Water diffusion in silica glass toward understanding of ...
79
Instructions for use Title Water diffusion in silica glass toward understanding of atomistic diffusion mechanism in silicate melts and glasses Author(s) 黒田, みなみ Citation 北海道大学. 博士(理学) 甲第13568号 Issue Date 2019-03-25 DOI 10.14943/doctoral.k13568 Doc URL http://hdl.handle.net/2115/77018 Type theses (doctoral) File Information Minami_Kuroda.pdf Hokkaido University Collection of Scholarly and Academic Papers : HUSCAP
Transcript of Water diffusion in silica glass toward understanding of ...

Instructions for use
Title Water diffusion in silica glass toward understanding of atomistic diffusion mechanism in silicate melts and glasses
Author(s) 黒田, みなみ
Citation 北海道大学. 博士(理学) 甲第13568号
Issue Date 2019-03-25
DOI 10.14943/doctoral.k13568
Doc URL http://hdl.handle.net/2115/77018
Type theses (doctoral)
File Information Minami_Kuroda.pdf
Hokkaido University Collection of Scholarly and Academic Papers : HUSCAP

A dissertation submitted for the doctoral degree of science
Water diffusion in silica glass toward understanding of atomistic diffusion mechanism in silicate melts and glasses
(石英ガラス中の水の拡散: ケイ酸塩メルトおよびガラス中における拡散メカニズムの原子スケ
ールでの理解に向けて)
Presented by Minami Kuroda
Department of Natural History Sciences Graduate School of Science
Hokkaido University
March, 2019

Abstract
Water diffusion in silicate melts is a fundamental process controlling physical
and chemical consequences of magmatism, but mechanism of diffusion in silicate
glasses and melts are not fully understood yet. In this study, with the aim of improving
our understanding of the mechanisms of water diffusion in silicate melts and glasses
including hydrogen isotope effects, I performed water diffusion experiments of water in
silica glass and discussed the diffusion mechanism of water in silicate melt and glasses.
The thesis consists of three parts as follows:
(1) Effect of structural dynamical property of melt on water diffusion in rhyolite
melt:
Diffusion coefficients of water in rhyolite melt reported in previous studies are
discussed in the context of water diffusion model in silica glass. The model well
explains the water concentration dependence of water diffusivity in rhyolite melt,
considering the effect of water concentration on activation energy of diffusion. The
water concentration dependence of activation energy can be explained by the change of
structural dynamical property of melt (i.e., viscosity), and the empirical relation
between the water diffusivity and viscosity is also explained by the present model.
Therefore I conclude that the water diffusion model proposed for silica glass (Kuroda et

al.. 2018) can be applied to rhyolite melt and that the water diffusion in rhyolite melt is
controlled by the same atomic process as in silica glass.
(2) Hydrogen isotopic exchange in hydrated silica glass:
Hydrogen isotopes can be a useful tracer of magmatism and eruption. I
performed hydrogen isotope exchange experiments between water vapor and hydroxyls
in silica glass for fundamental understanding of the hydrogen isotope fractionation
between silicate glasses and water vapor. Obtained hydrogen isotope exchange profiles
show that the surface isotope exchange reaction and diffusion of hydrogen isotopes,
which are carried as molecular water, occur simultaneously. I also found that the surface
exchange reaction between 1H2O and 2H in glass proceeds 1.7 times faster than that
between 2H2O and 1H in glass, which is a dominant cause of isotope fractionation
profiles inside the glasses. The large difference of surface isotope exchange rate implies
that a reaction involving hydrogen atoms controls the isotope exchange at the glass
surface. The large kinetic isotope fractionation of hydrogen between water vapor and
hydroxyls in glass may occur in a time scale of a few hours, and could affect the
hydrogen isotope fractionation between dissolved water in magma and degassed water
(i.e., bubbles) in an ascending magma.
(3) Fast diffusion path for water in silica glass:

Diffusion experiments of 2H2O at 900-750°C and water vapor pressure of 50 bar
found more than one-order of magnitude faster diffusion of water in SiO2 glass than that
reported previously. The fast diffusion profile of water was observed as an extended tail
of the normal water diffusion profile by a line scan analysis with SIMS, and it can be
fitted with a diffusion model with a constant diffusivity. The obtained fast diffusion
coefficient suggests that the diffusion species responsible for the fast diffusion is not
molecular hydrogen but molecular water. The diffusivity and activation energy for the
fast water diffusion can be explained by the correlation between diffusivities of noble
gases in silica glass and their sizes. Because noble gases diffuse through free volume in
the glass structure, we conclude that molecular water can also diffuse through the free
volume. The abundance of free volume in the silica glass structure estimated previously
is higher than that of 2H observed in the fast diffusion in this study, suggesting that the
free volume were not fully occupied by 2H under the present experimental condition.
This implies that the contribution of the fast water diffusion to the total water transport
in volcanic glass becomes larger under higher water vapor pressure conditions.
These new findings improve our understanding of the mechanism of water
diffusion in silicate melts/glasses, and would make a contribution to better
understanding of volcanic activities.

Contents
Chapter 1 1 General introduction Chapter 2 9 Effect of structural dynamical property of melt on water diffusion in rhyolite melt
2-1. Introduction 10
2-2. Application of water diffusion model in silica glass to rhyolite melt 11
2-3. Discussion 16
2-4. Conclusions 21
Chapter 3 23 Hydrogen isotope exchange reaction in hydrated silica glass
3-1. Introduction 24
3-2. Experimental and analytical methods 25
3-3. Results 28
3-4. Discussion 32
3-4-1. Non-equilibrium hydrogen isotope exchange reaction at glass
surface
3-4-2. Diffusion model for hydrogen isotope in silica glass
3-4-3. Implications for the mechanisms of hydrogen isotope
exchange reaction
3-5. Conclusions 38

Chapter 4 39 Fast diffusion path for water in silica glass
4-1. Introduction 40
4-2. Experimental and analytical methods 41
4-3. Results 44
4-4. Discussion 47
4-4-1. Profile fitting
4-4-2. Species and path for fast diffusion of water in silica glass
4-5. Implications 56
4-6. Conclusions 58
Chapter 5 59 General conclusions References 63 Acknowledgements 73

Chapter 1
General introduction

General introduction
2
Diffusion occurs through a thermal activated atomic-scale random motion of
atoms, ions and molecules in minerals, glasses, and melts. This diffusion process is
recorded as heterogeneous spatial distributions (zoning structure) of chemical or
isotopic composition in minerals or glasses. Petrologists and geochemists often use this
chemical or isotopic zoning to solve many problems, for instance, estimation of the
formation conditions of minerals (e.g., Oeser et al., 2015) and thermal history of rocks
(e.g., Takahashi, 1980; Sio et al., 2013). Diffusion data are also used to discuss bubble
size distribution in volcanic rocks (e.g., Toramaru, 1989; Cross et al., 2012; Martel and
Marziano, 2014), and processes influencing volcanic eruptions (e.g., Massol and
Koyaguchi, 2005; Lloyd et al., 2014). Diffusion in minerals and melts affects on
microscopic processes (e.g., formation of minerals and bubbles) and further has
influence on macroscopic geologic events (e.g., changing an eruption style). Hence, it is
important to obtain diffusion data and construct proper diffusion models from
laboratory experiments for understanding geological events from microscopic to
macroscopic view. In particular, understanding of diffusion mechanism is essential to
apply the diffusion data obtained under limited conditions in laboratory to diffusion
process under various physical and chemical conditions in nature.
Water diffusion in silicate melts and glasses is important especially in a field
of volcanology. Water is the most abundant volatile component in magma, and its
diffusion in magma strongly affects volcanic activity, for example, bubble nucleation
and bubble growth rate in magma. Oversaturation of dissolved water in magma leads to
bubble nucleation and growth by diffusion, providing the driving force of eruption (e.g.,

Chapter 1
3
Zhang et al., 2007). The bubble growth rate affects the magma ascent rate and could be
the main parameter controlling the eruption style. Many studies therefor have used
water diffusion data to estimate magma ascent rates from natural samples based on
water concentration profiles in volcanic glasses or bubble size distributions in volcanic
rocks and to compare the estimated ascent rates with observed eruption styles in order
to understand the critical factor governing the volcanic eruption style (e.g., Liu et al.,
2007; Lloyd et al., 2014). It is thus critically important in the field of volcanology to
fully understand water diffusion in silicate melts in a wide range of water concentration
and melt composition to discuss water diffusion data under various magmatic
conditions.
Because of its importance, water diffusion in silicate melts and glasses, as a
potential analog of silicate melts, have been so far studied intensively (e.g., Doremus,
1969; 1995; 2000; Wakabayashi and Tomozawa, 1989; Tomozawa et al., 1994; Zhang
and Behrens, 2000; Behrens, 2010; Kuroda et al., 2018; 2019). Water dissolves into
silicate melts and glasses as two species; one is molecular water (referred as H2Om) and
the other is hydroxyl (referred as OH) (e.g., Stolper, 1982). H2Om and OH can
interconvert in silicate melts and glasses through the following reaction (e.g., Stolper,
1982):
𝐻!𝑂! + 𝑂 ↔ 2𝑂𝐻 (1-1)
where O represents anhydrous oxygen in silicate melts or glass structure. Both H2Om

General introduction
4
and OH can be detected independently by IR spectroscopy (e.g., Zhang, 1999; Mcintosh
et al., 2017) or Raman spectroscopy (e.g., Losq et al., 2013; Ni et al., 2013), and the
equilibrium constant (K) of the reaction (1-1) is defined as:
𝐾 = !!"!
!!!!!!! (1-2)
where Xi represents a mole fraction of a single oxygen atom in the species i. The total
water concentration (XH2Ot) is given by the sum of the concentration of the two water
species:
𝑋!!!! = 𝑋!!!! +!!"!
. (1-3)
The XH2Om and XOH have different dependence on XH2Ot and hydroxyl is the dominant
species at the low water concentrations, while molecular water becomes dominant at
high water concentrations (e.g., Zhang and Ni, 2010). The time required for the reaction
(1-1) to reach equilibrium is considered to be less than a second for silicate glass and
melts at high temperatures (e.g., >~650°C for silica glass) (Doremus, 1999; Zhang and
Ni, 2010).
In general, the main diffusion species for the water diffusion in silicate melts
and glasses is considered to be molecular water. Zhang et al. (1991) performed
dehydration diffusion experiments for rhyolite glass with ≦1.7 wt% of H2Ot at
Chapter 1
5
403-550°C and 1 bar of total pressure, and measured the water diffusion profiles with
FTIR. By considering the inter-conversion reaction between H2Om and OH (reaction
(1-1)), they concluded that OH diffusivity is about six orders of magnitude smaller than
that of H2Om in Si-rich silicate melts and glasses. On the other hand, the OH diffusivity
may not be negligibly small in Si-poor silicate melts (andesite and basalt melts) at high
temperatures and low water contents (OH diffusivity is about one order of magnitude
smaller than that of H2Om) (Ni et al., 2013; Zhang et al., 2017).
Another characteristic feature of water diffusion in silicate melts and glasses
is its dependence on the water concentration. Doremus (1969, 1995) reported that water
diffusivity in silica glass depends on the water concentration linearly at 650-1000°C
based on published data. This dependence is consistent with that reported by Behrens
(2010) for silica glass at 521-1097°C at 2 kbar. However, the concentration independent
diffusion of water was also observed for silica glass at low water pressure (0.5 bar) and
low temperature (400-600°C) by Wakabayashi and Tomozawa (1989). Regarding
silicate glasses and melts, Doremus (2000) showed linear concentration dependence of
water diffusion in rhyolite melts at 650-1000°C and a water pressure of 0.7-5 kbar with
literature data. Zhang and Behrens (2000) showed the empirical relation of water
diffusivity to the water concentration in rhyolite glasses and melts over a wide range of
both temperature and pressure (400-1200°C and 0.01-8.1 kbar).
Kuroda et al. (2018) performed water diffusion experiments for silica glass at
650-850°C and discussed its diffusion mechanism with the aim of constructing a
general water diffusion model in silica and silicate glasses, which can explain various

General introduction
6
water concentration dependence of water diffusivity observed in previous studies. They
proposed a new water diffusion model for silica glasses, where molecular water diffuse
through diffusion pathways formed by breaking Si-O-Si bond through hydroxyl
formation reaction (Eq. (1-1)). Their model explains the stronger water concentration
dependence of water diffusion in silica glass at low water concentrations than that in
silicate glasses, and also explains both linear and no water concentration dependence
reported for silica glass (Doremus, 1969, 1995; Behrens, 2010; Wakabayashi and
Tomozawa, 1989). They proposed that their water diffusion model in silica glass could
be applicable to water diffusion behavior in silicate glasses (for instance, exponential
water concentration dependence of water diffusivity in rhyolite melt: Zhang and
Behrens, 2000). However, detailed discussion on the concentration dependence of water
diffusion in silicate melts and glasses and the mechanisms by which water diffuses
through silicate melts and glass structures has not been fully made yet.
The degassing process of magma could also be deduced from hydrogen
isotopic composition (δD) and water concentration in volcanic glasses (e.g., Taylor et
al., 1983; Nakamura et al., 2008 and references therein; Castro et al., 2014). The degree
of hydrogen isotopic fractionation (δD) is correlated with the water concentration in
natural volcanic samples: δD decreases with decreasing the water concentration and the
degree of decrease in δD is more pronounced at the lower water concentration. This
trend has been interpreted to reflect the transition of water degassing style from a
closed-system batch degassing to an open-system Rayleigh degassing. An elementary
process that has often been neglected to discuss the relation between δD and water

Chapter 1
7
concentration in the previous studies is the fractionation during diffusive transport of
water in magma (i.e., kinetic isotope fractionation invloving hydrogen isotope exchange
reaction and diffusion). Detailed understanding of hydrogen isotope fractionation
process between silicate melts/glasses and water vapor/fluid is needed to elucidate the
degassing processes from hydrogen isotopes.
There have been only a few studies for the hydrogen isotope fractionation
during water diffusion. Lapham et al. (1984) investigated the difference of diffusivities
of 1H2O and 2H2O in rhyolite melt. Their data showed that the diffusivity of 1H2O is
twice as large as that of 2H2O in rhyolite melt. However, a more recent study (Anovitz
et al., 2008) reported that there is no measurable difference between the diffusivities of
1H2O and 2H2O in rhyolite glass. Anovitz et al. (2009) further performed hydrogen
isotope exchange reaction experiments between water vapor and hydrated rhyolite glass
at 148°C. They found that hydrogen isotope exchange reaction occurs even at low
temperature, but no detail discussion (e.g., the isotope exchange reaction rate and its
dependence on temperature, glass composition, and pressure) has been made.
In this study, with the aim of improving our understanding of the mechanism
of water diffusion in silicate melts and glasses including isotope effects, I performed
diffusion experiments of water in silica glass and discussed the diffusion mechanism of
water in silicate melt and glasses. In chapter 2, I apply the water diffusion model
proposed by Kuroda et al. (2018) to water diffusion in rhyolite melt and to discuss the
effect of silicate melt structure on water diffusion. In chapter 3, to understand the
kinetic hydrogen isotope fractionation between water vapor and hydroxyls in silica glass,

General introduction
8
I performed hydrogen isotope exchange experiments between hydrated silica glass and
water vapor and found that a large hydrogen isotope fractionation could occur due to the
kinetic isotope exchange reaction at the glass surface, which can be a cause of large
hydrogen isotope fractionation between volcanic glass and water vapor. In chapter 4, a
new fast diffusion pathway for water in silica glass was found by the diffusion
experiments using 2H2O (2H was used as a tracer of water), through which water can be
transported at a rate of one-order of magnitude faster than previously reported (Kuroda
et al., 2018). In chapter 5, I summarize all the findings in this theses including future
works.

Chapter 2
Effect of structural dynamical property
of melt on water diffusion in rhyolite melt

Effect of structual dymanics of melt on water diffusion in rhyolite melt
10
2-1. Introduction
Water in silicate melts plays an important role to control both chemical and
physical properties of the melt. Dissolved water decreases melt viscosity, and promotes
mineral crystallization and bubble growth in ascending magmas (e.g., Tomozawa et al.,
1994; Zhang et al., 2007), which changes the volcanic eruption style. Diffusion of water
in silicate melts is one of the essential controlling factors of bubble nucleation and
growth in magma.
Water diffusion in various silicate melts and glasses, as an analog of silicate
melts, have been intensively studied because of its importance in volcanology (e.g.,
Doremus, 1969; Nowak and Behrens, 1997; Doreums, 2000; Zhang et al., 2007;
Persikov et al., 2014; Ni et al., 2015). Although it is widely known that water diffusivity
depends on water concentration and melt composition, its fundamental atomistic
mechanism in a wide range of melt composition and water concentration has not yet
been fully understood.
Kuroda et al. (2018) performed water diffusion experiments in silica glass to
understand a fundamental mechanism of water diffusion in interconnected SiO4
tetrahedra. They found that water diffusion in silica glass has stronger
water-concentration dependence than that in silicate glasses, which was explained by
diffusion of molecular water (𝐻!𝑂!) through diffusion pathways formed by hydroxyls
(-OH). In this study, this water diffusion model in silica glass is applied to water
diffusion in rhyolite melts, of which water diffusion has been well studied, to
understand an atomic-scale process of water diffusion in silicate melts.

Chapter 2
11
2-2. Application of water diffusion model in silica glass to rhyolite melt
The water concentration dependence of water diffusion in silica glass can be
attributed to a limited number of diffusion pathways formed through hydroxyl
formation reaction (𝐻!𝑂! + 𝑂 ↔ 2𝑂𝐻) (Fig. 2-1) (Kuroda et al., 2018). The model is
applied to multi-component silicate melts by taking the effects of metal cations into
account, which also provide diffusion pathways by forming non-bridging oxygen
(NBO). In this case, the diffusivity of total water (𝐷!!!!) can be given as:
𝐷!!!! = 𝐷!!!!𝜕𝑋!!!!𝜕𝑋!!!!
= 𝐽𝑢𝑚𝑝 𝑓𝑟𝑒𝑞𝑢𝑒𝑛𝑐𝑦 𝑜𝑓 𝐻!𝑂! [𝐽𝑢𝑚𝑝 𝑑𝑖𝑠𝑡𝑎𝑛𝑐𝑒]![𝑁𝑢𝑚𝑏𝑒𝑟 𝑜𝑓 𝑑𝑖𝑓𝑓𝑢𝑠𝑖𝑜𝑛 𝑝𝑎𝑡ℎ𝑤𝑎𝑦𝑠]!!!!!!!!!!!!
= 𝜈𝜆!𝑒𝑥𝑝 − !!!"
!!"!+ 𝑘𝑋!"#
!!!!!!!!!!!!
= 𝐷∗ 𝑘𝑋!"# +!!
1+ !"!!!!!
! !− 1 1− 1+ !"!!!!
!
!! !, (2-1)
where 𝐷! and 𝑋! represent the diffusion coefficient and the mole fraction of a single
oxygen atom in the species i, ν is the molecular vibration frequency, λ is the jump
distance, Ea is the activation energy for diffusion, R is the gas constant, T is absolute
temperature, K is the equilibrium constant of hydroxyl formation reaction (Zhang and
NI, 2010), and k is a parameter to relate XNBO to the number of diffusion pathways (0 ≤
k ≤1) (Kuroda et al., 2018). When all monovalent and divalent metal cations act as
network-modifier cations and all non-bridging oxygen atom generate one diffusion

Effect of structual dymanics of melt on water diffusion in rhyolite melt
12
pathways, k is equal to unity. Eq. (2-1) is equivalent to the water diffusivity in silica
glass when XNBO =0 (Kuroda et al., 2018).
Figure 2-1.
A schematic illustration of diffusion of molecular water in silicate melts. A water
molecule diffuses through a pathway formed by hydroxyls or network modifier cations.
When diffusivities of Si and O are enhanced by dissolved water, the network
rearrangement due to their diffusion could lower the energy barrier for molecular jump.
I found that Eq. (2-1) explains the water concentration dependence of water
diffusion coefficients reported for rhyolite melt (Nowak and Behrens, 1997) irrespective
of k only at low water concentration (dotted curves in Fig. 2-2). However, the model
Fig 1_20181226
H2Om
Si
OH
O
Si
OHO
OSi
O
O
Si
Si
O
O
Si

Chapter 2
13
cannot explain the water diffusivity in a wide range of water concentration, showing a
concave upward relation to water concentration, where water diffusion is more
promoted than that predicted in the model.
The activation energy (Ea) for water diffusion in rhyolite melt is known to
decrease with increasing the water content (0.5–6 wt%; Fig. 2-3) (Nowak and Behrens,
1997). This dependence was attributed to the change of melt viscosity with water
concentration (Nowak and Behrens, 1997), but no detailed discussion has been made
yet. In this study, the relation between the water concentration and the decrease of Ea in
Nowak and Behrens (1997) was fitted as a logarithm function (Fig. 2-3):
Δ𝐸!,!"# (𝑘𝐽/𝑚𝑜𝑙) = −8.61 𝑙𝑛!!!!!
𝑋!.!, (2-2)
where ΔEa,wat is the change of Ea from that at the H2O concentration of 0.9 mol% (X0.9)
(0.5 wt%) in the melt. This empirical expression diverges to positive infinity when
𝑋!!!! approaches to zero, but ΔEa,wat ranges from 0 to -18 kJ/mol within the range of
𝑋!!!! discussed in this study (0.5–6 wt%).

Effect of structual dymanics of melt on water diffusion in rhyolite melt
14
Figure 2-2.
Water concentration dependence of diffusivity for rhyolite melt (Nowak and Behrens,
1997). The water diffusivity data are fitted with the water diffusion model proposed in
this study: dashed curves (Eq. (2-1) with k=1 and 0) and solid curves (Eq. (2-4) with
k=1 and 0). The fitting with Eq. (2-1) was made only for the diffusivity data with water
concentration smaller than 4 wt% to show the deviation of the model from the data at
higher water concentrations. The model including the decrease of Ea with increasing
water concentration well explains the data.
0
20
40
60
80
100
0 0.01 0.02 0.03 0.04 0.05 0.06 0.07 0.08
BdEa k1dEa k0wo dEa k1wo dEa k0
B
A
Fig 2_20181226
0 2 4 6 80
20
40
60
80
100
Water concentration (wt%)
Wat
er d
iffus
ivity
(x10
-12 m
2 /s) 900 °C k=1
k=0
k=0
k=1
0
20
40
60
80
100
120
140
0 0.01 0.02 0.03 0.04 0.05 0.06 0.07 0.08
ÉfÅ[É^ 2
BdEa k1dEa k0wo dEa k1wo dEa k0
B
A
0 2 4 6 80
40
80
120
wat
er d
iffus
ivity
(x10
-12 m
2 /s)
Water concentration (wt%)
1000 °C k=1
k=0
k=0
k=1
0
50
100
150
200
0 0.01 0.02 0.03 0.04 0.05 0.06 0.07 0.08
ÉfÅ[É^ 4
BdEa k1dEa k0wo dEa k1wo dEa k0
B
A
0 2 4 6 80
50
100
150
200
Wat
er d
iffus
ivity
(x10
-12 m
2 /s)
Water concentration (wt%)
1100 °C
k=1k=0 k=0
k=1
0
50
100
150
200
250
0 0.01 0.02 0.03 0.04 0.05 0.06 0.07 0.08
ÉfÅ[É^ 6
BdEa k1dEa k0wo dEa k1wo dEa k0
B
A
0 2 4 6 8Water concentration (wt%)
0
50
100
150
200
Wat
er d
iffus
ivity
(x10
-12 m
2 /s)
250
1200 °Ck=1
k=0
k=0
k=1

Chapter 2
15
Figure 2-3.
The relation between the activation energy for water diffusion and water concentration
in rhyolite melt (data from Nowak and Behrens, 1997). The activation energy is shown
as a relative difference from that at the total water concentration of 0.5 wt% (ΔEa, wat).
The effect of water concentration on Ea (Eq. (2-2)) is included in Eq. (2-1) as
follows:
𝐷!!!! = 𝜈𝜆!𝑒𝑥𝑝 − !!!!!!,!"#!"
!!"!+ 𝑘𝑋!"#
!!!!!!!!!!!!
. (2-3)
Fig 3_20181226
-30
-20
-10
0
10
20
30
0 1 2 3 4 5 6 7
0 2 4 6 8 10 12
dEa (N&B)dEa (N&B)
∆Ea_
X t (kJ
/mol
)
Water concentration (wt%)
Water concentration (mol%)
0 2 4 6
-20
0
20
-30
-10
10
30
1 3 5 7
0 1 2 3 4 5 6
Water concentration (wt%)
Water concentration (mol%)
ΔE a
, wat
(kJ/
mol
)

Effect of structual dymanics of melt on water diffusion in rhyolite melt
16
By combining all the concentration-independent terms into D*, the diffusion
coefficient of total water can be given by:
𝐷!!!! = 𝐷∗𝑒𝑥𝑝 −∆𝐸!,!"#𝑅𝑇
𝑋!"2 + 𝑘𝑋!"#
𝜕𝑋!!!!𝜕𝑋!!!!
= 𝐷∗𝑒𝑥𝑝 − ∆!!,!"#!"
𝑘𝑋!"# +!!
1 +!"!!!!!
!
! !− 1 1 − 1 +
!"!!!!!!
!! !.(2-4)
The water diffusivity in rhyolite melts (Nowak and Bherens, 1997) are fitted
with Eq. (2-4) for k=1 or 0 (Fig. 2-2). Eq. (2-4) fits the water diffusivity in rhyolite melt
better than Eq. (2-1) in a wide range of water concentration. The chemical composition
of rhyolite melt in Nowak and Behrens (1997) suggests NBO/T of ~0 for the melt,
implying that monovalent and divalent cations in rhyolite melt in Nowak and Behrens
(1997) do not act as network modifiers due to the presence of Al3+ in the network of
tetrahedra (k=0). However, the present model cannot quantitatively determine k for the
melt.
2-3. Discussion
The model for water diffusion in silica glass (Kuroda et al., 2018) can explain
the water diffusion in rhyolite melt with taking the decrease of Ea with water
concentration into account. Here I attribute the change of Ea to the effect of structural
dynamical property of melt on water diffusion. Viscosity is a bulk property of melt, and

Chapter 2
17
has been measured for various silicate melts including the effect of dissolved water.
Viscosity is microscopically related to diffusivities of Si and O atoms, which construct
the network structure of silicate melts, by the Eyring relation (Ni et al., 2015; Eyring,
1936). In low-viscosity silicate melts, the diffusive movement of Si and O in the melt
structure may lower the activation energy of molecular jump and enhance the water
diffusivity through network rearrangement (Fig. 2-1).
Here I consider that the empirical relation of ΔEa,wat with dissolved water
concentration (Eq. (2-2)) is caused by decrease of viscosity (η) due to increase of water
concentration. In order to include the viscosity effect into the model, the relation of
ΔEa,wat and water concentration (Nowak and Behrens, 1997) (Eq. (2-2)) was converted
into the relation between ΔEa,wat and η as follows; (1) Based on the relation between
viscosity, water concentration, and temperature (Zhang et al., 2003), the relationship
between ΔEa,wat and water concentration (0.1–8 wt%) (Fig. 2-3; Eq. (2-2)) was changed
to that between ΔEa,wat and η at different temperatures (Fig. 2-4). (2) ΔEa,wat and ln η
show a liner relation at each temperature, and d(ΔEa,wat)/d(ln η) of 2.55, 2.86, 3.19, and
3.53 are obtained at 900, 1000, 1100, and 1200°C, respectively. (3) Using the average
d(ΔEa,wat)/d(ln η) at different temperatures (A = 3.03), the relationship between ΔEa,vis
and η is given by:
Δ𝐸!,!"# (𝑘𝐽/𝑚𝑜𝑙) = 𝐴 𝑙𝑛 !!!
(2-5)

Effect of structual dymanics of melt on water diffusion in rhyolite melt
18
where ΔEa,vis is the relative difference of Ea from that at the viscosity at the glass
transition temperature (η0 = 1012 Pa s). The choice of the reference viscosity (η0) does
not affect the discussion below.
Figure 2-4.
The relation between ΔEa, wat and melt viscosity of rhyolite melt at 900, 1000, 1100, and
1200 °C (see details in the text).
Fig 4_20181226
-30
-20
-10
0
10
20
5 10 15 20 25
dEa
dEa
Viscosity (Pa s)
5 10 15 20 25-30
-20
-10
0
10
20
ΔE a
, wat (k
J/m
ol)
ln η (Pa s)
900 °C
d (ΔEa) / d (ln η) = 2.55
-30
-20
-10
0
10
20
5 10 15 20
dEa
dEa
visocisty_1000
5 10 15 20-30
-20
-10
0
10
20
ΔE a
, wat (k
J/m
ol)
ln η (Pa s)
1000 °C
d (ΔEa) / d (ln η) = 2.86
4 8 12 16-30
-20
-10
0
10
20
ΔE a
, wat (k
J/m
ol)
ln η (Pa s)
1100 °C
-30
-20
-10
0
10
20
4 6 8 10 12 14 16 18
ÉfÅ[É^ 4
dEa
dEa
visocisty_1100
d (ΔEa) / d (ln η) = 3.19
-30
-20
-10
0
10
20
4 6 8 10 12 14 16
ÉfÅ[É^ 4
dEa
dEa
visocisty_1200
4 8 12 16-30
-20
-10
0
10
20
ΔE a
, wat (k
J/m
ol)
ln η (Pa s)
1200 °C
d (ΔEa) / d (ln η) = 3.53

Chapter 2
19
The water diffusivity is expressed as follows using Eq. (2-5):
𝐷!!!! = 𝜈𝑑!𝑒𝑥𝑝 −!!! !"# !
!!!"
!!"!+ 𝑘𝑋!"#
!!!!!!!!!!!!
= 𝜈𝑑! !!!
! !!" 𝑒𝑥𝑝 − !!
!"!!"!+ 𝑘𝑋!"#
ð!!!!!!!!!!!
(2-6)
By combining all water concentration- or melt composition-independent terms into D,
the diffusion coefficient of total water can be given as;
𝐷!!!! = 𝐷 !!!
! !!" !!"
!+ 𝑘𝑋!"#
!!!!!!!!!!!!
. (2-7)
The water diffusivity in silicate melts depends on viscosity in the form of
!!!
! !!". The viscosity dependence of water diffusion in various silicate melts has been
empirically known to be proportional to η-0.269 for silicate melt with η > 102.5 Pa s
(Persikov et al., 2010). The multiplier of η in Eq. (2-7) (A/RT) ranges from 0.26 to 0.29
in the temperature range considered here, and is well consistent with the empirical
relation between the water diffusivity and melt viscosity. Because the term !!"!+
𝑘𝑋!"#!!!!!!!!!!!!
in Eq. (2-7) does not change significantly with η, the water diffusion
model in this study can explain the empirical dependence of water diffusivity on the
melt viscosity.
Kuroda et al. (2019) found fast diffusion pathways for H2O molecules in

Effect of structual dymanics of melt on water diffusion in rhyolite melt
20
silica glass at 900-750°C with water vapor pressure of 50 bar. A small fraction of
dissolved water molecules diffuse through connected free volume (not through the
pathways formed by OH), and the activation energy for diffusion is explained by
𝐸! = 8𝜋𝐺𝑟! 𝑟 − 𝑟! !, (2-8)
where G represents a shear modulus of the silica glass (30 GPa for silica glass
(Znderson and Stuart, 1954)), r and r0 are radii of the diffusion species and the diffusion
gateway, respectively (Anderson and Stuart, 1954; Zhang and Xu, 1995). Because the
fast diffusion of H2O molecules in silica glass occurs within the pre-existing network
structure, its activation energy is likely to simply represent the energy required for
molecular jump.
The shear modulus of silicate melts (G) is negatively proportional to
temperature (Bansal and Doremus, 1986; Schilling et al., 2003; Falenty and Webb,
2010). The temperature dependence of G is in order of -0.01 GPa/K, and its change with
temperature cannot be recognized in diffusion experiments. On the other hand, the
viscosity of silicate melts (η) has larger temperature dependence than G. The
temperature dependence of η is modeled by the VFT equation (Vogel, 1921; Hess and
Dingwell, 1996), but in the temperature range considered here, it can be approximated
to the Arrhenius elation (η=A exp (B/T)). Assuming that the temperature dependence of
G is caused by the change of viscosity with temperature, the temperature dependence of
G can be converted into its viscosity dependence as follows:
Chapter 2
21
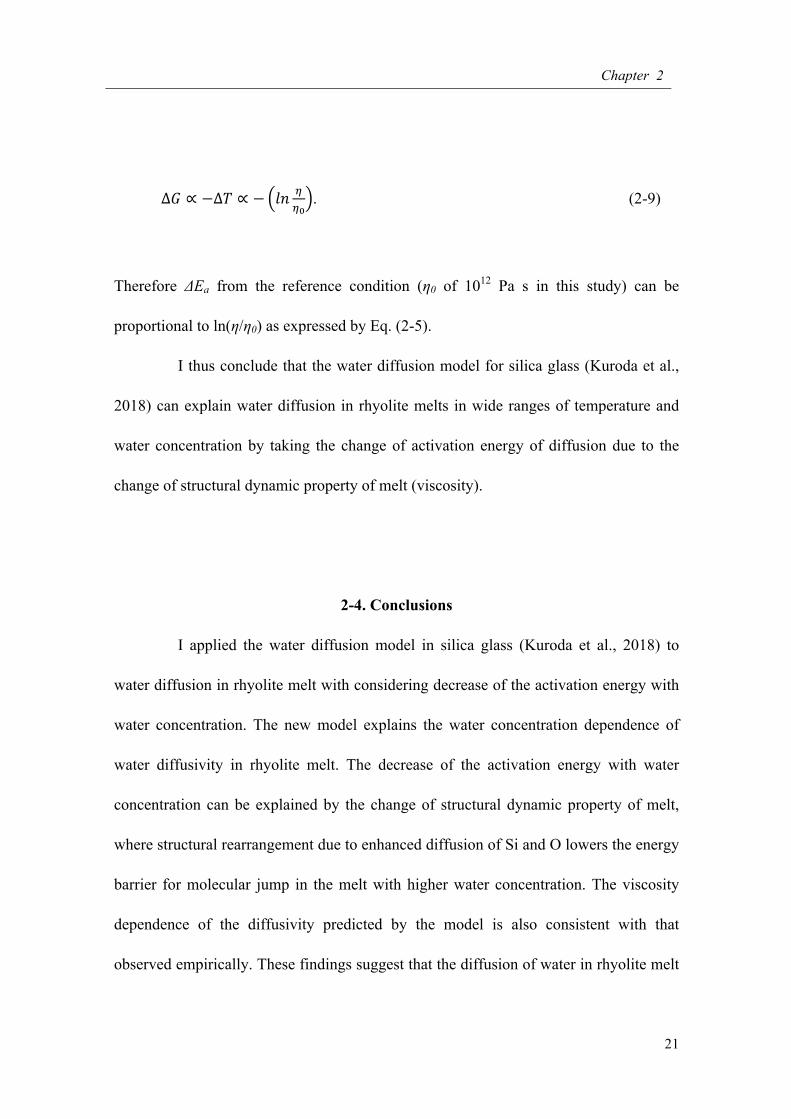
∆𝐺 ∝ −∆𝑇 ∝ − 𝑙𝑛 !!!
. (2-9)
Therefore ΔEa from the reference condition (η0 of 1012 Pa s in this study) can be
proportional to ln(η/η0) as expressed by Eq. (2-5).
I thus conclude that the water diffusion model for silica glass (Kuroda et al.,
2018) can explain water diffusion in rhyolite melts in wide ranges of temperature and
water concentration by taking the change of activation energy of diffusion due to the
change of structural dynamic property of melt (viscosity).
2-4. Conclusions
I applied the water diffusion model in silica glass (Kuroda et al., 2018) to
water diffusion in rhyolite melt with considering decrease of the activation energy with
water concentration. The new model explains the water concentration dependence of
water diffusivity in rhyolite melt. The decrease of the activation energy with water
concentration can be explained by the change of structural dynamic property of melt,
where structural rearrangement due to enhanced diffusion of Si and O lowers the energy
barrier for molecular jump in the melt with higher water concentration. The viscosity
dependence of the diffusivity predicted by the model is also consistent with that
observed empirically. These findings suggest that the diffusion of water in rhyolite melt

Effect of structual dymanics of melt on water diffusion in rhyolite melt
22
can be explained by the same atomic process as in silica glass.
Chapter 3
Hydrogen isotopic exchange in
hydrated silica glass

Hydrogen isotopic exchange in hydrated silica glass
24
3-1. Introduction
Water is the most abundant volatile component in magma. Water in silicate
melts changes physical and chemical melt properties of the melts, and plays an
important role to control magmatism and volcanic eruption in subduction zones, for
instance, through lowering melting point of rocks and melt viscosities and increasing
bubble nucleation and growth in magmas (Tomozawa et al., 1994; Zhang et al., 2007).
Hydrogen isotope ration in volcanic glasses could provide useful information to track
the interaction between dissolved water in magmas and water vapor in an open or
closed system using an equilibrium isotopic fractionation factor (e.g., Nakamuta et al.,
2006; Kyser and O’Neil, 1984; Taylor et al., 1983; Castro et al., 2014). However,
hydrogen isotope exchange between magma/volcanic glass and water vapor/ fluid
occurs in a short timescale or at low temperatures, where hydrogen isotope fractionation
may need to discusses as a result of a series of time-dependent processes such as surface
exchange reaction and diffusion, not as a simple fractionation in an open (Rayleigh) or
closed (butch) system. Therefor, the fundamental understanding of elementary
processes responsible hydrogen isotope exchange between magma/glass and water
vapor/fluid is essential to interpret properly hydrogen isotope records in natural
samples.
Lapham et al. (1984) firstly investigated the hydrogen isotope fractionation by
water diffusion in rhyolite glass at 850°C with 1H2O or 2H2O vapor of 700 bar and
reported that the diffusivity of 1H2O is twice as large as that of 2H2O, which could cause
a large diffusive D/H fractionation in the glass. On the other hand, Anovitz et al (2008,
Chapter 3
25
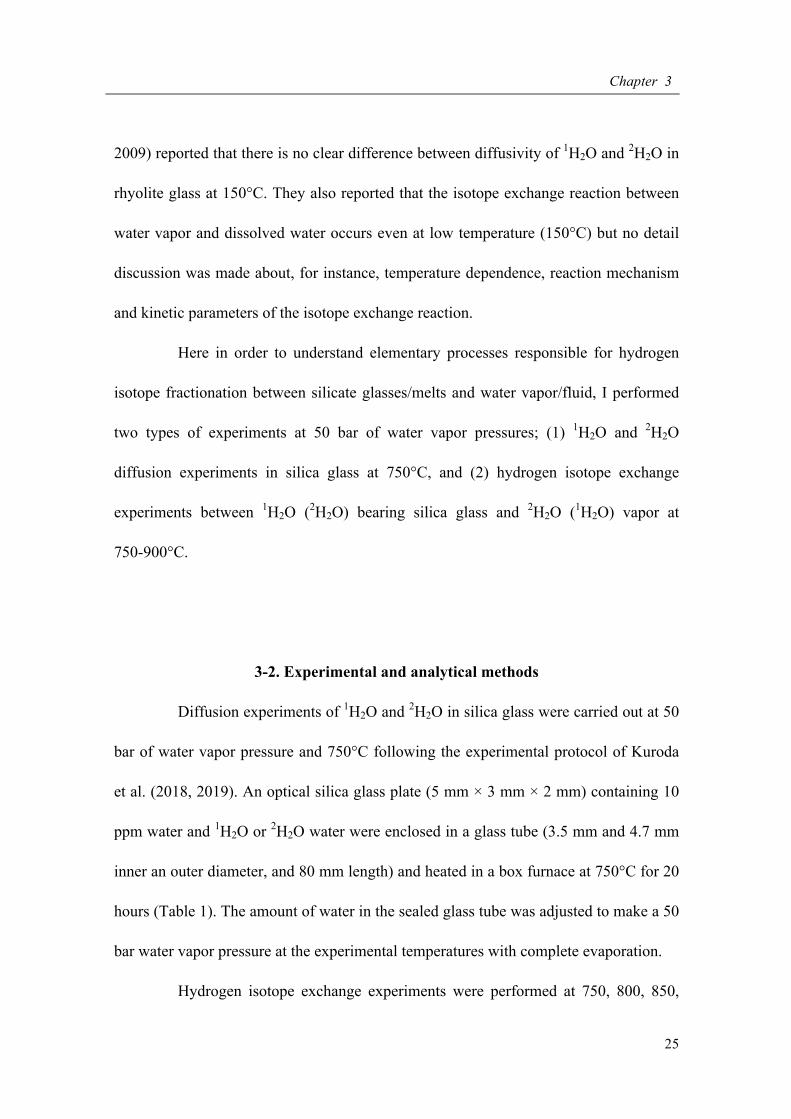
2009) reported that there is no clear difference between diffusivity of 1H2O and 2H2O in
rhyolite glass at 150°C. They also reported that the isotope exchange reaction between
water vapor and dissolved water occurs even at low temperature (150°C) but no detail
discussion was made about, for instance, temperature dependence, reaction mechanism
and kinetic parameters of the isotope exchange reaction.
Here in order to understand elementary processes responsible for hydrogen
isotope fractionation between silicate glasses/melts and water vapor/fluid, I performed
two types of experiments at 50 bar of water vapor pressures; (1) 1H2O and 2H2O
diffusion experiments in silica glass at 750°C, and (2) hydrogen isotope exchange
experiments between 1H2O (2H2O) bearing silica glass and 2H2O (1H2O) vapor at
750-900°C.
3-2. Experimental and analytical methods
Diffusion experiments of 1H2O and 2H2O in silica glass were carried out at 50
bar of water vapor pressure and 750°C following the experimental protocol of Kuroda
et al. (2018, 2019). An optical silica glass plate (5 mm × 3 mm × 2 mm) containing 10
ppm water and 1H2O or 2H2O water were enclosed in a glass tube (3.5 mm and 4.7 mm
inner an outer diameter, and 80 mm length) and heated in a box furnace at 750°C for 20
hours (Table 1). The amount of water in the sealed glass tube was adjusted to make a 50
bar water vapor pressure at the experimental temperatures with complete evaporation.
Hydrogen isotope exchange experiments were performed at 750, 800, 850,

Hydrogen isotopic exchange in hydrated silica glass
26
and 900°C with a similar experimental protocol using the same silica glass plate (5 mm
× 3 mm × 2 mm) in the following way. The glass plate was enclosed with either 1H2O
or 2H2O into a silica glass tube, and heated in the box furnace at 50 bar of water vapor
pressure and a desired temperature for 20 hours (first-step heating). The glass plate was
then taken out from the sealed glass tube, and re-sealed in a new silica glass tube with
water enriched in the isotope counterpart (2H2O for 1H2O an vice versa). The
second-step diffusion was done at the same temperature as the first-step experiment for
1, 3, or 10 hours. All the experimental conditions are summarized in Table 1.
Concentration profiles of 1H, 2H, and 30Si for a polished cross-section of the
run products were measured with secondary ion mass spectroscopy (SIMS; CAMECA
ims-6f) at Hokkaido University. A defocused primary beam of Cs+ of 10 keV was
irradiated on the sample surface to make a flat crater with a diameter of 20-25 µm. The
primary beam current was about 20 nA. Sputtered secondary ions were collected from
the central region (10 µm in diameter) of the spattered area to minimize the 1H signal
from adsorbed water on the polished sample surface. A normal electrical flood was used
for charge compensation. A few profiles (mostly three) were obtained for each sample
to assess the analytical reproducibility by moving the sample stage with 5 µm steps
across the sample surface.

Chapter 3
27
Table 3-1. Summary of experimental conditions.
T (°C) P (bar)
1st heating 2nd heating
vapor
species
duration
(h)
vapor
species
duration
(h)
750 50 1H2O 20 - -
2H2O 20 - -
1H2O 20 2H2O 1
2H2O 20 1H2O 1
1H2O 20 2H2O 3
2H2O 20 1H2O 3
1H2O 20 2H2O 10
2H2O 20 1H2O 10
800 50 1H2O 20 2H2O 3
2H2O 20 1H2O 3
850 50 1H2O 20 2H2O 3
2H2O 20 1H2O 3
900 50 1H2O 20 2H2O 3
2H2O 20 1H2O 3

Hydrogen isotopic exchange in hydrated silica glass
28
3-3. Results
Typical diffusion profiles of 1H or 2H of the samples heated for diffusion
experiments of 1H2O and 2H2O are shown with 30Si and the isotope counterpart in
Figures 3-1 ((a) and (b)). The typical profiles of both 1H and 2H for the isotopic
exchange experiments are also shown with 30Si in Figures 3-1 ((c) and (d)).
The concentration profiles of 1H and 2H in diffusion experiments of 1H2O and
2H2O show almost the same diffusion distances (Figures 3-1 (a) and (b)). This suggests
that the diffusivities of 1H2O and 2H2O are not largely different as reported in Laphan et
al (1984), but they are almost the same as observed by Anovitz et al (2008, 2009).
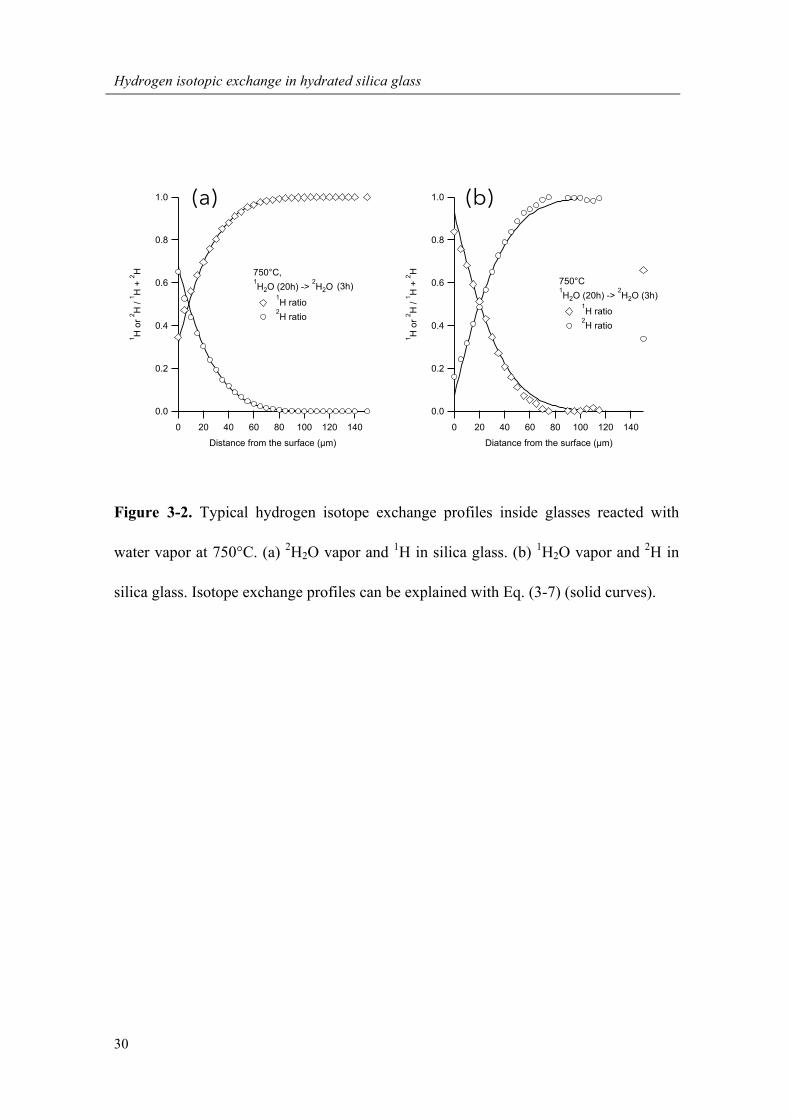
The 1H and 2H profiles in Figures 3-1 (c) and (d) show that 1H or 2H that
diffused into the glass during the first step diffusion was exchanged with the isotope
counterpart (2H or 1H) during the second step heating. The hydrogen isotope exchange
profiles are obtained using the hydrogen isotope ratio (Xi) of
𝑋! =!!
!! ! !! (3-1)
where iH represents the hydrogen isotope used for the second-step heating (Figure 3-2).
The relative difference (R) between X1 and X2 inside the glasses heated under
the same conditions is calculated as
𝑅 = !!!! !!!!
. (3-2)

Chapter 3
29
Figure 3-1. Typical ion intensity profiles of 1H, 2H, and 30Si of the heated samples (a)
750°C, 1H2O of 50 bar for 20 hours. (b) 750°C, 2H2O of 50 bar for 20 hours. (c) 750°C,
1H2O of 50 bar for 20 hours followed by 2H2O of 50 bar for 3 hours. (d) 750°C, 2H2O of
50 bar for 20 hours hollowed by 1H2O of 50 bar for 3 hours. 1H and 2H signals inside
the glass (deeper than -180 µm) are from backgrounds.
10-1
100
101
102
103
104
105
106
Ion
inte
nsity
(cps
)
3002001000Distance from the surface (µm)
750°C, 2H2O (20h)
1H 2H 30Si
10-1
100
101
102
103
104
105
106
Ion
inte
nsity
(cps
)
3002001000Distance from the surface (µm)
750°C,H2O (20h)
1H 2H 30Si
10-1
100
101
102
103
104
105
106
Ion
inte
nsity
(cps
)
3002001000Distance from the surface (µm)
750°C, 1H2O (20h) -> 2H2O (3h)
1H 2H 30Si
(a) (c)
(b)
10-1
100
101
102
103
104
105
106
Ion
inte
nsity
(cps
)
3002001000Distance from the surface (µm)
750°C, 2H2O (20h) -> 1H2O (4h)
1H 2H 30Si
1.0
0.8
0.6
0.4
0.2
0.0
1 H o
r 2 H /
1 H +
2 H
140120100806040200
Diatance from the surface (µm)
750°C1H2O (20h) -> 2H2O (3h)
1H ratio 2H ratio
(d)
Hydrogen isotopic exchange in hydrated silica glass
30
Figure 3-2. Typical hydrogen isotope exchange profiles inside glasses reacted with
water vapor at 750°C. (a) 2H2O vapor and 1H in silica glass. (b) 1H2O vapor and 2H in
silica glass. Isotope exchange profiles can be explained with Eq. (3-7) (solid curves).
1.0
0.8
0.6
0.4
0.2
0.0
1 H o
r 2 H /
1 H +
2 H
140120100806040200
Distance from the surface (µm)
750°C, 1H2O (20h) -> 2H2O (4h)
1H ratio 2H ratio
1.0
0.8
0.6
0.4
0.2
0.0
1 H o
r 2 H /
1 H +
2 H
140120100806040200
Diatance from the surface (µm)
750°C1H2O (20h) -> 2H2O (3h)
1H ratio 2H ratio
1.0
0.8
0.6
0.4
0.2
0.01 H
or 2 H
/ 1 H
+ 2 H
140120100806040200
Diatance from the surface (µm)
750°C1H2O (20h) -> 2H2O (3h)
1H ratio 2H ratio
(a) (b)
Chapter 3
31
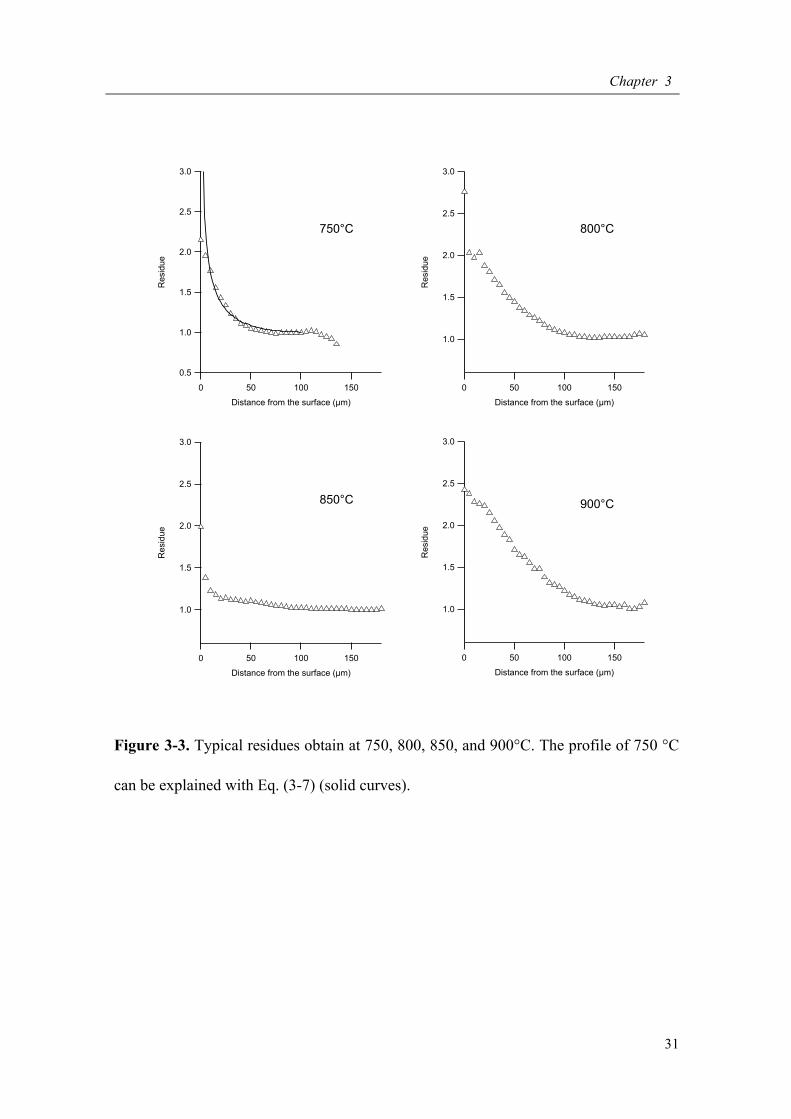
Figure 3-3. Typical residues obtain at 750, 800, 850, and 900°C. The profile of 750 °C
can be explained with Eq. (3-7) (solid curves).
3.0
2.5
2.0
1.5
1.0
Res
idue
150100500
Distance from the surface (µm)
800°C
3.0
2.5
2.0
1.5
1.0
Res
idue
150100500
Distance from the surface (µm)
900°C
3.0
2.5
2.0
1.5
1.0
Res
idue
150100500
Distance from the surface (µm)
850°C
3.0
2.5
2.0
1.5
1.0
0.5
Res
idue
150100500
Distance from the surface (µm)
750°C

Hydrogen isotopic exchange in hydrated silica glass
32
I used (1- Xi) instead of Xi in order to avoid dividing by 0 in the deep interior of glasses,
where no water diffusion occurred (i.e., Xi=0). The R should be equal to unity where X1
= X2.
Typical profiles of R inside the glasses heated the different temperatures are
shown in Figure 3-3. The R’s in all the samples are larger than 0 and tend to decrease
monotonically from the surface along concave profiles. This indicated that the isotope
exchange between 2H2O vapor and 1H in silica glass processed faster than that between
1H2O vapor and 2H in silica glass.
3-4. Discussion
Here the cause of the difference of isotope exchange behaviors of 2H2O vapor
with 1H in silica glass and 1H2O vapor with 2H in silica glass is discussed. I focus on the
results obtained from the samples at 750°C.
3-4-1. Non-equilibrium hydrogen isotope exchange reaction at glass surface
The isotopic effect of the hydrogen isotope exchange rate at the glass surface
could be the cause of isotope fractionation. The rate constants for the hydrogen isotope
exchange reaction at the glass surface were estimated form the temporal change of the
surface isotope compositions that were obtained from the concentration profiles
measured with SIMS (Table 1).

Chapter 3
33
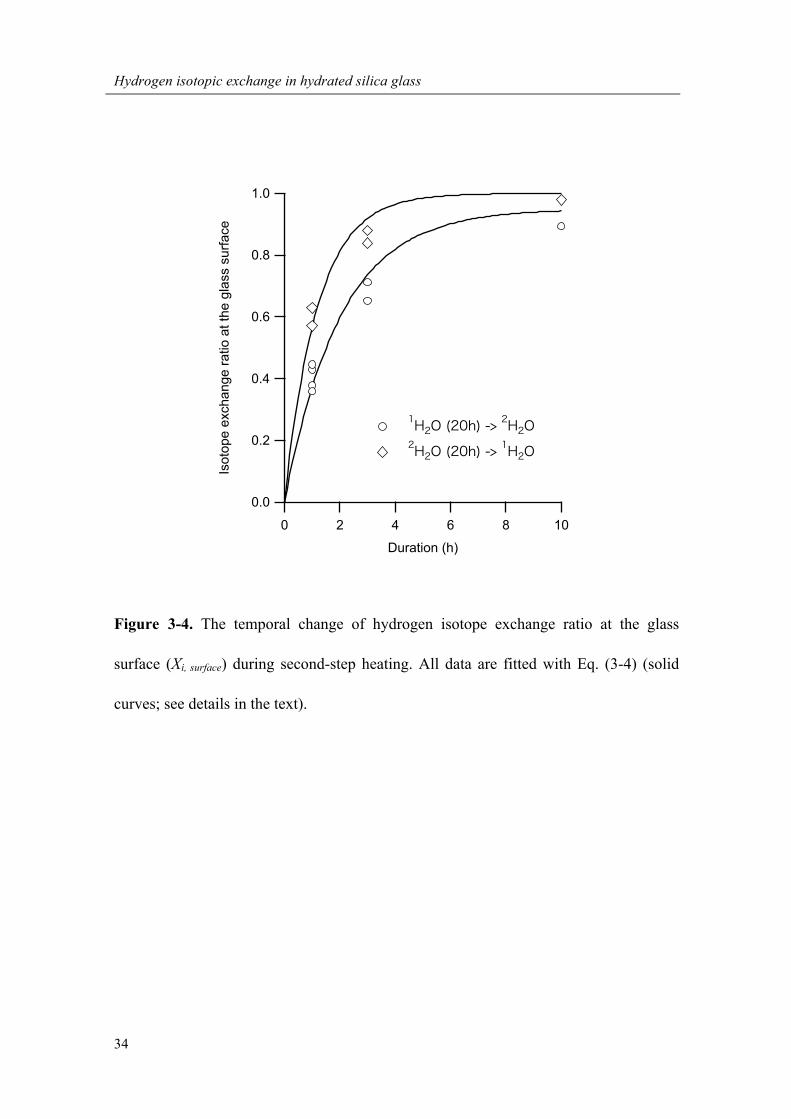
The X1 and X2 at the glass surface (X1, surface and X2, surface) increase with time
(Figure 3-4), showing that the surface isotope compositions were not in equilibrium
with water vapor during second-step heating, especially for samples with shorter
heating durations. The X1, surface and X2, surface show different time-dependent trends,
which may imply that the surface isotope exchange reaction is isotope-dependent.
The change of Xi, surface can be expressed as
!!!,!"#$%&'!"
= 𝑘! 1− 𝑋!,!"#$%&' (3-3)
where ki is the surface isotope exchange rate for iH2O with H in the glass. Eq. (3-3) is
integrated to be
𝑋!,!"#$%&' = 𝑋!,! 1− 𝑒!!!! (3-4)
where Xi, ∞ is the isotope composition at t=∞, which should be determined by the
equilibrium isotope fractionation factor between H2O vapor and H in silica glass, and t
is time during 2nd-step heating. In this study, X1, ∞ and X2, ∞ are given as 1 and 0.95
based on Xi, surface of diffusion experiments of 1H2O and 2H2O (Figure 3-1 (a) and (b)).
By fitting the data with Eq. (3-4), I obtained k1 of 2.32 (±0.22) ×10-4 /s and k2 of 1.39
(±0.11) ×10-4 /s (Figure 3-4), and found that k1 is about 1.7 times larger than k2 (k1/k2 =
1.67 ± 0.21). This difference of k1 could be the cause of hydrogen isotope fractionation
Hydrogen isotopic exchange in hydrated silica glass
34
Figure 3-4. The temporal change of hydrogen isotope exchange ratio at the glass
surface (Xi, surface) during second-step heating. All data are fitted with Eq. (3-4) (solid
curves; see details in the text).
1.0
0.8
0.6
0.4
0.2
0.0
Isot
ope
exch
ange
ratio
at t
he g
lass
sur
face
1086420
Duration (h)
1H2O (20h) -> 2H2O
2H2O (20h) -> 1H2O

Chapter 3
35
observed in the interior of the glasses.
3-4-2. Diffusion model for hydrogen isotope in silica glass
Hydrogen isotope exchange profiles inside glasses are discussed based on the
diffusion model for silica glass (Kuroda et al., 2018) and k1 and k2 for the surface
reaction. I first assume that there is no difference in diffusivities among 1H2O, 1H2HO,
and 2H2O as observed for diffusion of 1H2O and 2H2O (Figures 3-1 (a) and (b)). The
diffusive change of Xi is expressed as
𝜕𝑋!𝜕𝑡 =
𝜕𝜕𝑥 𝐷!
𝜕𝑋!𝜕𝑥
= !!"
𝐷 !!!!
!!!!!!
!!!+ 𝐷 ! !"!!
!! ! !"!!
!!!
!!!!"
(3-5)
where D is the diffusion constant, and x is the diffusion distance. The diffusivity of
molecular water (𝐷 !!!! and 𝐷 ! !"!! ) has water concentration dependence, and the
water diffusivity decreases about 30% along the hydrogen isotope exchange profile
(Kuroda et al., 2018). However, D is assumed to be constant in the present study for
simplicity because such a decrease of diffusivity does not largely affect the profile
fitting and discussion below.
In this case, the diffusion equation can be given as
Hydrogen isotopic exchange in hydrated silica glass
36
!!!!"= !
!"𝐷!"#$%&#$
! !!!!! !! !! !"!
!!!
!!!!"
(3-6)
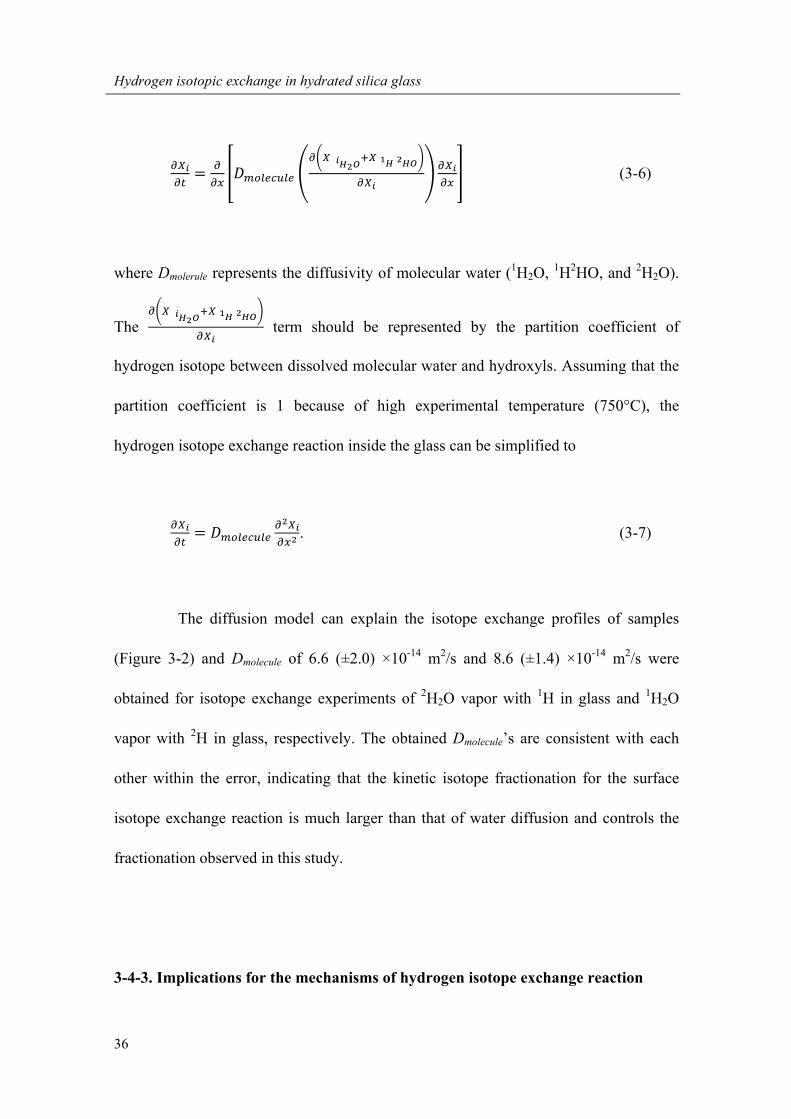
where Dmolerule represents the diffusivity of molecular water (1H2O, 1H2HO, and 2H2O).
The ! !
!!!! !! !! !"!
!!! term should be represented by the partition coefficient of
hydrogen isotope between dissolved molecular water and hydroxyls. Assuming that the
partition coefficient is 1 because of high experimental temperature (750°C), the
hydrogen isotope exchange reaction inside the glass can be simplified to
!!!!"= 𝐷!"#$%&#$
!!!!!!!
. (3-7)
The diffusion model can explain the isotope exchange profiles of samples
(Figure 3-2) and Dmolecule of 6.6 (±2.0) ×10-14 m2/s and 8.6 (±1.4) ×10-14 m2/s were
obtained for isotope exchange experiments of 2H2O vapor with 1H in glass and 1H2O
vapor with 2H in glass, respectively. The obtained Dmolecule’s are consistent with each
other within the error, indicating that the kinetic isotope fractionation for the surface
isotope exchange reaction is much larger than that of water diffusion and controls the
fractionation observed in this study.
3-4-3. Implications for the mechanisms of hydrogen isotope exchange reaction
Chapter 3
37
I finally discuss the hydrogen isotope exchange mechanism between
molecular water and hydroxyls at the glass surface and inside the hydrated glass based
on the observation that the surface isotope exchange reaction and water diffusion inside
the glass have different effect on kinetic isotope fractionation.
The difference between k1 and k2 (k1/k2 = 1.69 ± 0.21) might be too large to be
explained by the square root of mass ratio of 1H2O and 2H2O that can be the isotopic
fractionation factor related to the reaction involving water molecules. This large
difference of k1 could be explained by a surface reaction mechanism associated with
hydrogen atoms, where the kinetic isotopic fractionation factor could (2/1)0.5~1.41.
Nolan and Bindeman (2013) performed hydrogen isotope exchange
experiments between rhyolite glass and deuterated water at low temperature (20-70°C)
and reported that the hydrogen isotope exchange reaction at the glass surface is
apparently controlled by proton adsorption and proton exchange with dissolved water in
rhyolite glass. If the same mechanism worked at the higher-temperature condition
between water vapor and glass surface, the large isotope fractionation at the glass
surface could be explained.
More experiments are needed to discuss the effect of hydrogen isotope
exchange reaction at the glass surface and inside the glass on kinetic isotope
fractionation and to construct the isotope exchange reaction model. However, the
present data may indicate that the hydrogen isotope exchange reaction at the glass
surface does not reach equilibrium in a few hours, and there could be a large kinetic
isotopic fractionation for the surface isotope reaction, which could be the cause of large

Hydrogen isotopic exchange in hydrated silica glass
38
hydrogen isotope fractionation during short-time exchange events (e.g., bubble growth
in magma).
3-5. Conclusions
Hydrogen isotope exchange experiments between water vapor and hydroxyls
in silica glass were performed at 900-750°C and a water vapor pressure of 50 bar.
Obtained hydrogen isotope exchange profiles show that the surface isotope exchange
reaction and diffusion of hydrogen isotopes, which are carried as molecular water, occur
simultaneously. I also found that the surface exchange reaction between 1H2O and 2H in
glass proceeds 1.7 times faster than that between 2H2O and 1H in glass, which is a
dominant cause of isotope fractionation profiles inside the glasses. The large difference
of surface isotope exchange rate implies that a reaction involving hydrogen atoms
controls the isotope exchange at the glass surface. The large kinetic isotope
fractionation of hydrogen between water vapor and hydroxyls in glass may occur in a
time scale of a few hours, and could affect the hydrogen isotope fractionation between
dissolved water in magma and bubbles in an ascending magma.

Chapter 4
Fast diffusion path for water in silica glass

Fast diffusion path for water in silica glass
40
4-1. Introduction
Water inside the Earth changes physical and chemical properties of rocks, minerals,
and magma. Water circulates into the mantle through subduction zones and back to the surface
through arc volcanism. The arc volcanism is affected by water in magma because water
changes the physical and chemical properties of magma. For instance, water influences
eruption styles through changing magma ascent rates via its influence on bubble nucleation,
bubble growth, and degassing (e.g., Sparks, 1978; Rutherford, 2008). Bubble growth in
magma is controlled by viscous relaxation and water diffusion, the relative influence of which
depends on magma properties such as temperature, pressure, and chemical compositions.
Water diffusion in magma is therefore one of the important basic parameters to
control water degassing from magmas. Water diffusion in various silicate glasses, as an analog
of silicate melts, has been intensively studied (e.g., Zhang et al., 2007 and references therein).
Although the dependences of water diffusion on temperature, water concentration, and
pressure have been obtained and formulated, water diffusion in silicate glasses is not yet fully
understood as an atomistic-scale process. Kuroda et al. (2018) performed water diffusion
experiments in silica glass, and proposed a water diffusion model, where water molecules
diffuse through pathways formed by hydroxyls. They also showed that the model is applicable
to the water diffusion in various silicate glasses to explain the concentration dependence of
water diffusion in rhyolite and basalt glasses.
Chapter 4
41
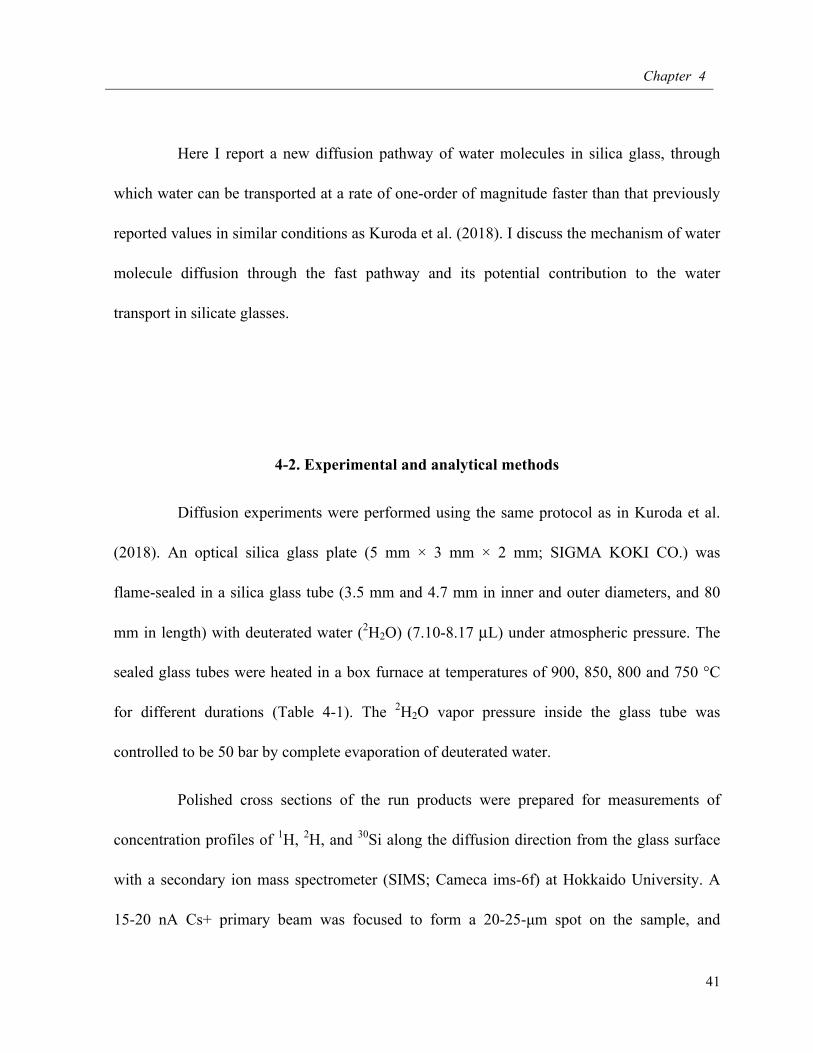
Here I report a new diffusion pathway of water molecules in silica glass, through
which water can be transported at a rate of one-order of magnitude faster than that previously
reported values in similar conditions as Kuroda et al. (2018). I discuss the mechanism of water
molecule diffusion through the fast pathway and its potential contribution to the water
transport in silicate glasses.
4-2. Experimental and analytical methods
Diffusion experiments were performed using the same protocol as in Kuroda et al.
(2018). An optical silica glass plate (5 mm × 3 mm × 2 mm; SIGMA KOKI CO.) was
flame-sealed in a silica glass tube (3.5 mm and 4.7 mm in inner and outer diameters, and 80
mm in length) with deuterated water (2H2O) (7.10-8.17 µL) under atmospheric pressure. The
sealed glass tubes were heated in a box furnace at temperatures of 900, 850, 800 and 750 °C
for different durations (Table 4-1). The 2H2O vapor pressure inside the glass tube was
controlled to be 50 bar by complete evaporation of deuterated water.
Polished cross sections of the run products were prepared for measurements of
concentration profiles of 1H, 2H, and 30Si along the diffusion direction from the glass surface
with a secondary ion mass spectrometer (SIMS; Cameca ims-6f) at Hokkaido University. A
15-20 nA Cs+ primary beam was focused to form a 20-25-µm spot on the sample, and

Fast diffusion path for water in silica glass
42
negatively charged secondary ions of 1H, 2H, and 30Si were counted by an electron multiplier
for 2, 10, and 1 seconds, respectively, with a 5 µm step. A normal electron flood gun was used
for charge compensation. A field aperture was used to permit transmission of ions from the
central area of 10 µm in diameter of the sputtered region to minimize the hydrogen signals
from absorbed water on the sample surface. A few profiles (mostly three) were obtained for
each sample to assess the analytical reproducibility. A starting material glass sample was also
measured as a reference with the same analytical condition. The position of the glass surface
was determined as being the point from which 30Si counts became constant.

Chapter 4
43
Table 4-1. Experimental conditions and diffusion coefficients of fast water diffusion in silica
glass. Errors are 2-sigma standard deviations of the diffusion coefficients evaluated from
multiple diffusion profiles. The samples heated for 1 hour and 20 hours were not used to
determine the diffusion coefficients because of their short diffusion profiles and homogeneous
2H distributions, respectively.
Run No. T(°C) t (hours) D (m2/s)
900-1 900 3 1.61 (±0.42) x10-12
900-2 900 3 1.87 (±0.60) x10-12
900-3 900 20 -
900-4 900 1 -
850-1 850 3 0.92 (±0.25) x10-12
850-2 850 3 1.58 (±0.41) x10-12
800-1 800 3 0.42 (±0.14) x10-12
800-2 800 3 0.66 (±0.11) x10-12
800-3 800 3 0.57 (±0.37) x10-12
750-1 750 3 0.67 (±0.17) x10-12
750-2 750 3 0.55 (±0.08) x10-12
750-3 750 20 -

Fast diffusion path for water in silica glass
44
4-3. Results
Diffusion profiles of 2H in samples heated at 900 °C for 1, 3, and 20 hours are
compared in Fig. 4-1. The 2H intensity decreases rapidly from rim to core of the sample with
diffusion distances of about 50, 100, and 250 µm for the samples heated for 1, 3, and 20 hours,
respectively. This is consistent with the diffusion experiments with 1H2O (Kuroda et al., 2018),
and the profile shape can be explained by water concentration-dependent diffusion in silica
glass (Kuroda et al., 2018), of which detail is discussed below.
It is found that the tail of deuterium profile extends further into the deep region of
the sample, where the 2H ion intensity is higher than the original value in the starting material
(2H/30Si < 2 × 10⁻⁷) (Fig. 4-1). Comparison between the concentration profiles heated at 900°C
for 1 and 3 hours clearly shows that 2H migrated into the deeper region of the glass with time
(Fig. 4-1). The 2H finally seems to have an almost homogeneous distribution inside the glass
after 20-hour heating (Fig. 4-1). This observation clearly shows that a small fraction of
deuterium-bearing species migrates at a faster diffusion rate than the dominant fraction that
diffuses as the concentration dependent profile. This newly-observed fast diffusion profile was
also confirmed in samples heated at 850, 800, and 750 °C (Fig. 4-2).

Chapter 4
45
Figure 4-1.
Typical ion intensity profiles of 1H, 2H and 30Si (900 °C for 1, 3, and 20 hours). 1H signals
inside the glass are from backgrounds.
Figure 1
10-1
100
101
102
103
104
105
106
Ion
inta
nsity
(cou
nts/
s)
3002001000-100
Distance from the surface (x10-6
m)
1H 2H 30Si
900°C, 20 hours
10-1
100
101
102
103
104
105
106
Ion
inte
nsity
(cou
nts/
s)
3002001000-100
Distance from the surface (x10-6
m)
1H 2H 30Si
900°C, 3 hours
10-1
100
101
102
103
104
105
106
Ion
inte
nsity
(cou
nts/
s)
3002001000-100
Distance from the surface (x10-6
m)
1H 2H 30Si
Starting material
10-1
100
101
102
103
104
105
106
Ion
inte
nsity
(cou
nts/
s)
3002001000-100
Distance from the surface (x10-6
m)
1H 2H 30Si
900°C, 1 hour

Fast diffusion path for water in silica glass
46
Figure 4-2.
Typical diffusion profiles of 2H, shown as 2H/30Si normalized to that at the surface, in silica
glass at 900, 850, 800, and 750 °C and a water pressure of 50 bar. The “normal water diffusion”
Figure 2
10-6
10-5
10-4
10-3
10-2
10-1
100
Nor
mai
zed
conc
entra
tion
(Gla
ss s
urfa
ce=1
)
3002001000
Distance from the surface (x10-6
m)
900°C, 3 hours
10-6
10-5
10-4
10-3
10-2
10-1
100
Nor
mai
zed
conc
entra
tion
(Gla
ss s
urfa
ce=1
)
3002001000
Distance from the surface (x10-6
m)
800°C, 3 hours
10-6
10-5
10-4
10-3
10-2
10-1
100
Nor
mal
ized
con
cent
ratio
n (G
lass
sur
face
=1)
3002001000
Distance from the surface (x10-6
m)
850°C, 3 hours
10-6
10-5
10-4
10-3
10-2
10-1
100
Nor
mai
zed
conc
entra
tion
(Gla
ss s
urfa
ce=1
)
3002001000
Distance from the surface (x10-6
m)
750°C, 3 hours

Chapter 4
47
profiles are fitted with the concentration-dependent water diffusion model (dashed curves)
(Kuroda et al., 2018), and the “fast water diffusion” profiles are fitted with the
constant-independent water diffusion model (solid curves). All 2H/30Si ratios are normalized to
the 2H/30Si at the glass surface. For fitting of the “normal water diffusion” profiles, D*, K, and
the surface water concentration were taken from Kuroda et al. (2018), where diffusion
experiments were performed under the same condition as in the present study (850-650 °C). K
and D* for 900 °C were obtained by the extrapolation of those in Kuroda et al. (2018), and the
surface concentration was assumed to be the same as at 850 °C. The surface water
concentration of all run products in this study is estimated to be about ~0.3 mol% based on the
experiments by Kuroda et al. (2018).
4-4. Discussion
4-4-1. Profile fitting
The profiles of 2H/30Si in the run products are used to discuss the 2H2O diffusion
because it has a linear relation to the water concentration (Kuroda et al., 2018). The 2H/30Si
profiles, normalized to the ratio at the glass surface, are shown in Fig. 4-2. The

Fast diffusion path for water in silica glass
48
concentration-dependent diffusion profiles can be explained by the water diffusion model in
silica glass (Kuroda et al., 2018), where molecular water is proposed to diffuse through the
pathway formed by hydroxyls (-OH). The model attributes the strong water concentration
dependence for water diffusion in silica glass to the limited number of diffusion pathways. If
water molecules (H2Om) favor a pathway formed by cuting Si-O-Si bonds to diffuse in the
polymerized silica glass network, water molecules themselves should form the pathways
through the hydroxyl formation reaction (𝑯𝟐𝑶𝒎 + 𝑶 ↔ 𝟐𝑶𝑯). On the other hand, such
pathways preexist in silicate glasses due to the presence of network modifier cations such as
Na+ and K+ that cut the glass network. This difference results in the stronger water
concentration dependence for water diffusion in silica glass than in silicate glasses because the
number of diffusion pathways in silica glass depends on water concentration (Kuroda et al.,
2018).
The total water diffusivity (𝑫𝑯𝟐𝑶𝒕 ) in silica glass through the pathways formed by
hydroxyls (‘normal diffusion’ hereafter) is given by
𝑫𝑯𝟐𝑶𝒕 =𝑫∗𝑲𝟖
𝟏+𝟏𝟔𝑿𝐇𝟐𝐎𝐭
𝑲
𝟏𝟐 − 𝟏 𝟏− 𝟏+
𝟏𝟔𝑿𝐇𝟐𝐎𝐭𝑲
!𝟏𝟐 , (4-1)
where Xi is the molar fraction of species i, D* is a concentration independent term and K is an
equilibrium constant of the hydroxyl formation reaction (Kuroda et al., 2018). The water

Chapter 4
49
diffusion profiles fitted with the diffusion coefficient of Eq. (4-1) are shown as dotted curved
in Fig. 4-2. The diffusivities for normal diffusion at the glass surface are about (5-0.8) ×10-13
m2/s in the present experimental conditions, and decreases with decreasing 𝑿𝐇𝟐𝐎𝐭 in roughly
proportion to 𝑿𝐇𝟐𝐎𝐭𝟐 (Kuroda et al., 2018).
The extended tails of the diffusion profiles (‘fast diffusion’ hereafter) cannot be
explained by the normal diffusion, while they can be fitted by a one-dimensional, semi-infinite
diffusion model with a fixed surface concentration and a constant diffusion coefficient (Crank,
1975) assuming that the fast diffusion is independent of the normal diffusion (Fig. 4-2):
𝑹 𝒙 = 𝑹𝒔 − 𝑹𝟎 𝟏− 𝒆𝒓𝒇 𝒙𝟐 𝑫𝒕
+ 𝑹𝟎, (4-2)
where x is the distance from the glass surface, R(x) is the normalized 2H/30Si at x, Rs is the
normalized 2H/30Si at the glass surface for fast diffusion, R0 is the background 2H/30Si relative
to Rs, respectively. The fitting curves were obtained for the first ~100-µm of the tails (Fig. 4-2)
because the 2H intensities in the deeper region became comparable to the detection limit. The
obtained diffusion coefficients of fast diffusion (Table 4-1) are about one-order of magnitude
larger than those of normal water diffusion at the glass surface at all temperatures. They are
more than one order of magnitude larger than the normal diffusion coefficients inside the glass
Fast diffusion path for water in silica glass
50
((5-0.8) ×10-13 m2/s at the glass surface under the present experimental conditions), where the
total water concentration is lower than at the surface.
The diffusion model with a constant diffusion coefficient gives Rs of (2–6) ×10-4 at
all the temperatures. Although the estimated Rs has a large uncertainty, it is comparable to the
homogeneous R(x) within the samples heated for 20 hours ((4–12) ×10-4). This suggests that
the assumption of the fixed surface concentration in Eq. (4-2) is valid.
4-4-2. Species and path for fast diffusion of water in silica glass
Mean values of the fast diffusion coefficients at different temperatures, obtained
from multiple-line profiles of a single sample, are summarized in Table 4-1. The Arrhenius
plot of the fast diffusion coefficient gives an activation energy of 80.5 ± 40.5 kJ/mol and a
pre-exponential factor of 6.1 × 10⁻⁹ m2/s (Fig. 4-3).

Chapter 4
51
Figure 4-3. The Arrhenius plot of the diffusion coefficient of fast water diffusion (eq. 4-2).
The line is a fit to the data. Error bars represent 2-sigma standard deviations of the diffusion
coefficients evaluated from multiple diffusion profiles.
Figure 3
-29.5
-29.0
-28.5
-28.0
-27.5
-27.0
-26.5ln
D (m
2 /s)
1.000.980.960.940.920.900.880.860.84
1000/T (1/K)

Fast diffusion path for water in silica glass
52
The obtained diffusion coefficient at 900-750°C (Table 4-1) is two orders of
magnitude smaller than that of H2 in the same temperature range (Lou et al., 2003), and its
activation energy is twice as large as that of H2 diffusion in silica glass (Lou et al., 2003).
Therefore H2 is unlikely to be a diffusing species for the fast diffusion observed in this study.
The activation energy of ~80.5 kJ/mol is similar to that of the normal diffusion of
water in silica glass (e.g., Kuroda et al., 2018; Wakabayashi and Tomozawa, 1989). This
indicates that the main diffusion species for fast diffusion is molecular water and that water
molecules jump within the glass structure with a similar energetic barrier (Kuroda et al.,
2018).
The similar energetic barrier for normal and fast diffusion suggests that the
difference in diffusivity should be attributed to factors related to the pre-exponential term for
diffusion such as a frequency factor and a diffusion pathway. Here I propose that a small
fraction of water molecules diffuse through the pathways connecting free volume (Fig. 4-4)
without reacting with the silica glass structure to form hydroxyls. The free volume is the
intrinsic gap formed within the polymerized network (e.g., Cohen and Turnbull, 1959; Vrentas
and Duda, 1977), and it has been proposed that noble gases diffuse through the free volume in
the network structure of silica and silicate glasses (e.g., Behrens, 2010; Amalberti et al., 2016)
(Fig. 4-4(a)). In the free-volume diffusion model, the free volumes are connected by
“doorways” of an average radius r0. The activation energy for the diffusion may be given as
the energy required to deform the glass network large enough to allow an atom to pass from
Chapter 4
53
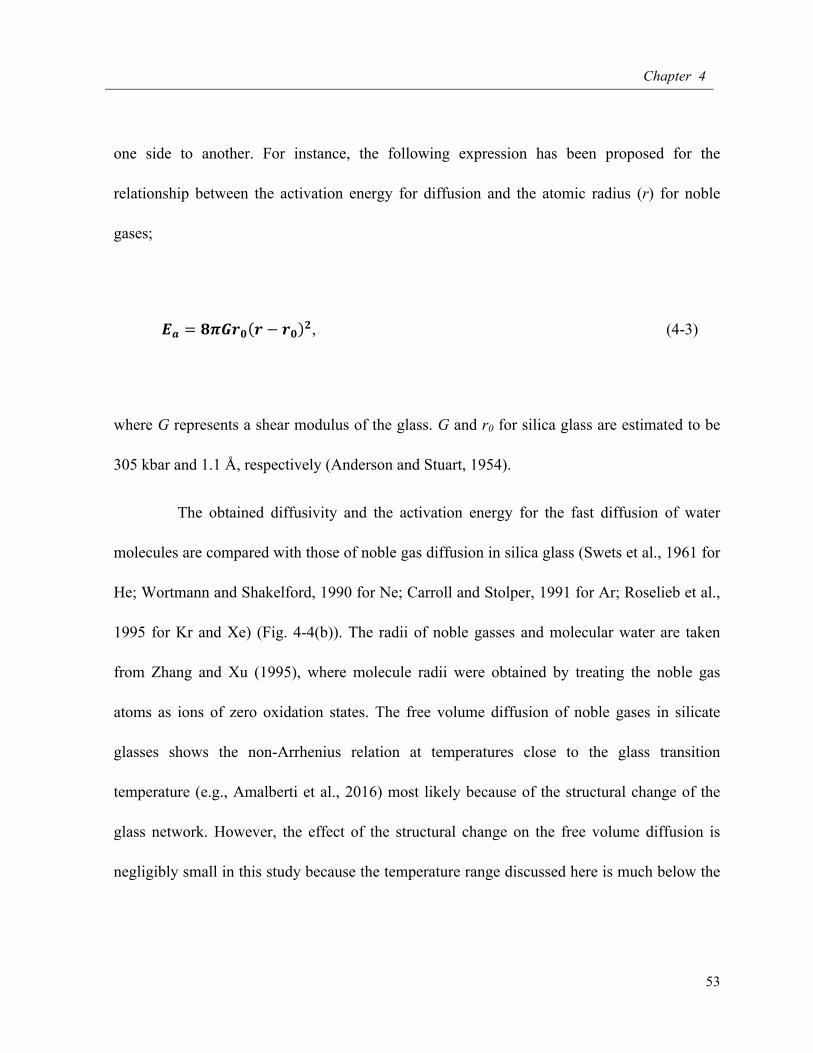
one side to another. For instance, the following expression has been proposed for the
relationship between the activation energy for diffusion and the atomic radius (r) for noble
gases;
𝑬𝒂 = 𝟖𝝅𝑮𝒓𝟎 𝒓− 𝒓𝟎 𝟐, (4-3)
where G represents a shear modulus of the glass. G and r0 for silica glass are estimated to be
305 kbar and 1.1 Å, respectively (Anderson and Stuart, 1954).
The obtained diffusivity and the activation energy for the fast diffusion of water
molecules are compared with those of noble gas diffusion in silica glass (Swets et al., 1961 for
He; Wortmann and Shakelford, 1990 for Ne; Carroll and Stolper, 1991 for Ar; Roselieb et al.,
1995 for Kr and Xe) (Fig. 4-4(b)). The radii of noble gasses and molecular water are taken
from Zhang and Xu (1995), where molecule radii were obtained by treating the noble gas
atoms as ions of zero oxidation states. The free volume diffusion of noble gases in silicate
glasses shows the non-Arrhenius relation at temperatures close to the glass transition
temperature (e.g., Amalberti et al., 2016) most likely because of the structural change of the
glass network. However, the effect of the structural change on the free volume diffusion is
negligibly small in this study because the temperature range discussed here is much below the

Fast diffusion path for water in silica glass
54
glass transition temperature of silica glass (~1163°C; Calculated with Deubener et al., 2003),
where the free volume diffusion of noble gases show a simple Arrhenius relation.
The activation energies of noble gas diffusion in silica glass show a clear relation
with the atomic radius, and they increase with increasing the atomic size (Fig. 4-4(b)).
Although the reported activation energies of noble gases are not well fit by the relation with
Eq. (4-3), the activation energy for the fast diffusion of molecular water lies on the same trend
of noble gas diffusion in silica glass. Moreover, the pre-exponential factor for the fast water
diffusion (6.1 × 10⁻⁹ m2/s) fits within the range of those for noble gas diffusion in silica glass
(7 × 10⁻⁸ and 2 × 10⁻⁹ m2/s for He and Kr, respectively) (Fig. 4-4 (b)). These similarities of
activation energy and pre-exponential factors suggest that fast diffusion of molecular water is
also governed by molecular jumps between connecting free volume in the silica glass
structure.

Chapter 4
55
Figure 4-4.
(a) Schematic illustration of the diffusion mechanism through connected free volume. (b)
Comparisons of activation energy for fast water diffusion and noble gas diffusion in silica
glass (left) and of temperature dependence of diffusion coefficients (right). Activation energies
free volume site
2r2r0
diffusing species
Si
OO Si
Si
O
Si
OSi
O
Si
O
SiOSi
O
Si
O
SiOSi
O
(a)
Figure 4
350
300
250
200
150
100
50
0
Ea (
kJ/m
ol)
2.01.81.61.41.21.0
Radius (x10-10
m)
He Ne
H2O
Ar
Kr
Xe
(b)
-40
-35
-30
-25
-20
ln D
(m2 /s
)
1.21.11.00.90.80.71000/T (1/K)
He (D0=7.4 x 10⁻⁸
)
Ne (D0=1.0 x 10⁻⁸
)
H2O (D0=6.1 x 10⁻⁹
)
Ar (D0=8.7 x 10⁻¹⁰
)
Kr (D0=2.2 x 10⁻⁹
)
Xe (D0=6.3 x 10⁻⁶
)

Fast diffusion path for water in silica glass
56
and diffusion coefficients of noble gases in silica glass are taken from Swets et al. (1961) for
He, Wortmann and Shakelford (1990) for Ne, Carroll and Stolper (1991) for Ar, and Roselieb
et al. (1995) for Kr and Xe. Radii of noble gases and water molecule are taken from Zhang and
Xu (1995). The relation between the activation energy and the radius of the diffusing species,
obtained with Eq. (4-3) with G = 305 kbar and r0 = 1.1 Å (Anderson and Stuart, 1954), is also
shown.
4-5. Implications
I found that there are, at least, two different pathways for water diffusion in silica
glass (normal diffusion through pathways created by the hydroxyl formation reaction and fast
diffusion through connected free volume). I here discuss the possible
contribution of the fast water diffusion to water transport in silica glass.
The amount of water transported by the fast diffusion can be estimated by
integrating the fast diffusion profiles, and it is ~0.5 % of the amount of water transported by
normal diffusion at 900 °C. The surface concentration of water for the fast diffusion path is
3-4 orders of magnitude smaller than the total water concentration at the surface (Fig. 4-2).
Because the surface concentration of dissolved water under the present experimental
conditions is ~0.3 mol% (Kuroda et al., 2018), the surface concentration of fast diffusion is

Chapter 4
57
estimated to range from a few ppm to several hundred ppb. The estimated surface
concentration of fast diffusion is likely to represent the water concentration in connected free
volume at the surface, and is much smaller than the concentration of free volume in silica
glass that was estimated from the solubility of Ar (~0.2 mol%; Shacklford, 1999). This implies
that the free volumes were not fully occupied by water molecules at water vapor pressure of
50 bar in the present experiments. I note that water concentration in the starting silica glass is
10 ppm, well below the free volume concentration, such that it should not affect the fast
diffusion of 2H2O even if the initial water was present in glass’ free volumes.
The solubility of molecular water in the fast diffusion path is expected to increase
with increasing the water vapor pressure until free volume saturation. The concentration of
molecular water occupying the free volume is likely to increase linearly with the water vapor
pressure following the Henry’s law as noble gases, while the solubility of water in the bulk
glass depends on the square root of water vapor pressure (<~200 MPa) (e.g., Zhang et al.,
2007).
I emphasize that more experimental work is clearly needed to determine the pressure
dependence of water solubility in free volume, but the finding in this study may imply that the
contribution of fast water diffusion to water transport in silica glass may become larger under
higher water vapor pressures. Especially, its contribution could be significant for water
diffusion occurring within a timescale shorter than a few hours as seen in this study, which the

Fast diffusion path for water in silica glass
58
timescale of magma ascent for explosive eruption (e.g., Lloyd et al., 2014). The fast water
diffusion might affect the nucleation and growth of bubbles in ascending magma.
4-6. Conclusions
A new fast diffusion path for water was found in the deuterated diffusion
experiments in silica glass at 900-750°C and water vapor pressure of 50 bar. The fast diffusion
profile was fitted with concentration-independent diffusion model, and the obtained diffusivity
is about one order of magnitude larger than that of “water diffusion” reported previously
(Kuroda et al., 2018). The obtained activation energy and diffusivity for the fast diffusion
indicated that the main diffusion species is molecular water. The fast diffusion coefficient lie
on the same trend for noble gas diffusion in silica glass, suggesting that water molecule can
diffuse between free volume sites. Contribution of fast diffusion may increase under high
water vapor pressure condition, where water molecule diffused into free volume sites may
increase. The contribution of fast diffusion could be significant for water diffusion especially
occurring within a short timescale, such as nucleation and growth of bubbles in ascending
magma.

Chapter 5
General conclusions

General conclusions
60
In this thesis, I discussed water diffusion in silicate melts and glasses based on
diffusion experiments of water in silica glass in order to understand the water diffusion
mechanism in silica glass and isotope exchange processes between water vapor and
hydroxyls in silica glass and to construct a general water diffusion model in silicate
glasses and melts. I focused on the atomistic diffusion mechanism for water in silicate
melts and glasses and found that
(1) The water diffusion model for silica glass (Kuroda et al., 2018) is applicable to
water diffusion in rhyolite melt taking the effect of water concentration and the
activation energy of diffusion into consideration (Chapter 2). The water
concentration effect on the activation energy can be attributed to the change of
structural dynamical property of melt (i.e., viscosity) due to the increase of
non-bridging oxygen atoms in hydrated melts.
(2) A large hydrogen isotope fractionation between water vapor and hydrated glasses
may occur in a short timescale (a few to several hours at 750-900°C) because of
kinetic isotope fractionation controlled by the surface isotope exchange reaction;
1H2O vapor reacts more rapidly than 2H2O vapor (Chapter 3).
(3) A new diffusion pathway for water molecules is present in silica glass, which
connects free volume in the silica glass structure. The water diffusion through the
newly found diffusion pathway is one order of magnitude faster than that through
the diffusion pathways formed by hydroxyls (Chapter 4).
All the findings in this study suggest that the water behavior in magmas, such as bubble
nucleation, bubble growth, and hydrogen isotope fractionation during magma ascent in
Chapter 5
61
an explosive eruption (a few hours to several hours) should be discussed as
time-dependent kinetic processes.
There are several issues that should be clarified to apply the results of this
study to natural volcanic samples. For instance, all the discussion here is needed to be
expanded to a wide range of temperature, pressure, and glass compositions. The
reaction model for hydrogen isotope exchange at the glass surface is also required to be
refined. More experimental work is required to solve these issues. However, the new
observations in the present study shed light on the nature of controlling processes of
volcanic eruption style, improving our understanding of the mechanism of water
diffusion in silicate melts/glasses, and would make a contribution to better
understanding of volcanic activities.

References

References
64
Amalberti, J., Burnard, P., Laporte, D., Tissandier, L., and Neuville, D.R. (2016)
Multidiffusion mechanisms for noble gases (He, Ne, Ar) in silicate glasses and
melts in the transition temperature domain: Implications for glass polymerization.
Geochemica et Cosmochemica Acta, 172, 107-126.
Anderson, O.L., and Stuart, D.A. (1954) Calculation of activation energy of ionic
conductivity in silica glass by classical methods, Journal of the American
Ceramics Society, 37. 573-580.
Anovitz, L.M., Cole, D.R., and Fayer, M. (2008) Mechanisms of rhyolitic glass
hydration below the glass transition. American Mineralogist, 93, 1166-1178.
Anovitz, L.M., Cole, D.R., and Riciputi, L.R. (2009) Low-temperature isotope
exchange in obsidian: Implications for diffusive mechanisms. Geochemica et
Cosmochemica Acta, 73, 3795-3806.
Bansal, N.P., and Doremus, R.H. (1986) Annealing of electron damage in Mid-IR
transmitting fluoride glass, Material Research Bulletin, 21, 281-288.
Behrens, H. (2010) Noble gas diffusion in silicate glasses and melts. Reviews in
Mineralogy and Geochemistry, 72, 227-267.
Behrens, H., and Zhang, Y. (2001) Ar diffusion in hydrous silicic melts: implications
for volatile diffusion mechanisms and fractionation. Earth and Planetary Science
Letters, 192, 363-376.

References
65
Castro, J.M., Bindeman, I.N., Tuffen, H., and Schipper, C.I. (2014) Explosive origin of
silicic lava: Textural and δD-H2O evidence for pyroclastic degassing during
rhyolite effusion. Earth and Planetary Science Letters, 405, 52-61.
Cohen, M.H., and Turnbull, D. (1959) Molecular transport in liquids and glasses. The
Journal of Chemical Physics, 31, 1164-1169.
Crank, J. (1975) The Mathematics of Diffusion Second Edition, 414 p. Oxford
University Press, Oxford.
Cross, J.K., Roberge, J., and Jerram, D.A. (2012) Constraining the degassing processes
of Popocatepetl Volcano, Mexico: A vesicle size distribution and glass
geochemistry study, Journal of Volcanology and Geothermal Research, 225-226,
81-95.
Deubener, J., Müller, R., Behrens, H., and Heide, G. (2003) Water and the glass
transition temperature of silicate melts. Journal of Non-Crystalline Solids, 330,
268-273.
Doremus, R.H. (1969) The diffusion of water in fused silica, in: J.M. Mitchell et al.
(Eds.), Reactivity of Solids, Wiley, New York, p. 667-673.
Doremus, R.H. (1995) Diffusion of water in silica glasses, Journal of Materials
Research, 10, 2379-2389.
Doremus, R.H. (1999) Diffusion of water in crystalline and glassy oxides:
Diffusion-reaction model. Journal of Materials Research, 14, 3754-3578.
Doremus, R.H. (2000) Diffusion of water in rhyolite glass: diffusion-reaction model,

References
66
Journal of Non-Crystalline Solids, 261, 101-107.
Eyring, H. (1936) Viscosity, plasticity, and diffusion as examples of absolute reaction
rates, Journal of Chemical Physics, 4 (1936) 283-291.
Falenty K., and Webb, S.L. (2010) Shear modulus, heat capacity, viscosity and
structural relaxation time of Na2O-Al2O3-SiO2 and Na2O-Fe2O3-SiO2 melts,
Physics and Chemistry of Minerals, 37, 613-634.
Fulcher, S. (1925) Analysis of recent measurements of the viscosity of glasses, Journal
of the American Ceramics Socsiety, 8, 339-355.
Deubener, J., Muller, R., Behrens, H., Heide, G. (2003) Water and the glass transition
temperature of silicate melts, Journal of Non-Crystalline Solids, 330, 268-273.
Hess, K.U., and Dingwell, D.N. (1996) Viscosity of hydrous leucogranitic melts: a
non-Arrhinian model, American Mineralogist, 81, 1297-1300.
Kuroda, M., Tachibana, S., Sakamoto, N., Okumura, S., Nakamura, M., and Yurimoto,
H. (2018) Water diffusion in silca glass through pathways formed by hydroxyls,
American Mineralogist, 103, 412-417.
Kuroda, M., Tachibana, S., Sakamoto, N., and Yurimoto, H. (2019) Fast diffusion path
for water in silica glass, American Mineralogist, 104, in press.
Kyser, T.K, and O’Neil, J.R. (1984) Hydrogen isotope systematics of submarine basalts.
Geochemica et Cosmochemica Acta, 48, 2123-2133.
Lapham, K.E., Holloway, J.R., and Delaney, J.R. (1984) Diffusion of H2O and D2O in
obsidian at elevated temperatures and pressures. Journal of Non-Crystalline Solids,
67, 179-191.

References
67
Liu, Y., Anderson, A.T., and Wilson, C.J.N. (2007) Melt pockets in phenocrysts and
decompression rates of silicic magmas before fragmentation. Journal of
Geophysical Research, 112, B06204.
Losq C.L., Moretti, R., and Neuville, D.R. (2013) Speciation and amphoteric behavior
of water in aluminosilicate melts and glasses: high-temperature Raman
spectroscopy and reaction equilibria, European Journal of Mineralogy, 25,
777-790.
Lloyd, A.S., Euprecht, P., Hauri, E.H., Rose, W., Gonnermann, H.M., and Plank, T.
(2014) NanoSIMS results from olivine-hosted melt embayments: Magma ascent
rete during explosive basaltic eruptions, Journal of Volcanology and Geothermal
Research, 283, 1-18.
Lou, V., Sato, R., and Tomozawa. M. (2003) Hydrogen diffusion in fused silica at high
temperatures, Journal of Non-Crystalline Solids, 315, 13-19.
Martel, C., and Iacono-Marziano, G. (2015) Timescales of bubble coalescence,
outgassing, and foam collapse in decompressed rhyolitic melts, Earth and
Planetary Science Letters, 412, 173-185.
Massol, H., and Koyaguchi, T. (2005) The effect of magma flow on nucleation of gas
bubble in a volcanic conduit. Journal of Volcanology and Geothermal Research,
143, 69-88.
Mcintosh, I.M., Nichols, A.R.L., Tani, K., and Llewelln, E.W. (2017) Accounting for
the species-dependence of the 3500 cm-1 H2Ot infrared molar absorptivity
References
68
coefficient: Implications for hydrated volcanic glasses. American Mineralogist,
102, 1677-1689.
Nakamura, M., Kasai, Y., Sato, N., and Yoshimura, S. (2008) Application of hydrogen
isotope geochemistry to volcanology: Recent perspective on eruption dynamics.
AIP Conference proceedings, 987, 93.
Ni, H., Xu, Z., and Zhang, Y. (2013) Hydroxyl and molecular H2O diffusivity in a
haploandesitic melt. Geochemica et Cosmochemica Acta, 103, 36-48.
Ni, H., Hui, H., and Neumann, G.S. (2015) Transport properties of silicate melts,
Reviews of Geophysics, 53, 715-744.
Nolan, G.S., and Bindeman, I.N. (2013) Experimental investigation of rates and
mechanisms of isotope exchange (O, H) between volcanic ash and
isotopically-labeled water. Geochemica et Cosmochemica Acta, 111, 5-27.
Nowak, M., and Behrens, H. (1997) An experimental investigation of diffusion of water
in haplogranitic melts, Contribution of Mineralogy to Petrology, 126, 365-376.
Oeser, M., Dohmen, R., Horn, I., Schuth, S., and Weyer, S. (2015) Processes and time
scales of magmatic evolution as revealed by Fe-Mg chemical and isotopic zoning
in natural olivines, Geochemica et Cosmochemica Acta, 154, 130-150.
Persikov, E.S., Newman, S., Bukhitiyarov, P.G., Nekrasov, A.N., and Stolper, E.M.
(2010) Experimental study of water diffusion in haplobasaltic and haploandesitic
melts, Chemical Geology, 276, 241-256.
Persikov, E.S., Bukhiyarov, P.G., Nekrasov, A.N., and Bondarenko, G.V. (2014)
Concentration dependence of water diffusion in obsidian and dacitic melts at

References
69
high-pressures, Geochemical International, 52, 365-371.
Roselieb, K., Rammensee, W., Büttner, H., and Rosenhaure, M. (1995) Diffusion of
noble gases in melts of the system SiO2-NaAlSi2O6. Chemical Geology, 120,
1-13.
Rutherford, M.J. (2008) Magma Ascent Rates, Reviews in Mineralogy and
Geochemistry, 69, 241-271.
Schilling, F.R., and Sinogeikin, S.V. (2003) Elastic properties of model basaltic melt
compositions at high temperatures, Journal of Geophysical Research, 108, B6.
Shackelford, J.F. (1999) Gas solubility in glasses – principles and structural
implications. Journal of Non-Crystalline Solids, 231-241.
Sio, C.K.I., Dauphas, N., Teng, F.Z., Chaussidon, M., Helz, R.T., and Roskosz, M.
(2013) Discerning crystal growth from diffusion profiles in zoned olivine by in
situ Mg-Fe isotopic analyses, Geochemica et Cosmochemica Acta, 123, 302-321.
Sparks, R.S.J. (1978) The dynamics of bubble formation and growth in magmas: a
review and analysis, Journal of Volcanology and Geothermal Research, 3, 1-37.
Stolper, E. (1982) Water in silicate glasses: An infrared spectroscopy study.
Contributions to Mineralogy and Petrology, 81, 1-17.

References
70
Swets, D.E., Lee, R.W., and Frank, R.C. (1961) Diffusion coefficients of helium in
fused quarts, The Journal of Chemical Physics, 34, 17-22.
Takahashi, E. (1980) Thermal history of lherzolite xenoliths-I. Petrology of lherzolite
xenoliths from the Ichinomegata crater, Oga peninsula, northeast Japan,
Geochemica et Cosmochemica Acta, 44, 1643-1658.
Taylor, B.E., Eichelberger, J.C., and Westrich, H.R. (1983) Hydrogen isotopic evidence
of rhyolitic magma degassing during shallow intrusion and eruption. Nature, 306,
8, 541-545.
Tomozawa, M., Li, H., and Davis, K.M. (1994) Water diffusion, oxygen vacancy
annihilation and structural relaxation in silica glasses, Journal of Non-Crystalline
Solids, 179, 162-169.
Toramaru, A. (1989) Vesiculation process and bubble size distribution in ascending
magmas with constant velocities, Journal of Geophysical Research, 94,
17,523-17,542.
Vrentas, J.S., and Duda, J.L. (1977) Diffusion in polymer – solvent systems. i.
reexamination of the free-volume theory. Journal of Polymer Sciene, 15, 403-416.
Wakabayashi, H., and Tomozawa, M. (1989) Diffusion of water into silica glass at low
temperature. Journal of the American Ceramic Society, 72, 1850-1855.
Wortman, R.S., and Shackelford, J.F. (1990) Gas transport in vitreous silica fibers.
Journal of Non-Crystalline Solids, 125, 280-286.
Zhang, L., Guo, X., Wang, Q., Ding, J., and Ni, H. (2017) Diffusion of hydrous species

References
71
in model basaltic melt. Geochemica et Cosmochemica Acta, 215, 377-386.
Zhang, Y. (1999) H2O in rhyolitic glasses and melts: Measurement, speciation,
solubility, and diffusion. Reviews of Geophysics, 37, 493-516.
Zhang, Y., Stolper, E.M., and Wasserburg, G.J. (1991) Diffusion of water in rhyolitic
glasses. Geochemica et Cosmochemica Acta, 55, 441-456.
Zhang, Y., and Xu, Z. (1995) Atomic radii of noble gas elements in condensed phases,
American Mineralogist, 80, 670-675.
Zhang, Y., and Behrens, H. (2000) H2O diffusion in rhyolitic melts and glasses,
Chemical Geology, 169, 243-262.
Zhang, Y., Xu, Z., and Liu, Y. (2003) Viscosity of hydrous rhyolitic melts inferred from
kinetic experiments, and a new viscosity model, American Mineralogy, 88,
1741-1752.
Zhang, Y., Xu, Z., Zhu, M., and Wang, H. (2007) Silicate melt properties and volcanic
eruptions, Reviews of Geophysics, 45, RG 4004.
Zhang, Y., and Ni, H. (2010) Diffusion of H, C, and O components in silicate melts,
Reviews of Mineralogy and Geochemistry, 72, 171-225.

Acknowledgments

74
I am indebted to my supervisors, Professor Shogo Tachibana (U. of Tokyo)
and Professor Hisayoshi Yurimoto (Hokkaido Univ.). They always gave me the
opportunities to make my study as my desires and gave me lots of support to do what I
want. I also had numerous valuable discussions with them through this work, which are
really interesting for me. I am happy that I could study in their lab and enjoyed my
research for a long period of six years.
I also thank other members of my doctoral committee, Professor Takaya
Nagai, and Dr. Junji Yamamoto for their advice and valuable comments.
I am deeply grateful to Dr. Naoya Sakamoto (Hokkaido Univ.) and Dr. Isao
Sakaguchi (NIMS) for their skillful help with SIMS measurements and numerous
encouragements. They always gave me suggestions in finding research themes,
performing experiments and SIMS measurements since I had been an undergraduate
student. Without their help, this paper would not have materialized.
I am also thanking Dr. Ryosuke Fujita (Kyusyu Univ.), Dr. Koji Takahashi
(AIST), and Dr. Ayumi Okamoto for their kindly advice and encouragements when I
bogged down. They always care about me and listened to my story even after they leave
Hokkaido University.
Furthermore, I am grateful to other staffs, students and former members of
Tachibana Lab and Yurimoto Lab for many helpful suggestions and encouragements. I
would like to thank all of those who spent a hard but fun working time with me.