Water desalination LAND AND WATER DISCUSSION … · Water desalination for agricultural...
56
Water desalination for agricultural applications Edited by J. Martínez Beltrán and S. Koo-Oshima Water Resources, Development and Management Service Land and Water Development Division LAND AND WATER DISCUSSION PAPER 5 FOOD AND AGRICULTURE ORGANIZATION OF THE UNITED NATIONS Rome, 2006 Proceedings of the FAO Expert Consultation on Water Desalination for Agricultural Applications 26–27 April 2004, Rome
Transcript of Water desalination LAND AND WATER DISCUSSION … · Water desalination for agricultural...

Water desalinationfor agricultural applications
Edited by
J. Martínez BeltránandS. Koo-Oshima
Water Resources, Development and Management ServiceLand and Water Development Division
LAND AND WATER
DISCUSSION PAPER
5
FOOD AND AGRICULTURE ORGANIZATION OF THE UNITED NATIONSRome, 2006
Proceedings of the FAO Expert Consultation on WaterDesalination for Agricultural Applications26–27 April 2004, Rome

The views expressed in this publication are those of the authors and do not necessarily reflect the views of the Food and Agriculture Organization of the United Nations.
The designations employed and the presentation of material in this informationproduct do not imply the expression of any opinion whatsoever on the part of the Food and Agriculture Organization of the United Nations concerning the legal or development status of any country, territory, city or area or of its authorities, or concerning the delimitation of its frontiers or boundaries.
All rights reserved. Reproduction and dissemination of material in this information product for educational or other non-commercial purposes are authorized without any prior written permission from the copyright holders provided the source is fullyacknowledged. Reproduction of material in this information product for resale or other commercial purposes is prohibited without written permission of the copyright holders. Applications for such permission should be addressed to: Chief Publishing Management ServiceInformation Division FAO Viale delle Terme di Caracalla, 00100 Rome, Italy or by e-mail to: [email protected]
© FAO 2006

iii
Contents
Foreword v
Acknowledgements vi
Summary report vii
Technical summary of the expert consultation 1Theme 1: State of the art on water desalination technology and costs 1
Theme 2: Environmental impacts and externalities associated with water desalination technology 1
Theme 3: Economic and environmental feasibility of water desalination for agricultural applications 2
Theme 4: Public–private partnerships 2
Theme 5: Comparison between wastewater treatment and desalination in agriculture 2
Introductory paper: Desalination of saline waters 5Julián Martínez Beltrán, Sasha Koo-Oshima and Pasquale Steduto
Water desalination technologies and costs – state of the art 11Koussai Quteishat
Water desalination and wastewater reuse for agriculture in Spain 19José Miguel Veza
Freshwater resources from desalination of wastewater and oilfield-produced brine 29David B. Burnett and C. Allan Jones
Feasibility of water desalination for agriculture 37José A. Medina
List of participants 45
Programme 47


v
Foreword
With worldwide concerns about water scarcity, agriculture is under pressure to improve water management and explore available options to match supply and demand. Desalination is a technical option to increase the availability of freshwater both in coastal areas with limited resources and in areas where brackish waters – such as saline groundwater, drainage water and treated wastewater – are available. Desalinated water can also be crucial in emergency situations where water sources have been polluted by saline incursions. However, desalinated water produced worldwide, estimated at 7 500 million m3/annum, equals only 0.2 percent of total water use.
Water desalination is a well-established technology mainly for drinking-water supply in water scarce regions such as the Near East. However, with agriculture accounting for 69 percent of all water withdrawals compared to domestic use of about 10 percent and industry 21 percent, it is the main source of potable water in the Persian Gulf countries and in many islands around the world and it is also being used in certain countries to irrigate high-value crops. However, it has proven much less economic for agricultural application than the reuse of treated wastewater, even where the capital costs of the desalination plants are subsidized.
Because of the increasing awareness of water desalination potential as an additional source of water for agriculture and questions about fundamental economics of its application, FAO organized an expert consultation on “Water desalination for agricultural applications” to analyse the state of the art and examine long-term prospects. The meeting was held in Rome from 26 to 27 April 2004.
The specific objectives of the expert consultation were to analyse the available water desalination technologies and their costs as well as their environmental impacts. There was a special focus on the economic feasibility of applying desalinated water in agriculture, specifically for irrigation, in comparison with the reuse of treated wastewater. The institutional and financial aspects of desalination were also discussed during the consultation.
Along with an introductory paper by staff of the Water Resources, Development and Management Service of the Land and Water Development Division of FAO, and some key-note papers of the participating experts, this document contains the summary report of the expert consultation and a technical summary with the conclusions and recommendations of the main topics discussed at the meeting.
It is intended that this publication will provide useful information on the current status of water desalination for agricultural applications.
To provide the most up-to-date information on water desalination with respect to irrigation and water supply in rural areas, FAO is pursuing periodical monitoring of developments. For this purpose, FAO will remain in contact with global and regional institutions working on this subject.
Louise O. FrescoAssistant Director-General
Agriculture, Biosecurity, Nutrition andConsumer Protection Department
vi
Acknowledgements
Many thanks are due to all those experts who participated in the Expert Consultation. In addition, the contributions provided by Professor K. Tanji and J.A. Medina prior to the Expert Consultation are most gratefully acknowledged.
Thanks are also due to J. Plummer, for editing the text, and to L. Chalk, for preparing the final document for publication.

vii
Summary report
Five external experts participated in the two-day consultation jointly with the chief of the FAO Water Resources, Development and Management Service (AGLW), the technical officers of the AGLW Water Quality and Environment Group and the senior irrigation and water resources officer of the FAO Regional Office for the Near East.
The experts covered the areas in the world where water desalination technology has been implemented, namely: the United States of America, North Africa, the Near East countries (especially the Persian Gulf countries), and Spain, where desalinated water is also applied in agriculture in addition to drinking supply. The experts who attended the consultation were:
ÿ Mr Koussai Quteishat, Middle East Desalination Research Center (MEDRC), Oman.
ÿ Mr Richard Morris, Richard Morris & Associates/WB, the United Kingdom.ÿ Mr José Miguel Veza, University of Las Palmas, Gran Canaria, Spain.ÿ Mr David Burnett, Texas A&M University, Global Petroleum Research Institute,
the United States of America.ÿ Mr José Antonio Medina, Centro de Estudios Hidrográficos, CEDEX, Spain.Following opening remarks by Louise Fresco, Assistant Director-General,
Agriculture Department, and Kenji Yoshinaga, Director, Land and Water Development Division, the experts presented their contributions under the five main themes selected for discussion:
ÿ state of the art on water desalination technology and costs;ÿ environmental impacts and externalities associated with water desalination
technology;ÿ economic and environmental feasibility of water desalination for agricultural
applications;ÿ public–private partnerships;ÿ comparison between wastewater treatment and desalination in agriculture.The experts’ presentations were followed by thematic discussions on the first day.
The following day, Mr Sharaf, Alternate Permanent Representative of the State of Kuwait, made a presentation on desalination of treated sewage effluent for agricultural purposes in Kuwaiti farms.
At the end of the consultation, the group of experts concluded that:ÿ Desalination might have a role in achieving food security although its major use
will continue to be for drinking-water. ÿ Applying water desalination technology to agriculture is generally rather cost-
ineffective.ÿ To date, the application of water desalination in agriculture is limited to a small
number of areas, only for certain high-value crops and with government subsidies in capital costs.
Insofar as the technology for desalination will be expensive, limiting its application in agriculture, FAO should focus on the safe reuse of treated wastewater to meet water demand prior to desalination.
However, FAO should monitor the evolution of desalination technology, its cost trend, and the availability of field data for application in agriculture.

1
Technical summary of the expert consultation
THEME 1: STATE OF THE ART ON WATER DESALINATION TECHNOLOGY AND COSTSAccording to the experts, the best desalination technologies are distillation (multistage flash, MSF) and membrane technologies (reverse osmosis, RO, and electro-dialysis reversal, EDR). RO and EDR are applied to desalinate brackish water, with salt concentrations of less than 10 g/litre, while RO and distillation are applied for seawater, with a salt concentration of more than 30 g/litre.
Distillation plants treat large volumes of water (55 000 m3/d), almost exclusively seawater, and they are often built together with power plants (dual purpose). Membrane technology is downscalable to the required size according its use:
ÿsmall plants (up to 500 m3/d);ÿmedium plants (500–5 000 m3/d);ÿlarge plants (more than 5 000 m3/d).Costs are described mainly for industry and drinking-water although for agriculture
they are within the range:ÿfor large plants, seawater distillation: US$1.00–1.50/m3 (Persian Gulf States
data);ÿfor RO applied on seawater: more than US$1.50/m3 for small plants; US$1.00–
1.50/m3 for medium plants, and less than US$1.00/m3 for large plants;ÿfor RO applied on brackish water: less than US$0.50/m3.Current trends show that distillation costs are falling because of economies of scale
(large plants), and RO costs are decreasing more rapidly because of new technology developments, competition and economies of scale.
The experts recommended that each specific case be studied carefully before selecting the technology. The expert group considered membrane technologies as being most adaptable with EDR being promising for future applications.
THEME 2: ENVIRONMENTAL IMPACTS AND EXTERNALITIES ASSOCIATED WITH WATER DESALINATION TECHNOLOGYWater desalination has positive impacts on the environment, such as increasing water availability and recycling poor-quality water. However, it has also several negative impacts, mainly: brine disposal of residues from desalination, chemical additives used for antifouling, anticorrosivity, etc.; visual impact on the landscape; noise; and emission of greenhouse gases. The complexity of brine disposal from inland areas is greater than that for coastal areas. Distillation impacts are considered to be the worst.
There are no specific standards for impact assessments, only guidelines drawn up by the United Nations Environment Programme (UNEP). To date, environmental impact assessments (EIAs) have not been integrated in management policies.
Although technology and management options to reduce impacts are available, standards and EIA studies (local and regional) are needed. Continuous monitoring of effluents and research on brine disposal are also required.
Water desalination for agricultural applications2
THEME 3: ECONOMIC AND ENVIRONMENTAL FEASIBILITY OF WATER DESALINATION FOR AGRICULTURAL APPLICATIONSDesalinated water is more expensive than conventional water resources and it is not affordable for most crops. However, desalinated water might be affordable for high-value crops, especially where subsidies on capital costs are provided.
Desalinated water is of high quality and can have less negative impact on soils and crops in comparison with direct use of brackish water.
For cost considerations, brackish water desalination is more suitable for agricultural production than is seawater desalination. Moreover, desalination facilities near the point of use are preferred in order to minimize transfer costs. In terms of operation and maintenance (O&M), small to medium plants are more problematic.
The expert group recommended that desalination programmes be integrated with water resources management, with application of best practices for water management (leaching requirements, and better irrigation methods) and selection of appropriate salt-tolerant crops. The optimal size and site of facilities should be studied, and better operating management of smaller plants is required (automatic plant operations, and farmer knowledge on operational processes).
THEME 4: PUBLIC–PRIVATE PARTNERSHIPSThere are various financial arrangements in relation to partnerships between government and the private sector for water desalination. Progress has been made towards private-sector participation and investment with guarantees from the government in most instances for desalination for drinking-water supplies. Because of the single-buyer’s market for drinking-water, the risk is perceived to be lower than for agricultural markets. The various contract models are evolving from build own or build own operate transfer (BOOT), etc. However, institutional issues remain an impediment as the process requires a policy framework.
The experts recommended design build operate (DBO) as a new contractual model with many of its associated advantages, in particular, in relieving capital burden, transferring construction and operational risk to the private sector, and attracting innovations. Furthermore, the experts recommended better regulation and legislation for brackish groundwater in aquifers as discrepancies exist in property rights (in some countries, they are considered public, in others, private). The recommendation is extended to overall groundwater management, which needs better legal definition and understanding.
THEME 5: COMPARISON BETWEEN WASTEWATER TREATMENT AND DESALINATION IN AGRICULTUREWastewater and water desalination constitute potential sources of water for agriculture and other uses. Technologies for tertiary wastewater treatment and desalination have very much in common. However, the cost of treatment varies depending on the type of treatment and the intended final use of product water. Treated wastewater reuse in agriculture is less expensive than is desalinated water. With its associated benefits, treated wastewater reuse also has problems in terms of public acceptance, and potential health and environmental risks.
Although the World Health Organization (WHO) and FAO have specified guidelines for wastewater reuse, no common standards have been set owing to difficulties in systematic implementation in countries around the world. For the reasons above, due consideration should be given to both the problems and benefits of wastewater reuse and water desalination.
The experts recommended wastewater treatment as a better option in sustainable development and the introduction of programmes to inform the public of the benefits of treated wastewater reuse. The group also suggested that hybrid solutions, a blend

Technical summary of the expert consultation 3
of wastewater plants coupled with desalination plants, may have a place in urban and peri-urban agriculture. However, of great importance is the setting of standards for the outflow quality of wastewater treatment plants and the associated effluent monitoring.


5
Introductory paper: Desalination of saline waters
INTRODUCTIONAmong the options for augmenting freshwater resources is the desalination of salty groundwater, brackish drainage water and seawater.
Distilling drinking-water from seawater has been studied over many centuries by Mediterranean and Near East civilizations. Large-scale solar ponding to serve as domestic drinking-water was practised more than 100 years ago in Egypt (Abu Zeid, 2000).
However, progress on modern desalination was made during the 1960s and plants have been developed since the 1970s, starting with some countries of the Persian Gulf because of their ready availability of energy and relevant scarcity of freshwater resources. Intensive research for large-scale commercial desalinating technologies began in the United States of America in the early 1960s (Buros, 1999).
The objective of this paper is to give an overview of desalination technologies, their energy requirements and costs, as well as of the achievements, constraints and perspectives of desalination.
PRINCIPLES AND TECHNOLOGIESThe first desalination technology to be developed was thermal distillation. In this process, saline water is distilled into steam, which in turn is condensed into pure water.
Later, membrane processes, such as electro-dialysis (ED) and reverse osmosis (RO), were developed. In an ED process, salts are separated from water by means of an electric load application. In RO, pressure is applied to the intake water to force it to flow through a semi-permeable membrane that prevents most of the salts from passing through. The higher the salt concentration of the intake water is, the higher the pressure that is required. The pressure required for desalinating brackish waters range from 100 to 270 kPa, while that required for seawater ranges from 550 to 1 000 kPa (FAO, 2003a).
Solar energy may also be used to produce water vapour, which is then condensed on a cooler surface to form the desalinated water. However, this process produces only a small amount of water and is generally ignored as a technological solution.
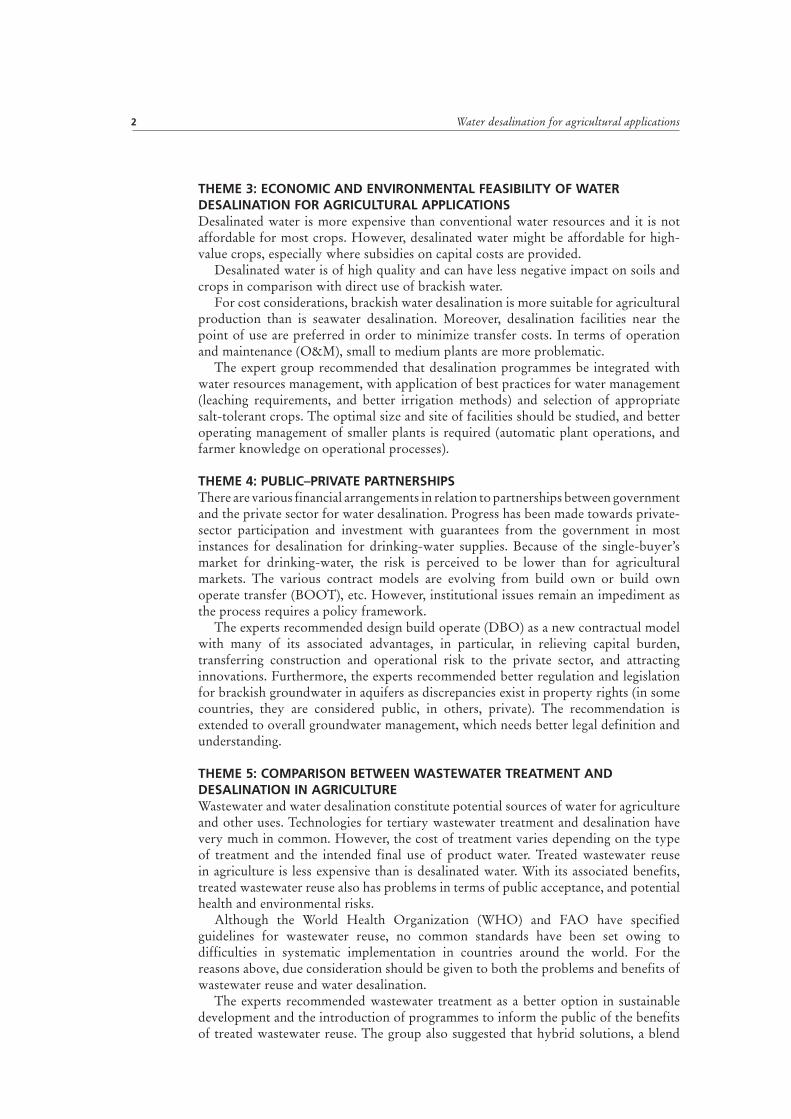
The high-energy requirement is an essential feature of the desalination process. Table 1 (based on data in FAO, 2003a) describes some characteristics of different desalination technologies and their corresponding energy requirements.
Semiat (2000) provides more detailed information on desalination technologies, while Furukawa (1997) provides information on RO.
In order to select the appropriate desalination technology for each specific use, it is necessary to consider site-specific factors, such as the intake water composition, the
Julián Martínez Beltrán, Sasha Koo-Oshima and Pasquale StedutoFAO Water Resources, Development and Management Service
Land and Water Development Division
Water desalination for agricultural applications6
desired quantity and quality of the product water, and the availability and costs of energy resources and alternate sources of water.
COSTS OF DESALINATIONThe costs of desalination depend mainly on the type of desalination process used, the quality of the intake and product waters, the output capacity of the plant, and the available options for waste disposal. They include:
ÿinvestment costs (cost of land, equipment, civil works, etc.);ÿoperation and maintenance (O&M) costs (energy, chemicals, labour, etc.);ÿenvironmental costs (water intake and environmental externalities, safe brine
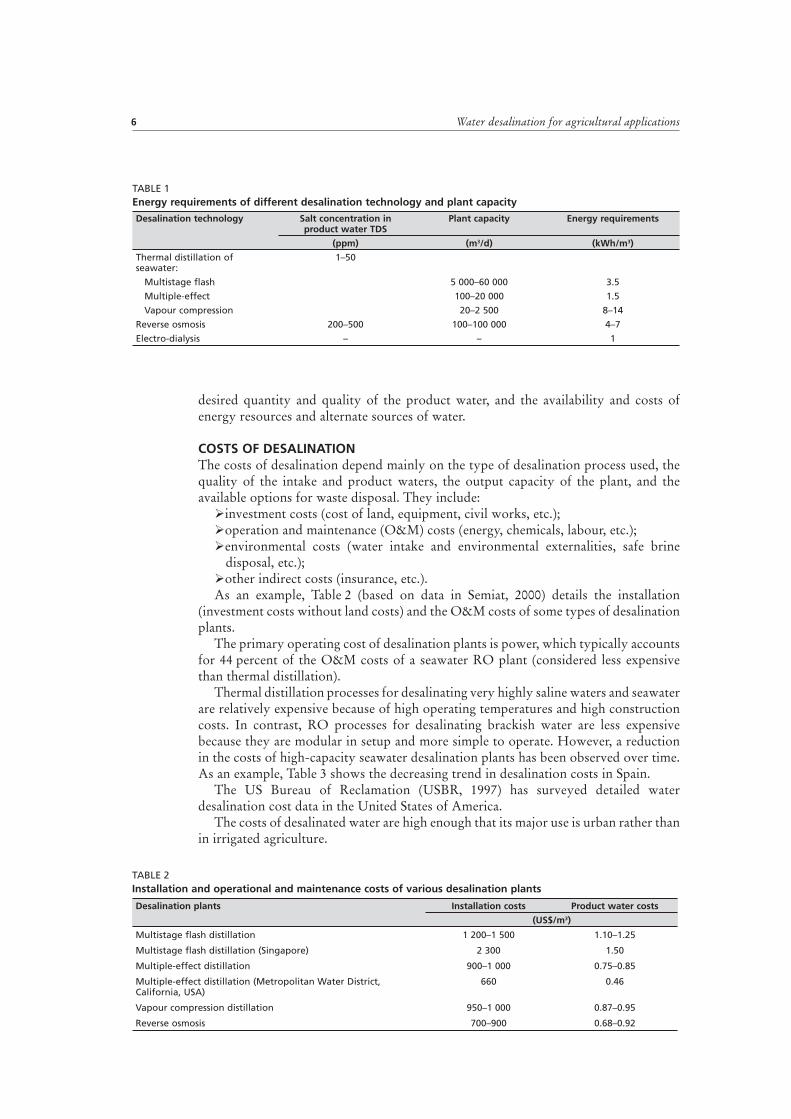
disposal, etc.);ÿother indirect costs (insurance, etc.).As an example, Table 2 (based on data in Semiat, 2000) details the installation
(investment costs without land costs) and the O&M costs of some types of desalination plants.
The primary operating cost of desalination plants is power, which typically accounts for 44 percent of the O&M costs of a seawater RO plant (considered less expensive than thermal distillation).
Thermal distillation processes for desalinating very highly saline waters and seawater are relatively expensive because of high operating temperatures and high construction costs. In contrast, RO processes for desalinating brackish water are less expensive because they are modular in setup and more simple to operate. However, a reduction in the costs of high-capacity seawater desalination plants has been observed over time. As an example, Table 3 shows the decreasing trend in desalination costs in Spain.
The US Bureau of Reclamation (USBR, 1997) has surveyed detailed water desalination cost data in the United States of America.
The costs of desalinated water are high enough that its major use is urban rather than in irrigated agriculture.
TABLE 1Energy requirements of different desalination technology and plant capacity
Desalination technology Salt concentration in product water TDS
Plant capacity Energy requirements
(ppm) (m3/d) (kWh/m3)
Thermal distillation of seawater:
1–50
Multistage flash 5 000–60 000 3.5
Multiple-effect 100–20 000 1.5
Vapour compression 20–2 500 8–14
Reverse osmosis 200–500 100–100 000 4–7
Electro-dialysis – – 1
TABLE 2Installation and operational and maintenance costs of various desalination plants
Desalination plants Installation costs Product water costs
(US$/m3)
Multistage flash distillation 1 200–1 500 1.10–1.25
Multistage flash distillation (Singapore) 2 300 1.50
Multiple-effect distillation 900–1 000 0.75–0.85
Multiple-effect distillation (Metropolitan Water District, California, USA)
660 0.46
Vapour compression distillation 950–1 000 0.87–0.95
Reverse osmosis 700–900 0.68–0.92

Introductory paper: Desalination of saline waters 7
ENVIRONMENTAL IMPACT OF DESALINATIONA major environmental problem of water desalination is the production of a flow of brine containing the salts removed from the intake water and that needs to be disposed. In addition, this brine may be polluted. This brine represents a significant fraction of the intake water flow. Seawater desalination typically yields a brine flow of 50–65 percent of the intake water flow, with about twice the initial concentration (FAO, 2003a). Brackish water desalination may result in 10–50 percent of reject water, and its salt concentration is dependent on the initial concentration of the brackish water and the number of stages in the process.
Thus, brine production poses a significant problem of environmentally safe waste disposal. Even where plants are near the sea, brine disposal may affect the local marine ecosystem.
Environmentally safe disposal depends mainly on the site of the treatment plant. With plants situated near the sea or close to brackish environments, such as estuaries, brine disposal is comparatively easier than that from inland desalinating facilities.
Where plants are not far from the sea, the construction of special collectors is an option. However, in this case, the additional environmental costs increase the total cost significantly.
In inland plants, one option is to inject the brine into a confined aquifer through deep wells. This alternative has serious technical problems and high environmental risks.
DESALINATION WORLDWIDETable 4 presents a summary of desalination plant capacity implemented worldwide as at 1998 for units with capacities larger than 100 m3/d.
The multistage flash distillation process makes up the highest total production capacity of desalinated waters, followed closely by RO. Other processes are comparatively smaller in production capacity.
Although thermal distillation plants make up about 21 percent of the total desalinating facilities in the world, they produce more than half of the total desalinated waters because they are larger than RO facilities.
RO is particularly appealing because recent advances in membrane technology allow modular construction of desalinating facilities to meet small- to large-volume desalination needs (FAO, 2003a).
From an inventory by Wangnick (2000), seawater and brackish water
Note: US$1 = Euro0.83 as at 27 April 2004.Source: FAO, 2003b.
TABLE 3Energy consumption and seawater desalination costs in Spain
Year Energy requirements Costs
(kWh/m3) (Euro/m3)
1970 22.0 2.103
1980 18.0 1.803
1985 15.0 1.112
1988 13.0 1.102
1990 8.5 0.961
1992 7.8 0.871
1994 6.2 0.751
1996 5.3 0.661
1998 4.8 0.528
1999 4.5 0.521
2000 4.0 0.504
2001 3.7 0.492
2002 3.5 0.428
Source: Wangnick, 2000.
TABLE 4Summary of worldwide desalination capacity, 1998 Desalinating process % Capacity No. of plants
(106 m3/d)
Multistage flash distillation 44.4 10.02 1 244
Reverse osmosis 39.1 8.83 7 851
Multiple-effect distillation 4.1 0.92 682
Electro-dialysis 5.6 1.27 1 470
Vapour compression distillation
4.3 0.97 903
Membrane softening 2.0 0.45 101
Hybrid processes 0.2 0.05 62
Others 0.3 0.06 120
Total 100.0 22.57 12 433

Water desalination for agricultural applications8
make up about 59 percent and 41 percent, respectively, of the total water sources for desalination.
THE USE OF DESALINATED WATER IN AGRICULTUREIn the past, the high cost of desalinating and the energy required have been major constraints on large-scale production of freshwater from brackish waters and seawater. However, desalinated water is becoming more competitive for urban uses because desalinating costs are declining and the costs of surface water and groundwater are increasing.
In spite of this development, the costs of desalinated water are still too high for the full use of this resource in irrigated agriculture, with the exception of intensive horticulture for high-value cash crops, such as vegetables and flowers (mainly in greenhouses), grown in coastal areas (where safe disposal is easier than in inland areas).
For agricultural uses, RO is the preferred desalination technology because of the cost reductions driven by improvements in membranes in recent years.
Spain provides a significant example of the application of desalinated water in irrigation. Spain has more than 300 treatment plants (about 40 percent of the total number of existing plants) and 22.4 percent of the total desalinated water is used for agriculture. Most of these plants process brackish water (only 10 percent of the total desalinated water for agriculture originates from seawater) and are located in coastal areas or within 60 km of the sea (FAO, 2003b). In this country, small and medium-sized brackish-water desalination plants, with a capacity of less than 1 000 m3/d (11.6 litres/s), are common because they adapt better to individual farmer requirements and to the existing hydraulic structures.
PUBLIC–PRIVATE PARTNERSHIPS IN DESALINATIONDesalination is the main source of potable water in the countries of the Gulf Cooperation Council (GCC), i.e. Bahrain, Kuwait, Oman, Qatar, Saudi Arabia and the United Arab Emirates. In these countries, desalination accounts for 40 percent of the water used for municipal and industrial uses. Kuwait and Qatar rely on desalinated water for 100 percent of their domestic and industrial needs.
The involvement of the private sector in providing freshwater is promising as it has the capability to provide the necessary capital, networks, technology, experience and human resources. Public–private partnerships (PPPs) have been much discussed at meetings worldwide on institutional and regulatory frameworks for private investment, market risk, offtaker risk, tariff structure and desalinated water charging, construction/technical/operational risk, financing structure, credit enhancements, environmental risk, etc. The need for a market-based economy and an expanded role of regional banks has also been raised. Recently, many countries have turned to the private sector for additional funding in investment projects. The build own operate transfer (BOOT) project delivery method has become the preferred method for municipalities and public utilities worldwide as it allows cost-effective transfer to the private sector of the risks associated with the costs of desalinated water. Some of these risks include: predicting plant performance due to variable intake-water quality; permitting challenges; startup and commissioning; fast-changing membrane technology and equipment market; and limited public-sector experience with the operation of large seawater desalination facilities (Voutchkov, 2004).
However, there are infrastructure constraints on the application of PPPs. For example, desalination normally requires long-distance transport of desalinated water to its site of use. Furthermore, there are institutional constraints that need to be addressed in concert with PPPs, such as establishing a water pricing policy and incentives, investment in research and development, and integrated water resources management.

Introductory paper: Desalination of saline waters 9
The State of California in the United States of America has the institutional experience of setting up of a water desalination task force. This task force has examined and reported on the opportunities and impediments of both brackish and seawater desalination, and the role of the State in furthering the use of this technology (Department of Water Resources, 2003a). A report from the California Coastal Commission (2003) has been released on the policy conformity of desalination to the Californian Coastal Act. Finally, environmental issues and plant permits are related institutional and legal issues, and a working draft of the California Water Plan Update was completed in 2003 (Department of Water Resources, 2003b).
Other constraints relate to the public perception of private-sector involvement in PPPs. Public concerns regard potential price increases, inappropriate business practices, and insufficient information dissemination. The effect of water quality on socio-economic growth has not been well quantified, and human resources and related organizations are still at a nascent stage. All the above issues pose current challenges to the sustainable application of desalination for supplying both potable water and irrigation water.
CONCLUSIONSModerately saline waters can be used for irrigation where control of soil salinity in the crop rootzone is by means of leaching and drainage of dissolved salts. However, where brackish water is the only resource available, prior desalination is needed.
Since the 1960s, saline desalination has been technically feasible. However, to-date, the energy required and the high cost of desalinating brackish waters and seawater have been the major constraints on large-scale production of freshwater from saline waters. Environmental costs relating to the safe disposal of residual brines – to be added to investment and O&M costs – are also an important issue concerning the development of water desalination, especially in plants far from estuaries and the sea.
However, in regions with scarce freshwater resources, water desalination for municipal and industrial uses is being applied increasingly as desalinating costs decline and the costs of surface and groundwater supplies increase. In high-capacity plants, reductions in energy consumption and operational costs are expected through the introduction of new equipment for energy recovery and through improvements in RO membrane technology.
Desalinated brackish waters and seawater are not used worldwide for irrigated agriculture because of the costs involved. However, in some countries, they are used for high-value horticultural cash crops. As irrigated agriculture does not require the strict standards that apply for drinking-water requirements, opportunities appear to exist for blending high-quality desalinated water with lower-quality waters. In this way, the final cost of a cubic metre of irrigation water can be reduced. Moreover, the desalination of saline waters for urban supply will also have a considerable impact on the production of low salt-content wastewater to be treated subsequently, with lower costs for use in irrigated agriculture.
REFERENCESAbu Zeid, M. 2000. Desalination in Egypt between the past and future prospects. Watermark,
Issue 9, Newsletter of the Middle East Desalination Research Center.Buros, O.K. 1999. The ABCs of desalting. 2nd Edition. International Desalination
Association.California Coastal Commission. 2003. Seawater desalination and the California Coastal Act.
Draft report. 55 pp.Department of Water Resources. 2003a. Water desalination. Findings and recommendations.
Water Desalination Task Force. 17 pp.Department of Water Resources. 2003b. California Water Plan Update 2003. Bulletin 160-03.

Water desalination for agricultural applications10
FAO. 2003a. Desalination of brackish waters and seawater, status in California and the USA, by K. Tanji. Draft report. Rome.
FAO. 2003b. La desalación de agua de mar en la agricultura: situación actual y perspectivas
futuras, by J.A. Medina. Draft report. Rome.Furukawa, D.H. 1997. A review of seawater reverse osmosis. IDA Desalination Seminar, Cairo,
September 1997.Semiat, R. 2000. Desalination: present and future. Wat. Int., 25(1): 54–65.US Bureau of Reclamation (USBR). 1997. Survey of US costs and water rates for desalination
and membrane softening plants. Water Treatment Technology Program Report No. 24. 43 pp. + appendixes.
Voutchkov, N.V. 2004. The ocean – a new resource for drinking water. Pub. Works, June: 30–33.
Wangnick, K. 2000. A global overview of water desalination technology and the perspectives (available at http:// www.us.es).

11
Koussai QuteishatMiddle East Desalination Research Center
Muscat, Oman
Water desalination technologies and costs – state of the art
ABSTRACTDesalinated water is becoming less of a “non-conventional” water resource. In some countries of the Arabian Gulf, it accounts for practically all potable water supplies, while it accounts for almost half of the domestic water supply in some other states in the Arabian Gulf. The fact that it is not a new technology provides a greater market potential as plants constructed in the earlier days of desalination are now ageing and in need of refurbishment. This, compounded by the growing need for freshwater, has led to a dramatic increase in the demand for desalination facilities. Recently, major increases in the demand for desalinated water have also been seen in areas other than the Arabian Gulf, namely North African states such as Algeria and the Libyan Arab Jamahiriya. On a somewhat smaller scale, but also rising, are needs for desalinated water in Egypt and other North African states as well as Israel, Jordan and the Palestinian Authority.
Technological advances in desalination processes are coping with the demand and have catered to the needs of burgeoning populations and industrial growth in terms of scale and rapid construction. This has resulted in sharp falls in the cost of producing desalinated water.
The key source to mobilize funding for desalination projects has been government, but the size of planned investments has convinced many governments that the private sector has a role to play in this development. Unlike in power projects, growth in public–private partnerships for desalination has been slow. Several reasons account for this and have induced both the public and private sectors to collaborate in order to facilitate transactions. Successful models for independent water and power producers exist but they need broader dissemination, particularly among government entities.
This paper reviews market trends in desalination, technological advances and direction, cost structure, and the various constraints that may affect the development of desalination.
INTRODUCTIONThe Middle East and North Africa (MENA) region is known more for its abundance of oil rather than for its shortage of water. It is the driest region in the world with renewable water resources of less than the critical level of 1 000 m3/person/year as defined by the World Health Organization (WHO). The shortage of water is becoming an increasingly common problem across much of the world. This can be attributed to a number of causes: growing populations, frequent droughts, increasing per-capita water demand, and industrial development. These and other factors combine to create a dire need for water of good quality as a reliable source for the future.

Water desalination for agricultural applications12
This reliable source of supply should utilize a technology that can be relied upon for many years and can ensure a guaranteed water supply independent of the climate conditions that prevail in the area. Desalination fits this requirement. Today, almost 7 500 million m3 are produced annually across the globe for various uses. The primary share goes to municipal use (4 800 million m3), followed by industry (1 900 million m3) and power (392 million m3). Agricultural use accounts only for 230 million m3.
Initially, desalinated water as a resource was restricted to use on islands, military bases, industrial sites and hotels (1950–1970). Between 1970 and 1995, it became the main resource for cities in the Arabian Peninsula and it has now become an accepted fact in the states of the Gulf Cooperative Council (GCC) that their future water demand will be met by desalination. In addition to the GCC countries, desalination is becoming the only viable and economic solution for countries such as Israel, Jordan and the Palestinian Authority. North African countries vary in their demand for desalination from the need to supply water to sea resorts, such as in Egypt and in Tunisia, to becoming an alternative to major water transport schemes, such as Egypt in its Sinai development, and Morocco for supply to its southern region. Countries such as the Libyan Arab Jamahiriya and Algeria view desalination as a de facto source of water to meet growing demands for fresh supplies. Whereas the Syrian Arab Republic and Lebanon may not see the need for desalination, the Syrian Arab Republic (with overabstracted aquifers) still has to consider desalination in its interior far from rivers and the sea. On the other hand, Yemen, the most water-depressed country in the world, has the additional problem of being forced into a combination of desalination and major transport schemes. Iraq is likely to experience severe water-treatment requirements equivalent to desalination, and it will also need solutions involving desalination in its southern territories.
DESALINATION TECHNOLOGYDesalination is a separation process that produces two streams: freshwater and saline solution (brine). Saline water is classified as either brackish water or seawater depending on the water source, brackish water being less saline than seawater. Two main commercial desalination technologies have gained acceptance throughout the world, namely those based on thermal and on membrane processes.
Thermal processes, except freezing, mimic the natural process of producing rain. Saline water is heated, producing water vapour that in turn condenses to form freshwater, thus producing freshwater by distillation. These processes include multistage flash (MSF), multiple-effect distillation (MED) and vapour compression (VC) distillation. In all these processes, condensing steam is used to supply the latent heat needed to vaporize the water. Owing to their high-energy requirements, thermal processes are normally used for seawater desalination and in dual power and water production plants. In addition, thermal processes are capable of producing high-purity water, do not require sophisticated pre-treatment, and are not sensitive to water contamination by oil or other organic matter.
Membrane processes include reverse osmosis (RO) and electro-dialysis (ED). Whereas ED is suitable for brackish water, RO can be used for both brackish water and seawater.
Desalination processes have undergone considerable development in the past 30 years. This development has led to a reduction in desalinated water cost to a level that has made desalination a viable option for potable water supply.
It is now technically and economically feasible to generate large volumes of water of suitable purity through the desalination of seawater, brackish water, and desalination of wastewater for reuse. In order to appreciate the unique opportunities for desalination and power industries in the Middle East, it is essential to understand the state of the art as well as the current trends in both technology and business.

Water desalination technologies and costs – state of the art 13
TRENDS IN DESALINATION TECHNOLOGYThermal desalinationSignificant technological developments to the distillation processes are not expected as the technology is fairly mature. However, there will be changes in the materials that constitute the plant (particularly in the tubing used in the heat exchangers), in larger plant unit sizes producing as much as 76 000 m3/d for MSF and 23 000 m3/d for MED, and in the faster delivery of plants (becoming of the order of 1–2 years).
Membrane desalinationThere is always room for development in membrane technologies. Development is driven by the fact that membranes are gaining wider use in water/wastewater treatment as well as pre-treatment for desalination. Technological trends include integrated membrane solutions, increased energy efficiency, and increased recovery ratio for seawater RO. New developments will also witness lower use of materials, fewer chemicals and smaller footprints.
As the success of RO desalination hinges on the proper pre-treatment of the feed water, various membranes could precede the removal of the monovalent ions by the desalination membrane in order to selectively remove suspended solids and decrease turbidity (microfiltration), organics (ultrafiltration) and hardness and sulphates (nanofiltration). Various energy recovery devices are now available, such as Pelton wheel turbines, work and pressure exchangers as well as hydraulic turbochargers that can reduce energy requirements by as much as 50 percent.
Larger plant size also contributes to the economy of scale that is significant between a plant producing 1 000 m3/d and that producing 40 000 m3/d, where the capital cost per cubic metre of water can decrease by a factor of 2.5. However, RO plant sizes larger than 40 000 m3/d will not have any further considerable effect on cost reduction.
Other trendsOwing to the difference in the demand growth factors (11 percent for water and 4 percent for power), a decoupling between power and desalination plants is expected. Where dual-purpose plants are planned, a major trend in technological development is the utilization of more than one process in combination. Such hybrid thermal/membrane combinations offer several advantages including the use of the steam to de-aerate the feed water and optimization of its temperature for RO, application of the post treatment to the combined product, use of the same seawater intake, and combining the discharged brine with the recycled brine.
Hybrid systems of RO and thermal processes utilize seasonal surpluses of idle power and address the power/water mismatch caused by differences in either daily or seasonal demands. The largest such hybrid plant is in Fujeirah, United Arab Emirates, where MSF desalinates 284 000 m3/d and RO desalinates 170 000 m3/d. To further address power/water mismatches, using idle power to desalinate would lead to greater water production, hence the need for storage of this excess desalinated water. Therefore, desalination aquifer storage and recovery (DASR) is considered strategic in terms of cost and security.
In addition, using filtration processes in conjunction with thermal processes to remove the hardness in the feed water theoretically reduces the scaling potential and allows the thermal plant to be operated at higher temperatures, hence, greater productivity.
Trends that are also worth tracking are the use of renewable energies in desalination, and the growing importance of the environmental impacts of desalination plants.

Water desalination for agricultural applications14
TRENDS IN THE DESALINATION MARKETDesalination development potentialDesalination has great development potential on a global scale. This is attributed to the fact that out of 71 large cities that do not have local access to new freshwater sources, 42 are coastal. Out of the entire world population, 2 400 million inhabitants (39 percent) live within 100 km of the sea. Current production of desalinated seawater corresponds only to the demand of 60 million inhabitants. Although desalination has been considered among the non-conventional water resources, it can no longer be considered as a marginal resource because some countries such as Kuwait and Qatar rely 100 percent on desalinated water for domestic and industrial uses (nearly 60 percent in Saudi Arabia).
Other than the fact that desalination may be the only option for some countries, there are driving forces behind its development potential, making it more favourable than conventional resources. Being independent of climate conditions, rainfall and so on, a primary force is its identification as a secure source of supply. Compared with conventional civil engineering projects, desalination offers advantages in terms of the length of the construction period, which is in the order of 1–3 years, as well as its modular construction allowing the increase in supply to be in line with that of the demand. In addition, a desalination project is less likely to encounter opposition from local groups or problems associated with construction right of way. Furthermore, it is much more attractive to private-sector investment than is a dam or a conveyor system. Given these factors, it appears that desalination is the only recourse for regions with overdrafted groundwater aquifers, albeit in combination with integrated management (primarily that of water demand).
Status of desalination in the MENA and market share developmentDesalination has become the main source of potable water in all the GCC states, where the annual demand rose from 1 500 million m3 in 1980 to 6 000 million m3 in 2000. Desalination is expected to provide an additional 5 000 million m3 per year by 2015.
This need for desalinated water is no longer associated only with the GCC. Almost all countries in the MENA are now considering desalination. Whereas desalination is expected to double by 2015 in the GCC countries, primary growth will also be seen in the Libyan Arab Jamahiriya, Algeria and Israel (slightly less than threefold from the planned capacity). This growth is driven by chronic water shortages caused by persisting droughts, increasing populations, increasing per-capita water demand and growing industrialization. On the other hand, this growth is also enhanced by the decrease in the costs associated with the production of desalinated water where prices have fallen from about US$4/m3 to less than US$1/m3.
Table 1 shows the desalinated capacity around the globe with the relative percentages for both the MENA countries and the GCC countries. Figure 1 shows the relative distribution of the overall desalination capacity in the MENA region with respect to the type of feed water.
Table 2 shows the relative distri-bution of desalinated capacity (market share) with regard to the energy source that drives the desalination processes. These figures fluctuate almost yearly, with the highest increase in market share allocated to RO and MED.
The predominant desalination process is currently the MSF thermal process, primarily in the MENA region and almost exclusively in the
Region Operation Contracted
(m3/d)
Worldwide 23 808 295 25 787 312
MENA 12 159 142 15 928 814
(62 %)
GCC 10 355 436 13 754 536
(53 %)
Non-GCC 1 803 706 2 174 278Note: In 1972, total world desalination capacity was 2 million m3/d.Source: Wangnick, 2000.
TABLE 1Desalination capacity by region

Water desalination technologies and costs – state of the art 15
GCC. There are several factors behind the selection of thermal processes over mechanical or electrical processes. In addition to the poor performance of RO plants in the early days, attributed mostly to the high salinity of the Gulf water (in excess of 40 000 ppm), thermal processes are suitable for dual-process plants of power generation and freshwater production, thus integrating both demands for water and power. The availability of oil and gas in the GCC countries has contributed to their growth. MSF technology, capable of producing water of high purity with total dissolved solids (TDS) of less than 25 mg/litre, has become more reliable and mature and has grown in unit size to far exceed 55 000 m3/d, imparting the additional element of the economy of scale.
The market for distillation processes will remain strong as long as there is also a need for power generation. In this aspect, MED is gaining ground over MSF because it offers significant potential reductions in costs owing to its lower specific energy consumption of 1.8 kWh per tonne of distillate versus 4 kWh per tonne for MSF. MED also has a higher performance ratio (in terms of kilograms of water per kilogram of steam) of 15 versus 10 for MSF.
The least common thermal process is thermal vapour compression (TVC), which can also be driven by electric motor. Although it is simple, reliable, can operate at temperatures below 70 °C and is more efficient, TVC exists only in small-scale units of the order of 3 000 m3/d.
Moreover, a significant market is expected for refurbishing and upgrading older plants.
Where decoupled from power, the more cost-effective RO is usually selected, which is also becoming a mature technology attributed primarily to the advancement in pre-treatment technologies. Its market share will increase at the expense of distillation processes, particularly as the rate of growth of demand for power increases at an annual rate of 4 percent whereas for water it stands at 11 percent.
The second membrane process, also relying on electrical energy, is ED. ED is applicable only to brackish water but it has the characteristics of high recovery, the ability to cope with suspended solids, and it uses fewer chemicals and utilizes robust membranes. This last quality offers opportunities for a wider use of the process.
Given the size of the market in the MENA region (estimated at US$20–30 000 million in the next ten years), it has become necessary to move away from public financing of projects. Where cogeneration projects (power and water) are being implemented, the trend has been for them to be project financed by an independent water and power producer (IWPP), where a developer owns a portion of the stakes and partners a public entity in a company set up specifically for the purpose of project implementation and operation. Abu Dhabi has had the most successful model in the region with six
0
2
4
6
8
10
12
14
1960 1965 1970 1975 1980 1985 1990 1905 2000C
ap
acit
y (
m /d
)
All water
Seawater
Brackish water
Year3
FIGURE 1Cumulative total capacity of desalination plants in
operation in the MENA region
TABLE 2Competitive desalination processes
Source: Wangnick, 2000.
Energy driving the process Share of world capacity
(%)
Thermal energy:
Multistage flash 45
Multiple-effect distillation 4
Thermal vapour compression 1
Mechanical energy (usually by electric motor):
Mechanical vapour compression 3
Reverse osmosis 42
Electrical energy:
Electro-dialysis 1
Water desalination for agricultural applications16
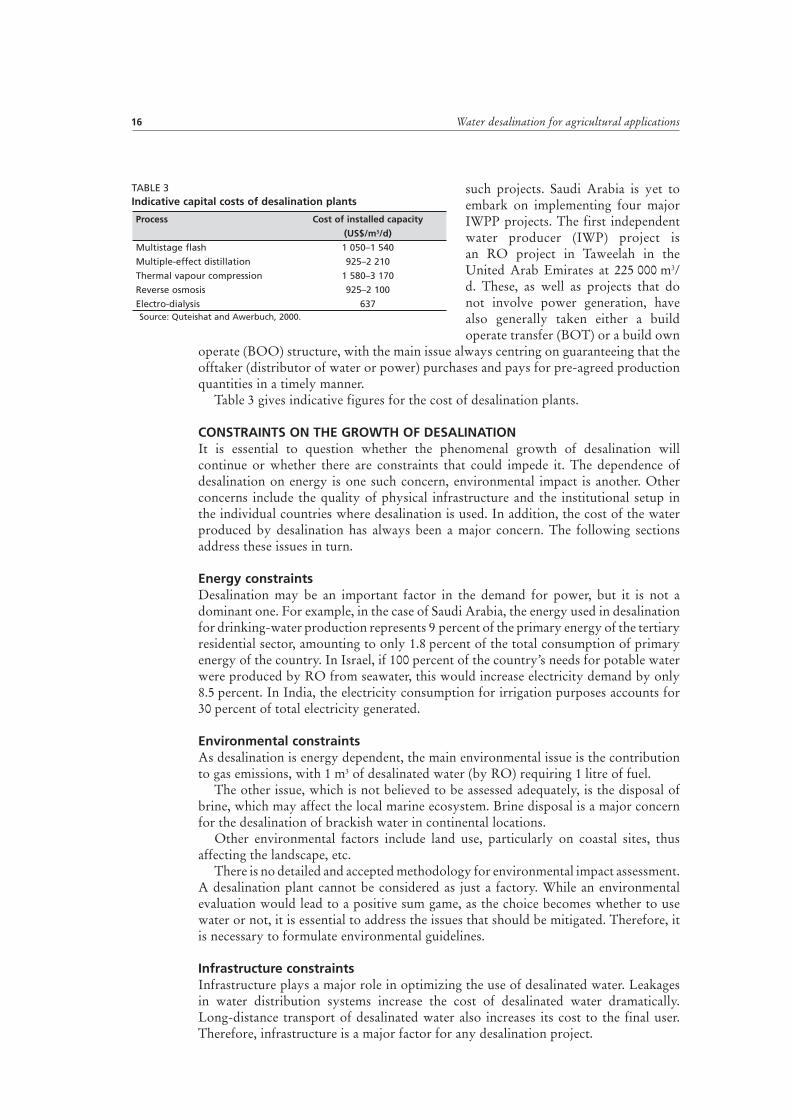
such projects. Saudi Arabia is yet to embark on implementing four major IWPP projects. The first independent water producer (IWP) project is an RO project in Taweelah in the United Arab Emirates at 225 000 m3/d. These, as well as projects that do not involve power generation, have also generally taken either a build operate transfer (BOT) or a build own
operate (BOO) structure, with the main issue always centring on guaranteeing that the offtaker (distributor of water or power) purchases and pays for pre-agreed production quantities in a timely manner.
Table 3 gives indicative figures for the cost of desalination plants.
CONSTRAINTS ON THE GROWTH OF DESALINATIONIt is essential to question whether the phenomenal growth of desalination will continue or whether there are constraints that could impede it. The dependence of desalination on energy is one such concern, environmental impact is another. Other concerns include the quality of physical infrastructure and the institutional setup in the individual countries where desalination is used. In addition, the cost of the water produced by desalination has always been a major concern. The following sections address these issues in turn.
Energy constraintsDesalination may be an important factor in the demand for power, but it is not a dominant one. For example, in the case of Saudi Arabia, the energy used in desalination for drinking-water production represents 9 percent of the primary energy of the tertiary residential sector, amounting to only 1.8 percent of the total consumption of primary energy of the country. In Israel, if 100 percent of the country’s needs for potable water were produced by RO from seawater, this would increase electricity demand by only 8.5 percent. In India, the electricity consumption for irrigation purposes accounts for 30 percent of total electricity generated.
Environmental constraintsAs desalination is energy dependent, the main environmental issue is the contribution to gas emissions, with 1 m3 of desalinated water (by RO) requiring 1 litre of fuel.
The other issue, which is not believed to be assessed adequately, is the disposal of brine, which may affect the local marine ecosystem. Brine disposal is a major concern for the desalination of brackish water in continental locations.
Other environmental factors include land use, particularly on coastal sites, thus affecting the landscape, etc.
There is no detailed and accepted methodology for environmental impact assessment. A desalination plant cannot be considered as just a factory. While an environmental evaluation would lead to a positive sum game, as the choice becomes whether to use water or not, it is essential to address the issues that should be mitigated. Therefore, it is necessary to formulate environmental guidelines.
Infrastructure constraintsInfrastructure plays a major role in optimizing the use of desalinated water. Leakages in water distribution systems increase the cost of desalinated water dramatically. Long-distance transport of desalinated water also increases its cost to the final user. Therefore, infrastructure is a major factor for any desalination project.
TABLE 3Indicative capital costs of desalination plants
Source: Quteishat and Awerbuch, 2000.
Process Cost of installed capacity
(US$/m3/d)
Multistage flash 1 050–1 540
Multiple-effect distillation 925–2 210
Thermal vapour compression 1 580–3 170
Reverse osmosis 925–2 100
Electro-dialysis 637

Water desalination technologies and costs – state of the art 17
Institutional constraintsSeveral institutional constraints can be seen in the MENA region water sector. Human resources and related organizations are weak. The desalination industry has been more concerned with water production rather than integrated water resources management. Water pricing policies that prevent full cost recovery are expected to affect the sustainability of desalination. There also seems to be a lack of policy and incentives to localize technology, which is coupled with minimal investment in research and development.
COST OF DESALINATED WATERCost structureThe cost structure in Table 4 is given for the purpose of comparing alternate desalination schemes as well as a simple water pipeline project to transfer domestic water from one point to another.
The following assumptions are made in the analysis:ÿwhere seawater is used, its salinity is 36 g/litre;ÿproduction capacity is levelled at 40 000 m3/d;ÿwhere membranes are used, membrane life is 6 years;ÿcost of steam is US$1.39/mBtu, and that of electricity at US$0.05/kWh;ÿload factor (percentage of the design capacity or the maximum load at which the
plant can operate) for each alternative is set at 90 percent;ÿloan is for 20 years at an interest rate of 7 percent.Table 4 shows that the total cost of supplying a town on the sea with domestic water,
by either RO or by transferring water from 300 km away, is nearly equivalent. It is also expected that the cost of RO would decrease whereas pipeline supply cost would increase.
Ability to payFor domestic users in countries of the Organisation for Economic Co-operation and Development (OECD), affordability is not a concern. Most OECD countries have cost-recovery tariffs in excess of the cost of desalination. However, affordability is a major problem for domestic users in developing countries, particularly where the efficiency of the distribution system is impaired by inadequate management or leakages in the networks. For industrial users, water supply costs are rarely a major factor in competitiveness whereas desalination is definitely not affordable for irrigating basic crops.
CONCLUSIONSIn terms of the desalination market and technology, the following can be concluded:
ÿGrowth in desalination is phenomenal in the MENA. The market is growing and is reliable.
ÿDesalination technology is responsive to market needs.ÿGrowth is sustainable in terms of water needs, but factors constraining the growth
rate of desalination should be mitigated:• Energy is not a major issue, but consumption can still be reduced.
TABLE 4Cost structure of various desalination processes
Source: Labre, 2002.
Reverse osmosis
Multiple-effect
distillation
Multistage flash
Water transfer pipeline (300 km)
Cost item (US$/m3)
Capital cost 0.301 0.520 0.449 0.548
Labour 0.128 0.128 0.128 0.128
Electricity 0.250 0.100 0.250 0.150
Steam 0.256 0.305
Replacement 0.126 0.072
Chemicals 0.072 0.024 0.024 0.024
Total 0.877 1.100 1.156 0.850

Water desalination for agricultural applications18
• Net environmental impacts are positive. However, guidelines are needed.• Distribution infrastructures are critical. Therefore, rehabilitation may be
necessary.• Institutional setups are weak. Therefore, reforms may be needed.• Costs are declining, but they can be further reduced.
ÿThe private sector has a role to play by investing in desalination in order to meet capital needs.
REFERENCESLabre, J. 2002. Desalination market: demand approach. Matching desalinated water and
conventional resources, Ondeo Workshop, Paris.Quteishat, K. & Awerbuch, L. 2000. Desalination and power developments and challenges in
the Middle East. 25th Annual Middle East Electricity Congress, Dubai.Wangnick, K. 2000. A global overview of water desalination technology and the perspectives
(available at http://www.us.es).

19
José Miguel VezaDepartment of Process Engineering
University of Las Palmas de Gran Canaria
Spain
Water desalination and wastewater reuse for agriculture in Spain
SUMMARYThis paper reviews the use of desalination technologies to produce freshwater for irrigation purposes in Spain, with a particular focus on the Canary Islands. The semi-arid areas of Spain suffer from a shortage of water resources, particularly if related to their size and population. In addition, agricultural water demand is rising, particularly for winter crops, which are in demand in the north European countries. This set of circumstances has given rise to the need for water desalination. In the 1980s, there were considerable withdrawals of brackish groundwater and a number of desalination units were installed and operated. However, the need to protect aquifers from overexploitation led to a shift to seawater plants.
On the other hand, and owing to the costs of desalinating water, it was soon realized that available wastewater should be reclaimed and reused as much as possible. Because wastewater has a high load of suspended and dissolved solids, a further tertiary treatment is required and membrane technologies have become essential.
Throughout southeast mainland Spain and the Canary Islands and Balearic Islands, there are many examples of using desalination processes for brackish water and seawater, as well as wastewater treatment, providing water for irrigation purposes, in a wide range of plant sizes, different water quality sources, and technologies applied. This paper presents some of these cases in order to provide an overview of current practices in Spain.
BRACKISH WATER DESALINATIONTwo desalination technologies are available in Spain for brackish water desalination: reverse osmosis (RO) and electro-dialysis reversal (EDR). This paper presents some examples of both methods.
Reverse osmosisSome of the Canary Islands are provided with substantial quantities of brackish groundwater. However, the Island Water Master Plans (BOC, 1997 and 1999) include indications whereby abstractions of brackish groundwater should be kept to a minimum in order to allow for replenishment and to maintain the water balance. Therefore, although some facilities were authorized some time ago, it is now difficult to obtain permits for exploiting new groundwater sources for desalination.
Some plants have been operating for years. More than 200 plants have been built using RO technology for brackish waters, usually pumped from wells. In this case,

Water desalination for agricultural applications20
particular attention must be paid to silica, which is quite frequent in the Canary Islands (owing to their volcanic origin), because of its low solubility limit.
Table 1 shows the breakdown of the Canary Islands RO plants according to their capacities.
The following paragraphs describe some examples of RO plants.The La Florida second plant (Plate 1) was built in 1999 with a production capacity
of 2 500 m3/d running on brackish water pumped from wells. This unit uses 20-cm elements, 1.5 m long, spiral wound, in 6-m pressure vessels, operating at 12 bar.
Other examples are located on the Spanish mainland. The first case is the plant built by SADYT at Pulpí, Almería, with a product flow rate of 6 000–7 000 m3/d and
a recovery ratio of 68 percent. The raw water is taken from a watercourse, which in turn receives drainage waters from irrigation (Rubio et al., 2004).
The average electric conductivity (EC) of the water source is 6 200 µS/cm, whereas the product water average EC is between 300 and 500 µS/cm. This water is used for irrigation.
The system consists of two racks (Plate 2), each one in two stages provided with 20 and 210 pressure vessels, each with six spiral-wound elements. This particular plant uses two different membranes, one in each rack, operating at pressures of 12–15 bar.
Figure 1 shows a flow diagram of the plant located at Pulpí.
The Pulpí plant serves a similar purpose to another plant located at Mazarrón, Murcia. Table 2 shows the main features of both plants.
Table 3 shows a cost comparison of the two plants.
One of the problems associated with operating plants fed with brackish groundwater is the risk of increasing salinity in the raw water. This is caused by an increasing amount of groundwater abstraction, as pointed out by León et al. (2003).
RO has proved a good technology for desalinating brackish waters, providing product water suitable for irrigation at a reasonable cost. Energy consumption, mainly related to the
TABLE 1Breakdown of brackish water RO plant capacities, Canary Islands
Plant capacity, m3/d < 500 500–1 000 1 000–2 000 > 2 000 Total
Capacity production, m3/d 15 198 26 799 14 480 16 300 72 777
Number of plants 54 90 102 6 252
Source: Fundación Centro Canario del Agua, data online.
Plate 1The La Florida second plant.
Plate 2General view of the Pulpí plant.

Water desalination and wastewater reuse for agriculture in Spain 21
operating pressure (10–20 bar), is a main concern. Membrane fouling is also an issue that has to be addressed carefully. Therefore, an appropriate pre-treatment scheme must be designed prior to desalination itself.
Electro-dialysis reversalEDR technology is based on the principle of electrolysis, combined with anion and cation membranes that operate in a similar way to ion exchange. Therefore, the energy supplied for the process takes the form of an electric potential difference (direct current) where dissolved ions are attracted towards cathode and anode and transferred through the membranes. Thus, the feed flow becomes progressively less saline, and
Raw watertank
Reverseosmosismodules
Microfiltration
Product water
tank
Filtration
on silex/
antracite
Filtration
on silex
Raw water
and
product
blending
PLANT FLOW DIAGRAM
Product
NaHO3, HCL,
antiscalant
closing
Reject
Cleaning
equipment
Settlingtank
Make uptank
FeCL3,
NaCLO
dosing
Water courseIn:
FIGURE 1Flow diagram of the Pulpí plant
TABLE 2Main features of the Mazarrón and Pulpí plants
Note: US$1 = Euro0.83 as at 27 April 2004.
Mazarrón Pulpí
Irrigated area (ha) 3 956 7 022
Location Mazarrón, Lorca, Cartagena Pulpí, Aguilas, Almeria
Members of cooperative society 883 1 200
Crops Horticulture and woodland Horticulture and woodland
Annual water demand (Mm3) 18 17
Desalination production capacity (m3/d) 13 500 6 500
Fraction of demand covered by desalination (%) 26 14
Water source Brackish groundwater Brackish groundwater
Feed water EC (µS/cm) 6 200
Product water EC (µS/cm) 300–500
Year of construction 1995 1998
Investment cost (M Euro) 4.72 1.35
Percentage subsidized 64 52

Water desalination for agricultural applications22
eventually becomes the product flow channel.The process is particularly suitable for brackish water with total dissolved solids
(TDS) up to 3 000 mg/litre because the amount of energy required is directly proportional to the amount of salts to be removed. In fact, with low-salinity waters, the process only requires a reasonable energy consumption (1–2 kWh/m3). The units can be designed in stages to reach low salinities, below 500 mg/litre TDS. They require little pre-treatment, being suitable for waters with suspended solids, such as wastewater.
Over the years, a number of EDR plants have been operating in several locations on the Canary Islands (Table 4 [Ionics Ibérica, data on line]).
SEAWATER DESALINATIONAs described above, it was soon understood that brackish groundwater might not be an easy solution for providing irrigation water in the Canary Islands, and some users turned to seawater.
In Gran Canaria, the first seawater desalination plant for irrigation was built in 1987 for BONNY (growers and exporters). The plant is denoted as Las Salinas (Plate 3). Nominal production capacity is 6 900 m3/d and a further 500 m3/d expansion is considered under a research and development (R&D) project using gas produced from agricultural biomass (F. Ojeda, personal communication, 2004).
TABLE 3Cost comparison, Mazarrón and Pulpí plants
Note: US$1 = Euro0.83 as at 27 April 2004.
Mazarrón Pulpí
(Euro cents/m3)
Energy 4.2
(discount for self-generation)
5.9
Labour 1.3 1.6
Chemicals 2.1 2.9
Maintenance 1.9 1.9
Membrane replacement 1.5 1.3
Consumables 0.9 1.0
Total operating 11.9 14.6
Total (capital & operating), subsidies discounted 18.0 19.9
Total (capital & operating) 30.1 26.4
TABLE 4Examples of EDR plants for brackish water treatment in the Canary Islands
Source: Ionics Ibérica, data online.
Plant La Botana 1
La Guancha 1
Costa Tejina Los Lentiscos
Hoya del Cano
La Guancha 2
La Botana 2
ICOD 2
Tamaimo
Owner Consejo Insular de Aguas de Tenerife
Cabildo Insular de Tenerife
Comunidad de Aguas Pozo Costa Tejina
Comunidad de Aguas Pozo de Los Lentiscos
Comunidad de Aguas Pozo Hoya del Cano
Consejo Insular de Aguas de Tenerife
Consejo Insular de Aguas de Tenerife
Consejo Insular de Aguas
Consejo Insular de Aguas
Location La Botana, Icod de los Vinos, Tfe
La Guancha, Tenerife
Guía de Isora, Tenerife
Firgas, Gran Canaria
Arucas, Gran Canaria
La Guancha, Tenerife
La Botana, Icod de los Vinos
Icod de los Vinos, Tfe
Santiago del Teide, Tenerife
Start up 1994 1995 1997 1998 1998 2000 2001 2003 2003
Production (m3/d)
1 200 1 900 1 400 1 550 1 550 4 000 2 100 4 000 2 100
Recovery (%) 85 90 > 85 > 85 88 90 85 85 > 85
Feed water TDS (mg/litre)
1 700 1 700 1 600 3 000 2 000 1 700 2 200 2 300 2 000
Product water TDS (mg/litre)
350 350 350 250
Product water use
Potable. Fluor removal
Potable. Fluor removal
Irrigation Irrigation Irrigation Potable. Fluor removal
Potable. Fluor removal
Irrigation/potable Fluor removal
Irrigation/potable

Water desalination and wastewater reuse for agriculture in Spain 23
The technology used is RO, with reciprocating high-pressure pumps, quintuplex with ceramic pistons. The membrane elements used are Filmtec, Fluid Systems, Toray and Hydranautics, always spiral wound. Each rack includes ten pressure vessels, with six elements each. The system includes nine racks rated at 750 m3/d plus one rack at 150 m3/d.
Seawater is taken through beach wells and sedimentation basins. The seawater salinity is about 34 000 mg/litre TDS. No sand filtration is applied, and the only pre-treatment is antiscalant.
The recovery ratio ranges from 39 to 51 percent, and the product water TDS is about 200 mg/litre. In 1990, the energy consumption was reduced to 3 kWh/m3 by using hydraulic turbochargers. In 2002, it was further reduced to 2 kWh/m3 in modules 5 and 7 by installing energy recovery devices called ERI.
The irrigated area is 150 ha. The load factor for the system is 350 operating days per year, and the overall costs range from Euro0.54/m3 to Euro0.70/m3 (US$1 = Euro0.83 as at 27 April 2004) depending on the units and operating conditions.
Permission has been granted for the building of a wind energy farm, rated at 1.7 MW in order to receive an income for the sale of energy, thus, reducing the overall balance sheet.
TEDAGUA has built a number of seawater plants for producing water for agriculture, as well as many others fed with brackish waters.
Table 5 shows the main characteristics of three seawater plants (J.C. González and J.L. Loidi, personal communication, 2004).
The usual seawater TDS is about 38 000 mg/litre, and these plants are designed for a product salinity of less than 500 mg/litre TDS. Plate 4 shows a general view of the CR V Milagro-Mazarrón plant.
In 1989, another seawater plant for irrigation purposes was built for a farmers’ cooperative society called AGRAGUA, located in Galdar, Gran Canaria (Plate 5). This plant has a production capacity of 10 000 m3/d, using hollow fibre RO membranes.
Plate 3Las Salinas I.
Note: US$1 = Euro0.83 as at 27 April 2004.
TABLE 5Main characteristics of three seawater desalination plants
Location CR V Milagro, Mazarrón, Murcia
CR Águilas, Murcia La Aldea, Gran Canaria
Production capacity (m3/d) 35 000 20 800 5 800
Units 13 8 2
Raw water Seawater
Intake Beach well
Physical pre-treatment Vertical filtration on mixed bed and microfiltration
Chemical pre-treatment Sodium bisulphite and antiscalant
Recovery ratio (%) 45
Configuration 1 stage/1 pass (7 spiral-wound elements per vessel)
Brine energy recovery Turbo-charger/Pelton/ERI Pelton Pelton
Specific consumption (kWh/m3) 4.3/4.1/3.2 3.8 3.8
Estimated O&M cost (Euro/m3) 0.27 0.27 0.29

Water desalination for agricultural applications24
The interesting feature here is that the creation of the farmers’ cooperative society was supported by a banker’s reference guarantee provided by the local administration.
WASTEWATER DESALINATIONAs opposed to the policy guidelines for brackish water, the Canary Islands water authorities are promoting policies for the treatment and reuse of wastewater. However, owing to the low water consumption per capita, wastewater usually carries a high load of suspended solids and organic matter in some parts of the Canary Islands. Each parameter – biochemical oxygen
demand (BOD) and suspended solids (SS) – of wastewater can reach 800–900 mg/litre. Therefore, tertiary treatment in wastewater plants consists of reduction of SS, usually by some form of filtration, followed by desalination, either by RO or EDR membranes, as shown in the conceptual design in Figure 2.
The following are some case studies to illustrate the usage of membrane technologies in advance wastewater treatment.
The DEREA project consisted of a pilot installation set up in 1994 to test several technologies for advanced wastewater treatment (Del Pino et al., 1996; Del Pino and Durham, 1999). The pilot installation followed a conventional (activated sludge) wastewater treatment plant producing secondary effluent with an average of 34 mg/litre SS and 35 mg/litre BOD, and about 1 500 mg/litre TDS.
The pilot units included microfiltration with six hollow fibre cartridges, rated at 0.20 µm pore size, at a flow rate of 7.0 m3/h, hydraulic loading (water flow per unit area) of 1.6–1.8 m/d and a recovery ratio of 82–88 percent. The physiochemical treatment unit consisted of coagulation in a precipitation chamber followed by three flocculation chambers and lamella settling basin operating at 172 m/d hydraulic loading,
a 19-minute hold-up tank, and a three-layer granular filter, at 159 m/d hydraulic loading.
The RO unit was capable of a product flow rate of 80 m3/d, with a conversion of 70–80 percent, in two stages, with spiral-wound elements (10 cm diameter in cellulose acetate), operating at 28 bar, and electric power consumption at 17.7 kW. Finally, the EDR unit produced 4.2 m3/h, with a conversion of 85 percent, in two electric stages and two hydraulic stages, with 320 cell pairs and a limiting current of 4 A.
The four units were tested in different combinations, and they provided the first data for assessment of technologies, which were subsequently used for designing and specifying the next plants.
At that time, this test platform provided the first opportunity for trials of advanced technologies for the tertiary treatment of wastewater.
The Valle de San Lorenzo facility (Plate 6) is intended to provide reclaimed wastewater to irrigate a large area situated south of Tenerife. Using the EDR technology,
Plate 4CR V Milagro-Mazarrón.
Plate 5Reverse osmosis rack at Agragua.

Water desalination and wastewater reuse for agriculture in Spain 25
and with a production capacity of 8 000 m3/d, the water EC is reduced from an average of 1 400 to 400 µS/cm. The design includes granular pressure filtration, with cartridge filtration at 10 µm. The EDR part consists of 27 stacks, each with 500 cell pairs (600 in Phase III), in three electrical and hydraulic stages, with a maximum salt reduction of 88 percent per stage. The unit electricity consumption is 0.91 kWh/m3 in EDR, and 1.02 kWh/m3 in the whole system (Fundación Centro Canario del Agua e Ionics Ibérica).
After the successful experience in the latter plant, a tertiary treatment system was also added to the Adeje-Arona plant in Tenerife (Armas, 2002). This plant is a conventional activated sludge facility, where the secondary effluent is filtrated by pressure in 10 multilayer filters and 2 cartridge filters (10 microns), followed by the EDR process in 6 lines, each with 3 stages.
Feed water ranges from 1 600 to 1 800 mg/litre TDS, and the desalination units are set for a water product salinity of 300–400 mg/litre TDS. The production capacity is 4 200 m3/d with an expansion expected up to 8 000 m3/d. Recovery is 84–86 percent and salt reduction is 75–80 percent with third-generation membranes, and energy consumption of less than 0.80 kWh/m3. Table 6 provides information on costs.
The plant located at Barranco Seco (Plate 7), Las Palmas de Gran Canaria, is the largest wastewater tertiary treatment facility in the Canary Islands (Ibrahim, Reguero and Veza, 2003) and was commissioned in 2002. It can manage 28 800 m3/d, in four lines, each one consisting of ultrafiltration
Raw water
Wastewatertreatment(primary)
CARTRIGEFILTRATION
FILTRATIONwith used ROmembranes
DESALINATIONwith RO
membranes
Wastewatertreatment
(secondary)
Secondary
effluent
Tertiaryeffluent
IRRIGATION
FIGURE 2Conceptual design of a tertiary treatment of wastewater
Plate 6EDR stacks at San Lorenzo.
Note: US$1 = Euro0.83 as at 27 April 2004.
TABLE 6Operating costs for wastewater treatment through EDR
Staff Electricity Chemicals Filter cartridges Membranes and electrodes Total
(Euro cents/m3)
Cost 6.6 4.8 3.0 1.1 3.6 19.1
Plate 7EDR stacks at Barranco Seco.

Water desalination for agricultural applications26
(UF) membranes and EDR for salinity reduction. The UF part includes self-cleaning mesh filters (selectivity 100–150 µm) followed by four UF racks (32 tubes each, 6 m long). Each tube can produce 197.32 m3/d, and the hollow fibre membranes are prepared with a molecular weight cutoff between 150 000 and 200 000 Dalton.
The EDR treatment system consists of three units, each one with eight racks in parallel, and again each rack is provided with two stacks in series. Each unit is designed for a production capacity of 6 000 m3/d.
The Galdar (Plate 8) and Agaete, two identical plants situated in Gran Canaria, are rated at a production capacity of 2 500 m3/d, using secondary effluent as feed water (45 mg/litre BOD, 45 mg/litre SS, 1 150 mg/litre TDS). After filtering at 500 microns with six self-cleaning ring units, two microfiltration racks (hollow fibre, 0.2 µm pore size) produce 2 952 m3/d filtrate with turbidity of less than 0.2 nephelometric turbidity units (NTU) and a silt density index (SDI) of less than 3. The RO unit operates in two stages with a 10:5 array, recovering 85 percent, including a by-stream of 802 m3/d of feed water.
Another wastewater tertiary treat-ment plant, following two conventional activated sludge secondary units, is denoted as Sureste (Plate 9).
The tertiary stage is capable of processing up to 8 000 m3/d, with a recovery ratio of about 70 percent. The process includes coagulation/flocculation followed by lamella sedimentation, microfiltration and RO (three racks, two stages each). The tertiary treatment reduces the SS from 35 mg/litre to less than 1 mg/litre and the EC from 2 500 to 300 µS/cm (M. Sanchez, personal communication 2003).
Other tertiary wastewater plants using EDR technology are summarized in Table 7.
The pilot unit for tertiary treatment of wastewater, located at Alicante, with a production capacity of 100 m3/d, is based on two separate processes, whose costs are detailed in Table 8.
Finally, there is a research project aimed at reusing old RO membranes, discarded for use at seawater desalination units. The reason for the project is the increase in old RO elements, which can be reused for both environmental and economic reasons.
The process consists of a first phase where the old membranes are chemically attacked, destroying the surface layer. Thus, the elements are transformed into microfiltration membranes, suitable for use in wastewater tertiary treatment plants (Rodriguez et al., 2002; Veza and Rodríguez-González, 2003).
Plate 8Microfiltration unit at Galdar.
Plate 9Cartridge filters at Sureste.

Water desalination and wastewater reuse for agriculture in Spain 27
ENVIRONMENTAL ISSUES RELATED TO DESALINATIONIn terms of environmental impacts, the first effect to consider is the land occupation for the facilities, although this is not much larger than any other treatment facility.
Furthermore, this industry is energy intensive, with energy consumptions that are greater than any other water treatment process. This high consumption has implications for the primary energy associated with it, and environmental concerns for the power plants involved in each case. Noise is also sometimes mentioned as a damaging impact.
Major impacts in desalination are usually related to the brine discharge. Where the desalination system is located inland, provisions must be made either for discharging the brine down to the sea (through brine pipes), or for drying processes by means of evaporation ponds. Where the facilities are coastal, brine salinities of about 70 000 mg/litre TDS require a minimum dilution capacity in the sea receiving the waters. In the last few years, there has been growing concern about discharges possibly damaging Posidonia oceanica, a plant that forms part of the main ecosystem in the Mediterranean Sea.
On the other hand, chemical discharges are specific in time and not on a continuous basis, which makes it feasible to neutralize them before discharging.
However, not all impacts are to be considered negative. By far the main impact of a desalination plant is positive, and this lies in the very fact that it provides water resources that would otherwise be unavailable. However, as shown above, desalination is rather expensive. Therefore, it should be considered as an option for water supply only where no other resources are available at a reasonable cost.
TABLE 7Some examples of EDR plants for tertiary treatment of wastewater
TABLE 8Operating costs at pilot unit for tertiary treatment of wastewater
Source: Ionics Ibérica (www.ionics.es).
Location Cardones, Arucas, Gran Canaria
Santa Cruz de Tenerife Bañaderos, Arucas, Gran Canaria
Maspalomas, Gran Canaria
Year 1998 2002 2002 2002
Technology Coagulation/flocculation, followed by chlorination, sand filtration, and EDR
Online coagulation, followed by
chlorination, sand filtration, and EDR
Coagulation/flocculation in lamella decanter, chlorination, sand filtration, and EDR
Chlorination, sand filtration, and EDR
Production capacity (m3/d) 1 400 2 200 700 6 800
Conversion (%) 85 85 85 85
Feed salinity (mg/litre) 1 800 1 500 1 500 1 600
Product salinity (mg/litre) 400
Water use Irrigation Irrigation Irrigation Irrigation
Note: US$1 = Euro0.83 as at 27 April 2004.
Process 1 Process 2
(Euro cents/m3)
Technologies Coagulation flocculation + sand filtration
Cartridge MF
UF
NF
Disinfection with sodium hypochlorite
Multimedia filtration
Mesh MF
UF
RO
UV disinfection
Energy 5.68 3.67
Maintenance 0.24 0.24
Chemicals 5.05 5.05
Membrane replacement 0.90 0.90
Consumables 1.80 1.80
Labour 0.30 0.30
Other 1.80 1.80
Total 15.81 13.70

Water desalination for agricultural applications28
CONCLUSIONSWater resources must be managed carefully because of their chronic shortage in certain areas, where non-conventional water resources must be used. This paper has presented a number of cases from Spain to illustrate the range of technologies used for seawater and brackish water desalination as well as for wastewater reclamation.
In the Canary Islands, the water planning criteria include constraints for intensive groundwater use in order to mitigate aquifer depletion. About 260 membrane desalination plants are fed by brackish groundwater in the Canary Islands using either RO or ED. They produce some 100 000 m3/d. Most product water is used for irrigation purposes, with reported O&M costs of Euro0.11–0.15/m3. Most of these units are privately owned, and their investment costs have been mainly financed by the owners, with partial contributions from the regional government.
Some ten seawater desalination plants have been built with the sole purpose of providing water for irrigation, with an overall capacity around 70 000 m3/d, with reported O&M costs of Euro0.54–0.70/m3.
Additional resources are provided by wastewater treatment plants. The high loads of wastewater require a tertiary stage, which includes either RO or EDR for reducing dissolved solids (apart from microfiltration and ultrafiltration for SS). About ten major tertiary treatment units are now in operation in the Canary Islands, totalling some 70 000 m3/d, and ranging in size from 500 to 28 000 m3/d. In all cases, the treated wastewater is used for irrigation, with reported O&M costs of Euro0.13–0.19/m3.
As the examples have shown, the emphasis is on the use of different raw waters. Starting with scarce brackish groundwater, the evolution of water treatment expanded into seawater, and eventually wastewater for reuse.
The examples have also highlighted the availability of various desalination technologies to increase water resources in arid and semi-arid areas. The design and operational features of the plants depend on the specific application in each case.
REFERENCESArmas, J.C. 2002. Tratamiento terciario en la EDAR de Adeje-Arona (Tenerife) con electrodiálisis.
AEDYR Conference, Málaga, Spain.BOC. 1997. Plan Hidrológico Insular de Tenerife. Canary Islands Official Journal (14,15,17/
Feb/1997).BOC. 1999. Plan Hidrológico Insular de Gran Canaria. Canary Islands Official Journal (8/Jun/
1999).Del Pino, M. & Durham, B. 1999. Wastewater reuse through dual-membrane processes:
opportunities for sustainable water resources. Desal., 124: 271–277.Del Pino, M. et al. 1996. Informe proyecto DEREA.Fundación Centro Canario del Agua. Desalación en Canarias (available at www.fcca.es).Ibrahim, J.C., Reguero, P. & Veza, J.M. 2003. Membranes for wastewater treatment plant at
Las Palmas. EDS News., 17: 8–9.León, A., Otero, C., Zarzo, A. & Zarzo, D. 2003. Problemática de las aguas salobres con
salinidad creciente; caso de la planta de ósmosis inversa de la Comunidad de Regantes de
Cuevas de Almanzora (Almería). IV Conference AEDYR, Las Palmas de Gran Canaria, Spain.
Rodriguez, J.J., Jimenez, V., Trujillo, O. & Veza, J.M. 2002. Reuse of reverse osmosis membranes as a filtration stage in advanced wastewater treatment. Desal., 150: 219–226.
Rubio, M., Zarzo, D., Sanmartín, R. & García, C. 2004. Tratamiento de aguas superficiales
procedentes de drenajes para su uso agrícola; aspectos técnicos, económicos y experiencia en
explotación. SADYT.Veza, J.M. & Rodríguez-González J.J. 2003. Second use for old reverse osmosis membranes:
wastewater treatment. Desal. 157: 65–72.

29
David B. BurnettDepartment of Petroleum Engineering, Texas A&M University,
United States of America
C. Allan JonesTexas Water Resources Institute
United States of America
Freshwater resources from desalination of wastewater and oilfield-produced brine
ABSTRACTMany communities in the west of the United States of America will face severe shortages of freshwater in the near future. While freshwater resources are depleting rapidly, many of these communities are situated in close proximity to large reserves of low-quality brackish groundwater. A team at Texas A&M University, sponsored by the Texas Water Resources Institute, has evaluated brine membrane desalination as an alternative source of freshwater for these communities. This team has developed treatment systems that can recover freshwater from brackish groundwater aquifers at a cost comparable with traditional water treatment techniques. These processes also remove trace levels of impurities including lead, mercury, arsenic and radium from drinking-water sources. In collaboration with governmental support and industry participation, the Department of Petroleum Engineering at Texas A&M University has adapted this technology to recover freshwater from brines produced from oil and gas operations.
The proposed use of oilfield-produced brine for beneficial use is fundamental to the conversion of mature oil-producing fields into water-producing fields. The technology is based on water-flood process designs that have been routinely used by the industry for decades. However, before this technology can be accepted, we need to answer a number of questions. Is this process viable? Can freshwater resources be recovered from oilfield brine? What is the impact of this new technology? Is it environmentally acceptable? Can oilfields be converted to waterfields?
Our research addresses both engineering and environmental issues in waterfield development from the perspective of an oil and gas operating industry that derives no profit from selling water, but nevertheless handles a greater volume of this resource than do most municipalities. We address some of the most important technical problems that arise in the development of new groundwater resources from oil leases. We also discuss the non-technical issues that arise when a material that is normally considered a waste by-product is taken from the oil and gas production facility and converted into a new resource. Issues such as water pre-treatment, membrane efficiency, and concentrate disposal are part of the entire infrastructure of desalination and creation of freshwater resources for beneficial use. Add to these topics the socio-economic

Water desalination for agricultural applications30
and environmental issues involved in water resource development, and it can be seen that there are many issues to resolve before a commercial project can be created.
THE NEED FOR NEW FRESHWATER RESOURCESThe need for water in the west of the United States of America is critical. The part of the country dismissed by early American explorers as the “Great American Desert” (Resiner, 1987) supports almost ten times as many people in the twenty-first century as 100 years ago (Figure 1). The need to supply this population growth is being limited by access to freshwater. The US Geologic Survey (USGS) projections of water needs in the west of the country show a growth of more than 100 percent in the next 50 years (Holz, 2003).
The drought in the United States of America is aggravating what it is already a serious situation. Drought-affected areas cover a significant portion of the country. The search for new freshwater resources has led to investigation of seawater desalination processes for states bordering the Gulf of Mexico and the west coast of the country, and to proposed desalination of brackish groundwater for inland populations (Holz, 2003). The name of the game in the west is identifying alternative freshwater resources. Figure 2 shows a map of brackish groundwater resources identified by the Texas Water Development Board
(TWDB). The study found more than 780 million acre-feet (1 acre-foot = 1 234 m3) of brackish aquifers that would be amenable to desalination.
At Texas A&M University, we have been investigating the desalination of oilfield-produced brine to make it available for beneficial use (Siddiqui, 2002). The technology is based on water-flood process designs that have been routinely used by the industry for decades (Figure 3). We need to answer several questions. Is this process viable? Can freshwater resources be recovered from oilfield brine? What is the impact of this new technology?
Engineers are accustomed to evaluating technical options when considering the development of a new project (Borgmeier et al., 2001). Assessing the uncertainty and comparative economic risk of a drilling prospect is also common. However, what is not common is an effort to quantify the qualitative aspects of a project. It is uncommon for a proposed engineering programme to address public and other stakeholder issues
UN FAO Desalination April, 2004
0
20
40
60
80
100
120
140
18801900
1920 1940 19601990 2000 2025
2040
11 MM
76 MM
91 MM
126 MM
For more Info see:
http://www.wrri.nmsu.edu/
Population growth in Western U.S.
FIGURE 1Why the United States of America worries about water
resources
UN FAO Desalination April, 2004
TWDB identified the
saline ground water
aquifers in Texas and
reported more than 780
million acre feet (930x109
m ) of brackish aquifers
amenable to desalination.
For more Info see:
http://www.TWDB.state.TX.us
3
FIGURE 2Other water resources: Texas Water Development Board
(TWDB)

Freshwater resources from desalination of wastewater and oilfield-produced brine 31
that might be important in considering the impact of the project on society and the environment.
Aware of this need to connect the engineering effort to the social implications from the beginning of our project, we have been addressing not only the technical problems but also the non-technical issues that arise when a material that is normally considered to be a waste by-product is taken from the oil and gas production facility and converted into a new resource. We view the concentrate disposal issue as one part of the entire infrastructure of desalination and creation of freshwater resources for beneficial use.
One goal of our programme is to offer a process to identify, quantify and integrate the risks involved in developing new technology, in this case, the desalination of oilfield brine, and the disposal of desalination concentrate with the intent of using the freshwater recovered for beneficial purposes.
Our programme is based on partnerships. Only through public participation, industry involvement, and governmental support can the A&M programme succeed.
MEMBRANE FILTRATION PROCESSES IN THE OILFIELDCommercial desalination technology came of age in the 1990s. It is an efficient and environmentally friendly technology that removes all of the pollutants from impure water. Worldwide, more than 400 million gallons (1 US gallon = 3.785 litres) of freshwater per day are produced through RO desalination. In Texas, there are currently more than 40 facilities, most of them modest in size.
In contrast to commercial water treatment, oilfield water-flooding technology is more than 100 years old. Since the inception of the oil industry, it has been necessary to dispose of water produced along with the petroleum resource. As the industry evolved, it became apparent that pressure maintenance in producing properties also had to be maintained if efficient recovery was to be achieved. In fact, brine injection into rock formations for water flooding is very similar to the membrane filtration process.
Key technologies utilized in a reverse osmosis (RO) desalination process in the oilfield include (just as in water treatment): (i) pre-treatment; (ii) membrane filtration; and (iii) disposal of concentrate. The technology can provide freshwater resources from brackish groundwater for less than US$5.00 per 1 000 gallons (Siddiqui, 2002). Figure 4 shows a number of desalination sites in Texas that plan to provide services to more than 1 000 000 people by 2005. More facilities will be constructed if the cost of desalination can be lowered.
UN FAO Desalination April, 2004
Brine disposal represents a
significant fraction of the cost
of operating a desalination
facility.
In the oil and gas industry,
high salinity brines are
routinely injected into
formations for pressure
maintenance and secondary
recovery by water flooding.
Gas
Water
Oil
Waterdisposal
well
GasOil
Water
Desalination
Surface
FIGURE 3Saline water injection into oil and gas zones
UN FAO Desalination April, 2004
Legend
Sites
Streams
FIGURE 4Desalination sites near impaired streams

Water desalination for agricultural applications32
Pre-treatment issuesFor brackish water and oilfield-produced water systems, pre-treatment is critical because of the impurities that the water may contain. Even the most sophisticated RO facility can experience poor flux and high maintenance costs where pre-treatment is inappropriate for the feed water being treated. The most recent example of this is the highly publicized Tampa Bay desalination project that has failed to perform as designed (Naples, Florida Daily News, 25 September 2003). This system was troubled by solid material in the feed water that plugged pre-treatment filters and reduced throughput and by growth of fouling mussels in the feed lines.
For the treatment of oilfield-produced water, it is necessary to have more extensive pre-treatment than would be required for typical water desalination. In the past, expensive pre-treatment has prevented the development of commercial projects with produced water. Recently, new types of treatment and new procedures have been developed to reduce costs. We are evaluating powered centrifuges to remove any sediment and reduce oil content to low values. In addition, our process is testing various microfiltration and nanofiltration systems.
The resulting saline water is then treated to remove the remaining hydrocarbons before passing through to the RO filter portion of the process train (Figure 5).
Membrane filtrationThe RO section of the unit consists of a bank of RO membranes of a particular type to exclude dissolved salts, heavy metals and other species. Different types of filters can be chosen based on the components in the water to be removed and the quality of the output water to be delivered. The number of units is selected to allow optimal flux across the membranes. Provisions are made to backwash these units and to protect them in the event of a shutdown of operations. As the salinity of brackish water or produced water increases, the osmotic pressure across the desalination membranes increases. New types of microfilters and multistage RO filters have been developed by industry to increase yield and lower operating pressures.
Disposal issuesThe material separated from the freshwater is contained in the RO concentrate or reject stream. This material is not hazardous, only higher in salinity than the feed water. The A&M programme is planning to inject this concentrate into oil and gas producing zones at lower depths than the depths of freshwater aquifers.
The technical issue related to the disposal of the concentrate is similar in nature to the process of water treatment used for secondary recovery of oil by water flooding (Borgmeier et al., 2001). Water quality must be maintained in water-flood operations to ensure injectivity is optimal into the oil-bearing formation. Oil must be removed, precipitates must be prevented from forming, and pH must be kept in a range compatible with the formation so that the injectivity does not deteriorate with time. Texas has more than 300 000 oil and gas wells (Figure 6), many of them in mature fields nearing the end of their economic lives.
UN FAO Desalination April, 2004
polish
Permeate
Recycle
Chemicaladdition
RO system
Filters
RO post treatment
µ
Pump
waterBrine
Centrifuge/hydrocyclonesOrganoclay
Concentrate
FIGURE 5Brine desalination process
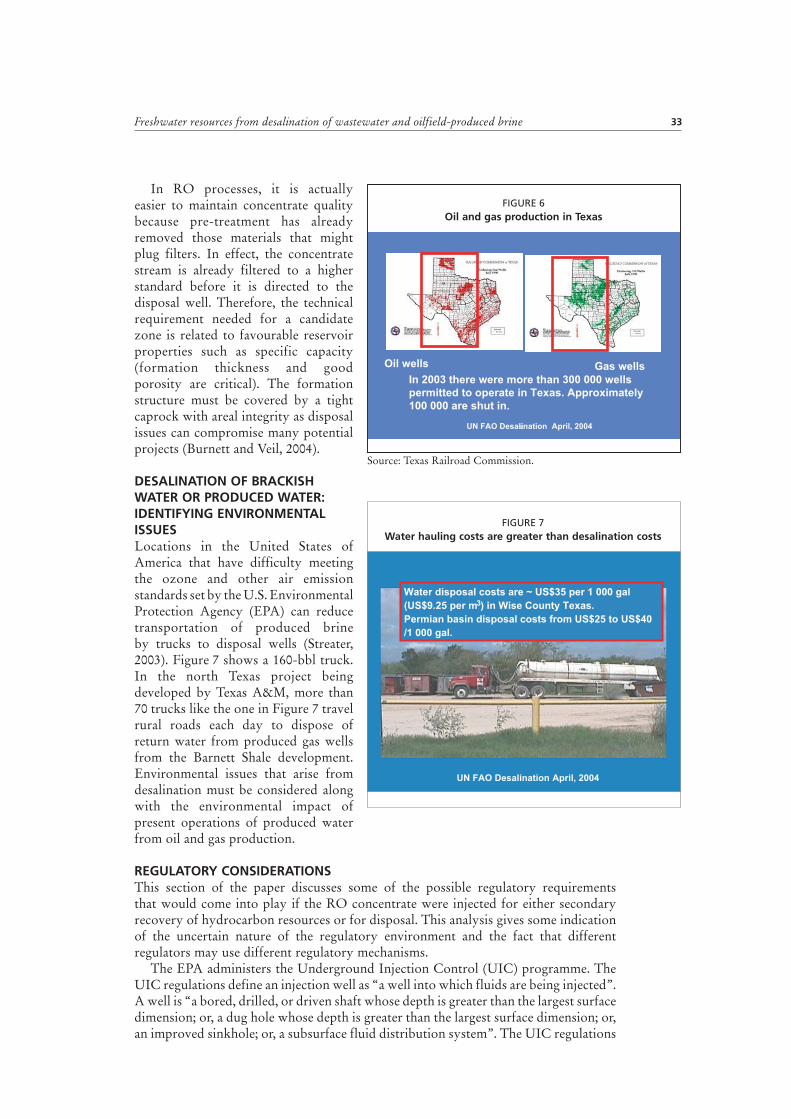
Freshwater resources from desalination of wastewater and oilfield-produced brine 33
In RO processes, it is actually easier to maintain concentrate quality because pre-treatment has already removed those materials that might plug filters. In effect, the concentrate stream is already filtered to a higher standard before it is directed to the disposal well. Therefore, the technical requirement needed for a candidate zone is related to favourable reservoir properties such as specific capacity (formation thickness and good porosity are critical). The formation structure must be covered by a tight caprock with areal integrity as disposal issues can compromise many potential projects (Burnett and Veil, 2004).
DESALINATION OF BRACKISH WATER OR PRODUCED WATER: IDENTIFYING ENVIRONMENTAL ISSUESLocations in the United States of America that have difficulty meeting the ozone and other air emission standards set by the U.S. Environmental Protection Agency (EPA) can reduce transportation of produced brine by trucks to disposal wells (Streater, 2003). Figure 7 shows a 160-bbl truck. In the north Texas project being developed by Texas A&M, more than 70 trucks like the one in Figure 7 travel rural roads each day to dispose of return water from produced gas wells from the Barnett Shale development. Environmental issues that arise from desalination must be considered along with the environmental impact of present operations of produced water from oil and gas production.
REGULATORY CONSIDERATIONSThis section of the paper discusses some of the possible regulatory requirements that would come into play if the RO concentrate were injected for either secondary recovery of hydrocarbon resources or for disposal. This analysis gives some indication of the uncertain nature of the regulatory environment and the fact that different regulators may use different regulatory mechanisms.
The EPA administers the Underground Injection Control (UIC) programme. The UIC regulations define an injection well as “a well into which fluids are being injected”. A well is “a bored, drilled, or driven shaft whose depth is greater than the largest surface dimension; or, a dug hole whose depth is greater than the largest surface dimension; or, an improved sinkhole; or, a subsurface fluid distribution system”. The UIC regulations
UN FAO Desalinationo April, 2004
Oil wells Gas wells
In 2003 there were more than 300 000 wells
permitted to operate in Texas. Approximately
100 000 are shut in.
FIGURE 6Oil and gas production in Texas
Source: Texas Railroad Commission.
UN FAO Desalination April, 2004
Water disposal costs are ~ US$35 per 1 000 gal
(US$9.25 per m3) in Wise County Texas.
Permian basin disposal costs from US$25 to US$40
/1 000 gal.
FIGURE 7Water hauling costs are greater than desalination costs
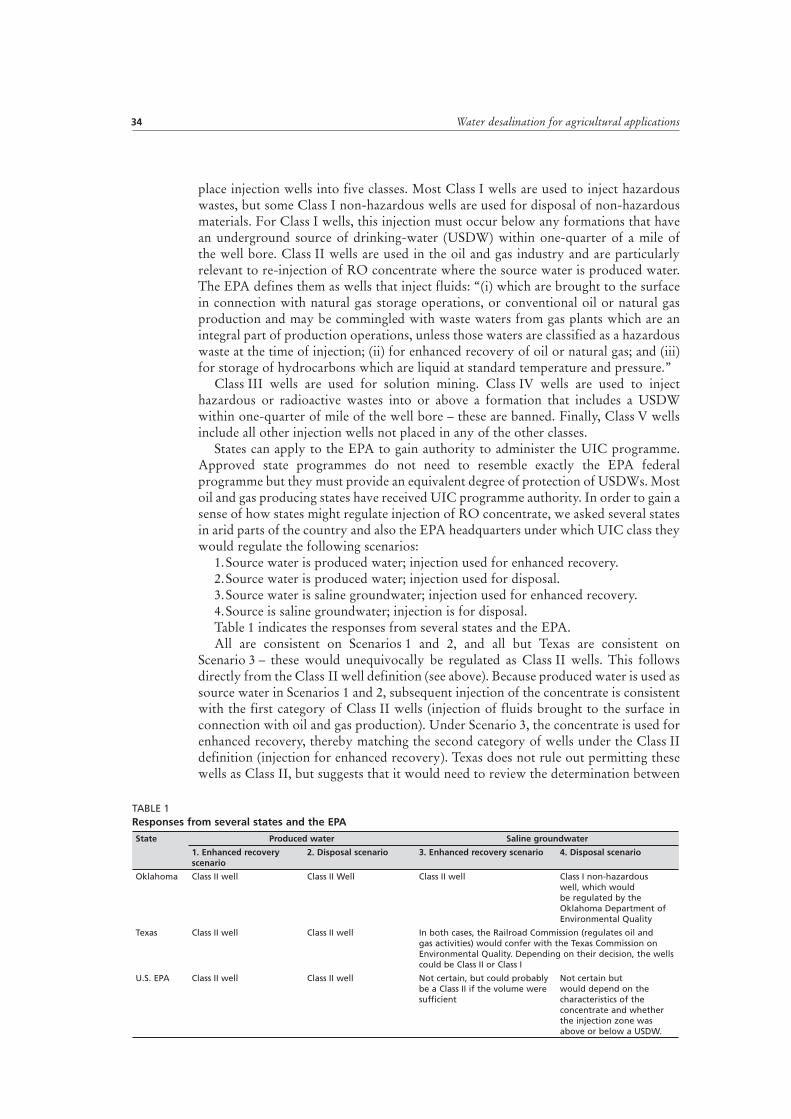
Water desalination for agricultural applications34
place injection wells into five classes. Most Class I wells are used to inject hazardous wastes, but some Class I non-hazardous wells are used for disposal of non-hazardous materials. For Class I wells, this injection must occur below any formations that have an underground source of drinking-water (USDW) within one-quarter of a mile of the well bore. Class II wells are used in the oil and gas industry and are particularly relevant to re-injection of RO concentrate where the source water is produced water. The EPA defines them as wells that inject fluids: “(i) which are brought to the surface in connection with natural gas storage operations, or conventional oil or natural gas production and may be commingled with waste waters from gas plants which are an integral part of production operations, unless those waters are classified as a hazardous waste at the time of injection; (ii) for enhanced recovery of oil or natural gas; and (iii) for storage of hydrocarbons which are liquid at standard temperature and pressure.”
Class III wells are used for solution mining. Class IV wells are used to inject hazardous or radioactive wastes into or above a formation that includes a USDW within one-quarter of mile of the well bore – these are banned. Finally, Class V wells include all other injection wells not placed in any of the other classes.
States can apply to the EPA to gain authority to administer the UIC programme. Approved state programmes do not need to resemble exactly the EPA federal programme but they must provide an equivalent degree of protection of USDWs. Most oil and gas producing states have received UIC programme authority. In order to gain a sense of how states might regulate injection of RO concentrate, we asked several states in arid parts of the country and also the EPA headquarters under which UIC class they would regulate the following scenarios:
1. Source water is produced water; injection used for enhanced recovery.2. Source water is produced water; injection used for disposal.3. Source water is saline groundwater; injection used for enhanced recovery.4. Source is saline groundwater; injection is for disposal.Table 1 indicates the responses from several states and the EPA.All are consistent on Scenarios 1 and 2, and all but Texas are consistent on
Scenario 3 – these would unequivocally be regulated as Class II wells. This follows directly from the Class II well definition (see above). Because produced water is used as source water in Scenarios 1 and 2, subsequent injection of the concentrate is consistent with the first category of Class II wells (injection of fluids brought to the surface in connection with oil and gas production). Under Scenario 3, the concentrate is used for enhanced recovery, thereby matching the second category of wells under the Class II definition (injection for enhanced recovery). Texas does not rule out permitting these wells as Class II, but suggests that it would need to review the determination between
TABLE 1Responses from several states and the EPA
State Produced water Saline groundwater
1. Enhanced recovery scenario
2. Disposal scenario 3. Enhanced recovery scenario 4. Disposal scenario
Oklahoma Class II well Class II Well Class II well Class I non-hazardous well, which would be regulated by the Oklahoma Department of Environmental Quality
Texas Class II well Class II well In both cases, the Railroad Commission (regulates oil and gas activities) would confer with the Texas Commission on Environmental Quality. Depending on their decision, the wells could be Class II or Class I
U.S. EPA Class II well Class II well Not certain, but could probably be a Class II if the volume were sufficient
Not certain but would depend on the characteristics of the concentrate and whether the injection zone was above or below a USDW.

Freshwater resources from desalination of wastewater and oilfield-produced brine 35
its Railroad Commission (the oil and gas regulatory agency) and the Commission on Environmental Quality (regulates all other environmental issues).
Scenario 4 presents a different situation because neither the source water nor the injectate meet the definition of a Class II well. Some agencies suggest that injection of the concentrate would be made into a Class I well, and the chemical characteristics of the well would determine if the well were a hazardous or non-hazardous well. Utah suggested that injection could be made into a Class V well. The difference between Class I and Class V is quite significant. Class I wells are subject to very stringent design, construction, operation and monitoring requirements, whereas Class V wells are regulated in a less stringent manner. The costs of constructing and operating a Class I well are much higher than comparable costs for a Class V well.
In general, the two key factors used to determine which well class would be assigned for concentrate injection under Scenario 4 are: (i) the depth of the injection zone in relation to the depth of the lowermost USDW, and (ii) whether the constituents of the concentrate are considered to be hazardous materials or not. If the injection occurred above or directly into a USDW and the concentrate were non-hazardous, the well could be permitted as a Class V well. Injection of hazardous concentrate into or above a USDW is prohibited. If the injection occurred below the USDW, the well would be a Class I well, and the nature of the concentrate would determine if the well would be Class I hazardous or Class I non-hazardous.
To further complicate the picture for Scenario 4, California reports that where the RO concentrate is not hazardous, the Department of Oil, Gas, and Geothermal Resources may try to permit the injection as part of a Class II well. They acknowledge that in the past the agency has occasionally authorized injection of non-oilfield wastes into Class II wells with the caveat that the permit had restrictions on total volume and the duration of the injection. If the concentrate were hazardous, its injection would require a Class I well.
At present, injection of RO concentrate is not a common practice. If the practice becomes more common in the future, states or the EPA may adopt new policies or regulations to govern concentrate injection.
ASSESSING ENVIRONMENTAL ISSUESA new research project is under consideration by the EPA within that agency’s Market Mechanisms and Incentives for Environmental Management. The goals of the project submitted by Theodori and Fox (2003) are: (i) identify and evaluate the individual, institutional, technical, legal and regulatory obstacles to successful implementation of market mechanisms and incentives (MM&I) for produced water management; (ii) provide empirical estimates of MM&I cost-savings relative to existing produced water regulatory programmes; and (iii) show how the MM&I approach to produced water can be transferred or generalized to other environmental problems and/or geographic/political scales.
The project will be gathering quantitative data for the issues arising when new technology is offered to local communities, but at a cost to the community. Will it be accepted or dismissed? The public’s view of risk versus economic benefit will determine the answer to this question.
REFERENCESBorgmeier, M., Gilch, A., Rohleder, R. & Zemke, J. 2001. Brine disposal in deep aquifer
reservoirs: evaluation and operation experiences. Solution Mining Research Institute, Fall 2001 Meeting 7–10 September 2001. Albuquerque, USA.
Burnett, D.B. & Veil, J.A. 2004. Decision and risk analysis study of the injection of desalination
byproducts into oil and gas producing zones. Paper SPE 86526 presented at the SPE Formation Damage Conference held in Lafayette, USA, 13–14 Feb. 2004.

Water desalination for agricultural applications36
Holz, D. 2003. National desalination agenda. Keynote presentation, produced water workshop, Hobbs, USA. New Mexico Water Resources Research Institute (available at http://www.wrri.nmsu.edu).
Resiner, M. 1987. Cadillac desert: the American west and its disappearing water. Penguin.Siddiqui, M. 2002. Treatment of oil field brine by desalination: a multidisciplinary program.
Department of Petroleum Engineering, Texas A&M University, USA. (MS thesis)Streater, S. 2003. EPA tells north Texas to focus on new ozone standards. Article from Ft. Worth
Star-Telegram, 20 September 2003.Theodori, G. & Fox, W.E. 2003. Fresh water resources from oil field brine: developing and
implementing market mechanisms and incentives.

37
José A. Medina Centro de Estudios y Experimentación de Obras Públicas (CEDEX)
Spain
Feasibility of water desalination for agriculture
INTRODUCTIONWater desalination is a reliable technology with more than 23 000 desalination plants built all over the world, with a total capacity exceeding 35 million m3/d. Most of the desalinated water is used for domestic supply and only less than 10 percent in agriculture.
Although there is a broad experience in the use of desalinated water for agricultural purposes, desalination technologies are only regularly used in some countries because of the costs involved in this process.
A cost analysis is essential in order to determine whether water desalination may be feasible at the beginning of the twenty-first century, to produce a water resource that could be used to complement or substitute natural water resources in areas with water shortages.
The current situation is quite different from that of 25 years ago, when water desalination started its development, and it is even different today from what it was only ten years ago. However, much experience is still needed in order to determine whether water desalination is a solution to water scarcity and especially whether desalinated water should be used in agriculture.
Therefore, it is necessary to analyse the factors influencing the water desalination costs of the different desalination technologies.
Desalination technologies have evolved in the last 25 years, from being little used in the world, limited to some oil rich countries of the Persian Gulf where energy costs are low, to now being used worldwide.
At the outset, water desalination was only used to provide domestic and industrial supplies. However, once this technology had been improved and the costs of production of desalinated water decreased, its application was extended to other sectors, especially to agriculture.
To obtain an average cost of desalinated water, it is necessary to consider three aspects:
ÿthe technology to be used for desalination;ÿthe quality of the feed water to be desalinated;ÿthe required quality of the product water.In addition to desalinated water, the reuse of treated wastewater has to be
considered as a potential water resource, especially where wastewater treatment plants are available. Specific treatments applied to these waters, which sometimes include desalination, could produce water suitable for irrigation.
TECHNOLOGIESWater desalination has evolved from the traditional systems of water distillation, with high energy consumption, to the most modern membrane technologies, especially

Water desalination for agricultural applications38
reverse osmosis (RO), which is more energy efficient and requires lower investment costs.
Although distillation technologies were predominant in the past, the appearance of RO membranes in the 1970s – available then only for brackish water, but since the 1980s also for seawater – has changed completely the panorama of desalination in the world, and especially the application of desalinated water for agriculture.
As does any industrial process, water desalination relies on energy consumption, which is the main cost in desalinating water. Distillation technologies consume considerable energy regardless of the level of water salinity. However, energy consumption with membrane technologies depends on the salt content of the feed water and of the product water. RO can be adapted to different water salinity contents. This flexibility has enabled the extension of the use of RO to new applications.
Electro-dialysis reversal (EDR) is another membrane technology. It is less flexible than RO and could be used only for special brackish water applications in agriculture.
FEED-WATER QUALITYIn many parts of the world where water resources of good quality are not available, saline water is often used for irrigation. In the long run, irrigation with brackish water produces soil salinization unless a supplementary volume of water is applied to leach the added salts from the rootzone. This supplementary amount of water, or leaching requirement (LR), depends on the salinity of the irrigation water and the specific salt tolerance of the crop to be irrigated. For example, Figure 1 shows the LR (expressed as a percentage of the total irrigation requirement) of some crops.
Figure 1 shows that salt-sensitive crops, such as orange tree and pepper, have a high LR if they are irrigated with slightly or moderately saline waters. Sometimes, satisfying a high LR is not technically, economically or environmentally feasible.
Desalinated seawater has not been considered as an alternative source of water for some areas, even where they border the sea, except in highly profitable out-of-season crops, as is the case of southeast Spain.
Generally, seawater is envisaged as the most promising resource for desalination in the future. This is because of the enormous volume that this natural water resource represents and its availability. However, brackish water desalination is also applied in many areas.
This paper first provides an overview of these non-conventional water resources in order to know how far the desalination technology can be applied and where it
Source: Medina, 2001a.
0
0.1
0.2
0.3
0.4
0.5
0.6
0.7
750 850 950 1 050 1 150 1 250 1 350 1 450 1 550 1 650 1 750 1 850 1 900 2 000
Lea
chin
g r
equ
irem
ents
Tomato
Pepper
Orange
Cotton
EC of the irrigation water (µS/cm)
FIGURE 1Leaching requirements of some crops

Feasibility of water desalination for agriculture 39
could be applied. For this purpose, the economic feasibility of brackish and seawater desalination for agricultural applications needs to be assessed. This is important because if the World Bank forecast that more than 200 million people will have problems of water scarcity by 2025 is correct, it is also true that most of this population will be living within 50 km of a coastal fringe. In addition, technologies to desalinate seawater and brackish water are available and their efficiency will improve in the coming years, enabling desalinated water to cover the agricultural demand in these areas.
Distillation technologies can only be used for desalination of seawater at a very high cost, while EDR is only used for certain brackish waters with a medium to low salt content. The adaptability of RO to the salt content of the product water makes it possible to reduce costs, but this is not feasible with the other technologies.
PRODUCT-WATER QUALITYThe required salinity of the irrigation water used to achieve sustainable agriculture depends on climate, crops, soils and water management. Therefore, the design of RO and EDR plants has to fit the specific agricultural needs, and, thus, investments and production costs can be optimized.
In order to reduce the LR and, subsequently, the quantity of water applied, desalinated water could be used in specific and profitable crops where the cost of desalination is less than the economically feasible threshold cost of the irrigation water. Figure 2 shows irrigation water costs in relation to the total costs for some crops. This is valuable information when deciding whether or not to use desalinated water in agriculture.
WATER DESALINATION IN SPAINIn terms of total desalination capacity installed for both brackish water and seawater, Spain ranks fifth in the world. If only seawater desalination is considered, Spain ranks fourth. The main difference between Spain and other countries where water desalination is a common practice is the technology applied: RO in Spain, and distillation in the countries of the Persian Gulf. In terms of the use of desalinated water in agriculture, Spain ranks first.
Although energy costs in Spain are high, water desalination is broadly used for agricultural purposes because of the continuing reduction in desalination costs. Therefore, it is interesting to analyse these reduction trends.
50
40
30
20
10
0
0.1 0.15 0.2 0.25 0.3 0.35 0.4 0.45 0.5
Lettuce
Orange
Pepper
Indoor tomato
Outdoor tomato
Water price US$/m
To
tal w
ater
co
st (%
)
3
FIGURE 2Irrigation water costs as a percentage of total costs as a function of the water price
Source: Medina and Cánovas, 2001.

Water desalination for agricultural applications40
At first, RO was used to improve water quality, but the development of membranes of very high rejection, while maintaining high permeability, has reduced energy consumption. This has allowed the extension of its use to more salty water, and even to seawater, as deterioration in water quality has become increasingly frequent.
At the end of the 1980s, new membranes that worked with seawater became available and water desalination became more widespread.
Today, the technology suitable for any application is available and, consequently, the use of desalinated water in agriculture is only a matter of cost. The main economic constraints on desalinating seawater are the repayment of the investment and energy consumption. Thus, developments in desalination have been and should be focused mainly on reducing energy consumption.
Twenty years ago, distillation plants consumed more than 16 kWh/m3. This was only appropriate for very few applications and only in places with low energy costs. The first breakthrough came in 1986 when the first seawater RO desalination plant reduced the consumption to 8 kWh/m3. By 1990, the first large seawater desalination plants came on stream:
ÿLas Palmas III, producing 36 000 m3/d with 4.5 kWh/m3 (with recovery device);
ÿJeddah I, producing 50 000 m3/d with 6.5 kWh/m3 (without recovery device).Further improvements in efficiency came in 1996 with the introduction of Pelton
turbines as recovery devices, replacing the former Francis turbines (with reverse-running pumps). This enabled savings in energy consumption of 0.5 kWh/m3, reducing the specific energy consumption below 4 kWh/m3.
In 1999, a new improvement came with the new design of the Pelton wheels, which reduced consumption by 0.3 kWh/m3.
In the last three years, savings in energy consumption have come from new engineering designs and through enlarging the capacity of trains and the size of HP pumps and turbines, which has improved their efficiency. More recently, the introduction of pressure exchangers has helped reduce energy consumption.
After these important energy savings, it is necessary to consider other costs of desalinated seawater.
DESALINATION COSTSFor RO, Figure 3 shows the costs to be considered.
SeawaterDistillation costs are higher than RO costs, even accepting variations among the different distillation technologies. For this reason, distillation technologies are not feasible for producing water to be used in agriculture (Table 1).
If the costs of desalinated water for agriculture have to be as low as possible, the trends in the last years to reduce costs should be considered:ÿimproved membrane performance
and efficiency;ÿenlarged capacity of the desalination
plants in order to achieve an economy of scale and reduce investment costs;
ÿfalling electricity tariffs;
Labour
4–11 %
Power
37–43 %
Chemicals
4–7.5 %Membrane
replacement
2–5 %
Chemical
cleaning
0.2–0.3 %
Membrance
3.5–4.5 %
Payback
33–43 %
FIGURE 3Water desalination costs
Source: Medina, 2003.
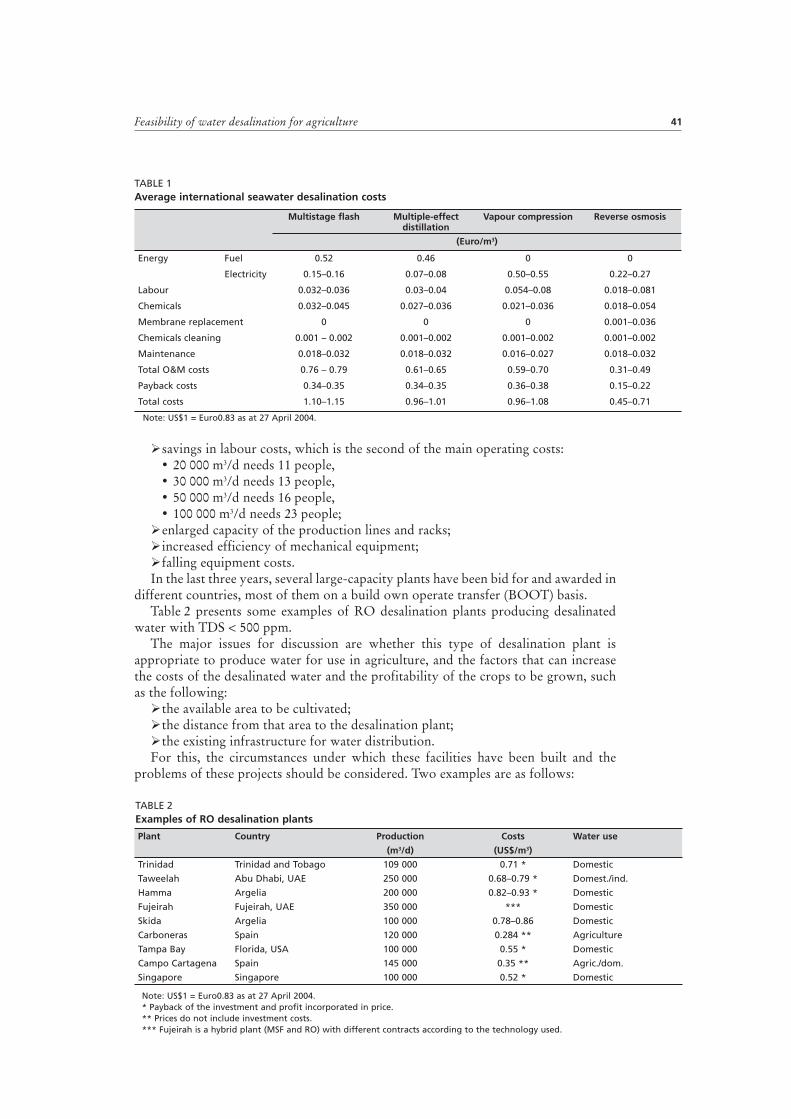
Feasibility of water desalination for agriculture 41
ÿsavings in labour costs, which is the second of the main operating costs:• 20 000 m3/d needs 11 people,• 30 000 m3/d needs 13 people,• 50 000 m3/d needs 16 people,• 100 000 m3/d needs 23 people;
ÿenlarged capacity of the production lines and racks;ÿincreased efficiency of mechanical equipment;ÿfalling equipment costs.In the last three years, several large-capacity plants have been bid for and awarded in
different countries, most of them on a build own operate transfer (BOOT) basis.Table 2 presents some examples of RO desalination plants producing desalinated
water with TDS < 500 ppm.The major issues for discussion are whether this type of desalination plant is
appropriate to produce water for use in agriculture, and the factors that can increase the costs of the desalinated water and the profitability of the crops to be grown, such as the following:
ÿthe available area to be cultivated;ÿthe distance from that area to the desalination plant;ÿthe existing infrastructure for water distribution.For this, the circumstances under which these facilities have been built and the
problems of these projects should be considered. Two examples are as follows:
TABLE 1Average international seawater desalination costs
Note: US$1 = Euro0.83 as at 27 April 2004.
Multistage flash Multiple-effect distillation
Vapour compression Reverse osmosis
(Euro/m3)
Energy Fuel 0.52 0.46 0 0
Electricity 0.15–0.16 0.07–0.08 0.50–0.55 0.22–0.27
Labour 0.032–0.036 0.03–0.04 0.054–0.08 0.018–0.081
Chemicals 0.032–0.045 0.027–0.036 0.021–0.036 0.018–0.054
Membrane replacement 0 0 0 0.001–0.036
Chemicals cleaning 0.001 – 0.002 0.001–0.002 0.001–0.002 0.001–0.002
Maintenance 0.018–0.032 0.018–0.032 0.016–0.027 0.018–0.032
Total O&M costs 0.76 – 0.79 0.61–0.65 0.59–0.70 0.31–0.49
Payback costs 0.34–0.35 0.34–0.35 0.36–0.38 0.15–0.22
Total costs 1.10–1.15 0.96–1.01 0.96–1.08 0.45–0.71
TABLE 2Examples of RO desalination plants
Note: US$1 = Euro0.83 as at 27 April 2004.* Payback of the investment and profit incorporated in price.** Prices do not include investment costs.*** Fujeirah is a hybrid plant (MSF and RO) with different contracts according to the technology used.
Plant Country Production Costs Water use
(m3/d) (US$/m3)
Trinidad Trinidad and Tobago 109 000 0.71 * Domestic
Taweelah Abu Dhabi, UAE 250 000 0.68–0.79 * Domest./ind.
Hamma Argelia 200 000 0.82–0.93 * Domestic
Fujeirah Fujeirah, UAE 350 000 *** Domestic
Skida Argelia 100 000 0.78–0.86 Domestic
Carboneras Spain 120 000 0.284 ** Agriculture
Tampa Bay Florida, USA 100 000 0.55 * Domestic
Campo Cartagena Spain 145 000 0.35 ** Agric./dom.
Singapore Singapore 100 000 0.52 * Domestic
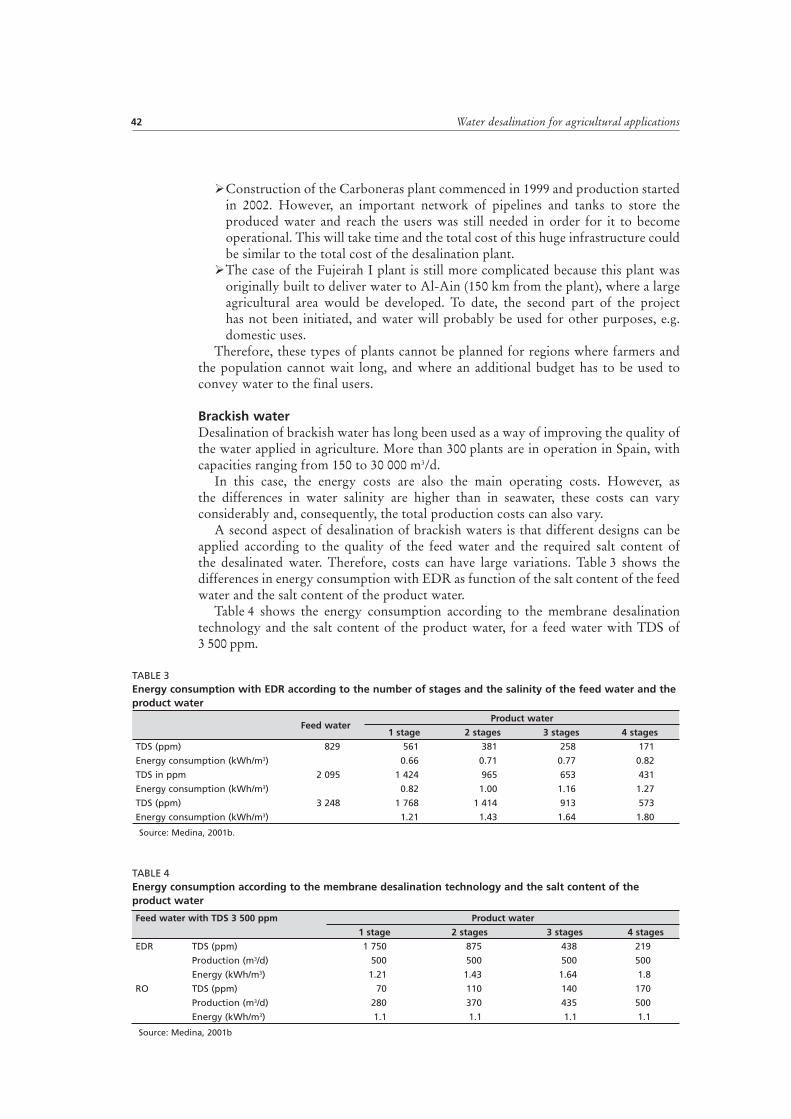
Water desalination for agricultural applications42
ÿConstruction of the Carboneras plant commenced in 1999 and production started in 2002. However, an important network of pipelines and tanks to store the produced water and reach the users was still needed in order for it to become operational. This will take time and the total cost of this huge infrastructure could be similar to the total cost of the desalination plant.
ÿThe case of the Fujeirah I plant is still more complicated because this plant was originally built to deliver water to Al-Ain (150 km from the plant), where a large agricultural area would be developed. To date, the second part of the project has not been initiated, and water will probably be used for other purposes, e.g. domestic uses.
Therefore, these types of plants cannot be planned for regions where farmers and the population cannot wait long, and where an additional budget has to be used to convey water to the final users.
Brackish waterDesalination of brackish water has long been used as a way of improving the quality of the water applied in agriculture. More than 300 plants are in operation in Spain, with capacities ranging from 150 to 30 000 m3/d.
In this case, the energy costs are also the main operating costs. However, as the differences in water salinity are higher than in seawater, these costs can vary considerably and, consequently, the total production costs can also vary.
A second aspect of desalination of brackish waters is that different designs can be applied according to the quality of the feed water and the required salt content of the desalinated water. Therefore, costs can have large variations. Table 3 shows the differences in energy consumption with EDR as function of the salt content of the feed water and the salt content of the product water.
Table 4 shows the energy consumption according to the membrane desalination technology and the salt content of the product water, for a feed water with TDS of 3 500 ppm.
Source: Medina, 2001b.
TABLE 3Energy consumption with EDR according to the number of stages and the salinity of the feed water and the product water
Feed waterProduct water
1 stage 2 stages 3 stages 4 stages
TDS (ppm) 829 561 381 258 171
Energy consumption (kWh/m3) 0.66 0.71 0.77 0.82
TDS in ppm 2 095 1 424 965 653 431
Energy consumption (kWh/m3) 0.82 1.00 1.16 1.27
TDS (ppm) 3 248 1 768 1 414 913 573
Energy consumption (kWh/m3) 1.21 1.43 1.64 1.80
Feed water with TDS 3 500 ppm Product water
1 stage 2 stages 3 stages 4 stages
EDR TDS (ppm) 1 750 875 438 219
Production (m3/d) 500 500 500 500
Energy (kWh/m3) 1.21 1.43 1.64 1.8
RO TDS (ppm) 70 110 140 170
Production (m3/d) 280 370 435 500
Energy (kWh/m3) 1.1 1.1 1.1 1.1
TABLE 4Energy consumption according to the membrane desalination technology and the salt content of the product water
Source: Medina, 2001b

Feasibility of water desalination for agriculture 43
Table 5 shows the energy consumption and the annual energy costs for an RO plant receiving feed water with a salt content of 2 000 ppm and producing 7 500 m3/d of desalinated water.
The information provided by Table 5 shows that for feed water with a salt content of 2 000 ppm, the energy consumption and the energy costs are quite sensitive to the salt content of the product water. As water with a TDS of 320 mg/litre is appropriate for irrigation of most crops, there is no need in this case to increase the annual energy costs beyond Euro145 000 (US$175 000; US1 = Euro0.83 as at 27 April 2004).
Table 6 summarizes the average total costs of brackish water desalination through membrane technologies such as RO and EDR.
ENVIRONMENTAL ASPECTSIn addition to the favourable effect
of producing water of good quality and preventing the soil salinization hazard of irrigation with brackish water, water desalination technologies have certain environmentally unfavourable impacts, e.g.:
ÿCarbon dioxide (CO2) production related to energy consumption, although it is lower than other domestic and industrial processes. It is also lower in RO and EDR than in distillation technologies.
ÿContamination by chemicals used in pre-treatments that are rejected by the membranes, by-products used for membrane and tube cleaning, and by coagulants and aids in filters.
ÿImpact of buildings on the landscape.ÿInfluence of the brine discharge on marine flora and fauna and on endangered
species. Temperature (more relevant in distillation technologies), pH and salt concentration are the major parameters to consider.
To reduce CO2 emissions, reducing energy consumption is the main issue. With RO, energy savings of more than 80 percent have been achieved compared with distillation.
Buildings need to be integrated in the landscape.Brine discharge in coastal areas is diluted by mixing with freshwater. Depth of
discharge and other design aspects of the disposal pipeline (such as site [bottom–
TABLE 5Energy consumption and energy costs of an RO plant for brackish water desalination
Note: US$1 = Euro0.83 as at 27 April 2004.Source: Medina, 2001b.
Production: 7 500 m3/d Feed water: TDS 2 000 ppm
Recovery (%) 60 75 87.5
TDS of product water (mg/litre) 188 228 320
Pressure (kg/cm2) 14.96 14.9 14.9
No. of membranes 612 612 672
Energy consumption (kWh/m3) 1.1 0.88 0.7
Annual cost of energy (Euro) 214 000 170 500 145 000
Recovery (%) 60 75 87.5
TDS of product water (mg/litre) 141 164 225
Pressure (kg/cm2) 19.79 20.06 20.2
No. of membranes 450 432 462
Energy consumption (kWh/m3) 1.42 1.15 0.9
Annual cost of energy (Euro) 275 200 222 800 191 800
Recovery (%) 60 75 87.5
TDS of product water (mg/litre) 114 131 186
Pressure (kg/cm2) 24.47 24.82 24.19
No. of membranes 360 342 378
Energy consumption (kWh/m3) 1.72 1.4 1.17
Annual cost of energy (Euro) 333 300 271 300 226 800
Recovery (%) 60 75 87.5
TDS of product water (mg/litre) 98 112 153
Pressure (kg/cm2) 28.67 29.16 29.37
No. of membranes 306 288 306
Energy consumption (kWh/m3) 2.00 1.63 1.37
Annual cost of energy (Euro) 387 600 315 900 265 500
TABLE 6Intervals of total costs for desalination of brackish water with membrane technologies
Note: US1 = Euro0.83 as at 27 April 2004
RO EDR
(Euro/m3)
Energy 0.08–0.12 0.10–0.17
Labour 0.02–0.07 0.02–0.07
Chemicals 0.02–0.03 0.006–0.01
Membrane replacement 0.015–0.022 0.006–0.013
Chemical cleaning 0.0013–0.0025 0.0006–0.0012
Maintenance and others 0.012–0.018 0.006–0.013
Total O&M costs 0.15–0.27 0.14–0.29
Payback 0.07–0.09 0.08–0.11
Total costs 0.21–0.36 0.22–0.38

Water desalination for agricultural applications44
surface–intermediate]), one or several exits, areas of agitation, and angle of the rejected flow) enable unfavourable environmental impacts to be reduced.
For inland disposals, injection in deep wells of contaminated aquifers or discharge to large flow rivers could be the solution.
CONCLUSIONSDesalination of water for agriculture is technically feasible and the appropriate technology is available. Therefore, only economic and environmental considerations can limit its application.
The major issues for discussion are: size of desalination plants; designs; crops and areas where desalinated water could be applied; and project financing. Environmental issues also have to be evaluated and controlled.
REFERENCES AND FURTHER READINGMedina, J.A. 2000. Desalación de aguas salobres y de mar: Osmosis Inversa. Madrid, Mundi
Prensa Libros.Medina, J.A. 2001a. Leaching requirements of crops. Master Gestión de Recursos Hídricos,
Instituto del Agua y las Ciencias Ambientales, Universidad de Alicante, Spain.Medina, J.A. 2001b. Una aproximación a los costes reales de la desalación de aguas salobres y
de mar en la agricultura. II Congreso Nacional de la Asociación Española de Desalación y Reutilización (AEDyR), Alicante, Spain.
Medina, J.A. 2002. Desalación y sus costes. I Congreso Internacional de Horticultura, Almería, Spain.
Medina, J.A. 2003. La desalación de agua de mar en la agricultura: situación actual y perspectivas
futuras. Murcia, Spain, Instituto Hidrotécnico del Mediterráneo.Medina, J.A. & Cánovas, J. 2001. The future of water desalination in Spanish agriculture:
brackish or sea water desalination. IDA Congress. Bahrain.Torres, M. & Medina, J.A. 1998. La desalación y los costes del agua desalada. Madrid,
CEDEX.

45
Mr Mohamed BazzaSenior Irrigation and Water Resources OfficerFAO Regional Office for the Near East (RNE)CairoEgyptTel.: (+20) 331 6132E-mail: [email protected]
Mr David BurnettTexas A&M University – Global Petroleum Research InstituteTAMU College Station, TexasUnited States of AmericaTel.: (+1) 979 8452272E-mail: [email protected]
Ms Barbara CasentiniJunior ConsultantWater Resources, Development and Management ServiceLand and Water Development DivisionFAO, RomeItaly
Ms Louise O. FrescoAssistant Director-GeneralAgriculture DepartmentFAO, RomeItalyTel.: (+39) 06 57053363E-mail: [email protected]
Ms Sasha Koo-OshimaWater Quality & Environment OfficerWater Resources, Development and Management ServiceLand and Water Development DivisionFAO, RomeItalyTel.: (+39) 06 57053798E-mail: [email protected]
Mr Julián Martínez BeltránDrainage and Salinity Management OfficerWater Resources, Development and Management ServiceLand and Water Development DivisionFAO, RomeItalyTel.: (+39) 06 57052078E-mail: [email protected]
Mr José Antonio MedinaDelegación Área de FomentoPlazoleta Ramón Franco s/nParque de Sta. Catalina. Casa del TurismoLas Palmas, Gran CanariaSpainTel.: (+34) 928 999130E-mail: [email protected]
Mr Richard MorrisRichard Morris & Associates9 Letham DriveGlasgow G43 2SLUnited KingdomTel.: (+44) 0141 6373146E-mail: [email protected]
Mr Fernando PizarroLand and Water Development EngineerInvestment Centre DivisionFAO, RomeItalyTel.: (+39) 06 57055838E-mail: [email protected]
Mr Koussai QuteishatMEDRC (Middle East Desalination Research Center)Muscat, OmanTel.: (+968) 695351E-mail: [email protected]
Annex 1
List of participants

Water desalination for agricultural applications46
Mr Hasan SharafAlternate Permanent Representative of Kuwait to FAOPermanent Representation of the State of Kuwait to FAOViale Aventino, 36 int. 8, RomeItalyTel.: (+39) 06 5754598E-mail: [email protected]
Mr Pasquale StedutoChief, Water Resources, Development and Management ServiceLand and Water Development DivisionFAO, RomeItalyTel.: (+39) 06 57054084E-mail: [email protected]
Mr José Miguel VezaDept. “Ingeniería de Procesos”University of Las Palmas, Gran Canaria SpainTel.: (+34) 928 451942E-mail: [email protected]
Mr Kenji YoshinagaDirectorLand and Water Development DivisionFAO, RomeItalyTel.: (+39) 06 57054702E-mail: [email protected]

47
Annex 2
Programme
Monday 26 April 2004
08.45–09.30 hrs. Registration of participants
09.30–09.45 hrs. Welcome, opening and introductionLouise O. Fresco, Assistant Director-General, Agriculture Department (AG)Kenji Yoshinaga, Director of Land and Water Development Division (AGL)Pasquale Steduto, Chief of Water Resources, Development and Management Service (AGLW)
09.45–09.50 hrs. Introduction of meeting participants
09.50–10.00 hrs. Julián Martínez Beltrán, AGLWObjectives and scope of the consultation in the context of AGLW Water Quality and Environment Group activities
10.00–10.15 hrs. Mohamed Bazza, FAO Near East Regional OfficeRegional perspectives on water quality issues in the Near East
10.15–10.45 hrs. Presentation by invited speakers
Theme I. State of the art on water desalination technology and costsTheme II. Environmental impacts and externalities associated with water desalination technologyTheme III. Economic and environmental feasibility of water desalination for agricultural applications
Koussai Quteishat, Middle East Desalination Research Center (MEDRC) Water desalination, technologies and costs, state-of-the-art
10.45–11.15 hrs. Coffee break
11.15–11.45 hrs. David Burnett, Texas A&M UniversityFreshwater in dry regions: desalination answers
11.45–12.15 hrs. José Antonio Medina, CEDEX, SpainFeasibility of desalination for agriculture
12.15–13.00 hrs. Discussion on Themes I, II & III
13.00–14.30 hrs. Lunch
14.30–15.00 hrs. Theme III. Economic and environmental feasibility of water desalination for agricultural applicationsTheme IV. Private–public partnershipTheme V. Comparison between wastewater treatment and desalination in agriculture
José Miguel Veza, Universidad de Las Palmas de Gran CanariaDesalination and wastewater reuse for agriculture in Spain

Water desalination for agricultural applications48
Monday 26 April 2004
15.00–15.30 hrs. Richard Morris, Richard Morris & Associates, United Kingdom Desalination in the Middle East and North Africa
15.45–17.00 hrs. Discussion on Themes III & IV
17.00 hrs. Cocktail, Celio Bar, Floor 8
Tuesday 27 April 2004Theme V. Comparison between wastewater treatment and desalination in agriculture
9.00–9.30 hrs. Hasan Sharaf, Alternate Permanent Representative from Kuwait to FAO
9.30–10.00 hrs. Discussion on Theme V
10.00–12.00 hrs. Preparation of conclusions and recommendations for all five themes
12.00–12.30 hrs. Coffee break
12.30–12.45 hrs. Sasha Koo-Oshima, AGLW Presentation of conclusions and recommendations
12.45–13.00 hrs. Pasquale Steduto, Chief AGLW Closing

FAO TECHNICAL PAPERS
FAO LAND AND WATER DISCUSSION PAPERS
1. A perspective on water control in southern Africa – support to regional investment initiatives, 2003 (E)
2. On-farm composting methods, 2003 (E, F)
3. Payment schemes for enviornmental services in watersheds / Sistemas de pago por servicios ambientales en cuencas hidrográfi cas, 2004 (E/S)
4. Drought impact mitigation and prevention in the Limpopo River Basin – a situation analysis, 2004 (E)
5. Water desalination for agricultural applications, 2006 (E)
Availability: May 2006
Ar – Arabic Multil + MultilingualC – Chinese * Out of printE – English ** In prep a ra tionF – FrenchP – PortugueseS – Spanish
The FAO Technical Papers are available through the authorized FAO Sales Agents or directly from Sales and Marketing Group, FAO, Viale delle Terme di Caracalla, 00100 Rome, Italy.