
Water Consumption Factors for Electricity Generation in ...
28
1 Water Consumption Factors for Electricity Generation in the United States Uisung Lee, Jeongwoo Han, and Amgad Elgowainy Energy Systems Division Argonne National Laboratory October 2016 Abstract In many regions of the United States, water availability is of concern due to growing demand and limited supply. In these regions, water is also an essential resource for most power generation technologies. Thermal power plants, which generate 87% of the total electricity in the United States, typically require a large amount of water for cooling purposes. Depending on types of cooling technology and prime movers, water loss or “consumption” through evaporation vary significantly. Hydropower plants with reservoirs “consume” large amount of water through evaporation due to the typically large surface area of the reservoir. Because water consumption rates vary by region due to different climate conditions, regional variation of water consumption due to hydropower generation should be considered. The objective of this study is to estimate the water consumption factor (WCF) for electricity generation, which is defined as the water consumed per unit of power generation (e.g., gallons of water per kWh of generated electricity). In particular, this study evaluates the variation in WCF by region. For hydropower, water consumption from hydropower reservoirs is calculated using reservoir’s surface area, state-level water evaporation data, and background evapotranspiration. Note that water consumption in multipurpose reservoirs is allocated to hydropower generation based on the share of the economic benefit of power generation among benefits from all other purposes (e.g., irrigation, flood control, navigation, etc.) Thus, the balance of water consumption is allocated among all other purposes based on their estimated economic benefits. For thermal power plants, the WCFs by types of cooling technology and prime mover are estimated. Because cooling technologies and prime mover types vary by region, the WCF for thermal power generation also exhibits regional differences. The WCFs from hydropower and thermal power generation are aggregated to the national-level and also to each North American Electric Reliability Council (NERC) utility region. The national average WCF for electricity is estimated at 0.58 gal/kWh considering the average U.S. electricity generation mix in 2015. At a facility-level, the WCFs of thermoelectricity and hydropower are 0.33 and 4.4 gal/kWh, respectively, while the shares of thermo- and hydro-power generation are 87% and 6.3%, respectively. The WCFs have been implemented in the Greenhouse gases, Regulated Emissions, and Energy use in Transportation (GREET ® ) model developed by Argonne National Laboratory. GREET is a life cycle analysis tool that evaluates energy use and emissions, as well as water consumption on a life cycle basis. This study allows researchers to analyze lifecycle water consumption for various energy production and conversion pathways. While the economic benefits approach was employed to allocate WCF to hydropower generation in multipurpose reservoirs, other approaches for estimating the hydropower WCFs are subjects for future analysis and updates to the GREET model.
Transcript of Water Consumption Factors for Electricity Generation in ...

1
Water Consumption Factors for Electricity Generation in the
United States
Uisung Lee, Jeongwoo Han, and Amgad Elgowainy
Energy Systems Division
Argonne National Laboratory
October 2016
Abstract
In many regions of the United States, water availability is of concern due to growing demand and
limited supply. In these regions, water is also an essential resource for most power generation technologies.
Thermal power plants, which generate 87% of the total electricity in the United States, typically require a
large amount of water for cooling purposes. Depending on types of cooling technology and prime movers,
water loss or “consumption” through evaporation vary significantly. Hydropower plants with reservoirs
“consume” large amount of water through evaporation due to the typically large surface area of the reservoir.
Because water consumption rates vary by region due to different climate conditions, regional variation of
water consumption due to hydropower generation should be considered. The objective of this study is to
estimate the water consumption factor (WCF) for electricity generation, which is defined as the water
consumed per unit of power generation (e.g., gallons of water per kWh of generated electricity). In
particular, this study evaluates the variation in WCF by region. For hydropower, water consumption from
hydropower reservoirs is calculated using reservoir’s surface area, state-level water evaporation data, and
background evapotranspiration. Note that water consumption in multipurpose reservoirs is allocated to
hydropower generation based on the share of the economic benefit of power generation among benefits
from all other purposes (e.g., irrigation, flood control, navigation, etc.) Thus, the balance of water
consumption is allocated among all other purposes based on their estimated economic benefits. For thermal
power plants, the WCFs by types of cooling technology and prime mover are estimated. Because cooling
technologies and prime mover types vary by region, the WCF for thermal power generation also exhibits
regional differences. The WCFs from hydropower and thermal power generation are aggregated to the
national-level and also to each North American Electric Reliability Council (NERC) utility region. The
national average WCF for electricity is estimated at 0.58 gal/kWh considering the average U.S. electricity
generation mix in 2015. At a facility-level, the WCFs of thermoelectricity and hydropower are 0.33 and 4.4
gal/kWh, respectively, while the shares of thermo- and hydro-power generation are 87% and 6.3%,
respectively. The WCFs have been implemented in the Greenhouse gases, Regulated Emissions, and
Energy use in Transportation (GREET®) model developed by Argonne National Laboratory. GREET is a
life cycle analysis tool that evaluates energy use and emissions, as well as water consumption on a life cycle
basis. This study allows researchers to analyze lifecycle water consumption for various energy production
and conversion pathways. While the economic benefits approach was employed to allocate WCF to
hydropower generation in multipurpose reservoirs, other approaches for estimating the hydropower WCFs
are subjects for future analysis and updates to the GREET model.

2
1 Introduction
Demand for water grows rapidly with population growth, which requires more water resources for
drinking, cooking, sanitation, food production, and power generation (Burnett et al. 2014). However, it is
expected that there would be a steady drop in fresh surface water availability (Seager et al. 2013), and
climate change may influence the water cycle through increased evaporation (Bartos and Chester 2015;
Qaddumi et al. 2009). Therefore, competition over water resources between various demands may result in
stress over water availability in affected regions.
The power generation sector is a major water consumer, and it is projected that demand for
electricity generation will grow over time due to increases in population and energy use per capita (EIA
2016). As a result, water security became one of the biggest challenges to sustainability for hydropower
and thermal power generation (i.e., fossil-based and nuclear power generation). Hydropower dams generate
electricity by converting gravitational potential energy from flowing water into electricity using hydraulic
turbines, and typically require an extensive volume of water to be stored in a reservoir. In the meanwhile,
water is evaporated from the reservoirs resulting in loss or consumption of water. Water consumption is
defined as water that is lost, i.e., that does not return to its original source in a given region. This is in
contrast to water “withdrawal”, which represents the amount of water withdrawn for a given purpose,
regardless of whether it is lost or returned to its original regional resource. Thermal power plants accounted
for 87% of total power generation in the United States in 2015 (EIA 2016) and required a large amount of
water for cooling purposes. The United States Geological Survey (USGS) estimated cooling water at power
plants as the largest sector of water withdrawal with 45% of total withdrawals in 2010 (Maupin et al. 2014).
While most of the withdrawn water is returned to the water body, a smaller portion is considered consumed,
mainly due to evaporation, which depends on the employed cooling technologies at the power plant level.
Water cannot be substitute by other resources for cases such as irrigation, drinking, and sanitation.
However, there are cooling technology options in power generation sectors which lead to reduced water
consumption. This is particularly important for reliability of power generation in areas where water
resources are limited. For example, California had to burn more natural gas to generate electric power
because hydropower was roughly halved during the drought of 2007–2009 (Christian-Smith et al. 2011).
Also, several southwestern thermoelectric power plants were forced to reduce or stop power generation due
to limited available cooling water resources (Kimmell and Veil 2009; van Vliet et al. 2012).
Life cycle analysis (LCA) is a method that evaluates the environmental impacts of any product,
including power generation, and covers all stages of the product’s lifetime. The Greenhouse gases,
Regulated Emissions, and Energy use in Transportation (GREET®) model developed by Argonne National
Laboratory is used to systematically evaluate the life cycle energy use, greenhouse gas (GHG) emissions,
and criteria air pollutant emissions associated with various fuel production pathways and vehicle
technologies. The GREET model was recently expanded to include water consumption as an additional
environmental sustainability metric. To determine the water consumption on a life cycle basis, it is essential
to construct a water consumption inventory of every process along the product’s life cycle. Because
electricity is one of the key resources used for other products’ pathways, it is important to evaluate water
consumption for the power generation sector. Furthermore, considering the large difference in water
availability and water consumption by region, regional analysis is essential for the water LCA.
This study aims to quantify water consumption for electricity generation and calculate water
consumption factors (WCFs), which are defined as water consumption per unit of electric energy generation.
For hydropower, regional climate differences that influence the WCFs of hydropower generation are mainly

3
discussed. For thermoelectricity, water consumption varies by types of cooling technologies and prime
movers. Because the share of cooling technologies varies by region, it is expected that the WCFs of
thermoelectricity also exhibit similar variation. The regional and national WCFs of various electricity
generation technologies are implemented in the GREET model to facilitate the evaluation of the life cycle
water consumption associated with the various end use of electricity.
2 Methodology
2.1 Definitions of Water Consumption
First, the definitions of fresh water and water consumption in this study should be clarified. On a
global scale, water is not limited; it is rather the most abundant resource. However, available water
resources for most end uses are constrained because water on earth is mostly seawater, which is not directly
accessible by inland areas or end uses that require fresh water. Thus, available water resources, in general,
mean freshwater which can be directly used for various purposes such as public water supply, irrigation,
power generation.
There are two terminologies that commonly refer to water use: water withdrawal and water
consumption. Water withdrawal represents the amount of water uptake from a surface or ground water
source. Generally, there are three causes of water consumption: evaporation, incorporation into products,
or degradation to insufficient quality for future use (Lampert et al. 2015). However, degradation of water
quality can usually be treated in waste water treatment plants and recycled for reuse. In such case,
degradation of water quality with use is not considered as water loss or consumption.
In this study, only freshwater is regarded as a water resource that is impacted by consumption.
Water consumption is different from water withdrawal, because withdrawn water can be used multiple
times unless it is consumed. In order to investigate the amount of water consumed for power generation, a
WCF is defined as water consumption per unit of generated electricity (gal/kWh).
2.2 WCFs of Hydropower Generation
2.2.1 Water Consumption in Hydropower Dams
Although hydropower plants convert the gravitational potential energy of flowing water into
electricity, the water keeps its quality as it merely flows through the hydraulic turbines. Such water can also
be used for other downstream applications such as irrigation or water supply. Therefore, direct water use
for hydropower generation is not considered consumed. However, when reservoirs store a large amount of
water for the power generation purpose, stored water is evaporated from the surface. This portion should
be accounted as consumed water because it becomes unavailable for other uses in the same water resource
region.
Previously, the National Renewable Energy Laboratory (NREL) evaluated a national-level WCF
for hydropower in the United States as 18.2 gal/kWh (Torcellini et al. 2003). That study aggregated the
water evaporation from individual reservoirs using yearly averaged pan evaporation data and divided the
annual evaporation by annual power generation. In 2012, Intergovernmental Panel on Climate Change
4
(IPCC) reported operational water consumption for hydropower varies from zero for run-of-river (ROR)
hydropower plants, which do not employ reservoirs, up to 55.2 gal/kWh by referencing five data sources
(Fthenakis and Kim 2010; Gleick and others 1993; LeCornu 1998; Mielke, Anadon, and Narayanamurti
2010; Torcellini et al. 2003). Bakken et al. (2013) reviewed previous approaches of evaluating hydropower
water consumption and pointed out a methodological error. The authors mentioned that background
evapotranspiration should be subtracted from the estimated water evaporation to account only for the
amount of water consumption caused by anthropogenic actions. In this report, we use the methodology
suggested by Bakken et al. (2013).
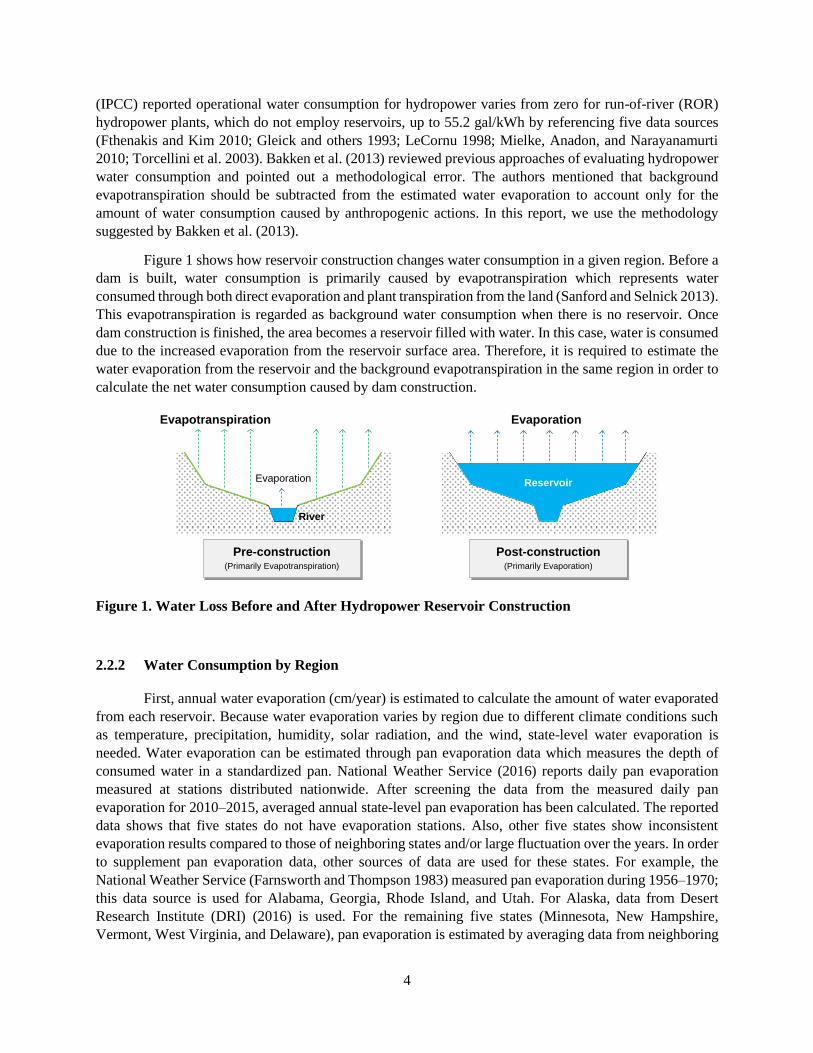
Figure 1 shows how reservoir construction changes water consumption in a given region. Before a
dam is built, water consumption is primarily caused by evapotranspiration which represents water
consumed through both direct evaporation and plant transpiration from the land (Sanford and Selnick 2013).
This evapotranspiration is regarded as background water consumption when there is no reservoir. Once
dam construction is finished, the area becomes a reservoir filled with water. In this case, water is consumed
due to the increased evaporation from the reservoir surface area. Therefore, it is required to estimate the
water evaporation from the reservoir and the background evapotranspiration in the same region in order to
calculate the net water consumption caused by dam construction.
Evapotranspiration Evaporation
Evaporation
River
Reservoir
Pre-construction(Primarily Evapotranspiration)
Post-construction(Primarily Evaporation)
Figure 1. Water Loss Before and After Hydropower Reservoir Construction
2.2.2 Water Consumption by Region
First, annual water evaporation (cm/year) is estimated to calculate the amount of water evaporated
from each reservoir. Because water evaporation varies by region due to different climate conditions such
as temperature, precipitation, humidity, solar radiation, and the wind, state-level water evaporation is
needed. Water evaporation can be estimated through pan evaporation data which measures the depth of
consumed water in a standardized pan. National Weather Service (2016) reports daily pan evaporation
measured at stations distributed nationwide. After screening the data from the measured daily pan
evaporation for 2010–2015, averaged annual state-level pan evaporation has been calculated. The reported
data shows that five states do not have evaporation stations. Also, other five states show inconsistent
evaporation results compared to those of neighboring states and/or large fluctuation over the years. In order
to supplement pan evaporation data, other sources of data are used for these states. For example, the
National Weather Service (Farnsworth and Thompson 1983) measured pan evaporation during 1956–1970;
this data source is used for Alabama, Georgia, Rhode Island, and Utah. For Alaska, data from Desert
Research Institute (DRI) (2016) is used. For the remaining five states (Minnesota, New Hampshire,
Vermont, West Virginia, and Delaware), pan evaporation is estimated by averaging data from neighboring

5
states that are subject to similar climate conditions. Table 1 shows the developed annual pan evaporation
data by state.
Natural evaporation from reservoirs does not exactly match with the measured pan evaporation.
When pan evaporation is measured, water is contained in a small pan installed above ground. Therefore,
additional water evaporation is caused by heat exchange with surrounding walls. In order to compensate
for this effects, lake evaporation is estimated by multiplying pan evaporation data with a coefficient of 0.75
(DRI 2016). Lake evaporation data at state-level is presented in Figure 2 and Table 1. The results show that
southwestern states have the highest evaporation rates due to their tropical and dry climate conditions.
As mentioned earlier, to evaluate water consumption caused by dam construction, background
evapotranspiration needs to be subtracted from evaporation. Due to lack of measured evapotranspiration
data nationwide, a regression equation developed by Sanford and Selnick (2013) is used, which combines
watershed water-balance data with meteorological data for 1971-2000, and related evapotranspiration with
climate data. As a result, evapotranspiration (ET) at a certain location in the United States can be estimated
using mean annual daily temperature (Tm), mean annual daily maximum temperature (Tx), mean annual
daily minimum temperature (Tn), and mean annual precipitation (P). Eq. (1) represents the regression
equation:
PET (1)
where, τ = (Tm + To)m / ((Tm + To)
m + a), Δ = (Tx – Tn) / ((Tx – Tn) + b), and Π = (P / Po)n. The fitted values
are 13.735°C, 505.87 cm, 2.4721, 1.9044, 10,000, and 18.262 for To, Po, m, n, a, and b, respectively
(Sanford and Selnick 2013). Calculated annual evapotranspiration by state is shown in Figure 2 and Table
1. Note that temperature and precipitation data are all from National Centers for Environmental
Information (NCEI) (NOAA 2016). Estimated evapotranspiration results show that the values along the
Gulf Coast and in Florida are the highest because of the large amount of rainfall and warm temperatures,
while the arid southeastern California area has the lowest evapotranspiration due to its low rainfall and
dry conditions.

6
Table 1. Pan Evaporation, Lake Evaporation, Evapotranspiration, and Water Consumption by State
State Pan Evaporation
(cm/yr)
Lake Evaporation
(cm/yr)
Evapotranspiration
(cm/yr)
Water Consumption
(cm/yr)
ALa 129 97 85 12
AKb 37 28 26 0
AZ 260 195 26 169
AR 114 85 79 6
CA 250 188 42 145
CO 212 159 29 130
CT 57 43 64 0
DE 84 63 68 0
FL 213 160 87 73
GAa 164 123 81 42
HI 230 173 84 88
ID 108 81 29 52
IL 93 70 62 8
IN 110 83 65 18
IA 114 85 58 28
KS 173 130 58 72
KY 113 85 72 12
LA 149 112 87 25
ME 53 40 53 0
MD 84 63 69 0
MA 36 27 59 0
MI 90 67 53 14
MNc 96 72 49 23
MS 113 85 85 0
MO 150 113 70 43
MT 113 85 32 53
NE 182 136 52 84
NV 265 199 20 178
NHc 55 41 35 7
NJ 97 73 65 7
NM 396 297 31 266
NY 90 67 61 6
NC 219 164 77 87
ND 95 71 40 32
OH 144 108 63 45
OK 176 132 74 59
OR 164 123 60 62
PA 64 48 64 0
RIa 91 68 65 3
SC 135 102 79 22
SD 120 90 45 45
TN 130 98 78 20
TX 302 227 65 162
UTa 143 107 32 75
VTc 55 41 56 0
VA 133 100 72 28
WA 132 99 62 37
WVc 181 136 68 68
WI 72 54 54 0
WY 150 112 34 79 a Farnsworth and Thompson (1983) b Desert Research Institute (2016) c Pan evaporation data have been averaged using neighboring states due to insufficient or inconsistent data
7
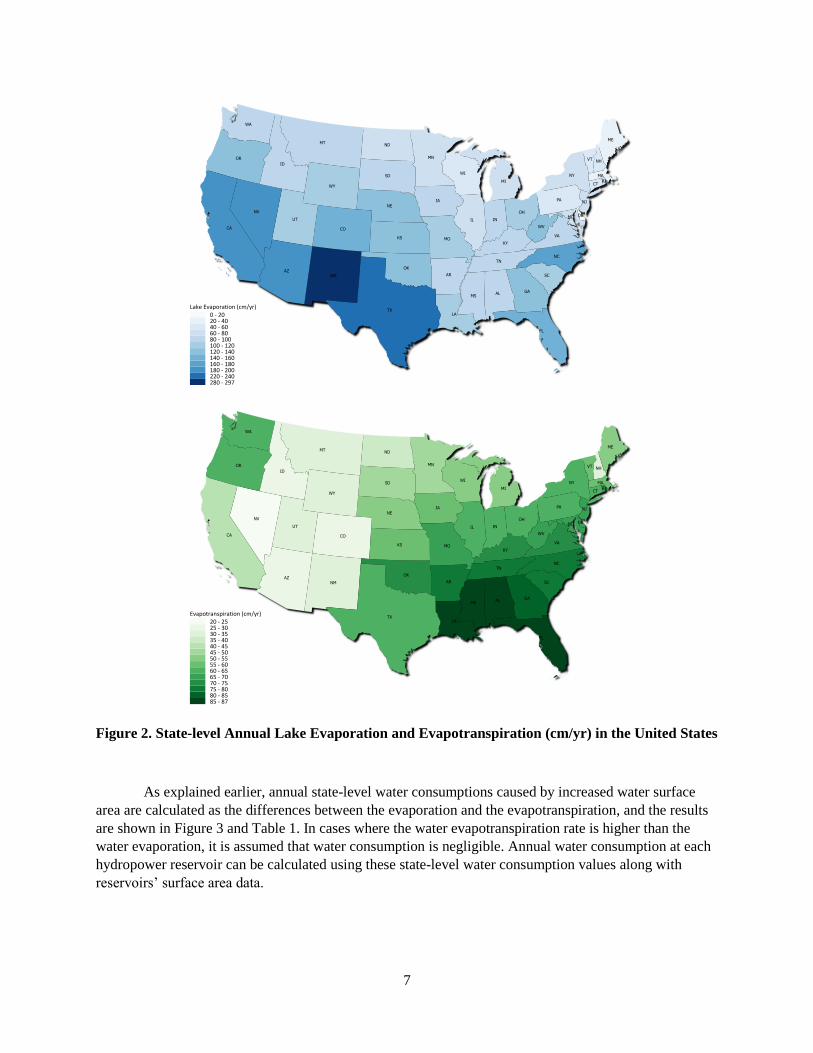
Figure 2. State-level Annual Lake Evaporation and Evapotranspiration (cm/yr) in the United States
As explained earlier, annual state-level water consumptions caused by increased water surface
area are calculated as the differences between the evaporation and the evapotranspiration, and the results
are shown in Figure 3 and Table 1. In cases where the water evapotranspiration rate is higher than the
water evaporation, it is assumed that water consumption is negligible. Annual water consumption at each
hydropower reservoir can be calculated using these state-level water consumption values along with
reservoirs’ surface area data.
Lake Evaporation (cm/yr) 0 - 20 20 - 40 40 - 60 60 - 80 80 - 100 100 - 120 120 - 140 140 - 160 160 - 180 180 - 200 220 - 240 280 - 297
Evapotranspiration (cm/yr) 20 - 25 25 - 30 30 - 35 35 - 40 40 - 45 45 - 50 50 - 55 55 - 60 60 - 65 65 - 70 70 - 75 75 - 80 80 - 85 85 - 87

8
Figure 3. State-level Annual Water Consumption due to Evaporation (cm/yr) in the United States
2.2.3 Data Sources and Data Processing
In order to estimate the water consumption from each hydropower reservoir, surface area data are
needed. National Inventory of Dams (NID) listed by Army Corps of Engineers (2010) includes data for
dams in the United States. The inventory has 8,119 dams in total, and lists the location, reservoir surface
area, and purposes of each dam. The amount of consumed water from a reservoir can be simply calculated
by multiplying the increment in surface area due to dam construction and the corresponding state-level
water consumption (cm/yr) estimated above. It is assumed that the surface area before dam construction is
negligible compared to the huge reservoir area so that the surface area data in the NID are directly used.
Among the NID data, there are some dams with possibly wrong surface area, which have been corrected
by incorporating other data sources as in Table 2.
Because the NID do not include power generation data, additional data need to be incorporated. US
EPA (2015) publishes the Emissions & Generation Resource Integrated Database (eGRID) every year to
provide information on GHG emissions associated with power generated in the United States. This includes
information and data of each power plant such as capacity, types of power generation, plant location, and
annual power generation. The eGRID includes a total of 1,365 hydropower plants which generated 270
TWh in 2012. In order to calculate the WCFs of hydropower dams, the two data sets–the NID and the
eGRID–have been merged based on the names and the proximity of the plants calculated using the location
information from each data set. After data processing, 85% of the dams in the United States that generate
hydropower are matched between the NID and the eGRID data sets, and data of these 539 dams are used
for WCF calculation. Figure 4 summarizes the data sources and the processes of calculating the hydropower
WCF. Note that water consumption associated with dam construction is excluded in this analysis because
it is negligible compared to the water consumption during operation (Mekonnen, Gerbens-Leenes, and
Hoekstra 2015).
Water Consumption (cm/yr) 0 - 20 20 - 40 40 - 60 60 - 80 80 - 100 120 - 140 140 - 160 160 - 180 260 - 266

9
Table 2. List of Dams with Corrected Surface Area
Power Generation
(MWh) in 2012
Surface Area Corrected (acres)
From To
Rovert Moses – Niagara a 13,373,029 0 1,900
Diablo b 935,630 0 910
Yale c 702,744 0 3,800
Thurmond Lake Dam d 310,391 0 71,100
Utah Power & Light – Cutler e 50,408 0 9,700
Lake Summit Dam f 19,953 0 290
Turner Shoals Dam d 10,999 0 438
Red Bridge Dam g 10,690 0 25
Zumbro Lake h 7,550 0 600
Sugarloaf i 5,195 0 780
Wachusett Reservoir Dam g 4,100 0 4,135
Chief Joseph Dam k 12,480,327 8,400 0
The Dalles Lock and Dam k 7,805,592 11,200 0
Lower Monumental Lock and Dam k 2,520,051 6,590 0
Lower Granite Lock and Dam k 2,417,376 8,900 0
Bonneville k 5,549,149 20,600 0
Little Goose Lock and Dam k 2,302,381 10,025 0
John Day Dam k 10,445,910 55,000 0
McNary Lock and Dam k 5,803,559 38,800 0
Lay k 349,824 13,700 0 a New York Power Authority (2016) b National Park Service (2011) c Federal Energy Regulatory Commission (2006) d Lakes Online (2016) e Audubon (2016) f Lake Summit Property Owners Association (2016) g Energy and Environmental Affaris (2016) h Minnesota Department of Natural Resources (2016) i Recreation.gov (2016) j USBR and USACE (2001)

10
Pan
Evaporation
(Measured Data)
Lake Evaporation
Evapotranspiration
(Estimated)
Water Consumption
Rate (cm/yr)
Reservoir Surface
Area (acre)
Power Generation
(MWh/yr)
National Weather
Service
NID
(Army Corps of Engineers)
eGRID
(USEPA)
Regression Equation
(Sanford and Selnick 2013)
Allocation Factors
(ORNL)
Water Consumption
(gal/yr)
WCF
(gal/kWh)
Data Sources
State-level Water Consumption
Each Hydropower Dams
Figure 4. Data Sources and Calculation Processes of WCFs for Hydropower
2.2.4 Water Consumption Allocation in Multipurpose Hydropower Dams
When dams are built they are usually not designed to only generate electricity but also to serve
other purposes (e.g., flood control, irrigation, and navigation). Also, there are many cases where
hydropower systems are added to existing non-power generation dams to improve revenue (Hadjerioua,
Wei, and Kao 2012). Therefore, it is not appropriate to allocate all of the water consumption solely to
hydropower generation in these cases. The NID specifies the purposes of dams to include hydropower
generation, irrigation, flood control, navigation, water supply, recreation, fire protection, fish and wildlife,
debris control, and others. It has been found that hydropower is not a major purpose of dam construction.
Among 8,119 dams in the NID, only 1,211 dams (15% by number) include hydropower as one of their
purposes, which means the majority of dams and reservoirs serve purposes other than hydropower
generation. Dams for hydropower alone (dedicated dams) are only 4% (298 dams) of the total number of
dams, while the rest, 11% (913 dams) are multipurpose dams that serve other purposes while also generating
electricity. There are some dams called ROR, which do not need reservoirs, but use natural river flow to
generate electricity. Therefore, there is no water consumption caused by power generation from these dams,
and they need to be separately classified along with dedicated (to hydropower) and multipurpose dams.
There have been discussions on allocation of water consumption to hydropower for multipurpose
dams. IPCC commented that allocation schemes for multipurpose reservoirs can significantly influence the
results (Edenhofer et al. 2011). However, Bakken et al. (2013) found only one study allocating water
consumption to hydropower in a multipurpose dam among all previously published papers for the water
footprint of hydropower. Pasqualetti and Kelley (2008) evaluated economic values of hydropower,
recreation, agriculture, and municipal supply for Lake Powell Dam located on the border between Utah and
Arizona. They allocated 55% of water consumption to hydropower based on the share of economic values
of each purpose.
There are many allocation schemes in LCA studies, and proper approaches are chosen among
energy allocation, volume or mass allocation, market value allocation, and displacement or substitution,
depending on the types of main products, co-products, and by-products. However, it is difficult to apply the
same schemes to multipurpose dams because often each purpose is vastly different from any of the other

11
purposes. Recently, Bakken et al. (2016) analyzed water consumption for four multipurpose hydropower
dams in India, Egypt, and Spain using four different allocation methods – volume allocation, energy
allocation, economic allocation, and explicit prioritizing. They concluded that volume allocation is the most
robust approach citing that the economic allocation method may incur additional uncertainties. They also
pointed that cost-efficient functions may take a higher burden than those generating the least benefits.
However, the volume allocation method also has several critical drawbacks. It might be
straightforward to estimate the volume used for some purposes such as power generation, water supply, and
irrigation because they have physically distinct volume usage. But it is subjective to use the same definition
of “volume” for other purposes such as navigation, flood control, and recreation because of the volume for
each of these purposes is not distinct. For these purposes, allocation varies significantly depending on the
definition of the volume of water used for the specific purpose. For example, Bakken et al. (2016) used two
totally different definitions of water volume for flood control. They used volumes available for storage of
inflow for Aswan High Dam in Egypt as proposed by the International Commission of Large Dams, but for
Mularroya Dam in Spain, they used 20% of the total storage capacity. Similarly, the volumes used for
navigation and recreation purposes are difficult to evaluate since there is no consensus regarding the
definitions of the volume for these purposes. Most of all, these approaches might fail to obtain national or
state-level WCFs due to insufficient data on these volumes.
Oak Ridge National Laboratory (ORNL) recently collected data of hydropower dams from three
agencies–The U.S. Bureau of Reclamation (USBR), The U.S. Army Corps of Engineers (USACE), and The
Tennessee Valley Authority (TVA), which accounted for 42% of the total installed hydropower capacity in
the United States. Based on the data, they quantified economic benefit for each purpose (Hadjerioua et al.
2015). Economic benefits indicate how dams are currently utilized, which makes it possible to compare the
relative importance of each purpose in terms of monetized values. The economic benefit of hydropower
over total economic benefits from all purposes can be regarded as the allocation factor of hydropower. This
approach is less controversial considering that dams would be constructed only when there are demands,
and people or municipalities are willing to pay for that.
Table 3 shows the allocation factors of hydropower based on the economic benefit evaluated by
ORNL. They categorized allocation factors in terms of hydropower capacity and the number of purposes.
The values indicate relative burdens that hydropower needs to take, which vary from zero to one. One
means that water consumption from reservoirs is totally allocated to hydropower, while zero represents
there is no water consumption by hydropower generation. Table 3 shows that the higher the number of
purposes, the fewer burdens to hydropower because the burdens are shared by other purposes. Reservoirs
with four or more purposes are classified into one category because additional purposes may not have
significant impacts and the ORNL’s report showed slight disproportion for the dams with five purposes.
In general, hydropower dams with high capacity tend to have higher allocation factors than low
and mid-size capacity hydropower dams. It is mainly because the revenue from power generation is
dominant for high capacity hydropower dams. Also, for dams with low to mid-size capacity, recreation
tends to have high economic benefits because those dams are more likely to be located near metropolitan
areas than massive hydropower dams. The revenue of recreation takes the majority of the evaporation
burden, which explains why hydropower in low and mid-capacity dams have low allocation factors. Using
the allocation factors in Table 3, water consumption for hydropower generation in each multipurpose
reservoir is calculated. It should be noted that the dams with a capacity greater than 500 MW generated
more than a half of hydroelectricity in 2012, and they are dominant for determining overall allocation
factors.

12
Table 3. Allocation Factors of Hydropower Based on Economic Benefits (Hadjerioua et al. 2015)
Capacity
(MW)
Number of purposes
1 2 3 4 or more
<100 1.000 0.444 0.171 0.130
100~500 1.000 0.545 0.264 0.196
>500 1.000 0.973 0.594 0.131
2.3 WCFs of Thermoelectricity Generation
2.3.1 Water Consumption in Thermal Power Plants
National Renewable Energy Laboratory (NREL) evaluated national water consumptions for
thermoelectricity generation in the United States as 0.47 gal/kWh in 2003, using a USGS’s water
consumption estimates and EIA’s net power generation data (Torcellini et al. 2003). Later, NREL collected
WCFs by power generation technologies from the literature (Macknick et al. 2011), but the reported values
may not be representative of the average WCF for the examined categories because each group included
only a small sample. USGS also estimated water use at thermoelectric plants using linked heat and water
budgets models, and the results were compared to EIA-reported water use (Diehl and Harris 2014; Diehl et
al. 2013). To avoid uncertainties of reported estimates, they calculated evaporation from reported energy
budget. These studies, however, have not evaluated the WCFs for electricity generation by region.
Power generation in thermal power plants mainly converts thermal energy input (heat) into
electricity. Most thermal power plants use water to generate steam, which operates turbines to produce
electricity. While the heat for boiling water can be obtained from various sources such as fossil fuel
combustion or nuclear reaction, the concepts of generating thermoelectricity are basically the same
regardless of energy sources. Once the steam is exhausted from the turbine, it is condensed and t recirculated
to the boiler. Cooling water is typically used to dissipate the waste heat from the turbine exhaust in the
condenser.
Water evaporation per unit power generation due to cooling mainly depends on the power plant
energy efficiency and employed cooling technology. According to the second law of thermodynamics for
heat engines, only a portion of heat input from fuel combustion is converted into electricity in thermal
power plants, while the rest has to be rejected, which is largely determined by the plant energy efficiency.
Thus, the amount of heat rejected per unit power generation can be calculated using the plant energy
efficiency. For cooling technologies that employ water to reject heat to the environment, the amount of heat
rejected to the water is a direct function of the energy conversion efficiency. Note that, prime movers
employing steam turbine and combined cycle have different energy efficiencies. The combined cycles
typically have much higher energy conversion efficiency than steam turbine cycles, and thus reject less heat
to the environment.
Given the amount of heat to be dissipated, water consumption varies depending on types of cooling
technologies. There are three major cooling technologies – once-through (or single-loop), recirculating (or
closed-loop), and dry cooling. Some power plants may use two or more types of cooling technologies. The
once-through cooling takes a large amount of water from a near water body, and the cooling water goes
through heat exchangers to cool down and condense the hot steam exiting from turbines. The heated cooling
water is then discharged to the water body usually back to its withdrawn source. The discharging cooling
water temperature is slightly higher than that of the withdrawal due to the large heat capacity and flow rate
13
of cooling water, which leads to negligible amount of water evaporation during the cooling process. On the
other hand, the recirculating cooling system has a closed-loop which circulates a relatively smaller amount
of cooling water. The recirculating cooling system uses towers (natural or mechanical draft cooling tower)
or ponds to dissipate the heat absorbed in the condenser by evaporating a portion of the cooling water to
the atmosphere. The deficiency due to the evaporation is compensated by withdrawing “makeup” water. In
other words, the once-through cooling system dissipates the heat through a small increase in the temperature
of cooling water, while the recirculating cooling system experiences large increase in water temperature
that is released to the environment through a subsequent evaporation process that involves phase change of
cooling water and results in significant water loss or consumption. Dry cooling technologies use air instead
of water to cool the steam, which does not include any water consumption but usually incur higher energy
and economic burdens.
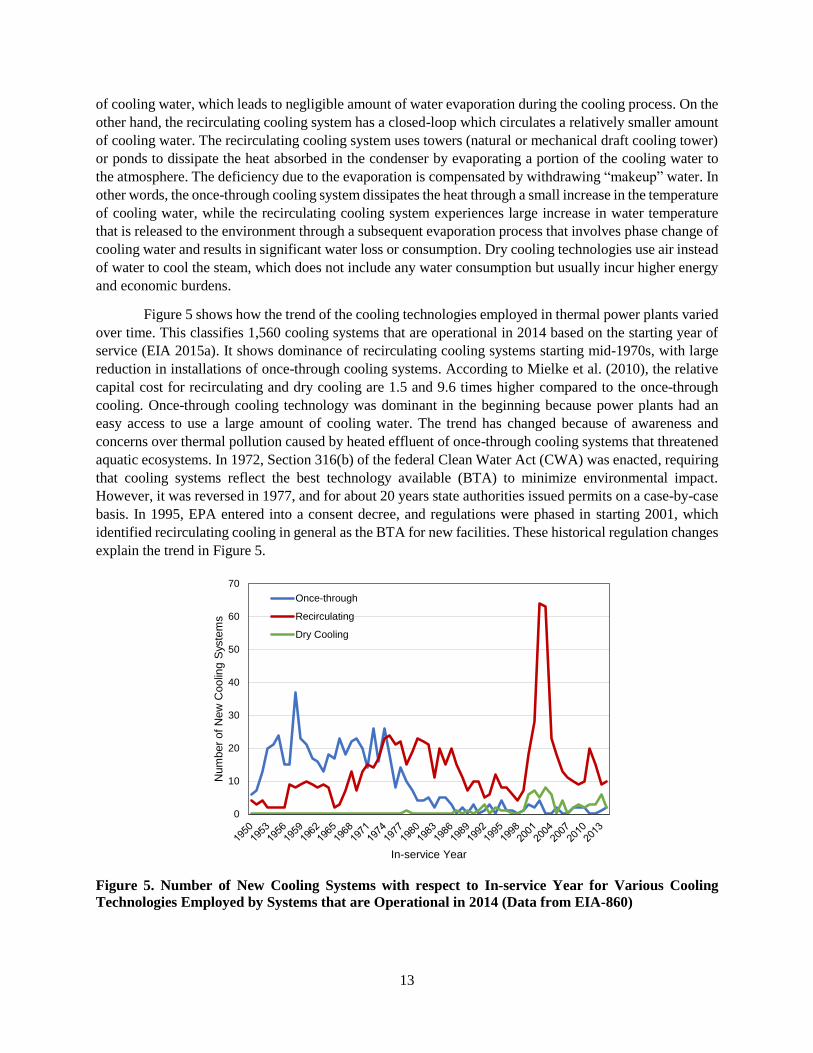
Figure 5 shows how the trend of the cooling technologies employed in thermal power plants varied
over time. This classifies 1,560 cooling systems that are operational in 2014 based on the starting year of
service (EIA 2015a). It shows dominance of recirculating cooling systems starting mid-1970s, with large
reduction in installations of once-through cooling systems. According to Mielke et al. (2010), the relative
capital cost for recirculating and dry cooling are 1.5 and 9.6 times higher compared to the once-through
cooling. Once-through cooling technology was dominant in the beginning because power plants had an
easy access to use a large amount of cooling water. The trend has changed because of awareness and
concerns over thermal pollution caused by heated effluent of once-through cooling systems that threatened
aquatic ecosystems. In 1972, Section 316(b) of the federal Clean Water Act (CWA) was enacted, requiring
that cooling systems reflect the best technology available (BTA) to minimize environmental impact.
However, it was reversed in 1977, and for about 20 years state authorities issued permits on a case-by-case
basis. In 1995, EPA entered into a consent decree, and regulations were phased in starting 2001, which
identified recirculating cooling in general as the BTA for new facilities. These historical regulation changes
explain the trend in Figure 5.
Figure 5. Number of New Cooling Systems with respect to In-service Year for Various Cooling
Technologies Employed by Systems that are Operational in 2014 (Data from EIA-860)
0
10
20
30
40
50
60
70
Nu
mb
er
of
Ne
w C
oo
ling S
yste
ms
In-service Year
Once-through
Recirculating
Dry Cooling

14
Although the regulations led the changes in cooling system technology installations, there were still
many power plants with once-through cooling technology because the BTA does not restrict it to a
recirculating cooling technology. Existing plants are required to equip cooling systems that achieve
environmental protection of aquatic species, equivalent to recirculating cooling. Based on EIA-860, the
recirculating cooling system is dominant for most southern and western states, while northern and eastern
states use of once-through is more prevalent. The differences in the use of cooling technologies by region
result in differences in their water use for power generation.
For the once-through cooling systems, the difference between the withdrawal and the discharge is
regarded as water consumption. Though the discharged water is not reused at a facility-level, it can be used
downstream of the power plant because no significant degradation of the water quality is incurred during
heat exchange process. There might be small increase in loss of water to evaporation after the cooling water
is returned to the water body due to increased temperature, but it is assumed to be negligible. It should be
noted that there are some once-through cooling systems with cooling towers or ponds. They cool down the
discharge to minimize environmental thermal impacts. In this case, the water consumption can be estimated
in the same manner of the once-through cooling system without cooling towers or ponds. For recirculating
cooling with a cooling tower, the system withdraws a small amount of makeup water to compensate for the
water loss due to evaporation. Similarly, the recirculating cooling systems with ponds withdraw makeup
water from near water body to maintain the water level of the cooling ponds. Therefore, the makeup water
can be regarded as water consumption for the recirculating cooling.
2.3.2 Data Sources and Data Processing
First, water consumption at the facility-level has been examined. EIA-923 (EIA 2015b) includes
data of power generation technologies, cooling technologies, water withdrawal and water consumption
along with other general information on the power plants. EIA-860 (EIA 2015a) includes information
regarding cooling tower and cooling ponds. Because EIA-923 does not specify whether or not once through
cooling employs cooling towers, EIA-860 is used to reclassify power plants with once-through cooling
technology.
The original EIA data includes a total of 3,380 thermal power plants, which produced 3,600 TWh
in 2014. The data are processed for the analysis as summarized in Table 4. Data used in this analysis covers
63% of power generation by the thermal power plants in EIA-923. Major data rejections are data with
incomplete information regarding the type of employed cooling technology. In order to investigate the WCF
associated with a specific cooling technology and prime mover, plants with multiple cooling technology
options cannot be used, and are therefore eliminated. Additionally, cooling systems of 15 power plants
needed reclassification, mostly by adding a category of once-through cooling that uses cooling tower, which
is not listed in EIA-923. With the help of EIA-860, 11 power plants are categorized into once-through with
a tower, while four misplaced plants are re-categorized after a careful investigation.
After the data processing, power plants are classified into six categories based on cooling
technologies and prime movers: (1) once-through cooling without a pond or a tower, (2) cooling with a
pond (steam turbine), (3) cooling with a pond (combined cycle), (4) cooling with a tower (steam turbine),
(5) cooling with a tower (combined cycle), and (6) dry cooling. For once-through cooling without a pond
or a tower, steam turbine and combined cycle power plants are classified in the same category because there
is minor difference between them with respect to negligible water consumption. The once-through cooling
systems with a pond or a tower have water consumption similar to recirculating cooling technology. Overall,

15
cooling water consumption depends on targeted cooling temperature; this is true for a cooling pond or a
cooling tower. Because there are only few plants with once-through using a pond or a tower, and they all
have similar level of water consumption, they are aggregated with the recirculating cooling systems.
Table 4. Data Processing (EIA-923)
Number of thermal
power plants
Power generation in
2014 (TWh)
Original data 3,380 3,600
Data eliminated
- Plants without cooling technology information 2,510 237
- Plants with multiple cooling technologies 64 309
- Plants with multiple prime movers 198 546
- Erroneous data 59 234
Data used for analysis 549
(16%)
2,274
(63%)
2.3.3 Non-freshwater Use
In order to meet the cooling water demands in a limited water availability environment, alternative
water sources are considered. Thermal power plants do not necessarily have to use high-quality freshwater
for cooling purposes. The processed data show that many plants, which contribute 21% of the total reported
power generation, utilize non-freshwater (i.e., reclaimed water, brackish water, and saline water) for cooling.
Using non-freshwater leads to some technical design and operational issues such as corrosion, scaling, and
biofouling, which may require additional pretreatment to mitigate these challenges (Stillwell and Webber
2014; Satpathy et al. 2010). However, these measures cost about 1–2% of electricity revenue (Walker et al.
2012), while the economic feasibility largely depends on the distance between power plants and the water
sources, as well as the price of water when applicable (Stillwell and Webber 2014).
Based on the earlier definition of water consumption, thermoelectric power plants using reclaimed
water, brackish water, and saline water have zero fresh water consumption. It is expected that these
resources can reduce freshwater consumption significantly. Figure 6 shows the locations of power plants
which use non-freshwater for cooling, while the relative size of circles in the figure indicates amount of
power generation. Figure 6 shows that these power plants are mostly located along the coast due to easy
access to seawater. However, there are some inland power plants that use reclaimed water, especially where
freshwater resources are not sufficient.

16
Figure 6. Power Generation using Cooling Water from Reclaimed Water, Brackish Water, and Saline
Water
2.3.4 Regional Analysis
Electricity can be generated through various pathways; it may be generated from fossil or nuclear
sources, or through the conversion of water potential energy, solar, and wind energy. Because each region
has different electricity generation mix, electricity generation in the different region has different
environmental impacts. In the United States, the North American Electric Reliability Council (NERC)
utility regions typically represent bulk-power systems that are interconnected facilities and systems for
electricity energy transmission network and system reliability (16 US Code 8240) as shown in Figure 7.
Therefore, it is of interest to examine the WCFs for power generation by NERC region. There are eight
regional entities: (1) Midwest Reliability Organization (MRO), (2) Northeast Power Coordinating Council
(NPCC), (3) Reliability First Corporation (RFC), (4) SERC Reliability Corporation (SERC), (5) Southwest
Power Pool, RE (SPP), (6) Western Electricity Coordinating Council (WECC), (7) Florida Reliability
Coordinating Council (FRCC), and (8) Texas Reliability Entity (TRE).
It is expected that there are differences in water consumption in power plants by region, mainly
caused by different types of cooling systems and prime movers. Figure 8 shows the power generation share
by types of cooling technologies and prime movers for each NERC region. The WECC region, where water
availability is a major concern, mostly uses recirculating cooling systems.
The WCFs by NERC region can be estimated using two methods. First, the WCFs by cooling
technologies and prime movers can be estimated using the cooling technology shares for that region as
shown in Figure 8. However, when the actual water consumption and power generation data are available
by regional units, the WCFs can be calculated more accurately. Where data are available, the WCFs from
the actual values are used by default.
Reclaimed Water (Treated Wastewater)
Saline Water
Brackish Water

17
Figure 7. Geographic Coverage of NERC Region (US EPA 2016)
Figure 8. Power Generation Share by Cooling Technology for each NERC Region
0%
10%
20%
30%
40%
50%
60%
70%
80%
90%
100%
MRO NPCC RFC SERC SPP WECC FRCC TRE Nationalaverage
NERC Region US
Sh
are
by p
ow
er
ge
ne
rati
on
Dry Cooling
Cooling with towers (Combined Cycle)
Cooling with towers (Steam turbine)
Cooling with ponds (Combined Cycle)
Cooling with ponds (Steam turbine)
Once-through (No pond/tower)
18
3 Results and Discussions
3.1 WCFs of Hydroelectricity
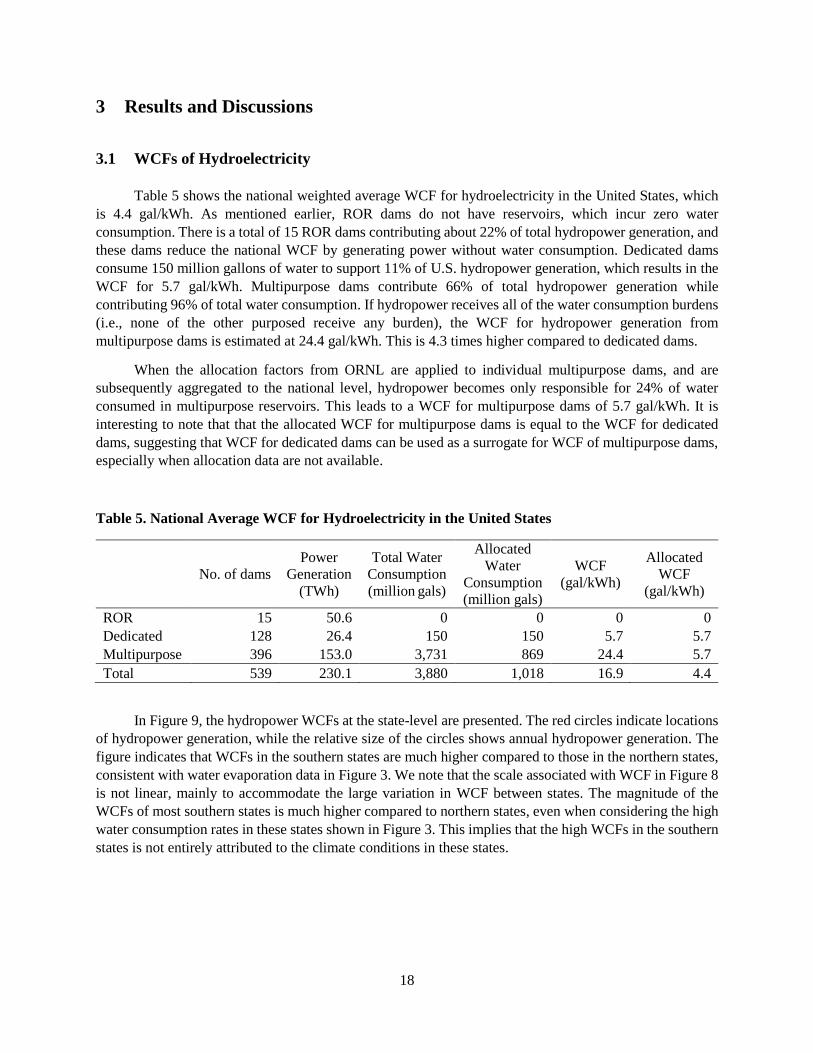
Table 5 shows the national weighted average WCF for hydroelectricity in the United States, which
is 4.4 gal/kWh. As mentioned earlier, ROR dams do not have reservoirs, which incur zero water
consumption. There is a total of 15 ROR dams contributing about 22% of total hydropower generation, and
these dams reduce the national WCF by generating power without water consumption. Dedicated dams
consume 150 million gallons of water to support 11% of U.S. hydropower generation, which results in the
WCF for 5.7 gal/kWh. Multipurpose dams contribute 66% of total hydropower generation while
contributing 96% of total water consumption. If hydropower receives all of the water consumption burdens
(i.e., none of the other purposed receive any burden), the WCF for hydropower generation from
multipurpose dams is estimated at 24.4 gal/kWh. This is 4.3 times higher compared to dedicated dams.
When the allocation factors from ORNL are applied to individual multipurpose dams, and are
subsequently aggregated to the national level, hydropower becomes only responsible for 24% of water
consumed in multipurpose reservoirs. This leads to a WCF for multipurpose dams of 5.7 gal/kWh. It is
interesting to note that that the allocated WCF for multipurpose dams is equal to the WCF for dedicated
dams, suggesting that WCF for dedicated dams can be used as a surrogate for WCF of multipurpose dams,
especially when allocation data are not available.
Table 5. National Average WCF for Hydroelectricity in the United States
No. of dams
Power
Generation
(TWh)
Total Water
Consumption
(million gals)
Allocated
Water
Consumption
(million gals)
WCF
(gal/kWh)
Allocated
WCF
(gal/kWh)
ROR 15 50.6 0 0 0 0
Dedicated 128 26.4 150 150 5.7 5.7
Multipurpose 396 153.0 3,731 869 24.4 5.7
Total 539 230.1 3,880 1,018 16.9 4.4
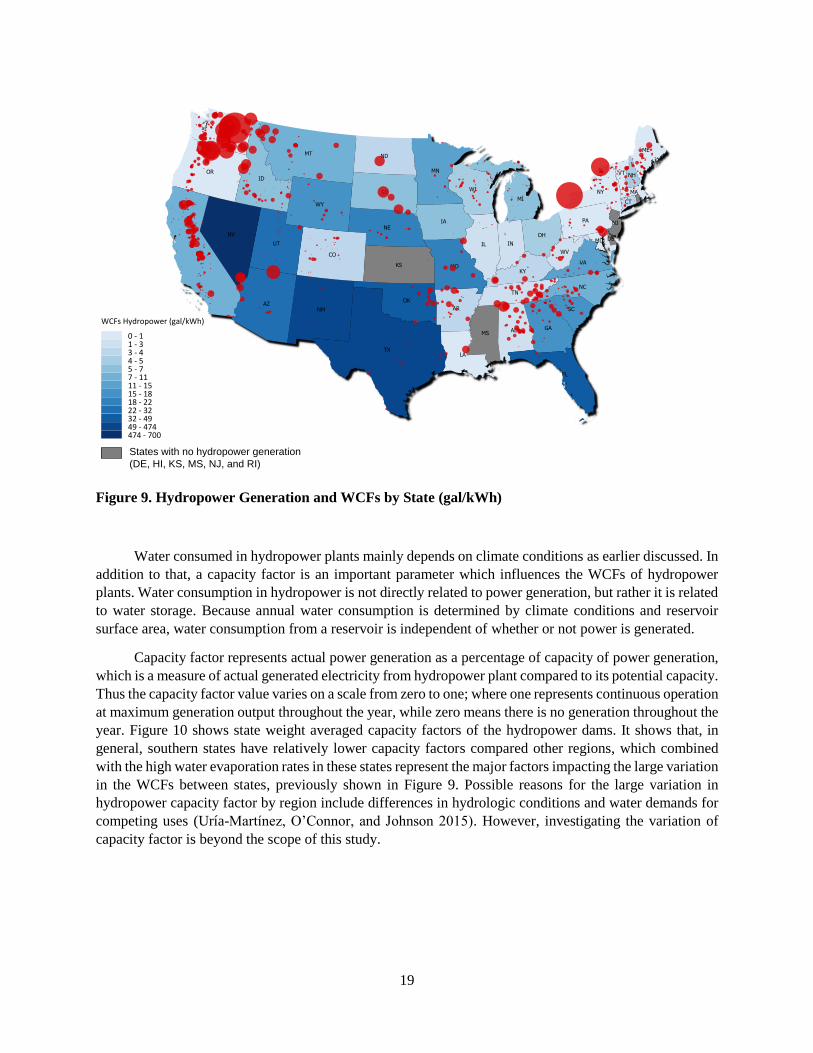
In Figure 9, the hydropower WCFs at the state-level are presented. The red circles indicate locations
of hydropower generation, while the relative size of the circles shows annual hydropower generation. The
figure indicates that WCFs in the southern states are much higher compared to those in the northern states,
consistent with water evaporation data in Figure 3. We note that the scale associated with WCF in Figure 8
is not linear, mainly to accommodate the large variation in WCF between states. The magnitude of the
WCFs of most southern states is much higher compared to northern states, even when considering the high
water consumption rates in these states shown in Figure 3. This implies that the high WCFs in the southern
states is not entirely attributed to the climate conditions in these states.
19
WCFs Hydropower (gal/kWh)
0 - 1 1 - 3 3 - 4 4 - 5 5 - 7 7 - 11 11 - 15 15 - 18 18 - 22 22 - 32 32 - 49 49 - 474 474 - 700
States with no hydropower generation
(DE, HI, KS, MS, NJ, and RI)
Figure 9. Hydropower Generation and WCFs by State (gal/kWh)
Water consumed in hydropower plants mainly depends on climate conditions as earlier discussed. In
addition to that, a capacity factor is an important parameter which influences the WCFs of hydropower
plants. Water consumption in hydropower is not directly related to power generation, but rather it is related
to water storage. Because annual water consumption is determined by climate conditions and reservoir
surface area, water consumption from a reservoir is independent of whether or not power is generated.
Capacity factor represents actual power generation as a percentage of capacity of power generation,
which is a measure of actual generated electricity from hydropower plant compared to its potential capacity.
Thus the capacity factor value varies on a scale from zero to one; where one represents continuous operation
at maximum generation output throughout the year, while zero means there is no generation throughout the
year. Figure 10 shows state weight averaged capacity factors of the hydropower dams. It shows that, in
general, southern states have relatively lower capacity factors compared other regions, which combined
with the high water evaporation rates in these states represent the major factors impacting the large variation
in the WCFs between states, previously shown in Figure 9. Possible reasons for the large variation in
hydropower capacity factor by region include differences in hydrologic conditions and water demands for
competing uses (Uría-Martínez, O’Connor, and Johnson 2015). However, investigating the variation of
capacity factor is beyond the scope of this study.

20
Capacity Factor 0.05 - 0.10 0.10 - 0.15 0.15 - 0.20 0.20 - 0.25 0.25 - 0.30 0.30 - 0.35 0.35 - 0.40 0.40 - 0.45 0.45 - 0.50 0.50 - 0.55 0.55 - 0.60 0.60 - 0.65 0.65 - 0.69
States with no hydropower generation
(DE, HI, KS, MS, NJ, and RI)
Figure 10. Capacity Factors of Hydroelectric Plants by State
Figure 11 shows the WCFs of hydroelectricity by NERC region. The light blue bars indicate the
WCFs for hydroelectricity, while the light gray bars represent water consumption allocated to all other
purposes. Similar to state-level data, Figure 10 shows that WCF for hydropower varies significantly by
NERC region. In particular, the WCFs for TRE and FRCC are much higher at 315 and 48 gal/kWh,
respectively, compared to other NERC regions. This is because these regions cover southern states where
water evaporation rates are high, and capacity factors are low.
Figure 11. WCFs for Hydropower by NERC Region
0
5
10
15
20
25
30
35
40
45
MRO NPCC RFC SERC SPP WECC FRCC TRE
Hyd
roele
ctr
icit
y W
CF
(g
al/
kW
h)
NERC Region
0
50
100
150
200
250
300
350
400
450↑
1487
↑
94Other Purposes
Hydropower

21
3.2 WCFs of Thermoelectricity
3.2.1 WCFs by Cooling Technologies and Prime Movers
Figure 12 shows the weighted average WCFs of six thermoelectricity generation categories based
on their cooling technologies and prime movers. Each WCF is calculated from total water consumption
divided by total power generation. The error bars indicate the distribution of WCF for each prime
mover/cooling technology combination, while the corresponding low end and the high end represent 25%
and 75% percentile, respectively. For the dry cooling and the once-through cooling without ponds and
towers, both the low end and the high end are all zero WCFs, which is why the error bars are not shown.
The gray bars indicate non-freshwater use which contribute power generation without water consumption.
Figure 12. WCFs by Cooling Technology and Prime Mover
First, we investigate the WCFs of thermoelectricity by prime movers. The power generation energy
efficiencies for conventional steam turbine and combined cycle plants are approximately 33% and 50%,
respectively. As mentioned earlier, thermal energy to be rejected per unit power generated mainly depends
on the power plant energy efficiency. Higher energy efficiency implies less waste energy, and thus less
cooling demand and less evaporation losses, and also implies increased power generation output. Combined,
less evaporation losses and more generated electricity work in the same direction of decreasing WCF.
Figure 12 shows this trend. For the recirculating cooling, WCF is not significantly impacted by whether
cooling ponds or cooling towers are employed as long as the prime mover is the same. For steam turbine
power plants, the WCFs are estimated at 0.52 and 0.60 gal/kWh for cooling with a pond and cooling with
a tower, respectively, while the WCFs for combined cycle plants are estimated at 0.24 and 0.23 gal/kWh,
for cooling with a pond and cooling with a tower, respectively.
Once-through cooling systems result in negligible water consumption, and most power plants
equipped the once-through cooling without ponds or towers usually report zero water consumption.
0.0
0.1
0.2
0.3
0.4
0.5
0.6
0.7
0.8
0.9
Steam Turbine Combined Cycle Steam Turbine Combined Cycle
Once-through(No Pond/Tower)
Cooling with Ponds Cooling with Towers Dry Cooling
We
igh
ted
Ave
rag
e W
CF
(g
al/
kW
h)
non-freshwater use
15% 10% 1% 48% 21% 5%
Share by Power Generation

22
However, 17 among 125 power plants in this category specified water consumption, which is why the WCF
for the once-through cooling is 0.03 gal/kWh, not exactly zero.
Note that, among power plants using non-freshwater in Figure 6, around 42% of their power
generation use once-through cooling without pond/tower. From a water consumption point of view, there
is no gain of using non-freshwater for these facilities because the WCF for the once-through without
pond/tower is negligible. On the other hand, power plants with a cooling tower or a pond reduce freshwater
consumption by the amount of non-freshwater use. Despite the fact that the recirculating systems consume
more water than the once-through cooling systems, it is inevitable to avoid shifting from once-through to
other types of cooling technologies due to regulations. Given this fact for granted, water consumption can
be reduced by increasing the efficiency of the power plants, or by using non-freshwater resources.
3.2.2 WCFs of Thermoelectricity by Region
Table 6 shows the aggregated water consumption and the power generation in thermal power plants
in the United States. The data used for this aggregation are based on data in Table 4. Table 6 shows that
power plants using freshwater for cooling represent 79% of total power generation, while dry cooling and
cooling with non-freshwater shares are 4% and 17%, respectively. When considering power generation
technologies that use only freshwater for cooling, their aggregate average WCF is estimated at 0.42 gal/kWh.
However, when dividing the annual fresh water consumption by the total annual power generation (using
freshwater and non-freshwater), the national average WCF for thermoelectricity becomes 0.33 gal/kWh.
Note that the WCF for power generation that uses cooling with non-freshwater is estimated at 0.20 gal/kWh,
which is mainly because of large use of once-through cooling along the coastline.
Table 6. National Average WCF for Thermoelectricity in the United States
No. of Plants Power
Generation
(TWh)
Water
Consumption
(billion gallons)
WCF
(gal/kWh)
Cooling with freshwater 403 1,806
(79%) 756 0.42
Dry cooling 36 87
(4%) 0 0
Cooling with non-freshwater 110 380
(17%) 76a 0.20a
Overall 549 2,274 756b 0.33b a non-freshwater use b freshwater use only
Figure 13 shows the regional differences in the WCFs of thermoelectricity by NERC region. The
main driver for these differences is the power generation technology shares in each region, provided in
Figure 8. The regions with high recirculating cooling share have higher WCF. For example, SPP has only
1.3% of once-through cooling without pond/tower by power generation, which is the lowest share of that
cooling technology among all NERC regions. Consequently, SPP has the highest WCF among all NERC
regions at 0.58 gal/kWh, without considering the gain in WCF from non-freshwater use. On the contrary,

23
NPCC has the highest share of once-through cooling without pond/tower, 57%, and thus has the lowest
WCF at 0.07 gal/kWh. Non-freshwater use reduces the WCF, especially for the regions located along the
coastline such as WECC and FRCC.
Table 7 shows the thermoelectricity WCFs by NERC region as calculated from the technology
shares in Figure 8 and the WCFs in Figure 12.
Figure 13. WCF for Thermoelectricity by NERC Region Calculated from Actual Water Use and
Power Generation Data
Table 7. WCF for Thermoelectricity by NERC Region Calculated from Technology Shares
MRO NPCC RFC SERC SPP WECC FRCC TRE US
Steam Turbine
Once-through no pond/tower 39% 92% 21% 35% 2% 10% 43% 1% 27%
Cooling with a pond 0% 0% 15% 4% 18% 6% 0% 68% 12%
Cooling with a tower 61% 8% 63% 61% 80% 82% 57% 31% 61%
Dry cooling 0% 0% 1% 0% 0% 3% 0% 0% 1%
Combined Cycle
Once-through no pond/tower 33% 8% 4% 0% 0% 0% 20% 1% 4%
Cooling with a pond 0% 0% 0% 7% 0% 0% 35% 1% 5%
Cooling with a tower 61% 51% 87% 90% 92% 76% 45% 93% 80%
Dry cooling 6% 41% 9% 3% 8% 24% 0% 5% 12%
Thermoelectricity WCF (gal/kWh)
Steam turbine 0.34 0.07 0.43 0.36 0.53 0.48 0.32 0.52 0.40
Combined cycle 0.12 0.10 0.16 0.18 0.17 0.14 0.17 0.17 0.16
0.0
0.1
0.2
0.3
0.4
0.5
0.6
MRO NPCC RFC SERC SPP WECC FRCC TRE Nationalaverage
NERC Region US
WC
F o
f T
herm
oe
lec
tric
ity (
gal/
kW
h)
Freshwater
Wastewater / Saline Water

24
3.3 WCFs for Electricity Generation
In order to calculate the WCF for total electricity generation, including thermos- and hydro-power
generation, the overall electricity generation technology mix should be considered. Table 8 shows the
electricity generation mix by NERC region in 2015 (EIA 2016). The WCFs of geothermal, wind, and solar
PV are set at 1.2, 0.001, and 0.045 gal/kWh, respectively (Lampert et al. 2015).
Table 8. Electricity Generation Mix by NERC Region in 2015 (EIA 2016)
Thermo-
electricity Hydropower Geothermal Wind Solar PV
NERC MRO 77% 5.2% 0% 18% 0% NPCC 83% 13% 0% 2% 0% RFC 96% 1.1% 0% 2% 0% SERC 96% 3.4% 0% 0% 0% SPP 82% 1.8% 0% 15% 0% WECC 66% 22% 2% 7% 3% FRCC 98% 0.7% 0% 0% 0% TRE 90% 0.2% 0% 10% 0%
US national average 87% 6.3% 0% 5% 1%
Figure 14 represents the overall electricity WCFs by NERC region, which is calculated by
multiplying the WCF for each generation type and the power generation share in the region. Due to its high
WCFs, hydropower generation significantly influences the overall WCFs despite its small power share. In
the United States, the aggregate average WCF for electricity generation is estimated at 0.58 gal/kWh, with
thermoelectricity and hydropower generation equally contributing to that WCF as shown in Figure 13. Note
that most hydroelectricity is generated where WCFs are low as shown in Figure 9. For TRE and FRCC with
much higher hydropower WCFs, their impact on WCF at the NERC regional level is limited due to the
small hydropower shares in these regions (0.3% and 0.7% for TRE and FRCC, respectively).
Figure 14. WCFs (gal/kWh) for Electricity Generation by NERC Region
0.0
0.1
0.2
0.3
0.4
0.5
0.6
0.7
0.8
0.9
1.0
MRO NPCC RFC SERC SPP WECC FRCC TRE Nationalaverage
NERC Region US
WC
F o
f E
lectr
icit
y (
gal/
kW
h)
Hydropower
Thermoelectricity
Others (geothermal/wind/solar)

25
4 Conclusions
In this study, the WCFs for electricity generation have been investigated. Water is critically
important for thermal power and hydropower generation, and they require large amount of water for their
operation. It has been found that WCF varies significantly by power generation technology, cooling
technology, and by region.
Our analysis estimated the national average WCF for electricity generation at 0.58 gal/kWh, with
equal contribution from thermoelectricity and hydropower generation, despite the much smaller share of
hydropower generation in the national average generation mix. In 2015, the thermoelectricity and
hydropower generation contribute 87% and 6.3% of total electricity generated in the United States,
respectively. The national average WCF for thermoelectricity generation is estimated at 0.33 gal/kWh,
while the corresponding WCF for hydropower generation is 4.4 gal/kWh.
For thermal power plants, the historic use of cooling technologies trends from once-through to
recirculating due to regulations of discharging water temperature. Considering that the recirculating cooling
involves higher water consumption compared to once-through cooling, alternative ways of cooling should
be considered. Dry cooling and non-freshwater are alternatives to the conventional cooling technologies as
they do not involve freshwater consumption for power generation. While hydropower is regarded as non-
polluting generation technology, it may result in significant water loss to evaporation if reservoirs are
employed, especially in regions where evaporation rates are high and the generation capacity factor is low.
In this study, increasing the number of purposes served by a dam/reservoir results in reduced water
consumption burden on hydropower by allocating a portion of the water evaporation to the other purposes.
However, the allocation method is a source of uncertainty and requires further investigation.

26
References
Army Corps of Engineers. 2010. “National Inventory of Dams.”
http://nid.usace.army.mil/cm_apex/f?p=838:12:22313203279474.
Audubon. 2016. “Cutler Reservoir and Marsh UT08.” Audubon. September 12.
http://www.audubon.org/important-bird-areas/cutler-reservoir-and-marsh-ut08.
Bakken, Tor Haakon, \AAnund Killingtveit, Kolbjørn Engeland, Knut Alfredsen, and Atle Harby. 2013.
“Water Consumption from Hydropower Plants–review of Published Estimates and an Assessment
of the Concept.” https://brage.bibsys.no/xmlui/handle/11250/2357855.
Bakken, Tor Haakon, Ingunn Saur Modahl, Hanne Lerche Raadal, Ana Adeva Bustos, and Silje Arnøy.
2016. “Allocation of Water Consumption in Multipurpose Reservoirs.” Water Policy,
wp2016009.
Bartos, Matthew D., and Mikhail V. Chester. 2015. “Impacts of Climate Change on Electric Power
Supply in the Western United States.” Nature Climate Change 5 (8): 748–52.
doi:10.1038/nclimate2648.
Burnett, Kimberly, Richard Howitt, James A. Roumasset, and Christopher A. Wada. 2014. Routledge
Handbook of Water Economics and Institutions. Routledge.
Christian-Smith, Juliet, Morgan Levy, Peter H. Gleick, Nancy Ross, and Paula Luu. 2011. Impacts of the
California Drought from 2007 to 2009. Pacific Institute Oakland, CA.
http://www2.pacinst.org/wp-content/uploads/2013/02/ca_drought_impacts_full_report.pdf.
Desert Research Institute (DRI). 2016. “Western Regional Climate Center.”
http://www.wrcc.dri.edu/htmlfiles/westevap.final.html.
Diehl, Timothy H., and Melissa A. Harris. 2014. “Withdrawal and Consumption of Water by
Thermoelectric Power Plants in the United States, 2010.” USGS Numbered Series 2014–5184.
Scientific Investigations Report. Reston, VA: U.S. Geological Survey.
http://pubs.er.usgs.gov/publication/sir20145184.
Diehl, Timothy H., Melissa A. Harris, Jennifer C. Murphy, Susan S. Hutson, and David E. Ladd. 2013.
“Methods for Estimating Water Consumption for Thermoelectric Power Plants in the United
States.” 2013–5188. Reston, VA: USGS. http://dx.doi.org/10.3133/sir20135188.
Edenhofer, Ottmar, Ramon Pichs-Madruga, Youba Sokona, Kristin Seyboth, Patrick Matschoss, Susanne
Kadner, Timm Zwickel, et al. 2011. “IPCC Special Report on Renewable Energy Sources and
Climate Change Mitigation.” Prepared By Working Group III of the Intergovernmental Panel on
Climate Change, Cambridge University Press, Cambridge, UK.
http://www.economicpolicyresearch.org/images/docs/SCEPA_blog/economics_of_climate_chang
e/Edenhofer_Presentation_Sept_2011_Compatibility_Mode.pdf.
EIA (U.S. Energy Information Administration). 2015a. “EIA 860.”
https://www.eia.gov/electricity/data/eia860/.
EIA. 2015b. “EIA 923.” https://www.eia.gov/electricity/data/eia923/.
EIA. 2016. “Annual Energy Outlook 2016.” DOE/EIA-0383(2015). http://www.eia.gov/forecasts/aeo/.
Energy and Environmental Affaris. 2016. “MassParks.” Energy and Environmental Affairs.
http://www.mass.gov/eea/agencies/dcr/massparks/.
Farnsworth, Richard K., and Edwin S. Thompson. 1983. Mean Monthly, Seasonal, and Annual Pan
Evaporation for the United States. US Department of Commerce, National Oceanic and
Atmospheric Administration, National Weather Service.
http://www.dynsystem.com/NetSTORM/docs/NWS34EvapTables.pdf.
Federal Energy Regulatory Commission. 2006. Lewis River Hydroelectric Projects: Environmental
Impact Statement.
Fthenakis, Vasilis, and Hyung Chul Kim. 2010. “Life-Cycle Uses of Water in U.S. Electricity
Generation.” Renewable and Sustainable Energy Reviews 14 (7): 2039–48.
doi:10.1016/j.rser.2010.03.008.

27
Gleick, Peter H., and others. 1993. Water in Crisis: A Guide to the World’s Fresh Water Resources.
Oxford University Press, Inc. http://www.cabdirect.org/abstracts/19941904398.html.
Hadjerioua, Boualem, Yaxing Wei, and Shih-Chieh Kao. 2012. “An Assessment of Energy Potential at
Non-Powered Dams in the United States.”
http://www.energy.gov/sites/prod/files/2013/12/f5/npd_report_0.pdf.
Hadjerioua, Boualem, Adam M. Witt, Kevin M. Stewart, Marisol Bonnet Acosta, and Miles Mobley.
2015. “The Economic Benefits of Multipurpose Reservoirs in the United States- Federal
Hydropower Fleet.” ORNL/TM--2015/550. Oak Ridge National Laboratory (ORNL), Oak Ridge,
TN (United States). http://www.osti.gov/scitech/biblio/1237622.
Kimmell, T. A., and J. A. Veil. 2009. “Impact of Drought on US Steam Electric Power Plant Cooling
Water Intakes and Related Water Resource Management Issues.” Argonne National Laboratory
(ANL). http://www.osti.gov/scitech/biblio/951252.
Lake Summit Property Owners Association. 2016. “LakeSummitOnline.com - North Carolina.” Accessed
October 1. http://www.lakesummitonline.com/.
Lakes Online. 2016. “Lakes Online.” Accessed October 1. http://www.lakesonline.com/.
Lampert, David J., Hao Cai, Zhichao Wang, Jennifer Keisman, May Wu, Jeongwoo Han, Jennifer Dunn,
John L. Sullivan, Amgad Elgowainy, and Michael Wang. 2015. “Development of a Life Cycle
Inventory of Water Consumption Associated with the Production of Transportation Fuels.”
Argonne National Laboratory (ANL). http://www.osti.gov/scitech/biblio/1224980.
LeCornu, Jacques. 1998. “Dams and Water Management.” In Report of the Secretary General,
International Commission on Large Dams to the Conférence Internationale Eau et
Développement Durable, 19–21.
Macknick, Jordan, Robin Newmark, Garvin Heath, and K. C. Hallett. 2011. “A Review of Operational
Water Consumption and Withdrawal Factors for Electricity Generating Technologies.” Contract
303: 275–3000.
Maupin, Molly A., Joan F. Kenny, Susan S. Hutson, John K. Lovelace, Nancy L. Barber, and Kristin S.
Linsey. 2014. “Estimated Use of Water in the United States in 2010.” USGS Numbered Series
1405. Circular. Reston, VA: U.S. Geological Survey. http://pubs.er.usgs.gov/publication/cir1405.
Mekonnen, Mesfin M., P. W. Gerbens-Leenes, and Arjen Y. Hoekstra. 2015. “The Consumptive Water
Footprint of Electricity and Heat: A Global Assessment.” Environ. Sci.: Water Res. Technol. 1
(3): 285–97. doi:10.1039/C5EW00026B.
Mielke, Erik, Laura Diaz Anadon, and Venkatesh Narayanamurti. 2010. “Water Consumption of Energy
Resource Extraction, Processing, and Conversion.” Belfer Center for Science and International
Affairs. http://live.belfercenter.org/files/ETIP-DP-2010-15-final-2.pdf.
Minnesota Department of Natural Resources. 2016. “Lake Zumbro: Minnesota DNR.” Accessed October
1. http://www.dnr.state.mn.us/areas/fisheries/lakecity/lakezumbro.html.
National Oceanic and Atmospheric Administration (NOAA). 2016. “National Centers for Environmental
Information (NCEI).” https://www.ncdc.noaa.gov/ghcn/comparative-climatic-data.
National Park Service. 2011. Ross Lake National Recreation Area.
National Weather Service. 2016. “National Weather Service Climate Prediction Center - U.S. Evaporation
Data.” National Weather Service.
http://www.cpc.ncep.noaa.gov/products/GIS/GIS_DATA/JAWF/.
New York Power Authority. 2016. “Niagara Power Plant.” Accessed October 1.
http://www.nypa.gov/facilities/niagara.htm.
Pasqualetti, Martin J., and Scott Kelley. 2008. “The Water Costs of Electricity in Arizona.” Arizona
Department of Water Resources, Phoenix.
Qaddumi, Halla Maher, Eric Dickson, Carolina Pizarro, Brian Blankespoor, Vahid Alavian, Alexander V.
Danilenko, Rafik Fatehali Hirji, Gabrielle Puz, Michael Jacobsen, and Sylvia Michele Diez. 2009.
“Water and Climate Change : Understanding the Risks and Making Climate-Smart Investment
Decisions.” 52911. The World Bank.

28
http://documents.worldbank.org/curated/en/2009/11/11717870/water-climate-change-
understanding-risks-making-climate-smart-investment-decisions.
Recreation.gov. 2016. “Turquoise Lake.” Accessed October 1.
http://www.recreation.gov/recreationalAreaDetails.do?contractCode=NRSO&recAreaId=92.
Sanford, Ward E., and David L. Selnick. 2013. “Estimation of Evapotranspiration Across the
Conterminous United States Using a Regression With Climate and Land-Cover Data1.” JAWRA
Journal of the American Water Resources Association 49 (1): 217–30. doi:10.1111/jawr.12010.
Satpathy, Kamala Kanta, Ajit Kumar, Gouri Sahu, Sudipta Biswas, and Selvanayagam M. 2010.
“Biofouling and Its Control in Seawater Cooled Power Plant Cooling Water System - A Review.”
In Nuclear Power, edited by Pavel Tsvetkov. Sciyo. http://www.intechopen.com/books/nuclear-
power/biofouling-and-its-control-in-seawater-cooled-power-plant-cooling-water-system-a-
review-.
Seager, Richard, Mingfang Ting, Cuihua Li, Naomi Naik, Ben Cook, Jennifer Nakamura, and Haibo Liu.
2013. “Projections of Declining Surface-Water Availability for the Southwestern United States.”
Nature Climate Change 3 (5): 482–86. doi:10.1038/nclimate1787.
Stillwell, Ashlynn S., and Michael E. Webber. 2014. “Geographic, Technologic, and Economic Analysis
of Using Reclaimed Water for Thermoelectric Power Plant Cooling.” Environmental Science &
Technology 48 (8): 4588–4595.
Torcellini, Paul A., Nicholas Long, Ron Judkoff, and others. 2003. Consumptive Water Use for US Power
Production. National Renewable Energy Laboratory Golden, CO.
http://www.nrel.gov/docs/fy04osti/35190.pdf.
Uría-Martínez, Rocío, Patrick W. O’Connor, and Megan M. Johnson. 2015. “2014 Hydropower Market
Report.” Oak Ridge National Laboratory. http://www.osti.gov/scitech/biblio/1220552.
US Environmental Protection Agency (USEPA). 2015. “Emissions & Generation Resource Integrated
Database (eGRID) 2012.” https://www.epa.gov/energy/egrid.
US EPA. 2016. “NERC Region Representational Map.” Data and Tools. Accessed October 1.
https://www.epa.gov/energy/nerc-region-representational-map.
USBR, and USACE. 2001. “The Columbia River System Inside Story.”
https://www.bpa.gov/power/pg/columbia_river_inside_story.pdf.
van Vliet, Michelle T. H., John R. Yearsley, Fulco Ludwig, Stefan Vögele, Dennis P. Lettenmaier, and
Pavel Kabat. 2012. “Vulnerability of US and European Electricity Supply to Climate Change.”
Nature Climate Change 2 (9): 676–81. doi:10.1038/nclimate1546.
Walker, Michael E., Iman Safari, Ranjani B. Theregowda, Ming-Kai Hsieh, Javad Abbasian, Hamid
Arastoopour, David A. Dzombak, and David C. Miller. 2012. “Economic Impact of Condenser
Fouling in Existing Thermoelectric Power Plants.” Energy, Integration and Energy System
Engineering, European Symposium on Computer-Aided Process Engineering 2011, 44 (1): 429–
37. doi:10.1016/j.energy.2012.06.010.