Water Chemistry and Plant Performance · Water Chemistry and Plant Performance. 2. Water Chemistry...
32
Plant Operations and Laboratory Analysis Specialty Workshop Water Environment Association Preserving & Enhancing Ohio’s Water Environment September 1, 2010 Dan Miklos Water Chemistry and Plant Performance
Transcript of Water Chemistry and Plant Performance · Water Chemistry and Plant Performance. 2. Water Chemistry...

1File
loca
tion
nam
e he
re.p
pt
Plant Operations and Laboratory AnalysisSpecialty Workshop
Water Environment Association
Preserving & EnhancingOhio’s Water Environment
September 1, 2010Dan Miklos
Water Chemistry and Plant Performance

2
Water Chemistry and Plant PerformanceAgenda
1. Introduction
2. What is the difference between pH and Alkalinity
3. Case Study – Turkey Processor
• Loss of nitrification due to loss of viable biology
• Mass Balance problems with inerts
• Sludge Quality as a function of inerts
4. Questions

3
What is the difference between alkalinity and pH?
4
pH and Alkalinity
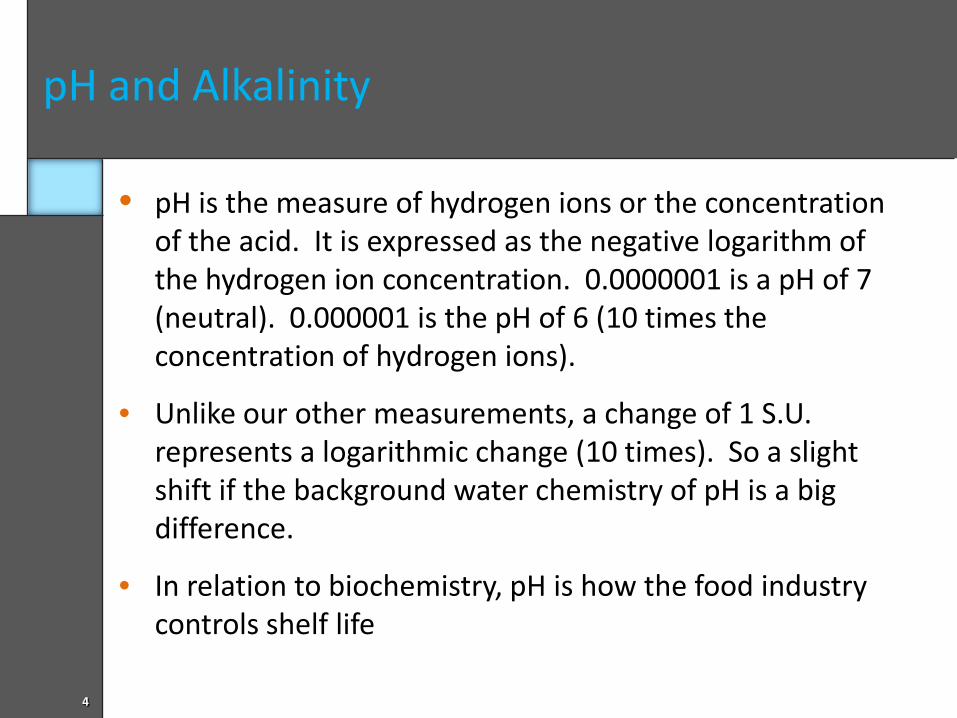
• pH is the measure of hydrogen ions or the concentration of the acid. It is expressed as the negative logarithm of the hydrogen ion concentration. 0.0000001 is a pH of 7 (neutral). 0.000001 is the pH of 6 (10 times the concentration of hydrogen ions).
• Unlike our other measurements, a change of 1 S.U. represents a logarithmic change (10 times). So a slight shift if the background water chemistry of pH is a big difference.
• In relation to biochemistry, pH is how the food industry controls shelf life
5
pH and Alkalinity
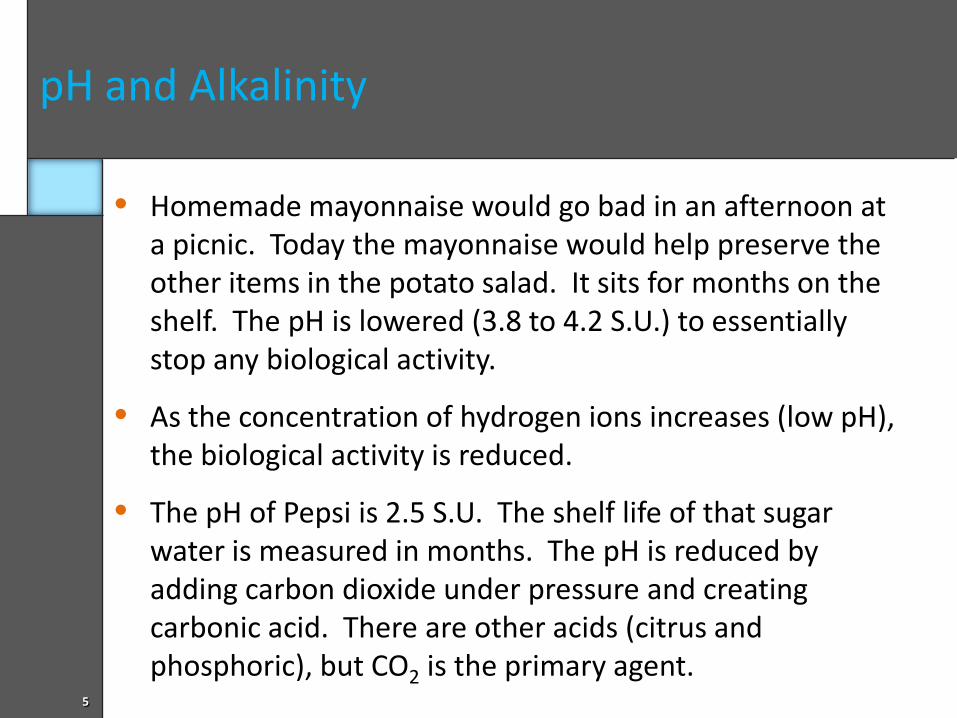
• Homemade mayonnaise would go bad in an afternoon at a picnic. Today the mayonnaise would help preserve the other items in the potato salad. It sits for months on the shelf. The pH is lowered (3.8 to 4.2 S.U.) to essentially stop any biological activity.
• As the concentration of hydrogen ions increases (low pH), the biological activity is reduced.
• The pH of Pepsi is 2.5 S.U. The shelf life of that sugar water is measured in months. The pH is reduced by adding carbon dioxide under pressure and creating carbonic acid. There are other acids (citrus and phosphoric), but CO2 is the primary agent.

6
pH and Alkalinity
• The carbon dioxide is under pressure and forms a very unstable solution. As you release the pressure and allow the pressure to reach atmosphere, the CO2 comes out of solution and the pH shifts.
• As the CO2 changes to a gas due to the drop in pressure (fizzes), the pH increases.
• As we add more pressure, more of the CO2 dissolves into solution and the pH is lowered as more carbonic acid (H2CO3) is formed.
CO2 + H2O --> H2CO3
• Henry’s Law governs these reactions.

7
Henry’s Law
• The solubility of a gas in a liquid depends on
• temperature,
• the partial pressure of the gas over the liquid,
• the nature of the solvent (water in our case), and
• the nature of the gas (carbon dioxide in the Pepsi example)
• Another example is temperature and oxygen solubility in water. Lower temperature – more dissolved oxygen. Higher temperature – lower dissolved oxygen. Colder water makes for better trout streams.
8
Henry’s Law
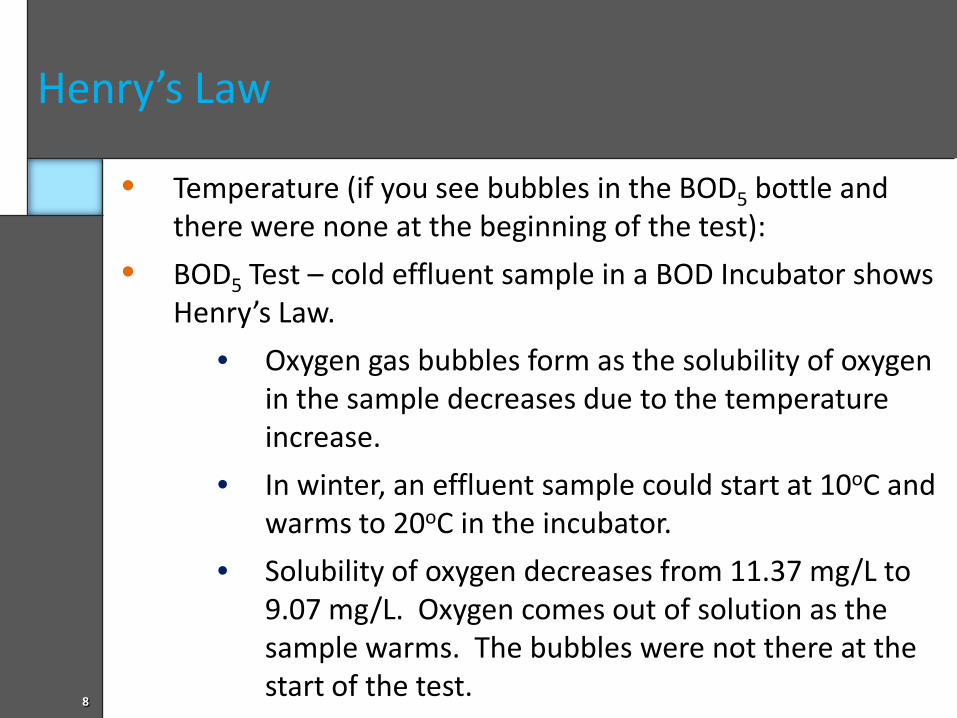
• Temperature (if you see bubbles in the BOD5 bottle and there were none at the beginning of the test):
• BOD5 Test – cold effluent sample in a BOD Incubator shows Henry’s Law.
• Oxygen gas bubbles form as the solubility of oxygen in the sample decreases due to the temperature increase.
• In winter, an effluent sample could start at 10oC and warms to 20oC in the incubator.
• Solubility of oxygen decreases from 11.37 mg/L to 9.07 mg/L. Oxygen comes out of solution as the sample warms. The bubbles were not there at the start of the test.

9
Henry’s Law
• The solubility of a gas solubility is also limited by the equilibrium between the gas and a saturated solution of the gas. The dissolved gas will always follow Henry's law.
• The concentration of dissolved gas depends on the partial pressure of the gas. The partial pressure controls the number of gas molecule collisions with the surface of the solution. If the partial pressure is doubled the number of collisions with the surface will double. The increased number of collisions produces more dissolved gas (Pepsi under pressure).
• Partial pressure is a function of gas pressure and gas concentration.

10
Henry’s Law
• Carbon dioxide is at approximately 380 mg/L in the atmosphere (increasing about 1 mg/L each year). Oxygen in comparison is 209,500 ppm (21%).
• In a pure oxygen plant, for example, you add close to 100% oxygen or 5 times the oxygen in the atmosphere. As a result, pure oxygen plants can have dissolved oxygen levels of 20 mg/L in the MLSS or 40 mg/L in the effluent. Pure oxygen plants have “decks” and actually create a pressurized gas space.

11
pH and Alkalinity
• Alkalinity is a measure of the water’s capacity to neutralize an acid, or H+ ions, thereby keeping the pH at a fairly constant level.
• Do not confuse this with our term alkaline substance (meaning basic or higher than neutral pH). A basic substance would have a high concentration of OH- ions.
• Alkalinity is reported in units of mg/L CaCO3, because the carbonate ion, CO3
2–, is its primary constituent.

12
pH and Alkalinity
• Alkalinity is measured by titrating a water sample with sulfuric acid. The Vernier pH System is used to monitor pH during the titration. The equivalence point will be at a pH of approximately 4.5. The volume of sulfuric acid added at the equivalence point of the titration is then used to calculate the alkalinity of the water.
• One problem is total alkalinity is misleading.
• We titrate to 4.5 S.U. Alkalinity that is available at that low of a pH is not available to our biology. So we can have “left over” alkalinity, but alkalinity is still limiting the process.
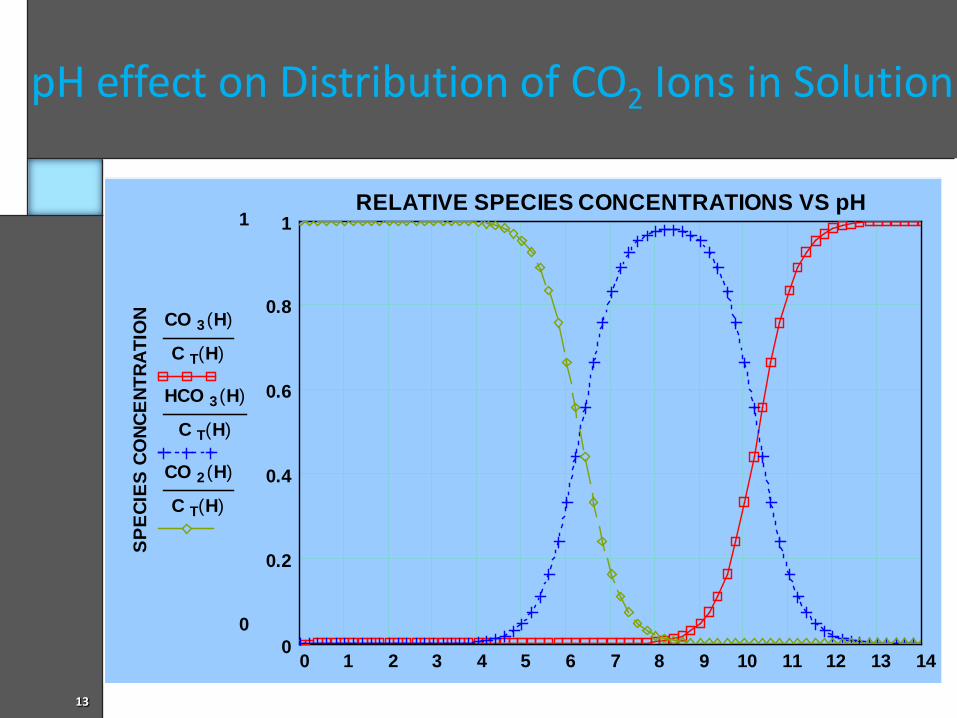
• Looking at the graph, bicarbonate alkalinity, is available in our biology’s pH range.
13
pH effect on Distribution of CO2 Ions in Solution
0 1 2 3 4 5 6 7 8 9 10 11 12 13 140
0.2
0.4
0.6
0.8
1RELATIVE SPECIES CONCENTRATIONS VS pH
SP
EC
IES
CO
NC
EN
TRA
TIO
N
1
0
CO 3 H( )
C T H( )
HCO 3 H( )
C T H( )
CO 2 H( )
C T H( )
14
Process Control is Hard Work!!
15
Restoring Alkalinity for Nitrification
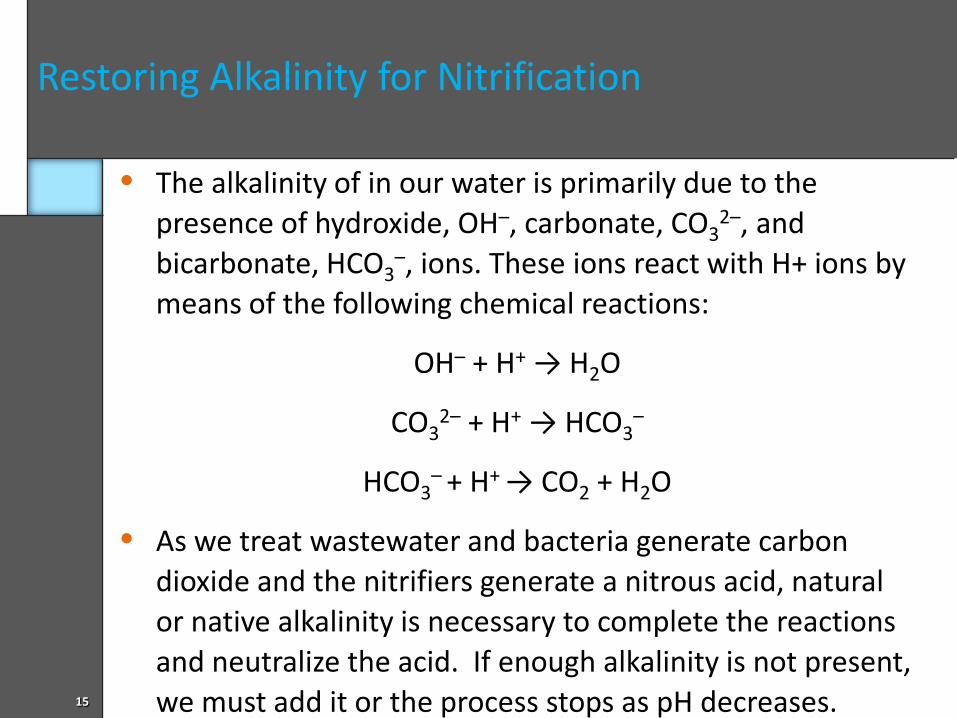
• The alkalinity of in our water is primarily due to the presence of hydroxide, OH–, carbonate, CO3
2–, and bicarbonate, HCO3
–, ions. These ions react with H+ ions by means of the following chemical reactions:
OH– + H+ → H2O
CO32– + H+ → HCO3
–
HCO3– + H+ → CO2 + H2O
• As we treat wastewater and bacteria generate carbon dioxide and the nitrifiers generate a nitrous acid, natural or native alkalinity is necessary to complete the reactions and neutralize the acid. If enough alkalinity is not present, we must add it or the process stops as pH decreases.
16
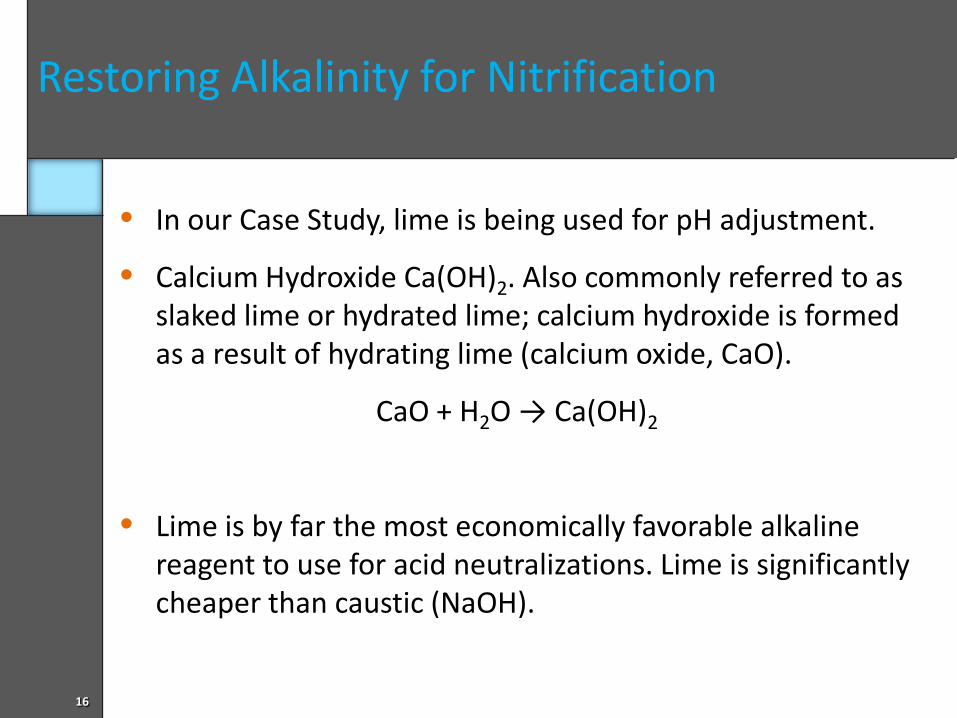
• In our Case Study, lime is being used for pH adjustment.
• Calcium Hydroxide Ca(OH)2. Also commonly referred to as slaked lime or hydrated lime; calcium hydroxide is formed as a result of hydrating lime (calcium oxide, CaO).
CaO + H2O → Ca(OH)2
• Lime is by far the most economically favorable alkaline reagent to use for acid neutralizations. Lime is significantly cheaper than caustic (NaOH).
Restoring Alkalinity for Nitrification

17
• Lime is very basic and the hydroxide ion removes the hydrogen ion (acid) in solution in the plant and raises the pH.
• The free calcium ions also react with the excess carbon dioxide and form an insoluble milky product, calcium carbonate.
• Enough lime has to be added to restore the alkalinity for 200 mg/L of ammonia oxidation. Remember, 7.14 mg/L of alkalinity is required for every mg/L of ammonia oxidized.
• In addition, we have carbon dioxide (carbonic acid) from respiration that also must be neutralized.
Restoring Alkalinity for Nitrification

18
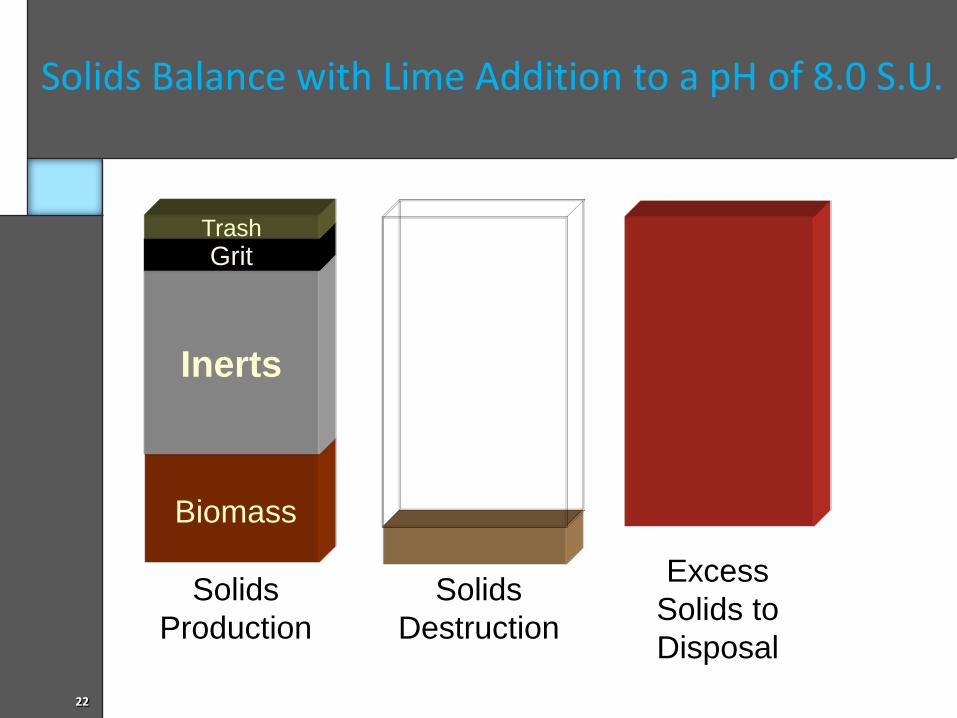
• If too much lime is added, a significant amount of insoluble calcium carbonate is formed. Those inert solids become incorporated in the MLSS and begin to crowd out the biology.
• In our Case Study, lime is used to support nitrification.
• The direct discharger believed raising the pH to 8.0 S.U. would improve nitrification (anaerobic reactor COD reduction resulted in a reduced carbon load but a relatively high ammonia loading).
• Nitrification was a noncompliance issue as a single aerobic reactor was used for full nitrification. Influent ammonia was reduced from a concentration of 200 mg/L to less than 1 mg/L in the effluent (when in compliance).
Case Study – Turkey Processor

19
• Based on a consultant’s recommendation, the pH was increased based on the “literature” stating the nitrification rate increases with an increase in pH just north of 8.0 S.U.
• Mixed liquor suspended solids were maintained within target MCRT values as was typical for the facility (why not? the nitrification rate was going to increase as the pH increased).
• The end result, nitrification was lost as the nitrifying population was crowded out by inerts solids (calcium carbonate moving out of solution as pH increased).
• An example of the solids balance is shown on the next slides.
Mixed Liquor Suspended Solids as Biomass

20
I Wonder How Much of that MLSS is Biomass?
21
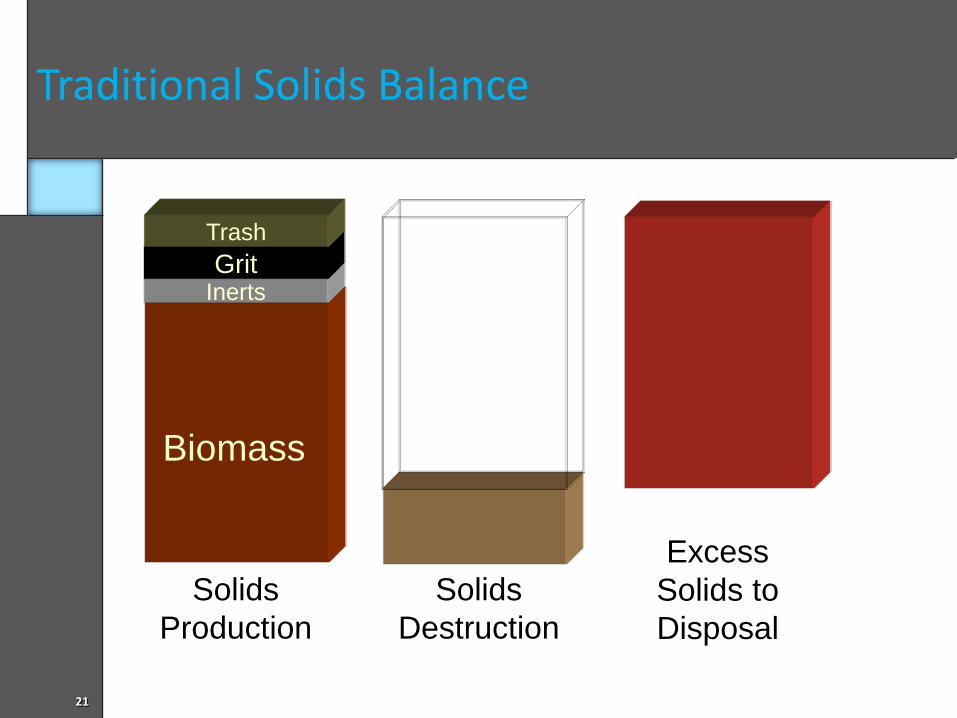
Traditional Solids Balance
Inerts
Solids Production
Grit
Solids Destruction
Biomass
Trash
Excess Solids to Disposal
22
Solids Balance with Lime Addition to a pH of 8.0 S.U.
Inerts
Solids Production
Grit
Solids Destruction
Biomass
Trash
Excess Solids to Disposal
23
• Other industrial plants have similar problems. In the paper industry, rather than inerts (trash or paper fiber) is a non biological solid that crowds out the biology.
• Significant levels of trash will be oxidized at 550 degrees. Paper mill wastewater operations actually uses increasing volatile solids concentrations as an indication of “lowering of viability”.
• Most mills in our region are recycle mills where spent fiber and starch is discharged to the wastewater treatment facility. Primary settling with chemical addition is the first line of defense for excess paper fiber loading.
• In the cases of the paper mill, if volatile solids show an increase, it means less biology is available in the MLSS
Inert Suspended Solids versus Biomass

24
Solids Balance with Spent Fiber Loading
Inerts
Solids Production
Grit
Solids Destruction
Biomass
Trash
Excess Solids to Disposal
25
• Structural Water (water of hydration) examples:
• Calcium Carbonate (CaCO3 * 6 H2O) – 52% water. Water starts leaving at 101oC and is gone by 220oC. Much of the solids in our Case Study example would have tested as volatile solids even though they could be inert solids. It does not have to be trash to burn.
• Concrete – based on curing (water loss), will show approximately 38% water loss (volatile solids) when raised from 103oC to 550oC.
Volatile Suspended Solids as Biomass for the Case Study?

26
• Options for analysis if it is necessary to compensate for volatile suspended solids test inaccuracy
• Nitrogen content of solids can be used to back calculate the maximum amount of biological solids possible (divide result by 12.5% - the nitrogen content of cells) .
• If nitrogen containing compounds such as polymer are used, nitrogen can be a little misleading.
• Carbon can be used to back calculate the maximum biological population potential (divide result by 50% - the carbon content of cells).
Volatile Suspended Solids as Biomass?

27
I smell nitrification problems
I wish he wouldn’t do that…

28
• Since calcium carbonate solubility is primarily a function of calcium hardness, pH, alkalinity and water temperature; those four (4) variables were analyzed and compared to effluent quality.
• A solubility or precipitation index was applied that is typically used in drinking water treatment operations. The Langelier Saturation Index (LSI) is typically used as a method of determining corrosive or scaling water chemistry.
• In the Case Study application , the LSI was applied assuming there was some slight interference from total dissolved solids and other ionic particles, but the LSI tracked losses in nitrification.
Using Calcium Carbonate Solubility to Control Nitrification

29
Figure 4 - 9Langelier Saturation Index versus Effluent NH3
0.00
10.00
20.00
30.00
40.00
50.00
60.00
6/30/2
009
7/7/200
9
7/14/2
009
7/21/2
009
7/28/2
009
8/4/200
9
8/11/2
009
8/18/2
009
8/25/2
009
9/1/200
9
9/8/200
9
9/15/2
009
9/22/2
009
9/29/2
009
10/6/
2009
10/13
/2009
Efflu
ent N
H3
mg/
L
-3.00
-2.40
-1.80
-1.20
-0.60
0.00
0.60
1.20
1.80
Lang
elie
r Sat
urat
ion
Inde
x
NH3 Index

30
• Since calcium carbonate solubility loads the MLSS with fine inerts with a high specific gravity and dense structure, the MLSS settling is affected.
• The result is like adding sand to feathers. As expected, as the insolubility of the calcium carbonate increased, the settling rate increased (the SVI decreased).
• The graph shows settling correlates closely to the MLSS pH (5 minute and 30 minute settling).
• As biological viability increases, the SVI increases and settling slows.
Using Calcium Carbonate Solubility to Control Settling?

31
Figure 4 - 8Langelier Saturation Index versus Settling
0100200300400500600700800900
1000
6/30/2
009
7/7/200
9
7/14/2
009
7/21/2
009
7/28/2
009
8/4/200
9
8/11/2
009
8/18/2
009
8/25/2
009
9/1/200
9
9/8/200
9
9/15/2
009
9/22/2
009
9/29/2
009
10/6/
2009
10/13
/2009
SSV
-3.50
-2.50
-1.50
-0.50
0.50
1.50
2.50
Lang
elie
r Ind
ex
SSV-5 SSV-30 Index

32
Questions????