Water-chemistry and on-site sulfur-speciation data for selected springs
40
U.S. Department of the Interior U.S. Geological Survey Water-Chemistry and On-Site Sulfur- Speciation Data for Selected Springs in Yellowstone National Park, Wyoming, 1994-1995 Open-File Report 98-574
-
Upload
hoangnguyet -
Category
Documents
-
view
218 -
download
0
Transcript of Water-chemistry and on-site sulfur-speciation data for selected springs
U.S. Department of the InteriorU.S. Geological Survey
Water-Chemistry and On-Site Sulfur-Speciation Data for Selected Springs inYellowstone National Park, Wyoming,1994-1995
Open-File Report 98-574
U.S. Department of the InteriorU.S. Geological Survey
Water-Chemistry and On-Site Sulfur-Speciation Data for SelectedSprings in Yellowstone National Park, Wyoming, 1994-1995
By James W. Ball1, D. Kirk Nordstrom1, Kirk M. Cunningham1, Martin A. A. Schoonen2, Yong Xu2,and Jennifer M. DeMonge3
1U.S. Geological Survey2Department of Earth and Space Sciences, State University of New York at Stony Brook3Department of Geology, University of Montana
Open-File Report 98-574
Boulder, Colorado1998
Revised and reprinted, April 2001

U.S. DEPARTMENT OF THE INTERIORBRUCE BABBITT, Secretary
U.S. GEOLOGICAL SURVEYThomas J. Casadevall, Acting Director
The use of firm, trade, and brand names in this report is for identification purposes only and doesnot constitute endorsement by the U.S. Geological Survey.
For additional information write to: Copies of this report can be purchased from:
Chief, Branch of Regional Research U.S. Geological SurveyU.S. Geological Survey Branch of Information ServicesDenver Federal Center Denver Federal Center,Box 25046, MS-418 Box 25286Denver, Colorado 80225 Denver, Colorado 80225-0286
iii
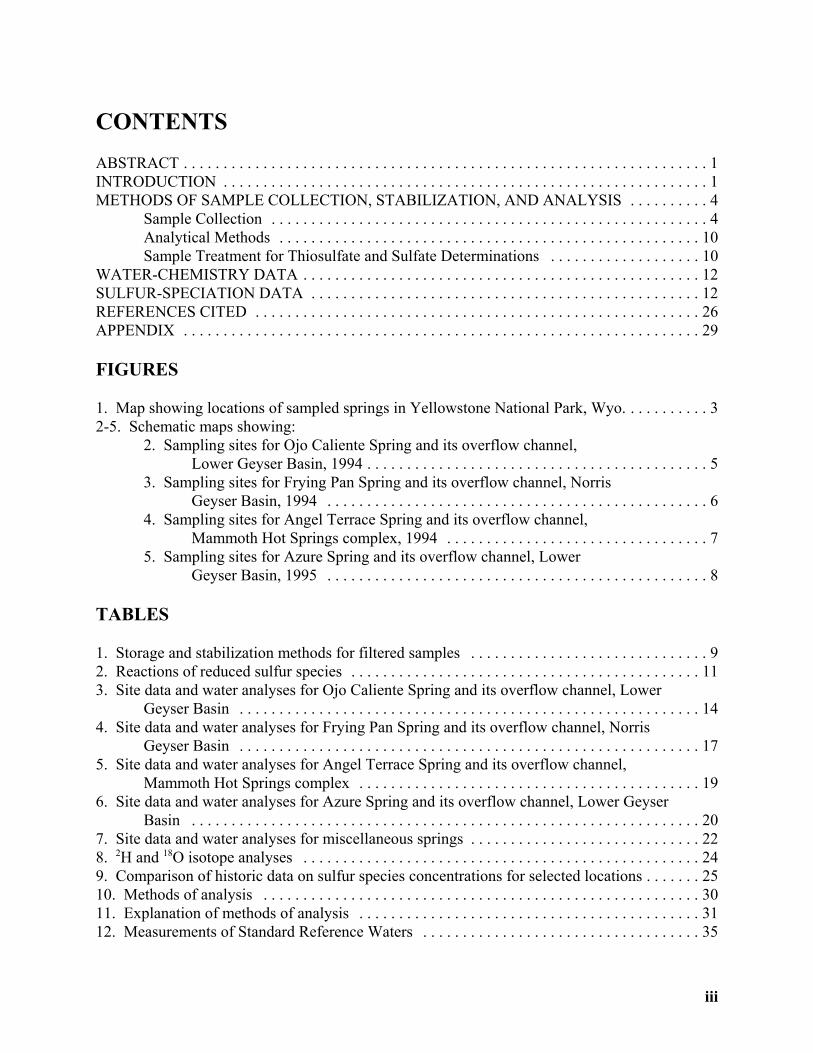
CONTENTSABSTRACT . . . . . . . . . . . . . . . . . . . . . . . . . . . . . . . . . . . . . . . . . . . . . . . . . . . . . . . . . . . . . . . . . . 1INTRODUCTION . . . . . . . . . . . . . . . . . . . . . . . . . . . . . . . . . . . . . . . . . . . . . . . . . . . . . . . . . . . . . 1METHODS OF SAMPLE COLLECTION, STABILIZATION, AND ANALYSIS . . . . . . . . . . 4
Sample Collection . . . . . . . . . . . . . . . . . . . . . . . . . . . . . . . . . . . . . . . . . . . . . . . . . . . . . . . 4Analytical Methods . . . . . . . . . . . . . . . . . . . . . . . . . . . . . . . . . . . . . . . . . . . . . . . . . . . . . 10Sample Treatment for Thiosulfate and Sulfate Determinations . . . . . . . . . . . . . . . . . . . 10
WATER-CHEMISTRY DATA . . . . . . . . . . . . . . . . . . . . . . . . . . . . . . . . . . . . . . . . . . . . . . . . . . 12SULFUR-SPECIATION DATA . . . . . . . . . . . . . . . . . . . . . . . . . . . . . . . . . . . . . . . . . . . . . . . . . 12REFERENCES CITED . . . . . . . . . . . . . . . . . . . . . . . . . . . . . . . . . . . . . . . . . . . . . . . . . . . . . . . . 26APPENDIX . . . . . . . . . . . . . . . . . . . . . . . . . . . . . . . . . . . . . . . . . . . . . . . . . . . . . . . . . . . . . . . . . 29
FIGURES
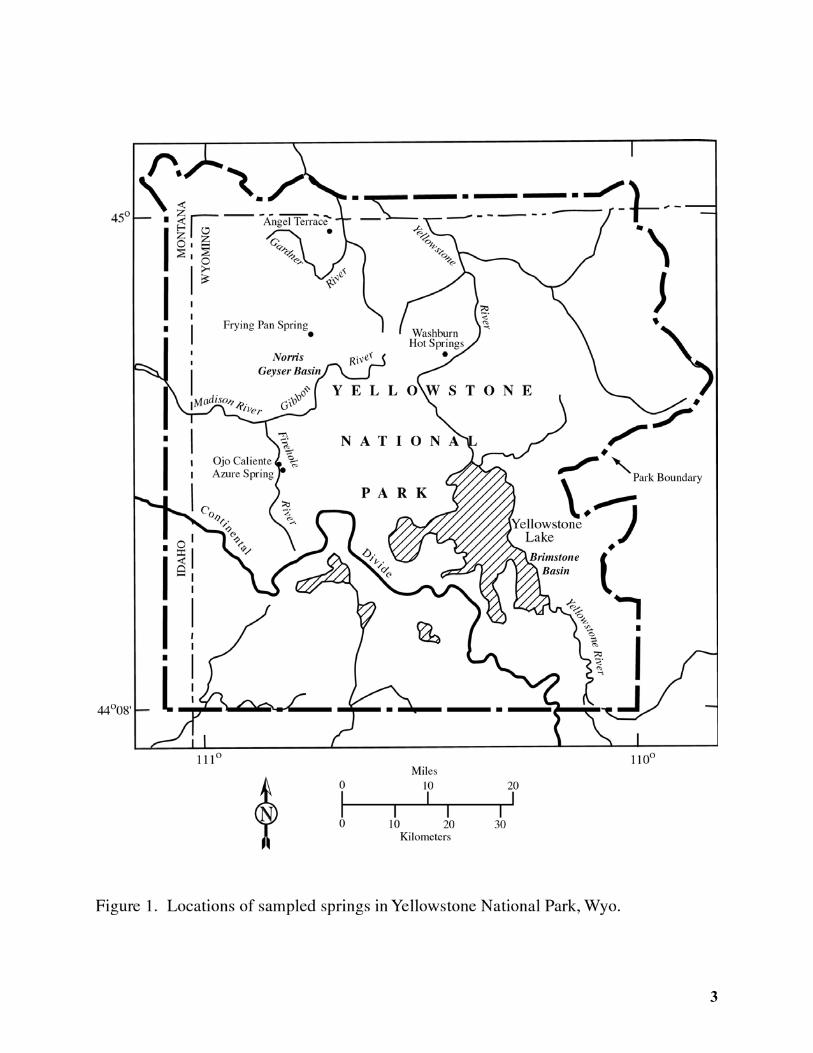
1. Map showing locations of sampled springs in Yellowstone National Park, Wyo. . . . . . . . . . . 32-5. Schematic maps showing:
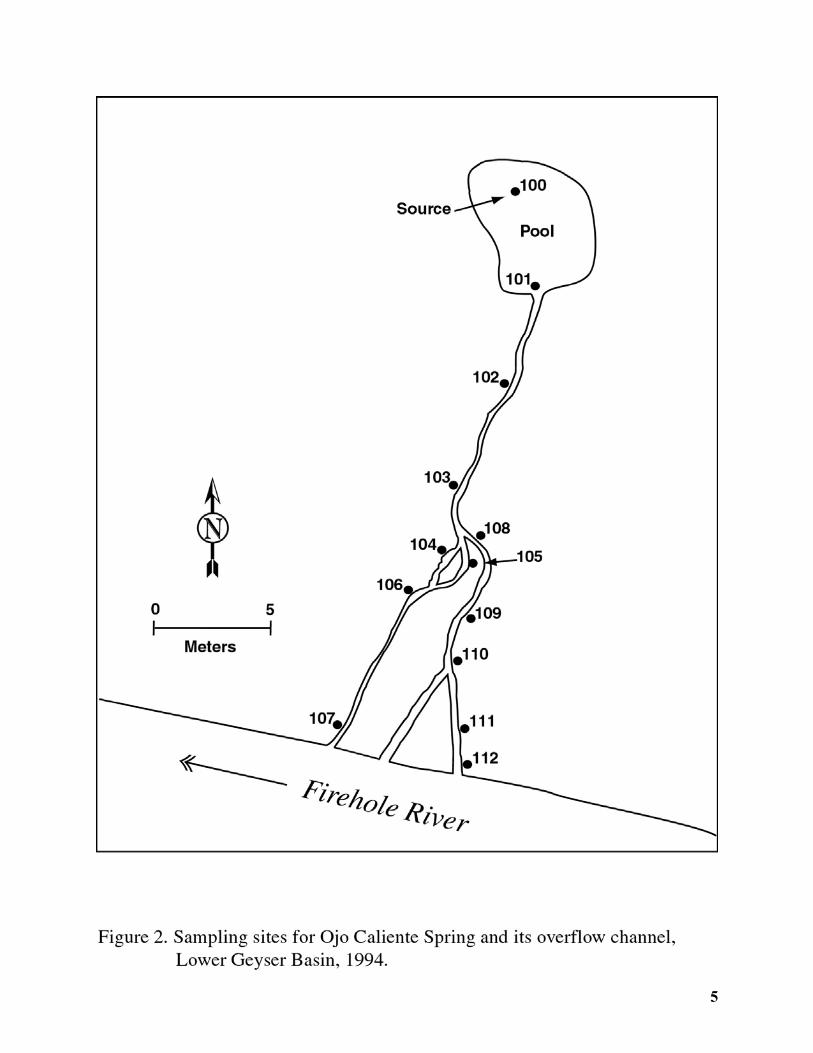
2. Sampling sites for Ojo Caliente Spring and its overflow channel,Lower Geyser Basin, 1994 . . . . . . . . . . . . . . . . . . . . . . . . . . . . . . . . . . . . . . . . . . . 5
3. Sampling sites for Frying Pan Spring and its overflow channel, NorrisGeyser Basin, 1994 . . . . . . . . . . . . . . . . . . . . . . . . . . . . . . . . . . . . . . . . . . . . . . . . 6
4. Sampling sites for Angel Terrace Spring and its overflow channel,Mammoth Hot Springs complex, 1994 . . . . . . . . . . . . . . . . . . . . . . . . . . . . . . . . . 7
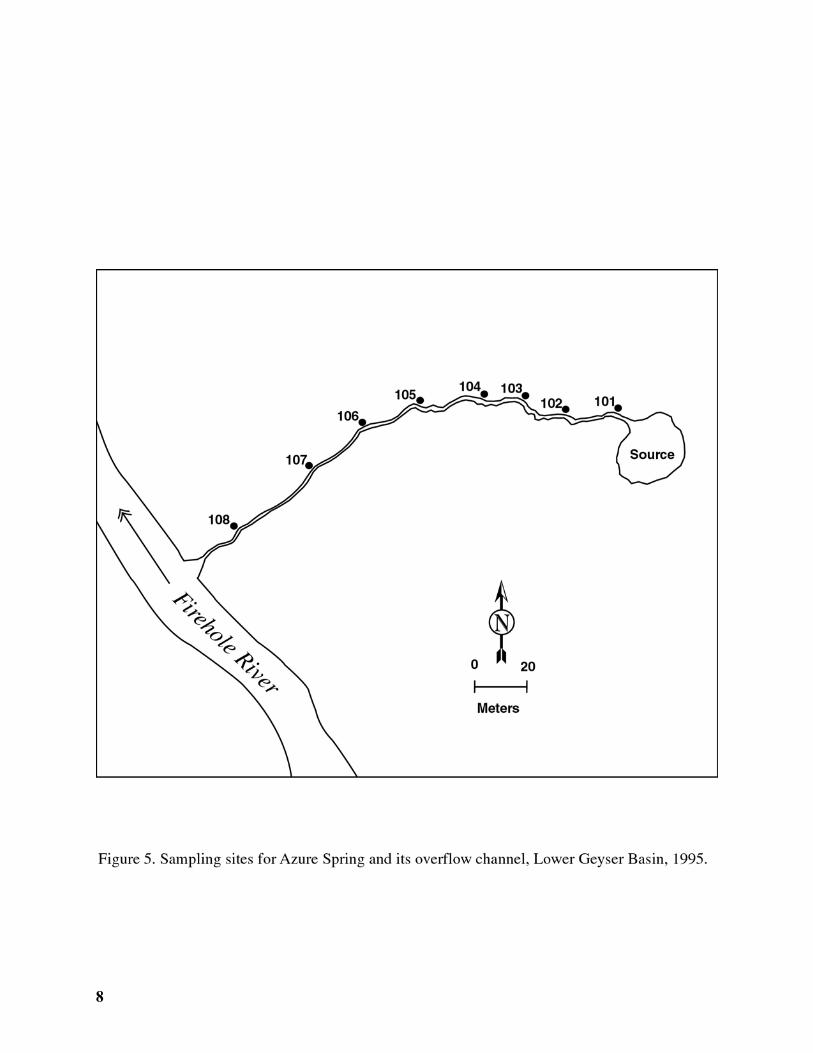
5. Sampling sites for Azure Spring and its overflow channel, LowerGeyser Basin, 1995 . . . . . . . . . . . . . . . . . . . . . . . . . . . . . . . . . . . . . . . . . . . . . . . . 8
TABLES
1. Storage and stabilization methods for filtered samples . . . . . . . . . . . . . . . . . . . . . . . . . . . . . . 92. Reactions of reduced sulfur species . . . . . . . . . . . . . . . . . . . . . . . . . . . . . . . . . . . . . . . . . . . . 113. Site data and water analyses for Ojo Caliente Spring and its overflow channel, Lower
Geyser Basin . . . . . . . . . . . . . . . . . . . . . . . . . . . . . . . . . . . . . . . . . . . . . . . . . . . . . . . . . . 144. Site data and water analyses for Frying Pan Spring and its overflow channel, Norris
Geyser Basin . . . . . . . . . . . . . . . . . . . . . . . . . . . . . . . . . . . . . . . . . . . . . . . . . . . . . . . . . . 175. Site data and water analyses for Angel Terrace Spring and its overflow channel,
Mammoth Hot Springs complex . . . . . . . . . . . . . . . . . . . . . . . . . . . . . . . . . . . . . . . . . . . 196. Site data and water analyses for Azure Spring and its overflow channel, Lower Geyser
Basin . . . . . . . . . . . . . . . . . . . . . . . . . . . . . . . . . . . . . . . . . . . . . . . . . . . . . . . . . . . . . . . . 207. Site data and water analyses for miscellaneous springs . . . . . . . . . . . . . . . . . . . . . . . . . . . . . 228. 2H and 18O isotope analyses . . . . . . . . . . . . . . . . . . . . . . . . . . . . . . . . . . . . . . . . . . . . . . . . . . 249. Comparison of historic data on sulfur species concentrations for selected locations . . . . . . . 2510. Methods of analysis . . . . . . . . . . . . . . . . . . . . . . . . . . . . . . . . . . . . . . . . . . . . . . . . . . . . . . . 3011. Explanation of methods of analysis . . . . . . . . . . . . . . . . . . . . . . . . . . . . . . . . . . . . . . . . . . . 3112. Measurements of Standard Reference Waters . . . . . . . . . . . . . . . . . . . . . . . . . . . . . . . . . . . 35

iv
CONVERSION FACTORS AND ABBREVIATIONS
Multiply By To obtain
L (liter) 0.2642 gal (gallon)g (gram) 0.03527 oz (ounce)m (meter) 3.28084 ft (foot)
Temperature in degrees Fahrenheit (oF) can be converted to degrees Celsius (oC) as follows:oF = 1.8 × oC + 32
Explanation of abbreviations
g/mL (grams per milliliter)kw (kilowatts)m (meters)meq/L (milliequivalents per liter)mg/L (milligrams per liter)mL (milliliter)mm (millimeter)M (moles per liter):m (micrometer):S/cm (microsiemens per centimeter at 25
degrees Celsius)n.a. (not analyzed)n.m. (not measured)psi (pounds per square inch)V (volts)v/v (volume/volume)COLOR (colorimetry)COND (conductance)*2H (2H/1H ratio referenced to the VSMOW
standard)*18O (18O/16O ratio referenced to the
VSMOW standard)D.O. (dissolved oxygen)DOC (dissolved organic carbon)
EC (electro-chemical method)FAAS (flame atomic absorption
spectrometry)FIAS (flow injection analysis system)IC (ion chromatography)ICP (inductively-coupled plasma atomic
emission spectrometry)ISOT (stable isotope analysis)MHZ (megahertz)PTFE (polytetrafluoroethylene)RF (radio frequency)SLAP (Standard Light Antarctic
Precipitation)spec. cond. (specific conductance)SRWS (standard reference water sample)TITR (titrimetry)UV (ultraviolet)VSMOW (Vienna Standard Mean Ocean
Water)YNP (Yellowstone National Park)ZGFAAS (Zeeman-corrected graphite
furnace atomic absorptionspectrometry)

1
Water-Chemistry and On-Site Sulfur-Speciation Data for Selected Springsin Yellowstone National Park, Wyoming, 1994-1995
By James W. Ball, D. Kirk Nordstrom, Kirk M. Cunningham, Martin A. A. Schoonen, Yong Xu, andJennifer M. DeMonge
ABSTRACT
Forty-two water analyses are reported for samples collected at 8 hot springs and theiroverflow drainages, two geysers, and two ambient-temperature acid streams in Yellowstone NationalPark during 1994-95. These water samples were collected and analyzed as part of the initialresearch investigations on sulfur redox speciation in the hot springs of Yellowstone and to documentchemical changes in overflows that affect major ions, redox species, and trace elements. The sulfurredox speciation research is a collaboration between the State University of New York (SUNY) atStony Brook and the U.S. Geological Survey (USGS). Four hot springs, Ojo Caliente, Azure, FryingPan, and Angel Terrace, were studied in detail. Analyses were performed adjacent to the samplingsite or in an on-site mobile lab truck constructed by the USGS, or later in a USGS laboratory.
Water temperature, specific conductance, pH, Eh, D.O., and dissolved H2S were determinedadjacent to the sample source at the time of sampling. Alkalinity and F- were determined on-site onthe day of sample collection. Thiosulfate and polythionates were determined as soon as possible(minutes to hours later) by ion chromatography (IC). Other major anions (Cl-, SO4
2-, Br-) also weredetermined on-site by IC within two days of sample collection. Ammonium, Fe(II), and Fe(total)were determined on-site by ultraviolet/visible spectrophotometry within two days of samplecollection. Later in the USGS laboratory, densities were determined. Concentrations of Ca, Mg,Li, Na, and K were determined by flame atomic absorption and emission (Na, K) spectrometry.Concentrations of Al, As, B, Ba, Be, Ca, Cd, Co, Cr, Cu, Fe(total), K, Mg, Mn, Na, Ni, Pb, Si, Sr,V, and Zn were determined by inductively-coupled plasma optical emission spectrometry. Traceconcentrations of Al and Mg were determined by Zeeman-corrected graphite furnace atomicabsorption spectrometry.
Three important conclusions from the sampling and analyses are: (1) variability in H2Sconcentrations can be caused as much by sampling and preservation artifacts as by actual variationsin water composition over time, (2) historical determinations of S2O3
2- were subject tooverestimation, most likely because of inadequate preservation leading to H2S oxidation, and (3)S2O3
2- is a common constituent of hot spring waters.
INTRODUCTION
Spectacular hot spring and geyser activity led to the designation of Yellowstone NationalPark (YNP) as the first national park in the world and inspired numerous scientific investigations.Investigations into the water chemistry of hot springs, geysers, streams, and rivers have beenaccomplished primarily by the USGS, dating back to the report of Gooch and Whitfield (1888) andthe comprehensive study by Allen and Day (1935). More recent water-chemistry data are availablefor 6 samples reported by White and others (1963), 166 samples reported by Rowe and others

2
(1973), 541 samples reported by Thompson and others (1975), 422 samples reported by Thompsonand Yadav (1979), 45 samples reported by Stauffer and others (1980), 38 samples reported byThompson and Hutchinson (1981), 17 samples reported by Kharaka and others (1991), and over 450samples reported by Thompson and DeMonge (1996). Additional data are reported by White andothers (1988), Fournier (1989), Fournier and others (1994), and Ball and others (1998).
Waters at YNP have a wide range of compositions. The pH values range from 1 to 10,temperatures range from ambient to boiling, and there are high concentrations of As, H2S, SO4
2-, andHCO3
-. Numerous redox reactions and mineral-precipitation reactions occur. As well as beingvaluable natural resources, active geothermal areas such as YNP provide enormous insight intoformation of mineral deposits, microbiological processes in extreme environments, and water-rockinteractions.
The present study is the first phase of collaborative research between the USGS, SUNY atStony Brook, and Northern Arizona University. The purpose of this investigation is to study theoccurrence, origin, rates of formation and disappearance, and hydrogeochemical significance ofunstable redox species of sulfur in mineral springs and geothermal waters.
Forty-two water samples were collected and analyzed for major and trace constituents fromfive areas (fig. 1): Mammoth Hot Springs (Angel Terrace), Norris Geyser Basin (including FryingPan Spring), Lower Geyser Basin (Ojo Caliente and Azure Spring), Washburn Hot Springs, andBrimstone Basin. Hot springs with well-defined overflow channels were sampled in detail,especially those at Angel Terrace, Frying Pan Spring, Ojo Caliente, and Azure Spring. Waterdischarging from these springs provided a range of pH values and dissolved constituentconcentrations. Discharge from each spring flowed into a small, well-defined channel, facilitatingcollection of samples and permitting study of chemical reactions during downstream transport. These analyses for the five hot-spring areas may be some of the most complete available, containingmajor ions, trace elements, and some redox species such as Fe(II)/Fe(total), H2S, S2O3
2-, and SO42-.
The authors thank the following USGS personnel: G. R. Aiken for dissolved organic carbonanalyses, R. C. Antweiler and B. Kumler for ammonium analyses, and T. B. Coplen, J. A. Hopple,and C. Kendall for isotope determinations. We acknowledge the contributions of Cherie Ball inpreparing publication versions of the figures for this report. The participation of SUNY at StonyBrook in this project is sponsored by the National Science Foundation-Earth Sciences.
We extend our appreciation to the staff of Yellowstone National Park for permission tocollect water samples. We are especially thankful to the late Rick Hutchinson for his advice and hisinterest in our work since 1974. We thank Bob Lindstrom for arranging transportation andaccompanying us to Brimstone Basin. We also thank Mike Thompson, formerly of the USGS, forleading us through Norris and Lower Geyser Basins.
3
4
METHODS OF SAMPLE COLLECTION, STABILIZATION, AND ANALYSIS
Many analyses were performed on each sample. Physical properties determined includedtemperature, pH, specific conductance, and density. Concentrations of D.O., H2S, NH4
+, SiO2, majorcations, trace metals, Fe(II), Fe(total), major anions, alkalinity, S2O3
2-, and DOC, as well as stableisotopes of H and O, were determined.
Sample Collection
Samples were collected as close to the source of each spring as possible and at variouslocations along the downstream overflow channel, as illustrated schematically in figs. 2-5 for OjoCaliente Spring, Frying Pan Spring, Angel Terrace Spring, and Azure Spring, respectively. Forsafety, to protect fragile hot spring mineral formations, and to minimize changes in temperature, pH,and water chemistry during sampling, samples from the middle of pools were taken using aninsulated stainless steel container attached to the end of an extendable aluminum pole. Thecontainer was rinsed several times with sample water to assure thermal equilibration and tominimize sample contamination. At more easily accessible sites, spring water was withdrawndirectly from the source or channel.
5

6

7
8

9
At all sites, samples for the following determinations were filtered upon withdrawal fromthe source: major cations, trace metals, Fe(II) and Fe(total), major anions, alkalinity, density, DOC,NH4
+, dissolved SiO2, H2S, SO42-, S2O3
2-, and isotopes of H and O. Samples for H2S, SO42-,
and S2O32- analyses were suctioned by hand into a plastic syringe to avoid the formation of head
space, then pressure-filtered through syringe-mounted 0.45-:m membrane filters; stabilizingreagents were put into the syringe before the sample was drawn into it. All other samples werepumped from the spring with a portable peristaltic pump through medical-grade silicone tubing, thenthrough a 142-mm diameter all-plastic filter holder (Kennedy and others, 1976) containing a 0.45-:m Millipore filter membrane, except for samples 94WA110 and 95WA116 where a 0.1-:m filtermembrane was used. Storage and stabilization of filtered samples are summarized in table 1.
Unfiltered samples were used for analyses of pH, Eh, D.O., temperature, and specificconductance. Temperature, specific conductance, and D.O. measurements were made by immersingprobes directly into the source or into a sample collected in the insulated container. Measurementsfor Eh and pH were made on unfiltered sample water pumped from the spring through an acrylicplastic flow-through cell containing a thermometer, Eh and pH electrodes, and test tubes containingcalibrating solutions.
Table 1. Storage and stabilization methods for filtered samples
Sample type(s) Storage containerStabilization treatment inaddition to refrigeration
Major cations, trace metals,Fe(II), and Fe(total)
Polyethylene or PTFEbottles, soaked in 10% HNO3and rinsed with double-distilled water
1% (v/v) redistilled 6 N HCladded
Major anions, alkalinity, anddensity
Polyethylene bottles, rinsedin 10% HNO3 and soaked indouble-distilled wateraliquots for >48 hours
None
DOC Baked (450°C) amber glassbottles with PTFE-lined caps
None
NH4+ Same as major cations, trace
metals, Fe(II), and Fe(total)1% (v/v) 1:10 redistilledH2SO4 added
Dissolved SiO2 Same as major anions,alkalinity, and density
Diluted 1:10 immediatelywith distilled H2O
SO42-, S2O3
2- 60 mL plastic syringe 1.6% (v/v) 1 M Cd-(OOC-CH3)2, CdCl2, or ZnCl2 plus0.2% (v/v) 5 M NaOH addedto precipitate S(-II)
10
Analytical Methods
The analytical methods are summarized in the Appendix at the back of the report (tables 10and 11). Because most determinations were accomplished using established procedures, the methodcorresponding to each descriptor in table 10 is described briefly in table 11. In the followingparagraphs, only general conditions or variants of standard procedures are discussed.
All reagents were of purity at least equal to the reagent-grade standards of the AmericanChemical Society. Doubly-distilled de-ionized water and re-distilled acids were used in allpreparations. For inductively-coupled plasma, flame atomic-absorption, and graphite-furnaceatomic-absorption spectrometric analyses, external standards, blanks, sample dilutions, and spikingsolutions were made with commercial ICP elemental standard solutions or standard solutionscomposed of elements or their compounds of the highest commercially-available purity. USGSstandard reference water samples (SRWS) were used as independent standards.
Samples were diluted as necessary to bring the analyte concentration within the optimalrange of the method. For elemental analyses, several dilutions of each sample, with the extremesof the range differing by dilution factors of 2 to 10, were analyzed to check for concentration effectson the analytical method.
Calibration curves were determined by using standards within each set of analyses. Ifmatrix effects were evident, spike-recovery and/or standard-addition measurements were performed.USGS SRWS T-117, T-115, and T-111 were used to check the analytical methods for major andtrace metals, and SRWS M-102 was used to check the analytical methods for major anions. TheSRWS data are presented in table 12 in the Appendix. Estimates of ICP detection limits are reportedin table 11 in the Appendix and were assumed equal to 3Fblank, where Fblank is the standard deviationof several dozen measurements of the constituent in a blank solution treated as a sample. Also listedin table 11 are typical values of analytical reproducibility for each method of analysis in samplescontaining the analyte at concentrations at least ten times the detection limit. These parameters wereestimated for FAAS and ZGFAAS in a similar manner, but using only about a dozen measurementsof blanks.
Sample Treatment for Thiosulfate and Sulfate Determinations
Determination of dissolved sulfur species presents particularly difficult analytical challenges,making the evaluation of sampling and analytical procedures critical to the success of the research.Hence, methods of collection and analysis are reported. For example, dissolved H2S can volatilizerapidly or oxidize to S, S2O3
2-, other S species of intermediate oxidation state, and SO42-. Without
proper precautions, all these species can be considered unstable and subject to change. Because on-site determinations or special preservation techniques are crucial for reliable determination ofunstable species concentrations, a USGS mobile lab truck with an on-board ion chromatograph,autotitrator, and UV-visible spectrophotometer was used to determine unstable speciesconcentrations within minutes to hours of sample collection.
The distribution of sulfur species during oxidation of H2S will change with storage timeaccording to the rates of several competing reactions. These reactions, based on the works of Chenand Morris (1972), O'Brien and Birkner (1977), and Zhang and Millero (1994), are listed in table 2.

11
Table 2. Reactions of reduced sulfur species
Reaction Conditions where reaction rate is at a maximum
HS- + H+ : H2S 6 H2S8 pH # 6
HS- + 2O2 6 SO42- + H+ 6 # pH # 8.5, [HS-]:[O2] low
2HS- + 2O2 6 S2O32- + H2O pH $ 6, [HS-]:[O2] low
HS- + 3/2O2 6 SO32- + H+ pH $ 7, [HS-]:[O2] low
HS- + ½O2 + H+6 S + H2O 6 # pH # 8.5, [HS-]:[O2] high
Sn + HS-: Sn2
+-1 + H+ (n = 4,5) 6 # pH # 8, [HS-]:[O2] high
Sn2- + 3/2O2 6 SO3
2- + (n-1)S 6 # pH # 8, [HS-]:[O2] high
Sn2- + 2O2 + 2H+ 6 S2O3
2- + H2O + (n-2)S 6 # pH # 8, [HS-]:[O2] high
SO32- + ½O2 6 SO4
2- All pH
S + SO32-: S2O3
2- 7 # pH # 8
S2O32- + 5/2O2 6 2SO4
2- Temperature $ 100°C
In the hot springs, high temperature and the presence of oxidation-catalyzing bacteria causethese reactions to proceed at a much faster rate than in cooled and filtered samples stored for lateranalysis. For example, S2O3
2- is oxidized rapidly to SO42! at high temperatures, but this reaction
proceeds at a negligible rate (Rolla and Chakrabarti, 1982) under typical sample-storage conditions.However, at the neutral pH and high initial [HS!]:[O2] ratio of Ojo Caliente Spring, Azure Spring,and Angel Terrace Spring waters, the oxidation reactions of S(-II) occur with a half-life comparableto that of the storage time between sample collection and analysis. In these types of samples, majoroxidation products are expected to be SO4
2- and S2O32-, with elemental S, SO3
2-, polythionates (SnO62-),
and polysulfides (Sn2-) as minor products.
To prevent over-estimation of the in-situ concentration of SO42- and S2O3
2-, S(-II) oxidationwas minimized by drawing unfiltered sample into a 60 mL syringe containing either 1 mL of 1 MCd-(OOC-CH3)2 (1994 sampling) or 1 mL of 1 M ZnCl2 (1995 sampling), plus 0.5 mL 5 M NaOH.This technique caused the oxidation-resistant ZnS or CdS species to precipitate. The sample wasthen pressure-filtered directly into the ion chromatograph on-site in the mobile laboratory or wasstored on ice and analyzed a few days to weeks later at the USGS laboratory in Boulder, Colorado,or SUNY at Stony Brook. The H2S concentrations range from <0.005 to 8 mg/L. For sampleshaving H2S concentrations toward the higher end of this range, S2O3
2- concentrations were higher inthe stored sample splits than in those analyzed on-site. For samples containing H2S concentrationstoward the lower end of the range, S2O3
2- concentrations were lower in the stored sample splits thanin those analyzed on-site. This result suggests that preservation using CdCl2 or ZnCl2 does notprevent oxidation of either S(-II) to S2O3
2- or S2O32- to SO4
2- upon longer term storage.
12
Cd initially appeared to be the superior precipitating agent because the smaller solubilityproduct constant of CdS (K = 10-27.0) compared with the solubility product constant for ZnS (K =10-22.5) (Smith and Martell, 1976) should result in better preservation of the S(-II). However, recentwork (Xu and Schoonen, 1995; Xu and others, 1996) has established that semiconductors such aspyrite (FeS2) and CdS can catalyze the oxidation of S2O3
2- by O2. The catalytic effect depends onthe energy position of the conduction and valence bands of the semiconductor relative to thestandard potential of the S2O3
2-/SO42- redox couple in solution. By contrast, the conduction and
valence band energies of ZnS cannot facilitate the S2O32- oxidation reaction.
Based on the observations and discussions above, S2O32- in water samples needs to be
stabilized by adding 1 mL of 1 M ZnCl2 and 0.5 mL of 5 M NaOH to 60 mL of sample, storing thesample on ice, and analyzing it as quickly as possible, preferably within 2 days.
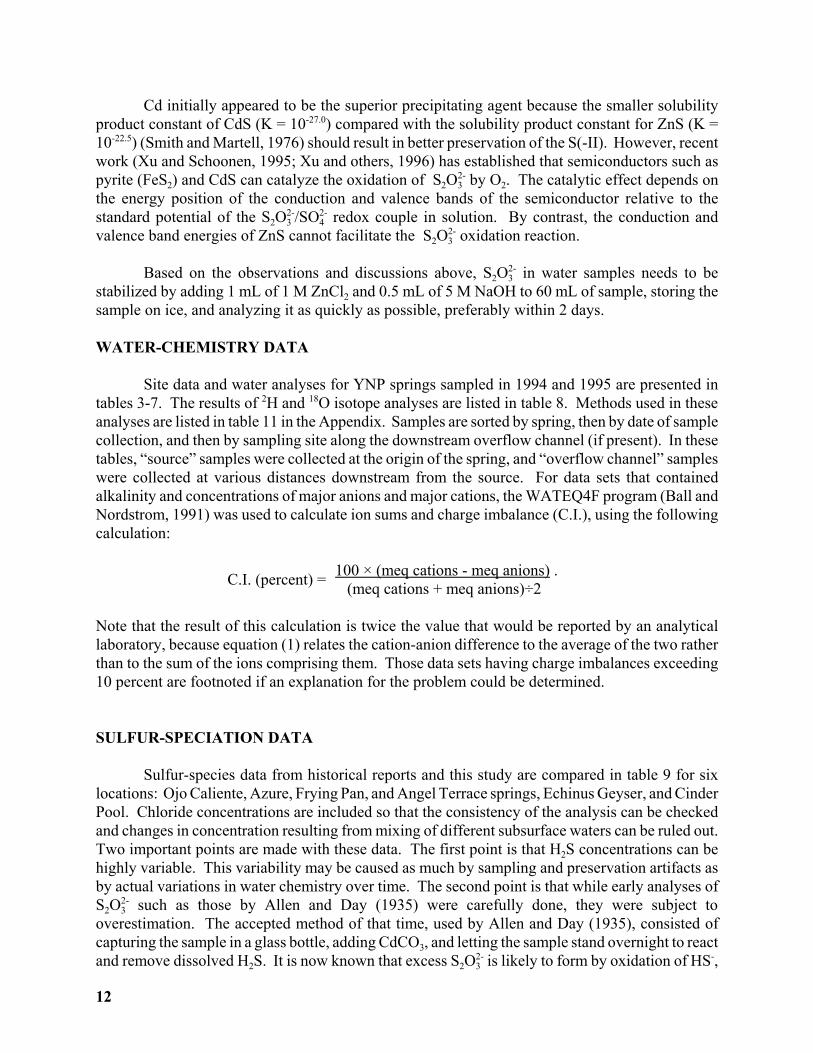
WATER-CHEMISTRY DATA
Site data and water analyses for YNP springs sampled in 1994 and 1995 are presented intables 3-7. The results of 2H and 18O isotope analyses are listed in table 8. Methods used in theseanalyses are listed in table 11 in the Appendix. Samples are sorted by spring, then by date of samplecollection, and then by sampling site along the downstream overflow channel (if present). In thesetables, “source” samples were collected at the origin of the spring, and “overflow channel” sampleswere collected at various distances downstream from the source. For data sets that containedalkalinity and concentrations of major anions and major cations, the WATEQ4F program (Ball andNordstrom, 1991) was used to calculate ion sums and charge imbalance (C.I.), using the followingcalculation:
100 × (meq cations - meq anions) . C.I. (percent) = (meq cations + meq anions)÷2
Note that the result of this calculation is twice the value that would be reported by an analyticallaboratory, because equation (1) relates the cation-anion difference to the average of the two ratherthan to the sum of the ions comprising them. Those data sets having charge imbalances exceeding10 percent are footnoted if an explanation for the problem could be determined.
SULFUR-SPECIATION DATA
Sulfur-species data from historical reports and this study are compared in table 9 for sixlocations: Ojo Caliente, Azure, Frying Pan, and Angel Terrace springs, Echinus Geyser, and CinderPool. Chloride concentrations are included so that the consistency of the analysis can be checkedand changes in concentration resulting from mixing of different subsurface waters can be ruled out.Two important points are made with these data. The first point is that H2S concentrations can behighly variable. This variability may be caused as much by sampling and preservation artifacts asby actual variations in water chemistry over time. The second point is that while early analyses ofS2O3
2- such as those by Allen and Day (1935) were carefully done, they were subject tooverestimation. The accepted method of that time, used by Allen and Day (1935), consisted ofcapturing the sample in a glass bottle, adding CdCO3, and letting the sample stand overnight to reactand remove dissolved H2S. It is now known that excess S2O3
2- is likely to form by oxidation of HS-,

13
and determination of the remaining S2O32- by titration with starch iodine solution suffered from
uncertainties. Allen and Day (1935) did not attempt to determine S2O32- in acid springs such as
Frying Pan because it was well known that S2O32- is unstable in acid solutions. However, the
oxidation rate for S2O32- is much slower than that for H2S so that S2O3
2- can be found in thesesprings where a constant supply of hydrogen sulfide is provided. Ignoring Frying Pan Spring, whichis poorly-defined in terms of input sources of water and gases, and ignoring Echinus Geyser becauseit occurs primarily as a geyser and thus always exhibits transient flow conditions, the remaining datashow remarkable consistency in concentrations of sulfur species over long periods of time.
Two publications (Xu and others, 1998; 2000) discuss the origin of S2O32- in hot spring waters
and the formation and decomposition of S2O32- and SnO6
2- in Cinder Pool, Norris Geyser Basin. Datathat form the basis of the discussions and conclusions in those reports are in tables 3-9.

14
Table 3. Site data and water analyses for Ojo Caliente Spring and its overflow channel, Lower Geyser Basin
Sample code number 94WA100 94WA101 94WA102 94WA103Date collected 6/28/94 6/28/94 6/28/94 6/28/94Flow channel distance (m) 0 (source) 0 (pool) 5.5 11Temperature (°C) 93 91.9 88.5 85.8Density (g/mL) at 20°C 0.99936 0.99929 0.99906 0.99916pH (field/lab) 7.72/8.61 7.6/8.65 7.69/8.69 7.79/8.61Spec. cond. (:S/cm) (field/lab) 1517/1595 1517/1596 1517/1614 1526/1614Eh (V) -0.156 -0.086 0.029 0.090D.O. (mg/L) 0.1 0.5 0.75 1.1Constituent (mg/L)Ca 1.00 0.91 0.88 0.91Mg 0.001 0.0006 0.001 0.0007Na 331 331 331 332K 9.45 9.5 9.7 9.58SO4 20.7 21.0 20.9 21.2S2O3 0.269 0.275 0.351 0.477H2S 1.09 1.06 0.74 0.55Alkalinity (as HCO3) 231.7 234.2 236.4 233.3F 31.6 30.9 31.5 31.4Cl 324 326 328 330Br 1.15 1.17 1.17 1.18SiO2 243 236 248 248NO3
10.132 0.032 0.032 <0.031NH4 0.089 0.028 0.03 0.033Al 0.280 0.275 0.278 0.278Fe(tot) 0.0232 0.0237 0.014 0.0118Fe(II) 0.0232 0.0237 0.014 0.0118B 3.98 3.89 3.97 3.98Li 3.96 3.99 3.98 4.01Sr 0.008 0.007 0.006 0.006Ba <0.04 <0.04 <0.04 <0.04Mn <0.12 <0.12 <0.12 <0.12Zn <0.01 <0.01 <0.01 <0.01Pb <0.15 <0.15 <0.15 <0.15Be <0.001 <0.001 <0.001 <0.001V <0.02 <0.02 <0.02 <0.02Cr <0.09 <0.09 <0.09 <0.09Co <0.04 <0.04 <0.04 <0.04Ni <0.04 <0.04 <0.04 <0.04Cu <0.14 <0.14 <0.14 <0.14Cd <0.04 <0.04 <0.04 <0.04As(total) 0.86 1.1 0.99 1.27DOC (mg/L) 1.0 0.8 0.6 0.4Sum cations (meq/L) 14.6 15.2 15.2 15.3Sum anions (meq/L) 14.9 15.0 15.0 15.3Charge imbalance (percent) -1.8 1.7 1.3 0.02
1Likely to be contaminated.

15
Table 3. Site data and water analyses for Ojo Caliente Spring and its overflow channel, Lower Geyser Basin--continued
Sample code number 94WA104 94WA105 94WA106 94WA107Date collected 6/28/94 6/28/94 6/28/94 6/28/94Flow channel distance (m) 14.9 14.9 17.7 26.2Temperature (°C) 82.8 78.8 79.1 73.8Density (g/mL) at 20°C 0.99903 0.99912 0.99935 0.99906pH (field/lab) 7.86/8.66 7.94/8.70 7.92/8.72 8.12/8.71Spec. cond. (:S/cm) (field/lab) 1542/1623 1568/1631 1556/1628 1580/1646Eh (V) 0.142 0.183 0.148 0.171D.O. (mg/L) 1.15 1.5 1.7 2.7Constituent (mg/L)Ca 0.84 0.83 0.93 0.97Mg 0.0004 0.0005 0.0003 0.0004Na 336 325 339 340K 9.67 9.74 9.66 9.84SO4 21.1 21.7 21.8 22.2S2O3 0.574 0.756 0.702 0.629H2S 0.33 0.17 0.16 0.12Alkalinity (as HCO3) 237.6 240.1 245.2 233.9F 31.6 32.0 31.9 32.7Cl 331 331 332 335Br 1.19 1.21 1.21 1.23SiO2 257 260 262 259NO3 <0.031 <0.031 <0.031 <0.031NH4 0.031 0.014 0.013 0.008Al 0.277 0.290 0.290 0.280Fe(tot) 0.0021 <0.0005 0.004 <0.0005Fe(II) 0.0021 <0.0005 0.004 <0.0005B 3.98 4.02 4.16 4.01Li 4.02 4.07 4.02 4.09Sr 0.005 0.005 0.005 0.006Ba <0.04 <0.04 <0.04 <0.04Mn <0.12 <0.12 <0.12 <0.12Zn <0.01 <0.01 <0.01 <0.01Pb <0.15 <0.15 <0.15 <0.15Be <0.001 <0.001 <0.001 <0.001V <0.02 <0.02 <0.02 <0.02Cr <0.09 <0.09 <0.09 <0.09Co <0.04 <0.04 <0.04 <0.04Ni <0.04 <0.04 <0.04 <0.04Cu <0.14 <0.14 <0.14 <0.14Cd <0.04 <0.04 <0.04 <0.04As(total) 1.5 1.53 1.29 1.48DOC (mg/L) 0.4 0.3 0.4 0.3Sum cations (meq/L) 15.4 15.5 15.6 15.6Sum anions (meq/L) 15.2 15.3 15.4 15.3Charge imbalance (percent) 1.5 1.5 1.0 1.8

16
Table 3. Site data and water analyses for Ojo Caliente Spring and its overflow channel, Lower Geyser Basin--continued
Sample code number 94WA108 94WA109 94WA110 94WA111 94WA112Date collected 6/29/94 6/29/94 6/29/94 6/29/94 6/29/94Flow channel distance (m) 13.4 16.8 20.4 25.3 29.9Temperature (°C) 78 71.2 66.6 55 50.5Density (g/mL) at 20°C 0.99906 0.99905 0.99935 0.99935 0.99927pH (field/lab) 8.06/8.55 8.13/8.65 8.21/8.73 8.37/8.76 8.47/8.81Spec. cond. (:S/cm) (field/lab) 1580/1626 1595/1640 1628/1647 1650/1687 1683/1710Eh (V) 0.093 0.146 0.195 0.217 0.234D.O. (mg/L) 2 2.3 2.7 3.3 3.7Constituent (mg/L)Ca 0.95 0.94 1.01 1.00 1.01Mg 0.0004 0.0007 10.010 0.0011 0.0003Na 336 338 342 353 353K 9.8 9.8 9.9 10.1 10.3SO4 21.6 22.5 22.5 23.2 23.7S2O3 0.718 0.594 0.589 0.562 0.550H2S 0.17 0.09 0.06 0.03 0.03Alkalinity (as HCO3) 241.4 241.8 244.1 249 251.4F 32.5 32.8 33.1 34.0 34.3Cl 332 334 335 343 345Br 1.23 1.23 1.24 1.28 1.29SiO2 257 253 257 263 263NO3 <0.031 <0.031 <0.031 <0.031 <0.031NH4 0.013 0.009 0.013 <0.006 <0.006Al 0.300 0.296 0.278 0.275 0.288Fe(tot) <0.0005 <0.0005 0.0007 <0.0005 <0.0005Fe(II) <0.0005 <0.0005 0.0007 <0.0005 <0.0005B 4.02 3.97 4.02 4.15 4.16Li 4.07 4.11 4.13 4.25 4.25Sr 0.006 0.006 0.006 0.007 0.007Ba <0.04 <0.04 <0.04 <0.04 <0.04Mn <0.12 <0.12 <0.12 <0.12 <0.12Zn <0.01 <0.01 <0.01 <0.01 <0.01Pb <0.15 <0.15 <0.15 <0.15 <0.15Be <0.001 <0.001 <0.001 <0.001 <0.001V <0.02 <0.02 <0.02 <0.02 <0.02Cr <0.09 <0.09 <0.09 <0.09 <0.09Co <0.04 <0.04 <0.04 <0.04 <0.04Ni <0.04 <0.04 <0.04 <0.04 <0.04Cu <0.14 <0.14 <0.14 <0.14 <0.14Cd <0.04 <0.04 <0.04 <0.04 <0.04As(total) 1.44 1.53 1.44 1.43 1.5DOC (mg/L) 0.3 0.3 11.1 0.4 0.3Sum cations (meq/L) 15.4 15.5 15.7 16.2 16.2Sum anions (meq/L) 15.3 15.4 15.5 15.9 16.0Charge imbalance (percent) 0.7 0.5 1.2 2.1 1.2
1Likely to be contaminated.

17
Table 4. Site data and water analyses for Frying Pan Spring and its overflow channel, Norris Geyser Basin
Sample code number 94WA113 94WA114 94WA115 94WA116Date collected 6/29/94 6/29/94 6/29/94 6/29/94Flow channel distance (m) 0 (source) 0 (outflow) 4.6 9.4Temperature (°C) 78.2 58.1 52 48.5Density (g/mL) at 20°C 0.99889 0.99895 0.9988 0.99893pH (field/lab) 2.34/2.42 2.3/2.40 2.32/2.39 2.33/2.40Spec. cond. (:S/cm) (field/lab) 1230/2070 1575/2260 1675/2150 1760/2190Eh (V) 0.182 0.294 0.327 0.358D.O. (mg/L) 2.4 2 2.5 2.65Constituent (mg/L)Ca 2.41 2.76 2.56 2.52Mg 0.53 0.59 0.49 0.46Na 54.6 59.8 57.5 58.1K 13 14.3 13.4 13.7SO4 437 460 458 456S2O3 0.632 0.696 n.d. n.d.H2S 1.03 0.04 0.01 <0.005Alkalinity (as HCO3) n.a. n.a. n.a. n.a.F 2.95 3.24 3.21 3.23Cl 8.69 9.48 9.14 9.23Br <0.040 <0.040 <0.040 <0.040SiO2 221 235 236 239NO3 <0.031 <0.031 <0.031 <0.031NH4 1.16 1.10 1.08 1.13Al 5.65 6.49 5.85 6.10Fe(total) 1.09 1.14 1.05 1.07Fe(II) 1.09 1.14 1.05 1.07B 0.64 0.78 0.64 0.72Li 0.31 0.33 0.32 0.32Sr 0.014 0.015 0.015 0.013Ba <0.06 0.072 <0.05 <0.05Mn <0.12 <0.12 <0.12 <0.12Zn 0.108 <0.01 <0.01 <0.01Pb <0.15 <0.15 <0.15 <0.15Be <0.001 <0.001 <0.001 <0.001V <0.02 <0.02 <0.02 <0.02Cr <0.09 <0.09 <0.09 <0.09Co <0.04 <0.04 <0.04 <0.04Ni <0.04 <0.04 <0.04 <0.04Cu <0.14 <0.14 <0.14 <0.14Cd <0.04 <0.04 <0.04 <0.04As(total) 0.19 0.21 0.21 0.21DOC (mg/L) 1.8 1.9 1.5 1.5Sum cations (meq/L) 8.3 9.1 8.7 8.6Sum anions (meq/L) 6.7 7.6 7.8 7.9Charge imbalance (percent)1 22.0/8.4 19.0/2.3 11.4/-0.3 9.5/-1.9
1Where two charge imbalance values appear, they are field pH C.I./lab pH C.I.
18
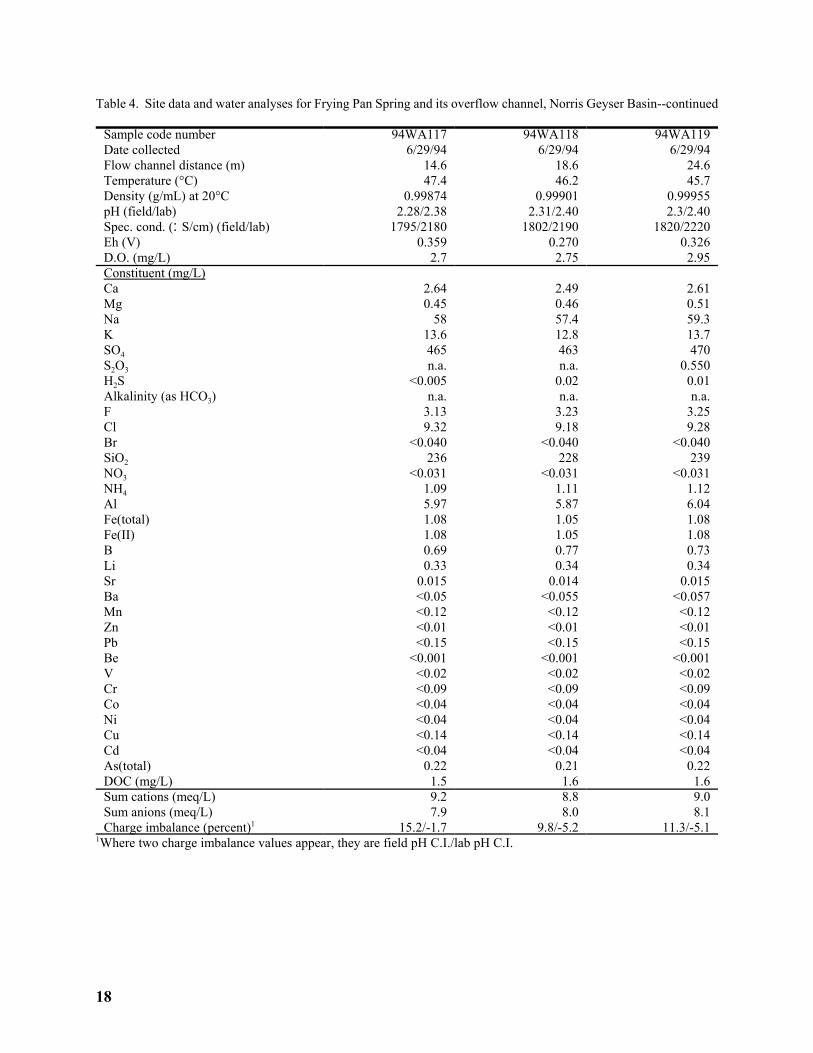
Table 4. Site data and water analyses for Frying Pan Spring and its overflow channel, Norris Geyser Basin--continued
Sample code number 94WA117 94WA118 94WA119Date collected 6/29/94 6/29/94 6/29/94Flow channel distance (m) 14.6 18.6 24.6Temperature (°C) 47.4 46.2 45.7Density (g/mL) at 20°C 0.99874 0.99901 0.99955pH (field/lab) 2.28/2.38 2.31/2.40 2.3/2.40Spec. cond. (:S/cm) (field/lab) 1795/2180 1802/2190 1820/2220Eh (V) 0.359 0.270 0.326D.O. (mg/L) 2.7 2.75 2.95Constituent (mg/L)Ca 2.64 2.49 2.61Mg 0.45 0.46 0.51Na 58 57.4 59.3K 13.6 12.8 13.7SO4 465 463 470S2O3 n.a. n.a. 0.550H2S <0.005 0.02 0.01Alkalinity (as HCO3) n.a. n.a. n.a.F 3.13 3.23 3.25Cl 9.32 9.18 9.28Br <0.040 <0.040 <0.040SiO2 236 228 239NO3 <0.031 <0.031 <0.031NH4 1.09 1.11 1.12Al 5.97 5.87 6.04Fe(total) 1.08 1.05 1.08Fe(II) 1.08 1.05 1.08B 0.69 0.77 0.73Li 0.33 0.34 0.34Sr 0.015 0.014 0.015Ba <0.05 <0.055 <0.057Mn <0.12 <0.12 <0.12Zn <0.01 <0.01 <0.01Pb <0.15 <0.15 <0.15Be <0.001 <0.001 <0.001V <0.02 <0.02 <0.02Cr <0.09 <0.09 <0.09Co <0.04 <0.04 <0.04Ni <0.04 <0.04 <0.04Cu <0.14 <0.14 <0.14Cd <0.04 <0.04 <0.04As(total) 0.22 0.21 0.22DOC (mg/L) 1.5 1.6 1.6Sum cations (meq/L) 9.2 8.8 9.0Sum anions (meq/L) 7.9 8.0 8.1Charge imbalance (percent)1 15.2/-1.7 9.8/-5.2 11.3/-5.1
1Where two charge imbalance values appear, they are field pH C.I./lab pH C.I.

19
Table 5. Site data and water analyses for Angel Terrace Spring and its overflow channel, Mammoth Hot Springscomplex
Sample code number 94WA120 94WA121 94WA122 94WA123Date collected 6/30/94 6/30/94 6/30/94 6/30/94Flow channel distance (m) 0 (source) 1 (pool) 1 (outlet) 2Temperature (°C) 71.4 70.6 61.9 56.5Density (g/mL) at 20°C 1.00013 0.99999 0.99996 0.99975pH (field/lab) 6.43/8.47 6.51/8.37 7.14/8.47 7.52/8.32Spec. cond. (:S/cm) (field/lab) 2170/2340 2195/2340 2230/2090 2245/1810Eh (V) -0.041 -0.030 0.158 0.178D.O. (mg/L) 0.5 1.1 2.2 2.9Constituent (mg/L)Ca 320 308 298 270Mg 74.8 73.2 73.4 72.9Na 136 132 133 132K 57.4 58.5 57.9 53.6SO4 547 544 553 557S2O3 <0.09 0.452 0.620 0.553H2S 3.01 0.95 0.33 0.09Alkalinity (as HCO3) 734 734.5 629.1 633.7F 2.93 2.72 2.35 1.98Cl 165 166 168 170Br 0.554 0.561 0.568 0.573SiO2 54 51.9 58.4 54.4NO3 0.034 <0.031 <0.031 <0.031NH4 0.913 0.863 0.873 0.881Al 0.012 0.010 0.007 0.006Fe(tot) 0.0297 0.0253 0.0055 0.0025Fe(II) 0.0297 0.0253 0.0055 0.0025B 3.56 3.5 3.6 3.48Li 1.64 1.64 1.66 1.67Sr 1.63 1.59 1.49 1.31Ba <0.1 <0.1 <0.1 <0.1Mn <0.3 <0.3 <0.3 <0.3Zn <0.025 <0.025 <0.025 <0.025Pb <0.375 <0.375 <0.375 <0.375Be <0.001 <0.001 <0.001 <0.001V <0.05 <0.05 <0.05 <0.05Cr <0.225 <0.225 <0.225 <0.225Co <0.1 <0.1 <0.1 <0.1Ni <0.1 <0.1 <0.1 <0.1Cu <0.35 <0.35 <0.35 <0.35Cd <0.1 <0.1 <0.1 <0.1As(total) 0.47 0.42 0.55 0.62DOC (mg/L) 1.1 1.1 0.8 n.a.Sum cations (meq/L) 24.3 23.5 23.2 21.7Sum anions (meq/L) 22.5 22.6 21.2 21.6Charge imbalance (percent) 7.5 3.9 8.7 0.5

20
Table 6. Site data and water analyses for Azure Spring and its overflow channel, Lower Geyser Basin
Sample code number 95WA101 95WA101A 95WA101B(unfiltered)
95WA102 95WA103
Date collected 8/20/95 8/20/95 8/20/95 8/20/95 8/20/95Flow channel distance (m) 6.4 6.4 6.4 25 42Temperature (°C) 72.8 (75)1 (75) 66 (64)Density (g/mL) at 20°C n.a. 0.9992 0.9993 0.9991 0.9989pH (field/lab) 8.75/9.21 n.m./9.29 n.m./9.28 8.76/9.26 8.77/9.28Spec. cond. (:S/cm) (field/lab) 1510 n.m./1652 n.m./1575 1530/1577 1520/1578Eh (V) -0.038 n.m. n.m. -0.026 0.016D.O. (mg/L) n.m. n.m. n.m. n.m. n.m.Constituent (mg/L)Ca 1.5 1.9 1.7 1.3 1.4Mg 0.0056 0.0095 0.0118 0.0065 0.0061Na 315 346 321 318 316K 13.5 13.8 13.8 13.5 13.7SO4 41 44 46 43 45S2O3 5.26 n.a. n.a. 4.49 4.08H2S 0.36 n.a. n.a. 0.237 0.149Alkalinity (as HCO3) 206 205.6 206.8 198.5 199.3F 30.1 31.9 31.0 30.6 31.1Cl 306 310 305 308 316Br 0.9 0.8 0.9 1.0 1.1SiO2 294 277 272 293 283NO3 0.96 1.01 1.07 1.07 1.06NH4 0.05 0.06 n.a. 0.06 0.01Al 0.200 0.205 0.241 0.218 0.200Fe(total) 0.030 0.025 0.026 0.035 0.027Fe(II) 0.030 0.023 0.026 0.035 0.027B 4.30 4.70 4.80 4.40 4.38Li 2.91 3.21 2.95 2.83 2.87Sr 0.010 0.015 0.015 0.010 0.008Ba <0.015 <0.015 <0.015 <0.015 <0.015Mn <0.010 <0.006 <0.006 <0.011 <0.010Zn 0.009 <0.010 <0.009 0.009 0.009Pb <0.11 <0.11 <0.11 <0.11 <0.11Be <0.001 <0.001 <0.001 <0.001 <0.001V <0.021 <0.021 <0.021 <0.021 <0.021Cr <0.21 <0.21 <0.21 <0.21 <0.21Co <0.024 <0.024 <0.024 <0.024 <0.024Ni <0.070 <0.042 <0.042 <0.070 <0.070Cu <0.20 <0.20 <0.20 <0.20 <0.20Cd <0.009 <0.009 <0.009 <0.009 0.011As(total) 1.5 1.5 1.7 1.4 1.9DOC n.a. n.a. n.a. n.a. n.a.Sum cations (meq/L) 14.39 15.94 14.79 15.54 14.47Sum anions (meq/L) 14.38 14.76 14.57 14.41 14.73Charge imbalance (percent) 0.11 7.64 1.51 0.90 -1.78
1Temperatures in ( ) were estimated from data collected 8/18/96.
21
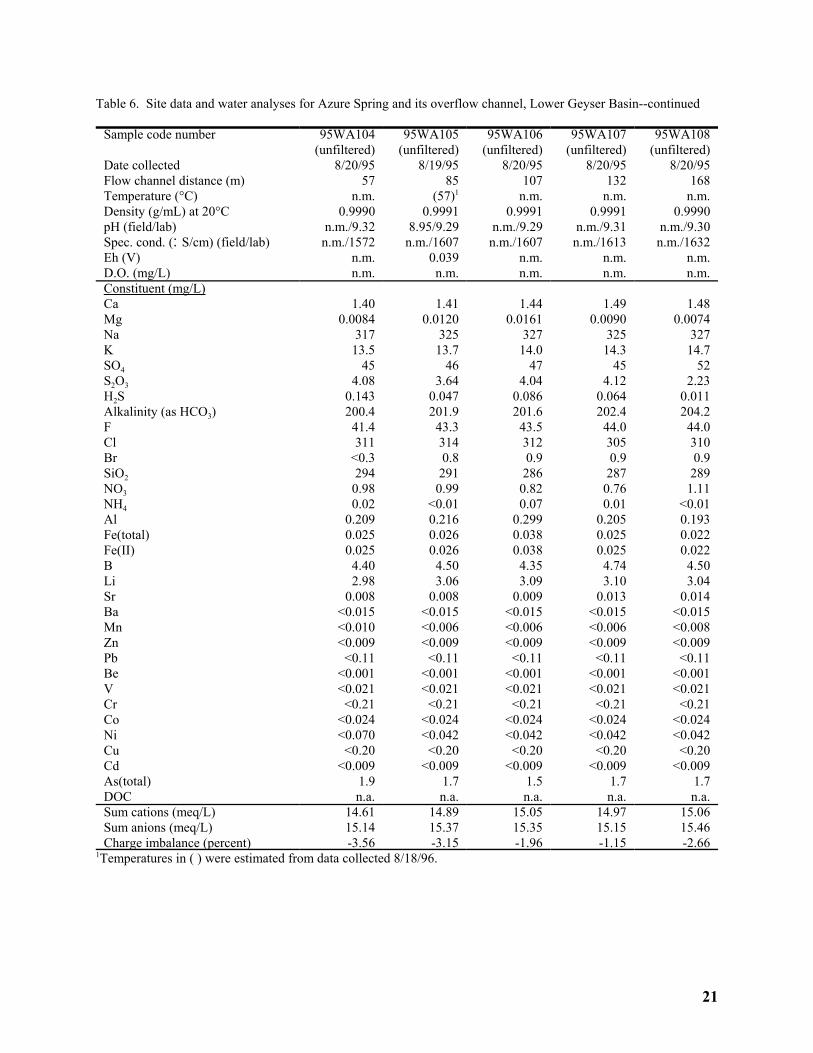
Table 6. Site data and water analyses for Azure Spring and its overflow channel, Lower Geyser Basin--continued
Sample code number 95WA104(unfiltered)
95WA105(unfiltered)
95WA106(unfiltered)
95WA107(unfiltered)
95WA108(unfiltered)
Date collected 8/20/95 8/19/95 8/20/95 8/20/95 8/20/95Flow channel distance (m) 57 85 107 132 168Temperature (°C) n.m. (57)1 n.m. n.m. n.m.Density (g/mL) at 20°C 0.9990 0.9991 0.9991 0.9991 0.9990pH (field/lab) n.m./9.32 8.95/9.29 n.m./9.29 n.m./9.31 n.m./9.30Spec. cond. (:S/cm) (field/lab) n.m./1572 n.m./1607 n.m./1607 n.m./1613 n.m./1632Eh (V) n.m. 0.039 n.m. n.m. n.m.D.O. (mg/L) n.m. n.m. n.m. n.m. n.m.Constituent (mg/L)Ca 1.40 1.41 1.44 1.49 1.48Mg 0.0084 0.0120 0.0161 0.0090 0.0074Na 317 325 327 325 327K 13.5 13.7 14.0 14.3 14.7SO4 45 46 47 45 52S2O3 4.08 3.64 4.04 4.12 2.23H2S 0.143 0.047 0.086 0.064 0.011Alkalinity (as HCO3) 200.4 201.9 201.6 202.4 204.2F 41.4 43.3 43.5 44.0 44.0Cl 311 314 312 305 310Br <0.3 0.8 0.9 0.9 0.9SiO2 294 291 286 287 289NO3 0.98 0.99 0.82 0.76 1.11NH4 0.02 <0.01 0.07 0.01 <0.01Al 0.209 0.216 0.299 0.205 0.193Fe(total) 0.025 0.026 0.038 0.025 0.022Fe(II) 0.025 0.026 0.038 0.025 0.022B 4.40 4.50 4.35 4.74 4.50Li 2.98 3.06 3.09 3.10 3.04Sr 0.008 0.008 0.009 0.013 0.014Ba <0.015 <0.015 <0.015 <0.015 <0.015Mn <0.010 <0.006 <0.006 <0.006 <0.008Zn <0.009 <0.009 <0.009 <0.009 <0.009Pb <0.11 <0.11 <0.11 <0.11 <0.11Be <0.001 <0.001 <0.001 <0.001 <0.001V <0.021 <0.021 <0.021 <0.021 <0.021Cr <0.21 <0.21 <0.21 <0.21 <0.21Co <0.024 <0.024 <0.024 <0.024 <0.024Ni <0.070 <0.042 <0.042 <0.042 <0.042Cu <0.20 <0.20 <0.20 <0.20 <0.20Cd <0.009 <0.009 <0.009 <0.009 <0.009As(total) 1.9 1.7 1.5 1.7 1.7DOC n.a. n.a. n.a. n.a. n.a.Sum cations (meq/L) 14.61 14.89 15.05 14.97 15.06Sum anions (meq/L) 15.14 15.37 15.35 15.15 15.46Charge imbalance (percent) -3.56 -3.15 -1.96 -1.15 -2.66
1Temperatures in ( ) were estimated from data collected 8/18/96.

22
Table 7. Site data and water analyses for miscellaneous springs
Name EchinusGeyser, Norris
Geyser Basin
Cinder Pool,Norris Geyser
Basin
Black Pool,Norris Geyer
Basin
Unnameddrainage,
BrimstoneBasin
Sample code number 95WA109 95WA110 95WA116 95WA114Date collected 8/22/95 8/22/95 8/25/95 8/24/95Temperature (°C) 85 95 89.2 6.5Density (g/mL) at 20°C 0.9990 0.9993 0.9993 0.9991pH (field/lab) 3.53/3.33 4.22/3.95 2.61/2.54 2.84/2.86Spec. cond. (:S/cm) (field/lab) 1090/1230 n.m./2320 1980/2990 1473/1315Eh (V) 0.336 0.022 0.127 0.473D.O. (mg/L) n.m. 0.5 n.m. n.m.Constituent (mg/L)Ca 5.1 5.9 2.4 32.0Mg 0.690 0.024 0.182 21.4Na 160 373 293 14.2K 54.8 57.6 71.4 17.8SO4 296 96 300 602S2O3 0.03 5.10 0.02 n.a.H2S 0.03 1.6 1.6 2.6Alkalinity (as HCO3) n.a. n.a. n.a. n.a.F 5.11 6.24 5.28 0.364Cl 109 601 463 0.6Br 0.3 1.7 1.4 <0.3SiO2 335 433 426 90.4NO3 0.55 1.63 1.41 0.37NH4 2.1 18 19 0.34Al 2.00 1.13 6.10 51.0Fe(tot) 2.63 0.088 2.15 5.33Fe(II) 2.62 0.088 2.15 5.28B 2.31 9.60 8.50 <0.20Li 0.840 4.70 4.24 0.040Sr 0.006 0.011 0.008 0.650Ba 0.065 <0.025 0.090 <0.015Mn 0.280 <0.006 0.06 0.51Zn 0.050 <0.009 0.016 <0.009Pb <0.11 <0.11 <0.11 <0.11Be 0.006 <0.001 <0.001 <0.001V <0.021 <0.021 <0.02 0.05Cr <0.21 <0.21 <0.21 <0.21Co <0.024 <0.024 <0.024 <0.024Ni <0.042 <0.042 <0.04 <0.04Cu <0.20 <0.20 <0.20 <0.20Cd <0.009 <0.009 <0.009 <0.009As(total) 0.29 2.4 1.5 <0.001DOC n.a. n.a. n.a. n.a.Sum cations (meq/L) 9.18 19.70 19.51 8.44Sum anions (meq/L) 8.82 19.09 17.87 8.78Charge imbalance (percent) 3.96 3.16 8.80 -3.93

23
Table 7. Site data and water analyses for miscellaneous springs--continued
Name Unnameddrainage,
BrimstoneBasin
Acid Ink Pot,Washburn Hot
Springs complex
Unnamedspouter,
Washburn HotSprings complex
Unnamed acidspring, Washburn
Hot Springscomplex
Sample code number 195WA115 95WA111 95WA112 95WA113Date collected 8/24/95 8/23/95 8/23/95 8/23/95Temperature (°C) 8 75.5 93 82Density (g/mL) at 20°C 0.9987 1.0012 0.9995 1.0019pH (field/lab) 4.79/4.03 2.92/2.49 6.71/6.77 1.83/1.63Spec. cond. (:S/cm) (field/lab) n.m.-/758 5790/7260 3250/3300 7670/13600Eh (V) 0.337 0.067 0.157 0.223D.O. (mg/L) n.m. 0.3 n.m. n.m.Constituent (mg/L)Ca 40.3 42 7.0 14.6Mg 41.0 19.7 4.40 9.30Na 11.7 31.0 11.0 11.0K 11.9 18.3 12.5 13.1SO4 430 3120 1280 4200S2O3 n.a. 0.09 0.13 n.a.H2S 0.4 8 <0.03 5.7Alkalinity (as HCO3) 7.23 n.a. 9.25 n.a.F 0.410 0.338 0.222 0.182Cl 0.4 <10 1.8 6.7Br <0.3 <22 <0.2 <0.2SiO2 88.0 262 263 316NO3 0.38 0.26 0.30 0.42NH4 0.19 884 478 628Al 27.5 34.0 0.820 68.0Fe(tot) 6.42 23.6 2.22 71.0Fe(II) 6.35 23.6 2.21 65.0B <0.20 9.40 14.3 15.0Li <0.055 0.050 0.050 <0.070Sr 0.530 0.240 0.050 0.490Ba <0.015 0.030 <0.015 0.070Mn 0.96 0.510 0.120 0.34Zn <0.009 0.080 <0.009 0.060Pb <0.11 <0.11 <0.11 <0.11Be <0.001 <0.001 <0.001 <0.001V <0.02 0.050 <0.021 0.11Cr <0.21 <0.21 <0.21 <0.21Co <0.024 <0.024 <0.024 0.060Ni <0.04 <0.042 <0.042 0.18Cu <0.20 <0.20 <0.20 <0.20Cd <0.009 <0.009 <0.009 <0.009As(total) <0.001 <0.001 <0.001 <0.001DOC n.a. n.a. n.a. n.a.Sum cations (meq/L) 7.16 51.12 26.06 57.90Sum anions (meq/L) 6.75 51.18 24.78 50.81Charge imbalance (percent)2 5.97 -0.11 5.04 13.1/-21.4
1This unfiltered sample contained visible colloidal precipitate.2Where two charge imbalance values appear, they are field pH C.I./lab pH C.I.

24
Table 8. 2H and 18O isotope analyses
Name Sample code *2H* *18O*
Ojo Caliente at source 94WA100 -142 -16.4Ojo Caliente at pool outflow 94WA101 -139 -16.3Ojo Caliente overflow channel 94WA104 -140 -16.3Ojo Caliente overflow channel 94WA106 -139 -16.2Ojo Caliente overflow channel 94WA107 -139 -16.1Ojo Caliente overflow channel 94WA108 -140 -16.1Ojo Caliente overflow channel 94WA110 -138 -15.9Ojo Caliente overflow channel 94WA112 -136 -15.4Frying Pan Spring at source 94WA113 -123 -11.9Frying Pan Spring overflow channel 94WA114 -121 -10.7Frying Pan Spring overflow channel 94WA116 -119 -10.8Frying Pan Spring overflow channel 94WA119 -119 -10.5Angel Terrace Spring at source 94WA120 -148 -18.2Angel Terrace Spring in pool 94WA121 -148 -18.2Angel Terrace Spring pool outlet 94WA122 -146 -17.9Azure Spring overflow channel 95WA101 -141 -15.9Azure Spring overflow channel 95WA101A -142 -15.5Azure Spring overflow channel 95WA101B -139 -15.5Azure Spring overflow channel 95WA102 -138 -15.7Azure Spring overflow channel 95WA103 -138 -15.6Azure Spring overflow channel 95WA104 -139 -15.6Azure Spring overflow channel 95WA105 -137 -15.3Azure Spring overflow channel 95WA106 -138 -15.4Azure Spring overflow channel 95WA107 -134 -15.2Azure Spring overflow channel 95WA108 -133 -15.0Echinus Geyser, Norris Geyser Basin 95WA109 -137 -16.4Cinder Pool, Norris Geyser Basin 95WA110 -124 -10.7Black Pool, Norris Geyser Basin 95WA116 -122 -9.7Unnamed drainage, Brimstone Basin, upper site 95WA114 -140 -18.6Unnamed drainage, Brimstone Basin, lower site 95WA115 -139 -18.9Acid Ink Pot, Washburn Hot Springs 95WA111 -106 -4.0Unnamed spouter, Washburn Hot Springs 95WA112 -115 -6.5Unnamed acid spring, Washburn Hot Springs 95WA113 -119 -7.3
*Permil relative to VSMOW.

25
Table 9. Comparison of historic data on sulfur species concentrations for selected locations
SO4 H2S S2O3 ClLocation and Data Source Date - - - - - - - - - - - - - - - - - mg/L - - - - - - - - - - - - - - - -
-Ojo CalienteAllen and Day (1935) 29 n.m. 5 324Thompson and others (1975) Jun 1966 n.m. n.m. n.m. 345Thompson and others (1975) Jun 1967 27 n.m. n.m. 331Thompson and others (1975) Sep 1972 24 1.3 n.m. 331Thompson and DeMonge (1996) Oct 1979 22 0.11 n.m. 338Thompson and DeMonge (1996) Oct 1981 14 0.29 n.m. 318Thompson and DeMonge (1996) Sep 1986 28 0.3 n.m. 326Thompson and DeMonge (1996) Sep 1990 15 0.28 n.m. 312This study Jun 1994 21 1.09 0.27 324
Azure SpringStauffer and others (1980) Sep 1974 50 1.5 n.m. 310This study Aug 1995 41 0.36 5.26 306
Frying Pan SpringAllen and Day (1935) 486 n.m. n.m. 4Thompson and others (1975) Sep 1973 335 n.m. n.m. 39This study Jun 1994 437 1.03 0.63 8.7
Angel TerraceAllen and Day (1935) 490 n.m. n.m. 178This study Jun 1994 547 3.01 0-0.6 165
Echinus GeyserGooch and Whitfield (1888) Aug 1884 232 trace n.m. 121Scott (1964) 310 n.m. n.m. 105White (unpub. data) 286 n.m. n.m. 108Rowe and others (1973) 284 n.m. n.m. 108Rowe and others (1973) 280 n.m. n.m. 115Rowe and others (1973) 270 n.m. n.m. 107Thompson and others (1975) Oct 1967 370 n.m. n.m. 106Thompson and Yadav (1979) 273 n.m. n.m. 103Thompson and DeMonge (1996) 120-360 0.01-0.12 n.m. 107-154This study 296 0.03 0.03 109
Cinder PoolWhite (unpub. data) Sep 1947 n.m. n.m. n.m. 668White (unpub. data) Sep 1957 n.m. n.m. n.m. 790White (unpub. data) Sep 1960 125 n.m. n.m. 727Rowe and others (1973) 87 n.m. n.m. 720Thompson and DeMonge (1996) 147 n.m. n.m. 569This study 96 1.6 15.1 601
1S4O6 . 1 mg/L.

26
REFERENCES CITED
Aiken, G. R., 1992, Chloride interference in the analysis of dissolved organic carbon by the wetoxidation method: Environmental Science and Technology, v. 26, p. 2435-2439.
Allen, E. T., and Day, A. L., 1935, Hot springs of the Yellowstone National Park: CarnegieInstitution of Washington Publication Number 466, 525 p.
American Public Health Association (APHA), 1985, Method 428C. Methylene blue method forsulfide in American Public Health Association, Standard methods for the examination ofwater and wastewater (14th ed.), p. 403-405.
Ball, J. W., Nordstrom, D. K., Jenne, E. A., and Vivit, D. V., 1998, Chemical Analyses of hotsprings, pools, geysers, and surface waters from Yellowstone National Park, Wyoming, andvicinity, 1974-1975: U.S. Geological Survey Open-File Report 98-182, 45 p.
Ball, J. W., and Nordstrom, D. K., 1991, User's manual for WATEQ4F, with revised thermodynamicdata base and test cases for calculating speciation of major, trace, and redox elements innatural waters: U.S. Geological Survey Open-File Report 91-183, 189 p.
Barnard, W. R., and Nordstrom, D. K., 1980, Fluoride in precipitation-I. Methodology with thefluoride-selective electrode: Atmospheric Environment, v. 16, p. 99-103.
Chen, K. Y., and Morris, J. C., 1972, Kinetics of oxidation of aqueous sulfide by O2: EnvironmentalScience and Technology, v. 6, p. 529-537.
Coplen, T. B., Wildman, J. D., and Chen, J., 1991, Improvements in the gaseous hydrogen-waterequilibrium technique for hydrogen isotope ratio analysis: Analytical Chemistry, v. 63, p.910-912.
Epstein, S. and Mayeda, T., 1953, Variation of 18O content of water from natural sources:Geochimica et Cosmochimica Acta, v. 4, p. 213-224.
Fishman, M. J., and Friedman, L. C., eds., 1989, Methods for determination of inorganic substancesin water and fluvial sediments. Techniques of water-resources investigations of the U.S.Geological Survey, Bk. 5., Chap. A1, p. 55-56.
Fournier, R. O., 1989, Geochemistry and dynamics of the Yellowstone National Park hydrothermalsystem: Annual Review of Earth and Planetary Sciences, v. 17, p. 13-53.
Fournier, R. O., Thompson, J. M., and Hutchinson, R. A., 1994, The geochemistry of hot springwaters at Norris Geyser Basin, Yellowstone National Park: Geothermal Resources CouncilT., v. 18, p. 177-179.
Gooch, F. A., and Whitfield, J. E., 1888, Analyses of waters of the Yellowstone National Park withan account of the methods of analysis employed: U.S. Geological Survey Bulletin 47, 84p.
27
Kharaka, Y. K., Mariner, R. H., Bullen, T. D., Kennedy, B. M., and Sturchio, N. C., 1991,Geochemical investigations of hydraulic connections between the Corwin Springs KnownGeothermal Resources Area and adjacent parts of Yellowstone National Park: in Sorey, M.L., ed., Effects of potential geothermal development in the Corwin Springs KnownGeothermal Resources Area,: U.S. Geological Survey Water-Resources InvestigationsReport 91-4052, p. F-1 - F-38.
Kennedy, V. C., Jenne, E. A., and Burchard, J. M., 1976, Back-flushing filters for field processingof water samples prior to trace-element analyses: U.S. Geological Survey Open-File Report76-126, 12 p.
Nordstrom, D. K., 1977, Thermochemical redox equilibria of ZoBell's solution: Geochimica etCosmochimica Acta, v. 41, p. 1835-41.
O'Brien, D. J., and Birkner, F. B., 1977, Kinetics of oxygenation of reduced sulfur species inaqueous solution: Environmental Science and Technology, v. 11, p. 1114-1120.
Reardon, J., Foreman, J. A., and Searcy, R. L., 1966, New reactants for the colorimetricdetermination of ammonia: Clinica Chimica Acta, v. 14, no. 3, p. 403-405.
Rolla, E. and Chakrabarti, C. L., 1982, Kinetics of decomposition of tetrathionate, trithionate, and
thiosulfate in alkaline media: Environmental Science and Technology, v. 16, p. 852-857.
Rowe, J. J., Fournier, R. O., and Morey, G. W., 1973, Chemical analysis of thermal waters inYellowstone National Park, Wyoming, 1960-65: U.S. Geological Survey Bulletin 1303,31 p.
Scott, R. C., 1964, Records in post earthquake quality of groundwater, in The Hebgen Lake,Montana, earthquake of August 17, 1959: U.S. Geological Survey Professional Paper 435,p. 179-184.
Shapiro, L., and Brannock, W. W., 1962, Rapid analysis of silicate, carbonate, and phosphate rocks:U.S. Geological Survey, Bulletin 1144-A, 56 p.
Smith, R. M., and Martell, A. E., 1976, Critical stability constants. Volume 4: Inorganic complexes:New York, Plenum Press, p. 76-77.
Solorzano, L., 1969, Determination of ammonia in natural waters by the phenolhypochloritemethod: Limnology and Oceanography, v. 5, p. 799-801.
Stauffer, R. E., Jenne, E. A., and Ball, J. W., 1980, Chemical studies of selected trace elements inhot-spring drainages of Yellowstone National Park: U.S. Geological Survey ProfessionalPaper 1044-F, 20 p.
Stookey, L. L., 1970, Ferrozine - a new spectrophotometric reagent for iron: Analytical Chemistry,v. 42, p. 779-781.
28
Thompson, J. M., and DeMonge, J. M., 1996, Chemical analyses of hot springs, pools, and geysersfrom Yellowstone National Park, Wyoming, and vicinity, 1980-1993: U.S. GeologicalSurvey Open-File Report 96-68, 66 p.
Thompson, J. M., and Hutchinson, R. A., 1981, Chemical analyses of waters from the BoundaryCreek Thermal Area, Yellowstone National Park, Wyoming: U.S. Geological SurveyOpen-File Report 81-1310, 15 p.
Thompson, J. M., Presser, T. S., Barnes, R. B., and Bird, D. B., 1975, Chemical analysis of thewaters of Yellowstone National Park, Wyoming from 1965 to 1973: U.S. Geological SurveyOpen-File Report 75-25, 58 p.
Thompson, J. M., and Yadav, S., 1979, Chemical analysis of waters from geysers, hot springs andpools in Yellowstone National Park, Wyoming from 1974 to 1978: U.S. Geological SurveyOpen-File Report 79-704, 48 p.
White, D. E., Hem, J. D., and Waring, G. A., 1963, Chemical composition of subsurface waters, inData of Geochemistry, 6th edition: U.S. Geological Survey Professional Paper 440-F, 67p.
White, D. E., Hutchinson, R. A., and Keith, T. E. C., 1988, The geology and remarkable thermalactivity of Norris Geyser Basin, Yellowstone National Park: U.S. Geological SurveyProfessional Paper 1456, 84 p.
Xu, Y., and Schoonen, M. A. A., 1995, The stability of thiosulfate in the presence of pyrite in low-temperature aqueous solutions: Geochimica et Cosmochimica Acta, v. 59, p. 4605-4622.
Xu, Y., Schoonen, M. A. A., and Strongin, D. R., 1996, Thiosulfate oxidation: catalysis of syntheticsphalerite doped with transition metals: Geochimica et Cosmochimica Acta, v. 60, no. 23,p. 4701-4710.
Xu, Y., Schoonen, M. A. A., Nordstrom, D. K., Cunningham, K. M., and Ball, J. W., 1998, Sulfurgeochemistry of hydrothermal waters in Yellowstone National Park: I. The origin ofthiosulfate in hot spring waters: Geochimica et Cosmochimica Acta, v. 62, p. 3729-3743.
Xu, Y., Schoonen, M. A. A., Nordstrom, D. K., Cunningham, K. M., and Ball, J. W., 2000, Sulfurgeochemistry of hydrothermal waters in Yellowstone National Park: II. Formation anddecomposition of thiosulfate and polythionate in Cinder Pool: J. Volcanol. Geotherm. Res.,v. 97, p. 407-423.
Zhang, J. -Z., and Millero, F. J., 1994, Kinetics of oxidation of hydrogen sulfide in natural watersin Alpers, C. N. and Blowes, D. W., eds., Environmental geochemistry of sulfide oxidation:Washington, District of Columbia, The American Chemical Society, ACS Symposium Series550, p. 393-409.
ZoBell, C. E., 1946, Studies on redox potential of marine sediments: 8. Other methods: Bulletin ofthe American Association of Petroleum Geologists, v. 30, p. 477-509.

29
APPENDIX

30
Table 10. Methods of analysisParameter or Element Descriptor pH PHSpec. cond. CONDEh EC1D. O. EC2Ca ICP, FAASMg ICP, FAAS, ZGFAASNa ICP, FAASK ICP, FAASSO4 IC1S2O3 IC2H2S COLOR1Alkalinity TITRF IC1, EC3Cl, Br IC1SiO2 ICP, COLOR2NO3 IC1NH4 COLOR3, COLOR4, IC3Al ICP, ZGFAASFe (total) ICP, COLOR5Fe (II) COLOR5B ICPLi FAASSr, Ba, Mn, Zn, Pb, Be, V ICPCr, Co, Ni, Cu, Cd ICPAs (total) ICP, FIASDissolved organic carbon DOC*2H ISOT1*18O ISOT2

Table 11. Explanation of methods of analysis[rsd, relative standard deviation]
DescriptorSpeciesDetermined Analyst(s) Equipment Used
Reference(s) orcomments
Typical rsd ordetection limit(mg/L)
COLOR1 H2S Cunningham Hach model DR-2000 UV-Vis absorptionspectrometer and Hach method # 8131 reagents
Method based on APHA(1985)
0.005
COLOR2 SiO2 Cunningham Hach model DR-2000 UV-Vis absorptionspectrometer
Method based on Shapiroand Brannock (1962)
3%, 0.4
COLOR3 NH4 R.C. Antweiler,USGS, Boulder,CO
Alpkem model RFA-300 flow injection analyzer Method based onSolorzano (1969)
3%, 0.012
COLOR4 NH4 Cunningham Hach model DR-2000 UV-Vis absorptionspectrometer and Hach method # 8155
Method based onReardon and others(1966)
COLOR5 Fe(II) andFe(total)
Ball Hewlett-Packard model 8452A diode arrayspectrometer (1992-1994) with 1 and 5 cm cells
Ferrozine method(Stookey, 1970)
3%, 0.0005
COND Spec. Cond. Authors Orion Research model 126 meter Automatic temperaturecorrection, conductancecheck with 0.0100 N KCl
#0.5%
DOC DOC G.R. Aiken,USGS, Boulder,CO
Oceanography International model 700 carbonanalyzer
Some samples werediluted to reduceinterference from Cl-
(Aiken, 1992)
~10%, 0.2
EC1 Eh Nordstrom, Ball Orion Research model 96-78-00 Pt electrode Electrode checked usingZoBell's solution (ZoBell,1946; Nordstrom, 1977),at the sample temperature
EC2 D.O. Authors Orion Research model 840 DO meter and probe Automatic sampletemperature andbarometric pressurecorrection
1%
EC3 F- Nordstrom Orion Research model 96-09 comb. F- electrode Barnard and Nordstrom(1980)
~3%

Table 11. Explanation of methods of analysis--continued
DescriptorSpeciesDetermined Analyst(s) Equipment Used
Reference(s) orcomments
Typical rsd,detection limit(mg/L)
FAAS Na, K, Ca,Mg, and Li
Cunningham Perkin-Elmer model 5000 flame atomic absorptionspectrometer with air/acetylene flame, single-slotburner head, and continuum background correction, inabsorption (Ca, Mg, Li, Na, K) or emission (Na*, K*)mode
1000 mg/L Cs ionizationbuffer.
~2%Na: 0.005(0.040*)K : 0.025(0.007*)Ca: 0.030Mg: 0.030Li: 0.003
FIAS As(total) Cunningham Perkin-Elmer model 5000 atomic absorptionspectrometer in absorption mode with a FIAS-200flow injection analysis system hydride generator,quartz cell, and furnace
Pre-reduction of As(V)using KI + HCl
-10%, 0.001
IC1 F-, Cl-, SO42-,
NO3-, and Br-
Schoonen, Xu,Cunningham
Dionex model 2000i/2010i ion chromatograph withAG4A guard and AS4A separator columns and anAnion Micromembrane Suppressor-II column
0.028 M NaHCO3 +0.022 M Na2CO3 eluent
2-3%, F- = 0.03,Cl- = 0.05,SO4
2- = 0.16,NO3
- = 0.09,Br- = 0.11
IC2 S2O32- Schoonen, Xu Dionex model 2000i/2010i ion chromatograph with
two AG4A guard columns and AS4A separatorcolumn and an Anion Micromembrane Suppressor-IIcolumn
0.028 M NaHCO3 +0.022 M Na2CO3 eluent
2-3%, 0.09
IC3 NH4 B. Kumler,USGS, Boulder,CO
Dionex model DX-300 ion chromatograph withCS12A IonPac column and 22 mN H2SO4 eluent
Analysis performed onyear-old samplespreserved in 1% HCl
~2%

Table 11. Explanation of methods of analysis--continued
DescriptorSpeciesDetermined Analyst(s) Equipment Used
Reference(s) orcomments
Typical rsd ordetection limit(mg/L)
ICP Al, As, B,Ba, Be, Ca,Cd, Co, Cr,Cu, Fe(total),K, Mg, Mn,Na, Ni, Pb,Si, Sr, V, Zn
Cunningham Leeman Labs Plasma-Spec III, simultaneous, multi-element, inductively coupled plasma spectrometer.Hildebrand grid nebulizer and polyethylene spraychamber. RF frequency - 27.5 MHZ at 1 kw. Arcoolant and nebulizer gas. Inter-element interferenceswere corrected with MEGACRUNCH software (J.W.Ball, unpub. data).
Analytical wavelengths -nanometers:Al - 309.27As - 193.70B - 249.68Ba - 455.40Be - 313.04Ca - 315.90Cd - 214.44Co - 228.62Cr - 205.55Cu - 324.75Fe - 238.20K - 766.46Mg - 279.08Mn - 257.61Na - 589.59Ni - 231.60Pb - 220.35Si - 288.16Sr - 407.77V - 292.40Zn - 213.86
~2% for allelementsAl: 0.220As: 0.170B : 0.090Ba: 0.020Be: 0.001Ca: 0.050Cd: 0.020Co: 0.020Cr: 0.045Cu: 0.070Fe: 0.150K : 0.870Mg: 0.090Mn: 0.060Na: 0.400Ni: 0.020Pb: 0.075Si: 1.02Sr: 0.001V : 0.010Zn: 0.005
ISOT1 *2H T.B. Coplen andJ.A. Hopple,USGS, Reston,VA (1994samples) and C.Kendall, USGS,Menlo Park, CA(1995 samples)
V.G. Micromass model 602 mass spectrometer Coplen and others (1991).Standardization againstVSMOW (*2H = 0 permil) and SLAP (*2H =-428 per mil)
1.5 per mil

Table 11. Explanation of methods of analysis--continued
DescriptorSpeciesDetermined Analyst(s) Equipment Used
Reference(s) orcomments
Typical rsd ordetection limit(mg/L)
ISOT2 *18O T.B. Coplen andJ.A. Hopple,USGS, Reston,VA (1994samples) and C.Kendall, USGS,Menlo Park, CA(1995 samples)
DuPont model 21-491 mass spectrometer Epstein and Mayeda(1953). Standardizationagainst VSMOW (*18O =0 per mil) and SLAP(*18O = -55.5 per mil)
0.1 per mil
PH [H+] Nordstrom, Ball Orion Research SA 250 meter, Orion Ross comb.electrode
Two buffer calibration atsample temp. using 9.18,7.00, 4.01, and 1.68 pHbuffers
0.02 pH units
TITR Alkalinity (asmg/L HCO3)
Ball Orion Research model 960/940 autotitrator,potentiometric detection
Fishman and Friedman(1989)
2%, 0.4
ZGFAAS Al, Mg Cunningham Perkin-Elmer Zeeman 5000 graphite furnace atomicabsorption spectrometer, with pyrolytically coatedgraphite platform cell and Ar purge gas
Analytical wavelength,nanometers:Al - 396.2Mg - 285.2Atomization temp.,°C:Al - 2550Mg - 1700Char temp., °C:Al - 1500Mg - 900Matrix modifier:Al - Mg(NO3)2Mg - none
~5%
Al: 0.005Mg: 0.0005

Table 12. Measurements of Standard Reference Waters[Number in brackets represents one sample standard deviation]
- - - - - - - - - - - - - Combined 1994 Data - - - - - - - - - - - - - - - - - - - - - - - - - - - Combined 1995 Data - - - - - - - - - - - - - -
Analytical USGSObserved
concentrationMost probable
value Analytical USGSObserved
concentrationMost probable
valueElement method SRWS - - - - - - - - - -mg/L - - - - - - - - - - method SRWS - - - - - - - - - - -mg/L - - - - - - - - - - Ca ICP T117 21.6 [0.5] 20.9 [1.2] ICP T117 21.5 [0.5] 20.9 [1.2]Mg ICP T117 10.3 [0.3] 10.05 [0.44] ICP T117 10.9 [0.4] 10.05 [0.44]Mg ZGFAAS T115 26.6 [1.1] 27.6 [1.0] ZGFAAS T117 9.47 [0.48] 10.05 [0.44]Na FAAS T111 61.2 [1.0] 53.8 [0.5] ICP T117 20.8 [0.6] 20.00 [1.26]Na ICP T117 20.6 [0.6] 20.00 [1.26] FAAS T117 18.9 [---] 20.00 [1.26]K FAAS T111 2.59 [0.06] 2.67 [0.07] ICP T117 <2.65 2.11 [0.19]K ICP T117 2.16 [0.35] 2.11 [0.19] FAAS T115 5.24 [0] 5.41 [0.32]K FAAS T117 2.01 [0.02] 2.11 [0.19]SO4 IC M102 423 [15] 420 [16]F IC M102 1.1 [0.2] 1.1 [0.1]Cl IC M102 40 [3] 44 [2]Br IC M102 <0.11 0.100 [0.022]SiO2 ICP T117 12.6 [0.8] 11.85 [0.64] ICP T117 12.7 [0.4] 11.85 [0.64]Al ICP T117 <0.35 0.079[0.0194] ICP T117 <0.32 0.0790 [0.0194]Al ZGFAAS T115 0.028 [0.002] 0.040 [0.020] ZGFAAS T117 0.074 [0.002] 0.0790 [0.0194]Fe (total) ICP T117 0.489 [0.015] 0.474 [0.0182] ICP T117 0.497 [0.015] 0.4740 [0.0182]B ICP T117 0.176 [0.024] 0.151 [0.021] ICP T117 0.197 [0.018] 0.151 [0.0208]Li FAAS T115 0.136 [0.002] 0.132 [0.012] FAAS T115 0.126 0.132 [0.012]Sr ICP T117 0.269 [0.009] 0.265 [0.011] ICP T117 0.273 [0.008] 0.265 [0.0111]Ba ICP T117 0.096 [0.005] 0.0985 [0.0063] ICP T117 0.098 [0.005] 0.0985 [0.0063]Mn ICP T117 0.216 [0.011] 0.220 [0.015] ICP T117 0.217 [0.006] 0.220 [0.0149]Zn ICP T117 0.179 [0.005] 0.176 [0.0093] ICP T117 0.182 [0.006] 0.176 [0.0093]Pb ICP T117 <0.113 0.005 [0.0013] ICP T117 <0.63 0.0050 [0.0013]Be ICP T117 0.004 [0.001] 0.0048 [0.0004] ICP T117 0.004 [0.001] 0.0048 [0.0004]V ICP T117 <0.015 0.0047 [0.0018] ICP T117 <0.013 0.0047 [0.0018]Cr ICP T117 <0.068 0.0103 [0.0016] ICP T117 <0.128 0.0103 [0.0016]Co ICP T117 <0.030 0.0043 [0.0007] ICP T117 <0.015 0.0043 [0.0007]Ni ICP T117 <0.030 0.0100 [0.0025] ICP T117 <0.028 0.0100 [0.0025]Cu ICP T117 <0.105 0.0060 [0.0018] ICP T117 <0.122 0.0060 [0.0018]Cd ICP T117 <0.030 0.0022 [0.0004] ICP T117 <0.006 0.0022 [0.0004]As (total) ICP T117 <0.26 0.0069 [0.0014] ICP T117 <0.22 0.0069 [0.0014]
1Number in square brackets represents 1 standard deviation.
![Research Article Sulfur Speciation in the Surface …downloads.hindawi.com/journals/jchem/2016/3672348.pdfstate of S in soil and marine sediments [, , ], providing information about](https://static.fdocuments.in/doc/165x107/5f0840737e708231d4211621/research-article-sulfur-speciation-in-the-surface-state-of-s-in-soil-and-marine.jpg)