Water and Wastewater Strategic Township Plan Warragul, Victoria · PDF fileWater and...
92
University of Southern Queensland Faculty of Engineering and Surveying Water and Wastewater Strategic Township Plan Warragul, Victoria A dissertation submitted by Darren James Wallace In fulfillment of the requirements of Courses ENG4111 and ENG4112 Research Project Towards the Graduate Diploma of Geomatics (GIS) Submitted: November, 2006
Transcript of Water and Wastewater Strategic Township Plan Warragul, Victoria · PDF fileWater and...

University of Southern Queensland
Faculty of Engineering and Surveying
Water and Wastewater Strategic Township Plan
Warragul, Victoria
A dissertation submitted by
Darren James Wallace
In fulfillment of the requirements of
Courses ENG4111 and ENG4112 Research Project
Towards the
Graduate Diploma of Geomatics (GIS)
Submitted: November, 2006
i
ABSTRACT
In the past, water authorities have been undertaking capital works expenditure on a
forward planning window of 18 months. Now under a more regulated State
Government regime, water authorities have to prepare more detailed plans showing
future capital expenditure over a five year period. These plans are then used to set price
tariffs for the business to cover those costs over that period.
With this in mind, the main objective of this dissertation was to prepare water and
wastewater strategic plans for Warragul, Victoria. These plans would then be adopted
by the organisation. Any recommendations from these strategic plans are then
forwarded onto Gippsland Water’s asset improvement department to undergo more
detailed planning and costing. These plans and costs are then submitted to the
regulatory for approval in Gippsland Water’s submission of the water plan. Water Plan
No.2 is due for submission by March 2007.

ii
DISCLAIMER
University of Southern Queensland Faculty of Engineering and Surveying
ENG4111 & ENG4112 Research Project
Limitations of Use The Council of the University of Southern Queensland, its Faculty of Engineering and
Surveying, and the staff of the University of Southern Queensland, do not accept any
responsibility for the truth, accuracy or completeness of material contained within or
associated with this dissertation.
Persons using all or any part of this material do so at their own risk, and not at the risk
of the Council of the University of Southern Queensland, its Faculty of Engineering
and Surveying or the staff of the University of Southern Queensland.
This dissertation reports an educational exercise and has no purpose or validity beyond
this exercise. The sole purpose of the course pair entitled “Research Project” is to
contribute to the overall education within the student’s chosen degree program. This
document, the associated hardware, software, drawings, and other material set out in
the associated appendices should not be used for any other purpose: if they are so
used, it is entirely at the risk of the user.
Prof R Smith Dean Faculty of Engineering and Surveying

iii
CERTIFICATION
I certify that the ideas, designs and experimental work, results, analyses and
conclusions set out in this dissertation are entirely my own effort, except where
otherwise indicated and acknowledged.
I further certify that the work is original and has not been previously submitted for
assessment in any other course of institution, except where specifically stated.
Darren James Wallace
Student Number: 0050005735
___________________________ Signature ___________________________ Date
iv
ACKNOWLEDGEMENTS
This study was made possible by several people who assisted me in many ways. I would like to express my sincere gratitude to the following people for there support and guidance along the way: § Associate Professor Frank Young, for your constructive comments and
marking in minor assessment leading up to this major body of work. § Mr. Ian Heafield, Mr. Paul Young, Mr. John Coulson, Ms Michelle Elvy and
Mr. David Smith all friends and colleges within the Planning and Development department of Gippsland Water. Your previous experience in planning was invaluable.
§ Gippsland Water as an organisation who supported me in both a time and financial manor which allowed my continuing study endeavors without sacrificing family time.
Darren James Wallace

v
TABLE OF CONTENTS
Abstract......................................................................................................................i Disclaimer..................................................................................................................ii Certification..............................................................................................................iii Acknowledgements...................................................................................................iv Table of Contents ......................................................................................................v List of figures...........................................................................................................vii List of Tables ..........................................................................................................viii List of appendices..................................................................................................... ix Nomenclature ............................................................................................................x Chapter 1. Introduction ......................................................................................3 Chapter 2. Literature Review ...............................................................................4
2.1 Background.................................................................................................4 2.2 Water ..........................................................................................................6 2.3 Wastewater..................................................................................................7
Chapter 3. Description of Study Area..................................................................8 3.1 Background.................................................................................................8 3.2 Population and Growth Rates......................................................................9 3.3 Future Land Requirements.........................................................................11 3.4 Level of Service and Standards...................................................................12
Chapter 4. Current System Demands and Standards ..........................................13 4.1 Water ........................................................................................................13 4.2 Wastewater................................................................................................14
Chapter 5. Future Growth Analysis and Option ................................................16 Chapter 6. Water Strategy..................................................................................17
6.1 Water Consumption...................................................................................17 6.2 Future Demand Forecast ...........................................................................17 6.3 Water Demand Forecast during Drought ...................................................18
6.3.1. Monthly Demand Pattern.................................................................18 6.3.2. Raw Water Capacity.........................................................................19 6.3.3. Raw Water Source............................................................................19
6.4 Environmental Flow Requirements Downstream of Pedersen Weir............22 6.5 Structural Condition of Major Assets..........................................................23
6.5.1. Pedersen Weir..................................................................................23 6.5.2. Pedersen – Warragul WTP Supply Pipeline.......................................23 6.5.3. Warragul WTP and Storage Basins ...................................................24
6.6 Basis of Cost Estimates..............................................................................24 6.7 Options.....................................................................................................26
6.7.1. Option 1 - No Further Development of the System..........................26 6.7.2. Option 2 - Increase Pedersen Weir’s Hydraulic Output.....................28 6.7.3. Option 3 - Pedersen Weir supply with Tarago Reservoir Water.........29
6.7.3.1. 6.7.3.1 Option 3A Pump Station at Tarago ...............................29 6.7.3.2. 6.7.3.2 Option 3B Pump Station at Rokeby...............................30
6.7.4. Option 4 - Transfer Bulk Water Entitlement to Tarago Reservoir.....31 6.7.4.1. 6.7.4.1 Option 4A Pump Station at Tarago ...............................32 6.7.4.2. 6.7.4.2 Option 4B Pump Station at Rokeby...............................32
6.7.5. Option 5 - Connection to the Moe - Yarragon Supply Main..............33 6.8 Discussion of Options...............................................................................34

vi
6.8.1. Option 4 Estimated Costs................................................................35 6.9 Conclusions...............................................................................................37 6.10 Recommendations ...........................................................................38
Chapter 7. Wastewater Strategy.........................................................................39 7.1 Introduction..............................................................................................39 7.2 Background and Future Development........................................................39 7.3 Existing System.........................................................................................39 7.4 Forecast Development...............................................................................40 7.5 System Upgrades .......................................................................................41 7.6 Solution.....................................................................................................42
7.6.1. Basis of Design................................................................................43 7.6.2. Design Life......................................................................................43 7.6.3. Design Flow Rate Relationship.........................................................43 7.6.4. Design Parameter Values..................................................................45
7.7 Catchments ...............................................................................................48 7.7.1. Warragul North East........................................................................48 7.7.2. Warragul South................................................................................49 7.7.3. Warragul West .................................................................................51 7.7.4. South West Outfall...........................................................................54
7.8 Warragul WWTP Buffer............................................................................55 7.9 Benefits.....................................................................................................56 7.10 Costs ...............................................................................................56
7.10.1. Basis of Capital Cost Estimates ........................................................57 7.11 Timing.............................................................................................59 7.12 Summary .........................................................................................59 7.13 Recommendation.............................................................................60
Reference.................................................................................................................61 Appendix.................................................................................................................63

vii
LIST OF FIGURES
Figure 6-1– Warragul Supply/Demand Impacts..................................................... 22

viii
LIST OF TABLES
Table 3-1 Gippsland Water Property Connections................................................... 9
Table 3-2 Warragul Growth Rates ......................................................................... 10
Table 3-3 Projected Connection Numbers............................................................. 10
Table 3-4 Land Requirements................................................................................ 11
Table 4-1 Plant Flows............................................................................................ 14
Table 6-1 Recent Annual Consumption by Category.............................................. 17
Table 6-2 Future Demand Forecast....................................................................... 18
Table 6-3 Monthly Demand Pattern ...................................................................... 18
Table 6-4 Tarago River Stream flow 1983 Summer Period ..................................... 19
Table 6-5 Quantity of Water Available in a Dry Summer........................................ 20
Table 6-6 Yearly Supply/Demand for an Average Year.......................................... 20
Table 6-7 Yearly Supply/Demand for a Drought Year........................................... 21
Table 6-8 Capital Cost Estimate Unit Rates ........................................................... 25
Table 6-9 Annual Operating Costs Estimate Unit Rates......................................... 25
Table 6-10 Summary of Estimate of Costs............................................................. 36
Table 7-2 Forecast Development, Warragul ........................................................... 41
Table 7-3 Wastewater Design Unit Flow Rate Parameters...................................... 47
ix
LIST OF APPENDICES
Appendix A Project Specification 1
Appendix B Gippsland Water Area 3
Appendix C Warragul Planning Boundaries 4
Appendix D Undeveloped Planning Areas 5
Appendix E Warragul Water Supply 6
Appendix F Warragul Wastewater Collection 7
Appendix G Water System Design Performance Criteria 8
Appendix H Wastewater System Design Performance Criteria 12
Appendix I Projected Infrastructure Provision for Warragul 16
Appendix J Warragul Sequencing Plan 19

x
NOMENCLATURE
ABS Australian Bureau of Statistics ADWF Average Dry Weather Flow ARI Average Return Interval ARnR Australian Rainfall and Runoff BWE Bulk Water Entitlement BZ1 Business Zone CAPEX Capital Expenditure CI Cast Iron CMPS&F Camp Scott and Furphy DAF Dissolved Air Flotation DN Nominal Diameter DWF Dry Weather Flow ESC Essential Services Commission EPA Environmental Protection Agency FRAB Flow Rate Attenuation Basin GMT General Management Team GW Gippsland Water Ha Hectare HL High Level IND1 Industrial Zone LDRZ Low Density Residential Zone kl Kilolitre L/S Litres per Second M Metre MSCL Mild Steel Concrete Lined ML Megalitres MOU Memorandum of Understanding MWH Montgomery Watson Houser O&M Operations and Maintenance Manual PDWF Peak Dry Weather Flow PS Pump Station ROS Regional Outfall Sewer PWWF Peak Wet Weather Flow RZ1 Residential Zone Seq Sequence SoO Statement of Obligations SPS Sewerage Pump Station TBL Triple Bottom Line Ten’t Tenement WHO World Health Organisation WSA Water Services Association WTP Water Treatment Plant WWTP Wastewater Treatment Plant

3
Chapter 1. Introduction
Gippsland Water services the area stretching from Drouin in the west to Sale in the
east and Briagolong in the north and Mirboo North in the south. Over 60,000 water
and 48,000 wastewater assessments are administered. Water and wastewater services
are provided to 41 towns incorporated within 21 water and 16 wastewater systems as
shown in Appendix B
Gippsland Water has a customer base that sets it apart from most water authorities.
Demand for product is dominated by a handful of major industries, some of which are
of state significance. Three of these are major power stations, a paper manufacturer
and an oil and gas platform and they require wastewater disposal services to operate.
The closure of any of the major customers could impact significantly on the revenue of
Gippsland Water.
The nature of rural water authorities such as Gippsland Water is that development is
concentrated into small towns widely dispersed. Accordingly the water and sewerage
systems tend to be discrete systems serving each locality.
This dissertation describes a study of future service requirements of the Warragul water
and wastewater systems to provide medium to long term security of supply for
Warragul and district.
A number of investigations have been carried out and proposals to supply the area
developed for Gippsland Water (GW) and other authorities. The most relevant
investigation is described in a report prepared by Camp Scott & Furphy (CMPS&F)
entitled, “Warragul Northern Basin Review”, February 1995. A previous report by Kinhill
Stearns entitled “Water Supply Master Plan for Warragul and Drouin” was prepared for
Tarago Water Board about 1987 also provides some relevant information. Information
contained in these reports and other relevant information obtained from GW
operations staff has been utilised during the course of the study described in this report

4
Chapter 2. Literature Review
2.1 Background
The Essential Services Commission (ESC) as the economic regulator of the water
businesses in Victoria is looking for more participation of the customers and
stakeholders in the decisions and future planning of the Authorities. This process of
engagement is fundamental in determining programs of work and in setting the prices
for charging rates ensuring both are appropriate to the needs and expectations of the
community. This requirement is further reinforced in the new Statement of Obligations
(SoO) of Gippsland Water to the Minister of Water, Victoria, dated 26 th July 2004.
Gippsland Water is reviewing its traditional approach to the provision of services. The
way that some things have been done in the past may no longer be appropriate of
sufficient in the new operating environment – including:
a) How long term planning for the future is carried out;
b) How the community, stakeholders and customers are consulted and their views
taken into account;
c) How services are provided and managed;
d) How decisions are made ( and the necessity to be more aware of the likely
future economic, environmental, social and cultural consequences of every
decision) and;
e) The requirement to work in a more inclusive, integrated, and coordinated way
(both within the Authority organisation and with others) towards the
achievement of common (and it is expected over time widely promoted and
supported), desired community outcomes.
Under the guiding principles of the Water Industry Regulatory Order the Essential
Services Commission has the authority to approve Gippsland Water’s future
submissions for proposed prices to apply from 1 July 2005.

5
Future Water Plan submissions to the Essential Services Commission rely on
comprehensive assessments of current and future expenditure of Gippsland Water to
meet its statutory and customer service requirements and standards. The expenditure
will be infrastructure related such as operations and maintenance, augmentation,
renewals and new works. However in addition the expenditure will incorporate
business costs in delivering all the services for which the Authority is responsible.
A key aspect of the regulatory framework is the requirement for water businesses to
establish a Water Plan. A water plan is required to be delivered to the ESC by a
regulated entity (such as Gippsland Water) under a Statement of Obligations.
Gippsland Water must include in the Water Plan: (Clause 7.3 Statement of
Obligations)
a) Outcomes to be delivered in the Regulatory Period with respect to Standards
and Conditions of Service and Supply, meeting future demands on the
Authority’s services and complying with any obligations specified in this
Statement, a Regulatory Obligation and other obligations imposed by or under
legislation; and
b) How the Authority proposes to deliver those outcomes; and
c) The proposed Prices to be charged for each of the Authorities Prescribed
Services
The Water Industry Regulatory Order sets out the process and regulatory principles
that will guide the ESC in deciding whether to approve the prices proposed within the
Water Plan.
The Minister of Water has issued a Statement of Obligations to impose on Gippsland
Water in relation to the performance of its functions and exercise of powers. The
statement of obligations commenced on 26 th July 2004 and will remain in place or
operate until it is revoked.
6
The guiding principles for Gippsland Water in performing its functions and providing
its services under the statement of obligations are:
a) Manage water resources in a sustainable manner; and
b) Effectively integrate economic, environmental and social objectives into its
business operations; and
c) Minimise the impact of its activities on the environment; and
d) Manage risk to protect public safety, quality and security of supply; and
e) Operate as efficiently as possible consistent with sound commercial practice;
and
f) Manage its business operations to maintain the long term financial viability of
the authority; and
g) Undertake continuous review, innovation and improvement; and
h) Collaborate with other public authorities and government agencies to take
account of regional needs.
2.2 Water
Gippsland Water’s water supply service functions are detailed under Part 8 of the Water
Act 1989. These functions are:
a) To provide, manage, operate and protect water supply systems, including the
collection, storage, treatment, transfer and distribution of water;
b) To identify community needs relating to water supply and to plan for the
future needs of the community relating to water supply;
c) To develop and implement programs for the conservation and efficient use of
water;
d) To investigate, promote and conduct research into any matter related to its
functions, powers and duties in relation to water supply;
e) To educate the public about any aspect of water supply.
7
Further to the above functions Gippsland Water’s Annual Report 03/04 (page 9) states
the following in regard to its strategic plan.
The achievement and maintenance of a high level of community confidence in the
safety, reliability and quality of the regions water supply system is a critical objective for
the Authority.
2.3 Wastewater
Gippsland Water’s wastewater service functions are detailed under Part 9 of the Water
Act 1989. These functions are:
a) To provide, manage and operate systems for the conveyance, treatment and
disposal of sewage and, if the Authority so decides, of trade waste;
b) To identify community needs relating to sewerage services and to plan for the
future needs of the community relating to sewerage services;
c) To develop and implement programs for the recycling and reuse of treated
wastewater;
d) To investigate, promote and conduct research into any matter which relates to
its functions, powers and duties in relation to sewerage services;
e) To educate the public about any aspect of sewerage.
Further to the above functions Gippsland Water’s 2003/2004 Annual Report 03/04
(page 9) states the following in regard to its strategic plan.
All domestic, commercial and industrial customers produce wastewater that must be
collected, transferred, treated and utilised to the benefit of the environment. The
protection of public health and the environment demands that all wastewater
infrastructures be operated and maintained skillfully to an acceptable standard.

8
Chapter 3. Description of Study Area
3.1 Background
Warragul is connected to the Pederson weir water supply system, located 100km east
of Melbourne along the road and rail transport corridor. Warragul has recently been
bypassed by the Princes Freeway construction, but is still linked to the metropolitan
railway services that make it more attractive as a base to commute to and from the
eastern suburbs of Melbourne GHD Management Engineering Environment 2005, p.4
Warragul is located on gentle rolling hills and valleys, with land subject to inundation
running east-west through the centre of town. Main roads follow ridgelines that run
north-south. The town is surrounded by a series of hills and valleys that reflect the
pattern of minor watercourses in the rural hinterland. The urban landscape is
predominantly low density dwellings, with self contained areas of open space and
recreation in strategic locations.
Warragul is the largest population centre within the Shire of Baw Baw and serves as the
regional centre for commerce, retail, industrial, educational and recreation facilities.
The business and employment centre of Warragul contains many of Gippsland
regional services for banking and government agencies, and services.
The Tarago River is the common raw water source for the area. Warragul, Drouin,
Darnum, Buln Buln, Rokeby and Nilma are currently supplied from Pedersen Weir.
The harvested water is transferred to the Warragul WTP by a 24 km 450 mm diameter,
MSCL gravity pipeline. A pump station supplies Neerim South from either the
Pedersen Weir or the Tarago Reservoir.
During times of drought additional water can be drawn from Tarago Reservoir by
arrangement with the owner of the reservoir, Melbourne Water. Some additional water
is supplied to Drouin during high demand, from the Labertouche Weir and Treatment
Plant. The reliability of this source during periods of extended dry weather is limited.
There are plans to decommission this source at a later date.

9
Warragul has a current population of 11500 people and is located just 20kms east of
the Melbourne Metropolitan Region boundary within the Shire of Baw Baw Shire
Council Planning Scheme Website. Warragul has experienced significant population growth
of 4.1% over the past 5 years and is expected to continue to grow due to its proximity
to Melbourne. Increasing population has placed pressure on existing water and
wastewater infrastructure in Warragul.
There is pressure on Gippsland Water as the regional water authority, to develop short
and long term planning strategies for water and wastewater service to cope with this
expansion. As a consequence, a water and wastewater Township plan using the current
planning scheme needs to be developed for accommodate future growth in Warragul
for the next 20 years (2026). The township plan will need to identify township growth,
identify the different options and optimum solutions for each of the development
areas and ultimately list the capital works programme, with timings.
3.2 Population and Growth Rates
Population and demand predictions are drawn from Gippsland Water’s customer
billing records showing the number of connected properties within Warragul. This
information has been sourced from data in Gippsland Water Annual Reports between
2000/01 to 2004/05. Billing records have been preferred over published population
figures due to the fact that the Australian Bureau of Statistics (ABS) population zones
do not align with reticulation zones.
Table 3-1 Gippsland Water Property Connections Period Residential Non-Residential
2000/01 3964 648
2001/02 4065 663
2002/03 4227 671
2003/04 4439 663
2004/05 4646 686
2 Yr Ave Growth 2.3% 1.7%
5 Yr Ave Growth 4.1% 1.4%

10
Meaningful forecasting of future population is complicated by recent progress in
expansion in Melbourne’s east, and future developments to road infrastructure such as
the Hallam and Pakenham bypasses will further improve access to Melbourne. There
is a lot of potential for Warragul to expand, but population expansion is impossible to
forecast with certainty. For this reason, future demands used in this study where based
on the above figures and presented to Gippsland Water General Management Team
(GMT) for approval.
Table 3-2 Warragul Growth Rates Period Growth
2006/07 – 2012/13 3.0%
2013/14 – 2025/26 2.0%
The above figures were approved at May 2006 GMT meeting.
Table 3-3 Projected Connection Numbers Year No Period Residential
Connections
Non
Residential
Connections
2000/01 3964 648
2001/02 4065 663
2002/03 4227 671
2003/04 4439 663
2004/05 4646 686
2005/06 4785 707
1 2006/07 4929 728
5 2010/11 5548 819
10 2015/16 6246 922
15 2020/21 6896 1018
20 2025/26 7613 1124
20 Year Lot Demand 2828 417

11
3.3 Future Land Requirements
Future land requirements are based on residential 1 (RZ1), low density residential
(LDRZ), industrial (IN1) and commercial (BZ1) are within the Baw Baw Shire
planning scheme development overlay shown as Appendix C. These areas only, are
considered for water and wastewater services in future planning considerations in
Gippsland Water.
Results from Table 3 show, an additional 2828 residential lots and 417 non residential
lots will need to be developed in Warragul over the study period to satisfy demand.
Based on industry figures of 10 lots per hectare for residential and 15 lots per hectare
non residential GHD Management Engineering Environment 2005, p.13 the following land
will be developed,
Table 3-4 Land Requirements Lot Type Residential
10 per/ha
Industrial &
Commercial
15 per/ha
Required Lots 2828 417
Infill Area (ha) 202.2ha 34.6ha
Infill Lots 2022 519
Difference -806 +102
Appendix D - Undeveloped Planning Areas shows the currently undeveloped land.
Given current growth existing residential infill will be exhausted prior to 2010. Results
from Table 4 shows a deficiency of 806 residential lots over the study period, which
equates to 80.6ha that will need to be rezoned.
GHD Management Engineering Environment 2005 p.29 highlights stage 2 of residential land
release for Warragul will yield an additional 3094 lots and will satisfy this reports study
period. See Appendix D.

12
3.4 Level of Service and Standards
Gippsland Water currently reports against a number of regulatory standards, internal
business performance targets and various industry benchmarking measures.
Service delivery standards are set down in Gippsland Water’s Customer Charter, which is
a public document.
Under the requirements of the new Statement of Obligations (SoO), which became
effective at 26 July 2004, a new customer charter has been developed to operate.
The Essential Services Commission will have the responsibility to approve the new
customer charter specific for the authority. Through the use of a customer service code
the ESC will impose certain obligations on businesses in relation to general terms and
conditions of service.
The service delivery standards set down in the customer charter only apply to those
customers that don’t have an individually negotiated agreement. Hence they apply to
the following customer segments:
§ Residential
§ Small commercial and industrial
§ Institutional
The Customer Charter clearly outlines the commitments, responsibilities and standards
of service that Gippsland Water will provide to its customers. It sets out Gippsland
Water’s obligations to its customers and is consistent with the Essential Services
Commission’s Customer Service Code for Victorian metropolitan and rural urban
water authorities.
13
Chapter 4. Current System Demands and Standards
4.1 Water
The source supply is Pedersen Weir on the Tarago River, upstream of the Tarago
Reservoir. The weir's capacity is about 11 ML. Water flows via a 450mmMSCL pipe
which has a hydraulic capacity of 13.7ML/day, by gravity to the Warragul Water
Treatment Plant. Wallace.D Water System Profiles 2000
The Warragul Water Treatment Plant is a 17 ML/day Dissolved Air Flotation (DAF)
Water Treatment Plant. It has been designed to produce treated water for the
townships of Warragul, Drouin, Darnum, Buln Buln, Rokeby and Nilma and rural
users along the supply pipelines, of a quality that consistently complies with the
Australian Drinking Guidelines 1996, for drinking water quality. Aqua clear Technology
P/L 2000
Treated water is stored in The North Basin which has an effective storage capacity of
39 ML and stands adjacent to the Treatment Plant.
A 450 mm diameter MSCL pipeline carries treated water from the North Basin to the
South Basin. There are two booster pumps along the pipe which assist in times of high
demand. Warragul is supplied directly off the pipeline but water can be supplied from
either North or South Basins, depending on demand. A booster pump and a header
tank feed off the South Basin to supply Warragul South consumers.
The South Basin is located off Warragul-Korumburra Road, approximately 3.2 km
south of the Warragul Township. The South Basin is supplied with treated water from
the North Basin. The Basin holds 50 ML of water. The water is chlorinated prior to
going to the customer to destroy any bacteriological re-contamination which may have
occurred while being held in the open storage basins. Wallace.D, Water System Profiles
2000

14
Using existing information generated from treatment records, Scada and hydraulic
modeling software the current average day and peak day demands for Warragul are
1. Average Day Demand = 5.2ML/day
2. Peak Day Demand = 9.0ML/day
See Appendix E – Warragul Water Supply Schematic
4.2 Wastewater
The Warragul sewerage system was constructed in the 1930s and has been augmented
over the decades to cope with urban growth and development. A major upgrade of the
plant was undertaken in 1965 in which a trickling filter, three sludge digesters and four
lagoons were constructed. The early 1990s saw the construction of an extra facultative
lagoon and an increase in capacity of the other four. The most recent upgrade,
achieving full biological nutrient removal, was completed in 1997. OTV-Kruger 1999
The sewerage reticulation system consists of 7 minor and 1 major pump station. The
major pump station, No.2 pump station, pumps directly into the waste water treatment
plant.
The Warragul WWTP is designed to meet the load conditions specified in Table 5
below.
Table 4-1 Plant Flows ADWF 4.2ML/day 175m3/hr
PWWF 12.6ML/day 525m3/hr
Max Flow 30.0ML/day 1250m3/hr
After treatment, effluent from Warragul WWTP is discharged to Hazel Creek, which is
part of the Latrobe Basin.

15
Using existing information generated from treatment records, Scada and wastewater
modeling software document the current average day and peak day flows for the
wastewater collection system are;
1. Average Dry Weather Flow (ADWF) = 3.9ML/day (MWH June 2005)
2. Peak Wet Weather Flow (PWWF) = 18.1ML/day (MWH June 2005)
See Appendix F – Warragul Wastewater Collection

16
Chapter 5. Future Growth Analysis and Option
Infill area identified in Appendix C is the preferred priority areas for development and
should occur prior to the development of expansion areas GHD Management Engineering
Environment 2005.
All infill areas will be fully developed in this study with the shortfall evenly distributed
among the identified expansion areas in Appendix D.
The performance of each Gippsland Water asset is reviewed from time to time to
assess its capacity to enable Gippsland Water to meet its customer obligations.
Performance requirements for the assets to ensure standards are met are set out in
Appendix G and Appendix H to ensure security of supply.
The performance requirements apply on the day of review and throughout the
planning period, of 20 years. If an asset requires upgrading, the upgraded capacity will
be based on the performance required during the appropriate planning period

17
Chapter 6. Water Strategy
6.1 Water Consumption
The annual consumptions for each category for the last four years are shown in Table
6. The detail break-up of consumption in 01/02 is not available.
Table 6-1 Recent Annual Consumption by Category Year Res
ML Major
Ind ML
Other Ind. Com ML
Total Ind ML
Other ML
Total ML
01/02 1330 1047 2587 02/03 866 360 230 590 580 2626 03/04 1130 436 827 899 204 3496 04/05 1086 326 360 686 249 2707 There are several features associated with the above information:
• In 03/04 Gippsland Water undertook to meter all currently unmetered
properties. This is reflected with the drop in the “other” consumption
figures.
• Industry usage has a major impact on overall consumption. This can vary by
100% in any one year.
6.2 Future Demand Forecast
The above variation in consumption, particularly industrial, makes it difficult to predict
future demands in the study area. Four years of data has been examined, 01/02 to
04/05. An upper and lower limit of consumption is established based on this data. A
four-year average has also been established. Table 7 shows the variation in
extrapolations over the study period.

18
Table 6-2 Future Demand Forecast 2005 2015 2025 2035
Annual Demand Lower Limit (ML)
2587 3409 4156 5066
Upper Limit (ML) 3496 4698 6314 8485 4 Year Average (ML) 2854 3835 5155 6927 Peak Weekly Demand (ML/d)
10.2 13.7 18.4 24.7
Peak Daily Demand (ML/d)
12.2 16.4 22.0 29.6
The timing of the options examined in this study will be based on the 4-year demand
average.
6.3 Water Demand Forecast during Drought
In the Camp Sco tt & Furphy 1995 report reference is made to the shortfall in supply
during a drought period. Reference is also made to a report to Gippsland Water “Bulk
Entitlement Conversion to Two Water Supply Systems” by Hydro Technology - Jan
1995.
The data used in the above report is included to show the basis for further
extrapolation.
6.3.1. Monthly Demand Pattern
The monthly demand pattern (04/05) is summarised in Table 8
Table 6-3 Monthly Demand Pattern Month Average
Year Dry Years
Jan 147 306 Feb 131 297 Mar 132 267 Apr 131 211 May 136 225 June 152 166 July 164 158 Aug 170 204 Sept 207 192 Oct 183 246 Nov 176 258 Dec 161 313

19
This table indicates that the historic trend for water use in a dry year is an increase by a
factor of approximately 1.2 over an average year use.
6.3.2. Raw Water Capacity.
The existing pipeline between Pedersen weir and Warragul WTP has a capacity of
approximately 13.7 ML/day.
An allowance of 0.7 ML/day is allowed for consumers upstream of the treatment plant
and an estimated 1.0 ML/day is allowed for sludge and filter backwash losses at the
plant.
The maximum water available to consumers is estimated at 12.0 ML/day which is
reduced as the availability of source water reduces.
6.3.3. Raw Water Source
Currently there is sufficient stream flow in the Tarago River to cater for the draw off
via Pedersen weir for normal system demands.
In extreme dry periods there is insufficient flow available to cater for the full carrying
capacity of the Pedersen Weir - Warragul WTP pipeline. Stream flow records Table 9
for a dry summer period (1983) indicate available raw water quantities.
Table 6-4 Tarago River Stream flow 1983 Summer Period
MONTHLY SUPPLY , M L
Daily Supply, ML/day
October 600 19.4 November 420 14.0 December 540 17.4 January 400 12.9 February 340 12.1 March 400 12.9 April 390 13.0 May 560 18.1
Allowing for losses through upstream consumers and treatment plant usage, water
available to consumers in a dry summer period is shown in Table 10

20
Table 6-5 Quantity of Water Available in a Dry Summer Oct Nov Dec Jan Feb Mar Apr May Available Supply ML/day
12.0 12.0 12.0 11.2 10.4 11.2 11.3 12.0
Assuming that all storage’s can be maintained at full supply level at the start of the
summer period, the supply/demand and shortfalls for an average year is shown in
Table 11 and a dry year is shown in Table 12
This information is extrapolated, based on population increase, to estimate the
expected shortfall of supply during such periods in future years. It is assumed that June
to September that 12 ML/d is available from Pedersen Weir.
Table 6-6 Yearly Supply/Demand for an Average Year 2005 2015 2025 2035
Supply Demand* Excess Demand Excess Demand Excess Demand Excess
Deficit from
Supply
Deficit from
Supply
Deficit from
Supply
Deficit from
Supply Month
(ML) (ML) (ML) (ML) (ML) (ML) (ML) (ML) (ML) May 372 147 225 197 175 265 107 356 16 June 372 131 241 176 196 236 136 317 55 July 372 132 240 177 195 238 134 320 52 August 372 131 241 176 196 236 136 317 55 September 372 136 236 183 189 245 127 330 42 October 372 152 220 204 168 274 98 369 3 November 360 164 196 220 140 296 64 398 -38 December 372 170 202 228 144 307 65 413 -41 January 372 207 165 278 94 373 -1 502 -130 February 336 183 153 246 90 330 6 444 -108 March 372 176 196 236 136 317 55 427 -55 April 360 161 199 216 144 290 70 390 -30 Excess/Deficit
2298 1867 997 (-179)

21
Table 6-7 Yearly Supply/Demand for a Drought Year 2005 2015 2025 2035
Supply Demand Excess Demand Excess Demand Excess Demand Excess
Deficit from
Supply
Deficit from
Supply
Deficit from
Supply
Deficit from
Supply Month
(ML) (ML) (ML) (ML) (ML) (ML) (ML) (ML) (ML) May 372 225 147 302 70 406 -34 546 -174 June 372 166 206 223 149 300 72 403 -31 July 372 158 214 212 160 285 87 384 -12 August 372 204 168 274 98 368 4 495 -123 September 372 192 180 258 114 347 25 466 -94 October 372 246 126 331 41 444 -72 597 -225 November 360 258 102 347 13 466 -106 626 -266 December 372 313 59 421 -49 565 -193 760 -388 January 347 306 66 411 -39 553 -181 743 -371 February 336 297 39 399 -63 536 -200 721 -385 March 372 267 105 359 13 482 -110 648 -276 April 360 211 149 284 76 381 -21 512 -152 Excess/Deficit
1561 583 -731 -2497
From the above summaries the following deductions are made:
• by 2025 the existing raw water supply and treated water storage’s will not
be adequate for normal demand.
• by 2015 there will be insufficient water available from Pedersen Weir to
meet the demands during a drought period.
Potential solutions for these shortfalls could be:
• Provide additional storage capacity in demand area.
• Development of a supplementary raw water source with Pedersen Weir.
• Development and use of an alternate raw water source other than
Pedersen Weir.
• Introduce water restrictions during the summer period in the demand area.
• Introduce water restrictions all year in the demand area.
22
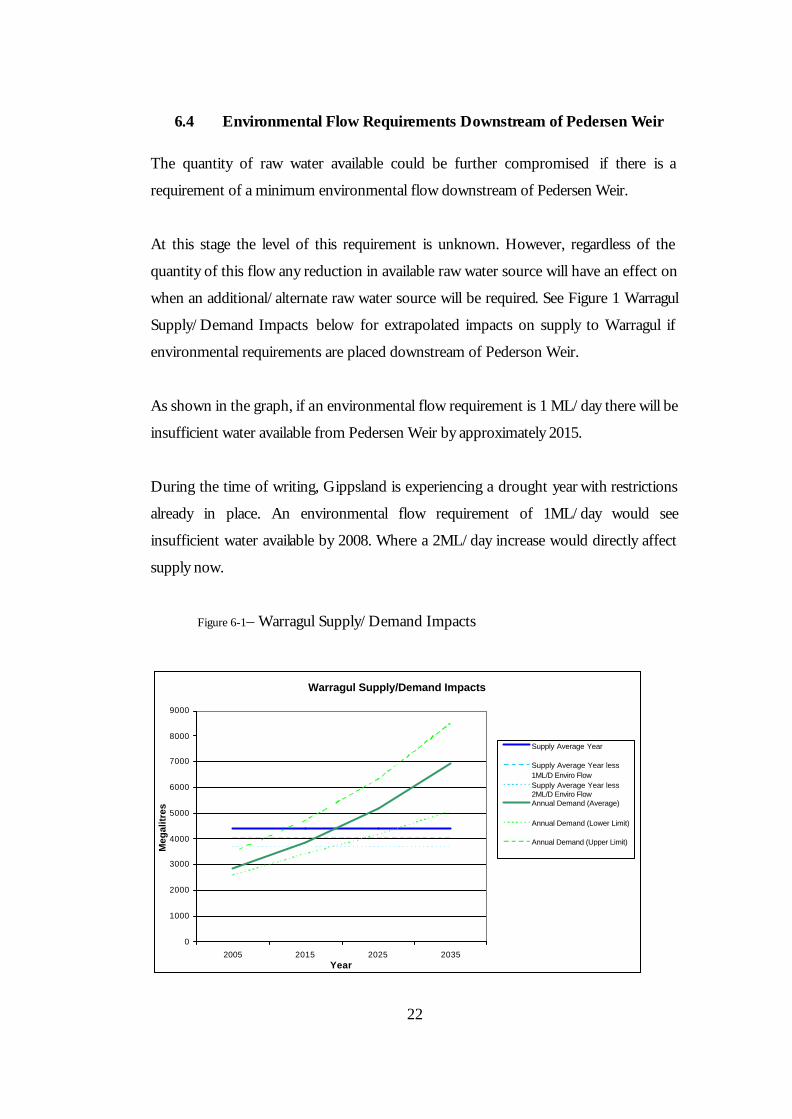
6.4 Environmental Flow Requirements Downstream of Pedersen Weir
The quantity of raw water available could be further compromised if there is a
requirement of a minimum environmental flow downstream of Pedersen Weir.
At this stage the level of this requirement is unknown. However, regardless of the
quantity of this flow any reduction in available raw water source will have an effect on
when an additional/alternate raw water source will be required. See Figure 1 Warragul
Supply/Demand Impacts below for extrapolated impacts on supply to Warragul if
environmental requirements are placed downstream of Pederson Weir.
As shown in the graph, if an environmental flow requirement is 1 ML/day there will be
insufficient water available from Pedersen Weir by approximately 2015.
During the time of writing, Gippsland is experiencing a drought year with restrictions
already in place. An environmental flow requirement of 1ML/day would see
insufficient water available by 2008. Where a 2ML/day increase would directly affect
supply now.
Figure 6-1– Warragul Supply/Demand Impacts
Warragul Supply/Demand Impacts
0
1000
2000
3000
4000
5000
6000
7000
8000
9000
2005 2015 2025 2035Year
Meg
alit
res
Supply Average Year
Supply Average Year less1ML/D Enviro FlowSupply Average Year less2ML/D Enviro FlowAnnual Demand (Average)
Annual Demand (Lower Limit)
Annual Demand (Upper Limit)

23
6.5 Structural Condition of Major Assets
6.5.1. Pedersen Weir
Pedersen Weir is a reinforced concrete arch structure approximately 4.6m high and
29m long and was constructed in June 1963. The weir impounds approximately 11ML
and except close to the weir structure, the water is relatively shallow. The structure is in
good condition. The weir has been constructed in such a way that would allow it to be
raised by approximately 1.8m. Because of the narrow steep nature of the valley this
would increase the storage marginally.
The weir does suffer from silting problems that reduces its storage capacity. The rough
ground upstream of the weir makes it difficult to clear the silt by mechanical means.
Access to the site is difficult because of the nature of the terrain. De-silting is usually
conducted using the two manually operated scour valves in the base of the dam. Use of
these scours is somewhat limited because of environmental restrictions on their use.
There is no accurate measurement of flows passing the weir into the river. The scour
valves are not metered and the weir has no depth gauge. The weir is remote from a
power supply and if metering was to be considered an alternative power source, e.g.
solar, would need to be considered. Connection of gathered information to the
telemetry system would also be required and may be possible with a relayed radio link.
During wet weather, it is common that the water turbidity increases significantly. There
is no measurement of this factor at the weir. It is only the knowledge of the operators
that this issue is able to be controlled. Unexpected increase in the turbidity of the water
could have an effect on the performance of the Warragul WTP.
6.5.2. Pedersen – Warragul WTP Supply Pipeline
The 24 km 450 mm diameter MSCL pipeline is in good condition. A major factor for
its good performance is that it has extensive cathodic protection system in place. The
pipeline construction was commenced in the late 1950’s and completed in 1963.
Approximately 2 km of the pipeline is under the Tarago Reservoir.

24
There have been two occurrences, 1978 and 1988, of the pipeline failing beneath the
Tarago Reservoir. The second incident was attributing to inadequate repair of the first
failure. There have been no incidents since 1988.
6.5.3. Warragul WTP and Storage Basins
The existing Warragul WTP and storage’s are in very good condition. The WTP
underwent a major upgrade in 2000. The existing plant was upgraded to a Dissolved
Air Flotation (DAF) at a cost of $1.5 million. The north and south water storages are
both concrete lined basins with a plastic liner and floating cover. This maintains the
water quality to World Health Organisation (WHO) standards.
6.6 Basis of Cost Estimates
Cost estimates prepared during this study have been calculated for the purpose of
comparison between schemes. Capital costs estimates of mechanical equipment and
pipes are based on budget prices obtained from suppliers. Cost estimates for
construction works are based on information obtained from past projects of a similar
nature and experience with like projects. Cost estimates for administration, operations
and maintenance are based on information provided by GW on existing assets. Other
sources of cost information have been the CMPS&F and the Kinhill reports. Costs in
these reports have been indexed to reflect current costs.
For comparison of costs and the timing of major infrastructure requirements the
following factors area considered:
• A 1 ML/d environmental flow is required downstream of Pedersen Weir.
• to meet the needs of water requirements in a dry season, additional
infrastructure should be operational by 2015
• supplemented water supply to meet average demand will be required from
2020
• payment to Melbourne Water for extra water to commence from 2020
25
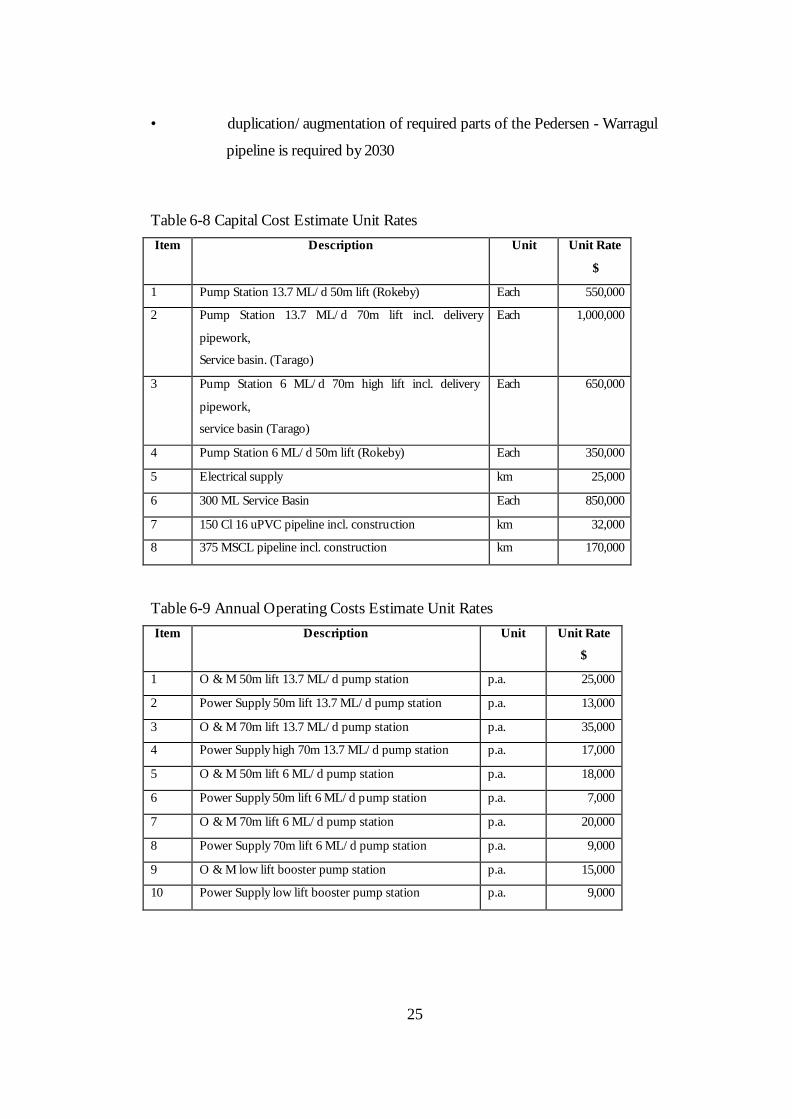
• duplication/augmentation of required parts of the Pedersen - Warragul
pipeline is required by 2030
Table 6-8 Capital Cost Estimate Unit Rates Item Description Unit Unit Rate
$
1 Pump Station 13.7 ML/d 50m lift (Rokeby) Each 550,000
2 Pump Station 13.7 ML/d 70m lift incl. delivery
pipework,
Service basin. (Tarago)
Each 1,000,000
3 Pump Station 6 ML/d 70m high lift incl. delivery
pipework,
service basin (Tarago)
Each 650,000
4 Pump Station 6 ML/d 50m lift (Rokeby) Each 350,000
5 Electrical supply km 25,000
6 300 ML Service Basin Each 850,000
7 150 Cl 16 uPVC pipeline incl. construction km 32,000
8 375 MSCL pipeline incl. construction km 170,000
Table 6-9 Annual Operating Costs Estimate Unit Rates Item Description Unit Unit Rate
$
1 O & M 50m lift 13.7 ML/d pump station p.a. 25,000
2 Power Supply 50m lift 13.7 ML/d pump station p.a. 13,000
3 O & M 70m lift 13.7 ML/d pump station p.a. 35,000
4 Power Supply high 70m 13.7 ML/d pump station p.a. 17,000
5 O & M 50m lift 6 ML/d pump station p.a. 18,000
6 Power Supply 50m lift 6 ML/d pump station p.a. 7,000
7 O & M 70m lift 6 ML/d pump station p.a. 20,000
8 Power Supply 70m lift 6 ML/d pump station p.a. 9,000
9 O & M low lift booster pump station p.a. 15,000
10 Power Supply low lift booster pump station p.a. 9,000

26
6.7 Options
6.7.1. Option 1 - No Further Development of the System
This option is based on the assumption that no additional water supply source is
developed. Main elements of the proposal are:
⇒ Continue to use Pedersen Weir as the main water supply source.
⇒ Neerim Sth. and district supplemented with Tarago Reservoir water.
⇒ Tarago Reservoir to supply water on an as needs basis to the rest of the
area during drought periods.
⇒ No further development of water storage basins (raw or treated) in the
demand areas.
⇒ No further development of supply system in the demand areas.
Costs
While there are no capital costs or appreciable increase in annual costs there will be
costs to the organisation. These are assessed as:
1. Loss of revenue due to inability to supply water on demand to
residential properties.
The figures used in the economical analysis are based on the deficiency in supply for a
normal year. Costs are based on a current charge of $ 0.50/kl. This impact comes in to
effect in 2025.
The impact on industrial supply has not been assessed. However, it is possible that
litigation may occur depending on how the supply agreements are structured.
2. Impact of poor publicity on GW because of deterioration of service.

27
Deterioration of service is expected to have a direct impact on customers in about
2025. It would be expected that there would be no more than the normal complaints
for the first few years. However as the deterioration of service becomes more common
there will be an increase in customer complaints which would involve articles in local
papers and eventually broader news agencies. This would also attract the attention of
local politicians and local members of State parliament. In the economical analysis it is
assumed that for the first few years there will only be one incident per year increasing
to four per year in 2036.
Melbourne Water has recently introduced an estimated cost, as a result of poor
publicity, on the organisation. This is assessed as $ 250,000 per incident.
The impact on GW would not be as significant as this amount. Based on population
alone, GW has a customer base of 133,000 compared to 3 million in Melbourne or
about 5%. Using this as a base the cost to GW is assessed at $12,500 per incident.
28
6.7.2. Option 2 - Increase Pedersen Weir’s Hydraulic Output
Supply Neerim Sth and District with Tarago Reservoir Water
This option is based on increasing the output of Pedersen Weir with in installation of a
booster pump station at the weir or further down the delivery main. Additional storage
in the demand area could be used to manage the additional quantity of raw water. This
however would have a limited life as the demand will outstrip supply by 2025. An
alternate option is to increase the size of the weir to capture extra water. This has
limited use for the same reason. Main elements of the proposal are:
⇒ Construction of booster pump station at Pedersen Weir or possibly
Rokeby.
⇒ Provision of a power supply to the pump station at Pedersen Weir.
⇒ Neerim Sth and district supplied only from Tarago Reservoir.
⇒ Acceptance of a reduced river flow downstream of Pedersen Weir
Costs:
Capital:
2020
Pump Station at Pedersen $350,000
Power supply to PS approx. 10 km $250,000
TOTAL $600,000
2030
Additional supply main approx 24 km $ 4,080,000
Annual:
Power supply p.a. $9,000
Maintenance p.a. $20,000

29
6.7.3. Option 3 - Pedersen Weir supply with Tarago Reservoir Water
Supply Neerim Sth and District with Tarago Reservoir Water
This option is based on drawing additional water from Tarago Reservoir to meet the
demands of the system. The extra water can either be drawn either directly from
Tarago or from the Tarago-Westernport pipeline at Rokeby. Main elements of the
proposal are:
⇒ Construction of a 6 ML/d pumps station at Tarago Reservoir
discharging into Pedersen Weir - Warragul WTP pipeline.
⇒ Alternatively construct a 6 ML/d pump station at Rokeby.
⇒ Acceptance by the owner of Tarago Res. (Melbourne Water) on the
scheme.
⇒ Neerim Sth and district supplied only from Tarago Reservoir.
6.7.3.1. 6.7.3.1 Option 3A Pump Station at Tarago
Costs:
Capital:
2020
Construction 6 ML/d pump station 70m lift $650,000
2030
Additional supply main approx 10 km $1,700,000
Annual:
Power supply p.a. $9,000
Maintenance p.a. $20,000
Extra water requirements Varies

30
6.7.3.2. 6.7.3.2 Option 3B Pump Station at Rokeby
Capital:
2020
Construction 6 ML/d pump station 50m lift $350,000
2030
Additional supply main approx 5 km $850,000
Annual:
Power supply p.a. $7,000
Maintenance p.a. $18,000
Extra water requirements Varies

31
6.7.4. Option 4 - Transfer Bulk Water Entitlement to Tarago Reservoir
Supply Neerim Sth and district with Tarago Reservoir Water
This option is based on using Tarago Reservoir as the main source of raw water for the
system. It involves the transfer of all GW bulk water entitlements from Pedersen Weir
to Tarago. These entitlements plus any extra demands are drawn out of Tarago via
pump station. Main elements of the proposal are:
⇒ Retrieving bulk water entitlement from Tarago Reservoir in addition to
any extra requirement purchased from Melbourne Water.
⇒ Acceptance of this proposal by Melbourne Water.
⇒ Construction of a pump station at Tarago Reservoir discharging into
Pedersen Weir - Warragul WTP pipeline
⇒ Decommissioning/removal of Pedersen Weir
⇒ Decommissioning of Pedersen Weir - Warragul WTP pipeline
upstream of Tarago Reservoir.
⇒ Note: additional option is to extract the water for Warragul from the
Tarago - Westernport pipeline at Rokeby enabling an extra length of
the Pedersen-Warragul pipeline to be decommissioned. Cost benefit of
this option is to be further examined.
32
6.7.4.1. 6.7.4.1 Option 4A Pump Station at Tarago
Costs:
Capital:
2020
Construction 13.7 ML/d pump station 70m lift $1,000,000
2030
Additional supply main approx 10 km $ 1,700,000
Annual:
Power supply p.a. $17,000
Maintenance p.a. $35,000
Extra water requirements Varies
6.7.4.2. 6.7.4.2 Option 4B Pump Station at Rokeby
Capital:
2020
Construction 13.7 ML/d pump station 50m lift $550,000
2030
Additional supply main approx 5 km $850,000
Annual:
Power supply p.a. $13,000
Maintenance p.a. $25,000
Extra water requirements Varies

33
6.7.5. Option 5 - Connection to the Moe - Yarragon Supply Main
Supply Neerim Sth and District with Tarago Reservoir Water
This option is based on connection to the Moe supply system to supplement the
existing supply system. It will require a new pipeline from Yarragon to Warragul Nth
storage basin. It is also likely that a booster pump station may be required. The main
elements of this proposal are:
⇒ Continue to use Pedersen Weir as the main water supply source
⇒ Neerim Sth. and district supplemented with Tarago Reservoir water.
⇒ Construction of a 150 pipeline from Yarragon to Warragul Nth storage
basin
⇒ Construction of a booster pump station
⇒ Adequate capacity in Moe - Yarragon supply main to supplement
Warragul area during high demand. (This will require further
investigation).
Costs:
Capital:
2020
Construction of 15 km of 150 uPVC pipeline, $480,000
Construction of booster station $250,000
Total $730,000
2030
Additional supply main approx 24 km $4,080,000
Annual:
Power supply p.a. $9,000
Maintenance p.a. $15,000
34
6.8 Discussion of Options
Options 1, 2, 3 (A &B) and 5 continue to depend on Pedersen Weir as the main source
of supply for the Warragul area. Several factors will effect consideration of these
options.
• Requirement of an undetermined environmental flow downstream of
Pedersen Weir will dramatically effect the timing of the need for an
additional raw water source to be brought on line. Each 1 ML/d
requirement will bring the need approximately 10 years closer. By 2025
the available supply at Pedersen will be exceeded by demand.
• The existing Pedersen - Warragul gravity main has a maximum
deliverable useable capacity of 12 ML/d (allowing for system losses). By
approximately 2025 the demand will also exceed the ability of the
pipeline to get water to Warragul. A additional supply main will be
required for the main source of supply. Including a booster pump on the
existing pipeline will enable the timing of construction of the additional
supply line to be deferred. However, its need will only be deferred not
eliminated. Option 3A and 3B reduce the length of the duplication
required.
Option 1 and 2 will not meet the needs and expectations of GW customers beyond
2020. By 2030, the available supply from Pedersen Weir, even if supplemented with an
additional pipeline, will not meet customer demands. Deterioration in service will result
in customer dissatisfaction and poor publicity for GW.
Option 3 (A & B) while still dependent on Pedersen Weir as the major raw water
source, has the backup of an additional source from Tarago Reservoir.
Options 4 (A & B) have the major benefit of tapping the larger raw water source of
Tarago Reservoir. However, the acceptance of Melbourne Water of this option, and
Option 3, is necessary for these options to be viable. Negotiates on Bulk Water
Entitlement at Tarago will need to be finalised to ensure all costs on these options are
captured.
35
It should be noted that design drawings, prepared by Garlick & Stewart, already exist
that could be used for option 4A.
Option 5 is dependent on the availability of excess water from the Moe supply area to
supplement the Warragul demands. This issue is yet to be examined in detail. However,
the long supply line, possibly requiring a booster pump increases the capital cost of this
option. Duplication of the existing supply main to Pedersen Weir will still be required.
6.8.1. Option 4 Estimated Costs
The cost estimates presented above are summarised in Table 13. The table shows the
capital costs of the additional assets that are required by 2020 and the additional
pipeline required by 2030. The annual costs are those associated with the operation of
the new assets. The cost of additional water required to meet demands are not shown
but have been factored in the economical analysis figures.

36
Table 6-10 Summary of Estimate of Costs Description Option
1
Option
2
Option
3A
Option
3B
Option
4A
Option
4B
Option
5
Capital
2020
2030
$,000
1450
4080
650
1700
350
850
1000
1700
550
850
730
4080
Annual
(Excl Extra
Water Costs
from 2025)
$,000
29
29
29
52
38
24
Economic
Evaluation
(Incl Extra
Water Costs
From 2030)
(4%, 8%, 15%)
$,000
518
140
17
1674
540
96
1071
378
79
716
247
50
1401
518
115
904
326
70
1593
528
99
The options of extraction water from the Tarago - Westernport pipeline at Rokeby
(Options 3B and 4B) appears the most favourable. This is regardless of the extra cost
from Melbourne Water of the supply at this point. The major savings occur from the
reduction in cost of the supply duplication main.

37
6.9 Conclusions
Based on population predictions, the Warragul water supply area will require
supplementation of its raw water source by 2020. The current source, Pedersen Weir,
has insufficient source water to meet demands. During a drought event the available
water from this source is further reduced.
In addition to an additional raw water source the existing Pedersen - Warragul gravity
pipeline will require supplementing by 2030. Provision of a booster pump on the
existing pipeline will not provide additional supplies because of the lack of source
water.
The Tarago Reservoir provides a significant source of raw water that is likely to meet
the system demands. Availability and costs associated with this water is dependent on
negotiations of a Bulk Water Entitlement Agreement with Melbourne Water. There are
also a number of water quality issues of this source that also need to be resolved.
The major physical assets are generally in good condition with significant useful life
remaining.
Significant savings can be made in future capital expenditure if the length of
duplicate/replacement supply main is reduced. These savings add to the strengths of
the options that extract water from the Tarago - Westernport pipeline at Rokeby.

38
6.10 Recommendations
It is recommended that GW:
1. Resolve the issue of the environmental flow requirements downstream
of Pedersen Weir.
2. Resolve the issue of the Bulk Water Entitlement Agreement at Tarago
Reservoir with Melbourne Water.
3. Because of the uncertain future of supply from Pedersen Weir, prepare
a long term management plan based on Option 4B, Extraction of Raw
Water from the Tarago - Westernport Pipeline at Rokeby, for the
development of the Warragul and district water supply area.
39
Chapter 7. Wastewater Strategy
7.1 Introduction
Warragul has had sewerage services since about 1938 and some of the elements of the
system are approaching the end of their useful life. Currently there is a significant
amount of residential development proposed all around Warragul and there are
approved capital works, which will be started within the next two years. There needs
to be an agreed strategy to ensure the orderly, sustainable, cost effective development
of the sewerage system to enable the community to be properly serviced over the next
100 years or so.
7.2 Background and Future Development
As noted above, Warragul has had a reticulated sewerage system for nearly 60 years.
This section describes the sewerage system, the population growth forecast for
Warragul and the sewer system upgrades required as a result of aging assets and the
forecast increased load on the systems.
7.3 Existing System
The Warragul sewerage system consists of four major catchments - the north east
catchment, the central catchment, the southern catchment and the western catchment
– discharging to the WWTP via an influent pump station (SPS). The WWTP is located
to the east of the town in the valley of Hazel Creek a tributary of the Little Moe River
which in turn is a tributary of the Moe River in the Latrobe River Catchment. The
north east catchment discharges directly to the WWTP influent SPS by gravity. The
Central and Southern catchments connect to a common gravity outfall sewer in
Queens St which is also connected to the WWTP influent SPS. The western catchment
is connected to the WWTP by a pump station and rising main which discharges to a
pressure main via a weir structure near the corner of Mason and Queen Sts.
The WWTP has been progressively upgraded as the township has developed since
1938. The influent pump station was replaced about 2004; the original sedimentation

40
tanks and trickling filters were augmented by lagoons during the 1950s and replaced
with a biological nutrient removal extended aeration plant about 1998. The WWTP will
be modified by the addition of more effective grit removal and screening equipment
and chemical dosing for Phosphorus removal during 2006. The upgraded WWTP is
expected to be able to service the community then until the population approaches
20,000 about 2022.
The major outfall sewer serving the central southern and western catchments was
upgraded by the addition of a pressure sewer between Queen St and the WWTP
influent SPS about 1960. The western catchment SPS has been re-equipped and had
minor upgrades from time to time, but the sewer system is generally unchanged from
that originally constructed. It has been extended to service additional areas as they were
developed.
7.4 Forecast Development
The population of Warragul at 2001 was about 10,500 persons and about 4230
allotments according to the bureau of Statistics data. The urban population is forecast
to increase at an average of three percent per annum for the foreseeable future. This
strategy presented herein is based on this rate of growth continuing for the effective
life of this scheme.
The Shire of Baw Baw is the planning authority for the area and it has proposed
zonings around the edges of the township for urban development. These limits are
well inside the natural catchment boundaries so it is possible that in the future the
planning scheme boundaries could be extended. In this event, additional load would be
applied to any sewer system constructed to serve the currently proposed urban zoned
areas. It would be prudent for this strategy to propose means of servicing the
development of the full catchment should that occur in the future.
Based on the 2001 ABS data and the forecast three percent growth rate, the forecast
population for Warragul is as set out in the following table. The shire of Baw Baw
requested input into the preferred sites for future development under the planning
scheme and GW is currently required by the Essential Services Commission to make

41
forecasts of the year each future development will commence. The development areas
as advised in letter Cor/06/2381 Appendix I and development plan Cor/06/2407
Appendix J and their forecast development dates are included in the following table.
Table 7-1 Forecast Development, Warragul
Forecast Population Year
Persons Lots
Development Area
Present 10,500 4,230 Existing
2011 5,725 Infill
2013 6,265 Infill
2014 6,265 Seq2
2016 16,300 6,600 Seq3
2021 18,900 7,700 Seq3
2026 21,900 8,900 Seq3
2031 25,400 10,300 Seq3
2032 10,425 Seq4
2036 29,400 11,825 Seq4
2038 12,455 Seq5
2041 34,100 13,800 Seq5
2046 39,500 16,015 Seq5
2047 16,665 Seq6
2051 45,800 18,500 Seq6
7.5 System Upgrades
GW has a program which assesses the condition of each reticulation sewer over a five
year cycle. The program reviews the condition and critically of each sewer based on a
condition/risk procedure and identifies reticulation sewers which require renovation or
upgrade. The renovation work is carried out progressively as the defective sewer is
identified. The reticulation sewer upgrade work resulting from this condition
assessment program is not included in this strategy.

42
There are no other known deficiencies within the Warragul sewer system other than
some access chambers located between Hazel Creek and the Freeway near the
Warragul Hospital and inadequacies as a result of age associated with SPS2, the pump
station serving the western catchment.
This strategy is primarily concerned with the augmentation of the system required to
service the growing township. As augmentation or extension of trunk sewer works is
found to be required, the condition of any nearby assets will be assessed and they will
be considered for replacement by the new works if appropriate.
In addition to the condition/consequence/criticality sewer assessment program
outlined above, GW carries out an assessment of the hydraulic capacity of its major
sewer systems having created digital models of the hydraulic capacity of its major sewer
schemes. These models are based on the proprietary line sewer flows modeling
software INFOWORKS. At about five year intervals GW undertakes a program
involving and gathering normal flow rate data and extreme flow rate data resulting
from infrequent storm activity in the sewer catchment and this flow rate data is used to
calibrate its digital sewer models.
A program of gathering sewer flow rate data was undertaken during the later months
of 2005 for the Warragul sewer system. Those data have been used to further calibrate
the Warragul digital model and identify sewer reaches that are stressed or under
capacity.
The 2005 flow rate data has identified hydraulic deficiencies in the SPS2 pump station
system and in the Logan Park sewer system. These deficiencies have been recognised
in the development of the sewerage strategy described herein.
7.6 Solution
For servicing each of the development areas, an investigation was undertaken to
evaluate the options and recommend a holistic strategic approach. No other recent
allied studies have been completed but an internal study report entitled Warragul
Sewerage Report on SPS2 System Upgrade Options by Abeysinghe.N, has been
43
complete for one Warragul catchment. The preliminary planning of the upgrade of the
North West Sewer system is being carried out under Capital Database Project 2237.
The recommendation for each of the specific area are described below and illustrated
in Appendix J.
7.6.1. Basis of Design
As noted above GW has created computer models of its significant sewer schemes
based on INFOWORKS. These models are very sturdy but are not readily adaptable
for the analysis of a range of disparate sewer scheme scenarios involving alternative
gravity sewers and pump systems. Accordingly, the preliminary design of the various
alternative options is based on a simpler digital model of the subject alternatives based
on Excel as described below. Once the favoured schemes have been identified, they
will be analysed using the computer model to verify the outcomes of the simpler Excel
based models.
7.6.2. Design Life
Sewer reticulation, pump station structures, rising mains and the like need to be
designed and sized for their ultimate design life of 60 years.
Pumps, electrical, equipments and sizes are designed for 20 year design life.
7.6.3. Design Flow Rate Relationship
Sewer design flows are based on a number of factors associated with permanent
infiltration, storm infiltration, peaking factors and factors of safety allowance for
imponderables. For these preliminary design purposes GW uses Excel models in
which these factors are related to the design flows by the following empirical
relationships:

44
Average Dry Weather Flow Rate (ADWF)
ADWF = Fs.(P.q + A c.C + A. (Ip ))/86400
Where the symbols have the meanings:
ADWF - Average dry weather flow rate, L/s
Fs - Small area uncertainty factor
P - Allotments, Number
q - Unit sewage flow rate, L/lot/d
Ac - Area of Non Urban Use zones, Ha
C - Unit non urban flow rate, L/Ha/day
A - Area sewered, Ha
Ip - Unit permanent infiltration, L/Ha/day
The small area uncertainty factor, Fs, ranges from a value of 2 for small areas with
nominal flow rates less than 6.0L/s, to a value of 1 for larger areas with flow rates in
excess of 100L/s. The actual values are listed in the Excel model.
45
Peak Dry Weather Flow Rate (PDWF)
PDWF = Fs.((P.q + Ac.C).r + A.Ip)/86400
Where the additional symbols have the meanings:
PDWF - Peak Dry Weather flow rate, L/s
r - Ratio between average and peak sewage flow rates
And
Peak Wet Weather Flow Rate (PWWF)
PWWF = Fs.( (P.q + Ac.C + A. (Ip + Is))/86400
Where the additional symbols have the meanings:
PWWF - Peak wet weather flow rate, L/s
Is - Unit Storm water Infiltration, L/Ha/day
For this study the flow rates from the non urban areas have been taken to be the same
as the equivalent domestic flow rates so with the exception of the Warragul Linen
Laundry and the nearby Hospital the non urban contributions have not been used
directly in this study. The flow rate values are calculated at each location where flow
rates are required usually at the location of changes of pipe size or grade, at significant
junctions or at pump stations. The required flow rate data is based on catchment data
readily available from reliable sources.
7.6.4. Design Parameter Values
As noted above, GW has recently completed the calibration of the digital model of its
Warragul sewerage system. Calibration involves the collection of rainfall intensity and
sewer flow rate data over a six to eight week period during late spring when there is
likely to be high intensity rainfall events. These data are then used to adjust the
parameters within the INFOWORKS model so that the flow rates forecast by the
46
model for any actual sewer at a particular time, closely match the actual flow rates
recorded during the monitoring period.
This calibration material is available for inclusion in the Excel model used for this
study. The average and peak dry weather flow rate parameters were readily available
from the data but the storm related infiltration rates were more difficult to enumerate
because the design event is a five year average return interval (ARI) but the only
relevant storm event during the monitoring period was a one year ARI event.
The unit sewerage flow rate was found to be 530L/Lot/d. This value is low compared
to historical values; thought to be as a result of the reduced number of persons/lot as
family units become smaller. There is increasing government pressure to maximise the
use of urban infrastructure by increasing development densities in existing urban areas.
It is therefore prudent to adopt a higher value for the unit sewage flow rate parameter.
A multiplier of 1.2 has been adopted for this study, making the unit sewerage flow rate
640L/Lot/d.
The permanent Infiltration factor was found to be 460L/ha/d which is low compared
with other systems. It probably reflects the freely draining topography of the township
so a value of 500L/ha/d has been adopted for this strategy.
The storm related infiltration data resulting from the one year ARI was adjusted to
establish the five year ARI parameter. The adjustment involved identifying the
frequency of the actual storm event, one year ARI. The infiltration rate was calculated
by comparing storm and normal hydrographs and Is1 was found to be 32,000L/ha/d.
Based on the intensity/duration/frequency chart published by the Bureau of
Meteorology for Warragul, the ratio Is5/Is1 is 1.75.
The current edition of the publication Australian Rainfall and Runoff (ARnR) provides a
series of relationships to model runoff from rainfall on surface catchments. These
relationships also apply to sewer system rainfall driven flow rates with analogous
parameters. The simplest relationship is the Rational Formula which provides that
runoff is directly proportional to storm intensity, catchment area, and catchment
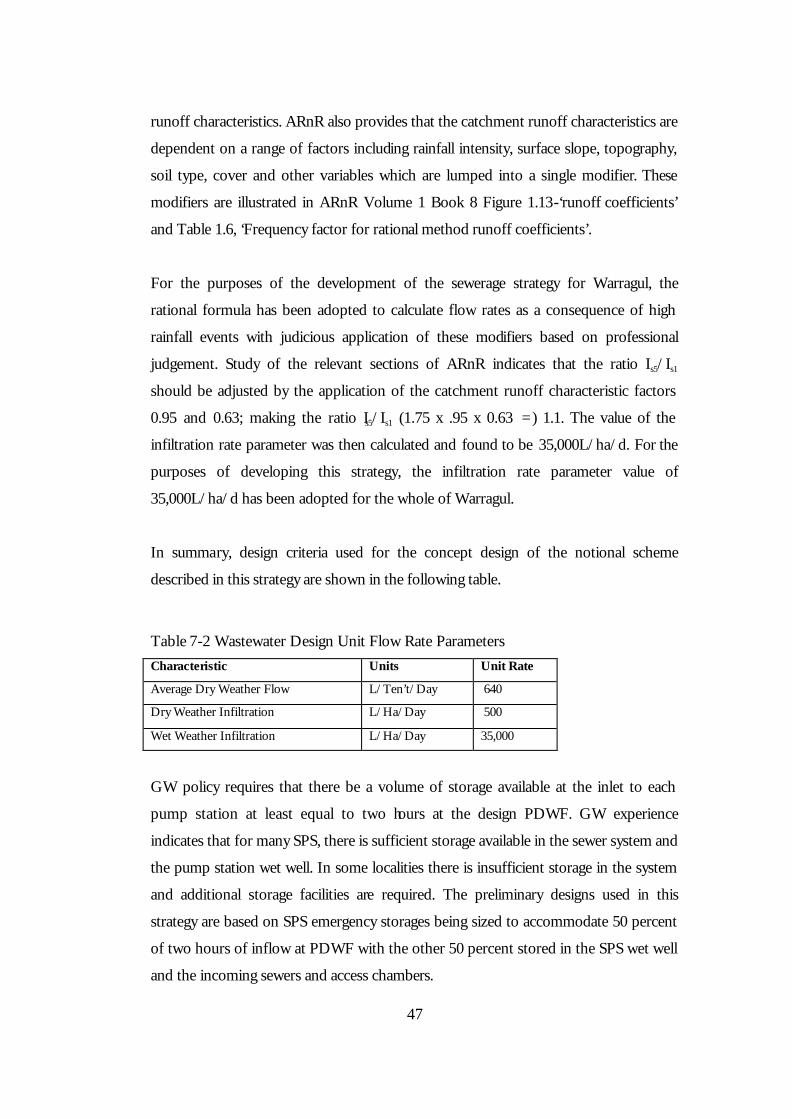
47
runoff characteristics. ARnR also provides that the catchment runoff characteristics are
dependent on a range of factors including rainfall intensity, surface slope, topography,
soil type, cover and other variables which are lumped into a single modifier. These
modifiers are illustrated in ARnR Volume 1 Book 8 Figure 1.13-‘runoff coefficients’
and Table 1.6, ‘Frequency factor for rational method runoff coefficients’.
For the purposes of the development of the sewerage strategy for Warragul, the
rational formula has been adopted to calculate flow rates as a consequence of high
rainfall events with judicious application of these modifiers based on professional
judgement. Study of the relevant sections of ARnR indicates that the ratio Is5/Is1
should be adjusted by the application of the catchment runoff characteristic factors
0.95 and 0.63; making the ratio Is5/Is1 (1.75 x .95 x 0.63 =) 1.1. The value of the
infiltration rate parameter was then calculated and found to be 35,000L/ha/d. For the
purposes of developing this strategy, the infiltration rate parameter value of
35,000L/ha/d has been adopted for the whole of Warragul.
In summary, design criteria used for the concept design of the notional scheme
described in this strategy are shown in the following table.
Table 7-2 Wastewater Design Unit Flow Rate Parameters Characteristic Units Unit Rate
Average Dry Weather Flow L/Ten’t/Day 640
Dry Weather Infiltration L/Ha/Day 500
Wet Weather Infiltration L/Ha/Day 35,000
GW policy requires that there be a volume of storage available at the inlet to each
pump station at least equal to two hours at the design PDWF. GW experience
indicates that for many SPS, there is sufficient storage available in the sewer system and
the pump station wet well. In some localities there is insufficient storage in the system
and additional storage facilities are required. The preliminary designs used in this
strategy are based on SPS emergency storages being sized to accommodate 50 percent
of two hours of inflow at PDWF with the other 50 percent stored in the SPS wet well
and the incoming sewers and access chambers.

48
The other flow rate parameters are characteristics of the sub-catchments being
analysed and are presented in the Excel model.
7.7 Catchments
7.7.1. Warragul North East
The existing gravity sewer system almost has the capacity to serve the proposed infill
areas. When these have been developed the provision of sewerage to additional areas
will require a duplicate sewer to be constructed up the creek valley north of the
WWTP, the North East Interceptor. The North East Interceptor System will consist
of about 8,500m of 225 DN, 300 DN, 375 DN, 450 DN and 600 DN sewer, a 60L/s
SPS with emergency storage and about 900m of 250 ND pressure main with suitable
discharge end ventilation.
These works will be constructed in a succession of stages to serve the proposed
developments as they are progressed. The works will nominally be as follows:
Construct:
• About 2011 construct 1300m of 600 DN North East Interceptor sewers North
West from the WWTP to just north of Sutton St.
• About 2014 construct about 600m of 375 DN Twin Ranges Branch sewers up
the unnamed street to the property boundary north of Baw Baw Drive as part
of Sequence 2 development.
• About 2032 construct the Copeland’s Rd SPS system to serve the Sequence 4
area about two kilometres north of the WWTP. The Copeland’s Rd SPS
system will consist of an SPS near the south west corner of Sequence 4 on
Copeland’s Rd and a rising main west along the southern boundary of the
development to the Twin Ranges Branch sewer. If the Sequence 4 area is
under one ownership, the Copeland’s Rd SPS system will not be a shared
facility. However as it is likely the development will be under a multitude of
ownerships, this SPS system and the associated trunk sewers, the Copeland Rd
Trunk sewer system, will be shared facilities. GW will therefore be required to
contribute to the cost of the trunk sewers within this catchment. The Copeland
49
Rd Trunk sewer system will consist of about 3600m of 225 DN, and 300 DN
sewers. The pump station system will consist of a 60 L/s SPS with 50kL
emergency storage and about 900m of 225 DN pressure main with suitable
ventilation.
• About 2014 the North East Interceptor sewer will be extended about 1500m
as a 450 DN sewer through the existing developments, northwards to Stoddart
Rd and on through the Seq2 area, to the Seq5 area.
• About 2041 construct the Stoddart/Lillico Seq5 area system to serve the Seq5
area between Stoddarts and Lillico Rds. The Stoddarts/Lillico Seq5 area
system will consist of a branched system of gravity sewers. If this Seq5 area is
under the one ownership, the system will not be a shared facility. However as it
is likely the development will be under a multitude of ownerships, these trunk
sewers will be shared facilities, mostly financed by GW. The trunk sewer
system will consist of about 1600m of 225 DN, and 300 DN sewers.
Note that the infill area, with the Seq3 and Seq4 areas between Brandy Creek Rd and
the northern end of Bowen St, will be able to be served by the existing systems.
7.7.2. Warragul South
The existing gravity sewer system almost has the capacity to serve the proposed infill
areas with small extensions to the existing reticulation system. However care may be
required to ensure the incidence of overflows to the Hazel Creek near the trotting track
do not exceed the minimum five year ARI goal. When the infill areas have been
developed the provision of sewerage to additional areas will require two trunk sewer
systems. The lower portions of these trunk sewers will duplicate or replace existing
sewers.
One trunk sewer system will be the Korumburra Rd Trunk, which is up the valley
parallel to Korumburra Rd south towards Lovell Drive. This will also receive the
discharge from the proposed Bonavista SPS system in the valley south of East and
West Rd and east of Bona Vista Rd, which serves the Seq6 area there. The
Korumburra Rd Trunk System will consist of about 3,600m of 225 DN, 300 DN, 375

50
DN and 450 DN sewers, a 60L/s SPS with 60kL emergency storage and about 1300m
of 300 DN pressure main with suitable discharge end ventilation.
Another trunk sewer system, the Landsborough St Trunk, will start in the Hazel Creek
valley west of Howitt St and cross under the existing freeway to the valley near Hayes
Dve at Landsborough St. One branch, the Hayes Dve Branch, will be located in the
valley near Hayes Dve and will collect the flows from the balance of the Seq4 area west
of Korumburra Rd and will replace Landsborough SPS. It will consist of about 1500m
of 225 DN, 300 DN, 450 DN, 525 DN and 600 DN gravity sewers.
The other main branch will be located in Landsborough St then run up the valley west
of Butlers Trk then across Butlers Trk and East and West Rd to the Seq5 area south of
East and West Rd. It will receive flows from the proposed Stockdale Rd SPS serving
the southern most portion of Seq5 and from the proposed Lardner’s Rd SPS serving
the western most section of Seq5
These works will be constructed in a succession of stages, to serve the proposed
developments as they are progressed. The works will nominally be as follows:
• About 2030 construct the Korumburra Rd Trunk sewer from the Hazel Creek
interceptor to the southern boundary of the infill area consisting of about
900m of 450 DN sewers.
• About 2032 extend the Korumburra Rd Trunk sewer through the Seq4 area as
part of the Seq4 development to the southern boundary of the Seq4 area
requiring about 600m of 375 DN sewers.
• About 2047, as part of the Seq6 development construct the Bona vista SPS
system and inlet sewers involving about 300m of 300 DN sewer, a 60 L/s SPS,
60 kl emergency storage and about 300m of 300 DN pressure pipeline with
suitable ventilation.
• About 2036 construct the Landsborough Ck Trunk sewer consisting of about
900m of 600 diameter sewer, abandon the Landsborough Rd SPS and extend
the Hayes Dve Branch up the valley west of the hospital to serve Seq4 area.
The Hayes Dve branch will consist of about 600m of 225 DN and 300 DN
gravity sewers.
51
• About 2041 commence the construction of the Landsborough Rd Branch
sewer along Landsborough Rd and up the western valley as part of the Seq5
development. This will consist of about 1800m of 225 DN, 300 DN, 375 DN,
450 DN and 525 DN sewers.
• About 2043 construct the Lardner’s Rd SPS system consisting of a small
section of 225 sewers, a 20 L/s SPS with 20kL emergency storage and about
400m of 200 DN pressure main with suitable ventilation.
• About 2045 further extend this branch sewer south as part of the Seq5
development to serve the remnant Seq6 area. This sewer will also receive the
flows from the Stockdale Rd SPS system consisting of about 200m of 225
sewer, a 20 L/s pump station with 15kL emergency storage, about 300m of
200 DN pressure main. The branch will consist of about 2000m of 225 DN,
300 DN and 375 DN gravity sewers.
It is noted that the outfall works across the Hazel Creek Valley to Queen St and the
outfall works along Queen St have limited capacity. About 2008 it will be necessary to
augment the capacity of these outfall works by constructing a gravity sewer from near
the trotting track to the WWTP Influent SPS or constructing a pump station and rising
main to the WWTP inlet works. For the purposes of this strategy, the gravity sewer
system has been adoption as the notional outfall works augmentation.
7.7.3. Warragul West
The infill areas west of Glendalough Crt and east of Deakin Cres will be able to be
serviced by connection to the existing local reticulation. The balance of the proposed
development to the west of Warragul, Seq3, will be served by the construction of
several trunk sewers up the included valleys as required by the development, and as
part of the development reticulation. If this Seq3 area is under one owner, the
Pharaohs Rd trunk sewer system will not be a shared facility. However as it is likely the
development will be under a multitude of ownerships, this system will be ‘shared
facilities’. GW will therefore be required to contribute to the cost of the trunk sewers
within this catchment, by the Pharaohs Rd trunk sewer located in the valley west of
Pharaohs Rd commencing at a couple of low points about 600m north of Dollarburn
Rd. A main tributary trunk sewer system the west branch trunk sewer will be located

52
just north of and nearly parallel to the Old Princes Highway commencing close to
Lardner’s Track and discharging to the Pharaohs Rd trunk sewer. This west branch
sewer will have main tributaries from its north.
The existing reticulation system will not have the capacity to serve the Seq4 area
Windhaven Dve and the Windhaven Crt SPS system will be required to service this
area, discharging to the Seq3 area to the south west. Similarly the existing reticulation
system will not have the capacity to serve the Seq3 and Seq6 areas north of Elm Crt,
and the Bowen St Nth SPS system discharging to the Pharaohs Rd trunk sewer system
will be required to service these areas.
The Seq3 area North West of the SPS2 site will be able to be serviced
The West Warragul sewer system will consist of about 11,000m of 225 DN, 300 DN,
375 DN, 450 DN, 575 DN, and 600 DN sewers a 20L/s SPS and a 70 L/s SPS with
emergency storages and about 800m of 200 ND and 300 ND pressure mains with
appropriate ventilation.
However the existing outfall works serving the west Warragul area, the SPS2 system,
do not have capacity to service any Seq3 area. Before any of the West Seq3 area can
be serviced, the SPS2 outfall works will need to be significantly augmented.
The West Warragul works will be constructed in a succession of stages, to serve the
proposed developments as they are progressed. The works will nominally be as
follows:
• About 2013 construct some SPS2 outfall works augmentation. These
augmentation works can be gravity along the Hazel Creek valley to the WWTP
Influent SPS or they can be a pump station or series of pump stations with a
rising main system along the Hazel Creek valley to the WWTP inlet works.
Concurrent investigations, described in COR/06/6983, indicate that there are
advantages in reducing the sizes of the required long pipelines by providing
Flow Rate Attenuation Basins (FRABs) at key junctions so that the
downstream pipelines are sized for three times ADWF rather than about six
times ADWF used for normal designs.

53
• About 2016 construct - as part of the Seq3 development - the first part of the
Pharaohs Rd trunk sewer westerly from the SPS2 site to Tarwin St, duplicating
the existing reticulation sewers. Then as the development of the seq3 area
proceeds extend the Pharaohs Rd trunk sewer northerly to opposite the
Canawindi Dve area and extend the west branch and its tributaries up the
valleys, nearly to Lardner’s Trk and northerly to the northern boundary of the
Western portion of the Seq3 area. The initial works will consist of about
2300m of 225 DN, 300 DN, 375 DN, 450 DN, 525 DN and 600 DN gravity
sewers.
• About 2020 extend the Pharaohs Rd trunk sewer and its tributaries to appoint
about 700 south of Dollarburn Dve. This work will include about 1500m of
225 DN, 300 DN and 375 DN gravity sewers and the Bowen St Nth SPS
system including a 70L/s SPS with 65kL emergency storage and about 500m
of 300DN pressure pipeline with appropriate ventilation.
• About 2024 extend the Bowen St Nth SPS system as part of that Seq3
development east to about Birchcroft Crt and north to the island Seq3 area
boundaries. This work will involve about 340m of 225 DN and 300 DN
gravity sewers.
• About 2026 extend the Pharaohs Rd Trunk Sewer and its tributaries as part of
the Seq3 development to serve the northern extent of the development. This
work will involve about 3400m of 225 DN, 300 DN and 375 DN gravity
sewers.
• About 2032 as part of the island Seq4 development north of Windhaven Dve,
construct the Windhaven Dve SPS System consisting of about 400m of 225
DN and 300DN gravity sewer, the 20L/s Windhaven Dve SPS and 15kL
emergency storage and about 300m of 200 DN pressure main with appropriate
ventilation.
• About 2047 as part of the Seq6 development, extend the Bowen St Nth SPS
system to serve the area north to Buln Buln Rd. This work will involve about
1300m of 225 DN, 300 DN and 375 DN sewers.

54
7.7.4. South West Outfall
The Baw Baw Planning Scheme is proposed to provide for more than two thirds of
the Warragul ultimate population to be located west and south of Hazel Creek. The
Existing outfall works serving these area, the SPS2 system and the existing ‘S’ sewer
from the hospital area near Korumburra Rd appear to have the capacity to serve the
existing development connected to them but have limited capacity for connection of
additional areas. The proposed areas are many multiples of the existing areas so the
outfall works required to cater for the proposed developments Seq3 to Seq6 will be
significant. Work to date indicates that the required works will include pipelines form
about the SPS2 site to the WWTP.
These pipelines may be gravity sewers connected to the existing WWTP influent SPS
or they may be a series of SPS installations linked by common pressure mains to the
WWTP inlet works. Alternatively they may be a combination of the two. The selection
will be made after a significant study encompassing environmental, social and
economic benefits and disadvantages of the various options.
The work involves about three kilometres of pipelines so the benefits of slightly
increasing the cost of the nodal works are easily offset by the value of reducing the
sizes of the pipelines significantly.
GW has established that where (FRABs) can be provided with storage capacity equal
to about four hours at peak dry weather flow rate, then the capacity of the linking pipe
lines can be reduced by 50 percent.
In addition, observation of the growth of the Melbourne outskirts indicates that it is
unlikely in the longer term for the development to stop at the boundaries as currently
proposed under the Baw Baw Planning Scheme. It is more likely that in the longer
term future the development will extend out to the end of the drainage catchments.
While this forecast extra development is in the very long term it is well within the
economic life of gravity sewers and pressure mains. It has been shown that were
development is likely to occur within 60 years of the construction of main sewers it is
most cost effective to construct the sewers with the capacity to serve the whole area.

55
Duplicating such pipelines after the area has been developed for 50 years or so
involves significant social cost form the disturbance and disruption of such well
established areas.
Providing the main sewer systems with half the ultimate capacity and if required in the
future providing a limited number of (FRAB) to provide the additional capacity when
it is required is a sound economic compromise.
Accordingly the works to serve the western and southern development proposed for
Warragul are likely to be served by gravity sewers or pump station systems installed at
the outset with FRABs provided at key locations as required serving any additional
developments as and when they occur.
It is noted that the south west outfall – the Hazel Creek Interceptor System – will
enable the three existing pump stations, Hamilton Dve SPS, Munro St SPS and Spring
St SPS to be replaced by short gravity sewers lining them to the Hazel Creek
interceptor. This work will involve:
• Outfall sewers consisting of about 2400m of 225 DN gravity sewers.
7.8 Warragul WWTP Buffer
Under our licensing agreement with the EPA, a buffer is required around the Warragul
WWTP. The buffer for a 20,000 person capacity plant has been approved by EPA;
however the Shire has rezoned residential development within that buffer. As Warragul
grows to the size proposed by the Baw Baw Planning proposals and by the GW full
development of the whole catchment considerations the existing plant will have to be
augmented or all or part of it will have to be relocated.
One clear proposition is to establish a second plant the Little Moe river valley just
north of the Princes Highway west of Darnum. This plant could be established to take
the overflow from the existing WWTP where the three times ADWF exceeds 150 L/s,
the capacity of the existing plant. The initial connection works would be a gravity
sewer down the Hazel Creek Valley or a pump station and rising main system. In

56
either case the connecting works would be sized to serve the ultimate development of
the area and use may be made of the FRAB concept outlined above. The initial load on
the WWTP may be small so it would be desirable to take some of the load off the
existing pant and maybe turn either plant of for low flow periods to conserve energy.
The existing Warragul WWTP could remain in action in perpetuity or when the new
plant is fully established and the existing plant is no longer economically viable the old
plant could be abandoned and the new plant take on the full treatment function. The
new plant would not be located close to Warragul so would have disadvantages for
urban reuse possibilities but would simplify the provision of sewerage services to
Darnum and Nilma.
7.9 Benefits
The benefits of this strategy include:
• Provision of adequate outfall works to service programmed developments
within existing serviced catchments, to industry standards at the time of
development, minimising temporary or short working life works, and
• Provision for the future development of other catchments within the Warragul
precinct boundaries
• Reduced frequency of spills to the Latrobe River catchment beyond the target
five year ARI.
7.10 Costs
As this is a high level strategy and there are many uncertainties, the capital costs are
indicative only. No attempt has been made to optimise the works to match the
development or to refine any of the notional systems proposed. As the developments
occur, the proposals will be studied in more detail and the works most favourable to
GW taking into account Environmental, social and financial benefits and costs will be
identified.
The capital cost for the overall strategy is about $32M. Some of the work will be
undertaken by the relevant developer at its cost, some will be undertaken by the
57
developer and portion of the cost reimbursed by GW as portion of its CAPEX
expenditure. A large amount of the cost to GW will be financed by developer
contributions. To properly budget for the GW CAPEX the capital cost of each item of
the notional schemes outlined above have been calculated. No attempt has been made
to apportion the cost of the main works between the developers and GW. It is
sufficiently meaningful for forward planning purposes to attribute the whole of the
cost of the notional works to GW.
7.10.1. Basis of Capital Cost Estimates
The design work carried out to date is generalised based on notional schemes which
are likely to be suitable for the purpose. No attempt has been made to optimise the
schemes and the actual works chosen may have complexly different form The Capital
cost estimates presented herein have been developed for forward budgeting purposes.
They are based on whole unit costs and are sufficiently meaningful for the purpose.
Actual costs will be found to be quite different but future cost estimates will be
increasingly more meaningful as the design detail of the relevant works becomes more
representative of the actual works. The capital cost estimates herein have been
developed for other parallel studies and have been adjusted to reflect changes in costs
since the other prices were established so that all costs as are presented in 2006 dollars.
Unit pressure pipeline costs were found to be represented by the following
relationship.
Cu = 0.8 x D x F
Where:
D is the nominal diameter in mm
Cu is the Unit cost, $/m, and
F is the degree of difficulty factor..
Similarly the cost of gravity sewers was found to be represented by the following
relationship:

58
Cu =1.2 x D x F
Where the symbols have the same meanings
The cost of basic sewerage pump stations is based on the relationship between design
duty pump capacity and capital cost as follows:
Ci = 2.5 x O + 250
Where: Ci is the total SPS cost, k$, and
O is the design SPS output in L/s
GW requires that each pump station system has the capacity to store at least two hours
of inflow at the design peak dry weather flow rate (PDWF). In small pump stations
this can often be achieved in the wet well which has a minimum size or in the unused
capacity of the incoming sewers. For pump stations of the sizes required for this
scheme these volumes are not available and special provision of emergency storage is
required. The cost of recent special emergency storages constructed in the area have
been evaluated and found to be represented by the following relationship:
Ci = 1.1 x V + 350 Where: V is the required basin volume in m3.
The based on the above relationships the unit costs used to calculate the estimated
capital cost of the various options investigated in this study shown in Tables 1 and 2.
The unit costs are for pipelines with a unit degree of construction difficulty. For actual
pipelines a degree of construction difficulty ranging from unity to 2.4 would be applied
to the unit capital costs on a case by case basis. For this study, based only on notional
schemes a degree of difficulty factor of 1.6 has been applied globally to the calculated
net estimates. In addition a factor of 1.45 has been applied to the net estimates to
provide a contingency amount of 25 percent and an engineering and management
amount of 20 percent.

59
7.11 Timing
The attached schedule of cost estimates also has the indicative timings for when the
assets need to be constructed. Some of these assets are on the current five year capital
plan and the remainder will be constructed in the future, depending on growth.
7.12 Summary
The existing sewerage system serving Warragul was established about 60 years ago and
has served Warragul well over that period with minor upgrades. As the Melbourne
Metropolitan area advances eastward, Warragul is destined for significant growth over
the next 40 or 50 years. The Planning Authority is making provision of the orderly
progression of this development and has prioritised areas for development. Some of
these areas are easier to provide with sewerage services than others and GW has
provided the planning authority with a preferred timetable for the development of the
various areas.
The existing sewerage system does not have the capacity to service these proposed
areas and it will need to be augmented. Augmentation involves the construction of
main sewerage facilities up the valley north of the existing WWTP west along the
Hazel Creek valley to Latrobe Rd, south down the main valleys towards Bona Vista
and Stockdale’s Rd and north and west up the valleys parallel to Pharaohs Rd and
Drouin Warragul Rd (Old Princes Highway). The cost of these works and their main
tributaries and associated SPSs is estimated to be about $65M in 2006 dollars. This
money is expected to be expended spasmodically over the period to 2055.
Other parallel studies indicate that the sewerage works down the valleys are likely to be
gravity sewers. It has also established that there is considerable risk associated with
sizing these sewers for their technical life, about 100 years, since the forecast load over
that time may not ever arise because the development is interrupted by unforeseeable
events on a local or global scale, or they may be undersized for similar reasons.
GW has established that where emergency storage - with capacity of about four hours
of PDWF - is provided, the downstream works can be half of the design PWWF rate.

60
Since the design PWWF rate will occur only a few hours on a few occasions during the
life of the works, provision of such storage is frequently justified where the
downstream works are extended, like at Warragul.
For Warragul they have been found to be cost effective for several sites, Hazel Ck at
Latrobe Rd, Hazel Ck at Howitt St and probably the north east interceptor near Sutton
St. It these location it is likely that the actual downstream works will be sized for half
the ultimate catchment development with provision for (FRAB) to receive and store
the wet weather associated excess flows until the wet weather flow rates have passed
when the stored wastewater will be pumped back into the downstream works.
7.13 Recommendation
It is recommended that:
1. The strategy described above and summarised on the attached plans be
adopted by Gippsland Water as a guide for the future development of the
Warragul Sewerage System,
2. The strategy to be revised every two years.

61
REFERENCE
Camp Scott & Furphy (CMPS&F), “Warragul Northern Basin Review”, February 1995.
Kinhill Stearns, “Water Supply Master Plan for Warragul and Drouin” Tarago Water Board
1987
Water Industry Act 1994, Statement of Obligation (SoO) Central Gippsland Regional
Water Authority, COR/05/19918
Victorian State Government, Water Act 1989, No.80/1989
Gippsland Water, Annual Reports 2003/04
GHD Management Engineering Environment 2005, Growth Management Strategy and
Structure Plans Warragul and Drouin, Final Report April 2005
Baw Baw Shire Council Planning Scheme Website:
http://www.doi.vic.gov.au/DOI/PSO/bawbaw.nsf (Accessed February-May 2006)
Gippsland Water, Annual Reports 2000/01 – 2004/05.
Gippsland Water, Customer Charter 2006
Wallace.D 2000, All Water Supply Systems Profiles Gippsland Water, Trim Record
COR/03/5753
Aquaclear Technology P/L 2000, Warragul Water Treatment Plant, Operation and
Maintenance Manual, Introduction Page 5 of 36
OTV-Kruger 1999, Warragul WWTP Operations and Maintenance Manual. Volume 1 of 7
General Conditions
Hydro Technology 1994, Bulk Entitlement Conversion for Two Water Supply Systems,
LIB/12796
Abeysinghe.N. 2003, Warragul Sewerage Report on SPS2 System Upgrade Options,
Internal document COR/03/6727.
The Institution of Engineers, Australia, Australian Rainfall and Runoff, Reprinted edition
1998
Gippsland Water 2003, Warragul Wastewater Treatment Plant. Environmental
Management Plan.

62
Water Services Association of Australia, Water Reticulation Code of Australia WSA 03-
1999, Section 3 Design of Distribution Networks.
MWH June 2005, Warragul Sewerage Catchment Hydraulic Modelling (Volume 1, Final)
Gippsland Water June 06, Activity Management Plan, Wastewater Volume 1, Appendix ‘A’
Overview
Baumann D.D, Boland J.J, Hanemann W.M Urban Water Demand Management and
Planning 1997

63
APPENDIX

1
Appendix A Project Specification
University of Southern Queensland
FACULTY OF ENGINEERING AND SURVEYING
ENG 4111/4112 Research Project PROJECT SPECIFICATION
FOR: Darren Wallace
TOPIC: WATER AND WASTEWATER STRATEGIC TOWNSHIP PLAN FOR WARRAGUL VICTORIA
SUPERVISORS: Associate Professor Frank Young, USQ.
Paul Young, Gippsland Water.
ENROLMENT: ENG 4111 – S1, EXT, 2006
ENG 4112 – S2, EXT, 2006
PROJECT AIM: To develop a Water and Wastewater Township Plan for the current planning scheme for Warragul and future Baw Baw Shire growth strategy. The township plans will need to identify township growth, identify the different options and optimum solution for each of the development areas and ultimately list the capital works programme with timings.
SPONSORSHIP: Gippsland Water
PROGRAMME: 1. To confirm historical and future levels of service from agreed growth rates and
there priority. 2. To identify future land requirements. 3. To identify key stakeholders and their requirements. 4. To understand the existing water and wastewater infrastructure limitations. 5. To identify potential options and undertake options analysis using planning tools
and present via workshop(s). 6. To develop a short and medium term (20 years) capital works strategy
(infrastructure investment and non-asset solutions) in relation to major scheme components (e.g. headwork’s, trunk mains, treatment plants).
7. Document the solutions with timings and capital works programme in the Gippsland Water Activity Management Plans.

2
Agreed: __________________ ________________ __________________ Student Supervisor (USQ) Team Leader Darren Wallace Frank Young Paul Young

3
Appendix B Gippsland Water Area

4
Appendix C Warragul Planning Boundaries

5
Appendix D Undeveloped Planning Areas

6
Appendix E Warragul Water Supply

7
Appendix F Warragul Wastewater Collection
8
Appendix G Water System Design Performance Criteria
Water Systems Design Performance Criteria
CONFIGURATION PERFORMANCE CRITERIA This criterion is utilised to identify assets that require augmenting to meet levels of service. PREAMBLE The performance of each GW asset is reviewed from time to time to assess its capacity to enable GW to meet its customer obligations. Performance requirements from the assets to ensure standards are met are set out in this document (eg security of supply). The performance requirements apply on the day of review and throughout the planning period, normally 20 years. If an asset requires upgrading, the upgraded capacity will be based on the performance required during the appropriate planning period. Growth is different in each system and projected figures are to be used when addressing performance requirements (refer Planning & Dev Group for information). System components will be reviewed on an individual basis. Regard for the probability of the simultaneous occurrence of adverse circumstances (ie if a back up system fails an additional back up system will not be required). WATER SUPPLY SYSTEMS Commencing with the customer, the water supply system consists of:
(1) Service installation; (2) Reticulation pipelines; (3) Treated water high level tanks and associated pump systems; (4) Treated water storages; (5) Treatment systems; (6) Transfer pipelines including associated pump systems (7) Headwork systems.
Performance criteria are presented in the following paragraphs for each of these types of assets. Customers are defined as those connected to a water supply main fronting their property. GW undertakes to supply customers in accordance with the following criteria (Water by Agreement).

9
GW does not undertake to supply those on private extensions in accordance with these criteria.
1 Service Installations. Service installations consist of a meter installation, service pipe and tapping. Service installations, both potable water and fire service, comply with the Australian Plumbing Code 2 Reticulation pipelines. Reticulation systems consist of the network of pipelines downstream of a HL tank or treated water storage to which the service installation is connected.
Category Fireflow Requirement Number & Duration
All reticulation pipes Maximum velocity of 2m/s Peak hour demand Residential – Pipes >100mm 15L/S for 2 hours 1 @ 2 hours Commercial – Pipes > 150mm 30L/S for 4 hours
For schemes serving a population of less than 1000 a fireflow of 15L/S for 2 hours should be satisfactory except where a special hazard or risk development exists
1 @ 4 hours
High Risk (i.e. a development where there is a probability of a fire occurring or there is a high cost of resultant damage, personal injury or property)
To be determined Adopt a special hazard or risk fire
Residual pressure is to be 12m minimum at hydrant at all times Minimum Pressure & Maximum Pressure –refer to Policy in Trim COR/02/8879

10
3 Treated water high level tanks and associated pump systems
Treated Water High Level Tanks & Associated Pump Stations Criterion Measured Value/Standard Where/how measured Pumping to high level tank (Tank >20% of peak day demand)
Pumping rate = 1.2xPeak day demand(duty & standby pumps)
Verified by Gippsland Water hydraulic modeling simulation.
Pumping to high level tank. (Tank <20% of peak day demand)
Pumping rate = Peak hour demand (duty & standby pumps)
Minimum pressure 14m head. Verified by Gippsland Water hydraulic modeling simulation.
Pressure booster systems Pumping rate = Peak hour demand (duty & standby pumps)
Minimum pressure 14m head. Verified by Gippsland Water hydraulic modeling simulation.
Active storage volume (security of supply)
Minimum 20% of the larger of 1 peak day demand or 2 average day demand
Verified by Gippsland Water hydraulic modeling simulation.
Back up pumping must be available when loss of mains electricity occurs. Whether a High Level Tank exists or not, there must be diesel driven pump/s or back up generator driven pump/s capable of delivering at least a peak hour demand volume with automatic pumping occurring on loss of incoming power & enough accumulator storage to provide a minimum of 14m in the reticulation until backup comes on line. 4 Treated water storages Criterion Measured Value/Standard Where/how measured Active storage Minimum Volume. Larger of
1 peak day demand or 2 average days demand.
Verified by Gippsland Water hydraulic modeling simulation
5 Treated systems Hydraulic and treatment capacity of water treatment plants is to satisfy current and predicted demand projections based on population projections over the planning horizon of 20 years.

11
Criterion Measured Value/Standard Where/how measured Hydraulic and Treatment Capacity
Downstream storage volume is > 4.0 x peak day demand
Treatment capacity = 0.7 x Peak day demand over 24 hours
Downstream storage volume is > 1.5 x peak day demand
Treatment capacity = 1.0 x Peak day demand over 24 hours
Downstream storage volume is < 1.5 x peak day demand
Treatment capacity = 1.1 x Peak day demand over 24 hours
6 Transfer pipelines including pump stations Transfer pipelines and pump stations are to satisfy current and predicted demand projections based on population projections over the planning horizon of 20 years. Criterion Measured Value/Standard Where/how measured Hydraulic capacity (flow) Downstream storage volume
is > 4.0 x peak day demand Pipeline capacity = 0.7 x Peak day demand over 24 hours
Downstream storage volume is > 1.5 x peak day demand
Pipeline capacity = 1.0 x Peak day demand over 24 hours
Downstream storage volume is < 1.5 x peak day demand
Pipeline capacity = 1.1 x Peak day demand over 24 hours
7 Headworks Volume of Bulk Water Entitlement (BWE) on each system is to meet current and predicted demand based on estimated on population projections over the planning horizon of 20 years. Where the BWE does not satisfy predicted demand, Gippsland Water’s Strategic Planning department is to be notified to begin negotiations with the Department of Sustainability and Environment.

12
Appendix H Wastewater System Design Performance Criteria
Wastewater Supply System Design Performance Criteria CONFIGURATION PERFORMANCE CRITERIA This criterion is utilised to identify assets that require augmenting to meet levels of service. PREAMBLE The performance of each GW asset is reviewed from time to time to assess its capacity to enable GW to meet its customer obligations. Performance requirements from the assets to ensure standards are met are set out in this document (e.g. security of supply). The performance requirements apply on the day of review and throughout the planning period, normally 20 years.
If an asset requires upgrading, the upgraded capacity will be based on the performance required during the appropriate planning period. Growth is different in each system and projected figures are to be used when addressing performance requirements (refer Planning & Dev Group for information). System components will be reviewed on an individual basis. Regard for the probability of the simultaneous occurrence of adverse circumstances (i.e. if a back up system fails an additional back up system will not be required).

13
WASTEWATER COLLECTION SYSTEMS Commencing with the customer, the wastewater collection system consists of:
(1) Gravity pipelines and manholes; (2) Pump stations with wet wells and rising mains; (3) Collector mains; (4) Transfer pipelines including associated pump systems and wet weather
storages; (5) Treatment systems.
Performance criteria are presented in the following paragraphs for each of these types of assets. All wastewater assets are sized to meet current demands in regard to flow and spills to the environment. (Memorandum of Understanding (MOU) 1998) Wastewater assets are to have no more than (3) unplanned interruptions of a customer’s wastewater service each year. (Customer Charter) and no nuisance odour complaints. Customers are defined as those connected to a wastewater collections system main fronting their property. 1. Gravity pipelines and manholes Category Flow Requirements Where/how measured All gravity pipes To contain 6 x Average
Dry Weather Flow (ADWF) Verified by Gippsland Water hydraulic modeling simulation.
All gravity pipes Maximum velocity = 3.0m/s
Verified by Gippsland Water hydraulic modeling simulation.
All gravity pipes Minimum grade = 1:200 Verified by Gippsland Water hydraulic modeling simulation.
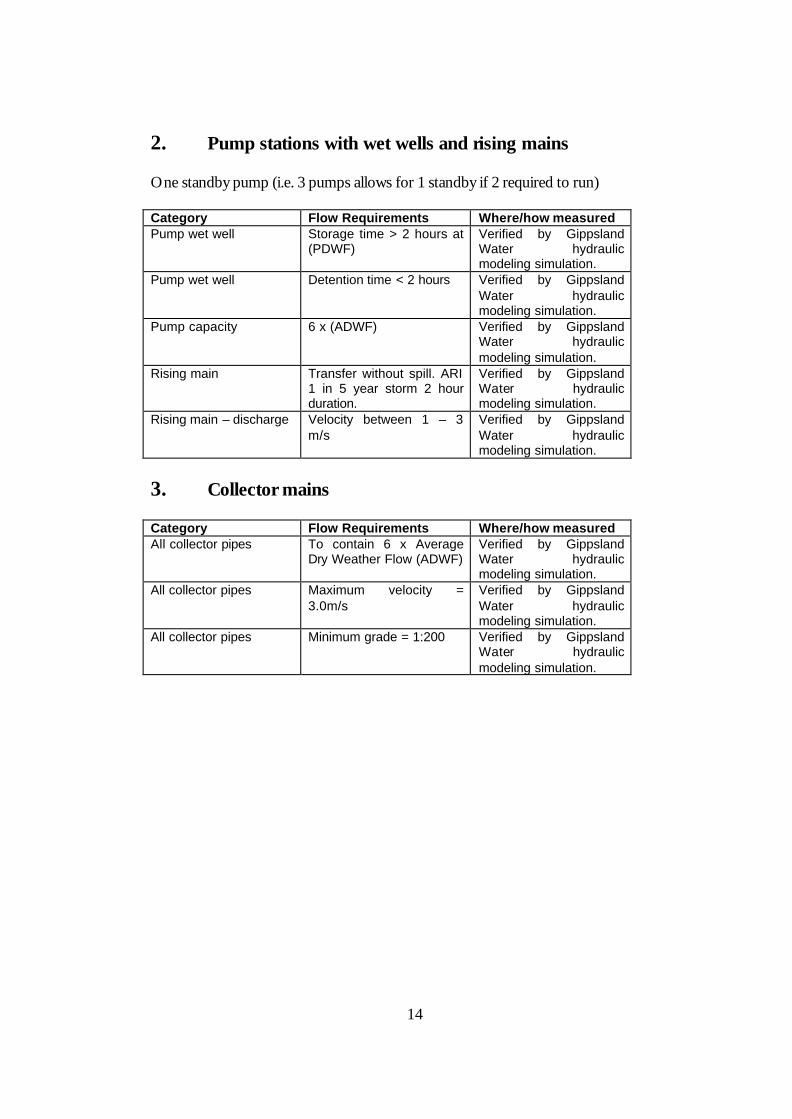
14
2. Pump stations with wet wells and rising mains One standby pump (i.e. 3 pumps allows for 1 standby if 2 required to run) Category Flow Requirements Where/how measured Pump wet well Storage time > 2 hours at
(PDWF) Verified by Gippsland Water hydraulic modeling simulation.
Pump wet well Detention time < 2 hours Verified by Gippsland Water hydraulic modeling simulation.
Pump capacity 6 x (ADWF) Verified by Gippsland Water hydraulic modeling simulation.
Rising main Transfer without spill. ARI 1 in 5 year storm 2 hour duration.
Verified by Gippsland Water hydraulic modeling simulation.
Rising main – discharge Velocity between 1 – 3 m/s
Verified by Gippsland Water hydraulic modeling simulation.
3. Collector mains Category Flow Requirements Where/how measured All collector pipes To contain 6 x Average
Dry Weather Flow (ADWF) Verified by Gippsland Water hydraulic modeling simulation.
All collector pipes Maximum velocity = 3.0m/s
Verified by Gippsland Water hydraulic modeling simulation.
All collector pipes Minimum grade = 1:200 Verified by Gippsland Water hydraulic modeling simulation.

15
4. Transfer pipelines including associated pump systems and
wet weather storages; Transfer pipelines and pump stations are to satisfy current and predicted demand projections based on population projections over the planning horizon of 20 years. Category Flow Requirements Where/how measured Pump capacity 6 x (ADWF) Verified by Gippsland
Water hydraulic modeling simulation.
Rising main Transfer without spill. ARI 1 in 5 year storm 2 hour duration.
Verified by Gippsland Water hydraulic modeling simulation.
Rising main – discharge Velocity between 1 – 3 m/s
Verified by Gippsland Water hydraulic modeling simulation.
Storage – capacity Storage time > 2 hours at (PDWF)
Verified by Gippsland Water hydraulic modeling simulation
Wet Weather Storages (i.e. ROS storages) - Sized to meet current demand in regard to flow & spill to environment prevention (MOU 1998)
- No nuisance odour complaints 5. Treatment systems Hydraulic and treatment capacity of wastewater treatment plants is to satisfy current and predicted demand projections based on population projections over the planning horizon of 20 years. Category Flow Requirements Where/how measured Wastewater treatment plant
To treat the greater of peak wet weather flow (PWWF) or 6 x ADWF.
Verified by Gippsland Water hydraulic modeling simulation.
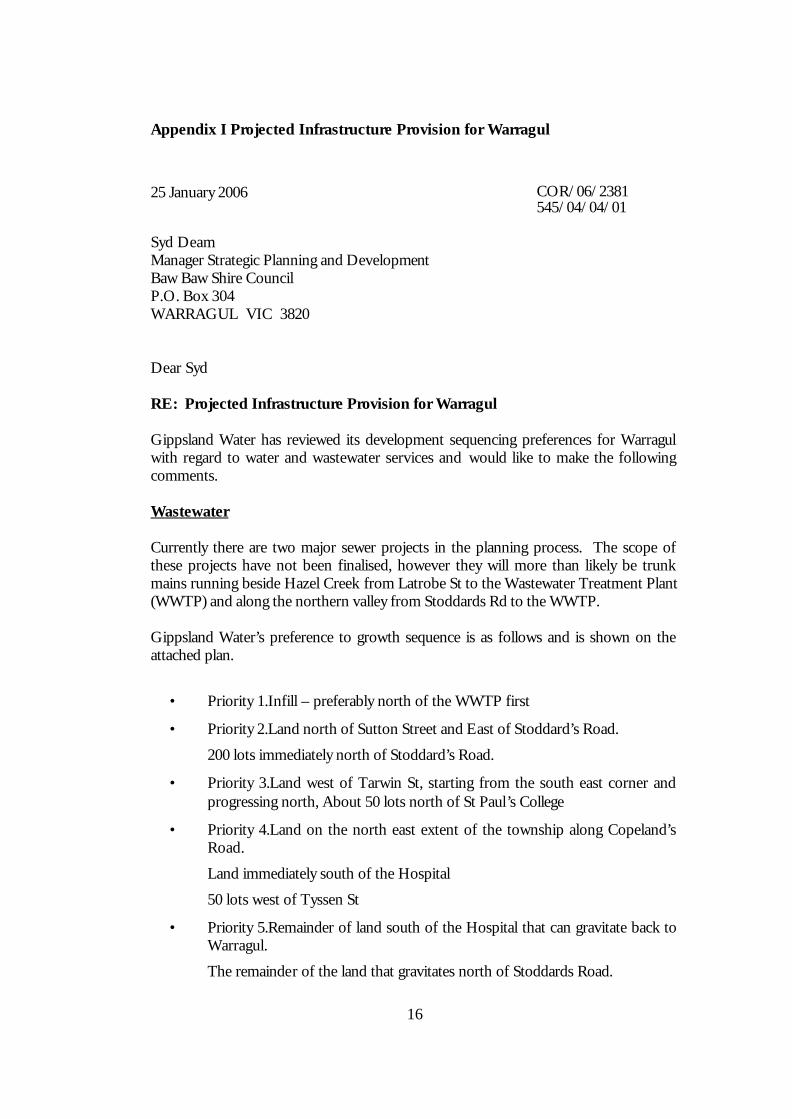
16
Appendix I Projected Infrastructure Provision for Warragul
25 January 2006 COR/06/2381 545/04/04/01 Syd Deam Manager Strategic Planning and Development Baw Baw Shire Council P.O. Box 304 WARRAGUL VIC 3820 Dear Syd RE: Projected Infrastructure Provision for Warragul Gippsland Water has reviewed its development sequencing preferences for Warragul with regard to water and wastewater services and would like to make the following comments. Wastewater Currently there are two major sewer projects in the planning process. The scope of these projects have not been finalised, however they will more than likely be trunk mains running beside Hazel Creek from Latrobe St to the Wastewater Treatment Plant (WWTP) and along the northern valley from Stoddards Rd to the WWTP. Gippsland Water’s preference to growth sequence is as follows and is shown on the attached plan.
• Priority 1.Infill – preferably north of the WWTP first
• Priority 2.Land north of Sutton Street and East of Stoddard’s Road.
200 lots immediately north of Stoddard’s Road.
• Priority 3.Land west of Tarwin St, starting from the south east corner and progressing north, About 50 lots north of St Paul’s College
• Priority 4.Land on the north east extent of the township along Copeland’s Road.
Land immediately south of the Hospital
50 lots west of Tyssen St
• Priority 5.Remainder of land south of the Hospital that can gravitate back to Warragul.
The remainder of the land that gravitates north of Stoddards Road.

17
• Priority 6.Remainder of land north of St Paul’s College. This land will need to be pumped to the West Tarwin St development.
Remainder of land south of the hospital that requires a pump station and the other adjoining catchment’s infrastructure to be constructed The criteria that has been used for identifying priority areas the sequencing of development is as follows:
• Priority 1.Infill areas
• Priority 2.areas that can be served by existing infrastructure with adequate capacity.
• Priority 3.areas that is near or directly upstream of existing infrastructure that currently requires upgrading to meet levels of service.
• Priority 4, 5 and 6.areas with increasing degrees of the following:
• additional works to service development
• further up the catchment/staging
• extent of required downstream infrastructure
Water Currently there is a large proposed main that will provide security of supply to the existing 450 mm main and also provide the future levels of service to the existing and new developments due to growth. The new main is currently in the future capital works programme and the details of the size and alignment will need to be investigated.

18
For the new smaller subdivisions the water reticulation will be extended and there may be a need to augment the existing system in localised areas to provide adequate levels of service. Generally wastewater infrastructure is the governing factor for the sequencing of land release. If there are any matters about this response that you or your staff would like to discuss, please contact Paul Young via either email [email protected] or phone 51 774 728. Yours sincerely, John Mitchell Chief Executive Offi cer.

19
Appendix J Warragul Sequencing Plan

4