
Water and Sewage Treatment Energy Management Joint … · Management Joint Conference. Montgomery...
55
Hosted By: Delaware Valley Regional Planning Commission, PA DEP southeastern Regional office, EPA Region III. Water and Sewage Treatment Energy Management Joint Conference Montgomery County Community College April 25, 2012
Transcript of Water and Sewage Treatment Energy Management Joint … · Management Joint Conference. Montgomery...
Hosted By: Delaware Valley Regional Planning Commission, PA DEP southeastern Regional office, EPA Region III.
Water and Sewage Treatment Energy Management Joint Conference
Montgomery County Community College April 25, 2012
Agenda :
Identify ways that energy can be conserved or recovered in Water and Wastewater Treatment.
Typically energy saving opportunities are more prevalent in Wastewater than Water Treatment.

Water Treatment; Example: Energy Savings Measures
• Energy Recovery by using raw or finished water for heat recovery. To be installed at the Ridley water treatment plant • Chemical Dose Optimization. • Pumps and Motors. • Process Changes. • Cyclic operation; if possible.

Water Treatment Case Studies; Energy Savings Measures
Bristol Water Treatment Facility Upgrade Retrofitting two sedimentation basins with plate settlers increased basin settling capacity ten-fold over the typical settling capacity Operating costs have been reduced by 22 percent.
Upgrade to the Morrison Coulter Water Treatment Facility at Ingrams Mill
Operating costs have been reduced by 25 to 30 percent.
Retrofitting sedimentation basins with plate settlers increased basin capacity from 2 mgd to 7 mgd per basin. The upgraded basins provide improved settled water quality, reduced chemical usage, and increased filter run times.
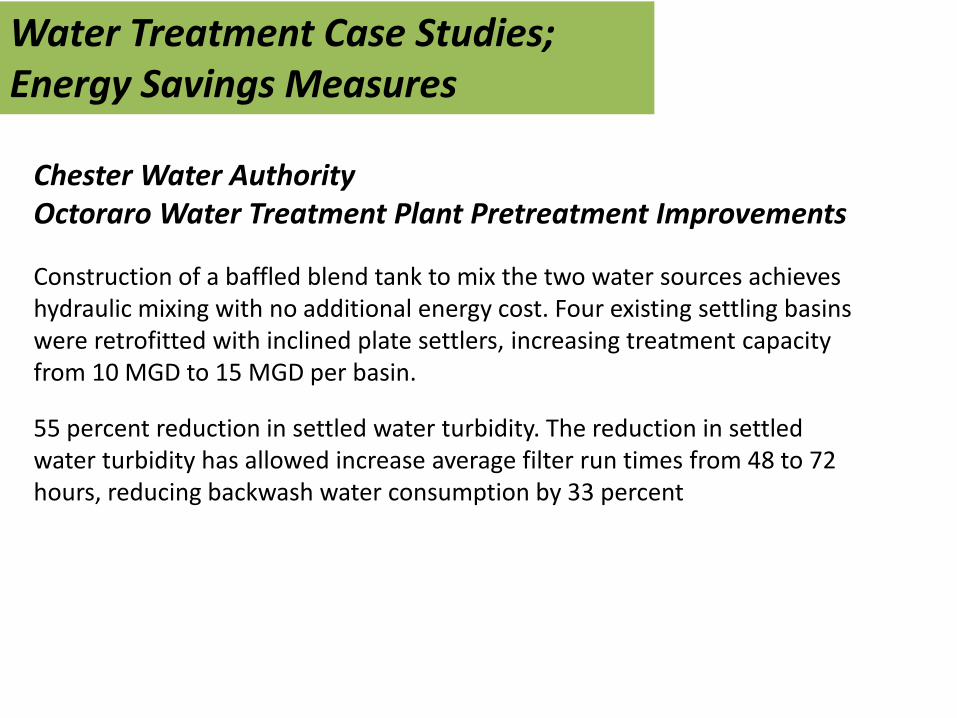
Chester Water Authority Octoraro Water Treatment Plant Pretreatment Improvements
Construction of a baffled blend tank to mix the two water sources achieves hydraulic mixing with no additional energy cost. Four existing settling basins were retrofitted with inclined plate settlers, increasing treatment capacity from 10 MGD to 15 MGD per basin.
55 percent reduction in settled water turbidity. The reduction in settled water turbidity has allowed increase average filter run times from 48 to 72 hours, reducing backwash water consumption by 33 percent
Water Treatment Case Studies; Energy Savings Measures

Solids Handling 20 to 25%
Wastewater treatment typically consumes about 35% of municipal energy budgets. Aeration and Solids Handlings are typically the largest energy users.
Wastewater Treatment Energy Profile
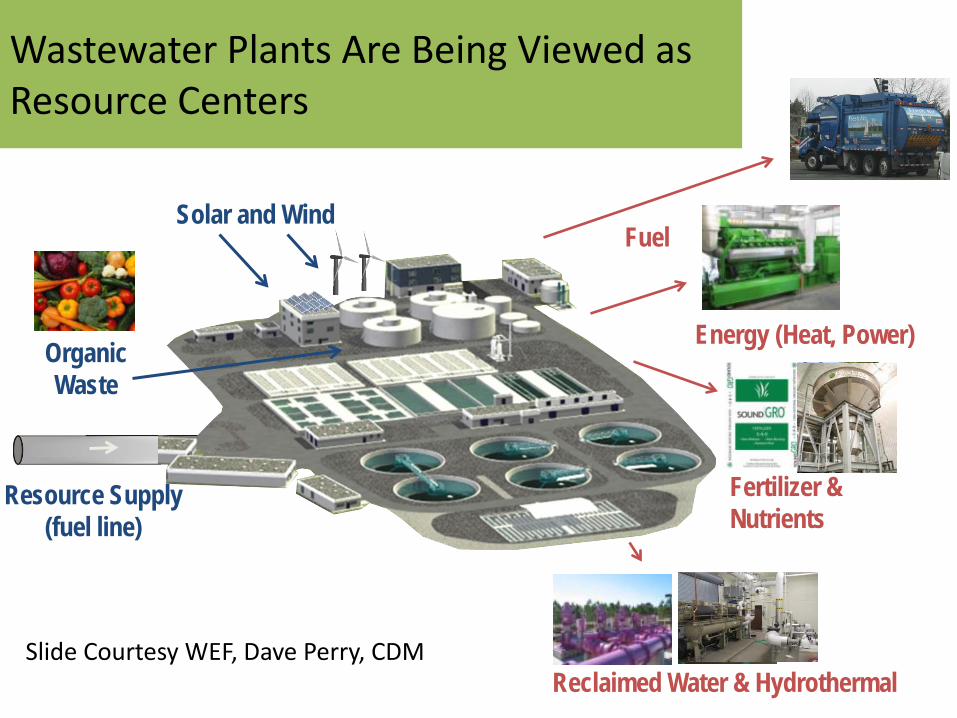
Fuel
Reclaimed Water & Hydrothermal
Fertilizer & Nutrients
Wastewater Plants Are Being Viewed as Resource Centers
Resource Supply (fuel line)
Organic Waste
Solar and Wind
Energy (Heat, Power)
Slide Courtesy WEF, Dave Perry, CDM
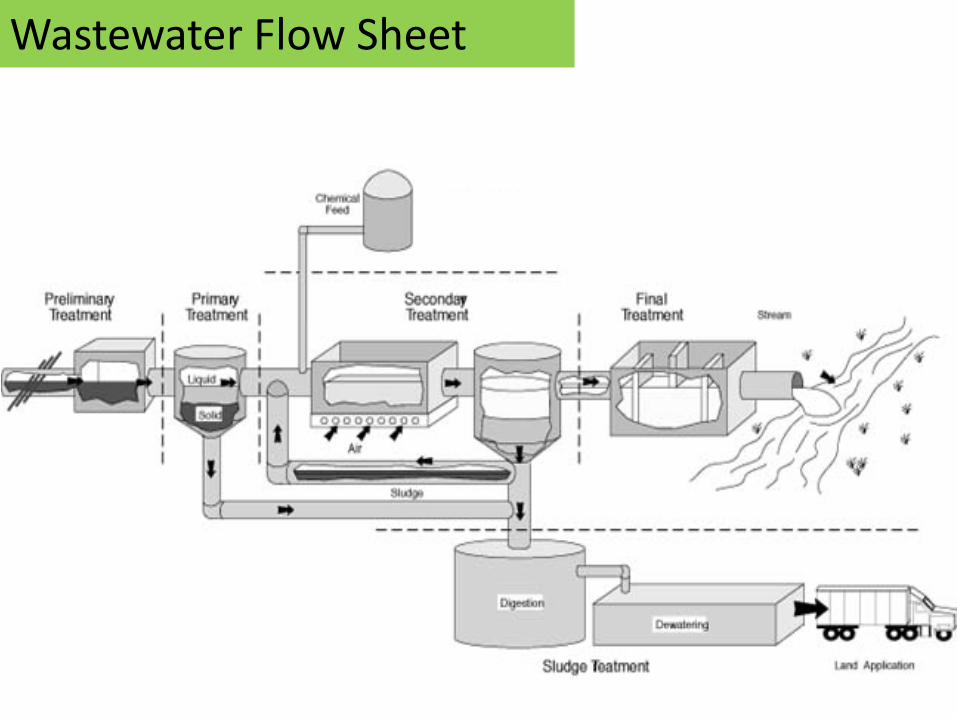
Wastewater Flow Sheet

Multi Stage Centrifugal
Single Stage Centrifugal
Positive Displacement
Aeration System Blowers
Aeration Tank VFD Driven Efficiency 45 to 60%
Inlet Throttled Efficiency 50 to 70% VFD Driven Efficiency 60 to 70%
Dual Vane Control Efficiency 70 to 85%

Aeration System Instrumentation
Screened, Degrited Wastewater
Blower DO Probe & Transmitter
Ammonia and Nitrite
Probe & Transmitter
VFD
Blowers
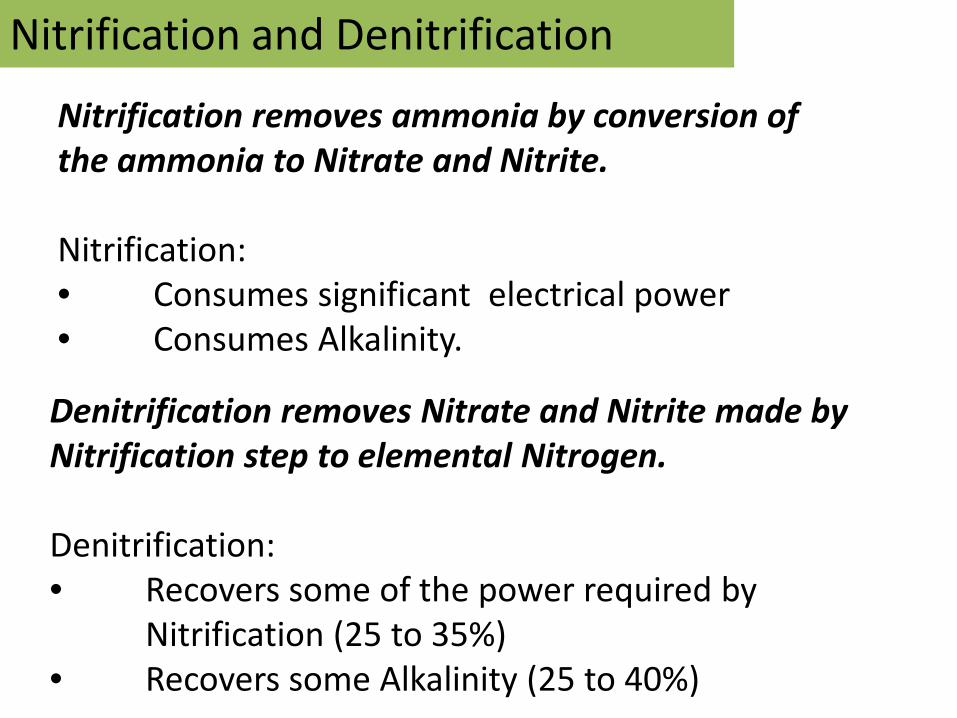
Nitrification and Denitrification
Nitrification removes ammonia by conversion of the ammonia to Nitrate and Nitrite. Nitrification: • Consumes significant electrical power • Consumes Alkalinity.
Denitrification removes Nitrate and Nitrite made by Nitrification step to elemental Nitrogen. Denitrification: • Recovers some of the power required by Nitrification (25 to 35%) • Recovers some Alkalinity (25 to 40%)
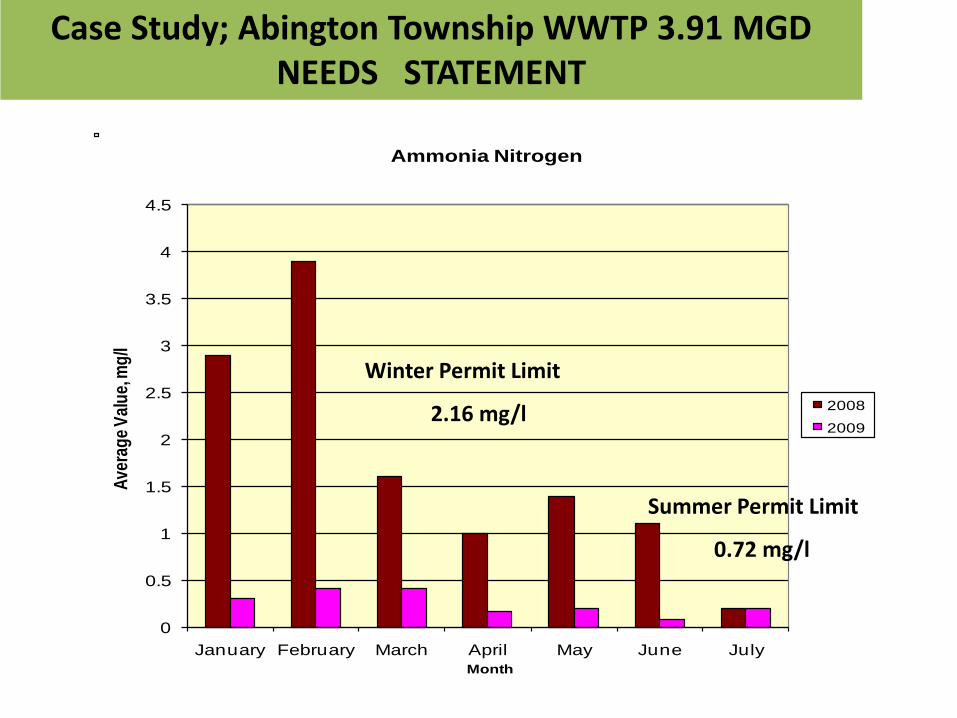
Case Study; Abington Township WWTP 3.91 MGD NEEDS STATEMENT
0
0.5
1
1.5
2
2.5
3
3.5
4
4.5
January February March April May June July
Aver
age V
alue,
mg/
l
Month
Ammonia Nitrogen
2008
2009
Winter Permit Limit
2.16 mg/l
Summer Permit Limit
0.72 mg/l
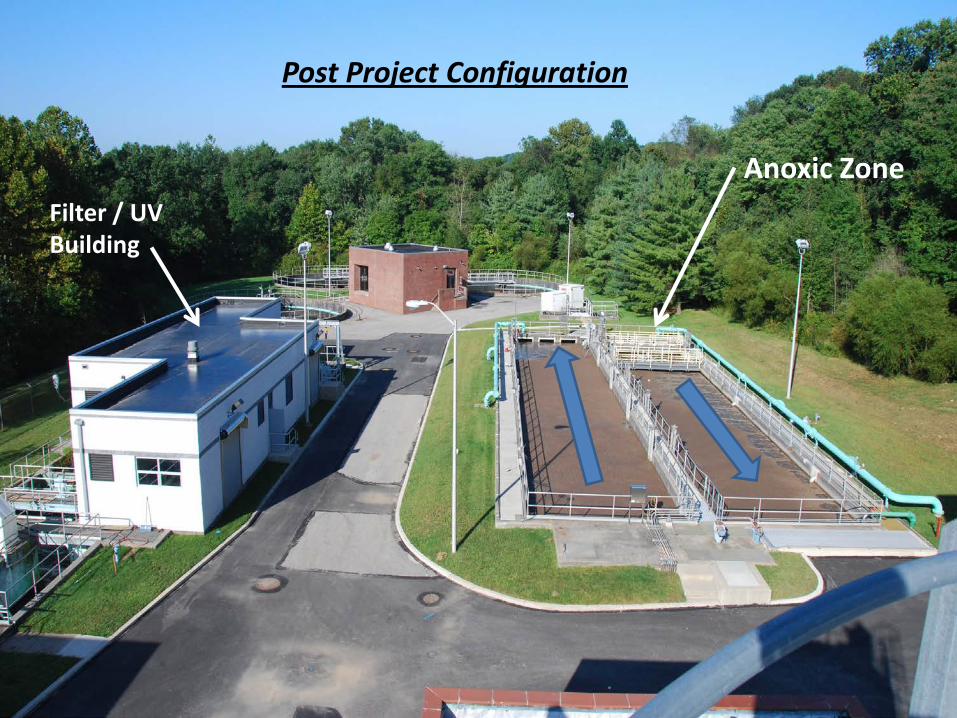
Anoxic Zone
Post Project Configuration
Filter / UV Building
Aeration Energy Control at Abington Township – Nitrification / Denitrification WWTP
BIOS Optimal Control System
Courtesy; Biochem Technologies

0
0.5
1
1.5
2
2.5
3
3.5
4
4.5
5
0:00 2:00 4:00 6:00 8:00 10:00 12:00 14:00 16:00 18:00 20:00 22:00 0:00
Time
Conc
entra
tion
(mg/
L)
0
200
400
600
800
1000
Load
ing
(lb/d
ay)
Effluent NH4 DO Set-Point NH4 Loading
NH4 Loading
DO Set-Point
Effluent NH4
Variable DO Setpoint Control

0
0.5
1
1.5
2
2.5
3
3.5
4
4.5
January February March April May June July
Aver
age V
alue,
mg/
l
Month
Ammonia Nitrogen
2008
2009
Winter Permit Limit
2.16 mg/l
Summer Permit Limit
0.72 mg/l
Post Project -Effluent Ammonia

Abington WWTP -Added Electrical Load
Third Aeration Reactor – About 50 kw (1,200 KWH / day) Pumping Station – About 30 kw (720 KWH / day) Filters – About 10 kw (240 KWH / day) Mixers, Chem. Feed – About 7 kw (150 KWH / day) TOTAL 2,310 KWH / day 69,300 KWH / month
About 20 to 25% increase
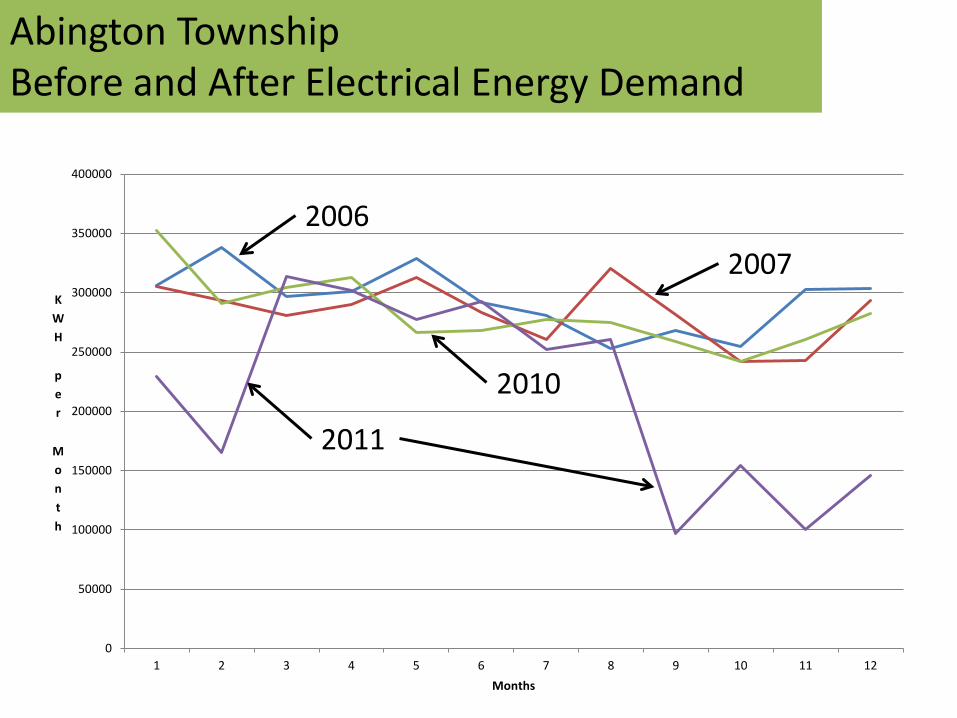
Abington Township Before and After Electrical Energy Demand
0
50000
100000
150000
200000
250000
300000
350000
400000
1 2 3 4 5 6 7 8 9 10 11 12
KWH per
Month
Months
2007 2006
2010
2011
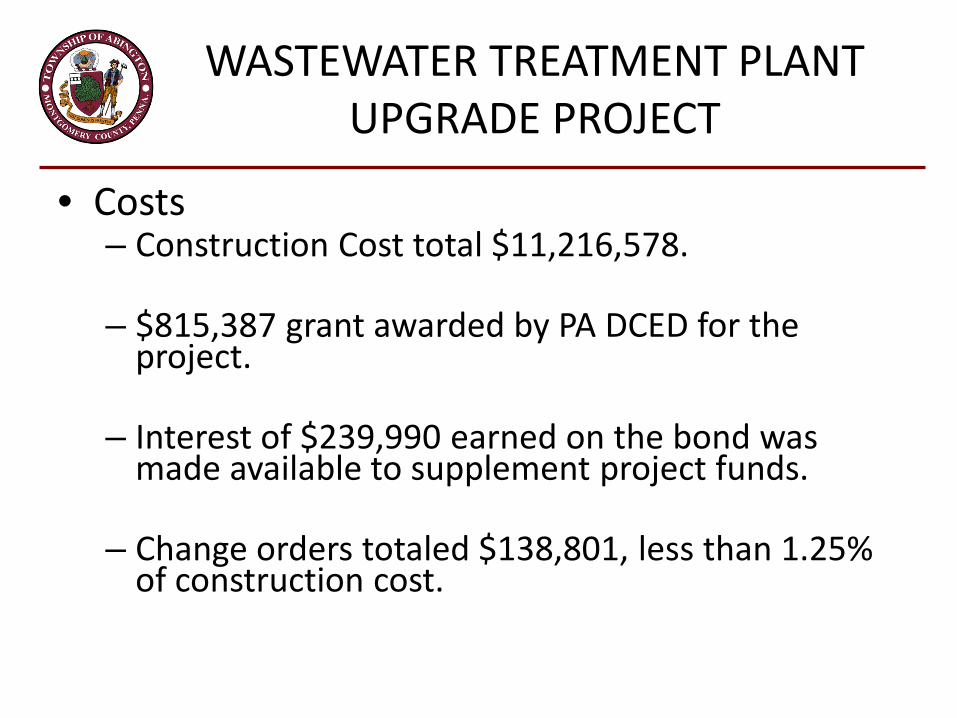
WASTEWATER TREATMENT PLANT UPGRADE PROJECT
• Costs – Construction Cost total $11,216,578. – $815,387 grant awarded by PA DCED for the
project. – Interest of $239,990 earned on the bond was
made available to supplement project funds. – Change orders totaled $138,801, less than 1.25%
of construction cost.
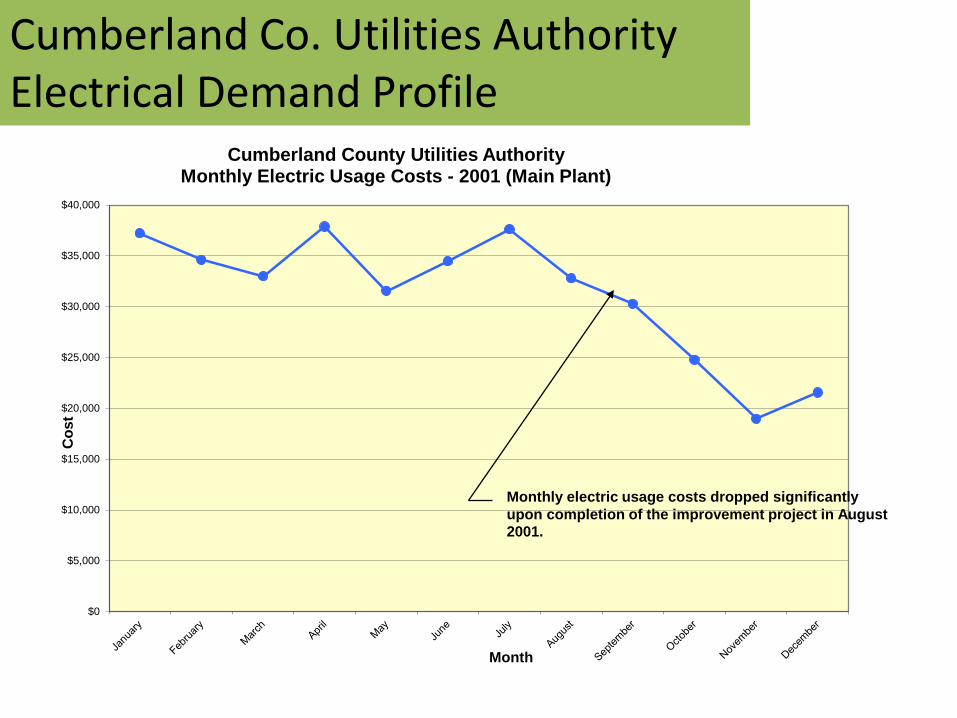
Cumberland Co. Utilities Authority Electrical Demand Profile
$0
$5,000
$10,000
$15,000
$20,000
$25,000
$30,000
$35,000
$40,000
Cos
t
Month
Cumberland County Utilities Authority Monthly Electric Usage Costs - 2001 (Main Plant)
Monthly electric usage costs dropped significantly upon completion of the improvement project in August 2001.

Other Energy Conservation and Recovery opportunities in Wastewater Treatment
Pumping & Screening
Primary Settling (optional)
Chemical Addition
Disinfection
Power Factor Correction
Solids Handling Systems

Biosolids – Energy Recovery Pathways
Wastewater Biosolids
Anaerobic Digestion
Aerobic Digestion
Digestion Thermal
Direct Combustion
Mechanical Dewatering
Mechanical Dewatering
Gasification / Pyrolysis / Others
HEAT
POWER +
No Energy to Recover
HEAT HEAT
+ + + POWER POWER
Biochar, Other Derativies
Thickening
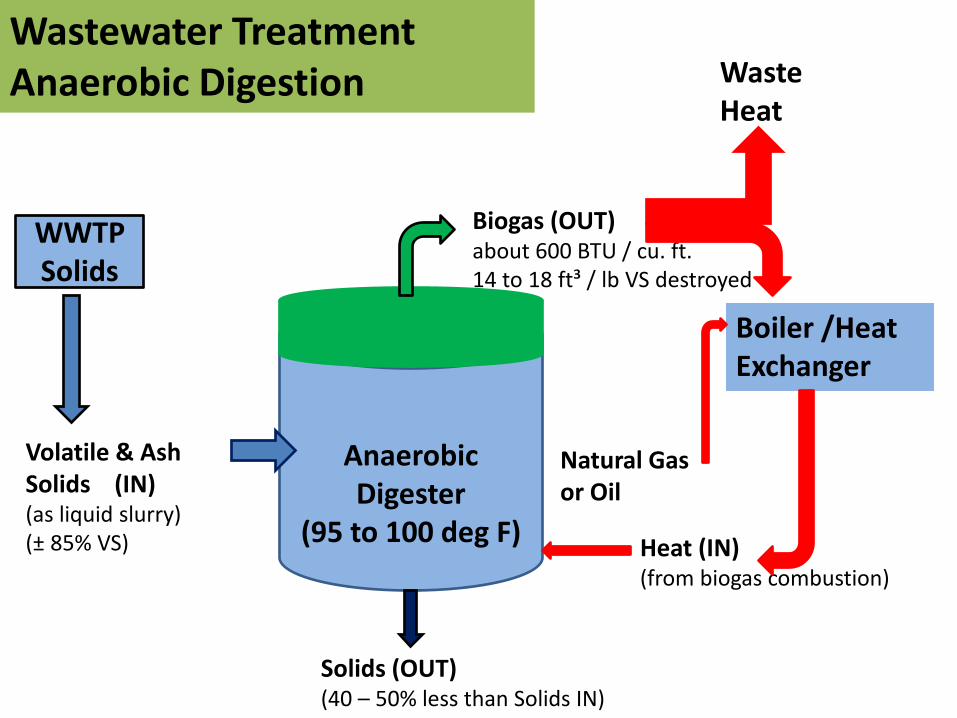
Volatile & Ash Solids (IN) (as liquid slurry) (± 85% VS)
Biogas (OUT) about 600 BTU / cu. ft. 14 to 18 ft³ / lb VS destroyed
Anaerobic Digester
(95 to 100 deg F)
Solids
Solids (OUT) (40 – 50% less than Solids IN)
WWTP Solids
Heat (IN) (from biogas combustion)
Waste Heat
Boiler /Heat Exchanger
Natural Gas or Oil
Wastewater Treatment Anaerobic Digestion
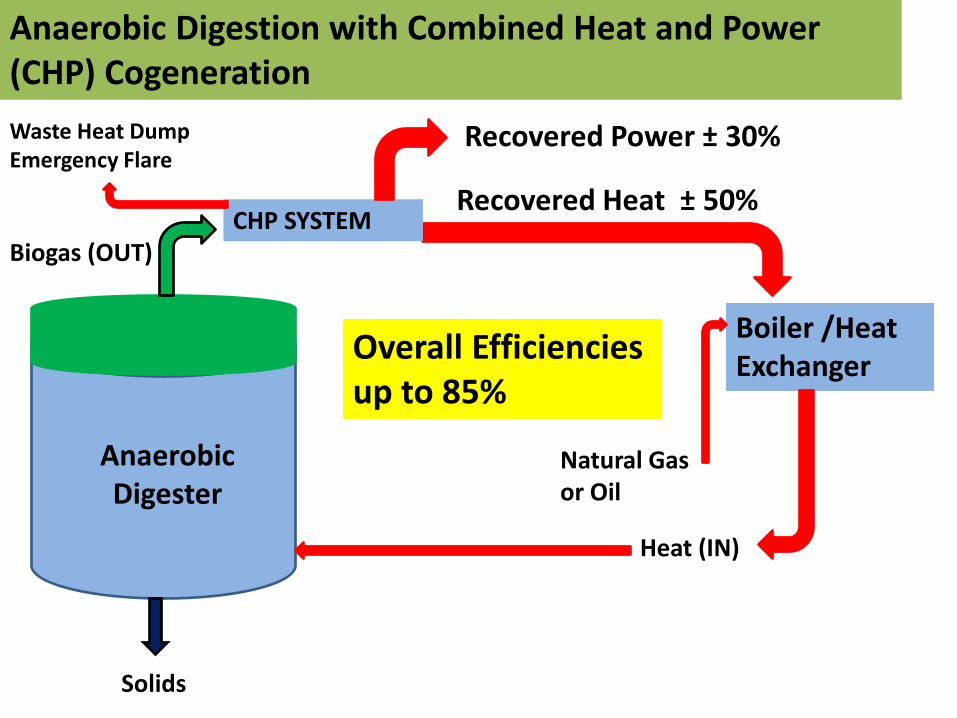
Anaerobic Digestion with Combined Heat and Power (CHP) Cogeneration
Biogas (OUT)
Anaerobic Digester
Solids
Heat (IN)
Recovered Heat ± 50%
Boiler /Heat Exchanger
Natural Gas or Oil
CHP SYSTEM
Recovered Power ± 30% Waste Heat Dump Emergency Flare
Overall Efficiencies up to 85%
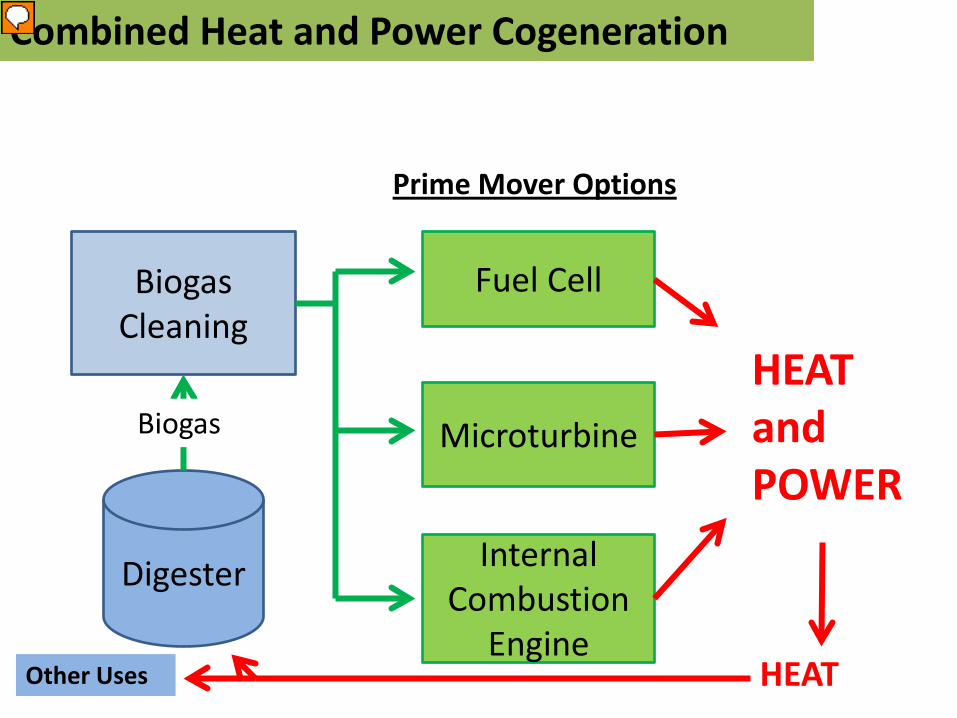
Combined Heat and Power Cogeneration
Biogas Cleaning
Fuel Cell
Microturbine
Internal Combustion
Engine
Digester
Prime Mover Options
HEAT and POWER
HEAT
Biogas
Other Uses
Presenter
Presentation Notes
Overall efficiency up to 80%
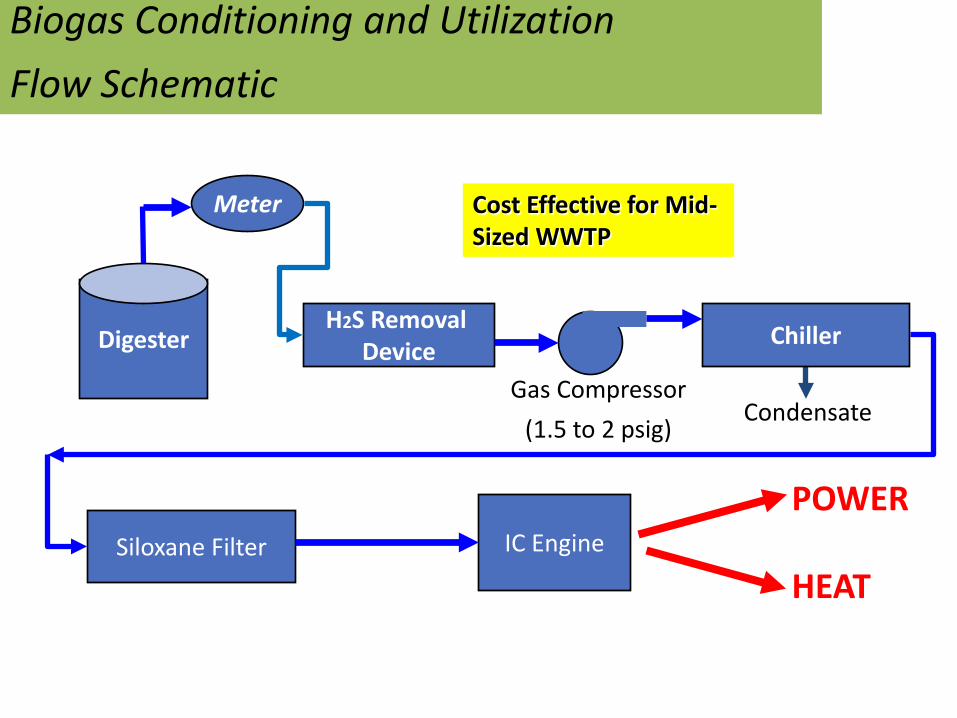
Biogas Conditioning and Utilization Flow Schematic
Digester H2S Removal
Device
Meter
Condensate
Chiller
Siloxane Filter
Gas Compressor (1.5 to 2 psig)
IC Engine POWER
HEAT
Cost Effective for Mid-Sized WWTP
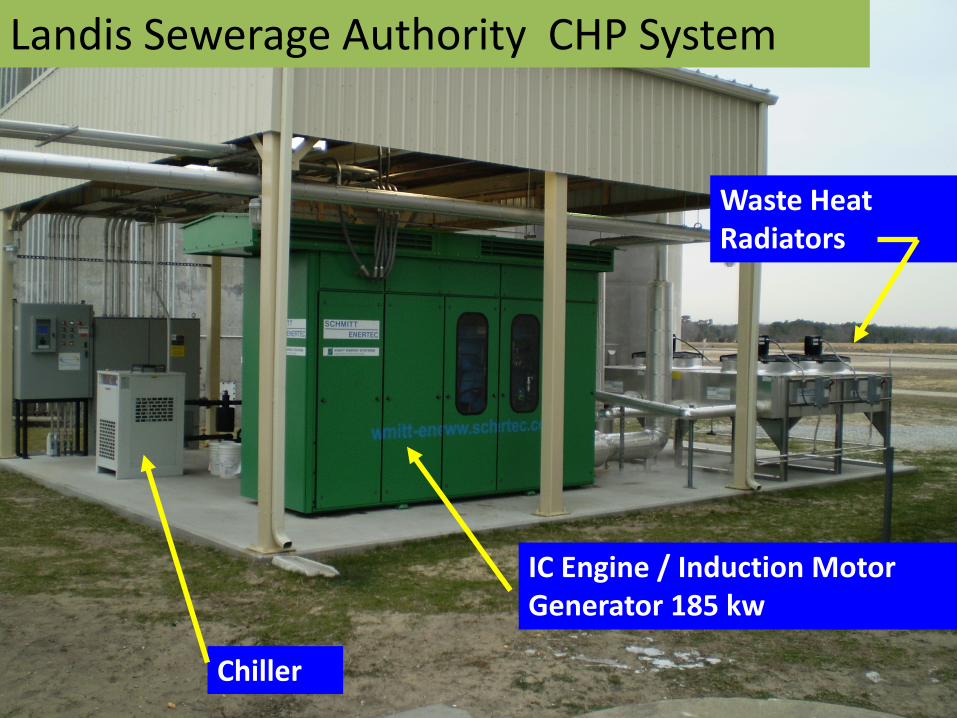
Chiller
IC Engine / Induction Motor Generator 185 kw
Landis Sewerage Authority CHP System
Waste Heat Radiators

H2S Filter Siloxane Filter
Waste-Heat Radiators
Stack
LSA – CHP SYSTEM

40
60
80
100
120
140
160
180
200
Jan Feb Mar Apr May June July Aug Sept Oct Nov Dec
Kwh
2008
Co-Generation Power
LSA Power Generated less Parasitic Losses 2008

0
20
40
60
80
100
120
140
160
180
200
Jan Feb Mar Apr May June July Aug Sept Oct Nov Dec
Kwh
2009
Co-Generation Power
Generator Bearing Failure
LSA Power Gless Parasitic Losses 2009

$-
$1,000
$2,000
$3,000
$4,000
$5,000
$6,000
0 2 4 6 8 10 12 14 16 18 20 22
Thou
sand
$
Year
CoGen Investment Breakeven Analysis ( 36 CFM Gas, 5% Interest, $500K Grant)
Estimated Invested ValueEstimated Value of Net Savings
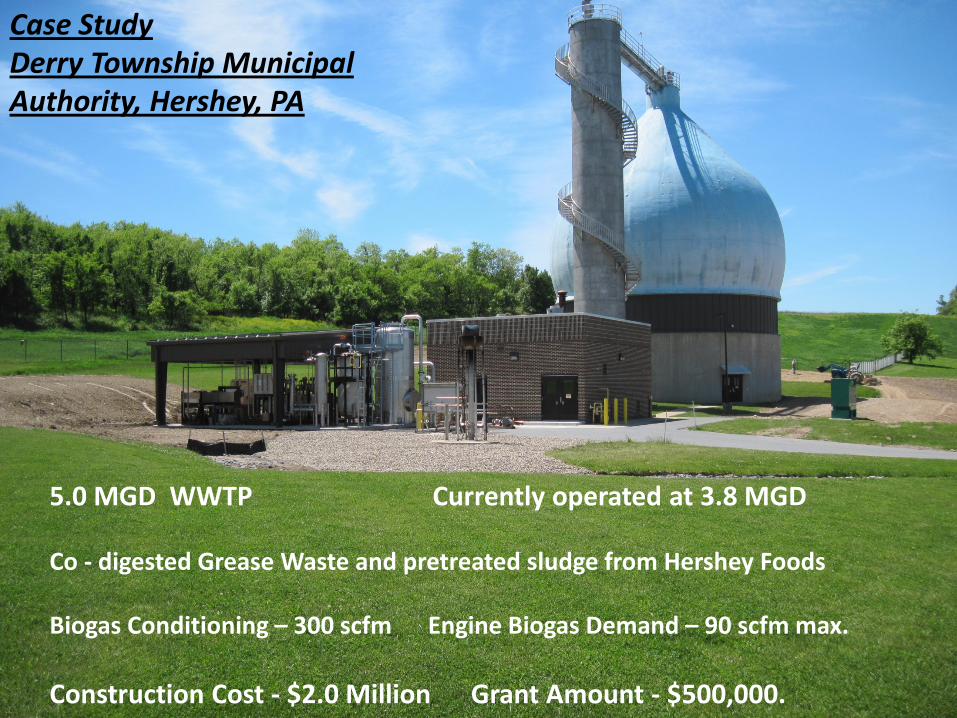
Case Study Derry Township Municipal Authority, Hershey, PA
5.0 MGD WWTP Currently operated at 3.8 MGD Co - digested Grease Waste and pretreated sludge from Hershey Foods Biogas Conditioning – 300 scfm Engine Biogas Demand – 90 scfm max. Construction Cost - $2.0 Million Grant Amount - $500,000.
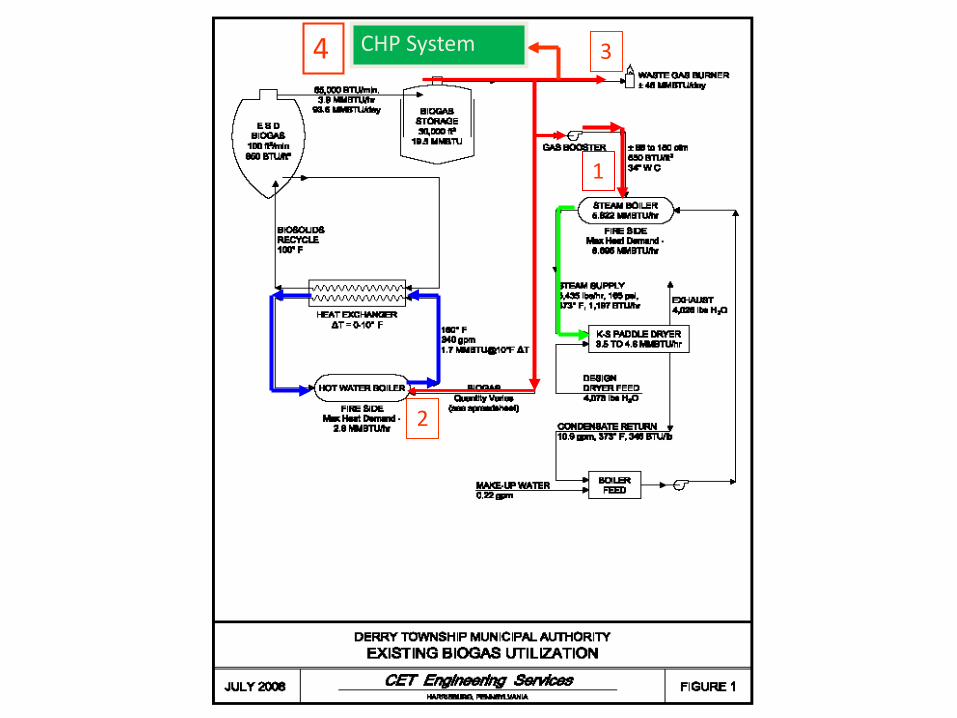
1
2
3 CHP System 4

DTMA Biogas Conditioning System
H2 S Filter
Siloxane Filters

DTMA Biogas Conditioning System
Engine Housed Inside Existing Building
Summertime Waste Heat Radiator
Moisture / Siloxane Reduction Heat Exchanger
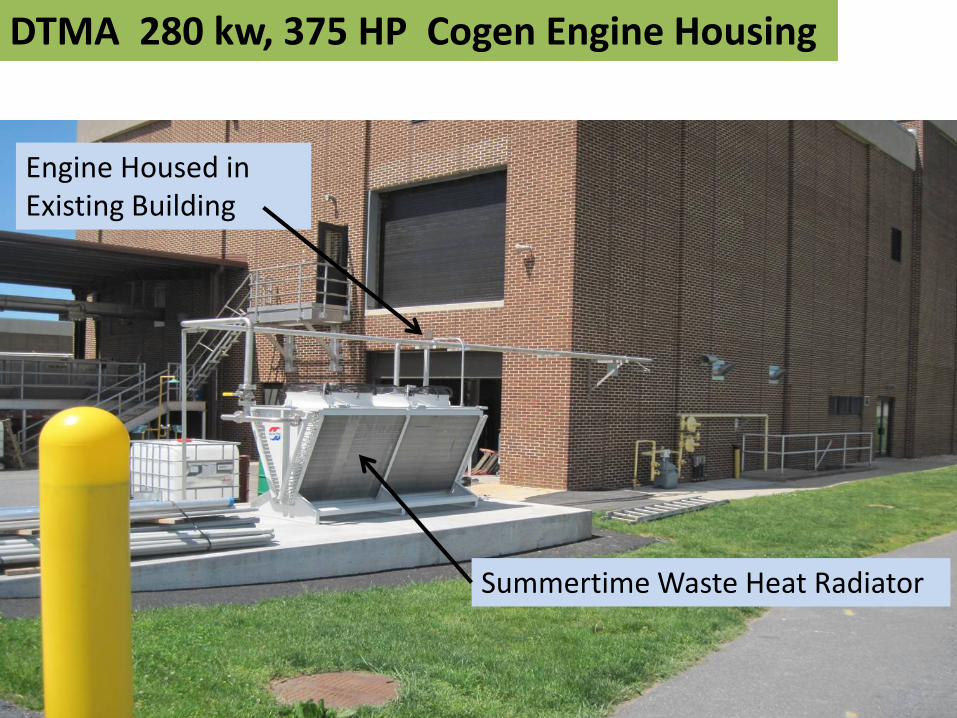
DTMA 280 kw, 375 HP Cogen Engine Housing
Engine Housed in Existing Building
Summertime Waste Heat Radiator
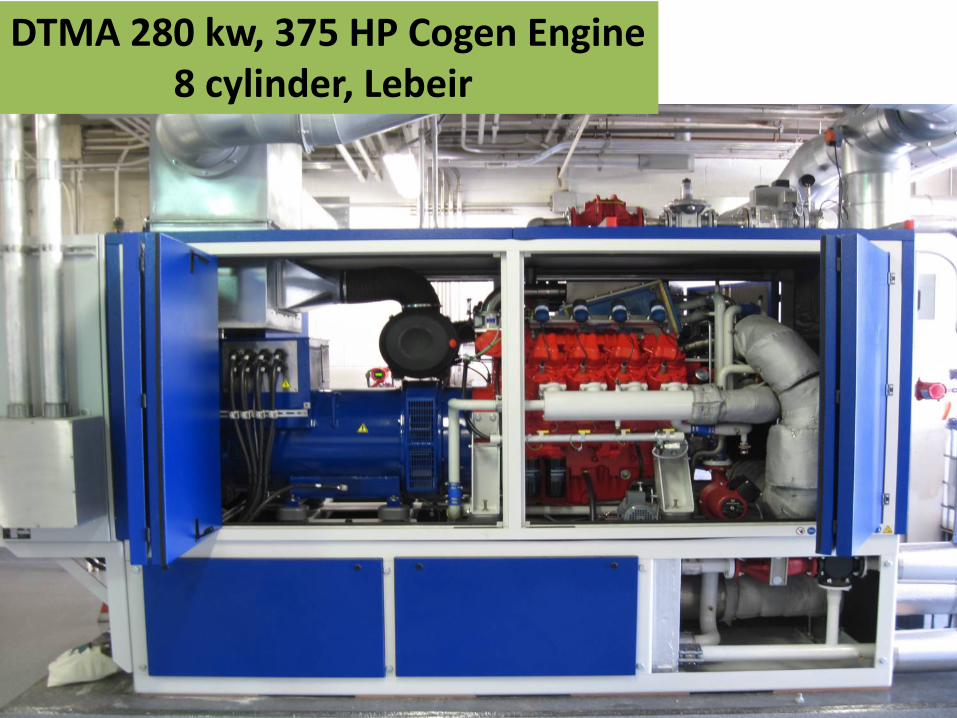
DTMA 280 kw, 375 HP Cogen Engine 8 cylinder, Lebeir
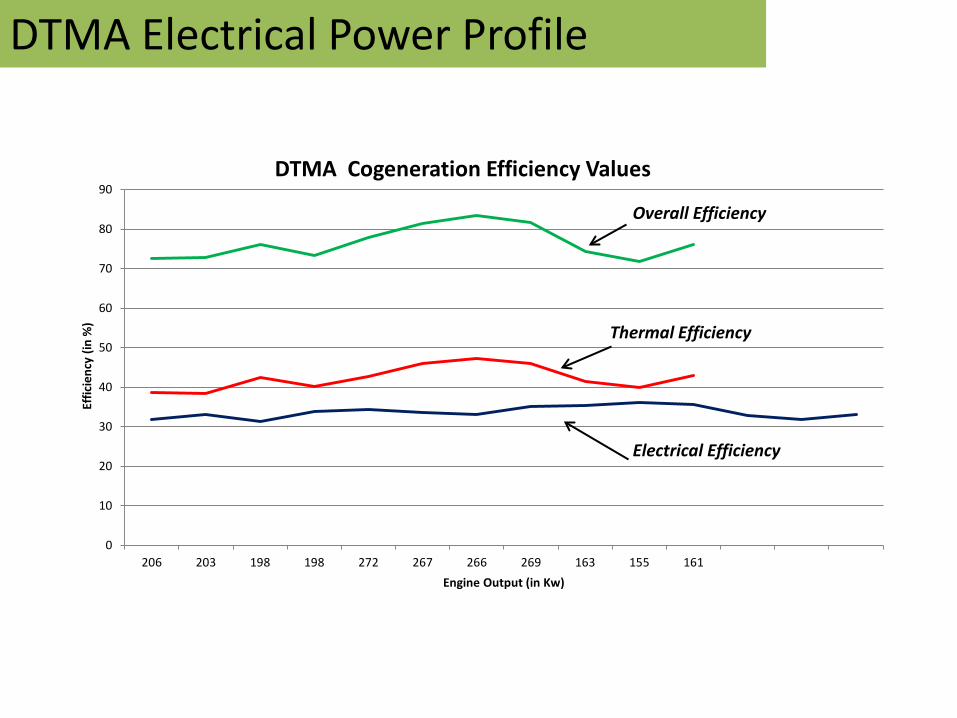
DTMA Electrical Power Profile
0
10
20
30
40
50
60
70
80
90
206 203 198 198 272 267 266 269 163 155 161
Effi
cien
cy (i
n %
)
Engine Output (in Kw)
DTMA Cogeneration Efficiency Values
Overall Efficiency
Thermal Efficiency
Electrical Efficiency

0
20000
40000
60000
80000
100000
120000
140000
160000
180000
1 2 3 4 5 6 7 8 9 10 11 12
KWH
Months
DTMA Electrical Power Profile and Savings
2010
2011
0
2000
4000
6000
8000
10000
12000
14000
1 2 3 4 5 6 7 8 9 10 11 12
Savings in
$ per
Month
Months
2011
2010

Thermal Bioenery Potential Of Biosolids
8,000 to 10,000 BTU / lb.
4,000 BTU / lb.

Indirect dryers use hollow metal paddles or trays with hot fluids inside to dry the biosolids Hot fluids include: • Steam • Thermal fluid (high flash point oil)
Indirect Dryers
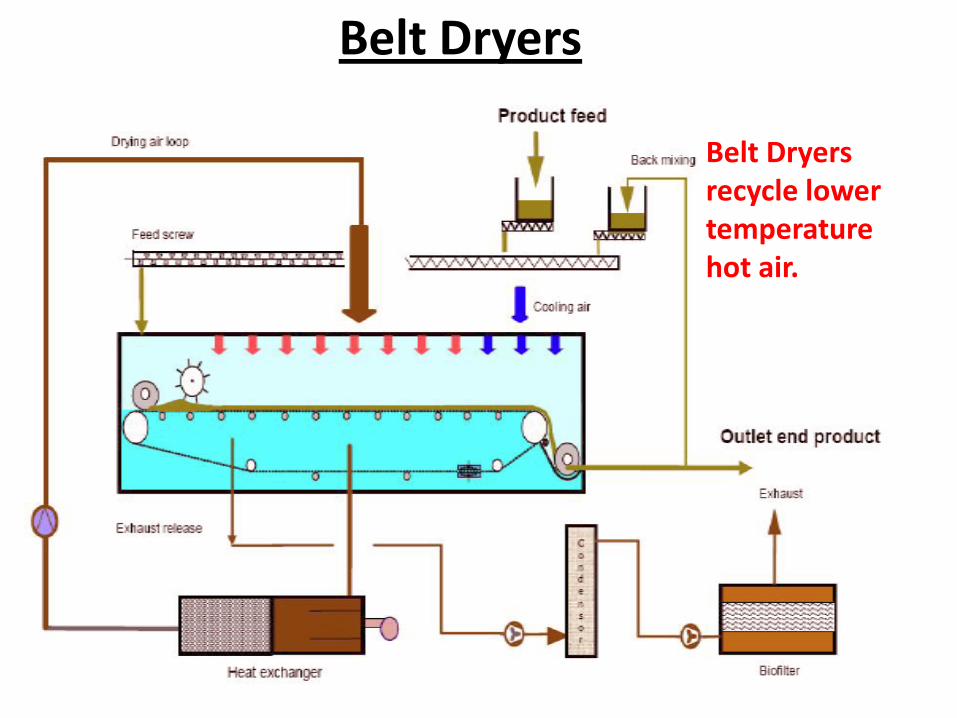
Belt Dryers
Belt Dryers recycle lower temperature hot air.
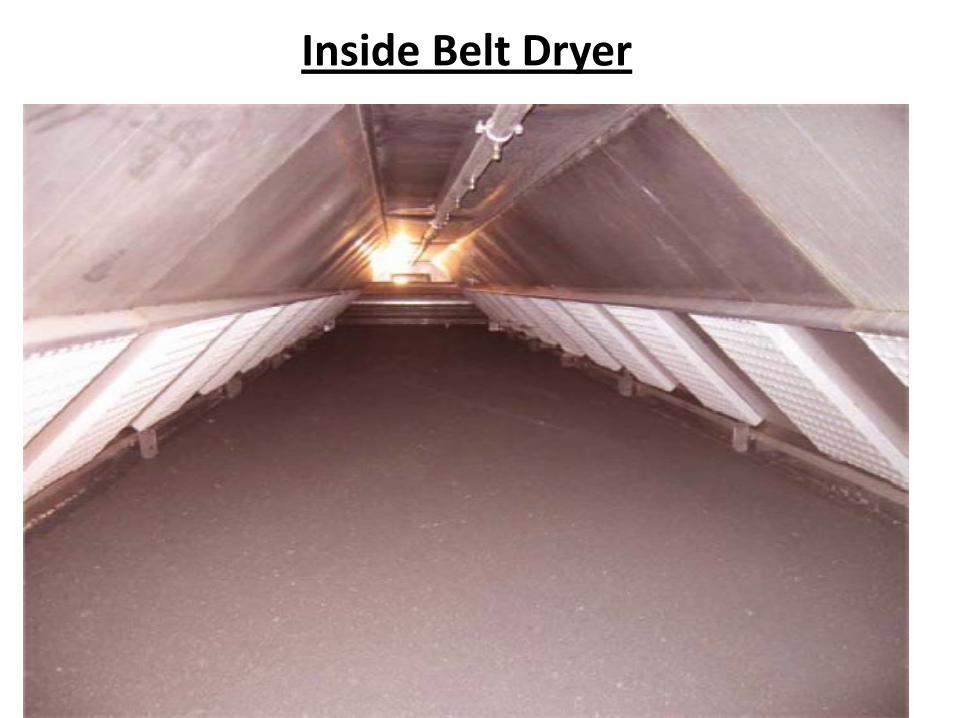
Inside Belt Dryer

Solar Sludge Drying
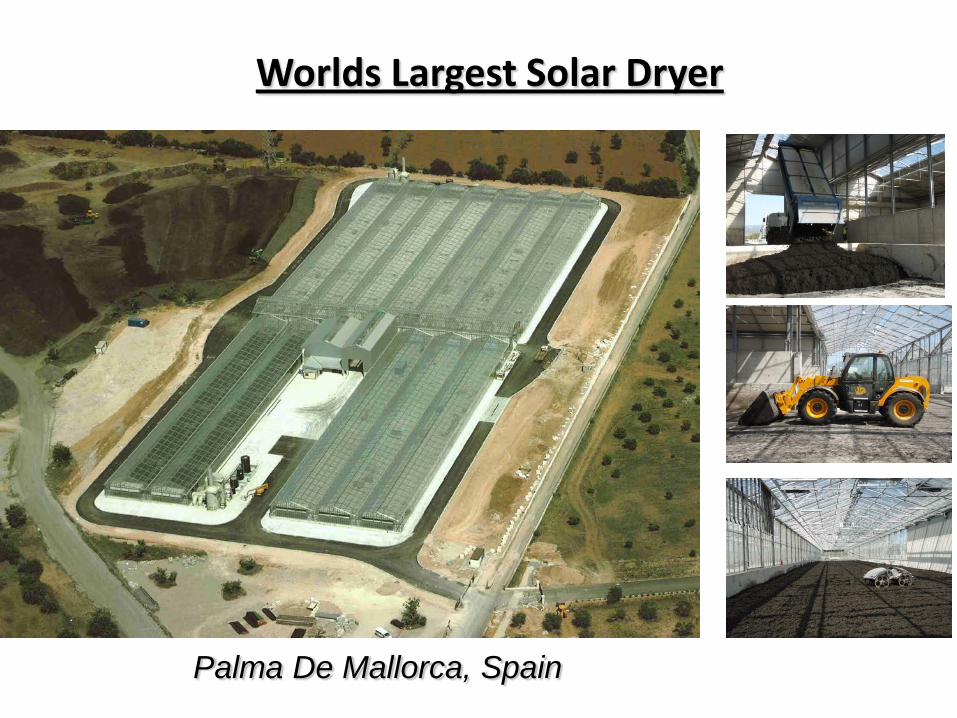
Worlds Largest Solar Dryer
Palma De Mallorca, Spain
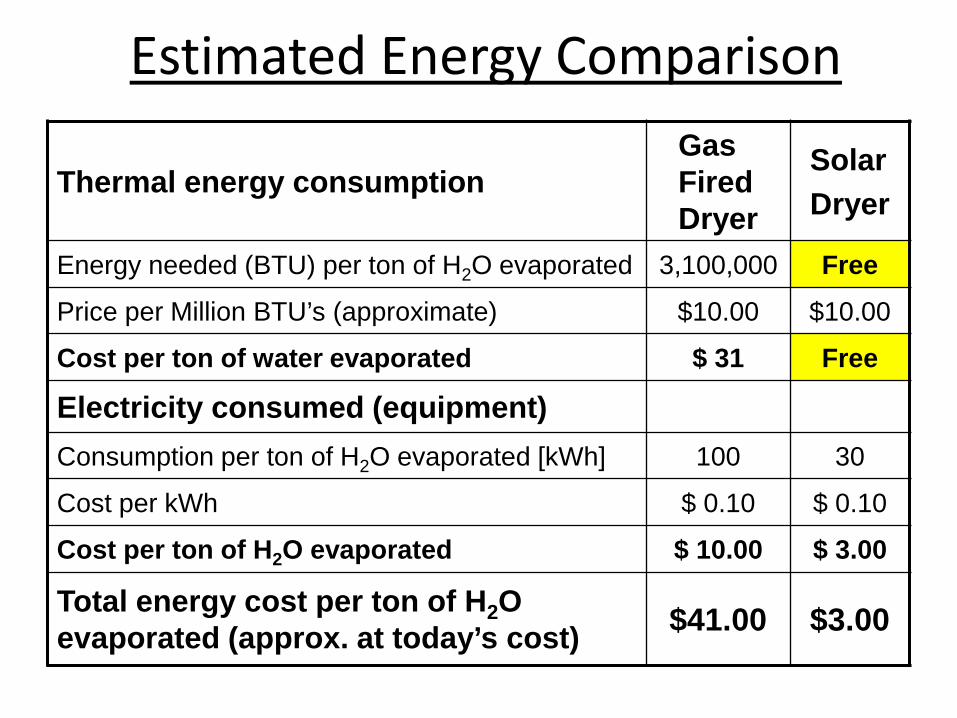
Estimated Energy Comparison
Thermal energy consumption Gas Fired Dryer
Solar Dryer
Energy needed (BTU) per ton of H2O evaporated 3,100,000 Free
Price per Million BTU’s (approximate) $10.00 $10.00
Cost per ton of water evaporated $ 31 Free
Electricity consumed (equipment) Consumption per ton of H2O evaporated [kWh] 100 30
Cost per kWh $ 0.10 $ 0.10
Cost per ton of H2O evaporated $ 10.00 $ 3.00
Total energy cost per ton of H2O evaporated (approx. at today’s cost) $41.00 $3.00
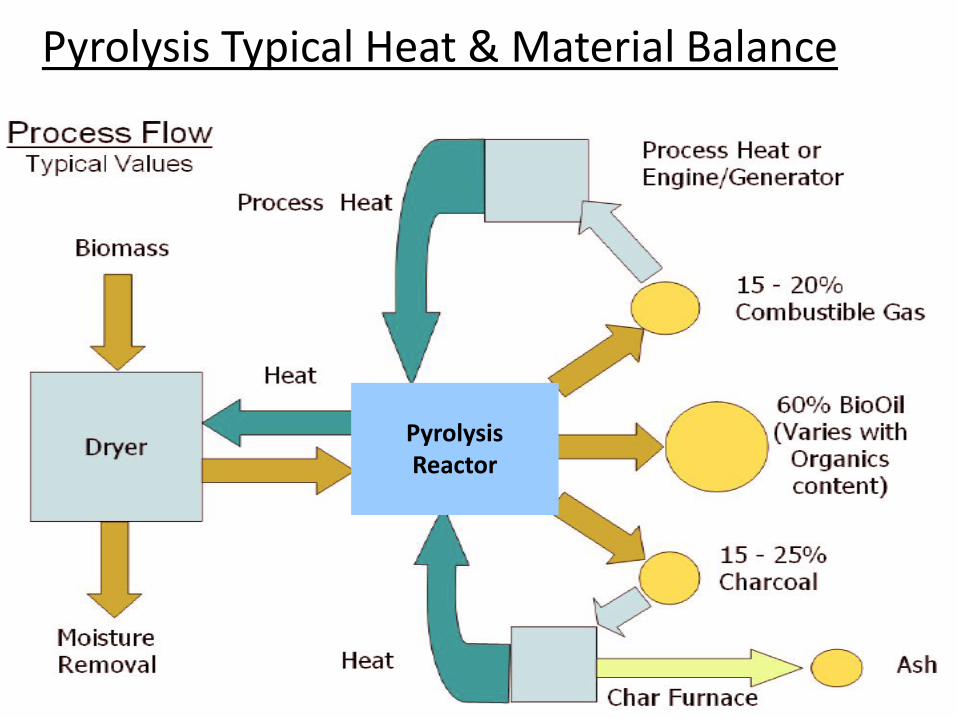
Pyrolysis Typical Heat & Material Balance
Pyrolysis Reactor
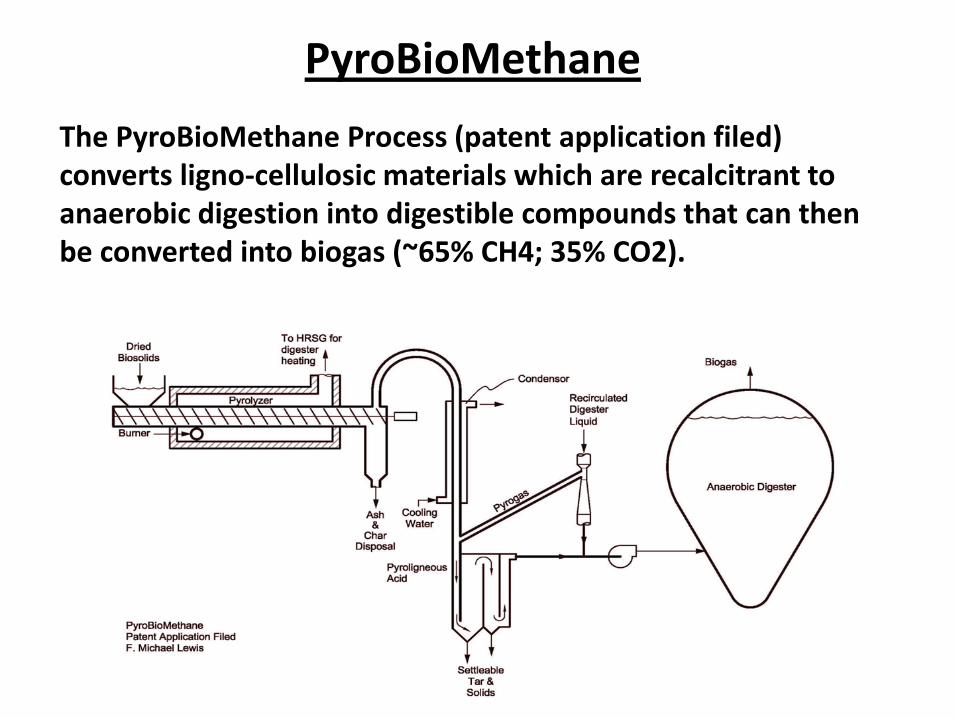
The PyroBioMethane Process (patent application filed) converts ligno-cellulosic materials which are recalcitrant to anaerobic digestion into digestible compounds that can then be converted into biogas (~65% CH4; 35% CO2).
PyroBioMethane

The PyroBioMethane process incorporates a slow, low temperature pyrolysis step. This is not to be confused with the numerous flash pyrolysis processes attempting to produce a “bio-oil” from biomass.

Other Case Studies

Facility Capital Improvement Capital Cost ($)
Energy Saved (in KWHs/yr)
Payback (in Years)
Green Bay WWTP (8.0 MGD)
6 New Blowers; air bearing turbo type
$850,000 (2004)
2,143,974 (50%
reduction)
13
Cumberland Co. Utilities Auth. NJ, (7.0 MGD)
New VFD driven multi- stage cent. blowers; new diffusers, new DO controls, new RAS system
$1.2 Million Annual Revenue $10,000 to $20,000
Self Amortizing Project
Hatfield Township Municipal Auth., PA
ReHeat Oxidization new Multiple Hearth Furnace system.
$10 Million 50,000 Million BTU/yr
Paid for in 4 to 5 yrs.
Burlington, VT New turo Blowers, DO Controls
$56,000 Rebate, electrical utility $21,000
250,000 1
Case Studies:

Facility Capital Improvement Capital Cost ($)
Energy Saved (in KWHs/yr)
Payback (in Years)
DELCORA Change from fuel oil to natural gas for incineration system
$2.3 Million Parallel Furnace Operation: Oil - $4,000 Gas - $650
5
Derry Twp. Mun. Auth., PA
280 kw (350 HP) CHP Cogeneration
$2.1 Million 1.5 to 2 Million KWH 17,000 gal. Fuel Oil
9
Landis Sewerage Auth., NJ
185 kw (240 HP) CHP Cogeneration
$1.4 Million 0.75 to 1.25 Million
6
East Norriton, Plymouth, Whitpain JSA, PA
ReHeat Oxidization system on Multiple Hearth Furnace
$1.2 Million 25,000 to 45,000 MMBTU/yr
6 to 7
Case Studies:
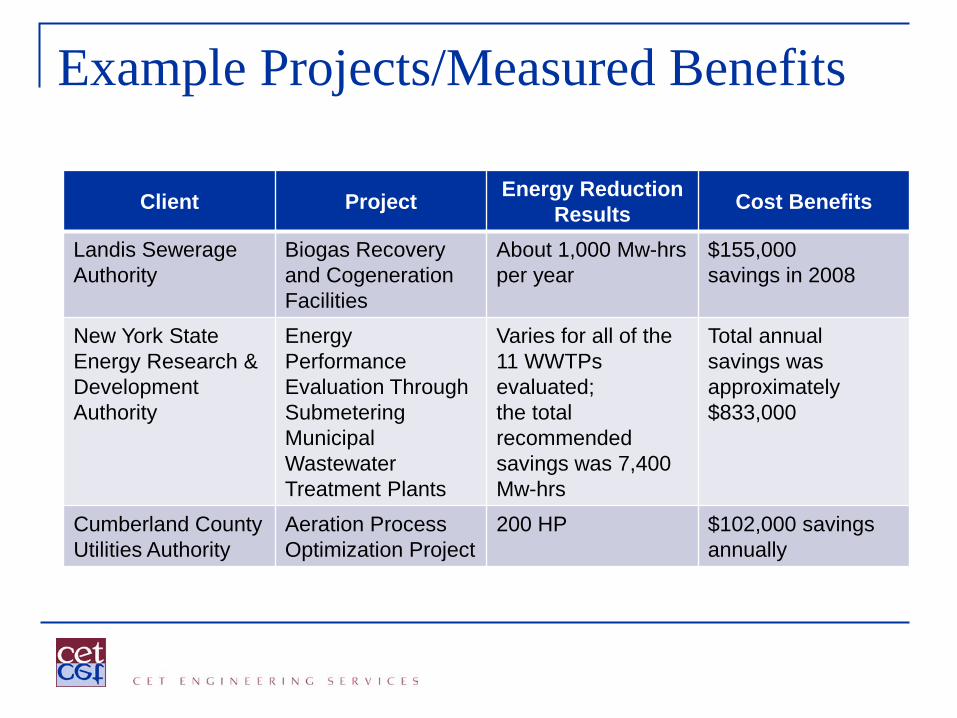
Example Projects/Measured Benefits
Client Project Energy Reduction Results Cost Benefits
Landis Sewerage Authority
Biogas Recovery and Cogeneration Facilities
About 1,000 Mw-hrs per year
$155,000 savings in 2008
New York State Energy Research & Development Authority
Energy Performance Evaluation Through Submetering Municipal Wastewater Treatment Plants
Varies for all of the 11 WWTPs evaluated; the total recommended savings was 7,400 Mw-hrs
Total annual savings was approximately $833,000
Cumberland County Utilities Authority
Aeration Process Optimization Project
200 HP $102,000 savings annually

NYSERDA Cost Savings