Water and sanitation infrastructure for health: The impact ... · Water and sanitation...
24
This Provisional PDF corresponds to the article as it appeared upon acceptance. Fully formatted PDF and full text (HTML) versions will be made available soon. Water and sanitation infrastructure for health: The impact of foreign aid Globalization and Health 2010, 6:12 doi:10.1186/1744-8603-6-12 Marianne J Botting ([email protected]) Edoye O Porbeni ([email protected]) Michel R Joffres ([email protected]) Bradley C Johnston ([email protected]) Robert E Black ([email protected]) Edward J Mills ([email protected]) ISSN 1744-8603 Article type Research Submission date 22 December 2009 Acceptance date 29 July 2010 Publication date 29 July 2010 Article URL http://www.globalizationandhealth.com/content/6/1/12 This peer-reviewed article was published immediately upon acceptance. It can be downloaded, printed and distributed freely for any purposes (see copyright notice below). Articles in Globalization and Health are listed in PubMed and archived at PubMed Central. For information about publishing your research in Globalization and Health or any BioMed Central journal, go to http://www.globalizationandhealth.com/info/instructions/ For information about other BioMed Central publications go to http://www.biomedcentral.com/ Globalization and Health © 2010 Botting et al. , licensee BioMed Central Ltd. This is an open access article distributed under the terms of the Creative Commons Attribution License ( http://creativecommons.org/licenses/by/2.0), which permits unrestricted use, distribution, and reproduction in any medium, provided the original work is properly cited.
Transcript of Water and sanitation infrastructure for health: The impact ... · Water and sanitation...
This Provisional PDF corresponds to the article as it appeared upon acceptance. Fully formattedPDF and full text (HTML) versions will be made available soon.
Water and sanitation infrastructure for health: The impact of foreign aid
Globalization and Health 2010, 6:12 doi:10.1186/1744-8603-6-12
Marianne J Botting ([email protected])Edoye O Porbeni ([email protected])
Michel R Joffres ([email protected])Bradley C Johnston ([email protected])
Robert E Black ([email protected])Edward J Mills ([email protected])
ISSN 1744-8603
Article type Research
Submission date 22 December 2009
Acceptance date 29 July 2010
Publication date 29 July 2010
Article URL http://www.globalizationandhealth.com/content/6/1/12
This peer-reviewed article was published immediately upon acceptance. It can be downloaded,printed and distributed freely for any purposes (see copyright notice below).
Articles in Globalization and Health are listed in PubMed and archived at PubMed Central.
For information about publishing your research in Globalization and Health or any BioMed Centraljournal, go to
http://www.globalizationandhealth.com/info/instructions/
For information about other BioMed Central publications go to
http://www.biomedcentral.com/
Globalization and Health
© 2010 Botting et al. , licensee BioMed Central Ltd.This is an open access article distributed under the terms of the Creative Commons Attribution License (http://creativecommons.org/licenses/by/2.0),
which permits unrestricted use, distribution, and reproduction in any medium, provided the original work is properly cited.

Water and sanitation infrastructure for health: The impact of foreign aid
Marianne J. Botting (1) Edoye O. Porbeni (2) Michel R. Joffres (2) Bradley C. Johnston (3) Robert E. Black (4) Edward J. Mills (5)*
1) Sunnybrook Health Sciences Centre, University of Toronto, Toronto, Canada 2) Faculty of Health Sciences, Simon Fraser University, Burnaby, Canada 3) Department of Clinical Epidemiology and Biostatistics, McMaster University,
Hamilton, Canada 4) Department of International Health, Johns Hopkins Bloomberg School of Public
Health, Johns Hopkins University, Baltimore, USA 5) Interdisciplinary School of Health Sciences, Faculty of Health Sciences,
University of Ottawa, Ottawa, Canada Email addresses: MJB: [email protected] EOP: [email protected] MRJ: [email protected] BCJ: [email protected] REB: [email protected] EJM: [email protected] *Corresponding author
Abstract
Background: The accessibility to improved water and sanitation has been understood as
a crucial mechanism to save infants and children from the adverse health outcomes
associated with diarrheal disease. This knowledge stimulated the worldwide donor
community to develop a specific category of aid aimed at the water and sanitation sector.
The actual impact of this assistance on increasing population access to improved water
and sanitation and reducing child mortality has not been examined.
Methods: We performed a country-level analysis of the relationship between water and
sanitation designated official development assistance (WSS-ODA) per capita, water and
sanitation coverage, and infant and child mortality in low-income countries as defined by
the World Bank. We focused our inquiry to aid effectiveness since the establishment of
the Millennium Development Goals (MDGs).
Results: Access to improved water has consistently improved since 2002. Countries
receiving the most WSS-ODA ranged from odds ratios of 4 to 18 times more likely than
countries in the lowest tertile of assistance to achieve greater gains in population access
to improved water supply. However, while there were modestly increased odds of
sanitation access, these were largely non-significant. The countries with greatest gains in
sanitation were 8-9 times more likely to have greater reductions in infant and child
mortality.
Conclusions: Official development assistance is importantly impacting access to safe
water, yet access to improved sanitation remains poor. This highlights the need for
decision-makers to be more intentional with allocating WSS-ODA towards sanitation
projects.

Background
Worldwide, 18% of all deaths in children under five are due to diarrheal diseases,
accounting for approximately 1.4 million deaths per year. This makes diarrheal diseases a
leading cause of child death globally[1, 2]. The most common cause of diarrheal diseases
results from gastrointestinal infections[3, 4]. The majority of diarrheal deaths in children
are due to the loss of large quantities of water and electrolytes (sodium, chloride and
potassium) through liquid stool, resulting in severe dehydration and acidosis[5].
Being primarily a faecal-oral disease, preventive measures include improving
access to safe drinking water and adequate sanitation. Wealthy nations and international
bodies first began designating assistance for water and sanitation specifically through the
World Bank in 1961 [6]. The history of development assistance in the water and
sanitation sector, summarized by Grover and others, includes investment in service
provision and infrastructure, and is marked by numerous international conferences and
declarations, multilateral organizational involvement, the International Drinking Water
Supply and Sanitation Decade (1990s), and the creation of water working groups,
councils, and partnerships [6-11]. In 2000, the Millennium Development Goals (MDGs),
were developed as a way to draw attention to global health and social justice issues and
measure global progress on these goals. Target four under Goal 7 is to “halve, by 2015,
the proportion of the population without sustainable access to safe drinking water and
basic sanitation”[12]. Goal 4 is to “Reduce by two-thirds, the under-five mortality rate”.
The adoption of the MDGs may in part explain the increase in overseas development
assistance (ODA) to over 5 times that of 1990 levels[13].

Studies on aid effectiveness have been mixed. Most have dealt with the relationship
between ODA and economic growth[14-16] the effect of predictability[17] and aid
modality[18, 19] on development. More recently some have examined the effectiveness
of foreign aid in poverty reduction and human development [20-22]. Only one study has
looked at aid effectiveness and population access to water and sanitation, though as part
of a framework examining public service delivery in general [23]. Our aim was to
specifically examine the relationship between per capita ODA designated to the water
and sanitation, the change in population access to improved water and sanitation services,
and subsequent indicators of child health.
Methods
Study Design and Rationale
Our study is a country-level analysis of the relationship between disbursements of
official development assistance (ODA) per capita, improved water and sanitation
coverage, and infant and child mortality since the establishment of the MDGs. Disbursed
ODA was chosen since promised ODA has not yet had the chance to effect change.
Countries included in this analysis were the 49 low-income economies of the world as
defined by the World Bank [24]. Nearly 70 percent of the countries are in Africa. The
low-income country category was chosen because of expected low levels of water and
sanitation-related infrastructure and high influx of ODA.

Data Collection
All included countries had data for water and sanitation access and ODA. All
ODA statistics for the years 2002-2006 were sourced from the Organization for
Economic Cooperation and Development Creditor Reporting System database [25] Data
on coverage of safe water and sanitation for the MDGs was gathered from The official
United Nations site for the MDG indicators for 2000 and 2006 [26] These data come
from the WHO/UNICEF Joint Monitoring Programme, which has specific definitions for
improved water supply and sanitation facilities. An improved water supply as any of the
following sources: piped water into a dwelling, plot, or yard; public tap or standpipe;
tubewell or borehole; protected dug well; protected spring; or rainwater. Options that
qualify as improved sanitation are: flush or pour-flush toilets connected to a sewer or
septic tank, pit latrines, Ventilated Improved pit latrines, pit latrines with a slab, and
composting toilets. It should be noted that since 2000, the Joint Monitoring Programme
since 2000, JMP has used multiple population-based surveys rather than estimates of
coverage by service providers, and values are derived from regression analysis to give the
best estimate of coverage in a single year [27]. Infant mortality rate (IMR) and child
mortality rate (CMR) figures were sourced from the World Health Organization
Statistical Information System (WHOSIS) [27]. The IMR and CMR data were gathered
for the years 2000 and 2006. The IMR and CMR indicators were chosen for child health
outcomes due to the lack of both baseline (year 2000 or before) and more recent (after
year 2000) data points for diarrhoeal-specific death rates.
We gathered information on potential confounders and effect modifiers from
various sources. Country population, gross domestic product (GDP) and health
expenditure statistics are sourced from WHOSIS [27] For population and GDP, the latest

available statistics are used. Health expenditure data was collected for the years 2000-
2006 for all countries except Laos and Somalia. We sourced Corruption Perception Index
data for 43 of the countries in our sample from the Transparency International annual
survey for 2006 [28] The index uses a scale of one to ten, with one being the most
corrupt. We collected data on land area statistics for all 49 countries from the US Central
Intelligence Agency World Factbook. Adjusting variables were included in the regression
modelling and odds ratio calculations, as specified in the data tables.
Statistical Analysis
We calculated the change in access to improved water and sanitation as the
difference in percent coverage between 2000 and 2006. Sao Tomé and Principe was
excluded from the analysis due to an atypically high influx of ODA in 2002 and 2003,
which made the ODA per capita out of the range of the other countries due to their small
populations.
Two values of change in outcomes (water coverage, sanitation coverage, IMR,
and CMR) were calculated, namely absolute change and relative change. The absolute
change was calculated simply by subtracting the value in 2000 from the value in 2006.
The relative change was calculated by taking the absolute change and dividing by the
2000 baseline value. Unless otherwise stated, the values presented are relative change.
Variables were assessed for normality, and found in general to have skewed
distributions. Thus, Spearman rank correlation coefficients were obtained to identify
statistically significant relationships between variables. To assess the associations
between variables of interest, unadjusted and adjusted odds ratios and 95% confidence
intervals were estimated by unconditional logistic regression. The Mantel-Haenszel

Statistic and the Breslow-Day test for homogeneity of the odds ratio were used to assess
potential confounding. Using these results, we adjusted for area and country population
using logistic regression. We used 2-sided p-values and all p-values are exact. All
statistical analysis was performed using Statistical Analysis Software (SAS) 9.1.
Here it should be noted that the mismatch in years between ODA and outcomes
(water and sanitation coverage, and IMR/CMR), though not ideal, does not negate the
findings of this analysis. The year 2000 was the closest year available to the beginning of
the ODA data for outcome variables, and thus is considered as a baseline value. Analysis
focuses on the absolute or relative change in outcomes in relation to ODA flows. All
years of ODA are compared individually to the change in outcomes between 2000 and
2006 to attempt to quantify the average lag in effect between ODA delivery and change
in outcome.
Results
Sample characteristics
Countries varied greatly in land area, and in total water and sanitation designated
official development assistance (WSS-ODA) received, as evidenced by the differences
between medians and their corresponding means. In general, WSS-ODA has risen
steadily between 2002 and 2006. Overall increases in water and sanitation coverage
alongside decreases in IMR and CMR were observed between 2000 and 2006. A
summary of data for collected variables is displayed in Table 1.

Correlations
Statistically significant correlations (Table 2) were observed for all years of WSS-
ODA per capita and the change in water access except for 2005 and 2006, with the
strongest correlation occurring for ODA given in 2004 (p=0.004). Interestingly, the
change in access to sanitation was negatively associated with the per capita government
health expenditure in 2006 (p=0.025).
In cases where no correlation was observed, we cannot conclude that there is
indeed no true association due to the limitation on statistical power determined by the
small sample size of the analysis. Hence it is with this disclaimer that we report that our
analysis did not detect statistically significant correlations between total levels of ODA
and any health or infrastructure changes; absolute change in water access and child
health; WSS-ODA and changes in access to improved sanitation services; and finally
country GDP and absolute change in access to improved water supply.
Aid and access:
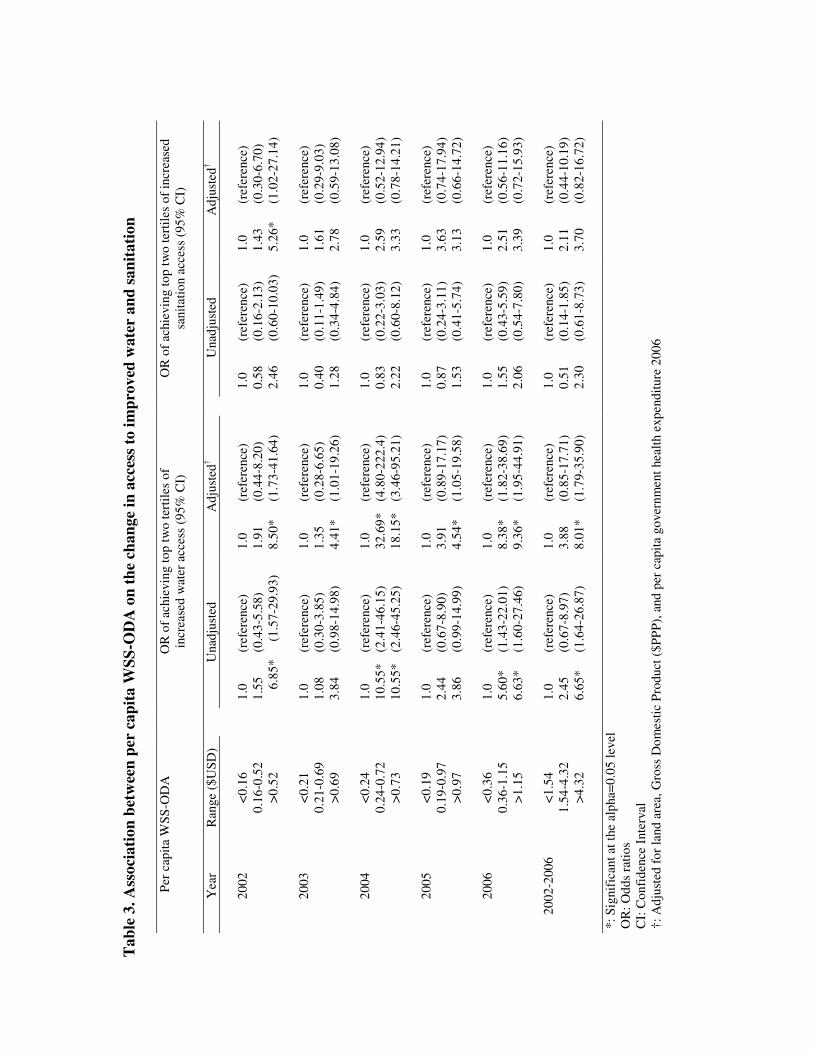
Table 3 summarizes the odds of increasing access to safe water and sanitation by
the amount observed in either the middle or top tertiles of change for each of the three
levels of WSS-ODA per capita received. Table 4 displays the ranges of change in
population access to improved water and sanitation. The unadjusted odds ratios are
presented alongside odds ratios adjusted for area, GDP, and per capita government health
expenditure for 2006.
Significant odds ratios for water access and WSS-ODA per capita were observed
for all years in the adjusted model, ranging from 4.4 (2003) to 32.7 (2004). Most odds

ratios were not significant for sanitation and WSS-ODA per capita, with the exception of
the adjusted model for 2002 (see Tables 3 and 4).
Access and child health
Table 5 summarizes the odds of increasing access to safe water and sanitation by
the amount observed in either the middle or top tertiles of change for each of the three
levels of reduction in child mortality. Unadjusted odds ratios were presented alongside
odds ratios adjusted for area, GDP, and per capita government health expenditure.
Though not apparent in the unadjusted odds ratios, accounting for potential confounders
uncovered an association between reductions in infant and child mortality and gains in
population access to improved sanitation. No such association was found for water
access. Reasons for this are discussed in the next section.
Line equation for assistance and water access
We used the logistic procedure in SAS to compute the equation of the regression line for
WSS-ODA per capita in 2004 and population access to improved water, adjusting for
area, GDP, and government health expenditure. The equation of the line was as follows:
Change in % population access to water = 3.8266 + 3.8457 * WSS-ODA per capita 2004.
Using this equation, it is estimated to cost $1.60USD per capita to increase the
number of people with access to improved water supply by 10% of the starting value. The
immediate caution to this formula is that actual increases in coverage depend on how
investment decisions are made and funds are administered. To make this formula more
clear, consider an example of a population of one million people where 80% of the
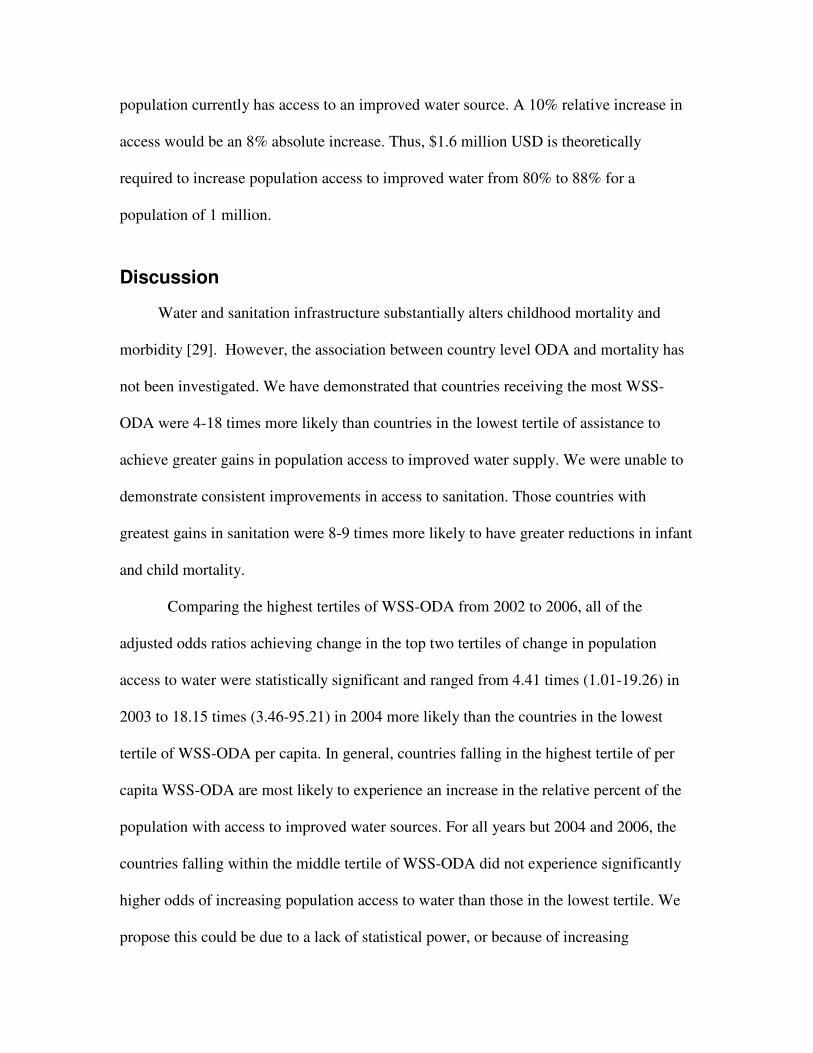
population currently has access to an improved water source. A 10% relative increase in
access would be an 8% absolute increase. Thus, $1.6 million USD is theoretically
required to increase population access to improved water from 80% to 88% for a
population of 1 million.
Discussion
Water and sanitation infrastructure substantially alters childhood mortality and
morbidity [29]. However, the association between country level ODA and mortality has
not been investigated. We have demonstrated that countries receiving the most WSS-
ODA were 4-18 times more likely than countries in the lowest tertile of assistance to
achieve greater gains in population access to improved water supply. We were unable to
demonstrate consistent improvements in access to sanitation. Those countries with
greatest gains in sanitation were 8-9 times more likely to have greater reductions in infant
and child mortality.
Comparing the highest tertiles of WSS-ODA from 2002 to 2006, all of the
adjusted odds ratios achieving change in the top two tertiles of change in population
access to water were statistically significant and ranged from 4.41 times (1.01-19.26) in
2003 to 18.15 times (3.46-95.21) in 2004 more likely than the countries in the lowest
tertile of WSS-ODA per capita. In general, countries falling in the highest tertile of per
capita WSS-ODA are most likely to experience an increase in the relative percent of the
population with access to improved water sources. For all years but 2004 and 2006, the
countries falling within the middle tertile of WSS-ODA did not experience significantly
higher odds of increasing population access to water than those in the lowest tertile. We
propose this could be due to a lack of statistical power, or because of increasing
population sizes, where WSS-ODA levels that fall below a certain threshold do not
appear to increase access to coverage of water and sanitation services because the
population is growing faster than additional services are being provided.
Despite trends of improved access to sanitation, most evaluations were
statistically non-significant. It is unclear whether or not the lack of association is due to a
true lack of association between WSS-ODA and sanitation, or whether or not, because of
the higher complexity of sanitation systems, there is a lag period for the association to
emerge. It may seem a paradox that overall, smaller relative gains were made in access to
water compared to access to sanitation, yet WSS-ODA was only significantly related to
the change in water access. A large factor in explaining this paradox is that the median
baseline value for water access was much higher compared to that of sanitation (59% vs.
28%). Sanitation appears in some ways to be at odds with ODA and government health
expenditures, as negative correlations were observed for both the sum of the total ODA
per capita between 2002 and 2006 (-0.30, p=0.041) and per capita government health
expenditures in 2006 (-0.33, p=0.025). Further analysis is required to explain the
relationship between ODA and sanitation.
Interestingly, there was no significant correlation between total ODA per capita
received by a country and any of the child health indicators. There was however a
significant association between higher levels of increase in sanitation and reductions in
infant and child mortality, with adjusted odds ratios of 8 and 9 times for the highest
compared to the lowest tertiles, respectively. It is unknown why there is an apparent lack
of association between this relationship and WSS-ODA. It may be due to ineffectiveness
in investments, a weak capacity of the mandated national institutions, or perhaps due to
success on behalf of local, non-internationally funded efforts. The higher odds of
sanitation, as compared to water access, producing significant reductions in child
mortality is consistent with the literature including a study by Fewtrell and co-workers
[29, 30, 31], who showed that sanitation and hygiene have a greater impact in relative
risk of acquiring diarrhea compared to water quality and water supply projects. And yet,
at least for donors that do provide disaggregated WSS-ODA data, only 30% of funding
goes to sanitation and hygiene efforts [32]. This highlights the need for decision-makers
to be more intentional with allocating WSS-ODA towards sanitation projects.
While public health practitioners may consider water and sanitation to go hand in
hand, this natural association must not be assumed in all cultural contexts [31]. Water, for
example, is often interpreted as a broad community issue that contributes to the local
economies in a variety of important ways, including employment based on clean water
access, such as food sales. Sanitation, on the other hand, may be associated with cultural
taboos, preventing local discussion of this important child health indicator [32]. Thus
interventions must recognize the uniqueness in approach necessary to optimize maximum
health benefits from water supply and sanitation and hygiene projects. Indeed, on an
international level, sanitation is gaining more unique attention, as evidenced by the
declaration by the United Nations of 2008 as the International Year of Sanitation.
Similarly, the eThekwini Declaration was supported by 32 African ministers responsible
for sanitation to ensure increased spending on sanitation [33] The impact of these
assurances need to be monitored. Currently the EU Water Initiative is working to provide
a feasible strategy to disaggregate WSS-ODA data into aid for water supply, sanitation
and hygiene, and water resources management [32] When this data becomes available, a
more thorough analysis of the relationship between water and sanitation-designated
funding, and their respective impacts on health should be assessed.
As with any study, this research was bound by certain limitations. First, due to the
nature of the research question dealing with only low-income countries, our sample size
was relatively small, which constrained some steps in our statistical analysis. It was
further constrained for analysis of health outcomes by the fact that diarrhoeal diseases
account for an estimated 18% of child deaths [1] Hence it is possible that with a larger
number of countries, correlations and odds ratios of borderline significance would
become significant.
Another limitation is that ecological studies are always to be interpreted with the
understanding that cross-country comparisons cannot capture fully all of the unique
socio-political, economic, cultural, and geographic factors that influence aid effectiveness
in expanding water and sanitation infrastructure, and gains in child health made can be
masked by other factors, such as increasing mortality from HIV/AIDS. Because of the
scope of our research, we were unable to include an analysis of how conditions in conflict
settings influence both ODA and its distribution and timeliness in expanding access to
water and improved sanitation facilities. This is an important topic for future study.
As we approach 2015 and the world continues to labour to meet its commitment
to the Millennium Development Goals, regular assessments should be carried out on the
goals and their components. This study draws attention to the need for more research
around ODA effectiveness in the expansion and maintenance of water and sanitation
infrastructure. Despite the transfer of large amounts of ODA, many of the MDG targets
are not expected to be met [13, 23] The G-8 summit in 2005 resulted in a commitment to

double aid to Africa to help change the course of these projects, particularly in improving
the delivery of government services and the building infrastructure for health, education,
and water and sanitation [23] Yet Thiele and colleagues found that proportions of total
aid going to water and sanitation have decreased since the early 1990s, with the
proportion designated to water and sanitation dropping from 4.9% to 3.9% and 1.1% to
0.8% in 2002-2004, respectively [34]
More research is needed to understand the seemingly paradoxical relationship
between ODA and sanitation, how debt relief compares to grants and loans in
proliferating water and sanitation infrastructure, what degree of public-private mixing in
ownership and service provision is optimal for rapid expansion in certain resource-poor
settings, and how public education can be used to compliment infrastructural expansion
to produce synergistic benefits to child health. It would also be interesting to conduct an
analysis determine the effectiveness of national allocations towards the water and
sanitation sector.
Preparation for this study uncovered the absence of important data. To begin, our
initial aim was to use diarrheal-specific mortality rates as our health outcome, since it is
expected to have a stronger association with water and sanitation infrastructure than
overall infant and child mortality rates. This indicator could not be employed since the
percentage of deaths from diarrheal disease, as reported by the World Health
Organization, was only reported for the year 2000. In addition to diarrheal mortality, we
had desired to control for conflict, but could not because we were unable to find an
appropriate conflict index scale.

Future research would benefit from the accessibility of sub-national level
monitoring of progress in water and sanitation access as well as health surveillance. Since
country-level data is often derived from census data, it is highly likely for many countries
that district and even city-level data is available, but not accessible. We would strongly
suggest that an international body, such as the UNICEF or the World Health
Organization, solicit and make publicly available sub-national data, to help researchers
avoid the ecological fallacy and be able to conduct precise and detailed inquiries.
Competing Interests
The authors declare that they have no competing interests.
Authors’ contributions
EP, MJB, MJ, and EM conceptualized the research question and developed the
inclusion criteria, EP, MJB collected data on the variables. MJ, RB and MJB
conceptualized and performed the statistical analysis. EP and MJB prepared the first draft
of the manuscript. EP, MJB, MJ, EM, BJ and RB critiqued the draft, added text, and gave
valuable input to refinement of the statistical analysis. Subsequent revisions were made
by all authors. All authors reviewed the final draft and approved it for submission.
Acknowledgments
We thank Ms. Samantha Biggs for assisting in early stages of the analysis.

Tables
Table 1. Summary statistics for key country characteristics
Median Mean Standard Error
n
Land area (km2) 259,828.50 444,992.79 66,057.82 48
Gross Domestic Product ($PPP) 1,120.00 1,144.78 82.68 46
Sum of all ODA from 2002 to 2006 (millions $USD)
1,156.68 2,191.46 434.28 48
Per capita WSS-ODA ($USD)
2002-2006 2.73 3.41 0.45 48 2002 0.25 0.42 0.06 47 2003 0.35 0.60 0.09 49 2004 0.44 0.66 0.11 48 2005 0.53 0.80 0.13 48 2006 0.59 0.94 0.13 48
Change in % access to safe water between 2000 and 2006
4.76 9.80 2.09 48
Change in % access to safe sanitation between 2000 and 2006
9.09 16.22 3.42 47
% change in infant mortality rate between 2000 and 2006
-8.66 -10.39 1.38 48
% change in child mortality rate between 2000 and 2006
-9.64 -11.68 1.58 48
Corruption Perception Index 2006
2.40 2.52 0.08 43
Per capita government health expenditure 2006 ($USD)
25.00 34.65 4.23 48
PPP: Purchasing Power Parity ODA: Official Development Assistance WSS-ODA: Water and sanitation sector designated official development assistance
Corruption Perception Index uses a scale of 1 to 10; corruption is highest at level 1

Table 2. Spearman’s rank correlation coefficients between selected variables
First Variable Second Variable Spearman Correlation
p n
Change in % Per capita WSS-ODA 2002-2006 0.35 0.014* 48 access to safe water Per capita WSS-ODA 2002 0.33 0.024* 47 Per capita WSS-ODA 2003 0.38 0.008* 48 Per capita WSS-ODA 2004 0.41 0.004* 48 Per capita WSS-ODA 2005 0.27 0.067 48 Per capita WSS-ODA 2006 0.24 0.106 48 Relative % change in access 0.42 0.003* 47 to improved sanitation Relative % change IMR† -0.08 0.592 48 Relative % change CMR† -0.06 0.688 48 Change in % Per capita WSS-ODA 2002-2006 0.17 0.252 47 access to improved Per capita WSS-ODA 2002 0.22 0.148 46 sanitation Per capita WSS-ODA 2003 0.21 0.148 47 Per capita WSS-ODA 2004 0.17 0.261 47 Per capita WSS-ODA 2005 0.08 0.585 47 Per capita WSS-ODA 2006 0.08 0.608 47 Per capita government health -0.32 0.025* 47 expenditure 2006 Relative % change IMR† -0.19 0.186 47 Relative % change CMR† -0.23 0.117 47 *: Statistically significant at the alpha=0.05 level †: Correlated with absolute, and not relative change in % access WSS-ODA: Water and sanitation designated official development assistance IMR: Infant mortality rate CMR: Child mortality rate
Tab
le 3
. A
sso
ciati
on
bet
wee
n p
er c
ap
ita W
SS
-OD
A o
n t
he
chan
ge
in a
cces
s to
im
pro
ved
wate
r an
d s
an
itati
on
P
er c
apit
a W
SS
-OD
A
O
R o
f ac
hie
vin
g t
op
tw
o t
erti
les
of
in
crea
sed
wat
er a
cces
s (9
5%
CI)
O
R o
f ac
hie
vin
g t
op
tw
o t
erti
les
of
incr
ease
d
sanit
atio
n a
cces
s (9
5%
CI)
Yea
r R
ange
($U
SD
)
Unad
just
ed
Ad
just
ed†
U
nad
just
ed
Ad
just
ed†
2
00
2
<
0.1
6
0.1
6-0
.52
>
0.5
2
1.0
(r
efer
ence
) 1
.55
(0
.43
-5.5
8)
6.8
5*
(1.5
7-2
9.9
3)
1
.0
(ref
eren
ce)
1.9
1
(0.4
4-8
.20
) 8
.50
*
(1.7
3-4
1.6
4)
1.0
(r
efer
ence
) 0
.58
(0.1
6-2
.13
) 2
.46
(0.6
0-1
0.0
3)
1
.0
(ref
eren
ce)
1.4
3
(0.3
0-6
.70
) 5
.26
*
(1.0
2-2
7.1
4)
20
03
<
0.2
1
0.2
1-0
.69
>
0.6
9
1
.0
(ref
eren
ce)
1.0
8
(0.3
0-3
.85
) 3
.84
(0.9
8-1
4.9
8)
1.0
(r
efer
ence
) 1
.35
(0.2
8-6
.65
) 4
.41
*
(1.0
1-1
9.2
6)
1
.0
(ref
eren
ce)
0.4
0
(0.1
1-1
.49
) 1
.28
(0.3
4-4
.84
)
1.0
(r
efer
ence
) 1
.61
(0.2
9-9
.03
) 2
.78
(0.5
9-1
3.0
8)
20
04
<
0.2
4
0.2
4-0
.72
>
0.7
3
1
.0
(ref
eren
ce)
10
.55
*
(2.4
1-4
6.1
5)
10
.55
*
(2.4
6-4
5.2
5)
1.0
(r
efer
ence
) 3
2.6
9*
(4.8
0-2
22
.4)
18
.15
*
(3.4
6-9
5.2
1)
1
.0
(ref
eren
ce)
0.8
3
(0.2
2-3
.03
) 2
.22
(0.6
0-8
.12
)
1.0
(r
efer
ence
) 2
.59
(0.5
2-1
2.9
4)
3.3
3
(0.7
8-1
4.2
1)
20
05
<
0.1
9
0.1
9-0
.97
>
0.9
7
1
.0
(ref
eren
ce)
2.4
4
(0.6
7-8
.90
) 3
.86
(0.9
9-1
4.9
9)
1.0
(r
efer
ence
) 3
.91
(0.8
9-1
7.1
7)
4.5
4*
(1.0
5-1
9.5
8)
1
.0
(ref
eren
ce)
0.8
7
(0.2
4-3
.11
) 1
.53
(0.4
1-5
.74
)
1.0
(r
efer
ence
) 3
.63
(0.7
4-1
7.9
4)
3.1
3
(0.6
6-1
4.7
2)
20
06
<
0.3
6
0.3
6-1
.15
>
1.1
5
1
.0
(ref
eren
ce)
5.6
0*
(1.4
3-2
2.0
1)
6.6
3*
(1.6
0-2
7.4
6)
1.0
(r
efer
ence
) 8
.38
*
(1.8
2-3
8.6
9)
9.3
6*
(1.9
5-4
4.9
1)
1
.0
(ref
eren
ce)
1.5
5
(0.4
3-5
.59
) 2
.06
(0.5
4-7
.80
)
1.0
(r
efer
ence
) 2
.51
(0.5
6-1
1.1
6)
3.3
9
(0.7
2-1
5.9
3)
20
02
-200
6
<1
.54
1
.54
-4.3
2
>4
.32
1
.0
(ref
eren
ce)
2.4
5
(0.6
7-8
.97
) 6
.65
*
(1.6
4-2
6.8
7)
1.0
(r
efer
ence
) 3
.88
(0.8
5-1
7.7
1)
8.0
1*
(1.7
9-3
5.9
0)
1
.0
(ref
eren
ce)
0.5
1
(0.1
4-1
.85
) 2
.30
(0.6
1-8
.73
)
1.0
(r
efer
ence
) 2
.11
(0.4
4-1
0.1
9)
3.7
0
(0.8
2-1
6.7
2)
*:
Sig
nif
ican
t at
the
alp
ha=
0.0
5 l
evel
O
R:
Od
ds
rati
os
CI:
Co
nfi
den
ce I
nte
rval
†
: A
dju
sted
fo
r la
nd
are
a, G
ross
Do
mes
tic
Pro
duct
($
PP
P),
and
per
cap
ita
go
ver
nm
ent
hea
lth e
xp
end
iture
20
06

Tab
le 4
. T
erti
le r
an
ges
for
rela
tive
chan
ge
(200
6 v
s. 2
000)
in p
op
ula
tion
acc
ess
to i
mp
roved
wate
r an
d s
an
itati
on
Ter
tile
le
vel
R
elat
ive
Chan
ge
in
po
pula
tio
n a
cces
s (%
)
Wat
er
L
ow
est
-7
.0 t
o 2
.3
M
idd
le
2.4
to
8.5
Hig
hes
t 1
1.1
to 7
1.0
San
itat
ion
Lo
wes
t -2
0.8
to
3.2
Mid
dle
3
.7 t
o 1
4.8
Hig
hes
t 1
7.9
to 1
18
.2
Tab
le 5
. A
sso
ciati
on
bet
wee
n r
edu
ctio
ns
in i
nfa
nt
an
d c
hil
d m
ort
ali
ty a
nd
ch
an
ge§
in
acc
ess
to w
ate
r an
d s
an
itati
on
%
Red
uct
ion i
n m
ort
alit
y
O
R o
f ac
hie
vin
g t
op
tw
o t
erti
les
of
in
crea
sed
wat
er a
cces
s (9
5%
CI)
O
R o
f ac
hie
vin
g t
op
tw
o t
erti
les
of
incr
ease
d
sanit
atio
n a
cces
s (9
5%
CI)
Ind
icat
or
Ran
ge
(%)
U
nad
just
ed
Ad
just
ed†
U
nad
just
ed
Ad
just
ed†
IM
R
<
5.1
3
5.1
3-1
1.8
2
>1
1.8
2
1.0
(r
efer
ence
) 1
.55
(0.4
3-5
.64
) 1
.32
(0.3
9-4
.54
)
1
.0
(ref
eren
ce)
1.5
6
(0.3
8-6
.39
) 1
.39
(0.3
4-5
.64
)
1.0
(r
efer
ence
) 1
.09
(0.2
6-4
.62
) 3
.41
(0.7
3-1
5.8
1)
1
.0
(ref
eren
ce)
1.8
0
(0.3
6-8
.95
) 8
.00
*
(1.3
0-4
9.3
4)
CM
R
<5
.46
5
.46
-16
.06
>
16
.06
1
.0
(ref
eren
ce)
1.7
1
(0.4
7-6
.22
) 1
.50
(0.4
4-5
.17
)
1.0
(r
efer
ence
) 1
.74
(0.4
2-7
.21
) 1
.52
(0.3
7-6
.21
)
1
.0
(ref
eren
ce)
0.8
9
(0.2
1-3
.79
) 4
.06
(0.8
6-1
9.1
8)
1.0
(r
efer
ence
) 1
.32
(0.2
6-6
.61
) 9
.08
*
(1.4
4-5
7.4
5)
§
: A
bso
lute
(an
d n
ot
rela
tive)
chan
ge
in p
erce
nt
acce
ss t
o w
ater
and
san
itat
ion
*:
Sig
nif
ican
t at
the
alp
ha=
0.0
5 l
evel
†
: A
dju
sted
fo
r la
nd
are
a, G
ross
Do
mes
tic
Pro
duct
($
PP
P),
and
per
cap
ita
go
ver
nm
ent
hea
lth e
xp
end
iture
20
06
O
R:
Od
ds
rati
os,
CI:
Co
nfi
den
ce I
nte
rval
, C
MR
: C
hil
d m
ort
alit
y r
ate,
IM
R:
Infa
nt
mo
rtal
ity r
ate3
1
References
1. Bryce J, Boschi-Pinto C, Shibuya K, Black RE, and the WHO Child Health
Epidemiology Reference Group: WHO estimates of the causes of death in children.
The Lancet 2005; 365: 1147-52. .
2. Stein C, Kuchenmuler T, Hendricks S, Ustun-Pruss A, Wolfson L, Engles D and
Schlundt J: Global Burden of Disease Assessments—WHO is responsible? PLoS Negl
Trop Dis. 2007;1: e161. .
3. Hardy A: Acute Diarrhea. The American Journal of Nursing 1942;42: 512-5.
4. Lanata CF, Black RE, Maúrtua D, Gil A, Gabilondo A, Yi A, Miranda E, Gilman
RH, León-Barúa R, Sack RB: Etiologic agents in acute vs persistent diarrhea in
children under three years of age in peri-urban Lima, Perú. Acta Paediatr Suppl.
1992;381:32-8.
5. Varavithya W, Sunthornkachit R, Eampokalap B: Oral rehydration therapy for
invasive diarrhea. Reviews of Infectious Diseases 1991;13:325-31. .
6. Grover B: Twenty-five years of international cooperation in water-related
development assistance, 1972-1997. Water Policy 1998;1:29-43. .
7. Kalbermatten JK: Water and sanitation for all, will it become a reality or
remain a dream? Water International 1991;16:121.
8. Biswas AK: Institutional arrangements for international cooperation in water
resources. Water Resources Development 1995;11: 139-45.

2
9. Biswas AK: From Mar del Plata to Marrakesh: rhetoric and reality.
Proceedings of the First World Water Forum Marrakesh, Morocco1997:27-35.
10. Serageldin I: Strategic water resources management: themes for a new
millenium. Keynote speech given at Fifth Stockholm Water Symposium, August 13-18
1995.
11. World Bank: Solving the water crisis together: the global water partnership.
Environment matters Washington, DC.1997; Winter/spring: 10-11.
12. United Nations. The Millennium Development Goals Reports, 2008. New York.
http://www.un.org/millenniumgoals/2008highlevel/pdf/newsroom/mdg%20reports/MDG
_Report_2008_ENGLISH.pdf (Accessed July 28, 2010).
13. Bryce J, Terreri N, Victora CG, Mason E, Daelmans B, Bhutta ZA, Bustreo F,
Songane F, Salama P, Wardlaw T: Countdown to 2015: tracking intervention
coverage for child survival. The Lancet 2006;368:1067-76.
14. Doucouliagos H, Paldam M: Aid effectiveness on accumulation: a metastudy.
Kyklos 2006; 59: 227-54.
15. Ali AM, Isse HS: An empirical analysis of the effect of aid on growth.
International Advances in Economic Research 2005; 11:1-11.
16. Loxley J, Sackey HA: Aid effectiveness in Africa. African Development Review
2008; 20:163-99.
17. Celasum O, Walliser J: Predictability of aid: do fickle donors undermine aid
effectiveness? Economic Policy 2008;12:545-94.
18. Mavrotas G: Aid heterogeneity: looking at aid effectiveness from a different
angle. Journal of International Development 2005; 17:1019-36. .

3
19. Cassimon D, Van Campenhout B: Aid effectiveness, debt relief and public
finance response: evidence from a panel of HIPC countries. Review of World
Economics 2007; 143: 742-63. .
20. Mosley P, Hudson J, Verschoor A: Aid, poverty reduction and the “new
conditionality”. The Economic Journal 2002; 114:F217-43.
21. Gomanee K, Morrissey O, Mosley P, Verschoor A: Aid, government
expenditure, and aggregate welfare. World Development 2005; 33: 355-70.
22. Dreher A, Nunnenkamp P, Thiele R: Does aid for education educate children?
Evidence from panel data. The World Bank Economic Review 2008; 22:291-314.
23. Wolf W: Does aid improve public service delivery? Review of World
Economics 2007; 143:650-72.
24. World Bank: Country groups. The World Bank Group 2008. Accessed 27 July
2010 from http://go.worldbank.org/D7SN0B8YU0.
25. OECD: OECD Creditor Reporting System Database. Accessed 27 July 2010
from http://stats.oecd.org/WBOS/Index.aspx?DatasetCode=CRSNEW.
26. UN Statistics Division: The official United Nations site for the MDG
indicators. Accessed 27 July 2010 from http://mdgs.un.org/unsd/mdg/. .
27. WHOSIS: World Health Organization Statistical Information System.
Accessed 27 July 2010 from http://www.who.int/whosis/en/.
28. Transparency International: Corruption Perception Index 2006. Accessed 27
July 2010 from http://www.transparency.org/news_room/in_focus/2006.
29. Fewtrell L, Kaufmann RB, Kay D, Enanoria W, Haller L, Colford JM, Jr.: Water,
sanitation, and hygiene interventions to reduce diarrhoea in less developed

4
countries: a systematic review and meta-analysis. The Lancet infectious diseases.
2005,5:42-52.
30. Victora CG, Smith PG, Vaughan J P, Nobre LC, Lombard C, Teixeira AM, Fuchs
SC, Morera LB, Gigante LP, Barros FC: Water Supply, Sanitation and Housing in
Relation to the Risk of Infant Mortality from Diarrhea. International Journal of
Epidemiology. 1988;17:651-654. .
31. Anon.: Keeping sanitation in the international spotlight. Lancet.
2008,371:1045.
32. Anon.: Access to toilets for all. Lancet. 2007,370:1590.
33. eThekwini Declaration.
http://www.wsp.org/UserFiles/file/eThekwiniAfricaSan.pdf (Accessed July 28, 2010).
34. Thiele R, Nunnenkamp P, Dreher A: Do donors target aid in line with the
millennium development goals? A sector perspective of aid allocation. Review of
World Economics 2007;143:596-630.