Water And Health Course 4 SOCIAL PERSPECTIVES ON WATER...
234
WLC Template file:///E|/Dropbox/WaterHealthNewFinal/Course4/concepts/WH40M000C001TitlePage.htm[12/17/2014 12:52:23 AM] Water And Health Course 4 SOCIAL PERSPECTIVES ON WATER AND HEALTH
Transcript of Water And Health Course 4 SOCIAL PERSPECTIVES ON WATER...

WLC Template
file:///E|/Dropbox/WaterHealthNewFinal/Course4/concepts/WH40M000C001TitlePage.htm[12/17/2014 12:52:23 AM]
Water And Health
Course 4
SOCIAL PERSPECTIVES ON WATER AND HEALTH

WLC Template
file:///E|/Dropbox/WaterHealthNewFinal/Course4/concepts/WH40M010C001overview.htm[12/17/2014 12:52:23 AM]
SOCIAL PERSPECTIVES ON HEALTH - OVERVIEW AND ORGANIZATION
"For many of us, clean water is so plentiful and readily available that we rarely, if ever, pause toconsider what life would be like without it."
Marcus Samuelsson
1. Water and Ethics2. Human Rights & Social Justice3. Managing Water4. Integrating Water and Health5. Challenges to Integration6. Moving Forward -- Managing Watersheds for Health

WLC Template
file:///E|/Dropbox/WaterHealthNewFinal/Course4/concepts/WH40M010C003Ethics.htm[12/17/2014 12:52:23 AM]
Ethics
Normative views about what water is, represents, or what it should be used for:
· Water as a natural resource
· Water as a commodity or economic good allocated through markets
· Water as a property right
· Water as a common good
· Water as a source of life, basic need for humans and ecosystems
· Water as a human right
Water right: an expression of agreement about the legitimacy of the right-holder’s claim to waterwhich must exist within the group of claimants and also be recognized by those excluded from itsuse.
Ethics means promoting integrity and preventing wrongdoings. This definition includes thedevelopment and maintenance of interrelated mechanisms, such as adequate:
Control
Guidance
Management
Elements of the Ethics Infrastructure

WLC Template
file:///E|/Dropbox/WaterHealthNewFinal/Course4/concepts/WH40M010C003Ethics.htm[12/17/2014 12:52:23 AM]
Political commitment
Workable codes of conduct
Professional socialization mechanisms
Ethics coordinating body
Supportive public service conditions
Effective legal framework
Efficient accountability mechanisms
Active civil society
Ethics Models
Compliance-based ethics management
Integrity-based ethics management

WLC Template
file:///E|/Dropbox/WaterHealthNewFinal/Course4/concepts/WH40M020C001WaterHuman%20Right.htm[12/17/2014 12:52:23 AM]
Water and Health - Human Rights and Social Justice
Human Rights
Human rights day
All human beings are born free and equal in dignity and rights. They are endowed with reason andconscience and should act towards one another in a spirit of brotherhood. (UN Declaration of HumanRights, 1945)
Human rights are rights inherent to all human beings, whatever our nationality, place of residence,sex, national or ethnic origin, colour, religion, language, or any other status. We are all equallyentitled to our human rights without discrimination. These rights are all interrelated, interdependentand indivisible. (http://www.ohchr.org/en/issues/pages/whatarehumanrights.aspx) (Internet AccessRequired)
All human rights can be traced back to the Universal Declaration of Human Rights.
By their very nature human rights are:
Universal and inalienable
Interdependent and indivisible
Equal and non-discriminatory
Both rights and obligations
WLC Template
file:///E|/Dropbox/WaterHealthNewFinal/Course4/concepts/WH40M020C001WaterHuman%20Right.htm[12/17/2014 12:52:23 AM]
Universal Declaration of Human Rights
· International Covenant on Civil and Political Rights (UN, ICCPR, 1966)
· International Covenant on Economic, Social and Cultural Rights (UN, ICESCR, 1966)
· Convention on the Elimination of All Forms of Discrimination Against Women (UN, CEDAW, 1979)
· Convention on the Rights of the Child (UN, CRC, 1990)
· Declaration on the Rights of Indigenous Peoples (UN, DRIP, 2007)
· Convention on the Rights of Persons with Disabilities (UN, CRPD, 2008)
Water as a Human Right
Given water is a source of life and required to fulfil other basic human needs it is argued that itshould be fundamentally enshrined in law as a human right of which all people are entitled.
Everyone is entitled to sufficient, safe, affordable, culturally acceptable, physically accessiblewater delivered in participatory non-discriminatory manner.
Social Justice - Equity and Equality
Equity describes access to just, impartial, and fair social benefits and responsibilities. Resources aresupplied based on need. Minimally, social equality includes legal and property rights and access tosocial goods and services. It may include health and economic resources as well as access toopportunities and the burden of obligations.
Equality describes sameness – that everyone, regardless of need, has access to the same socialbenefits and responsibilities.
Social Justice describes policies and practices that are both equitable and equal. Because of theirextraordinary circumstances, social justice enhances the circumstances of the poor, women, children, andthose with disabilities. It attempts to rebalance the distribution of goods and services to give people withstructural disadvantages more opportunity to lead health, happy, fulfilling lives protected by the socialcontracts of law and resource redistribution – “to level the playing field".
"We live in a system that espouses merit, equality, and a level playing field, but exalts those withwealth, power, and celebrity, however gained."
Bell, 2002.
Pluralist Governance
Pluralism argues that power is spread among many different groups within society that bargain,compete and compromise to shape policy and decision-making so that no one set of interestsdominates or controls all governance processes and decisions. Legal pluralism refers to multiplelegal systems within one geographic area.

WLC Template
file:///E|/Dropbox/WaterHealthNewFinal/Course4/concepts/WH40M020C001WaterHuman%20Right.htm[12/17/2014 12:52:23 AM]
Urban Governance Index (Taylor, 2006)
Urban Governance Index

WLC Template
file:///E|/Dropbox/WaterHealthNewFinal/Course4/concepts/WH40M020C005WaysKnow.htm[12/17/2014 12:52:23 AM]
WATER AND HEALTH - WAYS OF KNOWING
EPISTEMOLOGY & WAYS OF KNOWING IN INTEGRATED, COLLABORATIVE WATER GOVERNANCE
Many water governance controversies are related to discrepancies in knowledge that different actorspossess and (de)legitimize to support their positions. Managing, integrating and enhancingstakeholders’ awareness of different “ways of knowing” and how actors and organizations makesense of water problems is integral to reducing controversy and forging consensus.
WAYS OF KNOWING
Ways of knowing
Epistemology or “ways of knowing”:
The study of the nature and scope of knowledge, meaning and understanding, including whatknowledge is acquired and how this relates to beliefs, and justifies notions of “truth”
How a policy problem is experienced, investigated and interpreted
How stakeholders make sense of important relationships
Which and whose “facts” are deemed valid and relevant
How a problem is acted upon and solutions devised
Which social and institutional arrangements and resources actors organize and maintain
Knowledge as Power
While power is dependent on knowledge, it also (re)creates and legitimates knowledge throughthe very actors, organizations and institutions through which it is produced and exercised
Those with the greatest competence, expertise, and status are afforded additional rights
Sole reliance on scientific epistemologies and exclusive interpretation by “experts” isincreasingly contested due to public distrust; recognition that science itself is sociallyinfluenced; controversy over who or what should be burdened by uncertainties; disagreement

WLC Template
file:///E|/Dropbox/WaterHealthNewFinal/Course4/concepts/WH40M020C005WaysKnow.htm[12/17/2014 12:52:23 AM]
over quality and accuracy of data, appropriate methodologies, policy implications
Consequently other ways of knowing (e.g. traditional ecological knowledge, community-basedor lay perspectives, and NGO science have gained greater attention with varying recognition)
“Evidence” increasingly derived through joint knowledge production and social learning
Science and other types of knowledge informing policy, governance processes and rule systems,and environmental conditions co-evolve. Water Governance requires many different knowledge types(e.g. knowledge about Earth’s life support systems, ecological services, natural and biophysicalprocesses, anthropogenic effects, sustainable alternatives, how to utilize and develop institutionsand legislation, how to manage projects, facilitate dialogue and consensus, resolve conflict, etc.).
Social Learning seeks to facilitate convergence of goals and knowledge, develop accurate mutualexpectations, build trust & respect, reflection on embedded assumptions, joint fact finding,participatory interpretation, consensus building, changes in behaviours & norms. Centralizeddecision-making, privatization, rigid bureaucracies, poor public access to information, and lack ofpolitical transparency have been shown to impede social learning.
Boundary Organizations or Hybrid Institutional arrangements can enable stakeholders and policy-makers to work in tandem with experts to get to know one another, discuss research questions,information needs, methodological approaches, results, and the robustness or "acceptability " ofevidence.
Knowledge governance environment triangle

WLC Template
file:///E|/Dropbox/WaterHealthNewFinal/Course4/concepts/WH40M030C001Governance.htm[12/17/2014 12:52:23 AM]
WATER and HEALTH - GOVERNANCE
The “steering” of a group or society
Water Governance
Social, political and economic processes and institutions that determine who gets water, whenand how (e.g. agenda setting, deliberation, allocation, policy development, legislation, research& monitoring, evaluation, etc.)
Changing Trends, Actors, Influence
Until recently management and decision-making authority was generally the exclusive task of stategovernments and state-sponsored technical experts (e.g. “command and control”)
water resources controlled through legislating and enforcing environmental standards
Problems
Overcome jurisdictional fragmentation
Facilitate local sensitivity and autonomy
Enforce regulatory compliance
Secure the interests of marginalized populations
Globalization has profoundly impacted the use and governance of water
Less centralized, autocratic, more participatory and inclusive approaches increasing
Range of players are increasing – creating new roles and governance functions
Shift towards new policy tools and organizational modes

WLC Template
file:///E|/Dropbox/WaterHealthNewFinal/Course4/concepts/WH40M030C001Governance.htm[12/17/2014 12:52:23 AM]
Key elements of water governance
NEW POLICY TOOLS AND ORGANIZATIONAL MODES
Market-based mechanisms
Collaborative partnerships,
Multi-stakeholder processes,
Decentralization to more local levels of government
Community-based initiatives
Voluntary agreements, stewardship arrangements, and
Other non-regulatory tools.

Governance
file:///E|/Dropbox/WaterHealthNewFinal/Course4/concepts/WH40M030C003GovernanceNLMB.htm[12/17/2014 12:52:24 AM]
WATER and HEALTH - Governance Neo-Liberal and Market-Based Mechanism
NEO-LIBERAL AND MARKET BASED MECHANISM IN WATER GOVERNANCE
Examples of neo-liberal governance mechanisms
Privatization and establishment of private property rights
Private sector partnerships (where water resources are publicly owned but privately operatedand managed)
Employing markets as allocation mechanisms
Removal of government subsidies
Instituting user-pays initiatives
Full-cost recovery that incorporates environmental externalities through pricing
Rationales
Argument that environmental and water resources are over-used and degraded due to a failureof markets and societies to value them properly (if treated as economic goods and priced at fulleconomic and environmental costs they will be used more efficiently).
Harnessing the private sector will result in greater efficiencies, and financial and managementcapacity essential for improving the chances of achieving the United Nation’s MillenniumDevelopment Goal of universal water supply.
Proponents argue accountability to customers and shareholders is more direct and effectivethan the accountability of political representatives to citizens.
Markets and privatization claimed to help resolve ineffective public bureaucracies andentrenched interests that monopolize public subsidies.
Critiques
Water as a flow resource that does not stay in one place makes it difficult to establish privateproperty rights.
High degree of public health and environmental externalities that are difficult to reflect in waterpricing due to poorly understood ecological interrelationships, uncertainties, and disputes overhow to value aesthetic, symbolic, spiritual and ecological functions.
Water is a non-substitutable resource essential to life (that should not be commoditised).
Affordability and equity issues associated with price increases.
Poor transparency of financing, contracts, decision-making.
Exorbitant profits, bribery and corruption.
Non-compliance with contractual agreements and failed concessions.
Lack of focus on issues of sustainability or intergenerational equity.

Governance
file:///E|/Dropbox/WaterHealthNewFinal/Course4/concepts/WH40M030C003GovernanceNLMB.htm[12/17/2014 12:52:24 AM]
Foreign investors only interested in large markets with very limited risk and consequentlyinvestments and reforms are not necessarily going to where it is most needed.
Many countries do not have the regulatory and bureaucratic systems in place to oversee andmonitor business dealings, or enforce contractual obligations.
Market-based approaches and privatization initiatives, like command and control approaches,also face serious limitations and are only a partial remedy at best to the challenges ofsustainably and equitability.

Collaborative Approaches
file:///E|/Dropbox/WaterHealthNewFinal/Course4/concepts/WH40M030C005CollabApproaches.htm[12/17/2014 12:52:24 AM]
WATER and HEALTH - Collaborative Approaches
COLLABORATIVE APPROACHES TO WATER GOVERNANCE
Collaborative Governance
Over the past decade has become a widespread trend and prime focus in theory and practicearound the world at a host of scales
Involves diverse state and non-state stakeholders working together, cooperating, deliberatingand pooling resources under varying degrees of formality and power sharing to achievemutually negotiated goals
Stakeholders include water users, public or governmental organizations, private enterprises,non-governmental organizations, financiers, and civil society that hope to achieve morecollectively than they are able individually
Rationales & Ideals
Collaborative approaches are intended to improve governance processes by making them moreparticipatory, deliberative, inclusive, transparent, flexible, decentralized, enabling for buildingconsensus, and sensitive to distinct cultural, political, ecological and socioeconomic contexts
Different types of actors are able to experiment with different types of social and organizational(hybrid) arrangements
Hybrid and collaborative processes are intended to build upon the strengths, knowledge andcapacities of each partner
Give greater access to multiple “ways of knowing”, and marginalized interests
Increases stakeholder ownership and buy-in
Key Features or “Ideals” of Collaborative Processes
• Participatory
• Deliberative (weighing/considering options)
• Inclusiveness
• Transparency
• Consensus building
Criticisms & Uncertainties
Concerns as to whether collaborative processes actually deliver their intended benefits
Risk of processes being dominated by most powerfully resourced actors and those withgreatest access to data and expertise

Collaborative Approaches
file:///E|/Dropbox/WaterHealthNewFinal/Course4/concepts/WH40M030C005CollabApproaches.htm[12/17/2014 12:52:24 AM]
Collaborative processes can still lack transparency and be prone to corruption
Barriers to equitable participation persist especially under narrow time constraints
Distrust between parties can lead to manipulation, dishonest communication and stereotypes(overcoming this takes a lot of time, resource intensive)
Not necessarily effective when decisions and interventions have to be made quickly to addresssevere problems and avoid catastrophic impacts
Difficult to ensure clarity, capacity and accountability for new roles, expectations,responsibilities, and leadership
Evaluations of collaborative arrangements typically focus on social & process outcomes (e.g.ability to arrive at decisions, satisfaction with process), more attention needed on whethercollaboration is resulting in improved water and environmental outcomes
Mechanisms & Strategies of Collaborative Environmental Governance - Collaborative strategies
(Source: Adapted from Lemos & Agrawal, 2006)

Collaborative Approaches
file:///E|/Dropbox/WaterHealthNewFinal/Course4/concepts/WH40M030C005CollabApproaches.htm[12/17/2014 12:52:24 AM]
A Model of Collaborative Governance
(Source: Ansell & Gash, 2008)
Governance and Scale
file:///E|/Dropbox/WaterHealthNewFinal/Course4/concepts/WH40M030C008GovernScale.htm[12/17/2014 12:52:24 AM]
WATER and HEALTH - GOVERNANCE & SCALE
GOVERNANCE AND SCALE
Three major strands on questions of scale in the context of water can be identified in the literature. They can be distinguished according to differences in emphases and the epistemic communitieswithin which they are deliberated:
Operational scale: focuses on what is the most “appropriate” scale for analyzing, investigatingand governing water (e.g. basin/catchment level, community scale)
Political scale: focuses on the role of political and economic interests and power structuresinvolved in the “social construction” of scale. Examines how stakeholders strategicallyendorse particular scales of analysis, governance, management and administration thatadvance their interests
International relations: focuses on the international dimensions of water and the implications ofimposed scales and boundaries of governance for prospects of cooperation or conflict inmanaging transboundary resources
Scale as Socially Constructed
Scale was traditionally treated as a fixed and nested hierarchy of bounded spaces (e.g., local,national, global). State and non-state networks and political-economic actions are increasinglyunfolding at sub and trans-national spaces. Hence notion of scale as “given” and fixed has beenundermined. Scale is increasingly understood as socially constructed, as a way of knowing,navigating and governing the world.
Politics of Scale
The methods through which governance stakeholders contest and institutionalize the boundarieswithin which power, policy and management actions are exerted (reflect conflicting ideologies andgovernance paradigms over how water resources should be developed).
Scale-frames
Demonstrate where and how political actors strategically scope, emphasize or spatially bound policyproblems and potential solutions. They elucidate how, where, and why actors draw linkagesbetween the scale at which a problem is experienced (e.g. body, catchment, ecosystem, community,nation, etc.), and the scale at which it could be analyzed or politically addressed thereby influencingwhich actors, values, issues and solutions become (de)legitimized.
Common scales of water acquisition, governance and management include:
Individualized/household scale
Community scale

Governance and Scale
file:///E|/Dropbox/WaterHealthNewFinal/Course4/concepts/WH40M030C008GovernScale.htm[12/17/2014 12:52:24 AM]
National scale
International/Transboundary Scale
River Basin/Catchment Scale
Market Scale
As trends in water quality and quantity shift, along with prevailing ideologies and relationships ofpower, so too do prevailing scales of water governance. The result is a complex web of overlappingsystems and scales of governance and decision-making initiatives.
Basins/Catchments as “Ideal” Scales of Governance?
not confined to jurisdictional and administrative boundaries
thought to be more effective through systematically accounting for upstream and downstreamactivities impacting water within and between multiple jurisdictions in a single harmonizedforum
numerous attempts to implement basin-wide institutions to varying degrees of success
longstanding challenges remain raising questions as to whether actually results in betterprocesses and outcomes
disregard of heterogeneity within the basin
infringement upon state and local sovereignty
not a meaningful frame of reference for many political leaders & constituencies
capacity deficits and asymmetry between benefits and transaction costs ofcollaborative planning
unable to control forces outside of river basin boundaries
Transboundary Water Governance
When water transcends national and jurisdictional borders governance is extra complicated due toinconsistent rules and values; increasing scarcity; and lack of conflict resolutionmechanisms. Cooperative transboundary governance is thought to reduce conflict by: creatingforums for negotiating perspectives and interests, revealing new options, strengthening trust andconfidence in data, producing more acceptable decisions.
International Progress in Transboundary Water Governance
Cooperation largely formalized through vast number of treaties negotiated internationally.
Address a range of concerns including: apportionment, ecological needs, infrastructure, floodcontrol, irrigation, hydro-power development, water quality, joint research, monitoring anddecision-making.
Effectiveness of transboundary agreements have been mixed.
Overarching guiding principles have been developed internationally through consensus (e.g.

Governance and Scale
file:///E|/Dropbox/WaterHealthNewFinal/Course4/concepts/WH40M030C008GovernScale.htm[12/17/2014 12:52:24 AM]
equitable public and stakeholder participation, regular exchanges of data, cooperation,integration, basin-wide perspective, adaptability and flexibility, gender equity.
Community-based Water Governance
Many caution against universal remedies to water governance and instead promote models that“fit” with local places, communities, values, capacities and circumstances.
Community governance actors mobilize around principles of collective identity, moralgrounding and equity to challenge power imposed from elsewhere.
Thought to enhance participation and accountability by: bringing decision-making closer tothose most affected, assist in generating more time and place specific knowledge aboutresources and practices, facilitate knowledge co-production instead of top-down transfer ofscientific knowledge.
Yet inequitable power relations and methods of resource allocation also exist atcommunity scales.
Conventions and Declarations Relating to Transboundary Water Governance
· Madrid Declaration on the International Regulation regarding the Use of InternationalWatercourses for Purposes other than Navigation (1966)
· Helsinki Rules on the Use of Waters of International Rivers (1966)
· Dublin Statement on Water and Sustainable Development (1992)
· United Nations Convention on the Law of the Non-Navigational Uses ofInternational Watercourses (1992)
· Ministerial Declaration of the Hague on Water Security in the 21st Century (2000)
Good governance
Questions

Governance and Scale
file:///E|/Dropbox/WaterHealthNewFinal/Course4/concepts/WH40M030C008GovernScale.htm[12/17/2014 12:52:24 AM]
1. How is the scale of water governance conceived within major policy and legislative documents?
2. How do the language and practices of different governance actors reinforce particularconceptualizations of scale?
3. How do particular notions of scale further the agendas of different interest groups (particularlywith respect to health)?

IWRM
file:///E|/Dropbox/WaterHealthNewFinal/Course4/concepts/WH40M030C012IWRM.htm[12/17/2014 12:52:24 AM]
WATER and HEALTH - Integrated Water Resources Management (IWRM)
The diagram below shows the three main components of IWRM planning:
· Hydrologic cycle (blue) - listing common hydrological factors
· Watershed and land use (green) - listing common land activities that affect water
· Economics, social interactions and institutions (pink) - listing the various factors in those areas that affect the watersupply and IWRM

IWRM
file:///E|/Dropbox/WaterHealthNewFinal/Course4/concepts/WH40M030C012IWRM.htm[12/17/2014 12:52:24 AM]
Integrated Water Management
"IWRM is necessary to combat increasing water scarcity and pollution. Methods include waterconservation and reuse, water harvesting, and waste management. An appropriate mix of legislation,pricing policies and enforcement measures is essential to optimise water conservation andprotection." (UNDP, 1991).
Specialized Skills for IWRM Planning
· Many different specialists need to contribute their skills who may not be familiar with, or evensympathetic to, the overall goals.
· An education or training program will help convey these goals.
IWRM Connections
· Physical links
· Economic links
· Social links
· Institutional links
IWRM Processes
Integrate the views and processes of:
The hydrologic cycle
Watershed and land use
Economics, social interactions and institutions
IWRM vs. Traditional Resource Management
1. IWRM is more “bottom up” than “top down”
2. IWRM encourages cross-sectoral, interdisciplinary management of water resources.
3. IWRM encompasses the management of other activities, such as land use, that affect waterresources.
Key IWRM principles are
1. Water source and catchment conservation and protection are essential
2. Stakeholders within a national framework should agree about water allocation
3. Management needs to happen at the most basic appropriate level

IWRM
file:///E|/Dropbox/WaterHealthNewFinal/Course4/concepts/WH40M030C012IWRM.htm[12/17/2014 12:52:24 AM]
4. Capacity building is the key to sustainability
5. Involvement of all stakeholders is required
6. Efficient water use is essential and often an important “source” in itself
7. Water should be treated as having an economic and social value
8. Striking a gender balance is essential.

Stakeholders
file:///E|/Dropbox/WaterHealthNewFinal/Course4/concepts/WH40M030C015IWRMSHPP.htm[12/17/2014 12:52:25 AM]
WATER and HEALTH - IWRM Key Stakeholders & Potential Partners
Q: Do the people involved in this part of the plan have sufficient knowledge to be able toparticipate effectively?
Stakeholders
In identifying the key stakeholders, consider the following questions:
Who are the potential beneficiaries?
Who might be adversely impacted?
Have vulnerable groups who may be impacted by the plan been identified?
Have supporters and opponents of changes to water management systems been identified?
Are gender interests adequately identified and represented?
What are the relationships among the stakeholders?
Then:
What are the stakeholders expectations of the plan?
What benefits are likely to result from the project for the stakeholder?
What resources might the stakeholder be able and willing to mobilize?
What stakeholder interests conflict with IWRM goals?
Potential Partners
Once stakeholders have been identified, identify people to play roles, such as:
Technical
Leadership
Communication

Stakeholders
file:///E|/Dropbox/WaterHealthNewFinal/Course4/concepts/WH40M030C015IWRMSHPP.htm[12/17/2014 12:52:25 AM]
Education
Political liaison
Public policy

Demand-side Management
file:///E|/Dropbox/WaterHealthNewFinal/Course4/concepts/WH40M030C018Demandside.htm[12/17/2014 12:52:25 AM]
WATER and HEALTH - Demand Side Management
Demand Management
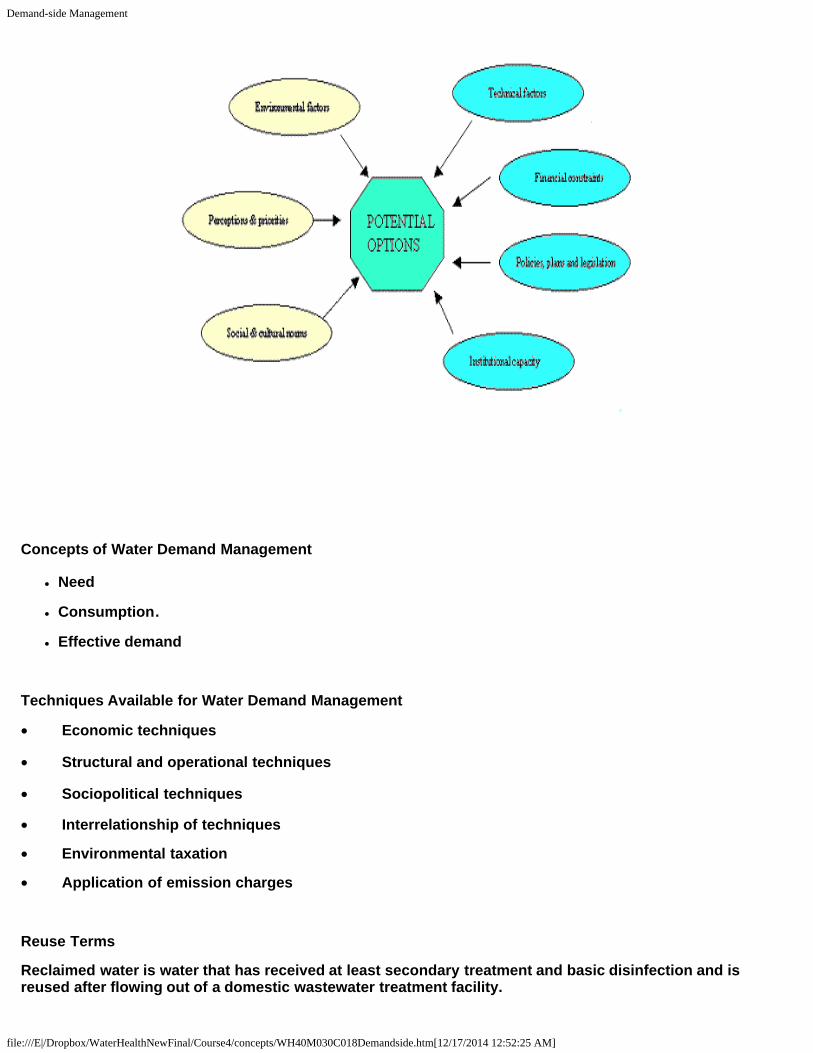
Water's unique physical properties, complex economic characteristics, important cultural features andessential role in supporting all life on earth distinguish it from all other natural resources. Because of thesevarious characteristics, developing effective water policies involves economic, ecological, environmental,legal, and political considerations, and taking into account water usage for drinking water, sanitation andhygiene, AND ecosystems services. In most societies, political considerations dominate water usedecisions. Nonetheless, most water policy options are framed and discussed in economic terms.
Concepts of Water Demand Management
To define effective demand management, it is important to understand three basic concepts of water use:
1. Need
2. Consumption
3. Effective Demand
Water demand management relies upon a range of tools and techniques. These can be divided into threecategories:
1. Economic,
2. Structural and Operational,
3. Sociopolitical.

Demand-side Management
file:///E|/Dropbox/WaterHealthNewFinal/Course4/concepts/WH40M030C018Demandside.htm[12/17/2014 12:52:25 AM]
Factors Affecting Demand
· Willingness to pay
· Expression of Human Rights
· Factors shaping demands
· User choices
Demand-side Management
file:///E|/Dropbox/WaterHealthNewFinal/Course4/concepts/WH40M030C018Demandside.htm[12/17/2014 12:52:25 AM]
Concepts of Water Demand Management
Need
Consumption.
Effective demand
Techniques Available for Water Demand Management
· Economic techniques
· Structural and operational techniques
· Sociopolitical techniques
· Interrelationship of techniques
· Environmental taxation
· Application of emission charges
Reuse Terms
Reclaimed water is water that has received at least secondary treatment and basic disinfection and isreused after flowing out of a domestic wastewater treatment facility.

Demand-side Management
file:///E|/Dropbox/WaterHealthNewFinal/Course4/concepts/WH40M030C018Demandside.htm[12/17/2014 12:52:25 AM]
Reuse is the deliberate application of reclaimed water for a beneficial purpose.
http://www.dep.state.fl.us/water/reuse/facts.htm (Internet Access Required)

Capacity
file:///E|/Dropbox/WaterHealthNewFinal/Course4/concepts/WH40M030C020Capacity.htm[12/17/2014 12:52:25 AM]
WATER AND HEALTH - Capacity
Capacity Types
Technical
Education (train the trainer)
Impact assessments
Management
Governance
Capacity Development vs. Capacity Building
Capacity Building - capacities can be transferred by courses or workshops given by “experts”to the people involved in IWRM (OLD VIEW)
Capacity Development - the education/training component must be done locally so that it issustainable (NEW VIEW)

Capacity
file:///E|/Dropbox/WaterHealthNewFinal/Course4/concepts/WH40M030C020Capacity.htm[12/17/2014 12:52:25 AM]
Although the older view of capacity building (short workshops, courses, etc) is still useful inrestricted cases, the new view of capacity development includes improving capacities in varioussectors such as academia, the private sector, the public sector and the community.
Capacity development is now considered an important prerequisite for many implementations ofIWRM.
Experience has shown that a top-down approach to water and health integration (e.g., water andsanitation sector and health) is, at best, limited in its effectiveness.
Sustainable, responsible use of water and respectful awareness of the inter-relationship with healthand sanitation, begins in the hearts and minds of individuals, who make up neighbourhoods,communities, cities, states and nations.
The cumulative impact of their attitudes and actions ultimately determines whether or notsustainability is achieved.

Capacity Prerequisites
file:///E|/Dropbox/WaterHealthNewFinal/Course4/concepts/WH40M030C023Capacity_prerequisites.htm[12/17/2014 12:52:25 AM]
WATER AND HEALTH - Capacity Prerequisites
Prerequisites for Integrated Water and Health - Sustainability (drawing on IWRM)
Any nation, state or city planning to develop an integrated water and health system needs to satisfyfour essential prerequisites for sustainability.
These are:
1. The awareness, understanding and commitment of citizens to the goal of a sustainable integrated water and healthsystem.
2. The human resources available to be educated and trained in the principles and practices of sustainable integrationof water and health systems.
3. The financial resources needed to pay for the development and operation of the capacities and enabling systems.
4. The commitment of the political system to the goal of sustainability and the continuity needed to achieve that goal.
Four Pillars of Integrated Water and Health - Sustainability
Education/Training
Information/Decision Making
Standards/Compliance
Services/Products

Capacity Prerequisites
file:///E|/Dropbox/WaterHealthNewFinal/Course4/concepts/WH40M030C023Capacity_prerequisites.htm[12/17/2014 12:52:25 AM]
Capacity Development
file:///E|/Dropbox/WaterHealthNewFinal/Course4/concepts/WH40M030C026Capacity_development.htm[12/17/2014 12:52:25 AM]
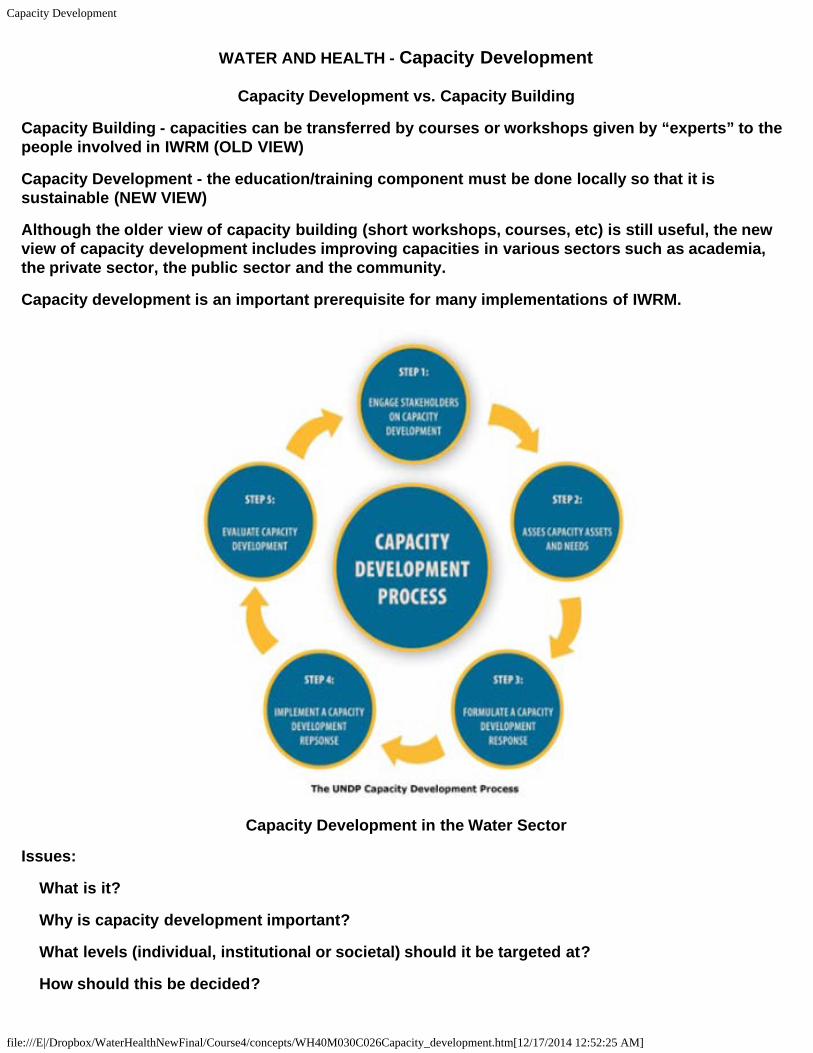
WATER AND HEALTH - Capacity Development
Capacity Development vs. Capacity Building
Capacity Building - capacities can be transferred by courses or workshops given by “experts” to thepeople involved in IWRM (OLD VIEW)
Capacity Development - the education/training component must be done locally so that it issustainable (NEW VIEW)
Although the older view of capacity building (short workshops, courses, etc) is still useful, the newview of capacity development includes improving capacities in various sectors such as academia,the private sector, the public sector and the community.
Capacity development is an important prerequisite for many implementations of IWRM.
Capacity Development in the Water Sector
Issues:
What is it?
Why is capacity development important?
What levels (individual, institutional or societal) should it be targeted at?
How should this be decided?
Capacity Development
file:///E|/Dropbox/WaterHealthNewFinal/Course4/concepts/WH40M030C026Capacity_development.htm[12/17/2014 12:52:25 AM]
How can it contribute to an organization’s performance?
How does an organization develop its capacities?
What tools are available and how are they to be chosen?
What are the conditions for success?
How should it be planned, managed and evaluated?
How long should a program be supported?
Capacity Development
file:///E|/Dropbox/WaterHealthNewFinal/Course4/concepts/WH40M030C029Capacity_particdevel.htm[12/17/2014 12:52:26 AM]
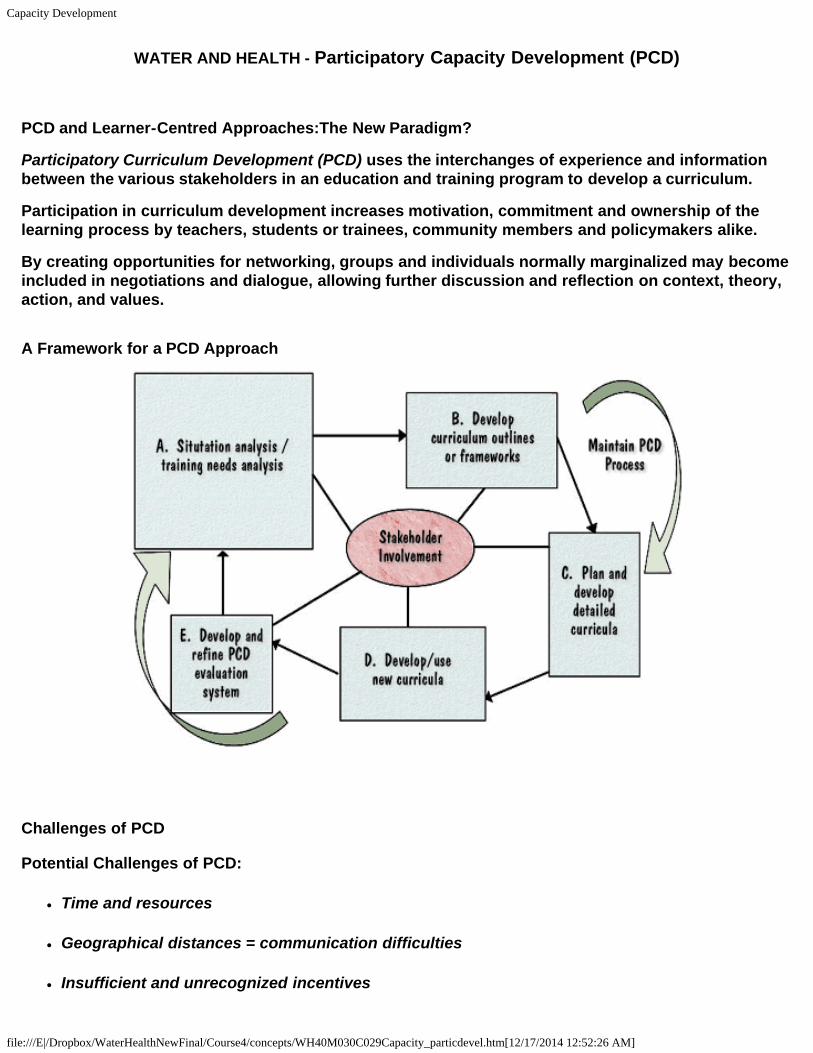
WATER AND HEALTH - Participatory Capacity Development (PCD)
PCD and Learner-Centred Approaches:The New Paradigm?
Participatory Curriculum Development (PCD) uses the interchanges of experience and informationbetween the various stakeholders in an education and training program to develop a curriculum.
Participation in curriculum development increases motivation, commitment and ownership of thelearning process by teachers, students or trainees, community members and policymakers alike.
By creating opportunities for networking, groups and individuals normally marginalized may becomeincluded in negotiations and dialogue, allowing further discussion and reflection on context, theory,action, and values.
A Framework for a PCD Approach
Challenges of PCD
Potential Challenges of PCD:
Time and resources
Geographical distances = communication difficulties
Insufficient and unrecognized incentives

Capacity Development
file:///E|/Dropbox/WaterHealthNewFinal/Course4/concepts/WH40M030C029Capacity_particdevel.htm[12/17/2014 12:52:26 AM]
Stakeholder commitment
Building partnerships
Integration of field learning into the curriculum.
Key outcomes development and monitored
Insufficient use of inputs and real costs

Integrated Approach
file:///E|/Dropbox/WaterHealthNewFinal/Course4/concepts/WH40M040C001IntegApp.htm[12/17/2014 12:52:26 AM]
WATER and HEALTH - Integrated Approach
INTEGRATED APPROACHES TO GOVERNING WATER AND HEALTH
One of the most elusive challenges for ensuring effective water governance is integration.
Integration requires that all water management decisions and governance processes be conductedsystemically and holistically in coordination with other policy spheres of development, planning anddecision-making that may impact water quality and quantity concerns (e.g. land use, agriculture,urban and rural development, forestry, energy production, etc.)
Challenges of Integrative Governance & Management
Institutional silos between various sectors and stakeholder communities (e.g. public health,natural resources, finance departments, etc.)
Differences in language, key terms and concepts, end goals, methodological preferences Identifying and measuring a large number of socio-ecological relationships can beoverwhelming and demanding upon human, organizational and financial resources
Substantial changes in water entitlements, bureaucratic cultures & objectives and humanbehaviour is required
Resources for supporting participatory engagement are not equitably distributed
Processes and skills must be in place to facilitate conflict resolution.

Integrated Approach
file:///E|/Dropbox/WaterHealthNewFinal/Course4/concepts/WH40M040C001IntegApp.htm[12/17/2014 12:52:26 AM]
Four Perspectives
1. Perspective A: governance for sustainable development
2. Perspective B: governance for ecosystems and well-being
3. Perspective C: governance for social determinants of health
4. Perspective D: governance for social–ecological health promotion
Image: integration
Knowledge base for IWRM

Integrated Approach
file:///E|/Dropbox/WaterHealthNewFinal/Course4/concepts/WH40M040C001IntegApp.htm[12/17/2014 12:52:26 AM]
Knowledge occurs on five levels:
· General - knowledge known by most people
· Overview - a broad understanding of a subject area without details
· General subject - knowledge about specialist areas of a discipline
· In-depth subject - knowledge about a particular speciality in a discipline
· Specialized background - knowledge of other specialized subject areas essential for effectiveapplication of specialized subject knowledge. For example, an ecosystem modeller who has detailedmathematical knowledge about the derivation and operation of the mathematical principles applyingto models.
Principles:
1. There is a common “core” knowledge base that all participants in an IWRM exercise can share.
2. Deciding what this knowledge base should be is an essential part of capacity building for IWRM.
3. This knowledge base can be communicated to all participants.
4. Each participant then shares a common vocabulary and understanding of this core knowledge.
5. When capacity building is complete, the participants interact more effectively and the dialogueon the IWRM process also becomes more effective.
6. If this core knowledge is not shared, then interactions between participants may be much moredifficult and even impossible.
Adapted from the GWP Comb, 2000

Integrated Approach
file:///E|/Dropbox/WaterHealthNewFinal/Course4/concepts/WH40M040C001IntegApp.htm[12/17/2014 12:52:26 AM]

Public Health Role
file:///E|/Dropbox/WaterHealthNewFinal/Course4/concepts/WH40M040C005PublicHealthRole.htm[12/17/2014 12:52:26 AM]
WATER and HEALTH - Public Health Role
The Role of Public Health in Issues Involving Water Related Impacts on Health
"Health is a complete state of mental, physical and social well-being, not only the absence ofdisease" (WHO).
This quote from the World Health Organization reminds us there are many determinants of health andwell-being in addition to risk factors for disease.
Public health units work with their community partners in the protection of the health of thecommunity and its members for the prevention of community health impacts from
1. transmissible infectious and communicable diseases
2. acute and chronic illness from harmful environmental exposures
Public health units also work with their community partners for the promotion of healthy lifestylechoices (e.g., diet nutrition and exercise, anti-tobacco smoking and substance abuse).

Public Health Role
file:///E|/Dropbox/WaterHealthNewFinal/Course4/concepts/WH40M040C005PublicHealthRole.htm[12/17/2014 12:52:26 AM]
Public health is involved in providing services such as,
admistration of public health resources
training education and advocacy
public immunization clinics for vaccine preventable diseases (VPD)
food safety inspections of commercial restaurants and food service establishments
health inspections of public institutions, including public schools nurseries and day-cares,public nursing homes and long-term care homes, jails and correctional facilities.
health inspections of commercial spas, nail treatment, and tatoo parlours
the development of policy, resources and initiatives
promotion of mental health and dental health
support for susceptible and vulnerable populations
communication and public health reporting on reportable and notifiable diseases, includingenterics and vector-borne diseases
communication of various public health and safety indicators, including hospital public safetyindicators and consumer product safety recalls
support to emergency management preparedness and response systems
support for review communication and litigation of environmental investigations impacting thecommunity

Challenges
file:///E|/Dropbox/WaterHealthNewFinal/Course4/concepts/WH40M050C001challenges1.htm[12/17/2014 12:52:26 AM]
Water and Health - Challenges
Sustainable Environmental Management by Applying the Principles of Economic Analysis andValuation
Rationale for Applying an Economic Analysis: Economic analysis can help inform decision-makingby providing a common "measuring rod" for assessment of potential changes and adopting theperspective of society as a whole (i.e., assessment metric = monetary value).
Land and water management issues result from the following:
Food crises
Energy crises
Financial crises
Lack of virgin lands for new discovery
Land productivity
Water supplies and water quality - surface water, groundwater, drinking water, wastewater
Global population of 9 billion people - food, drinking water, sanitation and hygiene, jobs,housing, transportation, health and well-being
Improving land (and water) productivity can be achieved through a range of complementaryapproaches such as intensification of production on already productive areas; slowly down orreversing land degradation where possible; and ensuring an appropriate distribution of propertyrights over land exploitation.
The threat of increased land (and water) degradation through overexploiting or destroying is welldocumented in scientific studies that quantify changes affecting ecosystems, but the results ofdecades of scientific research have not changed the way we manage our land despite the compellingdata and repeated warnings by world renowned scientists about the negative consequences of thosepractices. Scientific studies of ecosystem changes generally do not quantify the potential impact of thesechanges on the people depending on these ecosystems and their livelihoods. By focusing on theshort-term benefits the longer-term negative consequences of repeated recurring and cummulativeecosystem changes are often ignored, until it is too late.
For example, intensive agricultural production may lead to soil degradation (in terms of reduced soilnutrients, higher soil erosion…) and to water degradation, but may help to create agricultural jobopportunities, which is often viewed as desirable in regions where job opportunities are scarce. Inthis specific example, the negative impacts on land are beneficial to people by creating livelihoodopportunities, at least in the short term. The longer term losses of food, and jobs, safe drinkingwater and polluted water resources are often ignored, limiting necessary action to prevent them fromhappening until it is too late.
Economics provides tools to analyse a problem using a people's perspective. History shows us that

Challenges
file:///E|/Dropbox/WaterHealthNewFinal/Course4/concepts/WH40M050C001challenges1.htm[12/17/2014 12:52:26 AM]
people responsible for policy-making generally react faster under political and economic pressures(i.e., Money). The bottomline is often how much will it cost.
Assessment of Land Valuation Changes - Scientific methods vs Economic methods
Scientists typically consider how and why land and water ecosystems are fragile and biologicallyimportant and what management options are available for sustainable land management. Whereas,economists focus on the economic benefits land and water ecosystems bring to our society andwhether these existing benefits outweigh the costs of maintaining or restoring these existingbenefits.
Environmental economists often refer to environmental goods and services. For an economist, land and water are environmental goods which provide environmental services that in turn help sustainhuman life and livelihoods.
Environmental goods refer to stock resources, which exist in a (relatively) fixed quantity. Environmental services refer to flow resources, in which quantity is renewed with time.
Economics provides tools to answer the question, which use(s) is (are) most beneficial to society asa whole? Economists rely on the use of money as a "common measuring rod". The values to societyof the provided goods and services are all quantified in money to make them comparable. Theseeconomic values help quantify trade-offs between different goods and services: for instance betweenagricultural production and game park tourism revenue. Measuring these trade-offs may helpcompare land use from the best point of view of society and provides one way to arbitrate conflicts.
Environmental (Land and Water) Restoration Management
Different levels of environmental restoration require different levels of effort (i.e. different levels ofinvestment of time and money).Selecting the best management option for restoring a degraded ecosystem (e.g., specified area ofland and water selected for restoration) requires a budget, and the budget is often a limiting factor.
Sustainable Land Management (Environmental Management)
Economic sustainability is typically associated with a flow of physical or economic benefitscontinued through time. For instance, land can help naturally filter water and provide clean water.This clean water supply by land is a physical benefit. This physical benefit is associated with aneconomic benefit.
Ecologists typically consider strong sustainability whilst economists may consider either strong orweak sustainability. Ecologists are indeed interested in maintaining or expanding the level of naturalcapital.
For economists, the choice between strong and weak sustainability is a matter of social preferences,(i.e. which of these two options people choose). This choice reflects how much trade-off between thedifferent forms of capital would be acceptable to society as a whole.
An economic analysis involves comparing benefits and costs. In doing so it provides a rationale toallocate scarce resources, including natural resources, between competitive uses with the objective

Challenges
file:///E|/Dropbox/WaterHealthNewFinal/Course4/concepts/WH40M050C001challenges1.htm[12/17/2014 12:52:26 AM]
of maximizing them. The supply curve and demand curve for a good or service are standard toolsused by economists. As quantity increases, demand decreases and supply increases; the sociallyoptimal quantity (Q*) and price (P*) for this good and service is derived based on the point wherethey intersect.

Challenges
file:///E|/Dropbox/WaterHealthNewFinal/Course4/concepts/WH40M050C001challenges1.htm[12/17/2014 12:52:26 AM]
Figure: The economic optimum E* characterised by quantity Q* and price P* arising as the result of interaction between supply anddemand. Source: (Emmanuelle Quillérou, 2014 personal communication).
Challenges
file:///E|/Dropbox/WaterHealthNewFinal/Course4/concepts/WH40M050C001challenges1.htm[12/17/2014 12:52:26 AM]
Simpler and less data intensive tools are often used for policy assessment, such as the followingtypes of assessment tools:
Cost-benefit analysis
Cost-effectiveness analysis
Damage assessment
Regulatory analysis
Land use planning
Natural resource accounting
Sustainability assessment
Multi-criteria analysis
All of these assessment types can include economic tools, which have been used to varying degrees acrosscountries. In practice however, cost-benefit analysis and natural resource accounting are explicitly derived fromeconomics; other forms of assessment have traditionally focused more on physical rather than monetarychanges.
What values are needed for economic assessment use in policy-making?
"Nowadays people know the price of everything and the value of nothing." Oscar Wilde The Picture of Dorian Gray (Chapter 4)
Price and value are different concepts in economics. The economic value of a good or servicereflects the preferences that society as a whole has for this good or service. A price is determined bythe market as the result of interaction between demand and supply. Price reflects the true economicvalue allocated by society to this good or service under specific market conditions. However,markets do not always exist or may be imperfect. This leads to a discrepancy between economicvalue and price.
Externality
An externality is something generated by one party but which costs or benefits are borne by another.Externalities are common causes of market failures. For example, in real-life farmers usually onlypay for the cost of agricultural production. Because the cost of water pollution is not borne by thosewho produce it (farmers), water pollution is what economists call an externality. Water pollution is anexternality generated by farmers with costs of water treatment borne by the rest of society.
Economic Value
The general goal of economists is to know the economic value of something (i.e., the environmentalgood, service or feature under consideration) in order to estimate the economic price it should have.Economic value or economic price have been used interchangeably when referring to the true valueof a good or service from society's point of view. Financial prices refer to actual market prices.

Challenges
file:///E|/Dropbox/WaterHealthNewFinal/Course4/concepts/WH40M050C001challenges1.htm[12/17/2014 12:52:26 AM]
Two available options:
a) estimate the economic value for non-marketed goods or services by using environmentalvaluation methods
b) correct observed financial prices to reflect the true economic value of the good or service underconsideration from the perspective of society as a whole.
QUESTIONS
Why is economic analysis useful for assessment of environmental changes?
Which tools are available to policy-makers for economic assessment?
What type of value is needed to conduct economic assessment?
What type of environmental benefits do we as a society lose when land and water is degraded or itsarea reduced?
What kind of livelihood benefits do we as a society lose when land and water is degraded or its areareduced?

Challenges
file:///E|/Dropbox/WaterHealthNewFinal/Course4/concepts/WH40M050C003challenges2.htm[12/17/2014 12:52:27 AM]
Water and Health - Challenges
Environmental Valuation - An Economist's Approach
Guidance on Analysing Existing Case Studies or Conducting a Valuation Exercise
When faced with an economic value estimate one should ask:
How reliable is the value?
Can it be replicated?
How valid is it?
Does it match the value allocated by society as a whole or a specific group in society?
Does it correspond to the total economic value allocated by society or only a fraction of thisvalue?
It is important to remember that the choice of method influences the estimate of the economic valueobtained (i.e., the results of the economic analysis are dependent on the choice of method).
Additionally, because people's willingness to accept is higher than their willingness to pay,estimates of economic values depend on the question asked and the direction of the change underconsideration.
A good understanding of the context of the study is critical for choosing a valuation method thatgives reliable and valid estimates of the true economic value.
Environmental Valuation - The Economist's Toolbox
Total Economic Value (TEV) Framework: Total Economic Value = Use Value + Non-use Value
The TEV is the most common frameworks for environmental valuation.It is based on the use of utility as a measure of preference; utility is a flexible concept (i.e., consumption ornon-consumption).Utility represents how much enjoyment society as a whole derives from a good and/or service.The TEV framework divides the total economic value of a good or a service into a use value and a non-usevalue.
Uses can be direct (e.g., fish harvesting) or indirect (e.g., flood regulation).Non-use values are values allocated by society to goods and services. Use and non-use values are assumed independent one from the other and mutually exclusive. Non-use values can be further broken down into values called - Option Existence Bequest Stewardship

Challenges
file:///E|/Dropbox/WaterHealthNewFinal/Course4/concepts/WH40M050C003challenges2.htm[12/17/2014 12:52:27 AM]
Figure: Decomposition of the Total Economic Value into use and non-use values. The sizes of the boxes are notrepresentative of any order of magnitude. Source: (Emmanuelle Quillérou, 2014 personal communication).
Economic Measures of Value
What we want to measure are changes in society's welfare associated with the loss or gain inenvironmental goods or services. Welfare is an economic measure of society's level of "happiness". These changes in welfarerepresent the benefits or costs to society as a result of a change in environmental service provision.
Methods for measuring changes in welfare are based on slightly different measures of welfarechanges. There are three types of valuation methods:
1. Non demand-based methods
2. Demand-based revealed preference methods
3. Demand-based stated preference methods.
In practice, all demand-based methods are prone to experimental biases and often lead to verydiverse estimates of value, and are criticised in the academic literature; however, these are currentlythe only methods to capture non-use values.
Different types of demand curves used by Economists are:

Challenges
file:///E|/Dropbox/WaterHealthNewFinal/Course4/concepts/WH40M050C003challenges2.htm[12/17/2014 12:52:27 AM]
The Marshallian demand curve - is the demand for a good when income is held constant and utilityderived from the good varies. The Hicksian demand curve - is the demand for a good when the utility derived from the good is heldconstant and income varies.
Three different measures of preferences are used in environmental valuation:
Consumer surplus
Willingness to pay
Willingness to accept.
Consumer surplus is the area ABE and producer surplus the area EBD. The sum of consumer and producer surplus is equal towelfare (area ABD). The demand curve is a Marshallian demand curve. Source: (Emmanuelle Quillérou, 2014 personal
communication).Image: Marshallian demand curve

Challenges
file:///E|/Dropbox/WaterHealthNewFinal/Course4/concepts/WH40M050C003challenges2.htm[12/17/2014 12:52:27 AM]
Figure: Willingness to pay is the grey area ACD. The demand curve is a Hicksian demand curve (utility is constant andincome varies). Source: (Emmanuelle Quillérou, 2014 personal communication).
Non-Demand Curve Approaches to Valuation
Non-demand curve approaches to valuation can refer to the use of market prices, replacement costs,dose-response methods, mitigation behaviour and/or opportunity costs to value a given good orservice provided.
Market prices are the result of trade. In neoclassical economic theory, perfect competition is a necessarycondition for prices to reflect the true economic value of the good or service. Prices can be distortedcompared to the true economic value by policies (minimum price or wage), market settings (monopoly,oligopoly), the mode of trade (auctions). Taxes and/or subsidies need to be removed from market prices to estimate the true economic value. Taxesand subsidies are transfer payments within the economy and do not change society's welfare nor the trueeconomic value of the good considered. The use of market prices is an easy enough proxy for economicvalue, but is not as straightforward as it first appears and should be used with caution.
Replacement costs also rely on market prices, but the value of the good or service is measured instead byhow much it would cost to replace it.Replacement costs only measure a fraction of the true economic value of a good: it does not include thevalue of the good linked to preventing changes nor takes the demand for this good into account. Forinstance, benefits provided by an established forest are timber exploitation, water filtration, carbon storage,

Challenges
file:///E|/Dropbox/WaterHealthNewFinal/Course4/concepts/WH40M050C003challenges2.htm[12/17/2014 12:52:27 AM]
recreational and amenity values. E.g., The value of this established forest is thus greater than the costs ofseedlings (replacement costs).
Dose-response methods are based on linking a change in output - typically a change in productivity - to achange in environmental quality. E.g., a paper mill produces paper but its production also create waterpollution. Increasing paper production increases water pollution (decreases the environmental quality).
Mitigation behaviour relates to actions that people take to avoid the negative consequences ofenvironmental degradation. E.g., one way to mitigate the impact malaria is to limit the probability ofcontracting the disease, that is getting an infected mosquito bite.
Opportunity costs are based on the next best alternative available (the first best alternative being thecurrent state). This is typically used when several mutually exclusive management options exist. Forexample, the second best alternative to preserving a forest can be to convert the land on which it stands toagriculture.
Revealed preference method: the Hedonic Price Method
It is based on the use of a surrogate market with actual (observed) market behaviours to estimate the valueof non-marketed goods (referred to as "characteristics" for this method).
The hedonic price method consists of one generic and two specific steps:
Step 0 – Build the survey and sampling plan to collect data on the good's price, the good's levels (quantities) ofindividual characteristics, respondent's characteristics and timing of survey
Step 1 – Estimate the "hedonic price function", that is, price as a function of the characteristics
Step 2 – Estimate the inverse Marshallian demand equation, that is, price as a function of quantity
Step 0 Building the hedonic price database by i) identifying the environmental characteristic to be valued, the surrogate market good with this environmentalcharacteristic, and the stakeholders (users as this is a use value method) to state explicitly how "society as awhole" is defined; ii) designing a survey (questionnaire) and a sampling plan; iii) creating a database with the collected data. This step is not specific to hedonic pricing but is essential toobtain representative data to derive reliable and valid estimates of economic values. Step 1 Regressing the price of a good (e.g. a house) on its characteristics (size of the house, number ofrooms, distance to the nearest school, distance to the park considered, distance to other parks). Thecoefficient of one characteristic estimated by the regression corresponds by assumption to a marginalwillingness to pay.Step 2 Estimating an inverse Marshallian demand equation using marginal willingness to pay (thearea under the demand curve) estimated in Step 1. Knowing willingness to pay, we can easily derive thedemand curve using mathematical techniques.
Revealed preference method: the Travel Cost Method
The travel cost method consists in one generic and two specific steps:
Step 0 – Build the survey and sampling plan to collect data on the origin of travel, journey cost and time, number of

Challenges
file:///E|/Dropbox/WaterHealthNewFinal/Course4/concepts/WH40M050C003challenges2.htm[12/17/2014 12:52:27 AM]
visits, distance to substitute goods, respondent's characteristics and on the timing of survey
Step 1 – Estimate the cost of one trip as a function of the number of visitors, also called distance decay curve
Step 2 – Estimate price as a function of quantity following the introduction of a hypothetical entry fee that is theinverse Marshallian demand equation
Step 0 Building a travel cost database. Time needs to be transformed into a monetary value to be addedto the observed cost of travel.Step 1 Regressing the number of visitors or visits per level of travel cost. Typically, the more expensivethe travel journey, the lower the number of visitors coming to the site. This curve is called the distance decaycurve.Step 2 Introducing a user fee using the results from step 1. E.g., Introducing an entrance fee of $1means that people formerly paying $1 travel cost now pay a total of $2.One of the main problems faced when applying the travel cost method is the valuation of the journey timeinto money units. Seasonal patterns and socio-economic factors need to be taken into account so as toderive a meaningful value from the extrapolation of survey results to a whole population for a year.
Stated preference method: the Contingent Valuation Method
The contingent valuation method consists of four steps:
Step 1 – Set up the hypothetical market by describing the environmental good, the institutional context and acredible payment vehicle.
Step 2 – Build the sampling plan of survey respondents and collect survey data on the levels of environmentalprovision, obtained bids and respondent's characteristics
Step 3 – Estimate mean and median willingness to pay (accept)
Step 4 – Estimate the bid curve i.e. the willingness to pay (accept) as a function of respondent characteristics(income, age, education) and the level of environmental quality, then aggregate the data
The Contingent Valuation method is based on establishing a credible hypothetical market and askingpeople to state how much they are willing to pay to conserve a given non-marketed good or toaccept a reduction in provision in order to estimate the economic value of this good. The contingentvaluation methodology is prone to many biases (a form of measurement error) and its applicationcan be tricky.
the market set up is hypothetical and respondents might provide estimates of their willingness topay that are also hypothetical and might not materialise in real-life when the hypothetical market isimplemented. This is especially true when the change considered is very risky or very political andmore respondents make protest bids.
Step 1 Building a hypothetical market for survey respondents to make credible bids. This involvesdescribing this hypothetical market with the appropriate level of details, so respondents can make informedchoices.
Step 2 Building the sampling plan, in order to obtain representative bids for the whole population.The goal is to obtain bids for each level of environmental provision described in the survey as well as data onthe respondent's characteristics (income, age, educational level) that could influence how much they bid.
Step 3 Estimating the average and median willingness to pay (accept).
Challenges
file:///E|/Dropbox/WaterHealthNewFinal/Course4/concepts/WH40M050C003challenges2.htm[12/17/2014 12:52:27 AM]
Step 4 Estimating the bid curve by using a regression to estimate the willingness to pay (accept) as afunction of respondent characteristics (income, age, education) and the level of environmental quality. Thisallows us to estimate how the willingness to pay (accept) varies with different levels of characteristics.
A fifth step could be included to assess the reliability of the Contingent Valuation exercise in terms of theanswers gathered and the credibility of the values obtained.
Stated preference method: Choice experiment
The choice experiment method forces respondents to trade-off explicitly different proposed scenarios,thereby revealing their preferences for overall scenarios and individual attributes of the scenarios. By varyingthe scenarios for each respondent and across the different respondents, the willingness to pay (accept) foreach scenario and each attribute can be statistically estimated.
The choice experiment method consists of four steps:
Step 1 – Identify the current situation, likely changes and their consequences. These help to identify attributes,attribute levels and payment levels for each scenario
Step 2 – Build unique choice cards by selecting combinations of scenarios (i.e. a bundle of attribute and paymentlevels)
Step 3 – Design the survey instrument with the following five sections: i) describe the changes and theirconsequences, ii) describe the method of payment, iii) select a set of choice cards for each respondent, iv) addquestions to elicit the respondent's attitude and v) finish with questions on the respondent's characteristics (income,age, education)
Step 4 – Estimate willingness to pay and aggregate the results
Step 1 Understanding the context of the study. This step prepares for the description of the study contextto be provided to the respondents. It is critical as it is used to identify the individual building blocks toestablish the scenarios provided to the respondents.Step 2 Building unique choice cards by selecting combinations of scenarios from all the possiblescenarios. Each scenario is a bundle of attributes and payment. Step 3 Design of the survey instrument (questionnaire). As for contingent valuation, it is necessary thatthe respondent understands the problem fully and gives a credible and accurate answer reflecting theiractual - rather than hypothetical - willingness to pay. A pilot questionnaire can be tested on representativefocus groups to identify how to improve the questionnaire before the formal data collection.Step 4 Estimating the willingness to pay and then aggregating the results. Depending on the specificformat of the choice card, discrete models (logit, probit), paired-comparison models or random utility modelscan be used to statistically estimate the marginal willingness to pay associated with each attribute.
Benefit transfer
Economic valuations can be costly in terms of financial, time and human resources. Benefit transferoffers a cheaper alternative to other valuation methods as it reuses already available information.
Benefit transfer consists of two steps:
Step 1 – Identify a case study of reference as a source of economic value for the non-marketed good of interest(site 1)

Challenges
file:///E|/Dropbox/WaterHealthNewFinal/Course4/concepts/WH40M050C003challenges2.htm[12/17/2014 12:52:27 AM]
Step 2 – Transfer the economic value from the case study of reference to the case study to be valued (site 2)
Benefit transfer can be undertaken by identifying two sites (Site 1 and Site 2) that are similar in terms of theenvironmental goods and services they provide. If they have similar population sizes and characteristics, thetransfer is simply the allocation of Site 1's economic value to Site 2. If Site 1 and Site 2 have different scalesand/or scope, the known economic values of Site 1 obtained by other valuation methods need to beextrapolated before allocation to Site 2. This is so that the value allocated to Site 2 from Site 1 reflects its trueeconomic value. Despite its theoretical appeal and potential, benefit transfer is still prone to scale, scope andsampling effects. These can impair the derivation of reliable estimates of environmental values and thusneed to be tested for.
Multi-criteria analysisMulti-Criteria Analysis (MCA) or Multi-criteria Decision Analysis (MCDA) is a semi-qualitative procedureused to compare or determine overall preferences between alternative and often conflicting options. Multi-criteria analysis is not an environmental valuation method as such but rather helps identify preferredscenarios without using economic valuation techniques. It is used as an alternative to cost-benefit analysis.Assessment criteria can be quantitative or qualitative (score) and can relate to social, technical,environmental, economic and financial changes. It is easy to use and has a wider scope than cost-benefitanalysis because it includes qualitative as well as quantitative data.
Multi-criteria analysis consists of three steps:
Step 1 – Determine alternative options (scenarios) and criteria (attributes) for appraisal
Step 2 – Measure criteria or indicators, physically, in monetary terms of by scoring them
Step 3 –Aggregate the criteria values for each option by weighting the criteria and select the option with the highestscore
Step 1 Identifying potential options (scenarios) as well as criteria or indicators to assess whether these optionsare socially desirable or not.
Step 2 Assigning a quantitative or qualitative value for each criterion and each option (i.e., ranking ofcriteria). Ideally, the more socially desirable the outcome, the higher the criterion value to ensure consistency ofranking across the different criteria.
Step 3 Determining weights for each criterion. This can be done through selected focus groups and for variousstakeholders.
This method also has its limits. There is a risk of double counting for overlapping objectives. It relies on expertjudgement which does not always correspond to preferences of society as a whole. The ordinal scoring ofqualitative impacts is potentially too arbitrary.
QUESTIONS
1. True or false. Total Economic Value = Use value + Non use value
Answer: True.

Challenges
file:///E|/Dropbox/WaterHealthNewFinal/Course4/concepts/WH40M050C003challenges2.htm[12/17/2014 12:52:27 AM]
2.True or false. There are two types of valuation methods: the non demand-based methods and the demand-based revealedpreference methods.
Answer: False. There are three types of valuation methods: the non demand-based methods and the demand-based revealedpreference methods and the demand-based stated preference methods.
3. True or false. Different methods are based on different measures of welfare changes, which can lead to differences in theeconomic values estimated between methods.
Answer: True.
4. Multi Responses. Which methods are non-demand curve approaches to valuation? Select as many as appropriate.
(a) Market prices
(b) Contingent valuation
(c) Benefit transfer
(d) Replacement costs
(e) Hedonic pricing
(f) Travel cost
(g) Dose-response methods
(h) Mitigation behaviour
(i) Opportunity costs
(j) Choice Experiment
(k) Multi-criteria analysis
Answer: a, d, g, h, i. Hedonic pricing and Travel costs are revealed preference methods and Contingent valuation and ChoiceExperiment are stated preference methods. Multi-criteria analysis is not a valuation method.

Cost-Benefit
file:///E|/Dropbox/WaterHealthNewFinal/Course4/concepts/WH40M050C006challenges3%20Cost-benefit.htm[12/17/2014 12:52:27 AM]
Water and Health - Challenges
Environmental Valuation - An Economist's Approach
Cost-benefit analysis
Cost-benefit analysis is often used to assess whether a project, an action or a planned change areworth implementing compared to doing business-as-usual.
Providing Study Context through Identification of:
Stakeholders (i.e., local communities, local or national government bodies, non-governmentalorganisations (NGOs), donors...)
Area of interest and
Timeframe
Identification of "with project" and "without project" scenarios (i.e., business as usual)
With project net benefits = With project benefits With project costs Without project net benefits = Without project benefits Without project costs
Incremental net benefit = With project net benefits Without project net benefits
The likely pattern of variation in costs and benefits (or in prices and quantities) needs to be identified. Costsand benefits of the project are to be identified as clearly and precisely as possible, usually undertakenseparately for each stakeholder or group of stakeholders. A cost-benefit analysis compares the net benefitderived from implementing the project to the without project net benefits for each stakeholder (or eachstakeholder group). The project is worth undertaking if the incremental net benefit is positive.
Which costs and which benefits?
Benefits and costs can be estimated from unit quantities and prices. For example,
For a national park, benefits correspond to the number of visitors times the entry fee charged per visitor.
The benefits derived from carbon storage are the number of tonnes of carbon stored times the price for each tonne ofcarbon.
The benefits for agricultural land use are the number of hectares cropped times the price per ton of crop.
Variable Costs and Fixed costs.
Variable costs vary with the quantity used (the higher the quantity used, the higher the cost). Fixed costs do not vary with the quantity used (e.g., insurance, building depreciation…).
The gross margin and net income can then be computed for a given year as follows:
Gross Margin = Benefits - Variable costs
Net income = Gross Margin - Fixed costs

Cost-Benefit
file:///E|/Dropbox/WaterHealthNewFinal/Course4/concepts/WH40M050C006challenges3%20Cost-benefit.htm[12/17/2014 12:52:27 AM]
Time Preference and Discounting to Compare Values
The current value of future benefits and costs is computed as follows:
Present Value = Discount Factor * Value (year considered)
In economics, the trade-off made between receiving money now and later is called a time preference.
Costs and benefits are typically incurred at different times of a project. These are not directly comparablebecause of inflation and time preferences.
Discounting is the technique used to express equivalent economic or financial values at one given point intime. Economists call the preference for the present (i.e. "getting the money today") a positive timepreference. People are said to have a zero time-preference when they are indifferent between getting themoney in the present or in the future. If they prefer getting it in the future, they are said to have a negativetime preference.
Because of the timing of costs and benefits, the choice of a discount rate is not neutral and can influence the decision to undertakea project or not. A project that starts with high costs and have benefits later is less likely to be undertaken for a higher discountrate (giving a lower weight to later benefits than a smaller discount rate). This typically characterises environmental improvements.On the contrary, a project that starts with high benefits and have costs later (e.g. a nuclear power plant) is more likely to beundertaken for the same higher discount rate.
As a result of this time preference, strong identification of when benefits and costs arise is important to derive valid conclusionsfrom a cost-benefit analysis. How to set the discount rate is a choice that needs to be justified and the consequences of this choicemust be discussed. The social discount rate can be estimated through stakeholders survey. Another option would be to considerthe (social) opportunity costs of capital, that is, the rate of interest that would be earned by placing the money in a bank accountrather than spending it now.
Economic indicators of a project's worth
The main three indicators used for assessment are the net present value (NPV), the internal rate of return (IRR) and the benefit-to-cost ratio (BCR).
The Internal Rate of Return (IRR) is the discount rate at which the net present value equals zero. In other words, the maximuminterest rate that can be earned from investing resources in a project.The benefit-to-cost ratio (BCR) is the first indicator that has been historically adopted by project managers to assess the worthof a project. The BCR is the ratio obtained by dividing the present value of the benefit stream by the present value of the coststream, discounted at the opportunity cost of capital. A project is accepted if the BCR is greater than or equal to 1.
All three indicators are complementary and when possible should be computed to assess a project's worth. These indicatorscan be computed in a financial setting (ie when costs and benefits correspond to actual money flow in the economy) as well asin an economic setting
Financial cost-benefit analysis from actual (financial) prices
Economic costs-benefit analysis (also called social cost-benefit analysis).
Sensitivity analysis to assess risk and resilience
cost-benefit analysis is that it often relies on average values for quantities, prices, costs and benefits. This means that the analysisand the economic indicators derived from it provide a good idea of whether the project is worth undertaking on average but fail toconsider the viability of the project under extreme events such as droughts, floods, food crises, financial crises. This is important

Cost-Benefit
file:///E|/Dropbox/WaterHealthNewFinal/Course4/concepts/WH40M050C006challenges3%20Cost-benefit.htm[12/17/2014 12:52:27 AM]
because extreme events are becoming more frequent as a consequence of climate change.
Sensitivity analysis aims to assess consequences on the project's economic worth for risks arising from the project itself or externalforces. A good sensitivity analysis helps assess the resilience of the consequences of project implementation and its socialconsequences. This is particularly critical to assess whether livelihoods of already fragile populations can be sustained even underextreme events or not.
Conduct a sensitivity analysis by identifying the main quantities and/or prices that are likely to change, e.g. because ofdroughts, floods, changes in inputs or fluctuations in commodity prices on the world market. This can be done in consultationwith the relevant stakeholders and/or based on local or international expert opinion. The average values originally used in thecost-benefit analysis are changed to the new "extreme" values and the economic indicators of a project's worth are recalculated toassess whether the project remains economically worth implementing.
If the project is worth doing on average but not under extreme events, a policy-maker might want to consider either notundertaking this project or providing some form of safety net such as an insurance scheme or subsidies for when these extremeevents occur especially for projects targeting fragile populations.
Depending on the results and consultation with stakeholders, you may want to abandon the project and/or introduce safetynet mechanisms.
Social analysis and Environmental analysis
A good financial or economic assessment not only comprises a cost-benefit analysis but also a social analysisand an environmental analysis to assess the consequences of the project on the different populations (ethnicities,villages…) as well as on the environment (pollution, natural resource availability…). These are not detailed in thisunit but are essential to assess accurately the success and resilience of the project considered for implementation.
Derivation of economic costs and benefits from financial values
A financial analysis is based on the financial costs and benefits to participants (individuals,firms, organisations) whereas an economic analysis is based on the costs and benefits tosociety as a whole. Financial costs and benefits are typically observed through market prices,user fees…
Economic values correspond to opportunity costs and/or willingness to pay for the goods andservices considered from the point of view of society as a whole. One of the easiest ways toundertake an economic cost-benefit analysis is to first perform a financial analysis and thenadjust each financial value to derive its economic equivalent to compensate for market pricedistortions that arise when markets are not perfectly competitive.
Economic values can be derived or estimated from financial values in 3 steps:
Step 1 – Adjust for transfer payments (taxes and subsidies)
Step 2 – Adjust for price distortions in traded goods
Step 3 – Adjust for price distortions in non-traded goods (tradables and non-tradables).
Step 1 consists in removing transfer payments from the financial values, i.e. payments that corresponds to a redistribution of

Cost-Benefit
file:///E|/Dropbox/WaterHealthNewFinal/Course4/concepts/WH40M050C006challenges3%20Cost-benefit.htm[12/17/2014 12:52:27 AM]
wealth within society. This is a step undertaken for values expressed in the domestic price system only. They change the financialincentives faced by an individual but not the wealth of society as a whole. Taxes and subsidies are typical examples of this kind ofredistribution. This also applies to user fees that are transferred from a user to a provider within a given society.Step 2 consists in adjusting the financial price values to remove market imperfections and distortions introduced by policies suchas minimum wage or land market regulations. There are two different aspects that need to be checked upon to ensure thateconomic values are measured and expressed in a consistent way: the point of reference and the currency. Shadow prices arederived for the same point of reference or numéraire ("measuring unit"), e.g. using a world or a domestic price system. In the worldprice system, the opportunity costs to the country of traded goods are assumed to correspond to border prices. These opportunitycosts are valued using the cif (cost, insurance, freight) for imports and the fob (free on board) for exports. In the domestic pricesystem, economic values correspond to what society is willing to pay for goods and services. For both price systems, economicvalues can be expressed either in a foreign currency or the domestic currency. When values are expressed in different currencies,the Shadow Exchange Rate (SER) is used for conversion of values into one single currency for consistency.
Step 3 consists in adjusting the values of tradable but non-traded goods (i.e. good that can theoretically be traded but are nottrade in practice) in the World price system. This can be done by using a conversion factor when financial prices areconsidered good estimates of opportunity costs. The conversion factor is the ratio of the shadow price to the domestic marketprice. It is called standard conversion factor when an average ratio is used.
Non-tradable goods need to be valued using specific economic valuation methods in order to estimate their opportunity costs. Inthe domestic price system, the values of non-traded and non-tradable goods are estimated based on their opportunity costs.
Because an economic cost-benefit analysis adopts the perspective as society as whole, it can be used to assess the desirabilityof a project from this perspective. It does not, however, reflect on incentives faced by individual stakeholders or stakeholdergroups and should thus be complemented by a financial cost-benefit analysis for a thorough assessment of the proposedproject.
Because the values of the costs and benefits have changed, a new sensitivity analysis should be performed. The environmentaland social analyses undertaken in relation to the financial cost-benefit analysis still need to be conducted undertaken as acomplement to the financial and economic cost-benefit analyses.
Guidance for critically analysing an existing cost-benefit analysis or conducting a cost-benefit analysis.
Learning Outcomes
By the end of this section students should be able to:
· Describe the cost-benefit analysis framework
· Identify relevant stakeholders, area of interest and a timeframe
· Identify and value costs and benefits with and without project
· Describe how to structure a financial cost-benefit analysis
· Explain why economists use discounting and its consequences for consideration of future generations
· Calculate financial indicators to assess if it is worth undertaking the project
· Explain why sensitivity analysis is important and how to undertake it
· Describe the steps involved in adapting a financial cost-benefit analysis to obtain an economic cost-benefit analysis
QUESTIONS

Cost-Benefit
file:///E|/Dropbox/WaterHealthNewFinal/Course4/concepts/WH40M050C006challenges3%20Cost-benefit.htm[12/17/2014 12:52:27 AM]
1. Text Entry. List some of the key factors to consider when conducting a cost-benefit analysis.
Answer:
For a financial cost-benefit analysis:
- Identification of stakeholders, area of interest and timeframe
- Identification of with and without project scenarios
- Timing of costs and benefits
- Likely variations of values around the average
- stakeholder consultations at all stages of the cost-benefit analysis
For an economic cost-benefit analysis, the following needs to be added:
- removal of transfer payments
- corrections for market imperfections and distortions by adjusting financial prices to derive the economic prices
2. True or False. Shadow prices can be estimated by adjusting financial values to reflect opportunity costs to society as a whole.
Answer: True.
3. True or False. We all have a time preference, measured by a higher rate of discount when we allocate a greater weight to thefuture than the present.
Answer: False. The higher rate of discount means that future benefits lose value faster when converted into their present values. Ahigher rate of discount reflects a stronger preference for the present.
4. Multi Responses. Select the economic indicators that assess the social desirability of an action (project) compared to inaction(business-as-usual)
(a) Net present value (NPV)
(b) Shadow exchange rate (SER)
(c) Opportunity costs
(d) Benefit-to-cost ratio (BCR)
(e) Internal rate of return (IRR)
(f) cif (cost, insurance, freight)
(g) fob (free on board)
Answer: a, d, e. The others are used to adjust financial prices into shadow prices.
5. True or False. We need to complement a cost-benefit analysis by a sensitivity analysis in order to assess the impact of potentialrisks on the social desirability of the project and the economic resilience of the project for stakeholders.

Cost-Benefit
file:///E|/Dropbox/WaterHealthNewFinal/Course4/concepts/WH40M050C006challenges3%20Cost-benefit.htm[12/17/2014 12:52:27 AM]
Answer: True.

Economic Benefit
file:///E|/Dropbox/WaterHealthNewFinal/Course4/concepts/WH40M060C001EconBenProb.htm[12/17/2014 12:52:28 AM]
WATER and HEALTH - Managing Watershed for Health
Benefits of Water Demand Management
Several benefits occur from the adoption of water demand management and conservation. Theseinclude:
Better control over the throughput of water and wastewater systems generated by theneed for better accounting,
Changes in attitudes toward water use as costs begin to show on accounting records,
Improved technology as research and development expenditures for water handlingbecome profitable,
Development of new or expanded industries to provide that technology, and
Revenue generation, for example, from by-product recovery.
Problems of Water Demand Management
Water costs are relatively inelastic to demand levels.
A reduction in water demand will not lead to a proportional decrease in costs.
Increase in water rates to meet financial obligations.
Lack of immediate financial reward.
Potential imbalance between revenues and costs.
Water Reuse
"Reclaimed water" is water that has received at least secondary treatment and basic disinfectionand is reused after flowing out of a domestic wastewater treatment facility.
"Reuse" is the deliberate application of reclaimed water for a beneficial purpose.
Benefits of Ecosystems - Example Wetlands
World-wide wetlands of practically every type have declined in area and are continuing to decline atan alarming rate!
All mangroves may disappear by the end of this century (Duke et al. 2007). Coral reefs are in seriousdecline and many have been severely damage (Wilkinson, 2002)
Everyone in the world is completely dependent on Earth’s ecosystems (MEA 2005)
Ecosystem Services are: Provisioning services Regulating Services Supporting Services

Economic Benefit
file:///E|/Dropbox/WaterHealthNewFinal/Course4/concepts/WH40M060C001EconBenProb.htm[12/17/2014 12:52:28 AM]
Cultural Services
(MEA, 2005)
Benefits of Ecosystem Services - Economic Valuation
An economic valuation is “the process of assigning a monetary value to ecosystem goods andservices. It quantifies the benefits provided by ecosystems and the impact of ecosystem changes onthe well-being of people.” GIZ (2012)
Loss of mangrove ecosystems means the loss of these services and often a reduction in humanwell-being.Changes in welfare represent the benefits or costs to society as a result of a change inenvironmental service provision.

Pollution Release and Transfer Register
file:///E|/Dropbox/WaterHealthNewFinal/Course4/concepts/WH40M060C004PRTR.htm[12/17/2014 12:52:28 AM]
WATER and HEALTH - Managing Watersheds for Health
Pollution Release and Transfer Register (PRTR)
Pollution Charges - Polluter Pays Principle
A "pollution charge" or "emission charge" is a fee, collected by the government, which islevied on each unit of pollutant emitted into the water.
Emission charges reduce pollution because pollution costs the firm money. To save money,the polluter seeks ways to reduce its pollution.
As charges increase, it becomes more cost-effective for the polluter to install pollution controlequipment or switch to other, less polluting production processes.
Emission charges require a monitoring system to determine the quantity and quality ofemissions.
Monitoring Inspection and Oversight
This system can take the form of monitoring equipment which precisely measures the quality andquantity of the pollution emitted and documents it ( e.g., digital records, written records).
For example, in the case of water pollution, equipment can be installed to determine the volume ofwastewater.
The quality of wastewater can be estimated through regular sampling and laboratory analysis.
Monitoring, inspection and oversight of technical and administrative practices are fundamental forachieving compliance with emission standards based on quantity and quality of environmentalrelease and to operationalize collection of pollution charges.
Capacity building involving certification and training, licensing and permits, pollution controls,drinking water quality, waste water and sanitation, data management and auditing becomesnecessary for the development and operationalization of pollution reduction mechanisms.
Monitoring and surveillance of environmental releases (i.e., point and non-point sources) andperformance should be carried out systematically and audited and the findings communicated to all -stakeholders and the public.
Application and Advantages of Emission Charges
Emission charges have been applied primarily to situations involving water pollution.
Charges can be used to finance a regional pollution control system.
Pollution charges have three main advantages

Pollution Release and Transfer Register
file:///E|/Dropbox/WaterHealthNewFinal/Course4/concepts/WH40M060C004PRTR.htm[12/17/2014 12:52:28 AM]
1. Pollution charges achieve a given standard at least cost.
2. Charges force technology; they give firms an incentive to adopt the best availablepollution control technology in order to minimize their "tax" liability.
3. Charges economize on information needs by giving the individual agentsresponsibility for their decisions about pollution control.
Pollution Release and Transfer Registers (PRTRs)
Regional and national pollutant releases inventories
PRTRs can be voluntary and legislated
PRTRs are foundational to the risk management of chemicals; pollution preventionplanning; and chemical safety and pollution awareness.
PRTRs are integral to the public's "right to know" and environmental policy making.
PRTR Systems are key resources for,
identifying pollution prevention priorities, supporting the assessment and riskmanagement of chemicals and environmental modelling activities,
the development of pollution reduction strategies (policy, regulations, communications)
improving technological methods and research
improving understanding among industry, government and the public.
Examples of PRTRs are:
The U.S. Toxics Release Inventory (TRI) established in 1986 www2.epa.gov/toxics-release-inventory-tri-program (Internet Accessrequired)
Canada's National Pollutant Release Inventory www.ec.gc.ca/inrp-npri (Internet Access required)
A listing and links to information on PRTRs established in countries around the world is available at www.prtr.net (Internet Accessrequired)

Environmental Health
file:///E|/Dropbox/WaterHealthNewFinal/Course4/concepts/WH40M060C006susdevel.htm[12/17/2014 12:52:28 AM]
WATER and HEALTH - Moving Forward Managing Watersheds for Health
Environmental health has been broadly defined as "the theory and practice of assessing and controllingfactors in the environment that can potentially affect adversely the health of present and futuregenerations" World Health Organization (WHO), 1993, p 18. cited in Parkes et al., 2003
The Nexus Between Water Energy and Food Security
"In recent years, there has been considerable debate in the international community aboutunderstanding the nexus between water, energy and food security; while some interesting approacheshave emerged from that discussion, implementation of this concept through sector-focused governmentagencies and various stakeholders remains a challenge.....more concerted efforts at all levels arerequired to create the enabling environment necessary to implement solutions and that such efforts willhave to be broader than just dealing directly with water issues."
UNU and UNOSD, 2013 Report, Water for Sustainability: Framing Water within the Post-2015 Development Agenda.
Everyone has an interest in water issues.
Drivers of demand will encourage investment in water and sanitation infrastructure.
Image: Quote water landscape changing. Source: UNU and UNOSD, 2013
Since 2013, many water-based proposals for moving forward fall into three groupings.
Water as a Sector
Water as an Enabler
Water as a Supporter (to development and economic growth)

Environmental Health
file:///E|/Dropbox/WaterHealthNewFinal/Course4/concepts/WH40M060C006susdevel.htm[12/17/2014 12:52:28 AM]
Table comparison of water clusters. Source: UNU and UNOSD, 2013.

Environmental Health
file:///E|/Dropbox/WaterHealthNewFinal/Course4/concepts/WH40M060C006susdevel.htm[12/17/2014 12:52:28 AM]
Table assessment of water clusters. Source: UNU and UNOSD, 2013.
The need for an integration approach to water and health rather than treating each sector as silos hasbeen well established, but is not without its challenges. Arguments have been made for taking a broaderecosystem approach for watershed management and health. The complex, reciprocal interactions among ecosystems, society and health demand an integratedapproach (Parkes et al., 2008).
A cross-cluster framework has been proposed in order to address the following:
Access to water, sanitation and hygiene for all
Water for food and energy security
Water for ecosystem services
A strong governance structure based on transparency, cooperation and integration
(UNU and UNOSD, 2013).

Environmental Health
file:///E|/Dropbox/WaterHealthNewFinal/Course4/concepts/WH40M060C006susdevel.htm[12/17/2014 12:52:28 AM]
Image: Proposed Cross-cluster Framework for Sustainability Development Goals (SDGs). Source: UNU and UNOSD, 2013.
Policy, management, and understanding of human health and disease has largely been organized on thebasis of government borders and agencies, such as municipalities, counties, provinces and states andthe corresponding health authorities. These human-centered frameworks often overlook the structureand function of ecosystems, thereby creating a disconnection between the objects of managment andbiophysical processes that exist between health and nature.
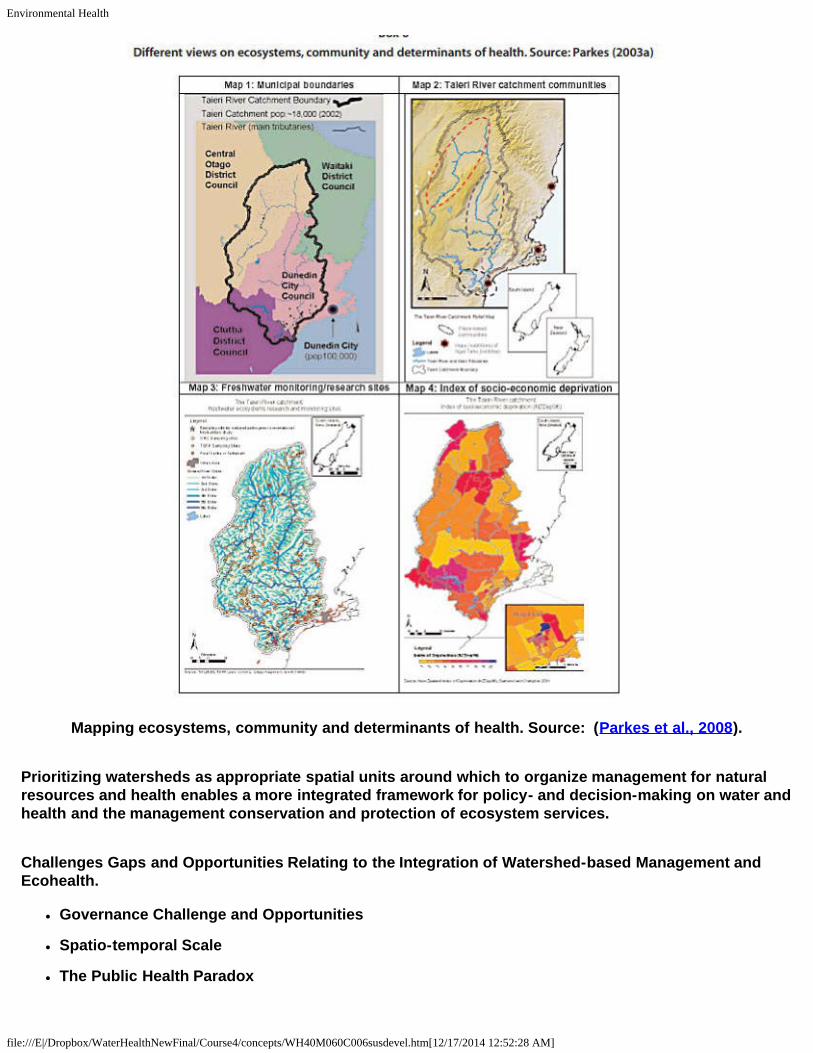
Environmental Health
file:///E|/Dropbox/WaterHealthNewFinal/Course4/concepts/WH40M060C006susdevel.htm[12/17/2014 12:52:28 AM]
Mapping ecosystems, community and determinants of health. Source: (Parkes et al., 2008).
Prioritizing watersheds as appropriate spatial units around which to organize management for naturalresources and health enables a more integrated framework for policy- and decision-making on water andhealth and the management conservation and protection of ecosystem services.
Challenges Gaps and Opportunities Relating to the Integration of Watershed-based Management andEcohealth.
Governance Challenge and Opportunities
Spatio-temporal Scale
The Public Health Paradox

Environmental Health
file:///E|/Dropbox/WaterHealthNewFinal/Course4/concepts/WH40M060C006susdevel.htm[12/17/2014 12:52:28 AM]
Ecological Goods and Services on a Watershed Basis
Poverty and Watersheds
"New-generation" Policy Instruments
Building Capacity for a Paradigm Shift
(Parkes et al., 2008)
The following global needs have been identified for catalyzing water for sustainable growth:
Governance
Accountability and Transparency
WaSH
Infrastructure
Wastewater Treatment
Water Resources Management
Agriculture
Energy
Environmental Services
Capacity
Key Challenges for Implementation of proposed Sustainability Development Goals,SDGs, are:
Monitoring and reporting - SMART indicators to monitor progress and global accountability
Stakeholder engagement - including non-traditonal international coalitions and global networks
Mobilizing financial resources
(UNU and UNOSD, 2013)

Environmental Health
file:///E|/Dropbox/WaterHealthNewFinal/Course4/concepts/WH40M060C006susdevel.htm[12/17/2014 12:52:28 AM]
Rapid assessment of the status of requirements for catalyzing water for sustainable development and growth. Source UNU and UNOSD,2013
Countries and regions with different levels of development will face different entry points to the common

Environmental Health
file:///E|/Dropbox/WaterHealthNewFinal/Course4/concepts/WH40M060C006susdevel.htm[12/17/2014 12:52:28 AM]
challenges, will be building from different strengths, and will therefore engage in the implementationprocess in different ways.
Different starting points will have implications for regional and national investment requirements.
Indicators and Expected Outcomes:Examples of possible compound indicators with stated expected outcomes for assessing progress onwater and health (UNU and UNOSD, 2013):
Infant mortality reduced by 3 per 1000 live births, with a reduction of 1 per 1000 associated withaccess to drinking water and sanitation,
based on the finding that for every quartile improvement in WSS, infant mortality rates werereduced by 1.4 per 1000 live births (Cheng et al., 2012).
Diarrhoea rates reduced by 50%,
based on the finding that for every quartile improvement in WSS, infant mortality rates werereduced by 1.4 per 1000 live births (Cheng et al., 2012)
Source water quality does not exceed selected (chemical and microbiological) WHO guidelines in8/10 samples.
Every country incorporates integrated water resources management plans into their G&PRS thataddress universal access, economic growth, allocation (including transboundary) and climatechange impacts
Improved water efficiency in different sectors (less drops per dollar or more dollars per drop)
Conclusions - Moving Forward Managing Watersheds for Health
Despite the many challenges that have been identified, the integration of Ecohealth and a Watershed-based integrated water resources management (IWRM) approach to environmental management holdspromise for addressing the gaps and linkages between ecosystems and natural resources managementand poverty reduction.
Changes affecting climate and atmospheric process, land uses, ecological process, social networks,livelihoods and lifestyles, add to the complexity of understanding social-ecological systems, involvingtransboundary movement of people, animals, disease and pollutants, spatial-temporal scaling, andcountless physical chemical biological social and ecological relationships.
A next step in this analysis would be specific case studies articulating both the needs and the cost ofmeeting those needs for the development and implementation of an integrated approach to water andhealth.

References
file:///E|/Dropbox/WaterHealthNewFinal/Course4/concepts/WH40M070C001References.htm[12/17/2014 12:52:29 AM]
WATER and HEALTH - References Used in Course 4 Social Perspectives on Water and Health
1. Adeel, Z. (2012). Water as a Human Right: A Panacea to the Global Water Crisis? Presentation to the University ofWaterloo. UNU-INWEH, March 23rd.
2. Ansell, C. and Gash, A. (2008). Collaborative governance in theory and practice. Journal of Public Administration Researchand Theory 18(4): 543-571.
3. Backstraand, K. (2004). Scientisation vs. Civic Expertise in Environmental Governance: Eco-feminist, Eco-modern andPost-modern Responses. Environmental Politics. 13 (4): 695-714.
4. Bakker, K. (2007). The “Commons” Versus the “Commodity”: Alter-globalization, Anti-privatization and the Human Right toWater in the Global South. Antipode. Vol. 39, 3: 430-455.
5. Bal R., Bijker, W., & Hendriks, (2004). Democratization of scientific evidence. BMJ. 329: 1339-41.6. Barlow, M. & Clarke, T. (2004). Water, Privatization., The Global Policy Forum. Available
at: http://www.globalpolicy.org/component/content/article/209/43398.html
7. Bell, Derrick A. Ethical Ambition: Living a Life of Meaning and Worth. New York: Bloomsbury, 2002.
8. Bjornlund, H. & McKay, J. (2002). Aspects of water markets for developing countries: experiences from Australia, Chile, andthe US. Environment and Development Economics 7: 769–795.
9. Blackmore, C. (2007). What kinds of knowledge, knowing and learning are required for addressing resource dilemmas? Atheoretical overview. Environmental Science and Policy, 10 (6), 512-525.
10. Boelens, R. & Zwarteveen, M. (2005). Prices and Politics in Andean Water Reforms. Development and Change. 36 (4):735–758
11. Borrás, S. and Ejrnæs, A. (2011). The legitimacy of new modes of governance in the EU: Studying national stakeholders'support. European Union Politics 12(1): 107-126.
Borresch, R., Maas, S., Schmitz, K., Schmitz, P. M. (2009) Modelling the value of a multifunctional landscape – A discretechoice experiment. International Association of Agricultural Economists Conference, Beijing, China, August 16-22, 2009, 13pages. Available from: http://ageconsearch.umn.edu/bitstream/51641/2/IAAE2009_692.pdf [Accessed 10 January2014]
12. Boyd, D. (2011). The Environmental Rights Revolution. UBC Press.
13. Connelly, S., T. Richardson, and T. Miles. (2006). Situated legitimacy: deliberative arenas and the new ruralgovernance. Journal of Rural Studies 22(3): 267-277.
14. Davidson-Hunt, I.J. & Berkes, F. (2010). Innovating through commons use: community-based enterprises. InternationalJournal of the Commons. Vol. 4 (1): 1-7. [online]. Available at: http://www.thecommonsjournal.org (Internet AccessRequired) (Internet Access Required)
15. de Albuquerque, C. (2012). On the Right Track: Good Practices to Realising the Rights to Water and Sanitation. UnitedNations Special Rapporteur on the Human Right to Safe Drinking Water and Sanitation. With Virginia Road.
16. Dean, Mitchell. (1999). Governmentality: Power and Rule in Modern Society. Thousand Oaks, CA: Sage Publications.
17. de Loë, R.C. 2009. Sharing the Waters of the Red River Basin: A Review of Options for Transboundary Water Governance.Prepared for International Red Rivers Board, International Joint Commission. Guelph, ON: Rob de Loë Consulting Services
18. de Loë, R., Di Giantomasso, S., and Kreutzwiser, R. D. (2002). Local capacity for groundwater protection inOntario. Environmental Management, 29 (2), 217-233.
19. de Loë, R. C. and Kreutzwiser, R. D. (2007). Challenging the status quo: the evolution of water governance in Canada.In Eau Canada: The Future of Canada’s Water, ed. K. Bakker, 85-103. Vancouver: University of British Columbia Press.
20. De Vos, H. et al, (2006). Formal Law and Local Water Control in the Andean Region: A Fiercely Contested Field. WaterResources Development., Vol. 22, No. 1, 37–48.
21. Dewulf, A., M. Mancero, G. Cárdenas, and D. Sucozhañay. (2011). The fragmentation and connection of frames incollaborative water governance. A case study of river catchment management in Southern Ecuador. International Review ofAdministrative Sciences 77 (1): 50-75.
22. Doern, B. & Reed, E.J. (2000). Risky Business: Canada’s Changing Science-Based Policy and Regulatory

References
file:///E|/Dropbox/WaterHealthNewFinal/Course4/concepts/WH40M070C001References.htm[12/17/2014 12:52:29 AM]
Regime. Toronto: University of Toronto Press.
23. Driedger, S.M. & Eyles, J. (2003). “Different frames, different fears: communicating about chlorinated drinking water andcancer in the Canadian media”. Social Science & Medicine. Vol. 56: 1279-1293.
24. Eden, S; Donaldson, A; Walker, G. (2006). Green groups and grey areas: scientific boundary-work, nongovernmentalorganisations, and environmental knowledge. Environment and Planning A. Vol. 38, No. 6: 1061-1076.
25. Edge, S. (2011). Environmental Health Governance and Socio-spatial Struggles for Legitimacy: The Case of Chemical RiskManagement in Canada. Paper presentation at the International Medical Geography Symposium. Durham University,Durham, United Kingdom.
26. Edge, S. & McAllister, ML. (2009). Place-based local governance and sustainable communities: lessons from Canadianbiosphere reserves. Journal of Environmental Planning & Management. 52:3, 279-295.
27. Edge, Sara. & Eyles, J. (in press). The socio-spatial (re)configuration of legitimacy, knowledge & practice in chemical riskgovernance: an exploratory integration of boundary-work & scale-frame analytics. Environmental Politics.
28. Entman, R. M. (1993). Framing: toward clarification of a fractured paradigm. Journal of Communication. 43:51-58.
29. Feitelson, E. (2012). What is Water? A Normative Perspective. Water Policy. 52-64. doi: 10.2166/wp.2012.003
30. Feitelson, E. & Fischhendler, I. (2009). Spaces of water governance: the case of Israel and its neighbors. Annals of theAssociation of American Geographers. 99, 728–745.
31. Ferreyra, C., de Loë, R. C., and Kreutzwiser, R. D. 2008. Imagined communities, contested watersheds: challenges tointegrated water resources management in agricultural areas. Journal of Rural Studies, 24 (3), 304-321.
32. Fischer, F. (2005). Environmental Regulation and Risk-Benefit Analysis: From Technical to Deliberative PolicyMaking. In: Robert Paehlke & Douglas Torgerson (eds). Managing Leviathan: Environmental Politics and theAdministrative State. 2nd Edition. Peterborough, ON: Broadview Press, pp. 59-80.
33. Fischhendler, I. & Feitelson, E. (2005). The formation and viability of non-basin transboundary water management: The caseof the U.S.–Canada boundary water. Geoforum 36:792–804.
34. Folke, C., Hahn, T., Olsson, P., and Norberg, J. (2005). Adaptive governance of social-ecological systems. Annual Review ofEnvironment and Resources, 30: 441-473.
35. Gearey, M. and P. Jeffrey. (2006). Concepts of legitimacy within the context of adaptive water managementstrategies. Ecological Economics 60(1): 129-137.
36. Giordano, M. A. and Wolf, A. T. 2003. Sharing waters: post-Rio international water management. Natural ResourcesForum, 27 (2), 163-171.
37. Gleick, P. et al. (2004) The World’s Water 2004-5: The Biennial Report on Freshwater Resources. Washington, DC andLondon: Island Press.
38. Global Water Partnership (2000). Integrated Water Resources Management. TAC Background Papers No.4, Global WaterPartnership, Technical Advisory Committee, Stockholm, Sweden. Available at: http://www.gwpforum.org/servlet/PSP?iNodeID=215&itemId=24Heath, T. (2010). Pragmatic but Principled: Background Report on IWRM. Cranfield Univeristy andWASUP.
39. Guston, D. (2001). Boundary Organizations in Environmental Science and Policy: An Introduction. Science, Technology &Human Values. 26 (4): 339-408.
40. Harris, L. (2002). Water and conflict geographies of the Southeastern Anatolia Project. Society and Natural Resources, 15,743-759.
41. Harris, L. & Alatout, S. (2010). Negotiating hydro-scales, forging states: Comparison of the upper Tigris/Euphrates andJordan River basins. Political Geography. 29: 148-56.
42. Hattingh, J., el. (2007). A trialogue model for ecosystem governaance.Water Policy 9 Supplement 2: 11–18.
43. Holley, C., Gunningham, N. & Shearing, C. (2012). The New Environmental Governance. Earthscan Publishing. New York,New York.
44. Ingram, H. (2008) Beyond Universal Remedies for Good Water Governance. Paper presented at the Rosenberg InternationalForum on Water Policy, Zaragoza, June 24-27.
References
file:///E|/Dropbox/WaterHealthNewFinal/Course4/concepts/WH40M070C001References.htm[12/17/2014 12:52:29 AM]
45. Kurtz, H. (2003). Scale frames and counter-scale frames: constructing the problem of environmentaljustice Political Geography 22 887–916
46. Lach, D., Rayner, S. & Ingram, H. (2005). Taming the waters: strategies to domesticate the wicked problems of waterresource management. International Journal of Water. 3(1), 1517.
Lancaster, K. (1966) A New Approach to Consumer Theory. Journal of Political Economy, Vol. 74, pp. 132--157.
47. Lejano, R. & Ingram, H. (2009). Collaborative networks and new ways of knowing. Environmental Science and Policy. 12:653-62.
48. Lemos, M. C. and Agrawal, A. (2006). Environmental governance. Annual Review of Environment and Resources 31: 297-325.
49. Mansfield, B., & Haas, J. (2006). Scale framing of scientific uncertainty in controversy over the Endangered Steller sealion. Environmental Politics: Vol. 15 (1): 78-94.
50. Marin, L. E., Sandoval, R., Tagle, F., Sanchez, E. & Martinez, V. H. (2009). Water as a human right and as an economicresource: an example from Mexico. In: Water Ethics. Llamas, M. R., Martinez-Cortina, L. & Mukherji, A. (eds). CRCPress/Balkema, Leiden, pp. 115–125.
51. Marston, S.A. (2000). The social construction of scale. Progress in Human Geography. Vol. 24: 219-42.
52. McCarthy, J. (2005). Scale, Sovereignty and Strategy in Environmental Governance. Antipode. 732-53.53. McCarthy, J., (2007). States of nature: theorizing the state in environmental governance. Review of International Political
Economy. 14: 176–194.54. McCloskey, M. (1999). Problems with Using Collaboration to Shape Environmental Public Policy,
34 Valparaiso University Law Review. 32(2): 423-3. Available at: http://scholar.valpo.edu/vulr/vol34/iss2/655. Millenium Ecosystem Assessment. (2005). Synthesis. Island Press, Washington, DC Available online
at: http://www.millenniumassessment.org/ (Internet Access Required)56. Meadowcroft, J. 2002. Politics and scale: some implications for environmental governance. Landscape and Urban
Planning 61(2-4): 169-179.
57. Mehta, L. (2001). Water, difference, and power: Unpacking notions of water “users” in Kutch, India. International Journal ofWater. 1 (3-4).
58. Miller, C. (2001). Hybrid Management: Boundary Organizations, Science Policy, and Environmental Governance in theClimate Regime. Science, Technology & Human Values. 26 (4): 478-500.
59. Molden, D., Douglan, M., (2002). Managing water from farmers’ fields to river basin: implications of scale. In: Turton,A.R.Henwood, (Eds.). Hydropolitics in the Developing World: a Southern African Perspective. African Water Issues ResearchUnit, Pretoria.
60. Norgaard, R., Kallis, G. & Kiparsky, M. (2009). Collectively engaging complex socio-ecological systems: re-envisioningscience, governance, and the California Delta. Environmental Science and Policy. 12: 644-52.
61. Ostrom, E. 1990. Governing the commons: The evolution of institutions for collective action. Cambridge, UK:Cambridge University Press.Pahl-Wostl, C., et al. (2007). Social Learning and Water Resources Management. Ecology andSociety. 12 (2): 5.
62. Parkes, M. et al, (2010). Towards integrated governance for water, health and social-ecological systems: The watershedgovernance prism. Global Environmental Change. Vol. 20: 693-704.
63. Pahl-Wostl, C. (2007). Transitions towards adaptive management of water facing climate and global change. WaterResources Management, 21(1), 49-62.
64. Pedynowski, D. (2003). Sciences(s): which, when and whose? Probing the metanarrative of scientific knowledge in thesocial construction of nature. Progress in Human Geography. Vol. 27, No. 6: 735-52.
65. Pollock, R.M. & Whitelaw, G.S. Community-Based Monitoring in Support of Local Sustainability. Local Environment 10: 3:211-228.
66. Prasad, N. (2006). Privatisation Results: Private Sector Participation in Water Services After 15 Years. Development PolicyReview. 24 (6): 669-692
67. Pruss-Ustun, A., Corvalan, C. (2005). Preventing Disease through Healthy Environments: Towards an Estimate of theEnvironmental Burden of Disease. World Health Organisation, Geneva.

References
file:///E|/Dropbox/WaterHealthNewFinal/Course4/concepts/WH40M070C001References.htm[12/17/2014 12:52:29 AM]
68. Reed, M. (2010). Guess who's (not) coming for dinner: Expanding the terms of public involvement in sustainable forestmanagement. Scandinavian Journal of Forest Research. 25(Suppl 9): 45-54.
69. Reed, M. & Bruyneel, S. (2010). Rescaling environmental governance, rethinking the state: A three-dimensionalreview. Progress in Human Geography. Published online: doi:10.1177/0309132509354836
70. Rogers, A. and Taylor, P. (1998), Participatory Curriculum Development in Agricultural Education. A Training Guide. Rome:FAO.
71. Roth, D., Boelens, R., & Zwarteveen, M. (Eds.). (2005). Liquid relations: contested water rights and legal complexity. RutgersUniversity Press.
Scarpa, R., Rose, J.M. (2008) "Design efficiency for non-market valuation with choice modelling: how to measure it, what toreport and why." Australian Journal of Agricultural and Resource Economics, Vol. 52, 253-282
72. Shiva V (2002) Water Wars: Privatization, Pollution and Profit. London: Pluto Press
73. Simms, G. And R.C. de Loë. 2010. Challenges for Water Governance in Canada: A Discussion Paper. Governance forSource Water Protection in Canada Report No. 2. Waterloo, ON: Water Policy and Governance Group
74. Sneddon, C. (2003). Reconfiguring scale and power: the Khong-Chi-Mun Project in Northeast Thailand. Environment andPlanning A, 35, 2229-2250.
75. Swyngedouw, E. (1999). Modernity and hybridity: nature, regeneracionismo, and the production of the Spanish waterscape.Annals of the Association of American Geographers, 89(1), 443-465.
76. Taylor, P. (2006) The Urban Governance Index: A tool to measure the quality of urban governance, Presentation toUNESCO UN-HABITAT meeting, Paris, December 2006.
77. Trawick, P. (2003) Against the privatization of water: an indigenous model for improving existing laws and successfullygoverning the commons, World Development, 31(6), pp. 977–996.
78. United Nation Environmental Program (UNEP), (2002). Atlas of International Freshwater Agreements. UNEP, Nairobi, Kenya.
79. United Nations Food and Agriculture Organization (UNFAO). (1984). Systematic Index of International Water ResourcesTreaties, Declarations, Acts and Cases, by Basin. Volume II. Legislative Study 34 Rome: Food and Agriculture Organizationof the United Nations.
80. United Nations General Assembly. (1945). UN Declaration of Human Rights, New York: UN,.
81. United Nations General Assembly. (1966). International Covenant on Civil and Political Rights. New York.
82. United Nations General Assembly. International Covenant on Economic, Social and Cultural Rights. New York: 1966.
83. United Nations General Assembly. (1979). Convention on the Elimination of All Forms of Discrimination against Women NewYork.
84. United Nations General Assembly. (1990). Convention on the Rights of the Child. New York.
85. United Nations General Assembly. (2007). Declaration on the Rights of Indigenous Peoples. New York.
86. United Nations General Assembly. (2008).Convention on the Rights of Persons with Disabilities. New York.
87. United Nations World Water Assessment Programme. (2003). Water for People, Water for Life: The United Nations WorldWater Development Report. New York: UNESCO Publishing.
88. Van Buuren, A. (2009). Knowledge for Governance, Governance of Knowledge: Inclusive Knowledge Management inCollaborative Governance Processes. International Public Management Journal. 12 (2): 208-35.
89. Van Kammen, J., de Savigny, D. & Sewankamboc, N. (2006). Using knowledge brokering to promote evidence-basedpolicy-making: the need for support structures. Bulletin of the World Health Organization. Vol. 84, pp. 608-612.
90. van Lieshout, M., Dewulf, A., Aarts, M. & C. Termeer. (2011). Do Scale Frames Matter? Scale Frame Mismatches in theDecision Making Process of a “Mega Farm” in a Small Dutch Village. Ecology & Society. 16(1): 38..
91. Wolf, A. et al, (1999). International river basins of the world. International Journal of Water Resources Development. 15 (4):

References
file:///E|/Dropbox/WaterHealthNewFinal/Course4/concepts/WH40M070C001References.htm[12/17/2014 12:52:29 AM]
387–427.
92. World Bank (2005). World Development Report 2006: Equity and Development. New York: Oxford University Press for theWorld Bank.
93. World Bank (2006). A Decade of Measuring the Quality of Governance. Worldwide Governance IndicatorsProject. Available at: http://siteresources.worldbank.org/INTWBIGOVANTCOR/Resources/1740479-1150402582357/2661829-1158008871017/booklet_decade_of_measuring_governance.pdf (Internet Access Required)
94. World Health Organization. Preamble to the Constitution of the World Health Organization as adopted by the InternationalHealth Conference, New York, 19-22 June, 1946; signed on 22 July 1946 by the representatives of 61 States (OfficialRecords of the World Health Organization, no. 2, p. 100) and entered into force on 7 April 1948.
95. World Water Council (2006) Costing MDG Target 10 on Water Supply and Sanitation: Comparative Analysis, Obstacles andRecommendations. Available at: www.worldwatercouncil.org
96. World Water Forum (2000) Forum session conclusions ‘Water and Indigenous Peoples’ of the Second WorldWater Forum,March 2000 (available at: http://www.worldwaterforum.org). (Internet Access Required)
97. WHO and UNICEF (2004). Meeting the MDG Drinking Water and Sanitation Target: A Mid-Term Assessment of Progress.New York: WHO and UNICEF.
98. n.a. Water Law and Indigenous Rights - WALIR Towards recognition of indigenous water rights and management rules innational legislation, Summary of the presentations at the public meeting (7 March 2002) on the occasion of the InternationalWALIR Seminar, 4-8 March 2002, Wageningen, The NetherlandsWater Governance Facility, (nd). Training Manual on WaterIntegrity
99. Wilde, O. (1890) The Picture of Dorian Gray. Chapter 4.

WLC Template
file:///E|/Dropbox/WaterHealthNewFinal/Course4/concepts/WH40M070C004ReadingMaterials_EnvironValuation.htm[12/17/2014 12:52:29 AM]
WATER and HEALTH - Course 4 Social Perspectives on Warer and Health
Economics of Valuation of Land Degradation (Environmental Degradation and Restoration)
and Economic Valuation for Wetland Conservation
Key Readings
This page is identical to the Discussion Page
Indicative textbook
Perman, R., Ma, Y., Common, M., Maddison, D., Mcgilvray, J. (2011) Natural Resource andEnvironmental Economics, 4th Edition. Pearson Education. 712p.
This textbook is written as an introductory textbook and covers all the material described inthis unit. It contains clear text descriptions as well as illustrative graphs and mathematicalequations. The companion website also provides example files. Depending on your ownproficiency in maths you may find other textbooks more suited to your needs but thistextbook should constitute a good starting point.
All sections
ELD Initiative (2013). The rewards of investing in sustainable land management. InterimReport for the Economics of Land Degradation Initiative: A global strategy for sustainableland management. Thomas, R.J., Quillérou, E., Stewart, N. (Coordinators and Eds.), 124pp.Available at: www.eld-initiative.org/ or http://inweh.unu.edu/reports/ [17 September 2013]
This report provides a good complement to this course. It details selected case studies andthe general background for the initiative and briefly reviews the methods detailed in thiscourse.
Section 1 WH40M05D001Challenges1
Pagiola, S., von Ritter, K., Bishop, J. (2004). Section 1 Introduction & Section 2 Ecosystemsand the services they provide. In: How much is an ecosystem worth? Assessing theEconomic Value of Ecosystem Conservation. In collaboration with The Nature Conservancyand IUCN - The World Conservation Union (Ed.). The World Bank Environment Departmentpaper, pp. 1-8. Available from: http://www.cbd.int/doc/case-studies/inc/cs-inc-iucn-nc-wb-en.pdf [22 November 2011]
The first part of this report outlines the key questions an economic analysis can help answerto complement other disciplinary perspectives.
Perman, R., Ma, Y., Common, M., Maddison, D., Mcgilvray, J. (2011) Chapter 2: The originsof the Sustainability Problem. In: Natural Resource and Environmental Economics, 4thEdition. Pearson Education, pp. 16-58.
This chapter provides an overview of the discussion on why we as a society should aim forsustainability.

WLC Template
file:///E|/Dropbox/WaterHealthNewFinal/Course4/concepts/WH40M070C004ReadingMaterials_EnvironValuation.htm[12/17/2014 12:52:29 AM]
Perman, R., Ma, Y., Common, M., Maddison, D., Mcgilvray, J. (2011) Chapter 3: Ethics,Economics and the Environment. In: Natural Resource and Environmental Economics, 4thEdition. Pearson Education, pp. 59-91.
This chapter provides an overview of utilititarism, that is the economic perspective adoptedin this unit, and its consequences for the definition of sustainability.
Shanahan, M. (2008) Entangled in the web of life: biodiversity and the media. IIED BriefingPapers, May 2008, 4pp. Available from: http://pubs.iied.org/pdfs/17037IIED.pdf [01 May2012]
This breifing paper details some ecosystem services provides by nature and outlines theimportance of using a communication language relevant to the target audience to triggereffective management.
Section 2 WH40M05D003Challenges2
Pagiola, S., von Ritter, K., Bishop, J. (2004). Section 3 Valuing ecosystem services. In: Howmuch is an ecosystem worth? Assessing the Economic Value of Ecosystem Conservation.In collaboration with The Nature Conservancy and IUCN - The World Conservation Union(Ed.). The World Bank Environment Department paper, pp. 9-12. Available from:http://www.cbd.int/doc/case-studies/inc/cs-inc-iucn-nc-wb-en.pdf [22 November 2011]
The second part of this report briefly describes methods available to decision-makers forenvironmental valuation.
Perman, R., Ma, Y., Common, M., Maddison, D., Mcgilvray, J. (2011) Chapter 4: Welfareeconomics and the Environment. In: Natural Resource and Environmental Economics, 4thEdition. Pearson Education, pp. 92-136.
This chapter provides an overview of the economics tools for analysis of environmentalchange. It describes the conditions for efficient allocation, how a market system woulddeliver this efficient allocation and why allocation is not always efficient as the rationale forgovernment intervention through public policy-making. In particular, it details the keyproblems of externalities and market failure arising in relation to the environment.
Perman, R., Ma, Y., Common, M., Maddison, D., Mcgilvray, J. (2011) Chapter 12: Valuingthe environment. In: Natural Resource and Environmental Economics, 4th Edition. PearsonEducation, pp. 411-454.
This chapter details the total economic value framework, the concepts of willingness to payand to accept, compensating surplus and equivalent surplus. It explains how to use differentmethods to conduct environmental valuation.
Section 3 WH40M05D006Challenges3 Cost-benefit
Pagiola, S., von Ritter, K., Bishop, J. (2004). Section 3 Valuing ecosystem services. In: Howmuch is an ecosystem worth? Assessing the Economic Value of Ecosystem Conservation.In collaboration with The Nature Conservancy and IUCN - The World Conservation Union(Ed.). The World Bank Environment Department paper, pp. 13-33. Available from:

WLC Template
file:///E|/Dropbox/WaterHealthNewFinal/Course4/concepts/WH40M070C004ReadingMaterials_EnvironValuation.htm[12/17/2014 12:52:29 AM]
http://www.cbd.int/doc/case-studies/inc/cs-inc-iucn-nc-wb-en.pdf [22 November 2011]
The last part of this report outlines general principles of cost-benefit analysis and potentialscenarios to be considered for assessment.
Perman, R., Ma, Y., Common, M., Maddison, D., Mcgilvray, J. (2011) Chapter 11: Cost-Benefit Analysis. In: Natural Resource and Environmental Economics, 4th Edition. PearsonEducation, pp. 367-410.
This chapter details the economic principles behind cost-benefit analysis. It outlines theimpact of the timing of costs and benefits on decisions made.
Perman, R., Ma, Y., Common, M., Maddison, D., Mcgilvray, J. (2011) Chapter 13:Irreversibility, risk and Uncertainty. In: Natural Resource and Environmental Economics, 4thEdition. Pearson Education, pp. 455-481.
This chapter explains the difference between risk and uncertainty and their consequencesfor decision-making at the individual and the society levels.
Key Readings on Economic Valuation for Wetland Conservation
GIZ. 2012. Integrating Ecosystem Services into Development Planning. A stepwise approach for practitioners based on the TEEBapproach.
Irwin, F. and J. Ranganathan. 2007. Restoring Nature’s Capital. An Action Agenda to Sustain Ecosystem Services. World ResearchInstitute, Washington, DC. Available at: http://pdf.wri.org/restoring_natures_capital.pdf
Millennium Ecosystem Assessment, 2005. Ecosystems and Human Well-being: Synthesis. Island Press, Washington, DC..Available at: www.maweb.org
Russi D., ten Brink P., Farmer A., Badura T., Coates D., Förster J., Kumar R. and Davidson N. 2013. The Economics ofEcosystems and Biodiversity for Water and Wetlands. IEEP, London and Brussels; Ramsar Secretariat, Gland. Available at:http://data.iucn.org/dbtw-wpd/edocs/2013-001.pdf
TEEB .2010. The Economics of Ecosystems and Biodiversity Ecological and Economic Foundations. Edited by Pushpam Kumar.Earthscan, London and Washington.
UNEP-WCMC. 2011. Marine and coastal ecosystem services: Valuation methods and their application. UNEP-WCMC BiodiversitySeries No. 33. 46 pp. Available at: http://www.unep.org/dewa/Portals/67/pdf/Marine_and_Coastal_Ecosystem.pdf (Internet AccessRequired)
Conservation International. 2008. Economic Values of Coral Reefs, Mangroves, and Seagrasses: A Global Compilation. Center forApplied Biodiversity Science, Conservation International, Arlington, VA, USA. Available at:http://www.conservation.org/documents/CI_Marine_CI_Economic_Values_Coral_Reefs_Mangroves_Seagrasses_compilation_2008.pdf (Internet Access Required)
Further Readings
The following readings have been selected because the description of the methodologies is still relevant. They aim to develop anunderstanding of the methods, their applications and some of their limitations. The methods detailed in this unit were primarilydeveloped in the 1990s and 2000s and methodological steps have not changed much since. Current research is still beingconducted on reducing empirical biases for improvement of the empirical results derived from these methods. The economic valuesdetailed in these readings would need to be updated and should be considered with caution. This list is far from being exhaustive,you can check your local university libraries, the Internet and other available sources for more examples.

WLC Template
file:///E|/Dropbox/WaterHealthNewFinal/Course4/concepts/WH40M070C004ReadingMaterials_EnvironValuation.htm[12/17/2014 12:52:29 AM]
Bennett, J., Birol, E. (2010) Choice Experiment in Developing Countries: Implementation,Challenges and Policy Implications. Edward Elgar, 321pp.
This is an excellent reference book on applications of the choice experiment method indeveloping countries. It can be used in the first half of Section 4 as an example case study.
Bromley, D.-W. (1995) Part V: The Valuation Problem, Chapters 24 to 30. In: The Handbookof Environmental Economics. Massachusetts: Blackwell Publishers, pp. 543-686.
This reading details economic methods for environmental valuation, their theoretical basis,the main steps and their main limitations.
Commission on the Measurement of Economic Performance and Social Progress (2009)The Report of the commission on the measurement of economic performance et socialprogress. Available from: http://www.stiglitz-sen-fitoussi.fr/en/ [Accessed 01 May 2012]
Also known as the "Stiglitz-Sen-Fitoussi" report. The Commission was set up to look at the(in)adequacy of current measures of economic performance and their relevance formeasuring societal well-being as well as economic, environmental and social sustainabilityand propose new tools for improved assessment. The report summarises their findings.
Grafton, Q., Adamowicz, W., Dupont, D., Nelson, H., Hill, R. J., & Renzetti, S. (2004) Part III:Environmental Valuation, Chapters 8 to 10. In: The Economics of the Environment andNatural Resources. Wiley-Blackwell, pp. 219-311.
This reading details the economic methods for environmental valuation: their theoreticalfoundations, main steps and limitations.
Hanley, N., Shogren, J. F., White, B. (1997) Chapter 12: The Theory of NonmarketValuation. In: Environmental Economics in Theory and Practice. Basingstoke, Hampshire:Palgrave Macmillan, pp. 356-382.
This reading details the economic methods for environmental valuation: their theoreticalfoundations, main steps and limitations.
Hanley, N. (1999) Chapter 57: Cost–benefit Analysis of Environmental Policy andManagement. In: van den Bergh, J. C. J. M. (ed). Handbook Of Environmental AndResource Economics. Cheltenham, United Kingdom: Edward Elgar, pp. 824-836
This reading details principles of environmental cost-benefit analysis: its theoreticalfoundations, main steps and limitations.
Stern, N. (2007) Stern Review on the Economics of Climate Change. Cabinet Office - HMTreasury. ISBN: 9780521700801. 712p. Available from:http://webarchive.nationalarchives.gov.uk/+/http://www.hm-treasury.gov.uk/sternreview_index.htm (Internet Access Required) [Accessed 29 November2011]
This review compared the economic cost of action versus the costs of inaction for mitigatingclimate change. The results of this review triggered a very strong political support for climatechange mitigation strategies throughout the world and a reorientation of economic

WLC Template
file:///E|/Dropbox/WaterHealthNewFinal/Course4/concepts/WH40M070C004ReadingMaterials_EnvironValuation.htm[12/17/2014 12:52:29 AM]
development towards green growth. This political support was associated with hugeinvestments for climate change mitigation technology development, financial support foradoption of green technologies and implementation of climate change-related policies. Thiseconomic analysis constitutes the current reference for economic assessment to induceaction.
Scarpa, R., Rose, J.M. (2008) Design efficiency for non-market valuation with choicemodelling: how to measure it, what to report and why. Australian Journal of Agricultural andResource Economics, Vol. 52, 253-282
This paper details why efficient designs should be preferred to design choice modelingcards.
"For the student" paper series, The Australian Economic Review. Available from:http://onlinelibrary.wiley.com/journal/10.1111/%28ISSN%291467-8462 [Accessed 01 May2012] (Internet Access Required)
These papers explain basic economic concepts in simple terms for people training ineconomics in more details than in a traditional academic paper.
References
Borresch, R., Maas, S., Schmitz, K., Schmitz, P. M. (2009) Modelling the value of amultifunctional landscape – A discrete choice experiment. International Association of
Agricultural Economists Conference, Beijing, China, August 16-22, 2009, 13 pages.Available from: http://ageconsearch.umn.edu/bitstream/51641/2/IAAE2009_692.pdf [Accessed10 January2014] (Internet Access Required)
Lancaster, K. (1966) A New Approach to Consumer Theory. Journal of Political Economy,Vol. 74, pp. 132--157.
Wilde, O. (1890) The Picture of Dorian Gray. Chapter 4.
Scarpa, R., Rose, J.M. (2008) "Design efficiency for non-market valuation with choicemodelling: how to measure it, what to report and why." Australian Journal of Agricultural andResource Economics, Vol. 52, 253-282
Weblinks and Portals
EnvironmentalValuation ReferenceInventory (EVRI)
The EVRI is a Canadian-run searchable storehouse of empiricalstudies on the economic value of environmental benefits andhuman health effects using various valuation methods. Thisstorehouse has been developed as a tool to help policy analystsuse the benefit transfer method.
https://www.evri.ca/ (Internet Access Required)
[Accessed 01 May 2012]

WLC Template
file:///E|/Dropbox/WaterHealthNewFinal/Course4/concepts/WH40M070C004ReadingMaterials_EnvironValuation.htm[12/17/2014 12:52:29 AM]
Envalue The ENVALUE environmental valuation database is an Australian-run systematic collection of environmental valuation studiespresented in an on-line database. It is expected that the ENVALUEdatabase will assist decision makers in government and industry aswell as academics, consultants and environmental groups, toincorporate environmental values into cost-benefit analyses,environmental impact statements, project appraisals and overallvaluation of changes in environmental quality.
http://www.environment.nsw.gov.au/envalueapp/ (Internet AccessRequired)
The EnvironmentalValuation and Cost-benefit website
A source of case studies, examples and further references
http://www.costbenefitanalysis.org/ (Internet Access Required)
[Accessed 01 May 2012]
Venice Platform The Coastal Wiki : Internet encyclopedia for coastal and marineprofessionals
http://www.coastalwiki.org/coastalwiki/ (Internet Access Required)
[Accessed 01 May 2012]
The World Bank,Environment Section
A good source of examples of policies, green growth strategies andindicators
http://go.worldbank.org/B28KB6VQQ0 (Internet Access Required)
Economic Valuation for Wetland Conservation -
Ecosystem Valuation: www.ecosystemvaluation.org (Internet Access Required)
The Natural Capital Project: http://www.naturalcapitalproject.org/ (Internet Access Required)
The Economics of Ecosystems and Biodiversity (TEEB): http://www.teebweb.org/ (Internet Access Required)
Multimedia
Pavan Sukhdev (2011) Put a value on nature! Technology Education and Design (TED) TalkJuly 2011. Available from:http://www.ted.com/talks/pavan_sukhdev_what_s_the_price_of_nature.html (Internet AccessRequired) [Accessed 01 May 2012]
The Water Channel (2008) Mangrove forests for coastal restoration. Available from:
http://www.thewaterchannel.tv/index.php?option=com_hwdvideoshare&task=viewvideo&Itemid=4&video_id=52 (Internet Access

WLC Template
file:///E|/Dropbox/WaterHealthNewFinal/Course4/concepts/WH40M070C004ReadingMaterials_EnvironValuation.htm[12/17/2014 12:52:29 AM]
Required)

WLC Template
file:///E|/Dropbox/WaterHealthNewFinal/Course4/discussion/WH40M000D001TitlePage.htm[12/17/2014 12:52:30 AM]
Water And Health
Course 4
SOCIAL PERSPECTIVES ON WATER AND HEALTH
*
WLC Template
file:///E|/Dropbox/WaterHealthNewFinal/Course4/discussion/WH40M010D001overview.htm[12/17/2014 12:52:30 AM]
Water And Health Course 4 - SOCIAL PERSPECTIVES ON WATER AND HEALTH
Overview and Organization
In this course we will examine the social aspect of water – who owns it, how is it used, what problems are attendant with water,how can water be seen and managed as a resource for individuals, families, and communities, and how are water and health inter-related? We have already established that water is essential for human survival and that there is a science and technology thatsupports the use of water for human and animal consumption. But how we use water, how we manage the global supply of water,is based so the value we place on water to in our lives. When water is clean, easily accessible and affordable we pay littleattention to how it is used. When the quantity,, quality or accessibility of our water supply is threatened, as is the norm in manyparts of the world on a regular basis, we becoming increasingly concerned about the social and health implications. How we dealwith these threats depends upon not only our technological abilities, but also on the human dimensions of values, knowledge of theproblem, capacity for change, and the impacts on health that is critical to water management.
To understand the social dimensions we will examine the following:
ethics and human rights issues surrounding water,
social justice and water,
water management approaches, featuring the following: Governance (models and mechanisms, collaborations, scalingwater governance); Key elements of IWRM; Demand side management (the economics of water); and Capacity(individual and institutional)
the integration of water and health concerns, such as: the water-health nexus (introduction to the intersectionbetween water and health); public health; and community engagement
and the challenges of water and health, such as challenges to integration involving monitoring and oversight ( themetrics of water vs health), balancing costs and benefits (watershed management for health and ecosystemsservices), and the ecohealth approach of manageing waersheds for health.
While each of these issues will be tackled individually, it is important to remember that they all interact with and influence eachother.

WLC Template
file:///E|/Dropbox/WaterHealthNewFinal/Course4/discussion/WH40M010D003Ethics.htm[12/17/2014 12:52:30 AM]
Discussion - Water and Ethics
Wrongdoing is a complex phenomenon. Wrongdoing is not itself a cause but it is the consequence of systemic failure or a culturewhich does not put an adequate emphasis on ethical behaviour. The key issue is how public servants can be given support inobserving the highest standards of integrity and ethics in a rapidly changing public sector environment, without undermining themain thrust of public management reforms, which aim to enhance efficiency and effectiveness. A range of tools and processes toregulate against undesirable behaviour are employed and to provide incentives for good conduct. However, there is no singlemethod for constructing an ethics infrastructure in the public service. Rather, a combination of incentives and sanctions areneeded to encourage professional standards of conduct.
Ethics means promoting integrity and preventing wrongdoings. This definition includes the development and maintenance ofinterrelated mechanisms, such as adequate:
Control
Guidance
Management
The consistent combination of these mechanisms:
· Provides suitable incentives for public servants to achieve the aims to which they aspire
· Promotes role models in the public service
· Discourages misconduct by efficient preventive and policing mechanisms
· Is necessary for success
Drawing on experience, a list of the institutions, systems, tools, and conditions that governments use to promote integrity in thepublic sector have been identified. These are necessary elements and functions of a sound ethics infrastructure.
There are many contested normative views about what water is, represents, or what it should be used for:
· Water as a natural resource
· Water as a commodity or economic good allocated through markets
· Water as a property right
· Water as a common good
· Water as a source of life, basic need for humans and ecosystems
· Water as a human right
Each is associated with a different approach to management and governance. The prioritization of each approach is a normative,contested exercise.
The following paragraphs describe the core components of the eight elements of the Ethics Infrastructure and illustrate them withsome selected recent examples:
Political Component
In the absence of sustained political commitment to ethical behaviour in the administration, efforts to encourage suchbehaviour will be in vain. The most recent examples show that attempts to improve public sector ethics have beensponsored at the highest political levels.
Workable Codes of Conduct
Codes of conduct play a vital role in stating the expected standards of behaviour that have reduced the rules applying topublic servants and have adopted more "managerial" styles of public management. A broad public service code of conduct
WLC Template
file:///E|/Dropbox/WaterHealthNewFinal/Course4/discussion/WH40M010D003Ethics.htm[12/17/2014 12:52:30 AM]
from which individual agencies design a purpose-built code to reflect their particular objectives and mission: for exampleAustralia updated its code of conduct in the Public Service Bill 1999. In other countries, codes are all agency-based.
Professional Socialization Mechanisms
However, the content of the codes of conduct or even legal provisions remains simply words on paper, if it is not adequatelycommunicated and inculcated. Socialization mechanisms are the processes by which public servants learn and adopt ethicalnorms, standards of conduct, and public service values. Training (induction and ongoing) is an essential element to raiseethics awareness and develop skills capable of solving ethical dilemmas; good role models (especially managers) also servethis purpose. For example, ethics issues now constitute an integral part of the initial training of future managers in Belgium,while all senior private sector entrants to the civil service in the United Kingdom are required to focus on ethics issues intheir mandatory induction training. in the Czech Republic, the Concept of Public Servants' Training integrated ethics as onemodule in the pre-service and in service training.
Ethics Coordinating Body
These take various forms - parliamentary committees, central agencies, or specially created bodies - and assume variousfunctions: "general promoter" of public sector ethics, a role performed by Norway's Ministry of Labour and GovernmentAdministration and New Zealand's State Services Commission; "counselor and advisor", such as the United States Office ofGovernment Ethics and the Canadian Office of the Ethics Counselor for public office holders in the Executive Branch andthe Office of Values and Ethics for the public service; standing oversight committee like the Committee on Standards inPublic Life in the United Kingdom or "watchdog" including investigation, such as France's permanent anti-corruptioninvestigation commission or the New South Wales independent Commission Against Corruption in Australia. The existenceof a coordinating body should not, however, be construed as absolving departments and managers of the responsibility forensuring ethical conduct within their jurisdictions.
Supportive Public Service Conditions
The high standards of ethical conduct expected of public officials are one side of the coin. The other side is a "package"which provides decent working and living conditions for the "servants of the public". This "package" consists of such basicelements as sufficient job security, opportunities for promotion and career development, fair remuneration or socialappreciation. Fair and impartial human resources management policies can ensure that selection and promotion processesin the public sector are based on general professional requirements and non-discrimination, and those other factors, such asfor example political considerations are minimized, if public servants are feeling underpaid, overworked and insecure, thenthey are less likely to embrace initiatives to improve performance including in the ethical domain.
Effective Legal Framework
The legal framework is the "teeth" of the overall ethics infrastructure. Laws and regulations define the basic standards ofbehavior for public servants and enforce them through systems of investigation and prosecution. In reviewing its legalframework, a country must check that existing criminal codes and civil service laws, conflict of interest statutes and otherregulations which apply to public servants are clear and consistent. Recent efforts include the Japanese law on the ethics ofpublic servants, the country's first such legislation. This law requires the Cabinet to establish a new code of conduct as agovernment order which bans public servants from receiving gifts and/or entertainment from private companies under theirjurisdiction. Furthermore, senior officials in the central government will be required to report gifts or entertainment worthmore than 5 000 yen, with some in higher positions required to report their stock transactions and income as well. The lawdelegates the setting up of the bans on receiving gifts and/or entertainment to a government order. Poland also adopted alaw recently requiring all public officials to declare their financial assets, property and business capital.
Efficient Accountability Mechanisms
Accountability mechanisms should encourage ethical behavior by making unethical activities hard to commit and easy todetect. Accountability mechanisms set guidelines for government activities, for checking that results have been achieved,and for checking that due process has been observed. They include internal administrative procedures (requirements thatactivities or requests be recorded in writing), comprehensive processes such as audits and evaluations of an agency'sperformance, or new forms of procedures such as whistle-blowing (which can encourage public servants to exposewrongdoing committed by others or to say no when asked to do something inappropriate). They might also be external to thepublic service: for example, oversight mechanisms such as legislative or parliamentary committees.
Active Civil Society
Ethics is everybody's responsibility, including that of an assertive media, which through its probing reporting helps citizens toact as watchdog over the actions of public officials. Freedom of information laws guarantee citizen access to public

WLC Template
file:///E|/Dropbox/WaterHealthNewFinal/Course4/discussion/WH40M010D003Ethics.htm[12/17/2014 12:52:30 AM]
information from the late 1960s and they can institutionalize and support public awareness and responsiveness. For example,the United States passed its act in 1967 and Denmark introduced its Freedom of information Act in 1970 while othercountries adopted it more recently as the Czech Republic and Japan in 1999 and drafts are under consideration in theUnited Kingdom and Switzerland.
Why Ethics Now?: Discussion
Public sector organizations with multiple goals always face conflicts that, in theory, require tradeoffs. For example, a commonconflict exists between traditional ethical values and the values imported with private sector methods, such as efficiency,effectiveness or economy. Such conflicting goals have left individual public servants confused about the every day application ofethical standards.
Changes in Public Services Management
Fiscal pressures are most common challenge for public services today. Tighter budgetary resources have forced governments tore-evaluate their programs and priorities for service delivery. They have also rethought what should constitute the core business ofgovernment and what could, or should, be provided by private enterprise or the voluntary sector to increase the cost efficiency ofpublic administration and to broaden the choice available to citizens.
In this context, governments have contested public sector functions while adopting more private sector management methods. Theincreased use of private sector methods has put a greater value on business principles and standards. The results include:
massive privatization, as found in Canada and the United States;increased contracting out, consultancy work and partnership arrangements with the private sector, as found in New Zealand;radical restructuring in the civil service, as found in Ireland, New Zealand;downsizing, as found in the United States; andwage freezes for public servants, as found in Canada.
In general, however, the most crucial element of this reform has been the shift from detailed regulations to performancemanagement. This new type of public service management reduces government control and provides administrators with theflexibility:
to manage people and resources in ways that are both creative and tailored to match particular business plans, andto achieve the outcomes sought by the government.
A recent example of performance management is the new Australian Public Service Act. Passed by the Parliament in October1999, this Act repealed the former regulations that had more technical and prescriptive details and were four times larger. The new,principles-based law authorizes agency heads to determine recruitment, pay and employment conditions of staff. Thus, theseagency heads have power similar to the private sector heads, except where there are public policy reasons not to do so.
Problems with Performance Management
Confusion in Applying Ethical Values
Unfortunately, both the increase in flexibility and in contacts with private firms have resulted in a fragmented public serviceenvironment, where the understanding of principles and practices, including the application of ethical values and standards, candiffer significantly.
For example, the acceptance of gifts, benefits and hospitality has become a particularly sensitive question. Even if it is againstpolicy, public servants tend to accept these items when they feel they are not harming anyone and there will not be anyconsequences.
Reduction of Accountability
This new type of management also reduces the traditional control mechanisms that maintain standards and accountability. In otherwords, without a legal and institutional environment that controls the risk of misconduct, public servants are more susceptible toexternal pressures. Public institutions are especially vulnerable to misconduct if transparency is insufficient during such processesas:

WLC Template
file:///E|/Dropbox/WaterHealthNewFinal/Course4/discussion/WH40M010D003Ethics.htm[12/17/2014 12:52:30 AM]
public decision-making, as was found in Korea;the provision of hospital services, as was found in Greece; orthe massive decentralization of public services, as was found in France, Hungary, and Poland.
Conflicts of Interest
Opening up the administration has also meant a greater opportunity for horizontal movement between the private and publicsectors. In particular, recruitment from the private sector to management positions exposes the collision between private and publicsector values.
Several countries, such as Spain and Sweden, noted that ancillary work increases the possibility of conflicts of interest betweenpublic duties and private interests and may be detrimental to the employer/employee confidence. Moreover, the publicitysurrounding their conflicts of interest badly affected the image of the entire public service.
All the above-mentioned public management reforms have been identified as the main causes of the crisis in values for thetraditional administration of government business.
To help the public service to meet more complex social and economic challenges, pressures and demands, countries haveintroduced substantial reforms in the way their central administrations operate.
Decisive Environment
A country's social, political, and economic environment directly influences working conditions in the public service.
The Economic Environment
The decreasing value of public salaries and the disparity in income between the private and the public sector has caused majorproblems for countries such as the Czech Republic, Hungary, Mexico, Poland, and Portugal. Together with an increasing workload,this disparity in income has reduced the prestige of the public service and caused a high number of people to leave its ranks.
Consequently, higher salaries and less attention to ethical standards are a great incentive for experienced and skilled officials toleave the public for the private sector. This movement is so prevalent that a dedicated word exists in France to describe whensenior officials move to the private sector for higher salaries: pantouflage.
The Political Environment
The political environment directly affects the functioning of the public service. Partisanship and political patronage are a concern inpublic service management. Forms of partisanship and political patronage include:
maintaining the political spoil system in state-owned banks, as found in Iceland;misusing public resources as a result of political pressures, as found in Turkey; andappointing people to public offices on the basis of political affiliations.
Situations in which officials return to permanent civil service positions after serving in political positions, such as minister or statesecretary, have also caused concerns in countries such as Norway.
The development of a supportive culture, based on agreed-upon values, norms and transparency, plays a crucial role inmaintaining a high level of integrity in the public service. In other words, politicians should act as role models of ethical leadership.Public management reforms can also strengthen the boundaries between politics and the strategic management of resources.
The Social Environment
In addition to the previously-mentioned changes in public services management, there has been a substantial increase in society'sexpectations regarding public servants' behaviour and performance. The public has become more conscious of ethical issues anddilemmas. In countries such as Australia, Canada and the United States, the private sector has also become more aware of ethicalquestions and has looked to the public service to help enforce expected behaviour.
In some cases, however, traditional social values may conflict with the principles of a modern merit-based public service. Forexample, the traditional value of assisting family and friends is now negatively labelled nepotism in most countries.
Countries in transition have to face rapidly changing political, social and economic environments. These changing environmentsultimately transform fundamental social values, legislative frameworks, and the make-up of institutions. Unfortunately, all of these

WLC Template
file:///E|/Dropbox/WaterHealthNewFinal/Course4/discussion/WH40M010D003Ethics.htm[12/17/2014 12:52:30 AM]
changes contribute to uncertainty about expected behaviour in the public service.
Models for Ethics:
Governments take two general approaches to the task of improving ethical conduct in the public service.
One approach focuses on strict compliance with descriptive administrative procedures, control mechanisms and detailed ruleswhich define what public servants should avoid, what they should do, and how they should do it. This is known as compliance-based ethics management.
The other approach, based on aspirations, relies on incentives and encourages good behaviour rather than policing and punishingerrors and wrongdoing. This approach is termed as integrity-based ethics management. However, international trends in ethicsmanagement reveal common directions despite the varying political, administrative and cultural diversity across countries.
The areas of greatest concern to governments are those where the private sector comes into contact with public officials exercisingdiscretion. The most common measures employed against corruption in the public sector include criminal and other legal sanctions,increasingly supplemented by greater transparency (conflict of interests regulation and disclosure policy) and control. Methods forevaluating the effectiveness of anti-corruption measures are less well-defined and largely take the form of reporting or periodicinspection.
Question
You chair the planning committee in your community. An American NGO has offered to build a new hospital in your community toserve an area with a population of 10,000 people. The site on which they propose to build the hospital is not part of any municipalwater system, nor does it have access to the local power grid. What ethical questions do you need to ask in making your decisionabout whether or not to accept this offer?

WLC Template
file:///E|/Dropbox/WaterHealthNewFinal/Course4/discussion/WH40M020D001WaterHuman%20Right.htm[12/17/2014 12:52:30 AM]
Water and Health - Human Rights and Social Justice
Human Rights
All human beings are born free and equal in dignity and rights. They are endowed with reason and conscience and should acttowards one another in a spirit of brotherhood. (UN Declaration of Human Rights, 1945)
Human rights are rights inherent to all human beings, whatever our nationality, place of residence, sex, national or ethnic origin,colour, religion, language, or any other status. We are all equally entitled to our human rights without discrimination. These rightsare all interrelated, interdependent and indivisible. (http://www.ohchr.org/en/issues/pages/whatarehumanrights.aspx). (InternetAccess Required)
By their very nature human rights are: universal and inalienable; interdependent and indivisible; equal and non-discriminatory; bothrights and obligations.
Water as a Human Right
Water is a source of life and required to fulfil other basic human needs (e.g. personal hygiene, food preparation). Everyone isentitled to sufficient, safe, affordable, culturally acceptable, physically accessible water delivered in participatory non-discriminatorymanner.
Water right: an expression of agreement about the legitimacy of the right-holder’s claim to water which must exist withinthe group of claimants and also be recognized by those excluded from its use.
The legitimacy of claims is linked to different social relations of power and authority (e.g. state legislation, local rulesestablished by traditions and community organizations, etc.Increasing accountability of public and private sector through legally binding obligations.
Water as a Human Right
Given that water is a source of life and required to fulfil other basic human needs (e.g. personal hygiene, food preparation) it isargued that the right to water and sanitation should be fundamentally considered a human right of which people are entitled,enshrined in law and national constitutions (de Albuquerque, 2012; Boyd, 2011).
This would entitle everyone to water that is:
· Sufficient in quantity (estimates vary anywhere from 50-100 litres/per capita/day
· Safe (e.g. based on water quality guidelines by the World Health Organization)
· Affordable
· Culturally acceptable
· Physically accessible (e.g. issues of personal security for women, accessible for those with disabilities)
· Delivered in a participatory, accountable, transparent, non-discriminatory manner
(Adeel, 2012; de Albuquerque, 2012)
Benefits of treating water as a human right include:
· Providing a legal framework for holding States accountable for delivering these services
· Assisting in clarifying how and where financial and water resources should be prioritized internationally and nationally
· Enhancing access to information and public participation in decision-making
· Empowering marginalized citizens, communities and groups to be better represented in decision-making (e.g. women, ethnicand racial minorities, children, slum dwellers, those with disabilities)
· Preventing systematic discrimination

WLC Template
file:///E|/Dropbox/WaterHealthNewFinal/Course4/discussion/WH40M020D001WaterHuman%20Right.htm[12/17/2014 12:52:30 AM]
· Enabling methods of recourse when rights are denied
· Increasing accountability of public and private sector through legally binding obligations, enhanced enforcement, etc.
(Adeel, 2012; Boyd, 2011)
International Progress & Role of International Law
Catarina de Albuquerque was appointed by the United Nations Human Rights Council in September, 2008 to serve as the first UNSpecial Rapporteur on the right to safe drinking water and sanitation. She was charged with the task of defining, identifying,analyzing and reporting good practices on the implementation of the rights to water and sanitation which culminated in a book “Onthe Right Track” released in 2012. Much of what is summarized in the following sections is attributed to her work.
All human rights can be traced back to the Universal Declaration of Human Rights (UDHR), adopted in 1948 by the United NationsGeneral Assembly.
Universal Declaration of Human Rights:
Has no independent legally binding force
States general human rights principles and standards
Was followed by the adoption of two Conventions dealing with specific groups of rights
International Covenant on Civil and Political Rights (ICCPR) (1966)
International Covenant on Economic, Social and Cultural Rights (ICESCR) (1966)
Collectively the UDHR, the ICCPR and the ICESCR with their optional protocols form the International Bill ofHuman Rights
United Nations General Assembly and the Human Rights Council as well as independent expert committees incharge of monitoring compliance by state parties have defined human rights in more detail and specificity overtime
International human rights law now more protective of specific individuals and groups and covers awider range of issues
When the UN Declaration of Human Rights was first adopted in 1948 the human right to water and sanitation was not explicitlyincluded in its text. As de Albuquerque (2012) explains this must be understood in the context of the world at that time:
Colonialism was widespread
Many countries lacking access to water and sanitation were not represented at the negotiating table
Civil society was less politically engaged
Countries were less urbanized (i.e. lack of water and sanitation in urban areas was not as major of an issue asit is now)
However, over the second half of the twentieth century water and sanitation crises and related health and economic consequencesbecame far more evident garnering the attention of the human rights community. Consequently several of the more recentinternational human rights treaties and agreements make explicit reference to the importance of water and/or sanitation in realisinghuman rights including:
Convention on the Elimination of All Forms of Discrimination Against Women (CEDAW) (1979)
Convention on the Rights of the Child (CRC) (1990)
Declaration on the Rights of Indigenous Peoples (2007)
Convention on the Rights of Persons with Disabilities (CRPD) (2008)
Additionally in 2002, the Committee for Economic, Social and Cultural Rights, the body responsible for monitoring State compliance
WLC Template
file:///E|/Dropbox/WaterHealthNewFinal/Course4/discussion/WH40M020D001WaterHuman%20Right.htm[12/17/2014 12:52:30 AM]
with the ICESCR, adopted General Comment No. 15 on the right to water. General comments are authoritative interpretations thatclarify the content of rights and used in the monitoring of States parties’ compliance. General Comment No. 15 found that the rightto water is implicitly included in the right to an adequate standard of living, right to adequate housing, right to the highest attainablestandard of health, and the right to life. The recognition of water and sanitation as human rights was re-affirmed by the UN GeneralAssembly’s Resolution 64/292 in July 2010, and by the Human Rights Council’s Resolution 18/1 in September 2010 (deAlbuquerque, 2012; Adeel, 2012).
International law, conventions and agreements serve many functions and are important for the following reasons:
Provide a framework of rules and standards that facilitate international cooperation
Serve as a basis for governments to monitor one another
Provide a framework for assessing national legislation by exposing gaps between national and internationalstandards
Provide a guide for governance reforms
Serve as a tool for rights-holders and civil society groups to hold their governments accountable by providing alegal context to demand change (e.g. can serve as legal arguments before court proceedings)
(Water Governance Facility, nd)
National Law & Progress
While international support for water and sanitation rights is essential, the actual realization and implementation of these rights isdependent upon nation-states. State parties must not only explicitly recognize these rights through ratifying international treaties,but incorporate their principles into domestic legal systems, national constitutions and policy (de Albuquerque, 2012)
National Level Recognition of the Right to Water
Countries with existing constitutional protection: Dominican Republic, Kenya, South Africa, Uruguay, Democratic Republic of Congo,Bolivia, Ecuador, Kenya, The Maldives, Nicaragua, South Africa, Uruguay. Countries with legal system upholding the right to water:Argentina, Belgium, Brazil, Costa Rica, Colombia, India, Indonesia, Israel, Nepal, Pakistan
Many countries recognize the ‘right to water’ in national legislation or policy: Algeria, Angola, Argentina, Bangladesh, Belarus,Belgium, Brazil, Burkina Faso, Cameroon, Central African Republic, Costa Rica, Dominican Republic, Finland, France, Germany,Ghana, Guatemala, Guinea, Honduras, Indonesia, Latvia, Luxembourg, Madagascar, Mauritania, Namibia, the Netherlands,Norway, Paraguay, Peru, Portugal, Romania, Russia, Senegal, Spain, Sri Lanka, Tanzania, Ukraine, and Venezuela
(Source: Adapted from Adeel, 2012, with de Albequerque, 2012)
Many other actors (e.g. donor states, international agencies, NGOs, development banks, private enterprises, civil society, etc.) canassist the state in achieving their goals of universal water access through various means (e.g. financial aid, research and expertise,enhancing planning and management capacity, monitoring, etc.). However the State is responsible for ensuring necessary politicalwill and an enabling environment for the delivery of services. It does not necessarily have to provide the services but it must makeprovision for acceptable water to be delivered in an accessible, affordable, and equitable fashion through public, private, or mixedmeans (2012).
The right to water and sanitation is subject to the principle of “progressive realization”, which means that states must take concreteand targeted steps to meet their treaty obligations, while recognizing that full realization is a long-term process shaped by technical,economic and political constraints (de Albequerque, 2012).
de Albequerque (2012) concludes that the strongest domestic legal frameworks typically exist within countries where explicitrecognition of the right to water is mentioned within the national constitution (the principal legal instrument describing therelationship between the State and citizens, and the roles and responsibilities of each). Recognition at this level provides a criticalreference point for policymakers, government ministries, judicial bodies and civil society. It also assists in making governments andother important actors more accountable. Statutory frameworks serve as the foundation for new policy initiatives and regulatoryentities whether independent bodies or government ministries responsible for designing, monitoring and enforcing standards, rulesand regulations.
Key elements of legislation include:
WLC Template
file:///E|/Dropbox/WaterHealthNewFinal/Course4/discussion/WH40M020D001WaterHuman%20Right.htm[12/17/2014 12:52:30 AM]
A policy statement outlining key principles, short and long-term objectives
The identification of key agencies, institutional roles, functions and responsibilities
Targets or guidelines regarding water quality and quantity
Timelines for implementation of objectives
Requirements for reporting, monitoring, surveillance and data access
Enforcement powers and penalties for violation, etc.
In addition to legislation specifically related to the water sector, broader accountability mechanisms such as transparency laws andfreedom of information laws are also important for ensuring integrity and policies that do not result in direct or indirect discriminationor privileging of certain groups over others. The Water Governance Facility suggests that such mechanisms be coupled with theempowerment of government ombudsmen or other independent bodies responsible for auditing and preventing corruption andmismanagement (nd). National and international watchdogs and NGOs can also play an important role in facilitating access toinformation and building public awareness around rights and entitlements particularly for marginalized groups.
Critique and Implementation Challenges
One of the biggest critiques of “rights talk” is that declaring water as a human right does not equate to practical changes on theground (Adeel, 2012). Even in some circumstances where it is enshrined in national constitution, inequities in water distribution andprovision can persist (Bakker, 2007). Challenges and critiques towards the implementation of a human rights framework are vastand include:
Insufficient political prioritization or conflict with other development and economic priorities
Lack of good governance
accountability for commitments,
transparent, participatory budgeting, contracting, decision-making
sufficient or predictable financing, institutional support and human resources particularly over the long term (e.g. forpolicy development, participatory processes, information generation, infrastructure construction, operation,maintenance, regulation, monitoring, evaluation, etc.)
sufficient advocacy
minimal corruption, monopolies, or conflicts of interest
Water scarcity (which may worsen with climate change)
Increases in demand
Great difficulty in regulating, monitoring and providing services to “informal” settlements or slums, and/or unwillingness overfear of encouraging illegal land occupation
Can complicate implementation of rational pricing or accounting of ecological externalities (could result in greater degradationof hydrological systems)
(Adeel, 2012; de Albequerque, 2012; Bakker, 2007)
Measuring and Facilitating Good Governance (The Urban Governance Index)
The Urban Governance Index (UGI) is a transnational initiative developed by the Global Campaign on Urban Governance, theGlobal Urban Observatory and UN-HABITAT to measure, support and improve the quality of inclusive local governance. It is aself-assessment and capacity-building tool aimed at assisting with gathering information and initiating multi-stakeholder debate onpolicy, development and decision-making priorities. The UGI has been adapted and applied in 24 cities across the world in severaldifferent countries, including Somalia, Sri Lanka, Zimbabwe and Mongolia. The Index criteria and variables seek to identify

WLC Template
file:///E|/Dropbox/WaterHealthNewFinal/Course4/discussion/WH40M020D001WaterHuman%20Right.htm[12/17/2014 12:52:30 AM]
· Urban decision-making processes and mechanisms,
· The methods and institutions through which stakeholders voice their claims and rights, deliberate, negotiate, setcommitments and targets
· Quality of relationships between key stakeholders
· Instruments for improving equity, etc.
For more information see: http://www.unhabitat.org/content.asp?typeid=19&catid=25&cid=2167 (Internet Access Required)
The Urban Governance Index (UGI) (Taylor, 2006)
Social Justice – Equity and EqualityEquity describes access to just, impartial, and fair social benefits and responsibilities. Resources are supplied based on need. Minimally, social equality includes legal and property rights and access to social goods and services. It may include health andeconomic resources as well as access to opportunities and the burden of obligations.
Equality describes sameness – that everyone, regardless of need, has access to the same social benefits and responsibilities.
Social Justice describes policies and practices that are both equitable and equal. Because of their extraordinary circumstances,social justice enhances the circumstances of the poor, women, children, and those with disabilities. It attempts to rebalance thedistribution of goods and services to give people with structural disadvantages more opportunity to lead health, happy, fulfilling livesprotected by the social contracts of law and resource redistribution – “to level the playing field”.
Challenges of Pluralist Governance

WLC Template
file:///E|/Dropbox/WaterHealthNewFinal/Course4/discussion/WH40M020D001WaterHuman%20Right.htm[12/17/2014 12:52:30 AM]
Pluralism argues that power is spread among many different groups within society that bargain, compete and compromise to shapepolicy and decision-making so that no one set of interests dominates or controls all governance processes and decisions. Legalpluralism refers to multiple legal systems within one geographic area
· As scales and trends of governance and relationships of power shift, state and customary laws, norms and codes of conductcome to exist side by side, often in contradiction with one another
· The world banking and donor community and many central governments favour uniform laws that uphold private enterprise,market logic, and deregulation. Diverse community-based approaches can be seen as a threat or obstruction to inter-regional orinternational transfers and trade, private investments and profits
· Indigenous, peasant and other community-based groups may view imposed uniformity as a threat to their traditional systems ofmanagement and customary codes of conduct thereby favouring locally-specific water rules and rights
· Indigenous and peasant communities and unique system of governance practices have been overlooked within globalizingwater development agendas
· Legislation has been introduced without consideration of historical heritage, local knowledge, systems of management, anddifferent social and ecological contexts
· In the past decade indigenous and other local community movements have adopted new strategies for gaining power tocompete with large private and state interests through linking local protests to others unfolding nationally and internationally (see: “Water Law and Indigenous Rights, (WALIR) program, http://www.cepal.org/drni/proyectos/walir/doc/walir1.pdf ) (Internet AccessRequired)
"We live in a system that espouses merit, equality, and a level playing field, but exalts those with wealth, power, and celebrity,however gained." (Bell, 2002)
Question
As the head of and NGO you discover that the majority of girls in your community are leaving primary school when they are 11years old. The school does not have a reliable supply of water and the children use an old bush latrine as a toilet. The Ministry ofEducation demands to know why this is happening in your district and not in another adjacent district where the school has bothwell water and upgraded latrine facilities. Why do you consider this to be an important issue in your community and what issueswill you explore in trying to find out why this is happening?

WLC Template
file:///E|/Dropbox/WaterHealthNewFinal/Course4/discussion/WH40M020D005WaysKnow.htm[12/17/2014 12:52:31 AM]
WATER AND HEALTH - WAYS OF KNOWING
Introduction of Key Concepts & Justification of their Importance
Given the many different, and often conflicting objectives, values and priorities of water governance many controversies are closelyrelated to the discrepancies in knowledge that different actors possess and mobilize to support their positions (Van Buuren, 2009).The ways in which actors advocate and defend their positions is highly dependent upon their knowledge and what they define aslegitimate, relevant and credible (or not) (Edge & Eyles, in press). Knowledge discrepancies can result in various forms of conflictand fragmentation in governance processes due to differences in actors’ underlying epistemologies or “ways of knowing” (VanBuuren, 2009).
Thus managing and integrating knowledge, and enhancing different stakeholders’ awareness of how others “know about” and makesense of water problems is integral to reducing controversy within collaborative governance. Solutions to water problems requirenew ways of knowing that forge coherence amongst multiple claimants (Lejano & Ingram, 2009).
WAYS OF KNOWING
Epistemology: the study of the nature and scope of knowledge, meaning and understanding, including what knowledge is acquiredand how this relates to beliefs, and justifies notions of “truth”
Within academic literature scholars often refer to different “ways of knowing”. Epistemology/ways of knowing shape:
· How a policy problem is experienced
· How governance stakeholders investigate and interpret the elements of a policy problem
· How stakeholders make sense of important relationships within a policy problem
· Which and whose “facts” are deemed valid and relevant
· How a problem is acted upon and solutions devised
· Which relationships and institutional arrangements actors develop and maintain
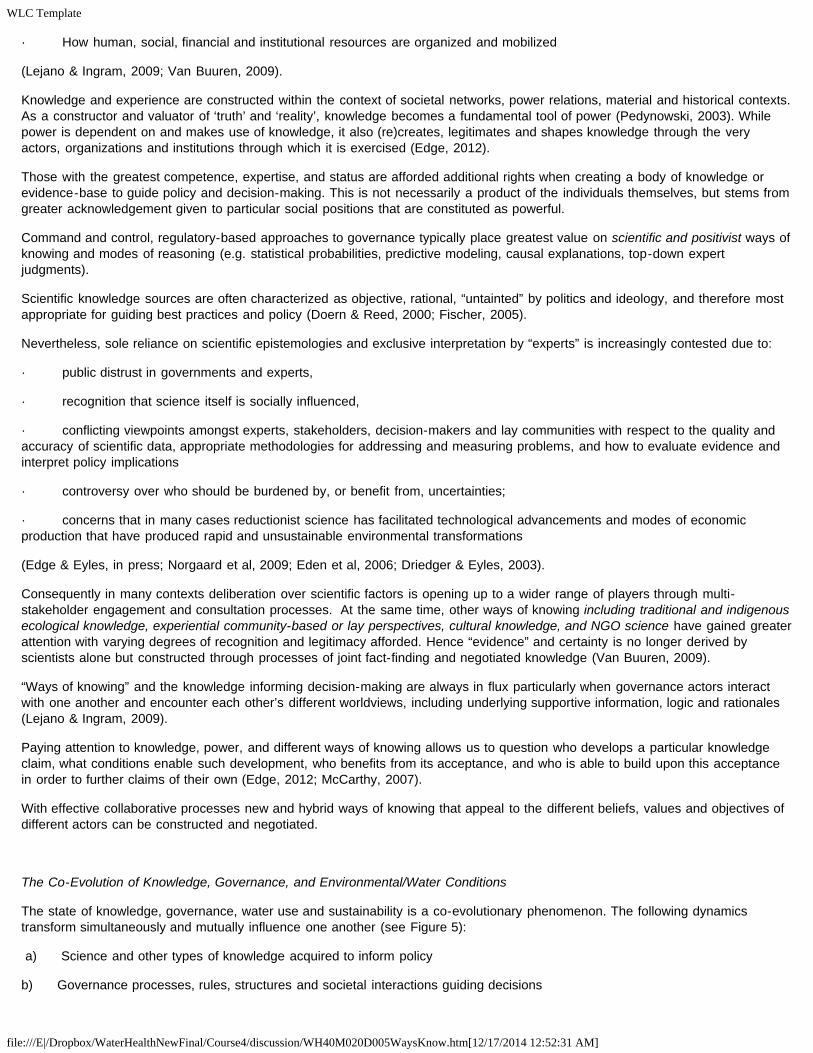
WLC Template
file:///E|/Dropbox/WaterHealthNewFinal/Course4/discussion/WH40M020D005WaysKnow.htm[12/17/2014 12:52:31 AM]
· How human, social, financial and institutional resources are organized and mobilized
(Lejano & Ingram, 2009; Van Buuren, 2009).
Knowledge and experience are constructed within the context of societal networks, power relations, material and historical contexts.As a constructor and valuator of ‘truth’ and ‘reality’, knowledge becomes a fundamental tool of power (Pedynowski, 2003). Whilepower is dependent on and makes use of knowledge, it also (re)creates, legitimates and shapes knowledge through the veryactors, organizations and institutions through which it is exercised (Edge, 2012).
Those with the greatest competence, expertise, and status are afforded additional rights when creating a body of knowledge orevidence-base to guide policy and decision-making. This is not necessarily a product of the individuals themselves, but stems fromgreater acknowledgement given to particular social positions that are constituted as powerful.
Command and control, regulatory-based approaches to governance typically place greatest value on scientific and positivist ways ofknowing and modes of reasoning (e.g. statistical probabilities, predictive modeling, causal explanations, top-down expertjudgments).
Scientific knowledge sources are often characterized as objective, rational, “untainted” by politics and ideology, and therefore mostappropriate for guiding best practices and policy (Doern & Reed, 2000; Fischer, 2005).
Nevertheless, sole reliance on scientific epistemologies and exclusive interpretation by “experts” is increasingly contested due to:
· public distrust in governments and experts,
· recognition that science itself is socially influenced,
· conflicting viewpoints amongst experts, stakeholders, decision-makers and lay communities with respect to the quality andaccuracy of scientific data, appropriate methodologies for addressing and measuring problems, and how to evaluate evidence andinterpret policy implications
· controversy over who should be burdened by, or benefit from, uncertainties;
· concerns that in many cases reductionist science has facilitated technological advancements and modes of economicproduction that have produced rapid and unsustainable environmental transformations
(Edge & Eyles, in press; Norgaard et al, 2009; Eden et al, 2006; Driedger & Eyles, 2003).
Consequently in many contexts deliberation over scientific factors is opening up to a wider range of players through multi-stakeholder engagement and consultation processes. At the same time, other ways of knowing including traditional and indigenousecological knowledge, experiential community-based or lay perspectives, cultural knowledge, and NGO science have gained greaterattention with varying degrees of recognition and legitimacy afforded. Hence “evidence” and certainty is no longer derived byscientists alone but constructed through processes of joint fact-finding and negotiated knowledge (Van Buuren, 2009).
“Ways of knowing” and the knowledge informing decision-making are always in flux particularly when governance actors interactwith one another and encounter each other’s different worldviews, including underlying supportive information, logic and rationales(Lejano & Ingram, 2009).
Paying attention to knowledge, power, and different ways of knowing allows us to question who develops a particular knowledgeclaim, what conditions enable such development, who benefits from its acceptance, and who is able to build upon this acceptancein order to further claims of their own (Edge, 2012; McCarthy, 2007).
With effective collaborative processes new and hybrid ways of knowing that appeal to the different beliefs, values and objectives ofdifferent actors can be constructed and negotiated.
The Co-Evolution of Knowledge, Governance, and Environmental/Water Conditions
The state of knowledge, governance, water use and sustainability is a co-evolutionary phenomenon. The following dynamicstransform simultaneously and mutually influence one another (see Figure 5):
a) Science and other types of knowledge acquired to inform policy
b) Governance processes, rules, structures and societal interactions guiding decisions

WLC Template
file:///E|/Dropbox/WaterHealthNewFinal/Course4/discussion/WH40M020D005WaysKnow.htm[12/17/2014 12:52:31 AM]
c) Environmental conditions
Water problems are extremely complex and therefore experts, stakeholders and decision-makers grappling with these problemstend to focus on certain social and ecological interactions and other factors of importance, while ignoring others (that may beequally important) (Norgaard et al, 2009).
It is important to reflect upon the role of research and knowledge in informing collective actions and the governance process(Hattingh et al, 2007). This includes how “we” as researchers, practitioners, decision-makers and organizational networks askquestions, organize data and information, pay attention to particular relationships at the exclusion of others, etc. This is interwovenwith prevailing political objectives, patterns of social and economic organization, who and which ways of knowing are mostdominant and/or accepted at any given time, and the availability of resources, data and technology to stakeholders and decision-makers.
As Norgaard et al (2009) summarize science and governance inquiries can only describe the aspects of the environment on whichthey focus, and this focus reflects prevailing values and concerns. The way in which water and other aspects of the environmentchange is interdependent with how stakeholders perceive, analyze and respond through governance initiatives.
At the same time, environmental conditions themselves (e.g. water scarcity, quality, hydro-climatic variability, etc.) shape the“stakes” and context within which political actors operate, determining what they value, become most concerned about, and hencewhat information they focus on and draw from.
Different Types of Knowledge Needed for Water Governance & Management
Awareness is growing about the different kinds of information, “ways of knowing”, and learning needed for addressing waterresource dilemmas. Examples include:
Knowledge about the Earth’s life support systems, ecological services, natural and biophysical processes
Knowledge about the effects and nature of anthropogenic activities and sustainable alternatives
Knowing when and how to intervene, and how to utilize and develop supporting institutions, rule systems, and legislation

WLC Template
file:///E|/Dropbox/WaterHealthNewFinal/Course4/discussion/WH40M020D005WaysKnow.htm[12/17/2014 12:52:31 AM]
Knowing how to manage projects, human and financial resources
Knowing how to facilitate multi-stakeholder negotiations, conflict resolution and consensus-building
(Blackmore, 2007)
Pahl-Wostl et al (2007) distinguish between a) knowledge associated with acquiring, processing and applying “factual information”;and b) knowledge associated with solving management and social relations problems. Van Buuren (2009) speaks of knowing“what” (reality judgments), “why” (value judgments), and “how” (action judgments), which require quests for certainty, consensus,and competence.
Scientists from different disciplines and multiple stakeholders are increasingly coming together to better understand each other’svantage point and unique contribution through integrated knowledge production and governance processes. Each has their ownbody of knowledge, way of knowing, values and beliefs about what is important and relevant. Through working together they areable to challenge their own assumptions and collectively make judgments about water resource and ecological systems in ways thatno group would be able to do individually (Norgaard et al, 2009). Many refer to these processes as practices of “social learning”.
Social Learning & Collaborative Governance
Several key characteristics and goals of social learning within collaborative natural resource governance have been identified:
Convergence of goals, criteria and knowledge amongst governance actors and stakeholders
Development of accurate mutual expectations
Building relations of trust and respect for each other’s knowledge contributions & perspectives
Becoming more conscious of the embedded assumptions and presumed certainties associated with different groups of actorsand ways of knowing
Collaborative engagement in joint fact finding, participatory interpretation, consensus building, and collective decision-making
Co-creation of new and hybrid knowledge to better understand issues and practices
Changes in behaviours, norms and procedures through creation of new understanding
Learning from and adapting to past experiences
(Blackmore, 2007; Pahl-Wostl, 2007; Norgaard et al, 2009; Van Buuren, 2009)
Each perspective and “way of knowing” develops new and added meaning upon interaction with the different perspectives of others.New meanings or “higher level” ways of knowing are created through discursive dialogue, translation and exchange (Lejano &Ingram, 2009). This must occur at the individual, organizational, and institutional level (Van Buuren, 2009).
The legitimacy of a governance process and organizational framework is in large part dependent upon the extent to which aplurality of interpretations are recognized through processes that enable inclusive and equitable dialogue, interaction and knowledgeexchange. This is thought to be necessary if a consensus is to be reached on how to define a policy problem, and evaluate factualknowledge to inform interventions (Van Buuren, 2009).
· Centralized decision-making, privatization, rigid bureaucratic systems, poor public access to information, and lack of politicaltransparency have been shown to impede social learning (Pahl-Wostl, 2007)
· Arrangements allowing for stakeholders and policy-makers to work in tandem with experts to get to know one another,discuss research questions, clarify information needs, methodological approaches, interpretations and results facilitate sociallearning, and the robustness, “convincingness” or “acceptability” of evidence (Van Buuren, 2009)
· Such arrangements are often referred to as boundary organizations or hybrid institutions (Edge & Eyles, in press; Guston,

WLC Template
file:///E|/Dropbox/WaterHealthNewFinal/Course4/discussion/WH40M020D005WaysKnow.htm[12/17/2014 12:52:31 AM]
2001; Miller, 2001; Bal et al, 2004). An independent facilitator or “knowledge broker” can often play an important role in facilitatingprocesses of mutual learning, negotiation, and self-reflection within boundary arrangements (Van Buuren, 2009; Van Kammen et al,2006)
· Having leadership dedicated to implementing deliberate and well-considered strategies for facilitating social learning isimportant for stimulating and influencing other actors. However social learning cannot be enforced or dictated. Governanceparticipants themselves must be committed to the “work” involved in understanding other ways of knowing and overcomingdifferences which includes a willingness to change their perspectives, share knowledge, and make trade-offs (Van Buuren, 2009;Simms & Loë, 2010).
Questions
1. What does the expression “knowledge is power” mean to you?
2. What are three types of knowledge that someone needs to competent in water governance and management?
3. How is collaborative governance similar to/different from other forms of governance?
4. Under what circumstances would you support a collaborative governance model in relation to water governance?

WLC Template
file:///E|/Dropbox/WaterHealthNewFinal/Course4/discussion/WH40M030D001Governance.htm[12/17/2014 12:52:31 AM]
GOVERNANCE
Defining Governance
The word governance derives from the Greek verb kubernáo which means to steer and was adopted to denote the mechanismsthrough which the “steering” of a group or society is achieved.
Governance, therefore, refers to the set of practices, regulatory processes, rule systems, mechanisms of authority, andorganizations through which political actors influence: i) policy actions, ii) the allocation of resources, iii) who becomes empoweredin decision-making, iv) related outcomes, etc. (Dean, 1999; Lemos & Agrawal, 2006; World Bank, 2006).
Practices of governance are not limited to the actions and conduct of nation-states, but also other institutions and actors (e.g.representatives from governmental, non-governmental, private sector, civil society, scientific organizations, etc.). These governanceactors possess different knowledge assumptions, norms, beliefs, and resources which collectively shape their degree of influenceover others, and upon policy and decision-making processes.
Introduction & Definition of Water Governance
While many solutions to contemporary water challenges are technological in nature (e.g. improved industrial processes for waterconservation, reduction in effluents, etc), many threats are closely associated with institutional and behavioural problems (e.g.fragmented authority, limited capacity, etc.) (Simms & de Loë. 2010). Changes in human activities, values, conduct and behaviourare required leading to the widespread belief that solutions to threats to water quality and availability are largely contingent upon thecreation and implementation of innovative, effective, equitable and improved governance strategies (Water Governance Facility, nd).
Ultimately water governance determines who gets water, when and how. The study and practice of water governance is thereforeconcerned with the social, political and economic processes and institutions through which societies are organized to makedecisions and take actions to accomplish goals that affect water resources and how societies interact with them (Simms & de Loë,2010; Water Governance Facility, nd; Pahl-Wostl et al, 2007)
The utility of an analysis of governance lies in its ability to explain:
i. the type of authority or agency involved in shaping societal behaviours and attitudes
ii. the forms of knowledge and techniques depended upon for decision justification
iii. how governed ‘entities’ are conceived
iv. the value intentions underlying political objectives; and
v. the consequences that arise from resulting decisions (Edge, 2012; Dean, 1999).
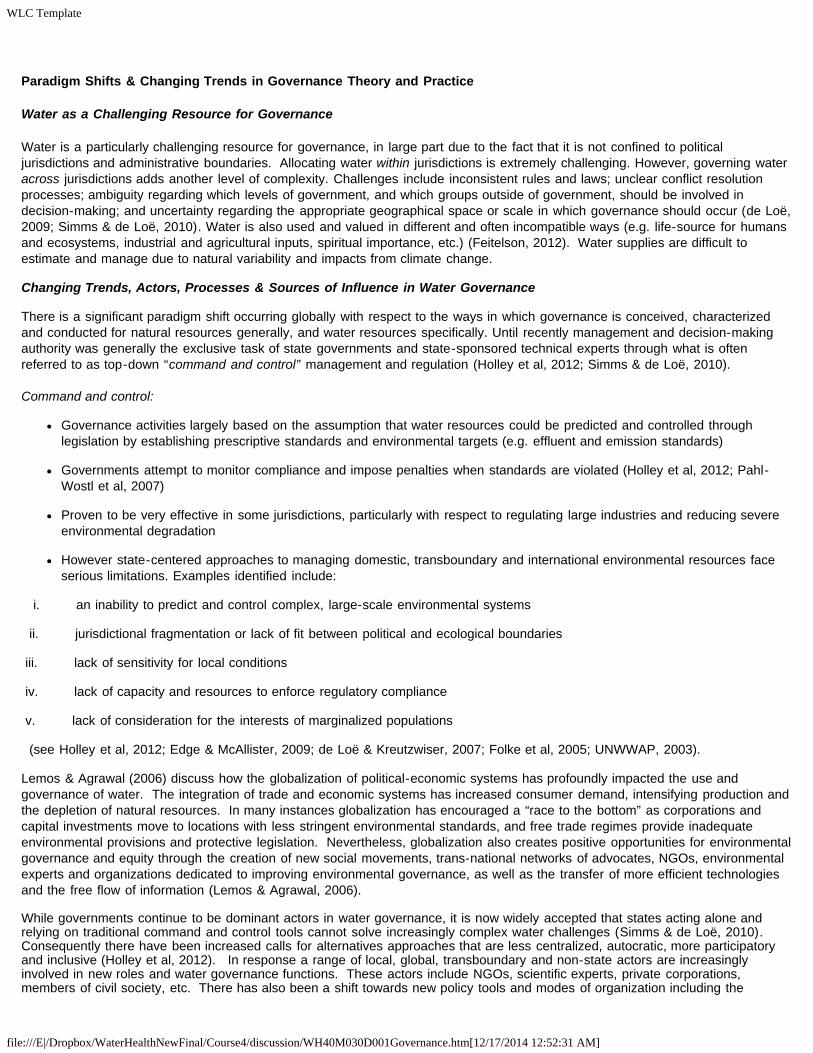
WLC Template
file:///E|/Dropbox/WaterHealthNewFinal/Course4/discussion/WH40M030D001Governance.htm[12/17/2014 12:52:31 AM]
Paradigm Shifts & Changing Trends in Governance Theory and Practice
Water as a Challenging Resource for Governance
Water is a particularly challenging resource for governance, in large part due to the fact that it is not confined to politicaljurisdictions and administrative boundaries. Allocating water within jurisdictions is extremely challenging. However, governing wateracross jurisdictions adds another level of complexity. Challenges include inconsistent rules and laws; unclear conflict resolutionprocesses; ambiguity regarding which levels of government, and which groups outside of government, should be involved indecision-making; and uncertainty regarding the appropriate geographical space or scale in which governance should occur (de Loë,2009; Simms & de Loë, 2010). Water is also used and valued in different and often incompatible ways (e.g. life-source for humansand ecosystems, industrial and agricultural inputs, spiritual importance, etc.) (Feitelson, 2012). Water supplies are difficult toestimate and manage due to natural variability and impacts from climate change.
Changing Trends, Actors, Processes & Sources of Influence in Water Governance
There is a significant paradigm shift occurring globally with respect to the ways in which governance is conceived, characterizedand conducted for natural resources generally, and water resources specifically. Until recently management and decision-makingauthority was generally the exclusive task of state governments and state-sponsored technical experts through what is oftenreferred to as top-down “command and control” management and regulation (Holley et al, 2012; Simms & de Loë, 2010).
Command and control:
Governance activities largely based on the assumption that water resources could be predicted and controlled throughlegislation by establishing prescriptive standards and environmental targets (e.g. effluent and emission standards)
Governments attempt to monitor compliance and impose penalties when standards are violated (Holley et al, 2012; Pahl-Wostl et al, 2007)
Proven to be very effective in some jurisdictions, particularly with respect to regulating large industries and reducing severeenvironmental degradation
However state-centered approaches to managing domestic, transboundary and international environmental resources faceserious limitations. Examples identified include:
i. an inability to predict and control complex, large-scale environmental systems
ii. jurisdictional fragmentation or lack of fit between political and ecological boundaries
iii. lack of sensitivity for local conditions
iv. lack of capacity and resources to enforce regulatory compliance
v. lack of consideration for the interests of marginalized populations
(see Holley et al, 2012; Edge & McAllister, 2009; de Loë & Kreutzwiser, 2007; Folke et al, 2005; UNWWAP, 2003).
Lemos & Agrawal (2006) discuss how the globalization of political-economic systems has profoundly impacted the use andgovernance of water. The integration of trade and economic systems has increased consumer demand, intensifying production andthe depletion of natural resources. In many instances globalization has encouraged a “race to the bottom” as corporations andcapital investments move to locations with less stringent environmental standards, and free trade regimes provide inadequateenvironmental provisions and protective legislation. Nevertheless, globalization also creates positive opportunities for environmentalgovernance and equity through the creation of new social movements, trans-national networks of advocates, NGOs, environmentalexperts and organizations dedicated to improving environmental governance, as well as the transfer of more efficient technologiesand the free flow of information (Lemos & Agrawal, 2006).
While governments continue to be dominant actors in water governance, it is now widely accepted that states acting alone andrelying on traditional command and control tools cannot solve increasingly complex water challenges (Simms & de Loë, 2010). Consequently there have been increased calls for alternatives approaches that are less centralized, autocratic, more participatoryand inclusive (Holley et al, 2012). In response a range of local, global, transboundary and non-state actors are increasinglyinvolved in new roles and water governance functions. These actors include NGOs, scientific experts, private corporations,members of civil society, etc. There has also been a shift towards new policy tools and modes of organization including the

WLC Template
file:///E|/Dropbox/WaterHealthNewFinal/Course4/discussion/WH40M030D001Governance.htm[12/17/2014 12:52:31 AM]
increased use of:
· market-based mechanisms,
· collaborative partnerships,
· multi-stakeholder processes,
· decentralization to more local levels of government,
· community-based initiatives,
· voluntary agreements,
· stewardship arrangements,
· other non-regulatory tools
(Holley et al, 2012; Simms & de Loë, 2010; Edge & McAllister, 2009; McCarthy, 2007; Pahl-Wostl et al, 2007; Lemos & Agrawal,2006).
As a result the number of potential influences attempting to steer the direction of societal water resource use has greatly increased,as have the “scales” within which power and decision-making authority are exerted and negotiated.
New and emerging modes of governance do not replace or supersede state power or existing national regulatory and legalframeworks. Rather, they represent additional layers of influence interacting with these more ‘established’ modes of authority,resulting in an increasingly complex and tangled web of power (Edge, 2012; Holley et al, 2012; Meadowcroft, 2002).

WLC Template
file:///E|/Dropbox/WaterHealthNewFinal/Course4/discussion/WH40M030D003GovernanceNLMB.htm[12/17/2014 12:52:31 AM]
WATER GOVERNANCE NEO-LIBERAL AND MARKET BASED MECHANISM
Definitions & Rationales
One of the major shifts unfolding globally is that private companies and market mechanisms have become increasingly relied upon as tools foraddressing the world’s water problems.
This involves a suite of potential initiatives including:
Privatization and establishment of private property rights (the transfer of ownership of water resources to private companies)
Private sector partnerships (where water resources are publicly owned but privately operated and managed)
Employing markets as allocation mechanisms
Removal of government subsidies
Instituting user-pays initiatives
Full-cost recovery that incorporates environmental externalities through pricing
(Holley et al, 2012; Ingram, 2008; Bakker, 2007; Bjornlund & McKay, 2002).
Proponents of this governance approach and paradigm argue that environmental and water resources are over-used and degraded due to afailure of markets and societies to value them properly. It is proposed that if they are treated as economic goods and priced at their full economicand environmental costs they will be more efficiently allocated, consumed and conserved (Holley et al, 2012; Ingram, 2008; Bakker, 2007).
Advocates include the World Bank, global financing community, many water professionals, private companies, bilateral aid agencies and manygovernments. They argue that harnessing the private sector will result in greater efficiencies, and financial and management capacity which isessential for improving the chances of achieving the United Nation’s Millennium Development Goal of universal water supply to an approximate 1billion people who still lack access to drinking water and more than 2 billion that lack sanitation services (WHO & UNICEF, 2004). It has beenestimated that it would cost around $10 billion dollars (US) annually to meet these goals (World Water Council, 2006). Proponents emphasize thelack of success and capacity of governments and aid agencies to achieve these goals and argue that accountability to customers andshareholders is more direct and effective than the accountability of political representatives to citizens (Bakker, 2007).
Markets and privatization are tabled as solutions to ineffective public bureaucracies and entrenched interests that monopolize public subsidies(Ingram, 2008). Those who desire minimal government intervention are often in favour of market-based approaches (Holley et al, 2012).
Proponents argue that the involvement of private enterprises and implementation of market strategies has worked well in a variety of contextsincluding Colombia, Chile, Brazil and Argentina, Côte d’Ivoire, Senegal and the Philippines (Marin, 2009).
Critique and Opposition
The implementation of market mechanisms and privatization measures has faced a series of challenges and opposition. Firstly, water is a flowresource, cycles through different physical states, and does not stay in one place making it difficult to establish private property rights. Secondly,there is a high degree of public health and environmental impacts or externalities that are difficult to calculate or reflect in water pricing due to

WLC Template
file:///E|/Dropbox/WaterHealthNewFinal/Course4/discussion/WH40M030D003GovernanceNLMB.htm[12/17/2014 12:52:31 AM]
poorly understood ecological interrelationships, uncertainties, and disputes over how to value aesthetic, symbolic, spiritual and ecologicalfunctions (Bakker, 2007). Water is also unique in that it is a non-substitutable resource essential to life. Private enterprise on its own does notprovide open public forums in which such value based decisions can be adequately discussed (Ingram, 2008).
There have been expressions of outright rejection of privatization initiatives all over the world. Grievances have centered on:
Affordability and equity issues associated with price increases,
Cut-offs of an essential resource to customers who cannot pay,
Poor transparency,
Exorbitant profits, bribery and corruption
Non-compliance with contractual agreements and failed concessions,
Reduced water quality,
Continuation of access problems,
Lack of focus on issues of sustainability or intergenerational equity (e.g. greater “efficiency” can result in higher rates of use and extraction)
(e.g. Ingram, 2008; De Vos et al, 2006; Prasad, 2006, Barlow & Clarke, 2004).
The World Bank has admitted that foreign investors are only interested in large markets with very limited risk (World Bank, 2005). As aconsequence most developing countries have been bypassed by privatization trends, especially in sub-Saharan Africa (Prasad, 2006).
As Figure 1 demonstrates between the period of 1990-2003 Argentina, the Philippines, Malaysia and Chile received the largest volumes ofprivate investment yet they are not countries with the lowest levels of water access, or the poorest of the poor (Prasad, 2006). Similarobservations can be made about aid trends, with the largest amounts of Official Development Assistance (ODA) going to China, Egypt, India,Indonesia and Turkey during the same period and therefore not necessarily going to where it is most needed or to the least developed countries(Prasad, 2006). Consequently low income countries or the poorest areas within countries are considered high risk and hence either bypassed forinvestment altogether, or the private sector draws upon the same sources of funds as the public sector to enable servicing the poor (e.g.subsidies or loans from bilateral and multilateral donors, aid money, etc.) (Prasad, 2006).
From the pro-privatization camp it has been argued that instances of privatization failures are often the result of weaknesses in a country’sregulatory system (Prasad, 2006). However critics charge that given privatization is often touted by proponents as having the greatest potentialfor improving water governance and management within countries that have a weak and corrupt government, it is unreasonable to expect thesesame countries to have the regulatory and bureaucratic systems in place necessary for overseeing and monitoring business dealings, contractualimplications and obligations (Gleick et al, 2004). This can result in a “gap” between the implementation of neo-liberal projects and thedevelopment of legal and administrative institutions capable of overseeing them (Prasad, 2006).

WLC Template
file:///E|/Dropbox/WaterHealthNewFinal/Course4/discussion/WH40M030D003GovernanceNLMB.htm[12/17/2014 12:52:31 AM]
Bakker (2007) calls for greater analytical precision when critiquing different elements of neo-liberal water reform processes arguing that a widerange of reforms are often over-simplified, assumed to be interchangeable or synonymous when they are not. For example, one may privatizewithout deregulating, deregulate without marketing, commercialize without privatizing, etc. She has created a typology to assist in distinguishingbetween different reform types, their characteristics, aims and potential trajectories with the hope of initiating and clarifying deliberations overwhere, when, and how they may be appropriate or not for particular social, economic, political and cultural contexts (see Table 1).
In summary market-based approaches and privatization initiatives, like command and control approaches, also face serious limitations and areonly a partial remedy at best to the challenges of sustainably and equitably governing water (Holley et al, 2012).

WLC Template
file:///E|/Dropbox/WaterHealthNewFinal/Course4/discussion/WH40M030D003GovernanceNLMB.htm[12/17/2014 12:52:31 AM]
Questions
1. What are the key elements of governance?
2. What are the key elements of water governance?
3. What are three examples of neo-liberal governance mechanisms?
4. How well are they working in your environment? How do you know?
5. Why has water become a market-based economic commodity?

WLC Template
file:///E|/Dropbox/WaterHealthNewFinal/Course4/discussion/WH40M030D005CollabApproaches.htm[12/17/2014 12:52:32 AM]
WATER and HEALTH - Collaborative Approaches
COLLABORATIVE APPROACHES TO WATER GOVERNANCE
Definition & Rationales
Over recent years, particularly over the past decade a new approach, namely “collaborative” environmental governance hasbecome a widespread trend and prime focus in theory and practice around the world at a host of scales.
Collaborative governance: involves diverse state and non-state stakeholders working together, cooperating, deliberating andpooling resources under varying degrees of formality and power sharing to achieve mutually negotiated goals (Lemos & Agrawal,2006; Ansell & Gash, 2008)
Stakeholders include water users, public or governmental organizations, private enterprises, non-governmental organizations,financiers, and civil society that hope to achieve more collectively than they are able individually
The term “collaborative governance” has been used interchangeably with other terms and processes including “co-management”,“partnerships”, “multi-sector”, “multi-stakeholder” (Simms & de Loë, 2010), and more recently the “new environmental governance”(Holley et al, 2012)
Lemos & Agrawal (2006) speak of three major forms of collaborative governance and offer a simplified typology (see Figure 2). There are co-management arrangements between the state and communities, public-private partnerships involving the state andmarket actors, and private-social partnerships between market actors and communities. Thus different types of social actors havebeen experimenting with different types of social and organizational arrangements to facilitate joint action. The precise nature ofthese arrangements, and related roles and expectations are shaped by specific institutional, cultural, political, socio-economic andecological contextual factors differentially enabling and constraining what is feasible / desirable.
These new approaches are often labelled as “hybrid” forms of governance, based on the recognition that no single type of actorpossesses all the skills, knowledge, and resources required to address the multiple facets, interdependencies, and complexities ofwater and other environmental resource challenges (Lemos & Agrawal, 2006). Hybrid and collaborative processes are intended tobuild upon the strengths, knowledge and capacities of each partner.

WLC Template
file:///E|/Dropbox/WaterHealthNewFinal/Course4/discussion/WH40M030D005CollabApproaches.htm[12/17/2014 12:52:32 AM]
Mechanisms & strategies of collaborative environmental governance (Source: Adapted from Lemos & Agrawal, 2006)
For example, private actors may be particularly adept at enhancing the efficient use of resources, community and local voices canprovide place specific information and increase the equitability of allocation decisions, while the state may provide the legitimacyand democratic accountability that is often lacking in market-focused instruments (Lemos & Agrawal, 2006).
Given the limitations of top-down, state-driven approaches discussed above, decisions based on limited sources of knowledge andauthority are increasingly regarded as ineffective and illegitimate (Backstraand, 2004). The direct involvement of a wider range ofactors is thought to foster greater stakeholder ownership and buy-in, and give greater voice to marginalized interests (Holley et al,2012). Proponents also suggest collaboration is essential in transboundary settings (when water crosses political jurisdictions) inorder to build trust, reveal multiple needs and perspectives, and work towards consensus (Simms & de Loë, 2010).
Criticisms & Uncertainties
There are a range of concerns as to whether collaborative processes actually deliver their intended benefits and manyimplementation challenges have been identified:
Ensuring an equitable and inclusive process
Risk of processes being dominated by most powerfully resourced actors (e.g. industry and commercial interests), or those wellplaced to influence regulatory decisions (e.g. government bureaucrats or agencies) (Holley et al, 2012). Those with the greatestaccess to data, expertise and information are more likely to have the most influence in shaping outcomes favourable to theirinterests (Edge & Eyles, in press). Ensuring an inclusive, equitable process is very difficult, particularly when an issue is imminent,when operating under narrow time constraints, and/or when there are barriers to participation (e.g. need for particular skills orexpertise, gender or cultural norms, financial constraints, etc.) (Ingram, 2008).
Building trust and accountability
Particularly difficult when there is a history of distrust or antagonism between parties. Lack of trust can weaken commitment to theprocess, result in strategies of manipulation or dishonest communication, and perpetuate stereotyping. Efforts to develop trustingrelationships, and/or remediate low levels of trust can take a lot of time (Ansell & Gash, 2008).

WLC Template
file:///E|/Dropbox/WaterHealthNewFinal/Course4/discussion/WH40M030D005CollabApproaches.htm[12/17/2014 12:52:32 AM]
Typically very time consuming resulting in high “transaction costs”
Consensus building is particularly time consuming. Requires intensive commitment of human, intellectual, financial resources(Simms & de Loë, 2010).Not necessarily effective when decisions and interventions have to be made and implemented quickly(Ansell & Gash, 2008) or when dealing with urgent and severe problems that could have catastrophic impacts (Lemos & Agrawal,2006).
Ensuring clarity in roles, expectations and responsibilities
Confusion can arise around leadership responsibilities, who directs the coordination of collaborative efforts, and what information isdrawn upon to inform that direction (van Lieshout et al, 2011). Becomes more complex when new relationships and roles are beingformed as societies shift away from command and control approaches (requires time and experiential learning). Uncertainty overthe extent to which new actors have requisite capacities and autonomy to carry out emergent roles, responsibilities and objectives(de Loë, et al, 2002). Clarity essential for accountability, consequences must be in place formally and informally that are linked tooutcomes and performance (e.g. legal, financial, reputation, public support) (Simms & de Loë, 2010).
(Re)defining legitimacy
Legitimacy refers to the approval and empowerment of actors, institutions, processes, and policies, by those subject to them(Gearey & Jeffrey, 2006). Legitimacy is conditional, negotiated and re-created through continuous acts of maintenance andcontestation (Connelly et al, 2006; Gearey & Jeffrey, 2006). Moving away from exclusive government control potentially underminesfundamental democratic principles such as representation of public interest through formal elections (Connelly et al, 2006).Uncertainties over how to afford power to unelected actors (McCloskey, 2010; Simms & de Loë, 2010), and how to ensure civilsociety is effectively and equitably represented (Reed, 2010; Borrás and Ejrnæs, 2011).
Ensuring transparency
Information upon which decisions are based and information on how decisions are being made must be equitably accessible to allstakeholders and the public. Legislation upholding freedom of information principles granting public access to information held bythe government is essential to ensuring interested parties have methods of recourse when access is denied (particularly importantfor marginalized groups). Accessibility to official records enables the public and other stakeholders to scrutinize the performanceand rationales of different governance actors. Essential for eliminating corruption (Water Governance Facility, nd).
Uncertainty over whether new collaborative approaches are resulting in improved water and environmental outcomes
Most evaluations of collaborative arrangements focus on process and social outcomes (e.g. ability to arrive at decisions,stakeholder’s satisfaction with process), and not environmental outcomes (Ansell & Gash, 2008; Simms & de Loë, 2010; Holley etal, 2012).
Based on a meta-analysis of 137 studies of collaborative governance Ansell & Gash (2008) provide a model of collaborativegovernance (see Figure 3). This model identifies a range of “contingent conditions” or factors that facilitate or discourage successfulcollaboration. The model assists scholars, practitioners and stakeholders in moving beyond deeming collaborative governance asinherently “good” or “bad” by encouraging them to focus on the contextual conditions of specific places that are likely to facilitate ordiscourage desired outcomes. That is, it assists in identifying and generating dialogue about key challenges and limitations thatmust be overcome if implementing a collaborative strategy.
At the centre are the collaborative process variables that are viewed as the core of the model. The collaborative process itself iscyclical and iterative. The boxes surrounding the core are seen as critical contributions or contextual factors that shape thecollaborative process and outcomes. These include:
i. Starting conditions (e.g. power imbalances, prehistory of conflict or cooperation, incentives or constraints to participate)
ii. Institutional design (e.g. inclusiveness, clarity of rules and roles, process, transparency)
iii. Leadership (mediation, facilitation)

WLC Template
file:///E|/Dropbox/WaterHealthNewFinal/Course4/discussion/WH40M030D005CollabApproaches.htm[12/17/2014 12:52:32 AM]
A Model of Collaborative Governance (Source: Ansell & Gash, 2008)
QUESTIONS
1. How is scale of water governance conceived within major policy and legislative documents?
2. How do the language and practices of different governance actors reinforce particular conceptualizations of scale?
3. How do particular notions of scale further the agendas of different interest groups (particularly with respect to health)?

WLC Template
file:///E|/Dropbox/WaterHealthNewFinal/Course4/discussion/WH40M030D008GovernScale.htm[12/17/2014 12:52:32 AM]
WATER and HEALTH - Governance & Scale
GOVERNANCE AND SCALE
Social Construction & Politics of Scale
Feitelson & Fischhendler (2009) argue that literature on questions of scale in the context of water is fragmented and identify threemajor strands that can distinguished according to differences in emphases and the epistemic communities within which they aredeliberated.
i. Operational scale
§ Focuses on what is the most “appropriate” scale for analyzing, investigating and governing water in ways that best recognizeand address the multiple, interacting facets of water governance (e.g. biophysical and ecological processes, organization of socialand political systems and jurisdictions, land-use decision making, socio-economic systems and livelihoods, etc.)
§ In recent years two main directions within this strand have been emphasized including basin/catchment level management aspart of IWRM initiatives, and decentralization to community scales to encourage local participation & engagement
§ Tends to pay inadequate attention to discrepancies between “ideal” scales and the scales that are actually implemented inpractice
ii. Political scale
§ Largely focuses on the role of political and economic interests and power structures involved in the “social construction” of scale
§ Examines how governance stakeholders strategically endorse particular scales of analysis, governance, management andadministration that advance their social, economic interests and benefits from resource utilization
§ Tends to pay inadequate attention to constraints of natural features
iii. International relations
§ Focuses on the international dimensions of water and the implications of imposed scales and boundaries of governance forprospects of cooperation or conflict in managing transboundary resources
§ With emphasis placed on the importance of international relations, the rationales behind various scale options and implicationsfor socio-ecological sustainability can be disregarded
(Feitelson &Fischhendler, 2009)
Scale was traditionally treated as a fixed and nested hierarchy of bounded spaces (e.g., local, national, global). However, due tomodern socioeconomic processes, state and non-state networks and societal and political actions are increasingly organizing andunfolding at sub and trans-national spaces (Marston, 2000). Hence the notion of scale as “given” and fixed has been undermined. Scales are not merely arenas containing political activity; rather politics constitute particular scales and spatial relations for action(Mansfield & Haas, 2006).
Scale therefore is increasingly understood as socially constructed, as a way of knowing, navigating and governing the world (Kurtz,2003). The acts of contesting and institutionalizing the boundaries within which power, policy and management actions areexerted, has become characterized as the “politics of scale” (Edge & Eyles in press; Reed & Bruyneel, 2010; Marston, 2000). Contestation between governance stakeholders at intrastate and international levels often takes the form of a struggle over storylines or narratives that reflect conflicting ideologies and governance paradigms over how water resources should be developed(Feitelson & Fischhendler, 2009).
As a means of examining spatial politics in environmental governance a small but growing number of scholars are focusing on“scale-frames” “or “scalar-narratives” invoked by stakeholders or encoded in legislation and institutions (Edge & Eyles, in press; vanLieshout et al, 2011; McCarthy, 2005; Kurtz, 2003). Some of this work is specifically focused on contested water resources (Dewulfet al, 2011; Harris & Alatout, 2010; Fischhendler & Feitelson, 2005; Sneddon, 2003; Harris, 2002; Swyngedouw, 1999).
· Frames demonstrate how people emphasize certain aspects of a perceived reality in a communicating context so thatparticular “facts” defining a policy problem, its causes, evaluations and interventions, become accepted by others (Entman, 1993)

WLC Template
file:///E|/Dropbox/WaterHealthNewFinal/Course4/discussion/WH40M030D008GovernScale.htm[12/17/2014 12:52:32 AM]
· Scale-frames place particular emphasize on where and how political actors strategically scope or spatially bound policyproblems and potential solutions
· Scale-frames elucidate how, where, and why actors draw meaningful linkages between the scale at which a problem isexperienced (e.g. body, catchment, ecosystem, community, nation, etc.), and the scale at which it could be analyzed or politicallyaddressed thereby influencing which actors, values, issues and solutions become (de)legitimized
(Edge & Eyles, in press)
Feitelson & Fischhendler (2009) summarize some of the common scalar trends of water acquisition and management. Theseinclude the following:
Individualized/household scale -
Often associated with values emphasizing private property rights, minimal role of state, opposition to centralized governance
Community scale
Common when water is not abundant or easily accessibleCan lower transaction and infrastructure costsPotential for enhancing sustainability and inter-generational equity of use and distribution
National scale
Centralized, state-drivenCoordinated effort and control at this scale became increasingly advocated as water resources faced increasing pressuresfrom population and economic growth
International/Transboundary Scale
Necessary when water resources transcend political and jurisdictional boundaries to ensure consistency in priorities andobjectives within legislation, policy and decision-making
River Basin/Catchment Scale
With increased awareness of environmental limits and notions of sustainability there has been an increased advocacy forintegrating the governance of water, land use and human activitiesThe Millennium Assessment (2005) convened by the United Nations and conducted by 1360 scientists from 95 countries isthe most authoritative scientific study to claim the catchment/basin as the most effective scale for achieving goals ofsustainability & integration in governance (Parkes et al, 2010)
Market Scale
Commodification of water has spatial implicationsMarket transactions, capital costs, conveyance costs and ability to pay determine the scale of a water systemMay exceed both national and basin scales if deemed worthwhile to import and export water across these boundaries
(Feitelson & Fischhendler, 2009)
As trends in water quality and quantity shift, along with prevailing ideologies and relationships of power, so too do prevailing scalesof water governance and management. This can result in a complex, multi-scalar web of overlapping and at times conflictingsystem of initiatives, and spaces of governance (Feitelson & Fischhendler, 2009).
Basins/Catchments as “Ideal” Scales of Governance
River basins/catchments or watersheds (as commonly referred to in North America) are not confined to jurisdictional andadministrative boundaries. Scaling governance, planning and management at this level is thought to be more effective throughsystematically accounting for upstream and downstream activities impacting water within and between multiple jurisdictions within asingle forum, (Parkes et al, 2010; Ingram, 2008) thereby harmonizing action across local and regional scales (Simms & de Loë.2010).

WLC Template
file:///E|/Dropbox/WaterHealthNewFinal/Course4/discussion/WH40M030D008GovernScale.htm[12/17/2014 12:52:32 AM]
Attempts to implement basin-wide institutions for governing water appropriation, quality, land use, and infrastructure planning, havebeen widespread to varying degrees of success. Numerous and longstanding challenges remain raising questions as to whethershifting governance to this scale actually results in better processes and outcomes. Identified shortcomings and criticisms includethe following:
A disregard of the physical, social and political heterogeneity of the basin region in an attempt to construct generic solutionsand policies.
Infringement upon state and local sovereignty.
Political leaders and constituencies that do not perceive a meaningful relationship to or understanding of basin-levelboundaries may feel disengaged from basin level institutions, or their main concerns and loyalties reside elsewhere.
Often fail to engage all relevant stakeholders, or actors who are engaged may lack the capacity to carry out their roles ingovernance.
Asymmetry between the benefits and high time investments or “transaction costs” of collaborative planning.
Difficulties in establishing or sustaining stable funding streams, technical and human resources, as joint provision can becomplex and contentious.
Unable to control forces outside of river basin boundaries.
(Ferreyra et al, 2008; Ingram, 2008; Fischhendler & Feitelson, 2005)
Hence many have cautioned against accepting the basin/catchment scale as a panacea for governance problems, stressing theneed for maintaining an open and flexible mind and negotiation process when determining ideal scales for management,administration, governance and decision-making (Fischhendler & Feitelson, 2006; Molden & Douglan, 2002).
Transboundary Water Governance
Given water frequently transcends national and jurisdictional borders, governance and management interventions can becomeextremely complicated. This is particularly arises from the following:
inconsistent rules, laws, customs and values;
increasing competition or scarcity due to growing populations and consumption;
climatic variability; and
lack of mechanisms or authorities in place for conflict resolution.
Water governance, practices and use patterns in one country often directly impacts another jurisdiction. There are approximately263 international river basins shared by two or more countries which encompass almost half of the earth’s surface (Wolfe et al,1999) and 40% of the world’s population (de Loë, 2009). Furthermore, many issues and challenges existing within internationaltransboundary contexts are also relevant to transboundary resources shared between jurisdictions within a country (e.g. provinces,states).
de Loë (2009) conducted a comprehensive literature review of contemporary transboundary water governance literature, andtherefore much of what is summarized in this section is attributed to that review. Findings from his review suggest consensus isemerging internationally that cooperative (vs. unilateral) management of shared basins can reduce conflict by:
creating forums for joint identification and negotiation of perspectives and interestsrevealing new options and solutionsstrengthening trust and confidence in data through joint fact findingproducing decisions that are more likely to be accepted
International Progress in Transboundary Water Governance
Cooperation is largely formalized through treaties and there have been a large number negotiated internationally. More than 3600treaties were created between 805 AD and 1894 AD, many focusing on navigation (UNFAO, 1984). According to the United

WLC Template
file:///E|/Dropbox/WaterHealthNewFinal/Course4/discussion/WH40M030D008GovernScale.htm[12/17/2014 12:52:32 AM]
Nations Environment Program’s Atlas of International Freshwater Agreements approximately 295 agreements were negotiated andsigned in the last half of the 20th century with many more created in subsequent years (2002). More recent agreementsincreasingly address a wider range of concerns including the following:
navigation
apportionment,
maintenance of ecological flows,
infrastructure,
flood control,
irrigation,
hydro-power development,
water quality,
the need for data exchange, joint monitoring and evaluation,
creation of joint decision-making bodies with enforcement powers, and
the importance of including all basin countries
(de Loë, 2009; Giordano & Wolf, 2003).
The effectiveness of transboundary agreements has been mixed. Internationally focus has been placed on developing overarchinglegal principles through consensus that can be adopted or adapted to transboundary treaty development within specific internationalwatercourses (see Box. 3).
Conventions & Declarations Relating to Transboundary Water Governance
Madrid Declaraton on the International Regulation regarding the Use of International Watercourse for Purposes other thanNaviagation (1911)
Helsinki Rules on the Uses of Waters of International Rivers (1966)
Dublin Statement on Water and Sustainable Development (1992)
United Nations Convention on the Law of the Non-Navigational Uses of International Watercourse (1997)
Ministerial Declaration of the Hague on Water Security in the 21st Century (2000)
Source: de Loë, 2009
International initiatives such as the 1997 UN Water Convention endorse a suite of principles including the following:
Equitable participation
Not causing significant harm to other basin states
Cooperation to achieve optimal utilization and protection
Regular exchanges of data and information
Equality among types of uses
( See: de Loë, 2009)
de Loë goes on to explain that additional benchmarks and principles from those which are identified in the UN Water Conventionare espoused in contemporary literatures from the fields of transboundary water management, water governance, climate change,

WLC Template
file:///E|/Dropbox/WaterHealthNewFinal/Course4/discussion/WH40M030D008GovernScale.htm[12/17/2014 12:52:32 AM]
water security, and international water law. These include an emphasis on:
Integration (e.g. of surface and groundwater, land use planning and water management, diverse water needs, etc.)
Involvement of the public, and private landowners
Shared, collaborative governance involving actors beyond nation-states including NGOs, private sector, local governments,state/provincial governments
Water quality supportive of human and ecological health
Basin-wide perspective
Adaptability and flexibility to accommodate changing conditions and respond to unforeseen circumstances
Mechanisms for dealing with water shortages
Importance of gender equity
(de Loë, 2009)
When a transboundary water agreement is being negotiated the parties involved have to come to a consensus on the mostappropriate scale for governance and management. As has been discussed this can be very contentious, despite widespreadclaims in theory and practice that the basin-wide scale is most effective for facilitating integration and ensuring externalities areaccounted for regardless of political boundaries. However as Fischhendler & Feitelson (2005) observe, many transboundaryinstitutions do not operate at the basin-wide scale. Alternatives include a wider supra-basin scale where several basins arenegotiated concurrently, as well as reductionist scales where only critical parts of a basin are incorporated into a treaty agreement. This latter option can be appealing when certain players, jurisdictions, or areas that lie within the basin are “troublesome” orresistant within negotiating processes. Their exclusion may be necessary for allowing a transboundary water regime of any kind tobe established, and may reduce the political costs of a basin-wide scale of agreement (2005). Nevertheless, this can posechallenges when jurisdictions outside of the imposed scale of governance sharing the same watercourse maintain the legal right toact unilaterally. This can create externalities within the boundary as the hydrological unity of the basin becomes fragmented (2005).
Community-Based Water Governance and Co-Management
Many are cautioning against the promotion and adoption of universal remedies to water governance and management, (e.g. basin-wide or market based prescriptions, etc.). Alternatively, models that are inherently varied and contingent upon “fitting” with andcomplementing local places, communities, values, capacities and circumstances are being advocated as more appropriate thangeneric strategies (Ingram, 2008; Bakker, 2007).
There are widespread examples of decentralized, place-based co-management regimes, community-based models of natural,“common-pool” resource management and collective action where users self-organize for governance (Ostrom, 1990; Davidson-Hunt & Berkes, 2010. Specific examples with respect to water include indigenous models of use and management in the Andes(Trawick, 2003; De Vos et al, 2006), and community norms of collective provision of irrigation in Indian “village republics” (Shiva,2002). In many of these cases community governance actors mobilize around principles of collective identity, moral grounding andequity to challenge management regimes and power imposed from elsewhere (Lach et al, 2005; Ingram, 2008).
Other rationales behind community-based governance alternatives include:
Enhancing participation and accountability by bringing decision-making closer to those most affected by governancedecisions
Bringing governance and decision-making to the scale at which impacts of water use and exploitation are generated andconsequences felt the most
Assisting in generating more time and place specific knowledge about the state of resources, in addition to cultural, spiritualand other water values and practices
Facilitation of knowledge co-production instead of sole reliance upon top-down transfer of scientific knowledge to citizens(e.g. community monitoring initiatives, citizen science, traditional ecological knowledge, etc.)
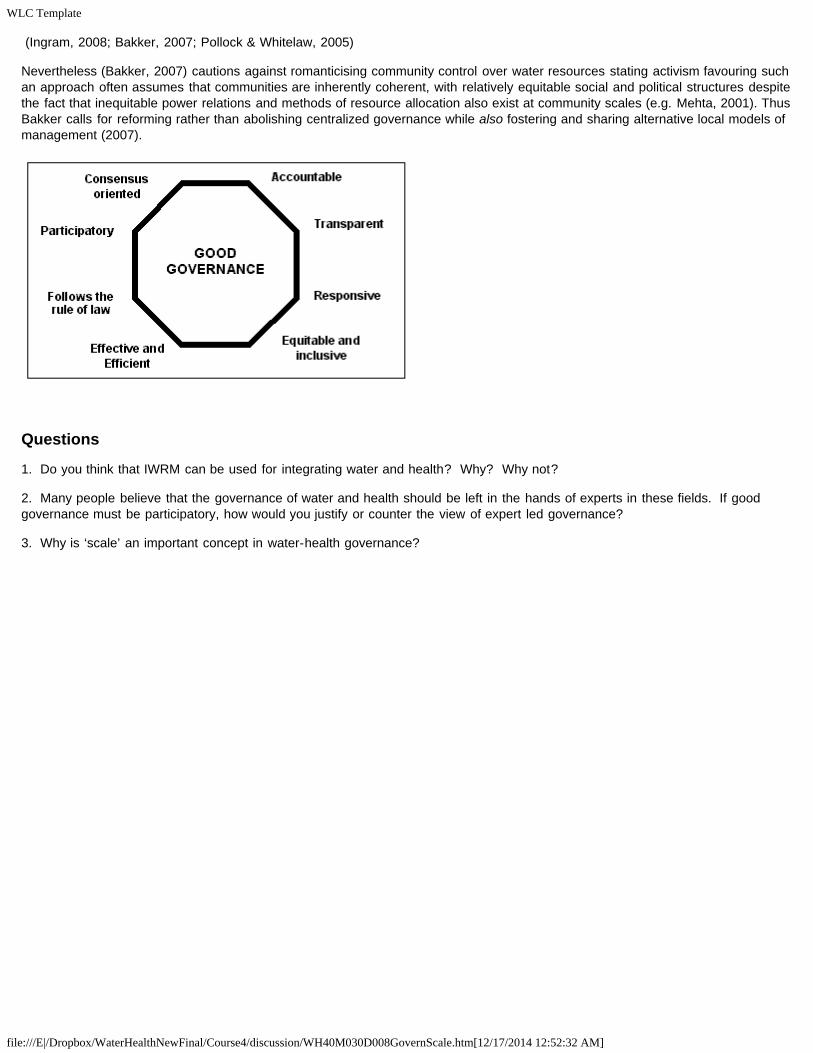
WLC Template
file:///E|/Dropbox/WaterHealthNewFinal/Course4/discussion/WH40M030D008GovernScale.htm[12/17/2014 12:52:32 AM]
(Ingram, 2008; Bakker, 2007; Pollock & Whitelaw, 2005)
Nevertheless (Bakker, 2007) cautions against romanticising community control over water resources stating activism favouring suchan approach often assumes that communities are inherently coherent, with relatively equitable social and political structures despitethe fact that inequitable power relations and methods of resource allocation also exist at community scales (e.g. Mehta, 2001). ThusBakker calls for reforming rather than abolishing centralized governance while also fostering and sharing alternative local models ofmanagement (2007).
Questions
1. Do you think that IWRM can be used for integrating water and health? Why? Why not?
2. Many people believe that the governance of water and health should be left in the hands of experts in these fields. If goodgovernance must be participatory, how would you justify or counter the view of expert led governance?
3. Why is ‘scale’ an important concept in water-health governance?

WLC Template
file:///E|/Dropbox/WaterHealthNewFinal/Course4/discussion/WH40M030D012IWRM.htm[12/17/2014 12:52:32 AM]
WATER and HEALTH - Integrated Water Resource Management (IWRM)
Overview of Processes
IWRM attempts to integrate the views and processes of:
The hydrologic cycle
Watershed and land use
Economics, social interactions and institutions
While recognizing that some factors external to the watershed have an impact;
Global climate change
Water transfers between watersheds
People movement and other human activities
Atmospheric pollution
The study of the “confluence” of all of the factors can result in a better watershed (or basin level) integrated water resourcemanagement planning process.
I
Overview of IWRM watershed or basin level

WLC Template
file:///E|/Dropbox/WaterHealthNewFinal/Course4/discussion/WH40M030D012IWRM.htm[12/17/2014 12:52:32 AM]
Integrated Water Resource Management
Seeks to better coordinate the use of land and water, surface and groundwater sources, and up and downstream users to maximizeeconomic and social welfare in an equitable manner without compromising the sustainability of ecosystems and natural resources
Implementation requires:
o enabling legislative and policy environment
o institutional linkages across scales (e.g. catchment, municipal, regional, provincial, national, global) and between privateand public partners
o intellectual and technical capacity building
o instruments and resources necessary for gathering and interpreting data, assessing resource availability and needs, andmaking allocation decisions
o Inclusive and equitable decision-making structures and processes.
Catchments and river basins increasingly accepted as ideal scale or context within which to design integrated governance
Importance of also incorporating determinants of health and social well-being into integrative environmental governanceframeworks (e.g. “The Watershed Governance Prism”)
o Emphasize interrelationships between ecosystem management, development, and human health
What is Integrated Water Resource Management?
A working definition is: "Integrated water resources management is a process which promotes the coordinated development and

WLC Template
file:///E|/Dropbox/WaterHealthNewFinal/Course4/discussion/WH40M030D012IWRM.htm[12/17/2014 12:52:32 AM]
management of water, land and related resources in order to maximise the resultant economic and social welfare in an equitablemanner without compromising the sustainability of vital ecosystems." (Global Water Partnership - Technical Advisory Committee,2000).
Another definition is:
"IWRM is necessary to combat increasing water scarcity and pollution. Methods include water conservationand reuse, water harvesting, and waste management. An appropriate mix of legislation, pricing policies andenforcement measures is essential to optimise water conservation and protection." (UNDP, 1991)
IWRM has gone beyond the traditional description of the resource and integrating or balancing demand. The conceptnow embodies:
· Integration across sectors
· Integration of use
· Integration of demand
· Integration with the environment
· Integration with the people
Specialized Skills for IWRM Planning
· To achieve the goals set for IWRM, many different specialists need to contribute their skills. These specialistsmay not be familiar with, or even sympathetic to, the overall goals.
· An education or training program in IWRM will help convey these goals to a diverse group of professionals and tocommunity members.
"Water resources means water in the broad sense as available for use and susceptible to humaninterventions. Water can be surface or groundwater, and is characterised by both quantity and quality.
Development and management cover all phases of resources planning, development, use and protection, i.e.assessment, planning, implementation, operation & maintenance, and monitoring & control. They include bothcombined resource and supply management and demand management. Integrated means development andmanagement of water resources as regards both their use and protection, and considering all sectors andinstitutions which use and affect water resources (cross-sectoral integration)." - Nordic Freshwater Initiative(Danida,1991)
Canada’s Department of Fisheries and Oceans (Internet Access Required) also studied and observed that IWRM:
Is not an exact science. Rather, it is an approach to environmental management that uses the topographically delineatedarea drained by a stream as both the physical and analytical boundary of analysis.
Encourages the examination of all biophysical and socio-economic connections such as those that exist among naturalresource sectors or those that exist between upstream activities and downstream impacts.
Has a transdisciplinary focus with an emphasis on collaboration among specialists in widely varying disciplines.
Balances social, economic and environmental values with an emphasis on strategic action and targeting issues and tasksthat are essential (better management in the face of decreasing financial and human resources).
Recognizes the need to cope with uncertainty and complexity of ecosystems and socio-economic systems.

WLC Template
file:///E|/Dropbox/WaterHealthNewFinal/Course4/discussion/WH40M030D012IWRM.htm[12/17/2014 12:52:32 AM]
IWRM Connections
Integrated water resources planning and management aims to take account of important physical, social, economic and culturalconnections within a water resources system. These connections may include:
Physical links between land use and surface and groundwater quantity and quality
Economic links between various, and sometimes competing, water uses
Social links between water development schemes and potential beneficiaries or those adversely affected
Institutional links, both horizontally and vertically, among various formal and non-formal stakeholder institutions.
“IWRM is a challenge to conventional practices, attitudes and professional certainties. It confrontsentrenched sectoral interests and requires that the water resource is managed holistically for thebenefit of all. No one pretends that meeting the IWRM challenge will be easy but it is vital that astart is made now to avert the burgeoning crisis.” (Global Water Partnership)
IWRM is, above all, a philosophy. As such, it offers a guiding conceptual framework with the goal of sustainable management anddevelopment of water resources. IWRM demands that people look at the bigger picture and realize that their actions do not occurindependently of the actions of others. It also introduces an element of decentralized democracy into water management byemphasizing stakeholder participation and decision making at the lowest appropriate level.
IWRM Processes
IWRM attempts to integrate the views and processes of:
The hydrologic cycleWatershed and land useEconomics, social interactions and institutions
While recognizing that some factors external to the watershed have an impact;
Global climate changeWater transfers between watershedsPeople movement and other human activitiesAtmospheric pollution
The study of the “confluence” of all of the factors can result in a better watershed (or basin level) integrated water resourcemanagement planning process.
IWRM vs. Traditional Resource Management
There are three features that distinguish IWRM from traditional media-based resource management:
1. IWRM is more “bottom up” than “top down” and thus emphasizes capacity building among water users. It is alsodescribed as the meeting of top-down and bottom up, as government certainly can have a major role in setting upframeworks to facilitate engagement.
2. IWRM encourages cross-sectoral, interdisciplinary management of water resources. It is integrative across environmentalmedia.
3. IWRM encompasses the management of other activities, such as land use, that affect water resources. It is solution-focused.
Key IWRM principles are:
1. Water source and catchment conservation and protection are essential
2. Stakeholders within a national framework should agree about water allocation

WLC Template
file:///E|/Dropbox/WaterHealthNewFinal/Course4/discussion/WH40M030D012IWRM.htm[12/17/2014 12:52:32 AM]
3. Management needs to happen at the most basic appropriate level
4. Capacity building is the key to sustainability
5. Involvement of all stakeholders is required
6. Efficient water use is essential and often an important “source” in itself
7. Water should be treated as having an economic and social value
8. Striking a gender balance is essential
Questions
· What is Integrated Water Resource Management?
· What is IWRM vs. Traditional Resource Management?
· What are Specialized Skills for IWRM Planning
· Describe Past and Present IWRM Efforts - Pertaining to Integrated Water and Health.
· What is the Knowledge Base for IWRM, as it Pertains to Integrated Water and Health?
WLC Template
file:///E|/Dropbox/WaterHealthNewFinal/Course4/discussion/WH40M030D015IWRMSHPP.htm[12/17/2014 12:52:33 AM]
WATER and HEALTH - IWRM Key Stakeholders & Potential Partner
Q: Do the people involved in this part of the plan have sufficient knowledge to be able toparticipate effectively?
Methods for Stakeholder Participation
Methods may include:
1. Stakeholder workshops, in which selected stakeholders are invited to discuss water issues.2. Representation in the management structure for the planning process.3. Local consultations ‘on the ground’.4. Surveys.5. Consultations with collaborating organizations (such as NGOs, academic institutions, etc.).
Types of Stakeholder Participation
Manipulative participation: Participation is only a pretence
Passive participation: People participate by being told what has been decided or has already happened. Information sharedbelongs only to external professionals
Participation by consultation: People participate by being consulted or by answering questions. No share in decision-making isconceded and professionals are under no obligation to take on board people’s views
Participation for material incentives: People participate in return for food, cash or other material incentives. Local people have nostake in prolonging practices when the incentives end.
Functional participation: Participation is seen by external agencies as a means to achieve project goals, especially reduced cost. People may participate by forming groups to meet predetermined project objectives
Interactive participation: People participate in joint analysis, which leads to action plans and the formation or strengthening oflocal groups or institutions that determine how available resources are used. Learning methods are used to seek multipleviewpoints.
Self-mobilization: People participate by taking initiatives independently of external institutions. They develop contacts with externalinstitutions for resources and technical advice but retain control over how resources are used.
Potential Partners
Some potential partners and their contributions are:
Mass Media
Coverage of watershed eventsHuman interest storiesUnderstanding of local information needsAbility to get information out quickly
Landowners & Managers
Trustworthy information sourcesRole models
Local Government Agencies
Financial and technical supportPolicies and decisions that affect the watershedLogistics, equipment, and related supportData collection and analysis expertise
Chambers of Commerce
Compatible, broader goals for local economyConcerns and interests of businesses

WLC Template
file:///E|/Dropbox/WaterHealthNewFinal/Course4/discussion/WH40M030D015IWRMSHPP.htm[12/17/2014 12:52:33 AM]
Peer pressure
Financial Institutions
Influence management decisionsLinks with landownersPrestige for partnershipFunding for programs
Agri-businesses & Industries
Distribute information and influence decisionsSponsor field days and demonstrationsDonate equipment and servicesFunding for programs
Farm Organizations
Credibility and visibility for programsExisting communication channels
Environmental & Conservation Groups
Knowledge of environmental constituenciesAwareness of problems and issuesCommitted and knowledgeable memberships
Locally Elected Officials
Political leadership and credibilityLand use and resource management decisionsFinancial support for projects
Students
Influence efforts in the futureTime and energy for "repetitive" tasks
Teachers
Influence values and beliefsAbility to shape future generationsSource of information
Women's Groups
Influence family decisionsInterest and concern for health issuesAbility to mobilize and motivate members
Religious Leaders
Commitment to stewardshipAbility to appeal to higher valuesCredibility and legitimacy
Retired persons
Time and talent for teamworkUnderstanding of local conditionsCredibility in community
Civic organizations
Ongoing program activitiesInterest in and concern for communityFund-raising skills
Some people who live outside the watershed may have an important role to play because they benefit from and/or impact water orother natural resources within the watershed.

WLC Template
file:///E|/Dropbox/WaterHealthNewFinal/Course4/discussion/WH40M030D018Demandside.htm[12/17/2014 12:52:33 AM]
WATER and HEALTH - Demand Side Management
ECONOMICS
A brief overview of the elements and key methods of economic analysis and guidance as it pertains to the application of economist tools for valuation of land and waterand sustainable environmental management (i.e., restoration and degradation) is provided further on in this Course entitled "Social Perspectives on Water and Health" .
Demand Management: Discussion
Most of us learned in elementary school that water is indestructible and will simply be recycled through the hydrologic cycle. However, water cannot be treated as aperfectly renewable resource. Withdrawals from our watersheds for drinking and industrial water and subsequent wastewater treatment are processes that, at today'sscale, have large "unpriced" external effects. There are land use consequences, biological degradation, and water quantity depletion. The amount of water withdrawn fromthe hydrological cycle is much more than it can replenish, so water cannot be considered infinite and renewable. It is therefore important to consider how to use the pricemechanism to reflect the underlying ecological costs. With expansions in water and wastewater capacity posing significant environmental battles in most majormetropolitan areas, the need for conservation and planning is greater than ever.
In addition to having until recently been considered an infinite, renewable resource, water was also until recently considered a “public good”. A public good is defined bytwo characteristics:
1. non-excludability (it is difficult to exclude someone from using the good) and2. non-rivalness in consumption (one person's enjoyment does not affect another person's enjoyment, up to the point of congestion).
The characteristics of public goods necessitate that government be responsible for them. There are few pure public goods, although many goods and services providedby government exhibit some "publicness" (street lighting, for example). Water and sewage services possess some elements of public goods, but with the recent shift inthinking regarding natural resources and their consumption, they can be described more accurately as “private goods”. The difficulty of today's water allocation problem isdue to increased population, periodic drought, depletion of groundwater, degradation of water quality, land use concerns and competition among water users (agriculture,recreation, urban drinking water and industrial use).
It is appropriate to charge for water and sewage services because they possess attributes of a private good. In theory, pricing at marginal cost (that is, charging usersthe cost of producing one additional unit, rather than charging based on the actual average cost per unit (all production costs divided by the number of units produced))generates the greatest net gain to society. In practice, however, implementing marginal cost pricing for water and sewerage may be difficult, if not impossible. Forexample, modifications may be required because of lack of knowledge about customer demand (e.g. because there are no water meters). Under these circumstances,municipalities will have to use an alternative pricing scheme.
Demand - Introduction
The main principle of economics is based on supply and demand theory - as the price increases the demand decreases and as price decreases demand increases. Howdoes one determine the cost/price of water based on demand for water?
Water demand describes the quantity and quality of water that users consume or are expected to consume. It is an important guideline for technical design. For anexisting water supply, water demand can be measured or calculated using local data or established norms and standards. These calculations take into account thenumber and type of users to be served, the anticipated rate of population growth and the expected life span of the infrastructure being provided. The influence of seasonon water demand must also be considered.
Technical staff rarely consider the influence of price on consumption, except to apply an assumed rule that users are able to afford between 3% and 5% of their incometo sustain a basic service. However, there are major difficulties in establishing household income and income may vary significantly from household to household.
In practice, the impact and sustainability of a water supply scheme may be compromised because actual consumption is significantly more (or less) than the anticipatedwater demand. For example, people may want to use water for a variety of productive uses. This may lead to communal standpipes being "upgraded" with hosepipes. Inother cases, households may switch to traditional supplies when water is widely available.
Demand - Definition
After reviewing demand from different perspectives, it is important to come to a common definition of demand. The definition used should satisfy a number of criterialike:
It should reflect how people value improved services, and not be based on external assumptions.It should stress the importance of users making key decisions about the services and service levels they require.It should be applicable to vulnerable groups and individuals (i.e. should include poor and women).It should be practical, with expressions of demand being used as a tool to guide project design.
The investments used to assess demand may consist of natural, economic, financial, human and social services.
Demand can also be defined as:
1. Willingness to pay2. An expression of human rights
Willingness to Pay
Used in an economic sense, demand is equated with a person's willingness to pay for a specified good or service. Demand expressed in this way is often termedeffective demand.
This interpretation of demand implies that improved water supply and sanitation services are economic goods. Many governments in the developing world cannot afford toprovide or sustain water and sanitation services without economic support. At the same time, there is strong evidence that many people are prepared to make significanteconomic contributions to receive services and service levels they desire.

WLC Template
file:///E|/Dropbox/WaterHealthNewFinal/Course4/discussion/WH40M030D018Demandside.htm[12/17/2014 12:52:33 AM]
Willingness to pay is a more reliable measure of demand than one based on an assumed level of affordability, because willingness to pay reflects how people value aservice. Various techniques have been developed to measure willingness to pay. These facilitate its use as a practical design tool.
In spite of these arguments, there are legitimate concerns that such an approach may marginalize those least able to express their demands in the way or ways required- poor households and women in particular.
Expression of Human Rights
Many issues are reflected in the rights based approach to development. The international human rights framework includes the right to a standard of living adequate forhealth and well-being. The Millenium Development Goals relating to water supply include halving the proportion of people who do not have access to affordable safewater by 2015. This can be achieved with access to safe water, adequate sanitation and an awareness of the associated health and hygiene issues.
It is debatable whether basic rights, such as access to safe water and sanitation, should be paid for by government (i.e. financed through cross subsidy or taxation) orpaid for directly by the individual concerned. The principles endorsed at the 1992 International Conference on Water and the Environment in Dublin require that affordablewater and sanitation services be provided as a human right. The 4th Dublin principle is: "Water has an economic value in all its competing uses and should be seen asan economic good. However, it is recognized that within this principle, it is vital to recognize the basic right of all human beings to have access to clean water andsanitation at affordable price".
Since Dublin, the human rights agenda has advanced. While access to basic services remains a concern, attention is now focused on how this can be achieved and inparticular, how poor people can be engaged in development processes that affect their lives. In this context, it is important to note that human rights include the right tocontinuous improvements to living conditions and livelihood. Water and sanitation projects should be designed accordingly, underlining the importance of upgradeablelevels of service.
Factors
Demand for water supply and sanitation is determined by a range of factors shaped by individual priorities and perceptions as seen in the following figure:
Most individual demand is expressed at the household level. Demand responsive projects should therefore focus on households. Inevitably, solutions may have to benegotiated at the community or neighbourhood level, implying the need for collective decision making and skilled negotiation.
Information on the demand for water suggests the following:
Water systems are designed to meet individual demand for potable water and demand for fire fighting. Fire fighting can impose a significant demand for capacity,especially in smaller municipalities.Residential demand for water depends on a number of factors including the price of water, size of lot, income of household, and climatic conditions.Industrial demand for water depends on the type of business activity and the production techniques employed.The extent to which a change in quantity demanded is sensitive to a price change is called price elasicity. Price elasticity shows that residential water demand isrelatively insensitive to price changes. Industrial demand is more price-sensitive. This information is useful for municipalities contemplating changes in the priceof water and future capital investment.Municipalities that have water meters consume less water per capita than those that are not metered. Furthermore, meters are necessary if municipalities are tointroduce volumetric prices.
It is sometimes assumed that users will automatically want the cheapest level of service offered. In fact, there is strong evidence that suggests that many people want,and are willing to pay for, higher levels of service.
Information on supply suggests the following:
Water supply is capital intensive. The cost of building modern water systems is approximately $4,000 per capita (not including sewage), making water systemssignificantly more capital intensive than other utilities.There are annual operating and maintenance costs and on-going administrative costs that need to be recovered if the water system is to be sustainable over thelong term.It is important to note that minimizing costs does not simply mean lowering operating costs. For maximum efficiency, both capital and operating costs need to beminimized. This needs to be done without compromising the quality and quantity of production.
Municipalities need to know the full cost of providing the service. A complete inventory of infrastructure (including buried infrastructure) and knowledge of the condition

WLC Template
file:///E|/Dropbox/WaterHealthNewFinal/Course4/discussion/WH40M030D018Demandside.htm[12/17/2014 12:52:33 AM]
of these assets is important in order to determine the life expectancy of water systems and the timing or cost of capital investments for renewal or replacement.
User Choices
Demand is met by enabling users to decide the type and form of service they want to receive. To achieve this, a number of potential options must be identified anddeveloped. These should reflect user perceptions and priorities, taking into account opportunities and constraints. This is shown schematically in the following figure.
Relating demand to a service (rather than a level of service)has important consequences. Individually, users should be
able to choose the level of service they desire and are prepared to sustain. Collectively, users should be able to determine how resources are allocated, how a service isto be managed, and how contributions are to be made. Once user preference is known, a consensus among users can be negotiated.
Predicting Demand of Improved Services
Having defined demand and how it can be identified, it is important to predict future demand of improved services. This can be done by gathering information on:
The amount of time spent fetching water; the volume used, its quality and where and how it is to be used.The type and size of any associated investment, who is making it and how it is made.Evidence of community meetings to consider how to sustain or improve an existing water supply.Efforts made, individually or collectively, to maintain or upgrade an existing water supply (this includes unauthorized connections and investments in waterstorage).Efforts made to dispose of (or otherwise manage) excrement. This may be demonstrated by one or two households rather than by the community as a whole. Such"positive deviance" provides project staff with clues as to what may be successful.Efforts made to improve the household and public environment, for example, by keeping the area around the home clear of rubbish.Expenditure on health, related to the treatment of illness associated with inadequate sanitation.
Concepts of Water Demand Management: Discussion
1. Need: The term need refers to the biological imperative of the individual for water. It also takes into account other water's other purposes, such as cooking,washing, etc.
2. Consumption: Consumption refers to the quantity of water used by a consumer(s) in any given time period. It may also specify the quality of water used. Mostoften it is represented graphically; the vertical axis depicts metres3 per unit of time and the horizontal axis measures the passage of time.
3. Effective demand: Effective demand defines the relationship between the price per unit of a product and the quantity that consumers would be willing to purchaseat that price, within a defined time and market. Graphical representation of effective demand has price on the vertical axis and quantity on the horizontal axis. It isinteresting to observe how consumers would respond to product price differences. The idea that level of demand responds to price changes is known as priceelasticity of demand.
For calculating the price, it is normally assumed that the supply of freshwater services is a monopoly and operates in a free market economy. Some problems with thisfree market approach are:
The demand curve is for all the water consumed, while the supply curve is only for additional capacity.The demand curve is estimated at the beginning of the financial year, while the supply curve is a planning function of an unspecified year.The catchment monopoly sets what price it chooses, but does not simultaneously determine total volumetric consumption.
Some of the variations suggested to average the cost-based pricing approach are:
target rate of return pricing,full cost pricing, andmark-up pricing.

WLC Template
file:///E|/Dropbox/WaterHealthNewFinal/Course4/discussion/WH40M030D018Demandside.htm[12/17/2014 12:52:33 AM]
Defining Water Conservation
Water conservation in a cost-benefit framework has been defined as "the socially beneficial reduction of water use or water loss". In this context, the use of the term"socially beneficial" implies that there are trade-offs between the benefits and costs of a water management action. In addition, it specifies the beneficiaries ofconservation efforts and encompasses the broad range of withdrawal and non-withdrawal uses. This definition of conservation, combined with the concept of demandmanagement, provides a focus for demand management; the aim is to increase social welfare, not to curtail water use per se. In regions where water shortages occur orare threatening, a social objective may in fact be to save water itself. Uncertainties about future needs, the value of keeping development options open, and the benefitsof maintaining ecosystems may not be adequately reflected in monetary terms.
Implications and Responses
All of these underlying concepts form the underlying rationale for water demand management. The incentive system of the private market system, if adopted as a workingmodel, suggests new methods allocating water in situations of scarcity. At the same time, this system of allocation should lead to a broader range of alternatives formanagement decision-making. Conservation concepts suggest a raison d'etre for demand management, namely, to increase social welfare through socially desirabledecreases in water use. Finally, and perhaps most vitally, the need to achieve sustainable development suggests a global rationale for demand management.
Techniques Available for Water Demand Management: Discussion
Economic Techniques
Economic techniques rely upon a range of monetary incentives (e.g. rebates, tax credits) and disincentives (e.g., higher prices, penalties, fines) to give users accurateinformation about the value of water. The aim is to promote better water use practices, to increase conservation and sustainability in water resource use. Realistic waterpricing is one of the keys to water demand management and is central to many of its options. Prices send "signals" to both consumers and producers about the economicvalue of the resource.
Economic techniques for municipal water management focus on using water pricing policies to influence the level of water demand. The effects of pricing on municipalwater use vary, depending upon the economic characteristics of water demand. One common indicator of the effect of price on demand is the "price elasticity of demand"for water. Price elasticity of demand measures the impact of changing prices on water demand. It does this by taking the ratio of the percentage change in the quantity ofwater demanded, and comparing it to the percentage change in price. Elasticity is normally discussed in terms of values between zero and one and values greater thanone. An elasticity value in the zero to one range means that the good or service is price inelastic - an increase in price leads to little change in demand. Elasticity valuesgreater than one imply that the changes in demand are more proportional to change in price. Since the demand curve for goods or services is downward sloping to theright, elasticity values are often negative. By convention however, the values are discussed in absolute terms, the demand for water is inelastic over the initial quantity ofwater used. This means that price change affecting this range of water use will not be very effective in inducing a decrease in water demand. Intuitively, this makessense because the initial demand for water in, for example, the household is considered essential to the user. Increased water demand occurs as less and less essentialuses come about. As water uses become less essential, the price elasticity of demand increases. In fact, some water uses, such as those for lawn and garden areas,have elasticity values greater than one. It is in this range of use where price increases can have substantial impacts on decreasing water demand.
Realistic water pricing, in the sense of recovering the full costs of water infrastructure, including repair, upgrading, and expansion costs, is the key factor in establishingdemand management as a major tool in managing water resources.
Structural and Operational Techniques
Structural techniques are those that alter existing structures to achieve better control over water demand. Examples of structural measures include metering, retrofitting,controlling flow, and recycling. Metering, a way of gaining accurate information about the amount of water used, is particularly important because it is the necessary firststep in moving toward effective pricing arrangements. Without metering, any attempt at demand-based pricing and demand management will be futile. Structuraltechniques also include changes in physical practices, such as using native species of plants to reduce sprinkling requirements or improving sprinkling equipment,permitting the application of less water. Operational techniques are actions by water users to modify existing water use procedures to control demand patterns moreeffectively. They include leakage detection and repair and water use restrictions during periods of water shortages.
Sociopolitical Techniques
In a water demand management context, sociopolitical techniques refer to policy and related measures that can be taken by public agencies to encourage waterconservation. Techniques include public awareness campaigns, laws such as building codes and appliance modifications, and government economic policies. These aredesigned to obtain cooperation from the public in moving toward improved water management practices. Thus, one of the most important techniques in this field iseffective public education.
Interrelationship of Techniques
Demand management techniques are often interrelated.
Water Reuse - Reclaimation
Reuse Terms
· Reclaimed water is water that has received at least secondary treatment and basic disinfection and is reused after flowing out of a domestic wastewater treatmentfacility.
· Reuse is the deliberate application of reclaimed water for a beneficial purpose.

WLC Template
file:///E|/Dropbox/WaterHealthNewFinal/Course4/discussion/WH40M030D018Demandside.htm[12/17/2014 12:52:33 AM]
Image: Water reuse
"Successful efforts to curb per capita invariably include some combination of water-saving technologies, economic incentives, regulations, and consumer education. Thesemeasures are mutually reinforcing, and they are most effective when implemented jointly. Higher water rates, for example, encourage consumers to install water savingdevices in their homes and apartments and to opt for native landscaping when purchasing a new home. Education is crucial to gain support for conservation, and tomake people aware of the easy and cost-effective ways they can save water."
Recommended readings
1. Wastewater re-use - Whybother (http://lnweb18.worldbank.org/ESSD/ardext.nsf/18ByDocName/WastewaterReuseWhyBother/$FILE/DHanrahanWastewaterReuseWhyBother.pdf) (Internet AccessRequired)
2. Wastewater use in Irrigated Agriculture(http://www.cabi-publishing.org/pdf/Books/0851998232/0851998232.pdf) (Internet Access Required)
3. Reuse of wastewater in Middle East and NorthAfrica (http://lnweb18.worldbank.org/ESSD/ardext.nsf/18ByDocName/ReuseofWastewaterintheMiddleEastandNorthAfrica380KBs/$FILE/ReuseofWastewater_WaterForum.pdf) (Internet Access Required)
Water demand management attempts to make water development funds cover as many initiatives as possible. Efficiency, in the economic sense, means trying to achievegoals as cheaply as possible in order to meet as many as possible of the competing demands for funding. Making available development funds stretch as far as possibleis the fundamental benefit of water demand management. Other benefits to municipalities of water conservation include lower average peak water system loading andsignificant energy savings. In addition, several benefits occur from the adoption of water demand management in industry. These include:
· Better control over the throughput of water and wastewater systems generated by the need for better accounting,
· Changes in attitudes toward water use as costs begin to show on accounting records,
· Improved technology as research and development expenditures for water handling become profitable,
· Development of new or expanded industries to provide that technology, and
· Revenue generation, for example, from by-product recovery.
Problems with Water Demand Management in Municipalities
The incorporation of the water demand management concept into municipal operations is not without problems, especially during the adjustment period. Water costs arerelatively inelastic to demand levels; a reduction in water demand will not lead to a proportional decrease in costs. An effective conservation program needs to increasewater rates to meet financial obligations. Depending on the cost of the conservation program, the financial obligations will decrease very little, and may in fact increase.Customers will understandably be displeased to see their efforts rewarded with water bills that don't decrease. This lack of immediate financial reward is a problem thatcan derail conservation efforts aimed at a longer-term benefit. Emergency or short-term conservation efforts do not have the same financial impact.

WLC Template
file:///E|/Dropbox/WaterHealthNewFinal/Course4/discussion/WH40M030D018Demandside.htm[12/17/2014 12:52:33 AM]
Image: energy management
The difficulties in matching revenues and expenditures and of having to increase rates to generate sufficient revenues in the face of falling demand have given manymunicipalities second thoughts about conservation options that directly involve customers.
Also, some studies have shown that there is a potential imbalance between revenues and costs. Revenue balancing is achieved by changing rates over time to reflectchanging cost conditions, arguing that economic efficiency was achieved when we set prices at short-run marginal costs.
Recommended readings
1. Wastewater re-use - Whybother (http://lnweb18.worldbank.org/ESSD/ardext.nsf/18ByDocName/WastewaterReuseWhyBother/$FILE/DHanrahanWastewaterReuseWhyBother.pdf) (Internet AccessRequired)
2. Wastewater use in Irrigated Agriculture(http://www.cabi-publishing.org/pdf/Books/0851998232/0851998232.pdf) (Internet Access Required)
3. Reuse of wastewater in Middle East and NorthAfrica (http://lnweb18.worldbank.org/ESSD/ardext.nsf/18ByDocName/ReuseofWastewaterintheMiddleEastandNorthAfrica380KBs/$FILE/ReuseofWastewater_WaterForum.pdf) (Internet Access Required)
Environmental Taxation
A "pollution charge" or "emission charge" is a fee, collected by the government, which is levied on each unit of pollutant emitted into the water. it is e1ffectively a tax.The total payment any source would make to the government could be found by multiplying the fee by the amount of pollutant emitted. Emission charges reducepollution because pollution costs the firm money. To save money, the polluter seeks ways to reduce its pollution.
Emission or effluent charges reflect the type and quantity of the pollutant discharged into surface water or emitted into the atmosphere, as well as its impact. Aneconomically efficient environmental charge is based on the cost inflicted on society. The total cost would include such things as lost opportunity, clean-up costs, andpublic health and aesthetic impacts.
The charges are established to meet environmental goals (normally performance standards). The charge can be based on environmental quality standards, the cost offinancing pollution control, or effluent standards. Raising or lowering the environmental charge usually affects the amount of pollution. As charges increase, it becomesmore cost-effective for the polluter to install pollution control equipment or switch to other, less polluting production processes.
Emission charges require a monitoring system to determine the quantity and quality of emissions. This system can take the form of continuous monitoring equipmentwhich precisely measures the quality and quantity of the pollution emitted. For example, in the case of water pollution, equipment can be installed to determine thevolume of wastewater. The quality can be estimated through regular sampling and laboratory analysis.
With an emission charge, a control authority can find the minimum cost allocation of meeting a predetermined emission reduction standard even when it has noinformation on control costs. Unfortunately, the process of finding the appropriate rate includes some trial-and-error. During the trial-and-error period of finding theappropriate rate, the changing emission charges make planning for the future difficult. Investments that would make sense under a high emission charge might not makesense when the emission charge falls. From either a policymaker's or business manager's perspective, this scenario leaves much to be desired.
Another type of pollution tax is the input charge. Where waste discharges are widely dispersed, and many polluters in many locations are responsible for them, it may bevery difficult to monitor and tax emissions. This is the case with, for example, the run-off of farm wastes containing concentrations of fertilizer nitrates, and with theemissions of carbon dioxide from cars, boilers and electricity generators.
Application of Emission Charges
Emission charges have been applied primarily to situations involving water pollution. Charges can be set up at a level that is calculated to achieve a pre-determined levelof water quality. Pollutants discharged in large quantities are easily monitored and can therefore readily be addressed in an emission charge scheme. Those occurring

WLC Template
file:///E|/Dropbox/WaterHealthNewFinal/Course4/discussion/WH40M030D018Demandside.htm[12/17/2014 12:52:33 AM]
irregularly and in small amounts are more difficult to include. Charges can be used to finance a regional pollution control system. These charges can be applied torecover municipal costs based on, for example, volume of discharge. To read about examples in China, France, etc.
Emission charges are only minimally effective in air pollution control. The allocation of revenue and the difficulty in monitoring emissions are factors. However, France hashad some success in applying emission charges to air emissions.
Advantages and Disadvantages of Pollution Charges
Advantages:
Firms can reduce pollution at lower cost than under a command and control approach. Savings arise from the flexibility afforded to forms in responding to thecharge. They may choose to pay the charge or to invest in a pollution control technology appropriate to their situation.
Incentives to invest in new pollution control technology are provided to firms.
Revenue that can be used to finance and enhance enforcement is generated.
· Emission charges can compensate for the externalities associated with industrial activity.
Disadvantages
It is difficult to develop charges that accurately reflect the marginal costs of pollution.
Charges too high or too low would distort activity and not lead to an economically efficient pollution level. Unfortunately, emission charges are often used as a newsource of revenue rather than as a mechanism to achieve an economically efficient level of resource use.
Charges based on ambient quality are complicated by the fact that location of industries requires firm-specific rates.
· Administrative and monitoring costs are high.
Pollution charges have three main advantages over the conventional approach in which standards are backed up by legal constraints and fines (i.e. polluting firms mustmeet the standard or risk being fined):
1. Pollution charges achieve a given standard at least cost.2. Charges force technology; they give firms an incentive to adopt the best available pollution control technology in order to minimize their "tax" liability.3. Charges economize on information needs by giving the individual agents responsibility for their decisions about pollution control.
Questions
1. What is demand-side management and how does it apply to water?
2. What is supply-side management and how does it apply to water?
3. It has been argued that water should not be privatized because it is a human right. Food is also a right but is a private commodity. Which side of thisargument do you find yourself on and why?
4. What techniques can be used in demand side management?
5. Are all taxes demand-side management techniques? Justify your response.

WLC Template
file:///E|/Dropbox/WaterHealthNewFinal/Course4/discussion/WH40M030D018Demandside.htm[12/17/2014 12:52:33 AM]
WLC Template
file:///E|/Dropbox/WaterHealthNewFinal/Course4/discussion/WH40M030D020Capacity.htm[12/17/2014 12:52:33 AM]
WATER AND HEALTH - Capacity
Capacity is a term that has several meanings including the following:
The maximum amount that something can contain;
Fully occupying the available area or space;
The amount that something can produce;
AND - The ability or power to do or understand something.
As applied to integrated water and health and to integrated water resources management, the term capacity is often used inreferring to both the individual and collective capacity in regard to the ability and to a maximum amount that integrated systems canprovide for, acheive, and sustain in water and health. Furthermore, this involves the determination of an individual and groupcompetency across a number of different and diverse and complementary fields of study, and professional expertise of theindividual and group in areas such as,
technical aspects of water and sanitation and hygeine, and health outcome diagnosis, tracking, reporting and surveillance;education (train the trainer) in terms of the capacity to teach existing and new skills and theory to health and waterprofessionals working in the water sanitation nd health sectors and where they intersect, and how to use new skills;impact assessments of actions taken and not taken in response to natural disasters, changes in access to water andsanitation health and learnings for those experiences to be applied in similar situations.management and governance.
Capacity Development vs. Capacity Building
Capacity is also often paired with the terms building and development
"Capacity building" or "Capacity Developement"
"Capacity development is not simply human resource development – it is much larger than that. It is not merely theacquisition of skills but also the capacity to use them. This in turn is not only about employment structures, but alsoabout social capital and the different reasons why people start engaging in civic action”
- Mark Malloch Brown. Foreword in Capacity for Development--New Solutions for Old Problems. Edited by SakidkoFukuda-Parr, Carlos Lopes and Khalid Malik. Earthscan/UNDP 2002.
WLC Template
file:///E|/Dropbox/WaterHealthNewFinal/Course4/discussion/WH40M030D023Capacity_prerequisites.htm[12/17/2014 12:52:33 AM]
WATER AND HEALTH - Capacity Prerequisites
Prerequisites for Integrated Water and Health - Sustainability (drawing on IWRM)
Taking into account integration, conditions for success and the theoretical basis for integrated water and health sustainability,drawing on IWRM, it can be seen that the concept of IWRM involves the technical integration of the many factors, includinginstitutional and social organizations in order to make progress, and is based on four pillars of sustainable water use describedbelow.
The Four Pillars of Sustainable Water Use
Pillar 1 - The capacity to educate and train through community awareness building, adult training and formal education so thatthere are enough competent human resources to develop and apply enabling systems.
Pillar 2 - The capacity to measure and understand aquatic systems through monitoring, applied research, technologicaldevelopment and forecasting, so that reliable data is used for analysis and decision making.
Pillar 3 - The capacity to legislate, regulate and achieve compliance through effective governmental, non-governmental and privatesector institutions and through efficient enforcement and community acceptance.
Pillar 4 - The capacity to provide appropriate, affordable water infrastructure, services and products through sustained investmentand management.
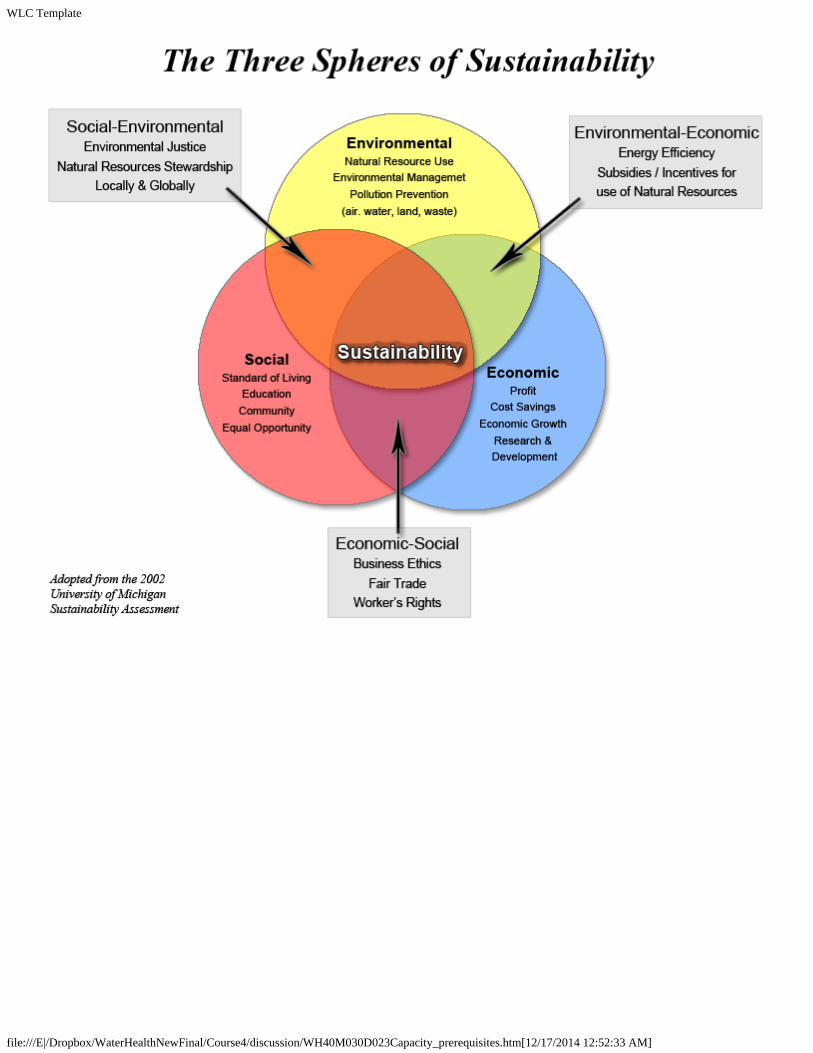
WLC Template
file:///E|/Dropbox/WaterHealthNewFinal/Course4/discussion/WH40M030D023Capacity_prerequisites.htm[12/17/2014 12:52:33 AM]

WLC Template
file:///E|/Dropbox/WaterHealthNewFinal/Course4/discussion/WH40M030D026Capacity_development.htm[12/17/2014 12:52:34 AM]
WATER AND HEALTH - Capacity Development
Capacity Development in the Water Sector
What is it?
Peter Morgan (1997) defined capacity development as "the process by which individuals, groups and organizations improve theirability to carry out their functions and achieve desired results over time.”
Capacity development is
· Obviously a very flexible concept
· An internal process
· Results-oriented
Why is capacity development important?
Development efforts often failed because local capacities were not developed to manage, operate and maintain the facilities.
Local groups were not empowered to implement new development activities after the initial round of funding finished.
The technical cooperation efforts of the past are declining as are overall budgets for development aid. Consequently, there is a newemphasis on management and governance coupled with results-based management and assessment protocols. This new emphasisdoes not necessarily lead to improved results.
The rate of technological change has increased.
What levels (individual, institutional or societal) should capacity development be targeted at? Howshould this be decided?
The simplistic answer to the question is “all levels need to be addressed”:
Micro-level - individuals
Meso-level - research and development organizations, academia, institutions, NGOs, communities, etc.
Macro-level - national and international governments, policy development, societal changes
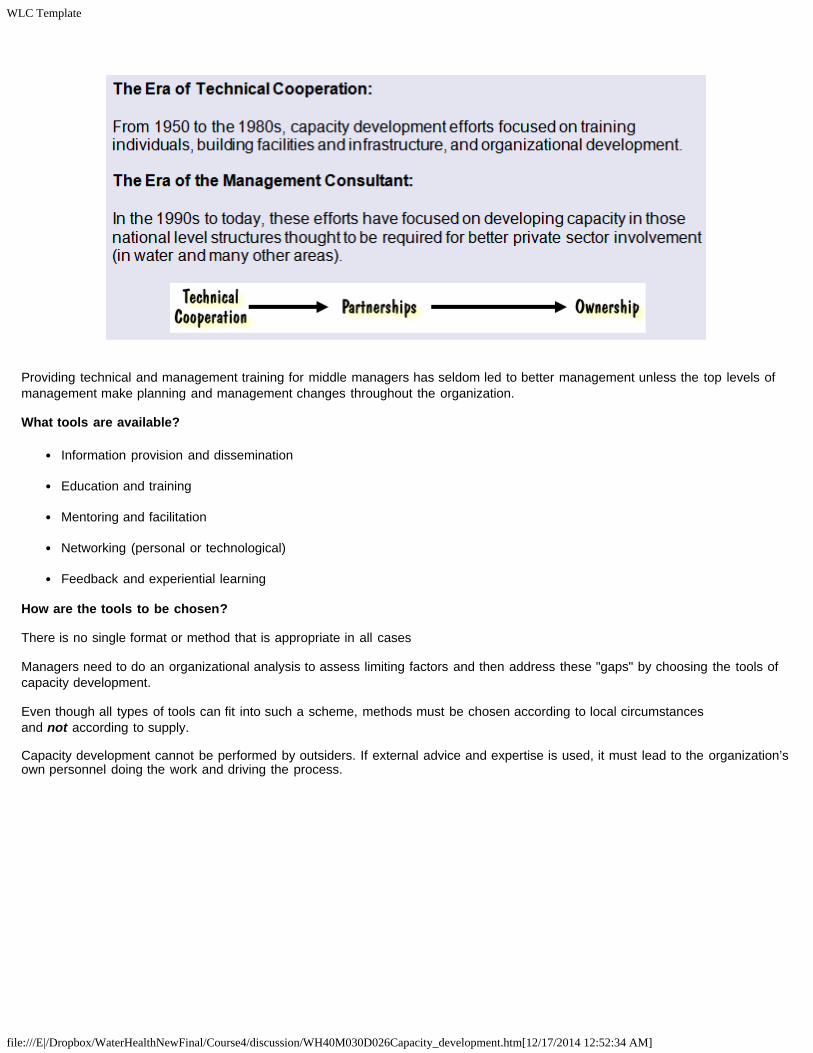
WLC Template
file:///E|/Dropbox/WaterHealthNewFinal/Course4/discussion/WH40M030D026Capacity_development.htm[12/17/2014 12:52:34 AM]
Providing technical and management training for middle managers has seldom led to better management unless the top levels ofmanagement make planning and management changes throughout the organization.
What tools are available?
Information provision and dissemination
Education and training
Mentoring and facilitation
Networking (personal or technological)
Feedback and experiential learning
How are the tools to be chosen?
There is no single format or method that is appropriate in all cases
Managers need to do an organizational analysis to assess limiting factors and then address these "gaps" by choosing the tools ofcapacity development.
Even though all types of tools can fit into such a scheme, methods must be chosen according to local circumstancesand not according to supply.
Capacity development cannot be performed by outsiders. If external advice and expertise is used, it must lead to the organization’sown personnel doing the work and driving the process.

WLC Template
file:///E|/Dropbox/WaterHealthNewFinal/Course4/discussion/WH40M030D026Capacity_development.htm[12/17/2014 12:52:34 AM]
What are the conditions for success in capacity development?
Experience over many years shows that the following are the main conditions for success:
Top managers who provide leadership for institutional change
Critical mass of participants involved and committed to the change process
Availability (or development) of appropriate institutional innovations
Adequate resources for capacity building and implementing changes
Adequate management of the capacity development process

WLC Template
file:///E|/Dropbox/WaterHealthNewFinal/Course4/discussion/WH40M030D026Capacity_development.htm[12/17/2014 12:52:34 AM]
How should capacity development be planned, managed and evaluated?
Most capacity building efforts reflect the priorities, assumptions and capabilities of the external agencies
There is no easy formula that is appropriate for all situations. Assessment by the managers, support by top managementand identification of the lack of capacities that are most constraining are all important.
Accept that change and redefinition of goals is inevitable and desirable.
Evaluations can be for:
Accountability - The obligation of reporting on or justifying a particular activity. Most evaluations are carried out tomeet government or funding-agency accountability requirements. These evaluations are generally conducted todetermine whether objectives have been achieved and resources have been used appropriately.
Improvement - Evaluations carried out to learn lessons that can be used to improve ongoing or future capacity-development efforts are of potentially greater value. Unfortunately, improvement-oriented evaluations are seldomperformed.
How long should a program be supported?
Capacity development cannot be a “one-off” event – it is an on-going process that needs support and management over time.

WLC Template
file:///E|/Dropbox/WaterHealthNewFinal/Course4/discussion/WH40M030D029Capacity_particdevel.htm[12/17/2014 12:52:34 AM]
WATER and HEALTH - Participatory Capacity Development and Learner-Centred Approaches - TheNew Paradigm
A Framework for a PCD Approach
Learner-centred teaching methodologies include:
Working in groupsVisualizingMaking presentationsUsing case studiesRole playing
Learning how to use such methods and actually applying them are two different things. Some teachers say that they find it difficultto introduce these alternative methods due to large class sizes, poor facilities and unwillingness by students to cooperate in a styleof teaching and learning that might reduce the amount of content in a lesson.
Educational methods are gradually improving through increasing:
Active and participatory pedagogy, particularly learner-centred teaching methodsUse of teaching/learning materials, such as handouts, transparencies, photos, videos, and posters Knowledge and skills in teaching large classesField-based learning preparation and use of specific case studies Analyses of teaching skills, including lesson planning and classroom observation
Framework for Learner-Centred Approach to Education
Participatory curriculum development provides an excellent basis for a systemic approach to teaching and learning.
A systematic approach to teaching and learning may be defined broadly as "all the learning which is planned and guided by atraining or teaching organization, whether it is carried out in groups or individually, inside or outside a classroom, in an institutionalsetting or in a village or field" (Rogers and Taylor, 1998). It takes into consideration the learning achieved by students, the activitiesand experiences that bring about the learning, the process of planning and organizing these activities and experiences, anddocumentation of the whole process.
Since, ultimately, curriculum development is about people, not about paper, the participation of stakeholders in curriculumdevelopment is critical. There is growing evidence from many countries that using a participatory approach to curriculumdevelopment improves the effectiveness and sustainability of training courses by creating partnerships between trainers, participantsand others who have an interest in the training and its outcomes (Taylor, 2006).
Unfortunately, curriculum development is often neither systemic nor participatory. In many contexts, it occurs in an ad hoc andreactive manner, and is largely expert-led and hierarchical.

WLC Template
file:///E|/Dropbox/WaterHealthNewFinal/Course4/discussion/WH40M030D029Capacity_particdevel.htm[12/17/2014 12:52:34 AM]
Framework for PCD
Challenges of PCD: Discussion
Potential challenges of PCD:
PCD requires more time and resources compared with more traditional, systematic approaches to curriculum development.
Communication is often difficult due to geographic distances between stakeholders.
Incentives, which could motivate the stakeholders to share and exchange information, are often insufficient or not wellrecognized. Additionally, commitment varies among stakeholders.
Building partnerships among the stakeholders is often a difficult task as each group may not be adequately represented.
Teachers must not only learn from the field, but also integrate what they learn into the curriculum.
The shift from a process-oriented approach to one where key outcomes are needed and monitored is cumbersome. Thisdifficult shift can affect planning and implementation, and discourage the establishment of an effective monitoring system.
Often, there is insufficient knowledge on the use of inputs and the real costs (time, resources, etc) of education-relatedinterventions in relation to the actual outcomes, leading to a perceived inefficiency in the program.
Obviously, if a PCD approach is only possible when time and resources (both human and financial) are virtually unlimited then itwill become unsustainable, and have little applicability in most other contexts.
Questions
1. In LMICs women are the major water drawers. When forming water committees in local communities women should have themajority of members. Discuss the pros and cons of this statement.
2. How do actors become involved in a collaborative process?
3. Who decides on the limits and criteria of inclusion and exclusion?
4. Are there serious differences between the power and legitimacy of different stakeholders?
5. Do all stakeholders have the capacity to participate in a meaningful way? What barriers to participation exist and how couldthey be minimised?

WLC Template
file:///E|/Dropbox/WaterHealthNewFinal/Course4/discussion/WH40M030D029Capacity_particdevel.htm[12/17/2014 12:52:34 AM]
6. Who would play a leadership role within a collaborative process? Would this be amenable to all parties? Do they have theresources and commitment to sustain this role over time?
7. Is there a history of past conflict between stakeholders? Were stakeholders able to overcome their differences? How muchremedial trust building is necessary? Is there enough time available to develop trust, relationships and engage in negotiations andconsensus-building?
8. What is the difference between capacity development and capacity building?
9. What are the four prerequisites of sustainable capacity development?
10. What are the four pillars and three spheres of sustainability?

WLC Template
file:///E|/Dropbox/WaterHealthNewFinal/Course4/discussion/WH40M040D001IntegApp.htm[12/17/2014 12:52:34 AM]
WATER and HEALTH - Integrated Approach
INTEGRATED APPROACHES TO GOVERNING FOR WATER AND HEALTH
One of the most elusive challenges for ensuring effective water governance is integration. Integration requires that all watermanagement decisions and governance processes be conducted systemically and holistically in coordination with other policyspheres of development, planning and decision-making that may impact water quality and quantity concerns (e.g. land use,agriculture, urban and rural development, forestry, energy production, etc.) (Simms & de Loë, 2010). This is the central premisebehind the now widely espoused concept of “Integrated Water Resource Management” (IWRM).
IRWM: seeks to better coordinate the use of land and water, surface and groundwater sources, and up and downstream users tomaximize economic and social welfare in an equitable manner without compromising the sustainability of vital ecosystems andnatural resources (Water Governance Facility, nd). Implementation requires:
Enabling legislative and policy environment which often requires reform of institutions and regulatory systems
Appropriate institutional and administrative frameworks that create linkages across scales (e.g. catchment/river basin, local,regional, provincial, national, global), and between private and public partners in ways that facilitate understandings ofbiophysical systems and socioeconomic and institutional contexts
Intellectual and technical capacity building of players in different sectors at various scales
Management instruments and supportive resources necessary for gathering and interpreting data, assessing resourceavailability and needs, and making allocation decisions
Inclusive and equitable decision-making structures and processes
(Water Governance Facility, and; Global Water Partnership, 2000)
Catchments and river basins are increasingly accepted as an “ideal scale” or context within which to design integrated governance.
Building upon the notion of IWRM others have emphasized the importance of incorporating determinants of health and social well-being into integrative environmental governance frameworks (Parkes et al, 2010; MEA, 2005; Pruss-Ustun & Corvalan, 2005). Parkes et al (2010) designed a heuristic framework entitled “The Watershed Governance Prism” to illustrate linkages betweenecosystems, social systems, health and watersheds and to assist policymakers, researchers, and water managers in movingbeyond disciplinary and sectoral approaches towards integrated governance practices (see Figure 4).
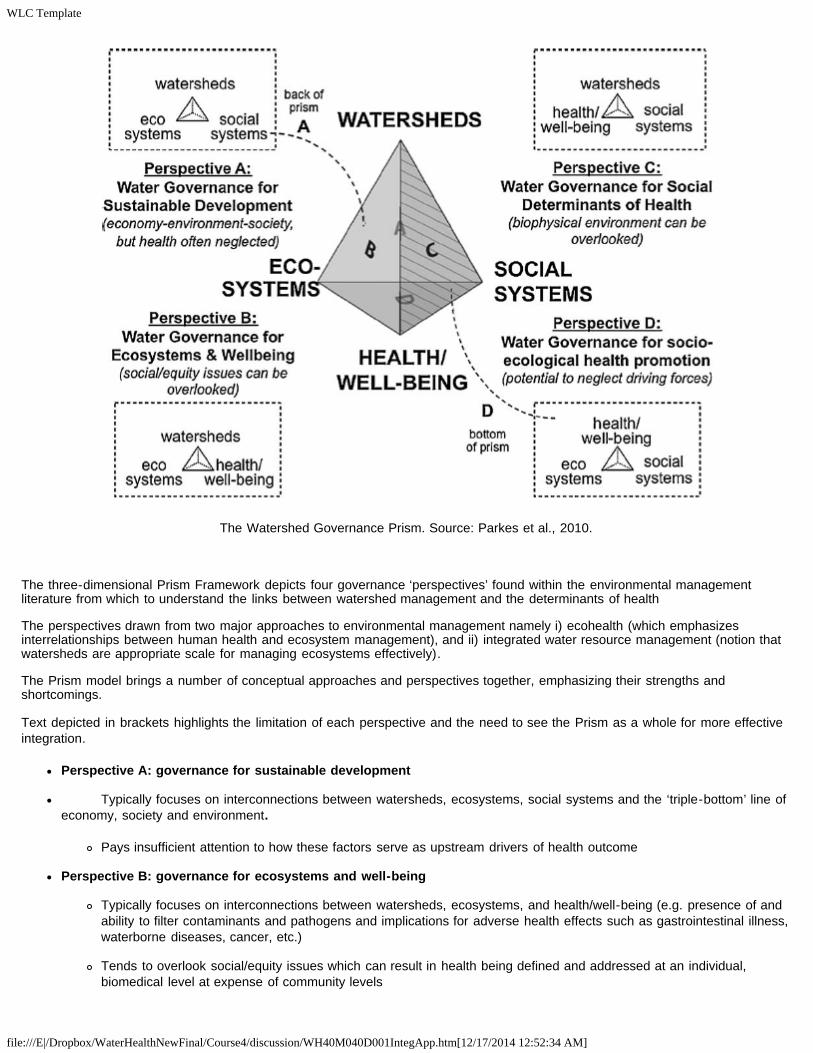
WLC Template
file:///E|/Dropbox/WaterHealthNewFinal/Course4/discussion/WH40M040D001IntegApp.htm[12/17/2014 12:52:34 AM]
The Watershed Governance Prism. Source: Parkes et al., 2010.
The three-dimensional Prism Framework depicts four governance ‘perspectives’ found within the environmental managementliterature from which to understand the links between watershed management and the determinants of health
The perspectives drawn from two major approaches to environmental management namely i) ecohealth (which emphasizesinterrelationships between human health and ecosystem management), and ii) integrated water resource management (notion thatwatersheds are appropriate scale for managing ecosystems effectively).
The Prism model brings a number of conceptual approaches and perspectives together, emphasizing their strengths andshortcomings.
Text depicted in brackets highlights the limitation of each perspective and the need to see the Prism as a whole for more effectiveintegration.
Perspective A: governance for sustainable development
Typically focuses on interconnections between watersheds, ecosystems, social systems and the ‘triple-bottom’ line ofeconomy, society and environment.
Pays insufficient attention to how these factors serve as upstream drivers of health outcome
Perspective B: governance for ecosystems and well-being
Typically focuses on interconnections between watersheds, ecosystems, and health/well-being (e.g. presence of andability to filter contaminants and pathogens and implications for adverse health effects such as gastrointestinal illness,waterborne diseases, cancer, etc.)
Tends to overlook social/equity issues which can result in health being defined and addressed at an individual,biomedical level at expense of community levels

WLC Template
file:///E|/Dropbox/WaterHealthNewFinal/Course4/discussion/WH40M040D001IntegApp.htm[12/17/2014 12:52:34 AM]
Perspective C: governance for social determinants of health
Typically focuses on watersheds, social systems, health/well-being recognizing access to water resources influenceslivelihoods and the socio-economic determinants of health
Brings attention to power dynamics and (in)equities that are inherent to provision, allocation and access decisionsthereby valuing the importance of equitable, multi-stakeholder water management processes
Encourages attention to how or why governance options may perpetuate gender, cultural and/or socioeconomic biases
May overlook biophysical processes and ecosystem services
Perspective D: governance for social–ecological health promotion
Typically focuses on ecosystems, social systems, health/well-being
Recognizes that health promotion is maximized when linking sustainable freshwater ecosystem services withequitable social processes and allocation decisions
May overlook upstream drivers of social and ecosystem change (e.g. changes in political economic systems atvarious scales) (Parkes et al, 2010)
While integration looks great on paper and in theory, the challenges of implementation in practice are vast and often grosslyunderestimated. Examples include:
· Institutional barriers (e.g. silos remaining between various sectors and stakeholder communities interacting with thosesectors such as public health, natural resource, finance departments, etc.)
· Working within interdisciplinary, multi-stakeholder and integrative environments can be challenging due to differences inlanguage, key terms and concepts used, end goals, and methodological preferences
· The sheer scope and scale of IWRM objectives including the identification and measurement of a large number of socio-ecological relationships can be overwhelming and demanding upon human, organizational and financial resources
· Substantial changes in water entitlements, bureaucratic cultures & objectives and human behaviour is required
· The resources available to enable and support participatory engagement in integrative processes are not equitablydistributed amongst society and interest groups
· Processes and skills must be in place to facilitate conflict resolution
(Ingram, 2008)

WLC Template
file:///E|/Dropbox/WaterHealthNewFinal/Course4/discussion/WH40M040D001IntegApp.htm[12/17/2014 12:52:34 AM]
Past and Present IWRM Efforts - Pertaining to Integrated Water and Health
There are clear advantages to IWRM at the international scale, particularly in international river basins, and even the global scale.However, in the words of McDonald and Kay (1988), integration at larger scales is "conspicuously absent."
Despite this, IWRM is improving and becoming more "mainstream." Many agencies now include it in their list of required orpreferred practices when dealing with certain water issues and tracking and surveillance of health outcomes such as, healthoutcomes and the water sanitation sector. As well as, tracking and surveillance of releases from industry commercial and municipalwastewaters and human exposures to water related diseases and pollution.
Nevertheless, IWRM and integrated water and health must not become simply a routine way to look at and talk about water andhealth management. Successful and useful implementations require rigorous analysis and integration.
More and more agencies are establishing administrative frameworks that permit and even encourage the management of water ona watershed basis and tracking and surveillance of health outcomes.
Less frequently, however, is the management of water integrated with that of other resources that affect or are affected by water,such as health outcomes and the water sanitation sector
These other resources may include, at minimum, the intensity and nature of agricultural activities, forestry, and commercialfisheries, as they are impacted by releases from industry commercial and municipal wastewaters and human exposures to waterrelated diseases and pollution.
Learning from Other IWRM Projects in Water and Health involving the Sanitation Sector
Integrated Water Resource Management in Water and Sanitation Projects– Lessons from 11 projects in Africa, Asia and SouthAmerica (Internet Access Required) contains the findings of a participatory review of 11 drinking water and sanitation supply(DWSS) and IWRM projects from around the world. The methodology of this review is as follows:
· Eight DWSS and three IWRM projects from seven countries were reviewed to identify the extent to which they incorporatedIWRM principles.
· The review covered a wide range of:
o Scales - from the micro-catchment (700 people, 900 ha) to the river basin (1.5 million people, 4,300 km2)
o Landscapes - varying from the humid to the semi-arid
o Socio-economic and developmental backgrounds
All projects shared a commitment to participatory approaches aimed at empowering and giving communities the maximum possiblecontrol over their resources.

WLC Template
file:///E|/Dropbox/WaterHealthNewFinal/Course4/discussion/WH40M040D001IntegApp.htm[12/17/2014 12:52:34 AM]
Comb cross-sectoral integration
Adapted from the GWP Comb, 2000
What is the knowledge base for IWRM, pertaining to integrated water and health?
Principles:
1. There is a common “core” knowledge base that all participants in an IWRM exercise can share.
2. Deciding what this knowledge base should be is an essential part of capacity building for IWRM.
3. This knowledge base can be communicated to all participants.
4. Each participant then shares a common vocabulary and understanding of this core knowledge.
5. When capacity building is complete, the participants interact more effectively and the dialogue on the IWRM process alsobecomes more effective.
6. If this core knowledge is not shared, then interactions between participants may be much more difficult and even impossible.
Participants are defined as EVERYONE involved, including water users, suppliers, industries, agriculture, governments (all levels),regulators, lawyers, planners, engineers, biologists, social scientists, economists, citizens, NGOs, hydrologists, limnologists, financialagencies, etc.
Core Knowledge Hydrogeology

WLC Template
file:///E|/Dropbox/WaterHealthNewFinal/Course4/discussion/WH40M040D001IntegApp.htm[12/17/2014 12:52:34 AM]
Hydrogeology core knowledge pyramid
Core and Specialized Knowledge in Hydrology Run-off
What is the knowledge base for IWRM, pertaining to integrated water and health?
Knowledge occurs on five levels:
· General - knowledge known by most people
· Overview - a broad understanding of a subject area without details
· General subject - knowledge about specialist areas of a discipline
· In-depth subject - knowledge about a particular speciality in a discipline
· Specialized background - knowledge of other specialized subject areas essential for effective application of specialized subjectknowledge. For example, an ecosystem modeller who has detailed mathematical knowledge about the derivation and operation ofthe mathematical principles applying to models.
Although many specialists can be involved in IWRM planning processes, and each brings their expertise to the process, thereremains a set of “core knowledge” that all participants in the process should share.

WLC Template
file:///E|/Dropbox/WaterHealthNewFinal/Course4/discussion/WH40M040D001IntegApp.htm[12/17/2014 12:52:34 AM]
Core knowledge vs specialised knowledge
What is this "core knowledge base" and how can it be defined?
Operationally, the core knowledge base is the knowledge that specialists, such as biologists or toxicologists, consider necessaryfor people to have in order to engage in an IWRM planning exercise.

WLC Template
file:///E|/Dropbox/WaterHealthNewFinal/Course4/discussion/WH40M040D005PublicHealthRole.htm[12/17/2014 12:52:35 AM]
WATER and HEALTH - PUblic Health Role
The Role of Public Health in Issues Involving Water Related Impacts on Health
"Health is a complete state of mental, physical and social well-being, not only the absence ofdisease" (WHO).
This quote from the World Health Organization reminds us there are many determinants of health and well-being in addition to riskfactors for disease.
Public health units work with their community partners in the protection of the health of the community and its members for theprevention of community health impacts from
1. transmissible infectious and communicable diseases2. acute and chronic illness from harmful environmental exposures
Public health units also work with their community partners for the promotion of healthy lifestyle choices (e.g., diet nutrition andexercise, anti-tobacco smoking and substance abuse).
Public health is involved in providing services such as,
admistration of public health resourcestraining education and advocacypublic immunization clinics for vaccine preventable diseases (VPD)food safety inspections of commercial restaurants and food service establishmentshealth inspections of public institutions, including public schools nurseries and day-cares, public nursing homes and long-term care homes, jails and correctional facilities.health inspections of commercial spas, nail treatment, and tatoo parloursthe development of policy, resources and initiatives

WLC Template
file:///E|/Dropbox/WaterHealthNewFinal/Course4/discussion/WH40M040D005PublicHealthRole.htm[12/17/2014 12:52:35 AM]
promotion of mental health and dental healthsupport for susceptible and vulnerable populationscommunication and public health reporting on reportable and notifiable diseases, including enterics and vector-bornediseases communication of various public health and safety indicators, including hospital public safety indicators and consumerproduct safety recallssupport to emergency management preparedness and response systemssupport for review communication and litigation of environmental investigations impacting the community
Question
1. Do all jurisdictions utilizing a shared water resource have the same understanding and definition of boundaries around thatwater source?
2. You are the chief public health officer in a community of 50,000 people. Your local area council has decided that the districtneeds an Ebola prevention/containment plan. What water, sanitation, and hygiene (WaSH) concerns will you include in the plan?Why?

WLC Template
file:///E|/Dropbox/WaterHealthNewFinal/Course4/discussion/WH40M050D001challenges1.htm[12/17/2014 12:52:35 AM]
Water and Health - Challenges
Sustainable Environmental Management by Applying the Principles of Economic Analysis andValuation
This section of the course entitled "Social Perspectives on Water and Health" provides a brief introduction of why economicanalysis is used for assessment of environmental changes, which tools are available for economic assessment, such used inpolicy-making and what type of value is needed to conduct economic assessment.
Learning outcomes:
By the end of this section students should be able to:
· Define ecosystem services provided by land and water from a set of examples
· List and recognise relevant questions that economic tools can help answer
· List and describe some tools for economic assessment used in policy-making
· Explain the difference between price and value
· Explain the difference between financial and economic prices
· Define market failure, externality and provide examples
Economic analysis can help inform decision-making by providing a common measuring rod for assessment of potential changesand adopting the perspective of society as a whole (i.e., monetary value). This economics perspective should be complemented bytechnical, sociological and political analysis for good management.
The recent food, energy and financial crises have sparked a renewed interest in land and water issues. There is lack of new virginlands to be discovered, and an increased awareness of a need to invest into improved land and water resources productivity if theneeds of the coming population of 9 billion people are to be satisfied. Improved land and water resources productivity can beachieved through a range of complementary approaches such as intensification of production on already productive areas; slowlydown or reversing land and water resources degradation where possible; and ensuring an appropriate distribution of property rightsover land and water exploitation.
Scientists have long identified land (and water) as threatened by degradation (e.g., pollution, overuse). They have warned policy-makers and stakeholders about the negative consequences of overexploiting or destroying land, water and ecosystems, but thishas often not been enough to induce a change in stakeholder behaviour and land and water are still subject to overexploitation anddegradation. WHY have land and water mangement practices not changed despite the urging by scientist and compelling scientificresearch and data?
It is partly because scientists quantify the changes affecting the ecosystems, but do not quantify how much these changes affectthe people depending on these ecosystems and their livelihoods. For instance, intensive agricultural production may lead to soildegradation (in terms of reduced soil nutrients, higher soil erosion…) but may help to create agricultural job opportunities, which isoften viewed as desirable in regions where job opportunities are scarce. In this specific example, the negative impacts on land arebeneficial to people bycreating livelihood opportunities, at least in the short term. The longer term losses of food and jobs are oftenignored, limiting necessary action to prevent them from happening until it is too late.
Economics is providing tools to analyse a problem using a people's perspective. Other disciplines such as psychology andsociology also provide tools and valuable insights into identifying and designing solutions to social problems, but policy-makersgenerally react faster under political and economic pressures, and understand and react to – money!
By adopting an economic perspective, economists analyse the environment (land and water) from the point of view of people. Thisis a different but complementary perspective to science: science focuses on providing technical solutions to a problem whilsteconomics focuses on allocating scarce resources between different uses so as to maximise benefits to society as a whole.Scientists typically consider how and why land ecosystems are fragile and biologically important and what management options areavailable for sustainable land management. Whereas, Economists focus on the economic benefits land brings to our society andwhether these existing benefits outweigh the costs of maintaining or restoring these existing benefits.
For example, land and water can be degraded because of soil erosion, soil nutrient depletion, salinity, overexploitation such as

WLC Template
file:///E|/Dropbox/WaterHealthNewFinal/Course4/discussion/WH40M050D001challenges1.htm[12/17/2014 12:52:35 AM]
overgrazing or overexploitation of forest timber, pollution. Land and water plays a critical role in food and fibre production, timberproduction, the recharge of groundwater, flood control, water purification, provision of drinking water, sustaining wildlife populationfor wildlife-based tourism, and additionally have aesthetic and/or cultural values. Land and water degradation can lead to areduction in the following benefits: food production, carbon storage, groundwater supply and flood protection, water quality, wildlife-based tourism (hunting or game watching). There are also several costs associated with land and water degradation. The decreasein water quality from increasing pollution near cities requires water treatment and thus has a cost to society. Likewise, accruedsensitivity to extreme events such as floods requires the construction and maintenance of specific infrastructures.
Environmental economists often refer to environmental goods and services. For an economist, land is an environmental good whichprovides environmental services that in turn help sustain human life and livelihoods. Environmental goods refer to stock resources,which exist in a (relatively) fixed quantity. Environmental goods can be land, mineral ore, trees. Environmental services refer toflow resources, in which quantity is renewed with time. Environmental services can be groundwater recharge, flood control, waterpurification, timber harvest and aesthetic or cultural benefits.
To successfully address environmental degradation issues, several questions need to be answered.
How do we decide whether to restore environmental productivity for its current use, or convert it to other uses?
Maintenance of environmental productivity requires effort and investment of financial and human resources. The ecosystemprovides a basis for alternative economic activities linked to food production, carbon storage, groundwater supply and flowregulation, water quality, wildlife-based tourism (hunting or game watching). These activities often cannot always be undertaken atthe same time and conflicts of interests arise. So, how do can decision-makers reconcile conflicting interests and decide whichuse(s) is (are) most beneficial to society as a whole? Economics provides tools to answer this question.
Economics relies on the use of money as a "common measuring rod". The values to society of the provided goods and servicesare all quantified in money to make them comparable. These values are measured so as to reflect society's preferences for theenvironmental goods and services provided. For non-marketed goods and services - i.e. goods and services that are notexchanged on a market - economists have developed valuation methods to estimate their value to society as a whole. Theseeconomic values help quantify trade-offs between different goods and services: for instance between agricultural production andgame park tourism revenue. Measuring these trade-offs help identify the best land use from the point of view of society as a wholeand provides one way to arbitrate conflicts. For example, it may not be worth investing in restoring productivity of existingagricultural land but rather reforest this land and capture revenues from carbon storage or wildlife-based tourism activities.
Setting property rights that are well-defined, excludable, transferable, and enforceable is another way of arbitrating conflicts andcomplements the design of economic instruments for improved management.
How do we decide how to best reverse land degradation on a given piece of land (i.e., environmental restoration)?
Different levels of environmental restoration require different levels of effort, (i.e. different levels of investment of time and money).For instance, to maintain declining timber stocks, two options can be taken: reducing timber harvest, or fully banning timberharvest. Both options have different impacts on people making a living from economic activities relying on the natural resource(timber). Banning timber harvest may lead to a loss of jobs for vulnerable populations (social cost) for a gain in forest cover(ecological benefit). Their implementation also requires different budgets for implementation: monitoring of a ban is often costly andcompensation to vulnerable populations may need to be provided.
So, what management options do we need for a given piece of land to best maintain its economic productivity? What budget doesit require and who provides this budget? Budgets are often a limiting factor, so what management options do we choose for a givenbudget to achieve our goal? Again, economics provide tools to answer these questions.
How do we define "sustainable" land management?
Sustainability is typically associated with a flow of physical or economic benefits continued through time. For instance, land canhelp naturally filter water and provide clean water. This clean water supply by l is a physical benefit. This physical benefit isassociated with an economic benefit. Society does not pay for this natural water treatment. It is important to note that physical oreconomic benefits do not always overlap. There are cases where environmental degradation can lead to the creation of neweconomic activities. In other words, a loss of physical benefits can be associated with an increase in economic benefits. Forinstance, increased water pollution can lead to the development of a water treatment infrastructures and job creation. Increasedwater pollution corresponds to a decrease in what economists call natural capital, but it leads to an increase in physical capital(water treatment facilities) and human capital (jobs).
If the decrease in natural capital is offset by the increase in physical and/or human capital, some economists consider the systemsustainable because the total level of capital is maintained even if there is a decrease in natural capital. In the economics literature,keeping the total level of capital (natural, physical and human) constant is referred to as "weak sustainability" whilst keeping the
WLC Template
file:///E|/Dropbox/WaterHealthNewFinal/Course4/discussion/WH40M050D001challenges1.htm[12/17/2014 12:52:35 AM]
level of natural capital constant is referred to as "strong sustainability".
Ecologists typically consider strong sustainability whilst economists may consider either strong or weak sustainability. Ecologistsare indeed interested in maintaining or expanding the level of natural capital. For economists, the choice between strong and weaksustainability is a matter of social preferences, i.e. which of these two options people choose. This choice relates to how muchtrade-off between the different forms of capital would be acceptable to society as a whole, that is how much extra physical capitalsociety as a whole would need to compensate for the loss of natural capital and still have the same level of enjoyment orsatisfaction (utility).
The economic assessment toolbox for use in policy-making
Economics provides a common measuring rod for comparison of benefits and costs from society's point of view. It provides arational to allocate scarce resources - including natural resources - between competitive uses so as to make the most of them.
A theoretical economist typically estimates the supply curve and the demand curve for a good or service. As quantity increases,demand decreases and supply increases. This economist can then derive the socially optimal quantity (Q*) and price (P*) for thisgood and service where they intersect. This intersection is called the equilibrium point and is represented by the letter E* intheFigure .

WLC Template
file:///E|/Dropbox/WaterHealthNewFinal/Course4/discussion/WH40M050D001challenges1.htm[12/17/2014 12:52:35 AM]
Figure: The economic optimum E* characterised by quantity Q* and price P* arising as the result of interaction betweensupply and demand. Source: (Emmanuelle Quillérou, 2014 personal communication).Image: supply vs demand curves.
Much simpler and less data intensive tools are often used for policy assessment. A few examples ofassessment types are:
Cost-benefit analysis consists in comparing the costs and benefits of a planned action or project against what would happen ifnothing is changed. If physical benefits are considered rather than economic (monetary) benefits against costs, this is called a cost-effectiveness analysis.
Damage assessment is linked to litigation and aims to estimate the level of compensation to be provided after environmentaldamages. This level of compensation can be arbitrarily set from a given level of physical damages or can be estimated from theeconomic costs of the damage incurred.

WLC Template
file:///E|/Dropbox/WaterHealthNewFinal/Course4/discussion/WH40M050D001challenges1.htm[12/17/2014 12:52:35 AM]
Regulatory analysis sets standards for environmental quality derived from scientific and/or economic analyses.
Land-use planning aims to effectively balance competitive land uses. It can be based on a formal economic assessment of costsand benefits for different land uses, although in practice a full economic assessment of land uses is seldom undertaken.
Natural resource accounting aims at capturing the depreciation of environmental or natural capital stocks at the country level,complementing more traditional indicators of an economy's health such as the Gross National Product (GNP). Natural resourceaccounting is now piloted in different countries following the 2009 report by the Commission on the Measurement of EconomicPerformance and Social Progress, also known as the "Stiglitz-Sen-Fitoussi report".
Sustainability assessment aims at identifying whether a current activity can be sustained over time or not [i.e., whether the levelof physical (and/or monetary) benefits derived from it can be maintained].
Multi-criteria analysis is a method that helps choosing between different scenarios from quantitative and qualitative data using ascoring system. Multi-criteria analysis can include economic data but not exclusively. The scenarios considered in a multi-criteriaanalysis are explicitly traded off one against the other to be able to choose the best one.
All of these assessment types can include economic tools, which have been used to varying degrees across countries. In practicehowever, cost-benefit analysis and natural resource accounting are explicitly derived from economics, whilst other forms ofassessment have traditionally focused more on physical rather than monetary changes. This is now slowly changing withassessments increasingly including a wider range of disciplinary perspectives.
Economic assessment provides a rationale for decision-making on action or inaction from a society's point of view. Economics notonly helps assess the needs for policy instruments but also design and calibrate these instruments. Typical economic instrumentsare taxes, subsidies, quotas or norms, tradable permits and property right regimes. They can be supplemented by other non-economic instruments such as certification, labelling, education and legislation. For instance, economics can help us identify whatconstitutes sustainable usage of land that is, the target we should be aiming for, and estimate how much tax (subsidy) needs to beimposed (granted) to change behaviours and achieve this target.
What values do policy-makers need for economic assessment?
"Nowadays people know the price of everything and the value of nothing."
Oscar Wilde The Picture of Dorian Gray (Chapter 4)
Think about the above quotation. It draws attention to the explicit difference between price and value. Price and value are alsodifferent concepts in economics. The economic value of a good or service reflects the preferences that society as a whole has forthis good or service. A price is determined by the market as the result of interaction between demand and supply. Price reflects thetrue economic value allocated by society to this good or service under specific market conditions. However, markets do not alwaysexist or may be imperfect. This leads to a discrepancy between economic value and price.
It is not because something does not have an explicit price that it does not have any value to society. This is in particular true fornon-marketed goods such as clean air: simply because you cannot buy a litre of clean air on the market does not mean that cleanair does not have a value to you!
Also, market prices might not reflect the full economic value to society as a whole. When this is the case, economists talk aboutmarket failures. Market failures typically arise because of incomplete information, inefficient property right allocations or what areknown as externalities.

WLC Template
file:///E|/Dropbox/WaterHealthNewFinal/Course4/discussion/WH40M050D001challenges1.htm[12/17/2014 12:52:35 AM]
Consider a simple example of a market failure arising because of an externality. Agricultural commodities such as wheat are tradedon the world market. However, world market prices of commodities do not consider water pollution resulting from the use offertilisers (nitrogen) as inputs to agricultural production. This water pollution imposes a cost to society as it affects people's healthand reduces their work output. The cost of water pollution in this case is measured through the loss of productivity. The cost ofwater pollution could also be measured by the cost of water treatment (or the increased cost) to water users and taxpayers. In thissituation, from society's point of view, the full cost of agricultural production is the cost of water pollution added to the cost ofagricultural production. If the costs of water pollution and the costs of agricultural production are borne entirely by farmers, theexternality is said to have been internalised. Assuming demand remains the same, the quantity of agricultural commodity producedand water pollution decrease as a result of this internalisation. Because of the reduction in agricultural commodity quantityproduced, commodity prices increase and internalising the externality is only worth doing if the increased price of agriculturalcommodities is offset by the reduction in the cost of water pollution. This scenario optimises the combination of agriculturalproduction and water pollution and not just agricultural production. That way, resources for agricultural production are used in amore economically efficient way which is desirable from society's point of view.
However, in real-life farmers usually only pay for the cost of agricultural production. Because the cost of water pollution is not borneby those who produce it (farmers), water pollution is what economists call an externality. In more general terms, an externality issomething generated by one party but which costs or benefits are borne by another. Externalities are common causes of marketfailures. In the above example, water pollution is an externality generated by farmers with costs of water treatment borne by therest of society.
Water pollution is a typical example of a negative eternality because it imposes a cost on a third party (consumers of drinkingwater) and consequently on society as a whole. Externalities are however not always negative: they are positive when a benefit is provided free of charge to third parties.Pollination is a typical example of a positive externality. The cost of bee-keeping are borne by bee-keepers with pollination providedto farmers free of charge. Pollination increases agricultural and tree yields around the beehives, thereby increasing benefits ofneighbouring farmers and consequently the whole of society, without farmers compensating beekeepers for these extra benefits. Inthis example, farmers implicitly have property rights over their land and own any benefit provided to them on this land, whichincludes pollination. If bee-keepers were granted property rights over pollination provided by their bees, then farmers have tocompensate bee-keepers for the pollination service provided.
So far, we have talked about the economic value of a good or service. This goes back to the difference between what prices andvalue are, but also refers to a difference in viewpoints. When talking about prices, we tend to adopt the viewpoint of an individualor firm trading within a given society or economy. When talking about economic value, we typically take the perspective of societyas a whole, with or without trade.
Imagine you would like to buy a good being sold at the price of $100. This good is subject to a 20% consumption tax and ends upcosting you $120 at the till. The $20 are taken from you as an individual through the tax and redistributed within your nationaleconomy, i.e. as subsidies to poor farmers. This is 20 for you, but +20 for someone else in your economy. This $20 tax doestherefore not change the wealth of society as a whole but is a transfer payment from you to someone else within the economy.$120 is the price you paid for the good but society as a whole paid only $100 for it. $120 is the financial price of the good youpurchased whilst $100 is the true economic price or economic value, with a $20 transfer payment.
There also exist price distortions generating a discrepancy between the financial and the economic price. Price distortions can beintroduced in perfectly functioning markets by regulations like minimum wage policies.
So, contrary to the quotation by Oscar Wilde, the goal as economists is to know the economic value of something (i.e., theenvironmental good, service or feature under consideration), in order to estimate the economic price it should have. To derive thiseconomic value, there are two available options: a) estimate it for non-marketed goods or services by using environmentalvaluation methods, or b) correct observed financial prices to reflect the true economic value of the good or service underconsideration from the perspective of society as a whole. Economic value or economic price are used interchangeably in thisdiscussion when referring to the true value of a good or service from society's point of view. Financial prices refer to actual marketprices.
Questions
1. Explain why economic analysis can be a useful tool for policy-makers
2. Describe the steps behind each valuation method, underlying assumptions and methodological and empirical limitations
3. Identify a suitable method for valuation of a non-marketed good or service
4. What steps and information would be needed to critically assess the choice of valuation method, its application and results for an

WLC Template
file:///E|/Dropbox/WaterHealthNewFinal/Course4/discussion/WH40M050D001challenges1.htm[12/17/2014 12:52:35 AM]
existing valuation study?
5. True or false. Economics provides tools to quantify the trade-offs between alternative uses of a scarce resource such as thoseprovided by land and make economically optimal decisions.
Answer: True.[EQ1]
6.Multi Responses[EQ2] . Different tools are available for environmental assessment use in policy-making. In the list provided,which are the ones systematically based on economics? Select as many as appropriate.
(a) Cost-benefit analysis
(b) Damage assessment
(c) Land use planning
(d) Sustainability assessment
(e) Natural resource accounting
(f) Regulatory analysis
(g) Cost-effectiveness analysis
(h) Multi-criteria analysis
Answer: a, e and g (g for costs only, not benefits), although the other types of assessment are progressively moving from beingbased on physical changes to economic changes.
7. Fill in the following table. Tick the relevant box to classify the environmental goods and services and identify the third partybearing the costs or benefits in the last column. The first line has been filled as an example.
Negative
externality
Positive
externality
Third party
bearing costs or benefits
Recharge ofgroundwater ü Water users
Flood and erosioncontrol
Water purification
Nitrogen contaminationof groundwater reserve
Nitrogen contaminationof farm pond becauseof run-off from the farmfields

WLC Template
file:///E|/Dropbox/WaterHealthNewFinal/Course4/discussion/WH40M050D001challenges1.htm[12/17/2014 12:52:35 AM]
Bird nesting
Recreation (hunting,hiking…)
Aesthetic values
Answer 7:
Negative
externality
Positive
externality
Third party
bearing costs orbenefits[EQ3]
Recharge ofgroundwater ü Water users
Flood and erosioncontrol ü Farmers and house owners
Water purification ü Drinkable water consumers
Nitrogen contaminationof groundwater reserve ü Water users
Nitrogen contaminationof farm pond becauseof run-off from the farmfields
- -
This is not an externality:the polluter is also the one
who bears the costs ofpollution
Bird nesting ü Hunters
Aesthetic values ü Recreational users
Recreation (hunting,hiking…) ü
Recreational users (hunters,hikers…)
[EQ1]All these answers should be collated in a separate answer file to be provided to students and/or placed at the end of the unit. It is importantto separate the answer from its question so that students have a stronger incentive to think about what to answer rather than check the answerfirst, [EQ2]Multiple responses is NOT the same as multiple choice. Multiple choice implies one answer and multiple responses have several possibleanswers. [EQ3]INTERACTIVE: Any answer is fine, please leave students enter free text in this column.
8. True or false. A market failure arises when the market does not allocate resource in an economically optimal manner. It is oftenassociated with externalities which cause a discrepancy between private and social benefits and/or costs.
WLC Template
file:///E|/Dropbox/WaterHealthNewFinal/Course4/discussion/WH40M050D001challenges1.htm[12/17/2014 12:52:35 AM]
Answer: True
9. Select the one correct statement:
(a) Price is the result of the market interaction of demand and supply. Value and price are two different concepts. Economic pricescan be used to estimate true economic values but financial prices cannot.
(b) Price is the result of the market interaction of demand and supply. Value and price are two similar concepts. Financial pricesand economic prices can both be used to estimate true economic values.
(c) Price is the result of the market interaction of demand and supply. Value reflects on the underlying preferences for differentgoods and services of society as a whole. Economic prices and under specific market conditions values, financial prices can beused to estimate true economic values.
Answer: (c). Undistorted financial prices are equal to the true economic price and can be good estimates of the true economic valuein this specific market context.
Questions - Cost-Benefit Analysis
1. Describe the steps required to undertake a cost-benefit analysis
2. Critically assess an existing cost-benefit analysis

WLC Template
file:///E|/Dropbox/WaterHealthNewFinal/Course4/discussion/WH40M050D003challenges2.htm[12/17/2014 12:52:36 AM]
Water and Health - Challenges
Environmental Valuation - An Economist's Approach
This is a very short introduction to environmental valuation. This section aims to give a basic understanding of the assumptionsbehind established valuation methods, why different methods lead to different estimates, how each of these methods works, whatkind of results they lead to and some of their limitations. Even though the following focuses on environmental valuation, thesevaluation methods are not specific to the environment and can be applied to other goods that are not traded on a market such ashealth and healthcare, proximity to schools.
Guidance on Analysing Existing Case Studies or Conducting a Valuation Exercise
This section also is intended to provide a guide to analyse existing case studies or conduct a valuation exercise yourself. Themethod description, background, assumptions and limitations should help you help answering the following questions when facedwith an economic value estimate: How reliable is the value? Can it be replicated? How valid is it? Does it match the valueallocated by society as a whole or a specific group in society? Does it correspond to the total economic value allocated by societyor only a fraction of this value?
Section Learning Outcomes
By the end of this section students should be able to:
· Describe the total economic value framework
· Recognise that different valuation methods lead to slightly different estimates because of what they measure and how theymeasure it
· Describe the steps involved in each of the valuation methods, the main assumptions underlying each method and somemethodological and empirical limitations
The Economist's Toolbox for Environmental Valuation
Total economic value is one of the most common frameworks for environmental valuation. This framework is anthropocentricbecause it is based on how society values these goods and services. This perspective is based on the use of utility as a measureof preference. Utility represents how much enjoyment society as a whole derives from a good and/or service. Utility is a flexibleconcept reflecting your preference for consumption or non-consumption of a good. For example, let us assume you like eating fruit:in economics terms, you derive utility from consuming fruit. However, if you do not like fruit, you derive utility from not consumingfruit. Utility applies to individual's preferences between goods whilst society's preferences are measured by welfare.
Total economic value and the associated utilitarian perspective is not the only economic approach available to decision-makers butit is based on explicit trade offs and social preferences. This corresponds to the way decision-makers take decisions in real-life:how much should society invest in mangroves versus clean air? How much should society invest in maintaining the quality of theenvironment versus investing in healthcare?.
This framework divides the total economic value of a good or a service into a use value and a non-use value. Use value refers tothe benefit derived from the use of the environmental good or service. Examples of use values are the revenues derived fromharvesting fish or from extracting oil from the ground (including off-shore), from the recreational use of a given site such as aneighbouring park or forest, or from living in a home with an ocean view. These uses can be direct, like fish harvesting or indirect,like flood regulation.
Non-use values are values allocated by society to goods and services but do not stem from the use of these good and services.You might for instance value the Great Barrier Reef in Australia or the Amazonian forest even if you do not nor will ever use it.
Use and non-use values are assumed independent one from the other and mutually exclusive. This assumption means that useand non-use values can be estimated separately and then added up to derive the total economic value: Total Economic Value = Use Value + Non-use Value
Non-use values can be further broken down into Option, Existence, Bequest and Stewardship values ( Figure 2). Option value isthe value allocated by society to the potential future use of a good or service and accounts in some measure for uncertainty. Forinstance, you might live far away from a blue whale breeding site but would still like to be able to enjoy watching blue whales at

WLC Template
file:///E|/Dropbox/WaterHealthNewFinal/Course4/discussion/WH40M050D003challenges2.htm[12/17/2014 12:52:36 AM]
some point in the future. You would therefore be ready to pay to protect blue whales and maintain the option to watch them later inyour life. Existence values refer to the value placed by society on the existence of an environmental good or service. For instance,you may never have the opportunity to personally see a live blue whale in its original habitat, but you like the idea that it exists andwould be happy to pay to help preserve its existence. Bequest value is the value placed by society on the environmental statepassed onto the next generation. For example, you might want your children to live in a pollution-free environment and thereforeplace a value on bequeathing them a pollution-free environment. Stewardship value is the value placed by society on themaintenance of a healthy environment for all living organisms and not just humans. Conservationists and people living off servicesprovided by the environment (farmers, fishers…) typically have stewardship values.
Figure: Decomposition of the Total Economic Value into use and non-use values. The sizes of the boxes are notrepresentative of any order of magnitude. Source: (Emmanuelle Quillérou, 2014 personal communication).Image: TEV framework
The total economic value provides a simple conceptualisation of the different types of economic values. It also serves as the basisfor categorising the different valuation methods. Some valuation methods capture use value only whilst other valuation methodscapture use value plus varying proportions of non-use value. However, this framework is not as easy to apply in practice. Thedifference between the types of values (e.g. use and non-use) is often fuzzier in real life than this Total Economic Value frameworksuggests. It is not always easy to differentiate between the different types of values in practice.
Economic Measures of Value: How do we measure changes in welfare?
What we want to measure are changes in society's welfare associated with the loss or gain in environmental goods or services. Welfare is an economic measure of society's level of "happiness". These changes in welfare represent the benefits or costs tosociety as a result of a change in environmental service provision.
Changes in welfare are assumed by neoclassical economists to depend on society's preferences. Changes in welfare requireknowledge on both demand and supply but are often estimated in contexts where demand is not easily observable. Welfarechanges are thus not straightforward to measure in practice.

WLC Template
file:///E|/Dropbox/WaterHealthNewFinal/Course4/discussion/WH40M050D003challenges2.htm[12/17/2014 12:52:36 AM]
The methods described in the following sections are based on slightly different measures of welfare changes. These are describedin more details in the next sections. There are three types of valuation methods:
1. Non demand-based methods2. Demand-based revealed preference methods3. Demand-based stated preference methods
The non demand-based methods consist in estimating the costs incurred from an increase (decrease) in environmental quality.This increase (decrease) in costs leads to a decrease (increase) in quantity supplies for a given demand associated to a increase(decrease) the economically optimal price. What is measured here is the change in welfare associated with the change in the costof provision. These methods can be very useful for policy decisions in practice as cost data is often available. However, becausethe influence of demand for environmental goods and services is ignored by these methods, economists often prefer to usedemand-based methods to estimate demand for environmental goods and services.
Demand-based methods are called so because they rely on changes in demand. They allow to derive a demand curve forcomparison to the cost of provision (supply curve). Revealed preference methods use surrogate markets to estimate the value ofnon-marketed goods and reveal preferences from market behaviour. These methods do not involve changes in income levels andrely on existing payments or costs incurred. A fraction of that cost is explicitly associated with the non-marketed environmentalgood or service. For example, apartments near Central Park in New York are more expensive than similar apartments elsewheresimply because they are close to the Park. A fraction of their market value is linked to the proximity to Central Park. The propertymarket is the surrogate market in this example. Revealed preference methods estimate the fraction of the apartment market valueand assume it corresponds to the social value of being close to Central Park. Because they rely on existing surrogate markets,these methods typically capture use values but not non-use values. The hedonic price and travel costs methods are examples ofrevealed preference methods and are detailed more specifically in the following sections.
Stated preference methods have been developed so as to capture (some of) the non-use value of an environmental good orservice. They are called "stated" because they involve people directly stating how much they would be willing to pay for an increasein the provision of an environmental good or service (or how much they would be willing to accept for a decrease in provision).Stated preference methods are based on intended rather than on actual behaviours like revealed preference methods. However,these methods do not lead to the same type of demand being estimated because they involve changes in income levels contrary torevealed preference methods. The contingent valuation and choice modelling methods are examples of revealed preferencemethods and are detailed more specifically in the following sections. Because they rely on people stating their preferences ratherthan expressing them through actual markets, these methods capture the use value and (some of) the non-use value of theenvironmental good and/or service.
In practice, all demand-based methods are prone to experimental biases and often lead to very diverse estimates of value. Thesemethods are still criticised in the academic literature. They are however improving over time and remain the only methods availableto capture non-use values so far.
Revealed preference methods measure economic value as a change in consumer surplus and rely on Marschallian demand curves.Stated preference methods measure economic value as a change in the area under a Hicksian demand curve. Consumer surpluscan be defined as the difference between the money consumers would be willing to spend and the actual price they are paying.This is detailed in more details below.
Economists can use two different types of demand curves: the Marshallian demand curve and the Hicksian demand curve. TheMarshallian demand curve, named after Alfred Marshall, is the demand for a good when income is held constant and utilityderived from the good varies. The Hicksian demand curve, named after John Hicks, is the demand for a good when the utilityderived from the good is held constant and income varies. It is mathematically possible to derive one type of demand curve fromthe other. The type of demand curve that is considered for further economic analysis and assessment depends on the studycontext and assumptions. In practice, it is often easier to estimate the Marshallian demand curve empirically because it is based onobservable variations in consumer surplus.
Three different measures of preferences are used in environmental valuation: consumer surplus, willingness to pay and willingnessto accept. Consumer surplus is the area between a demand curve and the market price as represented in the Figure . Consumersurplus variations can be derived from observed data to estimate a Marshallian demand curve. Revealed preference methodsestimate changes in consumer surplus and therefore lead to the derivation of a Marshallian demand curve.

WLC Template
file:///E|/Dropbox/WaterHealthNewFinal/Course4/discussion/WH40M050D003challenges2.htm[12/17/2014 12:52:36 AM]
Figure: Consumer surplus is the area ABE and producer surplus the area EBD. The sum of consumer and producer surplus isequal to welfare (area ABD). The demand curve is a Marshallian demand curve. Source: (Emmanuelle Quillérou, 2014 personalcommunication).Image: Marshallian demand curve
Willingness to pay is the area under the demand curve (see Hicksian demand curve in Figure below). It is basically the amount ofincome the individual is willing to give up to secure a reduction in price for the same quantity provided. This is a theoretical conceptwhich is measured in practice by what is called a compensating variation. The compensating variation is the income peoplewould be willing to give up to prevent the loss of environmental good or service and keep the same level of utility (or level of"enjoyment"). Compensating variation refers to a change in price (income) whilst compensating surplus refers to a change inquantity of good and/or service.
Willingness to accept is also the area under the demand curve and could be represented similarly to willingness to pay in . Bothwillingness to pay and willingness to accept rely on changes in income to keep utility constant and are therefore linked to a

WLC Template
file:///E|/Dropbox/WaterHealthNewFinal/Course4/discussion/WH40M050D003challenges2.htm[12/17/2014 12:52:36 AM]
Hicksian demand curve. Willingness to accept is basically the amount of income the individual is willing to accept to compensate fora change in price of goods and/or services. This is a theoretical concept which is measured in practice by what is calledequivalent variation. The equivalent variation is the income people would be willing to accept to keep the same level of utility (orlevel of "enjoyment"). An equivalent variation applies to a change in price (income) whilst an equivalent surplus applies to a changein quantity of good and/or service.
In real life willingness to pay and willingness to accept do not overlap exactly despite what is theoretically suggested in the above.The direction of the change considered influences estimates of economic values. This phenomenon is called hysteresis. This isbecause people tend to be more willing to accept more money for an increased degradation in environmental quality compared towhat they are willing to pay for a corresponding improvement in environmental quality. This leads to discrepancies economic valueestimates depending on whether people are asked about their willingness to pay (for increasing environmental quality) orwillingness to accept (for decreasing environmental quality).
Figure: Willingness to pay is the grey area ACD. The demand curve is a Hicksian demand curve (utility is constant andincome varies). Source: (Emmanuelle Quillérou, 2014 personal communication).
Image: Hicksian demand curve

WLC Template
file:///E|/Dropbox/WaterHealthNewFinal/Course4/discussion/WH40M050D003challenges2.htm[12/17/2014 12:52:36 AM]
It can be shown that:
Compensating variation < Change in consumer surplus < Equivalent variation
The theoretical derivation of this inequality is beyond this unit. This inequality implies that, in theory, a change in consumer surplusconstitutes on average a good estimation of economic value. However, in practice, any of these may be underestimated oroverestimated, so despite being theoretically appealing, the change in consumer surplus might not always be the best averageestimate. The most appropriate measure of welfare change needs to be determined based on the specific study context. Dependingon your economics background, this section might not make sense to you yet. You should try reading through the description of thedifferent methodologies and then come back to it. It should be clearer the second time! In the end, this section should have givenyou a feel for the complexity of the theory behind environmental valuation methods. What is important to remember is that themethod you choose influences the estimate of the economic value obtained as a result. This is because the chosen methodnot only influences how much of the total economic value you estimate (for either use value only, or use and non-use values), butalso what kind of approach (non demand-based or demand-based) is used to estimate welfare changes and how it is measured(changes in consumer surplus, willingness to pay or willingness to accept). Additionally, because people's willingness to accept ishigher than their willingness to pay, estimates of economic values depend on the question asked and the direction of the changeunder consideration. A good understanding of the context of your study is critical for choosing a valuation method that gives reliableand valid estimates of the true economic value.
Non-Demand Curve Approaches to Valuation
Non-demand curve approaches to valuation can refer to the use of market prices, replacement costs, dose-response methods,mitigation behaviour and/or opportunity costs to value a given good or service provided.
Market prices are the result of trade. In neoclassical economic theory, perfect competition is a necessary condition for prices toreflect the true economic value of the good or service, as if driven by an 'invisible hand'. Market prices can thus be used forenvironmental goods (forest) or services (timber) that are traded. Prices can be distorted compared to the true economic value bypolicies (minimum price or wage), market settings (monopoly, oligopoly), the mode of trade (auctions). In non-perfectly competitivemarkets settings (monopoly and/or oligopoly) prices are set higher than under perfect competition and are consequently alsoconsidered as distorted. Price distortions can also be introduced when goods are auctioned rather than traded under a perfectlycompetitive market. Taxes and/or subsidies need to be removed from market prices to estimate the true economic value. Taxes andsubsidies are transfer payments within the economy and do not change society's welfare nor the true economic value of the goodconsidered. The use of market prices is an easy enough proxy for economic value, but is not as straightforward as it first appearsand should be used with caution.
Replacement costs also rely on market prices, but the value of the good or service is measured instead by how much it wouldcost to replace it. For instance, a forest could be valued by how much it would cost to replant it. This method relies on marketprices and is thus prone to the same problems as the market price method. Replacement costs only measure a fraction of the trueeconomic value of a good: it does not include the value of the good linked to preventing changes nor takes the demand for thisgood into account. For instance, benefits provided by an established forest are timber exploitation, water filtration, carbon storage,recreational and amenity values. Newly planted forests however do not provide these benefits. The value of this established forestis thus greater than the costs of seedlings (replacement costs).
Dose-response methods are based on linking a change in output - typically a change in productivity - to a change inenvironmental quality. Environmental quality is considered as a factor of production in this approach and increasing production hasan impact on environmental quality. For instance, a paper mill produces paper but its production also create water pollution.Increasing paper production increases water pollution (decreases the environmental quality). In this example, the cost of improvingenvironmental quality is the cost (forgone profit) of decreasing paper production. It is however not always possible to link aproduction output to a change in environmental quality so this approach is not always applicable.
Mitigation behaviour relates to actions that people take to avoid the negative consequences of environmental degradation.Forinstance, one way to mitigate the impact malaria is to limit the probability of contracting the disease, that is getting an infectedmosquito bite. This can be done by using mosquito nets and repellents. The cost of malaria mitigation is in this example the cost ofmosquito nets and repellents, and provides one proxy indicator (also called "proxy") for the social cost of malaria to society as awhole. The cost of malaria to society as a whole is however not limited to preventing the contraction of the disease and includesthe costs of palliative care and healthcare treatments. Mitigation costs only represent a fraction of the total economic cost tosociety.
Opportunity costs are based on the next best alternative available (the first best alternative being the current state). This istypically used when several mutually exclusive management options exist. For example, the second best alternative to preserving a

WLC Template
file:///E|/Dropbox/WaterHealthNewFinal/Course4/discussion/WH40M050D003challenges2.htm[12/17/2014 12:52:36 AM]
forest can be to convert the land on which it stands to agriculture.
The profit that would be made from agricultural production represents the opportunity cost of preserving the forest. In other words,the opportunity cost of forest preservation is the forgone agricultural profit. For instance, land under forest often corresponds tolower value agricultural land, that is, land that has lower than average forgone profits. Taking the average agricultural incomeforgone profit as a proxy for the forest value in this case overestimates the true agricultural value of the land when converted toagricultural production. Also, if the proxy measure of opportunity cost is highly variable, its average value is not an accurate valueof the true opportunity costs incurred either. Also, because agriculture is the second best use of the land after the forest, even ifthe true opportunity cost is estimated, it is lower than the current value of the forest. If this was not the case, then there is noreason to keep the land under forest and not clearing it.
Most of these methods are convenient for estimating economic value of environmental goods andservices. They however lead to values which do not directly reflect people's preferences for theenvironmental good or service but rather their preferences for the proxies considered. For instance,the cost of mosquito nets is a proxy of the value of mitigating malaria. The price of mosquito netsdoes reflect perfectly on society's preference for mosquito nets assuming nets are traded in aperfectly competitive market but only indirectly measures of people's preference for avoidingmalaria. Because of these drawbacks, economists have favoured the demand-based methods whichrely on the elicitation of people's preferences as described in the next section.
Revealed preference method: the Hedonic Price Method
Hedonic pricing is one of the two revealed preference methods. It is based on the use of a surrogate market with actual (observed)market behaviours to estimate the value of non-marketed goods (referred to as "characteristics" for this method). This methodrelies on the assumption that people value a good based on the sum of its characteristics. Welfare changes are measured bychanges in consumer surplus. The most cited contributor to the development of this method is Lancaster (1966).
The hedonic price method consists of one generic and two specific steps:
Step 0 – Build the survey and sampling plan to collect data on the good's price, the good's levels (quantities) ofindividual characteristics, respondent's characteristics and timing of survey
Step 1 – Estimate the "hedonic price function", that is, price as a function of the characteristics
Step 2 – Estimate the inverse Marshallian demand equation, that is, price as a function of quantity
Step 0 is in most textbooks not considered to be an actual step of the hedonic price methodology. Step 0 consists in: i) identifyingthe environmental characteristic to be valued, the surrogate market good with this environmental characteristic, and thestakeholders (users as this is a use value method) to state explicitly how "society as a whole" is defined; ii) designing a survey(questionnaire) and a sampling plan; iii) creating a database with the collected data. This step is not specific to hedonic pricing butis essential to obtain representative data to derive reliable and valid estimates of economic values. Step 0 leads building thehedonic price database required to undertake both steps 1 and 2. A hedonic price database typically includes the price (e.g. ahouse price) and levels (quantities) of individual characteristics of the good (e.g., number of rooms, distance to nearest school,percentage of sea view), respondent characteristics (income range, age, education level), timing of the survey (spring, summer, fall,winter).
Reliable and valid estimates can be extrapolated from a sample to the overall population. Estimates are said to be (statistically)reliable when repeated measures lead to the same value, in other word when results can be replicated. Estimates are said to be(statistically) valid when their value is close to the true unknown value. There are two ways of ensuring collection of datarepresentative of the overall population. The first is to design a sampling plan to collect data from a representative sample from thepopulation (in this context "society as a whole") before data collection. The second is to collect data on respondents and check thataverage values and distributions of each respondent characteristic match those of the population after the data is collected. This isoften done by asking respondents to provide characteristics about themselves: the area where they live, their income range, theirage, their education level, in other words anything that might make preferences vary across individuals. We also need to takeseasonal variations into account as they could influence people's willingness to pay. Respondent characteristics and time patternsare typically included into regression analysis to "control for variation" and derive reliable and valid estimates.
Step 1 is often referred to as the first stage of the hedonic price method. It consists in regressing the price of a good (e.g. a house)
WLC Template
file:///E|/Dropbox/WaterHealthNewFinal/Course4/discussion/WH40M050D003challenges2.htm[12/17/2014 12:52:36 AM]
on its characteristics (size of the house, number of rooms, distance to the nearest school, distance to the park considered, distanceto other parks). The coefficient of one characteristic estimated by the regression corresponds by assumption to a marginalwillingness to pay, i.e. the marginal unit price for each characteristic (e.g. price paid for an extra square meter, price for an extraroom, price for an extra meter to the nearest school). This method often assumes a specific relationship between the overall(known) price and its characteristics, which is mathematically modelled by a specific functional form. You need to refer to aneconometrics course for more details on potential functional forms and estimation techniques. The influence on the coefficientvalues of this assumed relationship can be tested by changing the functional form adopted.
Step 2 is often referred to as the second stage of the hedonic price method. Willingness to pay is the area under the demandcurve. Knowing willingness to pay, we can easily derive the demand curve using mathematical techniques. Step 2 consists in usingthe marginal willingness to pay (characteristic coefficients) estimated in Step 1 as parameters in the estimation of an inverseMarshallian demand equation. In other words, this step assumes that the price of the characteristic is a function of the quantity ofthis characteristic as well as other parameters that can influence demand for a good or characteristic. The variables used for Step2 regression need to be independent from the variables used in Step 1. Step 2 regression ideally includes variables such asincome, quantities and prices of substitute and complementary goods, tastes, the type of environmental good considered ("normal","inferior", or "superior" good). As this second-stage is often not undertaken in practice, further details are beyond the scope of thisunit.
Step 1 is prone to the following limitations. First, it relies on a surrogate market. This market needs to be perfectly competitive sothat prices reflect the true economic value of the good. If not, then a bias is introduced in the estimation of the willingness to pay(Step 1). This in turn causes to a bias in the estimation of the demand curve (Step 2). The second limitation is linked to thefunctional form chosen in Step 1. Depending on the functional form chosen, the marginal prices of characteristics can varydrastically. The robustness of the results obtained in Step 1 can be assessed by repeating the regression for several functionalforms. The third limitation is linked to the fact that the hedonic method relies on the explicit underlying assumption that the value ofthe good is equal to the sum of its characteristics'. This assumption is often not met in real-life, as the sum of the parts(characteristics) is very often greater than the total (the observed price). By design, the hedonic price method also only allows toestimate the use value but not the non-use value of an environmental characteristic. The non-use value can be just as high (if nothigher) than the use value depending on the context. Not taking it into account is therefore limiting and does not reflect the fulleconomic value to society.
Step 2 is prone to the following limitation: it is not always possible to include variables that influence demand not correlated tothose used in Step 1 in Step 2.
Also, the hedonic pricing method relies on deriving a price for individual characteristics from a surrogate good with an observedmarket price. This market price is the result of the interaction of both demand and supply for the surrogate good. The willingness topay for each attribute estimated in the hedonic price function is therefore a proportion of market equilibrium prices. This leads tothe derivation of a demand curve based on a series of market equilibrium points and not just demand. In economics, demand andsupply are assumed independent one from the other and should therefore be estimated separately in theory. This is not fully thecase in the hedonic price method and this method is therefore not theoretically optimal despite being suitable for empirical analysis.
Revealed preference method: the Travel Cost Method
The travel cost method is the second revealed preference method. The idea behind this method is that the more people pay totravel to a site of interest, the more that site is economically worth to society as a whole. This method is therefore based on theuse of the travel cost to estimate the value of non-marketed goods and relies on surveys. The Marshallian demand curve is derivedby relating the number of visits (quantity) to the costs of each visit (price). As for the hedonic price method, this method measureswelfare changes through changes in consumer surplus.
The travel cost method consists in one generic and two specific steps:
Step 0 – Build the survey and sampling plan to collect data on the origin of travel, journey cost and time, number ofvisits, distance to substitute goods, respondent's characteristics and on the timing of survey
Step 1 – Estimate the cost of one trip as a function of the number of visitors, also called distance decay curve
Step 2 – Estimate price as a function of quantity following the introduction of a hypothetical entry fee that is theinverse Marshallian demand equation

WLC Template
file:///E|/Dropbox/WaterHealthNewFinal/Course4/discussion/WH40M050D003challenges2.htm[12/17/2014 12:52:36 AM]
Step 0 is not specific to the travel cost method and consists of the same steps as the hedonic method, the only difference beingthat the survey questions focus on travel cost and time rather than surrogate good prices and characteristics. Step 0 leads buildinga travel cost database that allows us to undertake both steps 1 and 2. For this we need the origin of each respondent's journey tothe site of interest (e.g. from their home or hotel to the park or reserve), the journey cost and time, the number of visits for a giventime (week, month, year), the distance to substitute goods (e.g. another nearby park), some respondent characteristics (incomerange, age, education level) to control for variations between individuals and the time of year the survey was taken to control forseasonal patterns in usage. Time needs to be transformed into a monetary value to be added to the observed cost of travel statedby the visitor. This is often done by taking the opportunity cost of time, that is the forgone benefit derived from the next bestalternative. In the case of travel costs, the alternative to travelling is working and the opportunity cost of time is measured by theworking wage forgone.
Step 1 relies on a regression of the number of visitors or visits per level of travel cost. You need to refer to a more specificeconometrics course for more details on regression techniques. In the following example, step 1 has led to determine that, out ofthe total 200 people coming to visit the reserve, 100 people pay $1, 60 people pay $2, 40 people pay $3 and none pay $4 or over.This is summarised in Table .
Table: Example of a travel cost table of results. Source: (Emmanuelle Quillérou, 2014 personal communication).
Travel cost Number of visits
$1 100
$2 60
$3 40
$4 and over 0
Total = 200
From this, the total number of visits to the site can be graphically represented for a given travel cost (seeFigure ). Typically, themore expensive the travel journey, the lower the number of visitors coming to the site. This curve is called the distance decaycurve.

WLC Template
file:///E|/Dropbox/WaterHealthNewFinal/Course4/discussion/WH40M050D003challenges2.htm[12/17/2014 12:52:36 AM]
Figure: Distance decay function derived from the application of the travel cost method. Source: (Emmanuelle Quillérou, 2014personal communication).Image: decay curve
Step 2 consists in introducing an entrance fee to the site and using the results from step 1 to derive the number of people thatwould come to visit the site for this entrance fee. Introducing an entrance fee of $1 means that people formerly paying $1 travelcost now pay a total of $2. Step 1 of this example has established that 60 people come to visit the reserve at a total cost of $2.The same reasoning can be applied to people formerly paying $2 and over. The number of people paying a $0 entrance fee is thetotal number of people surveyed, potentially extrapolated to a larger population. The results are summarised in the Table below,with the number of visits to the reserve for a given total cost. Table: Computation of the total number of visits for a $1 entrance fee. Source: (Emmanuelle Quillérou, 2014 personalcommunication).
Entrance fee Travel cost Total cost Number of people
$1 $1 $2 60
$1 $2 $3 40
$1 $3 $4 0
Total = 100
Applying the same reasoning for a $2 entrance fee and for a $3 entrance fee, the overall results shown in the Table are obtained.
Table: Total number of visits for each level of entrance fee. Source: (Emmanuelle Quillérou, 2014 personal communication).

WLC Template
file:///E|/Dropbox/WaterHealthNewFinal/Course4/discussion/WH40M050D003challenges2.htm[12/17/2014 12:52:36 AM]
Entrance fee Total number ofpeople
$0 200
$1 100
$2 40
$3 0
The results in the above able have been graphically represented in the Figure below to visualise the demand function for thereserve. This is not the same as the distance decay function from Step 1 because entrance fees have been introduced and thenumber of visitors to the reserve refers to a level of entrance fee rather than a travel cost.
Figure: Marshallian demand curve derived from the application of the travel cost method. Source: (Emmanuelle Quillérou, 2014 personalcommunication).
Image: Marshallian demand curve of travel costs
The travel cost method applied to individual visitors is referred to as the individual travel cost method. Visitors can also begrouped by zone of origin, i.e. zones defined for a common range of travel distance or travel time. This application is referred to inthe literature as the zonal travel cost method. The zonal travel cost method has been initially designed and favoured because oflimited spatial information available. Both variations of the travel cost method (individual and zonal) rely on the same stepsdescribed above, he only difference being whether individuals are aggregated for travel cost estimation or not. Choosing one or theother depends on the context of the study and available data. Data availability and computing capacities permitting, the individualtravel cost method should be preferred to the zonal travel cost method.
One of the main problems faced when applying the travel cost method is the valuation of the journey time into money units. Thevalue of journey time is often valued based on its opportunity cost. Some people enjoy the journey just as much as the destinationand the value of time measured in money therefore changes from one person to the other. It is not always easy to isolate the timeand costs relating to visiting a specific site, especially when people make multi-purpose trips. This is because the journey time andcosts are shared across several sites and the relationship between travel costs and utility derived from the site is not as direct as

WLC Template
file:///E|/Dropbox/WaterHealthNewFinal/Course4/discussion/WH40M050D003challenges2.htm[12/17/2014 12:52:36 AM]
for a single purpose trip. Also, seasonal patterns and socio-economic factors need to be taken into account so as to derive ameaningful value from the extrapolation of survey results to a whole population for a year.
By design, and similarly to the hedonic price method, the travel cost method allows the estimation of a use value only. The non-usevalue can be just as high (if not higher) than the use value depending on the context. Not taking it into account can therefore belimiting because is does not reflect the full economic value to society.
Stated preference method: the Contingent Valuation Method
The Contingent Valuation method is one of the two stated preference methods. a stated preference method because it does notrely on a surrogate markets to "reveal" preferences but is based on a statement of how much (or rather how much more)respondents would be willing to pay.
The Contingent Valuation method is based on establishing a credible hypothetical market and asking people to state how muchthey are willing to pay to conserve a given non-marketed good or to accept a reduction in provision in order to estimate theeconomic value of this good.
Welfare changes are measured through changes in willingness to pay (accept). In theory, an income-compensated Hicksiandemand curve can be mathematically derived by integrating the willingness to pay (accept) function. However, in practice this is notoften done and the average or median willingness to pay (accept) is directly taken as a proxy for the economic value to be used incost-benefit analysis.
The contingent valuation method consists of four steps:
Step 1 – Set up the hypothetical market by describing the environmental good, the institutional context and acredible payment vehicle.
Step 2 – Build the sampling plan of survey respondents and collect survey data on the levels of environmentalprovision, obtained bids and respondent's characteristics
Step 3 – Estimate mean and median willingness to pay (accept)
Step 4 – Estimate the bid curve i.e. the willingness to pay (accept) as a function of respondent characteristics(income, age, education) and the level of environmental quality, then aggregate the data
Step 1 relies on building a hypothetical market for survey respondents to make credible bids. This involves describing thishypothetical market with the appropriate level of details, so respondents can make informed choices. This hypothetical market hasthree components: (i) a description of the environmental good or service, (ii) a description of the institutional context in which theenvironmental good or service is to be provided and (iii) the method of financing or payment vehicle. Focus groups representativeof the society considered are useful in testing and refining the hypothetical market set up and description.
The description of the environmental good or service specifies precisely the current state of the environmental good or service, theconsequences of a change for this state and who the change is likely to affect. It can be a simple text description but photos oranimated films can also be used to show how changes impact the current state. It also needs to clearly identify the time at whichbenefits from the change would arise as this might influence the respondents' willingness to pay. For example, you may be willingto pay more for benefits (e.g., replenish fish stock) arising within 5 years than in 10 years time only.
The institutional context refers to whether the good or service is managed by a public body, a private firm, a stakeholdercooperative or individual stakeholders. People have preferences for these types of organisation and these preferences are reflectedin their bids. Specifying this clearly is thus essential to obtain valid and reliable estimates of willingness to pay (accept).
The payment for the environmental good depends on the study context and the type of value targeted (use or non-use). Paymentcan be made through various payment vehicles such as entrance fees, local property taxes, national income taxes, sales taxes,development aid or special international funds, in-kind donations of labour or local subsistence crops. Similarly, the willingness toaccept payment can be made as a lump sum, tax credits or tax reductions, in-kind donations of labour or local subsistence crops.

WLC Template
file:///E|/Dropbox/WaterHealthNewFinal/Course4/discussion/WH40M050D003challenges2.htm[12/17/2014 12:52:36 AM]
The choice of a financing method influences the bid levels because of varying distributional effects on the population. The paymentvehicle needs to be clearly identified in the hypothetical market set up.
Step 2 starts with the building of the sampling plan, in order to obtain representative bids for the whole population. There aredifferent ways to conduct the survey but delivering it through face-to-face interviews often ensures a higher level of responses andhelps better assess the respondent's understanding and commitment to the problem of interest. The goal is to obtain bids for eachlevel of environmental provision described in the survey as well as data on the respondent's characteristics (income, age,educational level) that could influence how much they bid. They are several ways of deriving bids: as a bidding game, as a close-ended referendum with yes/no answers, as a payment card with a range of values, as an open-ended question.
Step 3 consists in estimating the average and median willingness to pay (accept). You need to refer to a more specificeconometrics course for more details on regression techniques. The mean and median willingness to pay (accept) are estimatedfrom the descriptive statistics or from the regression depending on the survey questions. Protest bids - that is bids of zero that donot reflect a zero value but rather a refusal to answer - are usually ignored in order to compute the mean and median willingnessto pay (accept). If close-ended yes/no questions are used, a discrete choice model can be used to statistically (econometrically)estimate the probability of making a non-zero bid (or "yes" answer) as a function of environmental quality, income-level andrespondent characteristics. In this case, the area under the curve gives the mean willingness to pay.
Step 4 consists in estimating the bid curve i.e. using a regression to estimate the willingness to pay (accept) as a function ofrespondent characteristics (income, age, education) and the level of environmental quality. This allows us to estimate how thewillingness to pay (accept) varies with different levels of characteristics. The data can then be easily aggregated to derive anestimate of the total willingness to pay (accept). To be able to aggregate results and derive valid and reliable estimates of economicvalues implies that the population of reference (i.e. society as a whole) has been identified, that the mean willingness to pay of thepopulation can be derived from the sample mean and that the time period over which the benefits are gained is well identified.
Although fairly straightforward in its design, the contingent valuation methodology is prone to many biases (a form of measurementerror) and its application can be tricky. Firstly, the method is prone to design biases. These biases are a result of the hypotheticalnature of the market, the strategic behaviour of the respondents and interviewer, the "warm glow" effect (i.e. feel-good factor fromgiving money to what is perceived as good cause) or a social desirability effect. This can lead to respondents providing higher (orlower) estimates than they otherwise would. The chosen starting point, chosen payment vehicle, type of questions asked, scale,scope, sequencing and context also affect the willingness to pay (accept) estimate.
Secondly, the method is also prone to several information biases. The quantity and quality of information embedded into thehypothetical market specification and provided to respondents has been shown to influence willingness to pay (accept) estimates.This may represent more information or different information than respondents would be faced with in the real world. This mightlead to economic values that do not represent preferences of society as a whole but rather values of specific stakeholder groups.
Thirdly, the Contingent Valuation is prone to the part-whole bias. This refers to the fact that the sum of values of individualcomponents of a good (e.g. elements of a landscape such as crops, trees, biodiversity) is greater than the value allocated to thegood as a whole (e.g. landscape).
Fourthly, the market set up is hypothetical and respondents might provide estimates of their willingness to pay that are alsohypothetical and might not materialise in real-life when the hypothetical market is implemented. This is especially true when thechange considered is very risky or very political and more respondents make protest bids.
A fifth step could be included to assess the reliability of the Contingent Valuation exercise in terms of the answers gathered andthe credibility of the values obtained.
Stated preference method: Choice experiment
Choice experiment, also called choice modelling or conjoint analysis, is the second stated preference method. It was designed toovercome the warm glow and part-whole biases of the contingent valuation method by making respondents explicitly choosebetween alternative scenarios. These scenarios include levels of environmental or non-environmental attributes and a level ofpayment which varies between scenarios. The choice experiment method forces respondents to trade-off explicitly different

WLC Template
file:///E|/Dropbox/WaterHealthNewFinal/Course4/discussion/WH40M050D003challenges2.htm[12/17/2014 12:52:36 AM]
proposed scenarios, thereby revealing their preferences for overall scenarios and individual attributes of the scenarios. For thesame reasons as the Contingent Valuation method, it is a stated preference method. By varying the scenarios for each respondentand across the different respondents, the willingness to pay (accept) for each scenario and each attribute can be statisticallyestimated.
Welfare changes are measured through changes in willingness to pay (accept). In theory, the income-compensated Hicksiandemand curve can be mathematically derived by integrating the willingness to pay (accept) function. However in practice this is notoften done. The main interest of using the method is to obtain a proxy for the economic value from the change in welfare inducedby a change in environmental provision: the average or median willingness to pay (accept) is often directly plugged into a cost-benefit analysis without going through a formal estimation of demand and supply.
The choice experiment method consists of four steps:
Step 1 – Identify the current situation, likely changes and their consequences. These help to identify attributes,attribute levels and payment levels for each scenario
Step 2 – Build unique choice cards by selecting combinations of scenarios (i.e. a bundle of attribute and paymentlevels)
Step 3 – Design the survey instrument with the following five sections: i) describe the changes and theirconsequences, ii) describe the method of payment, iii) select a set of choice cards for each respondent, iv) addquestions to elicit the respondent's attitude and v) finish with questions on the respondent's characteristics (income,age, education)
Step 4 – Estimate willingness to pay and aggregate the results
Step 1 consists in developing an understanding of the context of the study, which is just as important as for any other piece ofresearch. This step prepares for the description of the study context to be provided to the respondents. It is critical as it is used toidentify the individual building blocks to establish the scenarios provided to the respondents, which have been summarised in Tablebelow. This identification can rely on selected representative focus groups.
Table: Identification of attributes, their current level or (most likely) levels for a given change. Source: (Emmanuelle Quillérou, 2014 personalcommunication).
Attributes Levels
a1 1, 2, 3
a2 1, 2, 3
a3 1, 2, 3
Payment p1, p2, p3
Table: Example of land-based attributes from a case study. Source: adapted from Borresch et al. (2009, Table 2 Indicators for the included LandscapeFunctions page 4)
Landscapefunction/characteristic
Values/Levels Explanation

WLC Template
file:///E|/Dropbox/WaterHealthNewFinal/Course4/discussion/WH40M050D003challenges2.htm[12/17/2014 12:52:36 AM]
Plant biodiversity · 170 plants/km²
· 190 plants/km²
· 205 plants/km² (status quo)
· 225 plants/km²
· 255 plants/km²
Absolute number of plantsinvestigated per km²
Animal biodiversity · 50% of desired population
· 70% of desired population(status quo)
· 80% of desired population
· 90% of desired population
· 100% of desired population
Percentage of desired populationof eleven indicator bird species
Water quality · Less than 10mg Nitrate/l
· 10-25mg Nitrate/l
· 25-50mg Nitrate/l
· 50-90mg Nitrate/l
· More than 90mg Nitrate/l
Water quality measured as thecontent of nitrate/l due tocommunication with respondents
Landscape aesthetics · Status Quo
· Multifunctionality scenario
· Grassland dominated scenario
· Intensity scenario (withincreased field sizes)
· High price scenario (withincreasing percentage
· of cereals)
Landscape options werepresented with images in thesurvey.
Price variable · 0/€/household/year
· 40€/household/year
· 80€/household/year
· 120€/household/year
· 160€/household/year
· 200€/household/year
Costs for provision of presentedlandscape options per householdand year.

WLC Template
file:///E|/Dropbox/WaterHealthNewFinal/Course4/discussion/WH40M050D003challenges2.htm[12/17/2014 12:52:36 AM]
Step 2 consists in building unique choice cards by selecting combinations of scenarios from all the possible scenarios. Eachscenario is a bundle of attributes and payment. Table 8 provides an example of attributes from an existing choice experiment. TheTable below represents the typical structure of a choice card. You may have even been asked to fill in one of those before, withoutknowing how researchers would analyse these!
Table: Example of a choice card structure. am_k refers to attribute m, level k; and pj to the payment level. Source: (Emmanuelle Quillérou, 2014personal communication).
Scenario 1 Scenario 2 Scenario 3
Attribute a1 a1_1 a1_1 a1_3
Attribute a2 a2_3 a2_2 a2_1
Attribute a3 a3_1 a3_1 a3_2
Payment p1 p2 p1
Tick one box corresponding toyour preferred scenario
o o o
There are several methods to select attributes and build up the choice cards but this is beyond the scope of this unit. Oneconstraint is that the attributes and their levels need to be orthogonal, that is, any attribute is fully independent from all others. Thisis a necessary condition to be able to correctly measure the trade-off between attributes and estimate a willingness to pay. Thisapproach is very computationally demanding and a newer approach - called efficient designs - has been developed more recently.The efficient designs approach consists in making assumptions on the sign and relative magnitude of the willingness to pay (accept)coefficient for each attribute. This approach has been recently shown to lead to more efficient estimates of willingness to pay(accept).
Step 3 is the design of the survey instrument (questionnaire). As for contingent valuation, it is necessary that the respondentunderstands the problem fully and gives a credible and accurate answer reflecting their actual - rather than hypothetical -willingness to pay. Also as for contingent valuation, the survey instrument includes a description of the current state, likely changesand their positive and negative consequences. It should include just enough information so that the respondent gives an answer asclose to a real-life setting as possible. Respondents are often presented with several choice cards. One respondent faces severalchoice cards and no two respondents face the same set of choice cards. This ensures enough variability in the answers providedto undertake a reliable and valid estimation. Questions on the respondent's attitude towards change and/or conservation can beincluded to better assess the credibility of the answers provided and provide information on reasons behind choosing one oranother alternative. As for all environmental valuation methods, the survey finishes with questions on the respondent'scharacteristics (income, age, education…). This survey may be delivered face-to-face for increased effectiveness and better directassessment of answer validity and accuracy. A pilot questionnaire can be tested on representative focus groups to identify how toimprove the questionnaire before the formal data collection.
Step 4 consists in estimating the willingness to pay and then aggregating the results. Depending on the specific format of thechoice card, discrete models (logit, probit), paired-comparison models or random utility models can be used to statistically estimatethe marginal willingness to pay associated with each attribute. You need to refer to a more specific econometrics course for moredetails on these estimation techniques. Aggregation of the results to derive the total willingness to pay depends on the assumptionson the marginal willingness to pay. Willingness to pay typically decreases with increasing scale or scope: the willingness to pay perhectare is higher for small sites (scarcer resources) than for bigger sites (less scarce). The total willingness to pay for the biggersite is typically lower than the willingness to pay per hectare in the small site multiplied by the surface of the big site. Extrapolationof a willingness to pay value from a small site to a bigger site needs to take this into account.

WLC Template
file:///E|/Dropbox/WaterHealthNewFinal/Course4/discussion/WH40M050D003challenges2.htm[12/17/2014 12:52:36 AM]
Like the contingent valuation method, the choice experiment method captures the non-use value of a good or service. The choiceexperiment method also relies on a hypothetical market set up in experimental conditions and may be prone to biases. Thismethod is very demanding in terms of data and data collection. It requires a high level of human, institutional and computationalcapacity because of the specific statistics and technical skills involved. Because respondents are requested to make explicit choicesbetween scenarios, this method also relies on the assumptions that preferences are both stable (i.e. which do not change in time)and consistent (i.e. if scenario A is preferred to B, and B is preferred to C, then A is preferred to C). This has been proven not toalways be valid in real-life and these assumptions should be checked upon using statistics or checking individual answers.
Benefit transfer
Economic valuations can be costly in terms of financial, time and human resources. Benefit transfer offers a cheaper alternative toother valuation methods as it reuses already available information. As a result, benefit transfer shows great potential fordevelopment as well as integration of environmental valuation into policy-making. The method has developed in relation to valuingdemand for (rather than supply of) environmental goods and services. Benefit transfer simply consists in "transferring" economicvalues from one case study with a known non-market economic value to a similar site to be valued in monetary terms. Thistransfer of values can be in theory made across time, space, populations and sometimes across ecosystem goods.
Benefit transfer consists of two steps:
Step 1 – Identify a case study of reference as a source of economic value for the non-marketed good of interest(site 1)
Step 2 – Transfer the economic value from the case study of reference to the case study to be valued (site 2)
Benefit transfer can be undertaken by identifying two sites (Site 1 and Site 2) that are similar in terms of the environmental goodsand services they provide. If they have similar population sizes and characteristics, the transfer is simply the allocation of Site 1'seconomic value to Site 2. If Site 1 and Site 2 have different scales and/or scope (i.e. Site 1 is 1 ha and Site 2 is 100 ha and/or Site1 has 1 environmental good and Site 2 has 10), the known economic values of Site 1 obtained by other valuation methods need tobe extrapolated before allocation to Site 2. This is so that the value allocated to Site 2 from Site 1 reflects its true economic value.Sites can often be quite different and located in regions or countries with very different populations and incomes. Meta-regressionmodels have been used to transfer values by controlling for some of the main factors of variation such as income level. You needto refer to an econometrics course for more details on how to estimate the economic value for the case study of interest usingmeta-analysis.
Despite its theoretical appeal and potential, benefit transfer is still prone to scale, scope and sampling effects. These can impair thederivation of reliable estimates of environmental values and thus need to be tested for. In practice, adjustment factors might berequired for benefit transfer which depend on the change in scale considered. Whether or not to adjust values for accurateextrapolation and how to best do so still needs to be dealt with on a case-by-case basis.
Multi-criteria analysis
Multi-Criteria Analysis (MCA) or Multi-criteria Decision Analysis (MCDA) is a semi-qualitative procedure used to compare ordetermine overall preferences between alternative and often conflicting options. It helps identify a preferred option in multi-disciplinary contexts without requiring agreement on the preferred option or how to weight assessment criteria or how to value allcriteria in monetary terms. Assessment criteria can be quantitative or qualitative (score) and can relate to social, technical,environmental, economic and financial changes. It is easy to use and has a wider scope than cost-benefit analysis because itincludes qualitative as well as quantitative data.
Multi-criteria analysis is not an environmental valuation method as such but rather helps identify preferred scenarios without usingeconomic valuation techniques. It is used as an alternative to cost-benefit analysis. It can however be seen as the ancestor of thechoice modelling method because of it similar structure, hence its description here. It does not involve a variation of attribute andprice levels but rather assesses options (scenarios) along several quantified or scored criteria (attributes). This method can beused as a preliminary to environmental valuation to screen scenarios and identify a preferred scenario and its criteria to beeconomically valued for more formal economic assessment.

WLC Template
file:///E|/Dropbox/WaterHealthNewFinal/Course4/discussion/WH40M050D003challenges2.htm[12/17/2014 12:52:36 AM]
Multi-criteria analysis consists of three steps:
Step 1 – Determine alternative options (scenarios) and criteria (attributes) for appraisal
Step 2 – Measure criteria or indicators, physically, in monetary terms of by scoring them
Step 3 –Aggregate the criteria values for each option by weighting the criteria and select the option with the highestscore
Step 1 identifies potential options (scenarios) as well as criteria or indicators to assess whether these options are socially desirableor not. For instance, Option 1 could correspond to a business-as-usual scenario with a reduction in productive land area of 10%per year, Option 2 to actions leading to a 5% decrease in productive land area per year, Option 3 to actions leading to a 0%decrease in productive land area per year. Examples of criteria to assess whether these options are socially beneficial are: thenumber of land-based jobs lost because of the reduction in productive land size, the number of jobs created by establishingalternative land-based livelihood options (economic activities), the likelihood of floods, pollution levels, recreational and culturalactivities… The general structure of a multi-criteria analysis is represented in theTable below.
Table: Example of a multi-criteria analysis structure. Source: (Emmanuelle Quillérou, 2014 personal communication).
Option 1 Option 2 Option 3
Criteria c1
Criteria c2
…
Criteria cn
Step 2 involves putting a quantitative or qualitative value for each criterion and each option. Ideally, the more socially desirable theoutcome, the higher the criterion value to ensure consistency of ranking across the different criteria. What really matters are therelative variations for a given criterion between options - that is, the trade-off between 2 options for a given criterion. For instance,Option 1 is associated with losing 10 land-based jobs, Option 2 with losing 8 jobs and Option 3 with losing no job. To obtain theright ordering between options, a score of 0 (=10-10) can be given to option 1, 2 (=10-8) to option 2 and 10 to option 3 (=10-0). Asimilar ranking process can be applied to each criterion seeTable below.
Table: Example of multi-criteria analysis criteria. Source: (Emmanuelle Quillérou, 2014 personal communication).
Option 1:
Business-as-usualscenario, 10%
decrease in landarea per year
Option 2:
5% decrease in landarea per year
Option 3:
0% decrease in landarea per year
Criteria c1: loss of land-basedjobs (score)
0 2 10
Criteria c2: likelihood of floods 80% 60% 30%
Criteria c3: loss of recreationaland cultural activities
40% 5% 1%

WLC Template
file:///E|/Dropbox/WaterHealthNewFinal/Course4/discussion/WH40M050D003challenges2.htm[12/17/2014 12:52:36 AM]
The absolute value of one criterion might affect the overall outcome if it is too different from the others. That is, if all criteria butone have their values between 1 and 10 and the last criterion has values between 100 and 200, this last criterion affects the finalchoice of option. A change of scale for this criterion can effectively solve this scaling problem.
Step 3 involves determining weights for each criterion. This can be done through selected focus groups and for variousstakeholders. Ideally the final mix of stakeholders should be representative of society as a whole. Each individual stakeholder canassign weights to each criterion. The weights are then aggregated to derived mean weight across all respondents for each criterion.The scores are then computed for each option as the weighted sum of the criterion values seeTable below. The highest valuecorresponds to the most socially desirable option, either for one stakeholder group or society as a whole depending on the natureof the respondent.
Table: Example of the general outcome from a multi-criteria analysis for selection of the most socially desirable option.Source: (Emmanuelle Quillérou, 2014 personal communication).
Criteria Weight Option 1 Option 2 Option 3
Criteria c1 w1 c1_1 c1_2 c1_3
Criteria c2 w2 c2_1 c2_2 c2_3
Criteria c3 w3 c3_1 c3_2 c3_3
Criteria c4 w4 c4_1 c4_2 c4_3
VALUE (SCORE) OF OPTION
w1*c1_1
+ w2*c2_1
+ w3*c3_1
+ w4*c4_1
w1*c1_2
+ w2*c2_2
+ w3*c3_2
+ w4*c4_2
w1*c1_3
+ w2*c2_3
+ w3*c3_3
+ w4*c4_3
This method also has its limits. There is a risk of double counting for overlapping objectives. It relies on expert judgement whichdoes not always correspond to preferences of society as a whole. The ordinal scoring of qualitative impacts is potentially tooarbitrary. Where significant differences in weightings occur between particular groups, preferred scenario might drastically differbetween groups. It might be difficult to derive a scenario that would be acceptable to all groups. Finally, this method is subject tosmall sample biases which arise when the sample is too small to allow for extrapolation to the entire population.
QUESTIONS For Self Assessment
1. True or false. Total Economic Value = Use value + Non use value
Answer: True.
2.True or false. There are two types of valuation methods: the non demand-based methods and the demand-based revealedpreference methods.
Answer: False. There are three types of valuation methods: the non demand-based methods and the demand-based revealedpreference methods and the demand-based stated preference methods.
3. True or false. Different methods are based on different measures of welfare changes, which can lead to differences in the

WLC Template
file:///E|/Dropbox/WaterHealthNewFinal/Course4/discussion/WH40M050D003challenges2.htm[12/17/2014 12:52:36 AM]
economic values estimated between methods.
Answer: True.
4. Multi Responses. Which methods are non-demand curve approaches to valuation? Select as many as appropriate.
(a) Market prices
(b) Contingent valuation
(c) Benefit transfer
(d) Replacement costs
(e) Hedonic pricing
(f) Travel cost
(g) Dose-response methods
(h) Mitigation behaviour
(i) Opportunity costs
(j) Choice Experiment
(k) Multi-criteria analysis
Answer: a, d, g, h, i. Hedonic pricing and Travel costs are revealed preference methods and Contingent valuation and ChoiceExperiment are stated preference methods. Multi-criteria analysis is not a valuation method.
WLC Template
file:///E|/Dropbox/WaterHealthNewFinal/Course4/discussion/WH40M050D006challenges3%20Cost-benefit.htm[12/17/2014 12:52:39 AM]
Water and Health - Challenges
Environmental Valuation - An Economist's Approach
Cost-benefit analysis
This section is a brief introduction to the principles behind cost-benefit analysis and the type of conclusions that can be derivedfrom it. Cost-benefit analysis is often used to assess whether a project, an action or a planned change are worth implementingcompared to doing business-as-usual. More specifically, this section describes how to undertake a financial cost-benefit analysisfrom actual (financial) prices, and then how to adapt it to the viewpoint of society as a whole to derive an economic costs-benefitanalysis (also called social cost-benefit analysis). This section is meant to provide a guide to critically analyse an existing cost-benefit analysis or to conduct one.
Cost-benefit analysis is often used to assess whether a project, an action or a planned change are worth implementing comparedto doing business-as-usual.
Section Learning Outcomes
By the end of this section students should be able to:
· Describe the cost-benefit analysis framework
· Identify relevant stakeholders, area of interest and a timeframe
· Identify and value costs and benefits with and without project
· Describe how to structure a financial cost-benefit analysis
· Explain why economists use discounting and its consequences for consideration of future generations
· Calculate financial indicators to assess if it is worth undertaking the project
· Explain why sensitivity analysis is important and how to undertake it
· Describe the steps involved in adapting a financial cost-benefit analysis to obtain an economic cost-benefit analysis
Identification of Stakeholders, area of interest, and timeframe
Firstly, as for any good study, it is important to understand the context in which the assessment is to be done very carefully andthoroughly. A good understating of the study context is essential to build a cost-benefit analysis that closely matches real-lifeconditions and derive reliable results for informed decision-making. Failing to do so invariably leads to inaccurate and/or misleadingoutcomes with policy-makers and project managers taking the wrong decisions. As well as a waste of financial and humanresources, consequences of these ill-informed decisions can be disastrous especially for vulnerable populations (e.g. the poor). Soit is very important to do a good job from the start and get it right!
Cost-benefit analysis is a tool that helps assess whether a project is worth undertaking compared to business-as-usual. As part ofthe context analysis, the area of interest (project scale) and the main stakeholders should be clearly and explicitly identified. Themain stakeholders often include local communities, local or national government bodies, non-governmental organisations (NGOs),donors... Participation of local stakeholders into the cost-benefit analysis process can often help identify who should be consideredas impacted by the project and with what scale/scope. Including the right people form the start help raise awareness about theproject. This is also helpful to calibrate the cost-benefit analysis so as to more closely match real-life conditions and derive resultsthat leads to good decision-making.
It is also very important to consider on what timescale the change (project) occurs in order to give an appropriate timeframe to thecost-benefit analysis. Again, this can be fostered by stakeholder participation for greater assessment accuracy.
The constraints faced by stakeholders, the area of interest and the chosen timeframe impact the amounts and variation of costsand benefits across stakeholders, space and time. These constraints should also be identified as part of the context to better frame

WLC Template
file:///E|/Dropbox/WaterHealthNewFinal/Course4/discussion/WH40M050D006challenges3%20Cost-benefit.htm[12/17/2014 12:52:39 AM]
the cost-benefit analysis and potential associated risks.
Identification of "with project" and "without project" scenarios (i.e., business as usual)
With project net benefits = With project benefits With project costs Without project net benefits = Without project benefits Without project costs
Incremental net benefit = With project net benefits Without project net benefits
Cost-benefit analysis is a method derived from accounting. It is used by policy-makers and project managers to assess whether anaction, planned change or project is worth undertaking. This framework of analysis considers that a project is worth undertaking ifthe net benefits derived from it are greater than the costs. This is often undertaken separately for each stakeholder or group ofstakeholders. Costs and benefits of the project are to be identified as clearly and precisely as possible. They can be broken downinto as many categories as appropriate. They can be calculated from individual prices and quantities. The net benefit derived fromthe project is computed as follows: With project net benefits = With project benefits With project costs
Even if we keep doing business-as-usual, benefits and costs vary from one year to the next. The likely pattern of variation in costsand benefits (or in prices and quantities) needs to be identified. Similar to the with project scenario, the without project (orbusiness-as-usual) net benefit can be computed as follows: Without project net benefits = Without project benefits Withoutproject costs
A cost-benefit analysis compares the net benefit derived from implementing the project to the without project net benefits for eachstakeholder (or each stakeholder group). That is the incremental net benefit is derived as follows:Incremental net benefit = Withproject net benefits Without project net benefits
The idea is that the project is worth undertaking if the incremental net benefit is positive, i.e. if the net benefits are greater for thewith project scenario than for the without project scenario. This requires knowledge of the economic values for the costs andbenefits and their timing as detailed in the following sections.
Which costs and which benefits?
Benefits and costs can be estimated from unit quantities and prices. The Table below shows examples of quantities and unit pricesthat can be used to estimate costs and benefits for a range of land uses. For example, the benefits associated with are agriculturalyields times the number of hectares cropped times the price per ton of crop. For a national park, benefits correspond to thenumber of visitors times the entry fee charged per visitor. The benefits derived from carbon storage are the number of tonnes ofcarbon stored times the price for each tonne of carbon.
Table: Example of quantities and prices to estimate costs and benefits for a range of landuses. Source: (Emmanuelle Quillérou, 2014 personal communication).
Type of land use: Agriculture National park orconservation area
Carbon storage
Benefits
Quantity Crop yield (tonnes/ha) timesarea cropped (ha); number ofanimals (kg of meat)
number of visitors (countrynationals, foreign tourists…)
Number of tonnes of carbonstored
Price
(per quantity unit)
Market price for crops; Marketprice for animals; Marketprice for meat
entry fee per visitor;willingness to pay per visit (ifno entry fee charged)
Carbon market price
Variable Costs

WLC Template
file:///E|/Dropbox/WaterHealthNewFinal/Course4/discussion/WH40M050D006challenges3%20Cost-benefit.htm[12/17/2014 12:52:39 AM]
Quantity Quantity of agricultural inputs(fertiliser, water, seeds,animal feed and fodder, fueland machinery, family labour,hired labour…)
Number of park employees(park rangers, welcomecentre…)
Number of trees planted
Price
(per quantity unit)
Market price per unitagricultural input; labour wage
Labour wage Price per tree seedling
Costs can be decomposed into variable costs and fixed costs. Variable costs vary with the quantity used (the higher the quantityused, the higher the cost). Fixed costs do not vary with the quantity used (e.g., insurance, building depreciation…).
The gross margin and net income can then be computed for a given year as follows:
Gross Margin = Benefits - Variable costs
Net income = Gross Margin - Fixed costs
Time Preference and discounting to compare values
Let us start with an example to help understand what time preference is:
- If you are given $10 today, would you take the money? Yes!
- If you are given $10 but you can choose between receiving this money today or tomorrow, when would you take it? You wouldprobably choose to have it today rather than tomorrow but waiting till tomorrow should be fine too.
- Taking this further, if you have to choose between receiving $10 today or next year, you would most probably choose to havethe money today rather than next year. Now, if you could choose between receiving $10 today or $11 next year, what would youchoose? And what if I offered you $20 next year instead?
Your choice on whether to take the money now or later depends on both how long you have to forego the money for and howmuch more money you receive to compensate for that extra waiting time. This is the same principle behind earning interest on yoursavings in a bank account: the bank pays you extra for leaving your money in your account to compensate for you not spending ittoday. In economics, the trade-off made between receiving money now and later is called a time preference.
Costs and benefits are typically incurred at different times of a project. These are not directly comparable because of inflation andtime preferences. Preferences do not change significantly over the timeframe of the project by assumption. To undertake a cost-benefit analysis, all costs and benefits need to be comparable in how they are measured (price system), their currency as well asacross time. Real prices can be derived from observed nominal prices by correcting for inflation. To assess a project's worth, theincremental net benefits need to be made comparable in time before they can be summed up. Discounting is the technique usedto express equivalent economic or financial values at one given point in time. Costs and benefits occurring in the future arediscounted to obtain the value they would have if they were occurring today. This value is called the present value.
The current value of future benefits and costs is computed as follows: Present Value = Discount Factor * Value (yearconsidered)
The discount factor directly reflects on time preferences. Several formulas exist for the discount factor. One of the most commonones is: Discount Factor = 1/(1+r)^(t 1)
where r is the discount rate (social discount rate in an economic analysis) and t is the year. The further in the future the costand/or benefit occurs, the less it is worth today. Also, the higher the rate of discount (r), the less the future is worth compared tothe present. A simple way of remembering this is that the higher the rate of discount is, the quicker an amount of money losesvalue in time.
Economists call the preference for the present (i.e. "getting the money today") a positive time preference. People are said tohave a zero time-preference when they are indifferent between getting the money in the present or in the future. If they prefergetting it in the future, they are said to have a negative time preference. These terms correspond to the sign of the discount rateused (e.g. positive time preference for a positive discount rate). Table below provides examples of present values.

WLC Template
file:///E|/Dropbox/WaterHealthNewFinal/Course4/discussion/WH40M050D006challenges3%20Cost-benefit.htm[12/17/2014 12:52:39 AM]
Table: Example of timing of benefits and computation of their present value. Source: Emmanuelle Quillérou, 2014 personalcommunication)
Year 1 (present) Year 2 Year 3 Year 4
Benefit 100 140 200 200
Discount rate 10% 10% 10% 10%
Discount factor =1 =0.9091 =0.8264 =0.7513
Present value
= Discount factor *Benefit
100 127 165 150
Computation of net present values based on Table 14.
ØTaking 10% as the social discount rate, can you recalculate the discount factor and discounted benefitdetailed in the table?
ØCan you compute the present value of a benefit of 200 arising in Year 10 for r=10%? How does it compareto the present values of the same level of benefits in Year 3 and Year 4?
ØCan you compute the present values of the benefits when r decreases to 5%? Are they greater or smallerthan for r=10%?
Because of the timing of costs and benefits, the choice of a discount rate is not neutral and can influence the decision to undertakea project or not. A project that starts with high costs and have benefits later is less likely to be undertaken for a higher discountrate (giving a lower weight to later benefits than a smaller discount rate). This typically characterises environmental improvements.On the contrary, a project that starts with high benefits and have costs later (e.g. a nuclear power plant) is more likely to beundertaken for the same higher discount rate.
Choosing the appropriate rate of discount can be challenging. The rate varies across space, time and groups and is generallyhigher in younger and/or less developed countries. The chosen rate of interest often reflects current generation's time preferencesand ignores future generation's time preferences. Future generations are not here to signal their time preference (yet!) and theirinfluence tends to be ignored when choosing a discount rate. The more the present time has value to current generations (i.e. thehigher the discount rate) the more weight is given to present generations compared to future generations.
By design, a lower discount rate assumes more intergenerational equity than a higher rate. The Stern Review on the Economics ofClimate Change caused controversy at the time of its release (2006), because it considered a 1% rate of discount. 1% is arelatively low value, which gives almost equal weight to both today and tomorrow’s generations.
The social discount rate should, in theory, be determined based on current and future preferences of society as a whole for thepresent but also reflecting on current and future preferences for intergenerational equity. A good cost-benefit analysis shouldinclude a discussion on the consequences the chosen rate of discount rate has for future generations.
As a result of this time preference, strong identification of when benefits and costs arise is important to derive valid conclusionsfrom a cost-benefit analysis. How to set the discount rate is a choice that needs to be justified and the consequences of this choicemust be discussed. The social discount rate can be estimated through stakeholders survey. Another option would be to considerthe (social) opportunity costs of capital, that is, the rate of interest that would be earned by placing the money in a bank accountrather than spending it now.

WLC Template
file:///E|/Dropbox/WaterHealthNewFinal/Course4/discussion/WH40M050D006challenges3%20Cost-benefit.htm[12/17/2014 12:52:39 AM]
Economic indicators of a project's worth
Several indicators have been developed to assess whether a project is worth implementing. The main three indicators used forassessment are the net present value (NPV), the internal rate of return (IRR) and the benefit-to-cost ratio (BCR).
The net present value (NPV) or net present worth is computed after all economic values have been obtained and/or estimated.The net benefit for the with-project scenario is computed by subtracting the costs from the benefits for all years. The same is thendone for the without-project scenario. The net incremental benefit corresponds to the extra benefit derived from the project and iscomputed by subtracting the without project net benefit from the with project net benefit. The discounted value of the incrementalnet benefit is then computed taking year 1 as the year of reference and a 10% discount rate. The NPV of the project is the sum ofthe present value of the incremental net benefits across all years. These computations are illustrated in the Table below.
Table: Example of timing of benefits and the computation of the net present value.
With Project Year 1(present)
Year 2 Year 3 Year 4
Benefit 100 140 200 200
Costs 300 150 0 0
Net benefit 200 10 200 200
Without Project
Benefit 100 90 90 90
Costs 80 80 80 80
Net benefit 20 10 10 10
Incremental netbenefit 220 20 190 190
Present value ofincremental netbenefit (10%discount rate)
220 18 157 143
Economic Netpresent value (10%discount rate)
= 220 18 + 157 + 143 = 62
The project is considered worth undertaking for a NPV greater than 0 (positive) and not worth undertaking for a NPV less than 0(negative). The NPV can be used in a financial or an economic cost-benefit analysis. This indicator does not allow comparisonsacross alternative projects, but only to make a decision on whether a given project is worth undertaking or not. For instance, for aproject with a NPV of 100 and a project with a NPV of 1, both projects are worth undertaking. However, the project with the lowest
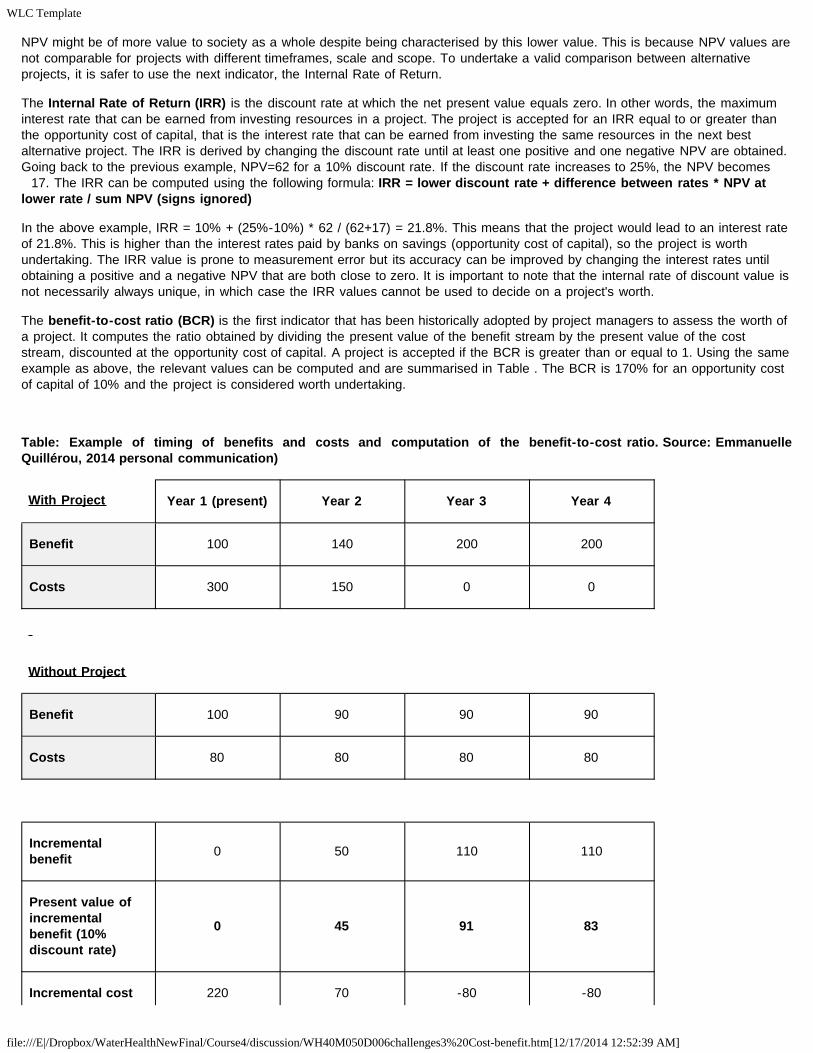
WLC Template
file:///E|/Dropbox/WaterHealthNewFinal/Course4/discussion/WH40M050D006challenges3%20Cost-benefit.htm[12/17/2014 12:52:39 AM]
NPV might be of more value to society as a whole despite being characterised by this lower value. This is because NPV values arenot comparable for projects with different timeframes, scale and scope. To undertake a valid comparison between alternativeprojects, it is safer to use the next indicator, the Internal Rate of Return.
The Internal Rate of Return (IRR) is the discount rate at which the net present value equals zero. In other words, the maximuminterest rate that can be earned from investing resources in a project. The project is accepted for an IRR equal to or greater thanthe opportunity cost of capital, that is the interest rate that can be earned from investing the same resources in the next bestalternative project. The IRR is derived by changing the discount rate until at least one positive and one negative NPV are obtained.Going back to the previous example, NPV=62 for a 10% discount rate. If the discount rate increases to 25%, the NPV becomes
17. The IRR can be computed using the following formula: IRR = lower discount rate + difference between rates * NPV atlower rate / sum NPV (signs ignored)
In the above example, IRR = 10% + (25%-10%) * 62 / (62+17) = 21.8%. This means that the project would lead to an interest rateof 21.8%. This is higher than the interest rates paid by banks on savings (opportunity cost of capital), so the project is worthundertaking. The IRR value is prone to measurement error but its accuracy can be improved by changing the interest rates untilobtaining a positive and a negative NPV that are both close to zero. It is important to note that the internal rate of discount value isnot necessarily always unique, in which case the IRR values cannot be used to decide on a project's worth.
The benefit-to-cost ratio (BCR) is the first indicator that has been historically adopted by project managers to assess the worth ofa project. It computes the ratio obtained by dividing the present value of the benefit stream by the present value of the coststream, discounted at the opportunity cost of capital. A project is accepted if the BCR is greater than or equal to 1. Using the sameexample as above, the relevant values can be computed and are summarised in Table . The BCR is 170% for an opportunity costof capital of 10% and the project is considered worth undertaking.
Table: Example of timing of benefits and costs and computation of the benefit-to-cost ratio. Source: EmmanuelleQuillérou, 2014 personal communication)
With Project Year 1 (present) Year 2 Year 3 Year 4
Benefit 100 140 200 200
Costs 300 150 0 0
Without Project
Benefit 100 90 90 90
Costs 80 80 80 80
Incrementalbenefit 0 50 110 110
Present value ofincrementalbenefit (10%discount rate)
0 45 91 83
Incremental cost 220 70 -80 -80

WLC Template
file:///E|/Dropbox/WaterHealthNewFinal/Course4/discussion/WH40M050D006challenges3%20Cost-benefit.htm[12/17/2014 12:52:39 AM]
Present value ofincremental cost(10% discountrate)
220 64 -66 -60
Benefit-to-costratio (0 + 45 + 91 + 83) / (220 + 64 66 60) = 139%
All three indicators are complementary and when possible should be computed to assess a project's worth. In our example, allthree indicators lead to conclude that the project is worth undertaking. However, these indicators do not necessarily always lead tothe same conclusion, in which case a further formal discussion on whether the project is worth undertaking needs to be includedwith the cost-benefit analysis.
These indicators can be computed in a financial setting (ie when costs and benefits correspond to actual money flow in theeconomy) as well as in an economic setting (where costs and benefits correspond to the values allocated by society as a whole,which may or may not match actual prices). In the case of a financial analysis, the economic indicators of a project’s worth cansometimes be referred to as “financial indicators”.
Sensitivity analysis to assess risk and resilience
One of the limitations of cost-benefit analysis is that it often relies on average values for quantities, prices, costs and benefits. Thismeans that the analysis and the economic indicators derived from it provide a good idea of whether the project is worth undertakingon average but fail to consider the viability of the project under extreme events such as droughts, floods, food crises, financialcrises. This is important because extreme events are becoming more frequent as a consequence of climate change.
A sensitivity analysis aims to assess consequences on the project's economic worth for risks arising from the project itself orexternal forces. A good sensitivity analysis helps assess the resilience of the consequences of project implementation and its socialconsequences. This is particularly critical to assess whether livelihoods of already fragile populations can be sustained even underextreme events or not.
A simple way of conducting a sensitivity analysis is to identify the main quantities and/or prices that are likely to change, e.g.because of droughts, floods, changes in inputs or fluctuations in commodity prices on the world market. This can be done inconsultation with the relevant stakeholders and/or based on local or international expert opinion. The average values originally usedin the cost-benefit analysis are changed to the new "extreme" values and the economic indicators of a project's worth arerecalculated to assess whether the project remains economically worth implementing.
If the project is worth doing on average but not under extreme events, a policy-maker might want to consider either not undertakingthis project or providing some form of safety net such as an insurance scheme or subsidies for when these extreme events occurespecially for projects targeting fragile populations. This decision depends on wider political considerations and needs to bediscussed with the relevant stakeholders to figure out what the best applicable solution is.
Alternatively, the values of quantities and prices of inputs (raw materials, labour, minimum wage, discount rate...) can be changed toobtain "switching values" - the values for which the project becomes economically undesirable (e.g. the input value which leads toNPV=0). You can change one value at a time and/or a bundle of values. You then need to estimate whether the values underwhich the project becomes economically undesirable are likely to arise or not, in light of previous and future biophysical andeconomic patterns and by discussions with local and national stakeholders and experts. Again, depending on the results andconsultation with stakeholders, you may want to abandon the project and/or introduce safety net mechanisms.
Social analysis and Environmental analysis
A good financial or economic assessment not only comprises a cost-benefit analysis but also a social analysisand an environmental analysis to assess the consequences of the project on the different populations (ethnicities,villages…) as well as on the environment (pollution, natural resource availability…). These are not detailed in thisunit but are essential to assess accurately the success and resilience of the project considered for implementation.

WLC Template
file:///E|/Dropbox/WaterHealthNewFinal/Course4/discussion/WH40M050D006challenges3%20Cost-benefit.htm[12/17/2014 12:52:39 AM]
PRICE SYSTEM
World Domestic
Derivation of economic costs and benefits from financial values
A financial analysis is based on the financial costs and benefits to participants (individuals, firms, organisations) whereas aneconomic analysis is based on the costs and benefits to society as a whole. Financial costs and benefits are typically observedthrough market prices, user fees… In this unit, we are interested in economic values rather than financial values.
Economic values are referred to as shadow prices, as they are "in the shadow" of the financial values that can be observed inreal-life. Economic values correspond to opportunity costs and/or willingness to pay for the goods and services considered from thepoint of view of society as a whole. One of the easiest ways to undertake an economic cost-benefit analysis is to first perform afinancial analysis and then adjust each financial value to derive its economic equivalent.
Adjustments between financial and economic values are needed because of market price distortions that arise when markets arenot perfectly competitive. The type of adjustment varies with: (i) the type of value being considered (transfer payments, tradedgood, non-traded tradable good, non-traded non-tradable goods), (ii) the reference adopted for measuring the costs and benefits(world or domestic price system) and (iii) the currency (domestic or foreign) in which benefits and costs are expressed.
The adjustment process outlined below leads to the shadow values required for an economic cost-benefit analysis.
Economic values can be derived or estimated from financial values in 3 steps:
Step 1 – Adjust for transfer payments (taxes and subsidies)
Step 2 – Adjust for price distortions in traded goods
Step 3 – Adjust for price distortions in non-traded goods (tradables and non-tradables).
Step 1 consists in removing transfer payments from the financial values, i.e. payments that corresponds to a redistribution ofwealth within society. This is a step undertaken for values expressed in the domestic price system only. They change the financialincentives faced by an individual but not the wealth of society as a whole. Taxes and subsidies are typical examples of this kind ofredistribution. This also applies to user fees that are transferred from a user to a provider within a given society.
Step 2 consists in adjusting the financial price values to remove market imperfections and distortions introduced by policies suchas minimum wage or land market regulations. There are two different aspects that need to be checked upon to ensure thateconomic values are measured and expressed in a consistent way: the point of reference and the currency. Shadow prices arederived for the same point of reference or numéraire ("measuring unit"), e.g. using a world or a domestic price system. In the worldprice system, the opportunity costs to the country of traded goods are assumed to correspond to border prices. These opportunitycosts are valued using the cif (cost, insurance, freight) for imports and the fob (free on board) for exports. In the domestic pricesystem, economic values correspond to what society is willing to pay for goods and services. For both price systems, economicvalues can be expressed either in a foreign currency or the domestic currency. When values are expressed in different currencies,the Shadow Exchange Rate (SER) is used for conversion of values into one single currency for consistency.
Step 3 consists in adjusting the values of tradable but non-traded goods (i.e. good that can theoretically be traded but are not tradein practice) in the World price system. This can be done by using a conversion factor when financial prices are considered goodestimates of opportunity costs. The conversion factor is the ratio of the shadow price to the domestic market price. It is calledstandard conversion factor when an average ratio is used. Non-tradable goods need to be valued using specific economicvaluation methods in order to estimate their opportunity costs. In the domestic price system, the values of non-traded and non-tradable goods are estimated based on their opportunity costs.
The Table below summarises the adjustments to be made depending on the price system used.
Table: Adjustments to derive shadow prices from financial prices. Source: Emmanuelle Quillérou, 2014 personalcommunication)

WLC Template
file:///E|/Dropbox/WaterHealthNewFinal/Course4/discussion/WH40M050D006challenges3%20Cost-benefit.htm[12/17/2014 12:52:39 AM]
SHADOWPRICES
Tradedgoods
- cif (cost, insurance, freight)
- fob (free on board)
- Delete taxes and subsidies
- Shadow Exchange Rate (SER )
Non-tradedgoods
- Conversion Factor (CF)
- Standard Conversion Factor (SCF)
- Opportunity Cost (OC)
- Opportunity Cost (OC)
- Correct for price distortions
The actual transformation is a bit more The actual transformation is a bit more complex than detailed above but this should give anidea of how to adapt a financial cost-benefit analysis into an economic cost-benefit analysis. For more information on how toperform such adjustments suggested reading materials are included at the end. Because an economic cost-benefit analysis adoptsthe perspective as society as whole, it can be used to assess the desirability of a project from this perspective. It does not,however, reflect on incentives faced by individual stakeholders or stakeholder groups and should thus be complemented by afinancial cost-benefit analysis for a thorough assessment of the proposed project.
Once transfer payment have been removed and shadow economic values of costs and benefits have been estimated, the economicindicators used for the financial analysis (i.e., the net present value, the internal rate of return and the benefit-to-cost ratio) can bederived from the perspective of society as a whole. The values may not match those of the indicators derived from the financialanalysis, and may sometimes lead to contradicting conclusions. Ultimately, the decision to undertake the project or not whenindicators are contradictory between the financial and economic analyses will depend on how much priority is given to actualfinancial flows over the value to society as a whole. It may be socially acceptable to go ahead with a development project thatleads to small losses for society as a whole (negative NPV in the economic analysis) but that allows poor stakeholders to benefitfrom it (positive NPV in the financial analysis).
Because the values of the costs and benefits have changed, a new sensitivity analysis should be performed. The environmentaland social analyses undertaken in relation to the financial cost-benefit analysis still need to be conducted undertaken as acomplement to the financial and economic cost-benefit analyses.
Unit Summary
This unit describes the rationale for using an economics perspective for assessment. Economics provides a common measuring rodfor assessment. It is a tool suited to decision-making because it adopts the viewpoint of society as a whole and focuses on trade-offs between alternative uses. For this, it relies on economic values rather than financial prices. Policy-makers need true economicvalues of goods and services for informed and economically efficient decision-making.
Economics also provide methods for valuation of non-marketed economic goods and services, including environmental goods andservices. This unit describes the total economic framework developed for environmental valuation and the associateddecomposition into different economic values. For each valuation method, underlying assumptions, key steps, some of theirtheoretical and empirical limitations are detailed. Different valuation methods do not capture the same proportion of economic valuewhich can lead to discrepancies in derived estimates of economic value. Different methods also measure welfare changes indifferent ways, again potentially leading to discrepancies in the obtained estimates of economic value.
Cost-benefit analysis requires a good analysis of the study context, with identification of the stakeholders, area of interest andchosen timeframe. A cost-benefit analysis is based on a comparison of a with-project scenario against a without-project (baseline)scenario. The types of costs and benefits to be included have been briefly detailed. The timing of costs and benefits has aninfluence of the desirability of a project because people have a positive time preference. This positive time preference is taken intoaccount through the discounting of costs and benefits for computation of the project's indicators of success. The main economicindicators used in cost-benefit analyses to assess whether the project is socially worth undertaking are detailed: the net presentvalue (NPV), the internal rate of return (IRR) and the benefit-to-cost ratio (BCR). Sensitivity analyses can be undertaken to assessthe impact of risks and uncertainty on the project's financial or economic desirability. The steps behind transforming a financialcost-benefit analysis into its economic equivalent are reviewed briefly.
WLC Template
file:///E|/Dropbox/WaterHealthNewFinal/Course4/discussion/WH40M050D006challenges3%20Cost-benefit.htm[12/17/2014 12:52:39 AM]
This unit finishes with a series of questions designed to guide you through existing case studies. These outline the key questionsthat need to be answered when undertaking your own analysis.
Guiding Questions for Critically Analysing an Exisiting Case Study
Select a suitable case study preferably published within the last three years. Choose a study that combines both environmentalvaluation and a cost-benefit analysis or two separate studies. The list of references provided with this unit should help you find atleast one suitable case study.
For older case studies, even if the method has not changed much, the economic values of land and land-based ecosystemservices in these resources might need updating, because of environmental changes, inflation and/or a change in socialpreferences since the time at which the study was conducted.
The list of questions provided aims to guide you in critically analysing an existing case study. These questions focus on thegeneral outline of a piece of research for economic valuation and cost-benefit analysis. The questions are meant as a guide for youto find your way through the information provided in your chosen case study and are by no means exhaustive. Try and answerthem as fully as possible using information from your chosen case study. Depending on your chosen case study, your answers mayor may not have a high level of detail. You might not be able to answer all questions as the necessary information might not existor be detailed enough in your chosen case study. Note that this is not a problem: the information is ultimately provided dependingon its relevance to the context and analysis of the specific case study you have selected! You can also use this guide to undertakeyour own study. There is no need to look far: you should be able to undertake a simple economic valuation and cost-benefitanalysis for a problem arising in your own neighbourhood!
Describe the study context: identify the problem to solve, key stakeholders
Q1. What is the problem? e.g. loss of land, loss of (ecosystem) services from land, loss of income from services derived from land(provisions of food and fibre, regulation of water flows, carbon storage, tourism…)
Q2. Has the problem been quantified? How big a problem is it? e.g. how much land area/economic benefit is lost per year or hasbeen lost in x years…
Q3. Are there any usage conflicts? If yes, which ones? Who stands to lose from the identified problem? Who stands to lose fromactions undertaken to address the problem? What trade-offs would arise with change?
Q4. How is "society as a whole" defined? Who is part of it and who is excluded? Is this definition appropriate to the study?
Describe potential solutions to the problem
Q5. What kind of solutions would be available to solve the problem? (adoption of sustainable land management, adoption of non-agricultural livelihood options, a combination of both…)
Identify the economic analysis to perform to take an informed decision on how to best solve the problem from aneconomic perspective
Q6. What kind of analysis do we need to assess how to best (economically) solve the problem? (derive an economic value forinclusion into a cost-benefit analysis, undertake a financial cost benefit analysis, undertake a financial and an economic cost-benefitanalyses…)
Q7. What frameworks do we use to inform the analysis? (ecosystem services, Total Economic Value, financial or economic cost-benefit analysis…)
Q8. Which method would be best suited to the study context and why?
Identify the data context and data needs
Q9. What kind of data is needed to conduct the analysis? (List the variables necessary for economic valuation, types of benefitsand costs...)
Q10. Are there any secondary data available? If yes, specify what variables and from what source.
Q11. What variables needed to conduct the analysis are not available as secondary data? What course of action is chosen forthese variables? (dropped from the study, collected through primary data collection, a change of method for one suited to the
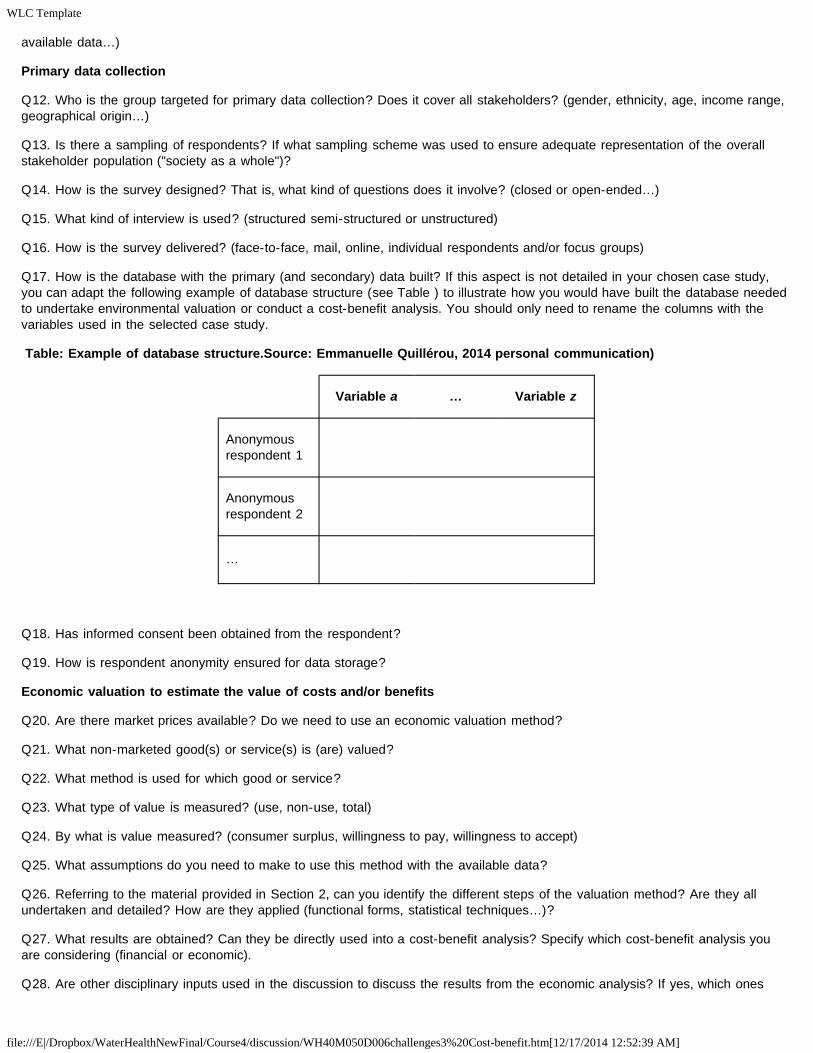
WLC Template
file:///E|/Dropbox/WaterHealthNewFinal/Course4/discussion/WH40M050D006challenges3%20Cost-benefit.htm[12/17/2014 12:52:39 AM]
available data…)
Primary data collection
Q12. Who is the group targeted for primary data collection? Does it cover all stakeholders? (gender, ethnicity, age, income range,geographical origin…)
Q13. Is there a sampling of respondents? If what sampling scheme was used to ensure adequate representation of the overallstakeholder population ("society as a whole")?
Q14. How is the survey designed? That is, what kind of questions does it involve? (closed or open-ended…)
Q15. What kind of interview is used? (structured semi-structured or unstructured)
Q16. How is the survey delivered? (face-to-face, mail, online, individual respondents and/or focus groups)
Q17. How is the database with the primary (and secondary) data built? If this aspect is not detailed in your chosen case study,you can adapt the following example of database structure (see Table ) to illustrate how you would have built the database neededto undertake environmental valuation or conduct a cost-benefit analysis. You should only need to rename the columns with thevariables used in the selected case study.
Table: Example of database structure.Source: Emmanuelle Quillérou, 2014 personal communication)
Variable a … Variable z
Anonymousrespondent 1
Anonymousrespondent 2
…
Q18. Has informed consent been obtained from the respondent?
Q19. How is respondent anonymity ensured for data storage?
Economic valuation to estimate the value of costs and/or benefits
Q20. Are there market prices available? Do we need to use an economic valuation method?
Q21. What non-marketed good(s) or service(s) is (are) valued?
Q22. What method is used for which good or service?
Q23. What type of value is measured? (use, non-use, total)
Q24. By what is value measured? (consumer surplus, willingness to pay, willingness to accept)
Q25. What assumptions do you need to make to use this method with the available data?
Q26. Referring to the material provided in Section 2, can you identify the different steps of the valuation method? Are they allundertaken and detailed? How are they applied (functional forms, statistical techniques…)?
Q27. What results are obtained? Can they be directly used into a cost-benefit analysis? Specify which cost-benefit analysis youare considering (financial or economic).
Q28. Are other disciplinary inputs used in the discussion to discuss the results from the economic analysis? If yes, which ones

WLC Template
file:///E|/Dropbox/WaterHealthNewFinal/Course4/discussion/WH40M050D006challenges3%20Cost-benefit.htm[12/17/2014 12:52:39 AM]
(anthropology, sociology, ecology, politics…)? What do they add to the economic side of the analysis?
Q29. From the discussion on the method, available data and results, how reliable is the value obtained?
Q30. Could another valuation method have been applied? If yes, why has it not been chosen for this study?
Cost-benefit analysis
Q31. What is the with-project scenario, (i.e., what kind of project, action or change is considered for implementation? What wouldthe costs and benefits be under the with-project scenario, that is if the project is implemented? Do they change in time and if so byhow much? (description needed)
Q32. What is the without-project scenario? What would the costs and benefits be under the without-project scenario, that is ifnothing is changed? Do they change in time and if so by how much? (description needed)
Q33. Are there any credit schemes? How are they set up?
Q34. What discount rate is chosen for this analysis and why?
Q35. What indicator(s) of the project's worth is (are) used and what are their values? (net present value, internal rate of return,cost-to-benefit ratio…)
Q36. What can we conclude from the financial cost-benefit analysis? Is the project leading to greater financial benefits than costs?In other words, is it worth implementing from a financial point of view? Do results differ across stakeholders?
Q37. How are shadow prices derived? What kind of "correction" is applied to financial prices to derive these shadow prices? Whatprice system (World or domestic) and currency (foreign or domestic) is used?
Q38. What are the ‘new’ values of the indicator(s) of the project's worth? (net present value, internal rate of return, cost-to-benefitratio…)
Q39. What can we conclude from the economic cost-benefit analysis? Is the project leading to greater social benefits than costs, inother words, is it worth implementing from society's point of view? Do results differ across stakeholders?
Q40. How reliable are the results obtained? Has a sensitivity analysis been conducted and if so how?
Q41. Are other disciplinary inputs used in the discussion to discuss the results from the economic analysis? If yes, which ones(anthropology, sociology, ecology, politics…)?
Q42. Are the conclusions derived from the economic cost-benefit analysis different from the financial cost-benefit analysis? If yes,financial incentives need to be implemented to achieve the socially desirable outcome. What kind of policy instruments are (or couldbe) envisaged to give stakeholders the right financial incentives to achieve a socially desirable outcome (taxes, subsidies, tradablepermits, standards, legislation, education, certification…)?
QUESTIONS for Self Assessment
1. Text Entry. List some of the key factors to consider when conducting a cost-benefit analysis.
Answer:
For a financial cost-benefit analysis:
- Identification of stakeholders, area of interest and timeframe
- Identification of with and without project scenarios
- Timing of costs and benefits
- Likely variations of values around the average

WLC Template
file:///E|/Dropbox/WaterHealthNewFinal/Course4/discussion/WH40M050D006challenges3%20Cost-benefit.htm[12/17/2014 12:52:39 AM]
- stakeholder consultations at all stages of the cost-benefit analysis
For an economic cost-benefit analysis, the following needs to be added:
- removal of transfer payments
- corrections for market imperfections and distortions by adjusting financial prices to derive the economic prices
2. True or False. Shadow prices can be estimated by adjusting financial values to reflect opportunity costs to society as a whole.
Answer: True.
3. True or False. We all have a time preference, measured by a higher rate of discount when we allocate a greater weight to thefuture than the present.
Answer: False. The higher rate of discount means that future benefits lose value faster when converted into their present values. Ahigher rate of discount reflects a stronger preference for the present.
4. Multi Responses. Select the economic indicators that assess the social desirability of an action (project) compared to inaction(business-as-usual)
(a) Net present value (NPV)
(b) Shadow exchange rate (SER)
(c) Opportunity costs
(d) Benefit-to-cost ratio (BCR)
(e) Internal rate of return (IRR)
(f) cif (cost, insurance, freight)
(g) fob (free on board)
Answer: a, d, e. The others are used to adjust financial prices into shadow prices.
5. True or False. We need to complement a cost-benefit analysis by a sensitivity analysis in order to assess the impact of potentialrisks on the social desirability of the project and the economic resilience of the project for stakeholders.
Answer: True.
6. Text Entry. Explain why economic analysis can be a useful tool for policy-makers.
Answer: Economics provide a common measuring rod which allows for comparison between different goods and services ofdifferent nature. It adopts the perspective of society as a whole and can help policy-makers take informed decisions.
7. Text Entry. Explain why different methods may lead to different estimates of economic values.
Answer: Different methods may lead to different estimates of economic values because:
- valuation methods do not use the same measure of economic value (consumer surplus, willingness to pay/accept)
- valuation methods do not capture the same level of economic value : some capture use value only, others use and proportions ofnon-use value
- they might be subject to empirical biases

WLC Template
file:///E|/Dropbox/WaterHealthNewFinal/Course4/discussion/WH40M050D006challenges3%20Cost-benefit.htm[12/17/2014 12:52:39 AM]

WLC Template
file:///E|/Dropbox/WaterHealthNewFinal/Course4/discussion/WH40M060D001EconBenProb.htm[12/17/2014 12:52:39 AM]
Water and HEALTH - Managing Watershed for Health
Benefits of Water Demand Management
Water demand management attempts to make water development funds cover as many initiatives as possible. Efficiency, in the economic sense, means trying toachieve goals as cheaply as possible in order to meet as many as possible of the competing demands for funding. Making available development funds stretch asfar as possible is the fundamental benefit of water demand management. Other benefits to municipalities of water conservation include lower average peak watersystem loading and significant energy savings. In addition, several benefits occur from the adoption of water demand management in industry. These include:
Better control over the throughput of water and wastewater systems generated by the need for better accounting,Changes in attitudes toward water use as costs begin to show on accounting records,Improved technology as research and development expenditures for water handling become profitable,Development of new or expanded industries to provide that technology, andRevenue generation, for example, from by-product recovery.
Problems with Water Demand Management in Municipalities
The incorporation of the water demand management concept into municipal operations is not without problems, especially during the adjustment period. Watercosts are relatively inelastic to demand levels; a reduction in water demand will not lead to a proportional decrease in costs. An effective conservation programneeds to increase water rates to meet financial obligations. Depending on the cost of the conservation program, the financial obligations will decrease very little,and may in fact increase. Customers will understandably be displeased to see their efforts rewarded with water bills that don't decrease. This lack of immediatefinancial reward is a problem that can derail conservation efforts aimed at a longer-term benefit. Emergency or short-term conservation efforts do not have thesame financial impact.
The difficulties in matching revenues and expenditures and of having to increase rates to generate sufficient revenues in the face of falling demand have givenmany municipalities second thoughts about conservation options that directly involve customers.
Also, some studies have shown that there is a potential imbalance between revenues and costs. Revenue balancing is achieved by changing rates over time toreflect changing cost conditions, arguing that economic efficiency was achieved when we set prices at short-run marginal costs.
Water Reuse: Discussion
Reuse Terms
"Reclaimed water" is water that has received at least secondary treatment and basic disinfection and is reused after flowing out of a domestic wastewatertreatment facility.
"Reuse" is the deliberate application of reclaimed water for a beneficial purpose.
http://www.dep.state.fl.us/water/reuse/facts.htm (Internet Access Required)
Recommended readings
1. Wastewater re-use - Why bother(http://lnweb18.worldbank.org/ESSD/ardext.nsf/18ByDocName/WastewaterReuseWhyBother/$FILE/DHanrahanWastewaterReuseWhyBother.pdf) (Internet AccessRequired)
2. Wastewater use in Irrigated Agriculture(http://www.cabi-publishing.org/pdf/Books/0851998232/0851998232.pdf) (Internet Access Required)
3. Reuse of wastewater in Middle East and North Africa(http://lnweb18.worldbank.org/ESSD/ardext.nsf/18ByDocName/ReuseofWastewaterintheMiddleEastandNorthAfrica380KBs/$FILE/ReuseofWastewater_WaterForum.pdf) (Internet Access Required)
Benefits of Ecosystems - Example Wetlands
World-wide wetlands of practically every type have declined in area. This pattern of loss is particularly evident in the case of mangroves which have beendiminished in almost every corner of the world, largely due to their undervaluation and subsequent conversion for alternative coastal developments. If currentdrivers off loss continue unabated, in conjunction with the impacts of climate change, it is possible that all mangroves may disappear by the end of this century(Duke et al. 2007).
Wetlands are areas where the water table is at or near surface level (Russi et al. 2013). There are many types of wetlands which exist and they have beenvariously grouped according to their characteristics and for different purposes. Five major types of natural wetlands are generally recognized (Ramsar ConventionSecretariat 2006).
Marine: Coastal wetlands such as rocky shores, lagoons and coral reefs
Estuarine: Includes deltas, mangrove swamps and tidal marshes
Lacustrine: Wetlands associated with lakes
Palustrine: Marshes, bogs and swamps
Riverine: Wetlands along rivers and streams

WLC Template
file:///E|/Dropbox/WaterHealthNewFinal/Course4/discussion/WH40M060D001EconBenProb.htm[12/17/2014 12:52:39 AM]
Wetlands are the focus of a dedicated intergovernmental treaty, The Ramsar Convention on Wetlands, which was signed in Ramsar, Iran in 1971, also known asthe ‘Ramsar Convention’. The Ramsar Convention was conceived to bring international attention to the global loss of wetlands (Ramsar Convention Secretariat2006). In this convention, the signatory countries have committed themselves to maintain the ecological character of their designated Wetlands of InternationalImportance and to plan for the wise or sustainable use of all of the wetlands in their territories.
The Ramsar Convention on Wetlands has classified wetlands into three broad categories:Inland wetlands; Marine/coastal wetlands; Human-made wetlands(aquaculture, farm ponds, permanently or temporarily inundated agricultural land, e.g., rice paddies)
Wetlands, especially mangroves have historically been perceived as ‘wastelands’ of no inherent value (Adger and Luttrell 2000). This image has led to theirundervaluation. When combined with financial incentives to convert wetlands for higher value uses (e.g., aquaculture), this perception has resulted in theirconversion and degradation (Adger and Luttrell 2000).
Coral Reefs are in serious decline. An estimated 30% have already been severely damaged (Wilkinson, 2002) and remaining healthy reefs face a multitude ofstressors.
What Are Ecosystem Services?
Ecosystems contribute substantially to human well-being. In fact, everyone in the world is completely dependent on Earth’s ecosystems (MEA 2005). Ecosystemsare linked to human well-being through the services that they provide. The Millennium Ecosystem Assessment was a global initiative undertaken from 2001-2005to investigate how changes in ecosystems affect human well-being and to identify actions to enhance the conservation and sustainable use of ecosystems as wellas their contribution to human well-being (MEA 2005).
The Millennium Ecosystem Assessment defines ecosystem services as “the benefits people obtain from ecosystems”.
Four categories of ecosystem services are identified in the MEA are: Provisioning services; Regulating services; Habitat services; and Cultural services. Whenconducting a valuation assessment of ecosystem services, the exact framework used is less important than ensuring that the assessment includes the mostimportant and relevant services
Provisioning services are the products people obtain from ecosystems. People derive many natural products from mangroves. These include the following(UNEP-WCMC 2006):
· Commercial and subsistence fisheries: Mangroves are critical intertidal habitats for many fishes, mollusks and crustaceans of value to coastal communities.Mangrove fisheries provide food, employment and income to millions of people around the world and thus the importance of this service cannot beoveremphasized.
· Aquaculture: Mangroves support aquaculture operations for mollusk, fish and shrimp. In some countries, land-based pond farming of fish and crustaceans informer mangrove areas is a centuries-old tradition (Schuster 1952). It is ironic that in recent decades, aquaculture has been the major cause of global mangroveloss (Valiela et al. 2001), because mangroves provide critical support to aquaculture in the form of seed, broodstock and feed (Rönnbäck 1999). Small-scale,sustainable mangrove-aquaculture operations still exist in some areas.
· Food items, including parts of mangrove themselves (e.g., mangrove fruit) and honey
· Building materials for construction, energy and industry such as wood, leaves, tannins and nypa palm
· Raw materials for traditional medicines and genetic resources
Regulating Services are the benefits obtained from regulation of ecosystem processes. Mangroves provide the following regulating services:
· Climate regulation: Mangroves play an important role in climate regulation because they capture and store large amounts of carbon (Murray et al. 2011,Nelleman et al. 2009). The carbon sequestered and stored in mangroves and other marine and coastal systems is referred to as ‘Blue Carbon’ (Nelleman et al.2009). The importance of mangroves as Blue Carbon habitats and their potential as a tool for climate change mitigation is being increasingly recognized bygovernments, intergovernmental organizations and mangrove advocacy groups.
· Erosion regulation: Vegetative cover aids soil retention (MEA 2005). By diminishing the energy of incoming waves, mangroves prevent sediments from beingwashed away and reduce shoreline erosion (Mazda et al. 2007, Thampanya et al. 2006). For example, a study has shown that in areas where mangroves formextensive stands in the Gulf of Thailand, it seems that net erosion has been prevented (Thampanya et al. 2006).
· Water purification - Mangrove vegetation is highly productive and filters nutrients and pollutants from the water (Kathiresan and Bingham 2001). Beingsituated between the land and the sea allows them to intercept land-derived nutrients, pollutants, and suspended matter before such contaminants reach coastalenvironments (Rivera-Monroy and Twilley 1996, Tam and Wong 1999).
· Protection from natural hazards – Mangroves play an important role in shoreline protection under normal sea conditions and during tropical storms andhurricanes (UNEP-WCMC 2006). This is because the presence of mangroves can attenuate waves and reduce the impacts of storm surges (McIvor et al. 2012ab).The complex structure of mangrove trees, particularly their extensive root systems can diminish the energy of incoming waves and lessen the risk of flooding tocommunities which live behind mangroves (McIvor et al. 2012a). As such, they can serve as a coastal buffer, protecting communities from natural hazards.
Supporting Services are the services that underpin the other types of ecosystem service and are necessary for their functioning. Supporting services differ fromprovisioning, regulating, and cultural services in that their impacts on people are often indirect or occur over a very long time.
· Nutrient cycling – Mangrove plants are efficient at conserving and recycling nutrients (Kristensen et al. 2008). These trees produce large amounts of leaf litterand the decomposition of this litter contributes to the recycling of nutrients within the mangrove as well as adjacent habitats (Kathiresan and Bingham 2001).
· Nursery Habitat – Mangroves not only act as nurseries for fish and crustaceans which reside in the mangrove for the entirety of their life, but also specieswhich are found as adults in offshore habitats. Several offshore species which use mangroves as nurseries are of particular economic importance. For example,offshore shrimp fisheries in Northern Australia, the Guianas, Mexico and Borneo are major economic activities and the species which comprise the bulk of catchesare either mangrove dependent or benefit greatly from the presence of inshore mangroves (Spalding et al. 2010).

WLC Template
file:///E|/Dropbox/WaterHealthNewFinal/Course4/discussion/WH40M060D001EconBenProb.htm[12/17/2014 12:52:39 AM]
Cultural Services encompass a range of nonmaterial benefits that people derive from ecosystems. These include opportunities for spiritual enrichment, reflection,recreation, cognitive development and aesthetic experiences (MEA 2005).
· Tourism and recreation – Mangroves have gained increasing popularity as sites for ecotourism (Spalding et al. 2010). The creation of boardwalks throughthese forests has made them more accessible to visitors. Popular tourism activities include boat tours, wildlife watching and kayaking.
· Spiritual – Mangroves may contain sacred sites of worship or be the location of culturally significant rituals.
Benefits of Ecosystem Services
Ecosystem services enhance human well-being substantially. The loss of these ecosystems means the loss of these services and often a reduction in human well-being. Another way of thinking about this relationship is that humans derive utility from ecosystems (i.e., the services they provide are ‘useful’ to us). Because theyare useful to society, they contribute to society’s welfare. Welfare is an economic measure of society's level of "happiness". In conducting an economic assessment,what we want to measure are changes in society's welfare associated with the loss or gain in environmental goods or services. These changes in welfarerepresent the benefits or costs to society as a result of a change in environmental service provision.
For example, loss of mangroves can cause a reduction in these services and changes to society’s welfare. Are there ways to measure changes in society’s welfareassociated with the loss of ecosystems services associated with degradation of ecosystems, such as the change in society's welfare by changes in mangroveservices?
As discussed previously in this unit, an economist's approach would apply valuation concepts relating to human welfare to estimate the impact of ecosystemchanges on human welfare. The key is determining how changes in ecosystem goods or services affect an individual’s well-being and then estimating how much aperson or a society is willing to pay to maintain those services that have a positive impact, or how much a person or a society is willing to accept as compensationfor giving up those services (Barbier 2011).
Stated simply, an economic valuation is “the process of assigning a monetary value to ecosystem goods and services. It quantifies the benefits providedby ecosystems and the impact of ecosystem changes on the well-being of people.” GIZ (2012)
To summarize, there are several reasons why estimating the benefits of ecosystem services are useful (King and Mazzotta 2000):
· To consider the public’s values, and encourage public participation and support for environmental initiatives. · To compare the benefits of different projects or programs.· To prioritize conservation or restoration projects.· To maximize the environmental benefits per dollar invested· To justify and decide how to allocate public spending on conservation, preservation, or restoration initiatives.
Why Value Ecosystem Services?
Using mangroves as an example - The undervaluation of the natural products and ecological services provided by mangroves has been a major driving force behind their conversion and degradation(Rönnbäck 1999). This is because in the absence of information on the economic value of mangrove ecosystems to compare against the economic value ofalternative public investments, the importance of mangroves is frequently overlooked (Brander et al. 2012). Additionally, unless the value of the ecosystem servicesprovided by mangroves to coastal communities is estimated, it is difficult to convince policy-makers to consider land use policies which favor mangroveconservation and sustainable use. Finally, by valuing ecosystem services provided by mangroves, their destruction for economic development can no longer beviewed as “costless” (Barbier et al. 2012).
Economic valuation is the process of assigning a monetary value to the goods and services provided by ecosystems. This is a useful tool because it quantifies thebenefits people derive from ecosystems in common terms. Moreover, it can help policy-makers and managers determine which decisions that affect ecosystemswill be most beneficial to society as a whole. Because the degradation and conversion of mangroves has historically been viewed as “costless”, assigning amonetary value to their services highlights their importance to coastal communities and can support policies which favour their conservation.
There are three major steps involved in converting ecosystem services to economic values and integrating these values into decision-making: Step 1) RecognizingValue, Step 2) Demonstrating Value and Step 3) Capturing Value. This course focuses primarily on Steps 2 and 3; Demonstrating and Capturing Value.
Wetlands such as mangroves have been historically undervalued and this has led to their degradation and clearance for alternative economic activities. Byrecognizing and demonstrating the range of benefits that mangroves provide, and by capturing the value of these benefits in economic and policy frameworks, wecan begin to halt and or reverse the major losses that have already occurred.
References:
Adger, W. N., & Luttrell, C. 2000. Property rights and the utilisation of wetlands. Ecological Economics 35: 75-89.
Barbier, E. B., S. D. Hacker, C. Kennedy, E. W. Koch, A. C. Stier and B. R. Silliman. 2011. The value of estuarine and coastal ecosystem services. EcologicalMonographs 81: 169–193
Barbier, E. B. 2012. Progress and challenges in valuing coastal and marine ecosystem services. Review of Environmental Economics and Policy, 6(1), 1-19.
Brander, L. M., Florax, R. J., & Vermaat, J. E. 2006. The empirics of wetland valuation: a comprehensive summary and a meta-analysis of the literature.Environmental and Resource Economics, 33: 223-250.
Duke, N., J. Meynecke, S. Dittmann, A. Ellison, K. Anger, U. Berger, S. Cannicci, K. Diele, K.C. Ewel, C.D. Field, N. Kowdam, S.Y. Lee, C. Marchand, I. Nordhaus,and F. Dahdouh-Guebas. 2007. A world without mangroves? Science 317:41-42.
GIZ. 2012. Integrating Ecosystem Services into Development Planning. A stepwise approach for practitioners based on the TEEB approach
Kathiresan, K. and B. L. Bingham. 2001. Biology of Mangroves and Mangrove Ecosystems. Advances in Marine Biology 40: 81-251.

WLC Template
file:///E|/Dropbox/WaterHealthNewFinal/Course4/discussion/WH40M060D001EconBenProb.htm[12/17/2014 12:52:39 AM]
King, D. M. and M. Mazzotta. 2000. Ecosystem Valuation. Accessed from http://www.ecosystemvaluation.org/index.html (Internet Access Required)
Kristensen, E., S. Bouillon, T. Dittmar and C. Marchand. 2008. Organic carbon dynamics in mangrove ecosystems: A review 89: 201–219.
Mazda, Yoshihiro, Eric Wolanski, and Peter Ridd. 2007. "The role of physical processes in mangrove environments: Manual for the preservation and utilization ofmangrove ecosystems."
(MEA) Millennium Ecosystem Assessment, 2005. Ecosystems and Human Well-being: Synthesis.Island Press, Washington, DC.
McIvor, A.L., Möller, I., Spencer, T. and Spalding. M. 2012a. Reduction of wind and swell waves by mangroves. Natural Coastal Protection Series: Report 1.Cambridge Coastal Research Unit Working Paper 40. Published by The Nature Conservancy and Wetlands International. 27 pages. ISSN 2050-7941. URL:http://www.naturalcoastalprotection.org/documents/reduction-of-wind-and-swell-waves-by-mangroves (Internet Access Required)
McIvor, A.L., Spencer, T., Möller, I. and M. Spalding. 2012b. Storm surge reduction by mangroves. Natural Coastal Protection Series: Report 2. Cambridge CoastalResearch Unit Working Paper 41. Published by The Nature Conservancy and Wetlands International. 35 pages. ISSN 2050-7941. URL:http://www.naturalcoastalprotection.org/documents/storm-surge-reduction-by-mangroves
Murray, B., L. Pendleton, W.A. Jenkins, and S. Sifleet. 2011. Green payments for blue carbon economic incentives for protecting threatened coastal habitats,Report NI 11 04, Nicholas Institute for Environmental Policy Solutions.
Nellemann, C., E. Corcoran, C. Duarte, L. Valdés, C. De Young, L. Fonseca, and G. Grimsditch. 2009. Blue carbon. A rapid response assessment. United NationsEnvironment Programme, GRID-Arendal.
Ramsar Convention on Wetlands. 2005. Wetland Values and Functions. Ramsar Bureau, Gland, Switzerland.
Rivera-Monroy, V. H. and R. R. Twilley. 1996. The Relative Role of Denitrification and Immobilization in the Fate of Inorganic Nitrogen in Mangrove Sediments(Terminos Lagoon, Mexico). Limnology and Oceanography 41: 284-296.
Rönnbäck, P. 1999. The ecological basis for economic value of seafood production supported by mangrove ecosystems. Ecological Economics 29: 235–252
Russi D., ten Brink P., Farmer A., Badura T., Coates D., Förster J., Kumar R. and Davidson N. 2013. The Economics of Ecosystems and Biodiversity for Water andWetlands. IEEP, London and Brussels; Ramsar Secretariat, Gland
Schuster, W.H. 1952. Fish culture in the brackish water ponds of Java. IPFC Spec. Pub. 1, 1–143.
Spalding, M., Kainuma, M., and Collings, L. 2010. World Atlas of Mangroves. A collaborative project of ITTO, ISME, FAO, UNEP-WCMC, UNESCO-MAB, UNU-INWEH and TNC. Earthscan, London, 319pp.
Tam, N. F. Y. and Y. S. Wong. 1999. Mangrove Soils in Removing Pollutants from Municipal Wastewater of Different Salinities. Journal of Environmental Quality28: 556-564.
Thampanya, U., J. E. Vermaat, S. Sinsakul and N. Panapitukkul. 2006. Coastal erosion and mangrove progradation of Southern Thailand. Estuarine, coastal andshelf science 68: 75-85.
UNEP-WCMC. 2006. In the front line: Shoreline protection and other ecosystem services from mangroves and coral reefs. Cambridge, UK: UNEP-WCMC. 33 pp
Valiela, I., J.L. Bowen, and J.K York. 2001. Mangrove forests: One of the world's threatened major tropical environments. Bioscience 51:807-815.
Wilkinson, C. Ed., Status of Coral Reefs of the World (Australian Institute of Marine Science, Townsville, Australia, 2002).
Question1. Why is there the need for an international convention on wetlands? 2. What are wetlands and why are they important to the integrated study of water and human health?

WLC Template
file:///E|/Dropbox/WaterHealthNewFinal/Course4/discussion/WH40M060D004PRTR.htm[12/17/2014 12:52:40 AM]
WATER and HEALTH - Managing Watersheds for Health
Pollution Release and Transfer Register (PRTR)
Pollution Charges - Polluter Pays Principle
A "pollution charge" or "emission charge" is a fee, collected by the government, which is levied on each unit of pollutant emittedinto the water. The total payment any source would make to the government could be found by multiplying the fee by theamount of pollutant emitted. Emission charges reduce pollution because pollution costs the firm money. To save money, thepolluter seeks ways to reduce its pollution.
Emission or effluent charges reflect the type and quantity of the pollutant discharged into surface water or emitted into theatmosphere, as well as its impact. An economically efficient environmental charge is based on the cost inflicted on society. Thetotal cost would include such things as lost opportunity, clean-up costs, and public health and aesthetic impacts.
The charges are established to meet environmental goals (normally performance standards). The charge can be based onenvironmental quality standards, the cost of financing pollution control, or effluent standards. Raising or lowering the environmentalcharge usually affects the amount of pollution. As charges increase, it becomes more cost-effective for the polluter to installpollution control equipment or switch to other, less polluting production processes.
Emission charges require a monitoring system to determine the quantity and quality of emissions. This system can take the form ofcontinuous monitoring equipment which precisely measures the quality and quantity of the pollution emitted. For example, in thecase of water pollution, equipment can be installed to determine the volume of wastewater. The quality can be estimated throughregular sampling and laboratory analysis.
With an emission charge, a control authority can find the minimum cost allocation of meeting a predetermined emission reductionstandard even when it has no information on control costs. Unfortunately, the process of finding the appropriate rate includes sometrial-and-error. During the trial-and-error period of finding the appropriate rate, the changing emission charges make planning forthe future difficult. Investments that would make sense under a high emission charge might not make sense when the emissioncharge falls. From either a policymaker's or business manager's perspective, this scenario leaves much to be desired.
Another type of pollution tax is the input charge. Where waste discharges are widely dispersed, and many polluters in manylocations are responsible for them, it may be very difficult to monitor and tax emissions. This is the case with, for example, the run-off of farm wastes containing concentrations of fertilizer nitrates, and with the emissions of carbon dioxide from cars, boilers andelectricity generators.
Application of Emission Charges
Emission charges have been applied primarily to situations involving water pollution. Charges can be set up at a level that iscalculated to achieve a pre-determined level of water quality. Pollutants discharged in large quantities are easily monitored and cantherefore readily be addressed in an emission charge scheme. Those occurring irregularly and in small amounts are more difficultto include. Charges can be used to finance a regional pollution control system. These charges can be applied to recover municipalcosts based on, for example, volume of discharge.
Emission charges are only minimally effective in air pollution control. The allocation of revenue and the difficulty in monitoringemissions are factors. However, France has had some success in applying emission charges to air emissions.
Advantages and Disadvantages of Pollution Charges
Advantages:
Firms can reduce pollution at lower cost than under a command and control approach. Savings arise from the flexibilityafforded to forms in responding to the charge. They may choose to pay the charge or to invest in a pollution control

WLC Template
file:///E|/Dropbox/WaterHealthNewFinal/Course4/discussion/WH40M060D004PRTR.htm[12/17/2014 12:52:40 AM]
technology appropriate to their situation.Incentives to invest in new pollution control technology are provided to firms.Revenue that can be used to finance and enhance enforcement is generated.Emission charges can compensate for the externalities associated with industrial activity.
Disadvantages
It is difficult to develop charges that accurately reflect the marginal costs of pollution. Charges too high or too low woulddistort activity and not lead to an economically efficient pollution level. Unfortunately, emission charges are often used as anew source of revenue rather than as a mechanism to achieve an economically efficient level of resource use.Charges based on ambient quality are complicated by the fact that location of industries requires firm-specific rates.Administrative and monitoring costs are high.
Pollution charges have three main advantages over the conventional approach in which standards are backed up by legalconstraints and fines (i.e. polluting firms must meet the standard or risk being fined):
1. Pollution charges achieve a given standard at least cost.2. Charges force technology; they give firms an incentive to adopt the best available pollution control technology in order to
minimize their "tax" liability.3. Charges economize on information needs by giving the individual agents responsibility for their decisions about pollution
control.
Monitoring Inspection and Oversight
Emission charges require a monitoring system to determine the quantity and quality of emissions and to calculate thecorresponding charges. This system can take the form of monitoring equipment which precisely measures the quality and quantityof the pollution emitted and documents it (e.g., digital records, written records, databases). For example, in the case of waterpollution, equipment can be installed to determine the volume of wastewater. The quality of wastewater can be estimated throughregular sampling and laboratory analysis.
Monitoring, inspection and oversight of technical and administrative practices are fundamental for achieving compliance withemission standards, based on quantity and quality of environmental releases, and to operationalize the collection of pollutioncharges. Capacity building involving certification and training, licensing and permits, pollution controls, drinking water quality, wastewater and sanitation, data management and auditing becomes necessary for the development and operationalization of pollutionreduction mechanisms. Monitoring and surveillance of pollution reduction practices at the source of environmental releases (i.e.,point and non-point sources) and performance in terms of pollution prevention and mitigation of degradation of the receivingenvironment (e.g., watershed, surface water and runoff, groundwater, land, and, air, flora and fauna) and at the point of use (e.g.,drinking water and other potable uses, non-potable uses) should be carried out systematically and audited and the findingscommunicated to all stakeholders including the public.
Pollution Release and Transfer Registers (PRTRs)
Regional and national pollutant release and transfer registers (PRTRs), consisting of pollutant releases inventories andenvironmental pollution reporting and monitoring networks, voluntary and legislated, are foundational to risk management ofchemicals and pollution prevention planning and awareness of chemical safety and environmental pollution. About 30 countriesaround the world already report emissions and transfers of chemicals to air, water and soil through their PRTRs and about 14countries are in the process of designing their own PRTR system www.prtr.net (Internet Access Required)
The Organization for Economic Cooperation and Development (OECD) www.oecd.org/chemicalsafety/pollutant-release-transfer-register (Internet Access Required) produces documents describing the experiences of countries that have already developedPRTRs; current and emerging uses of PRTR data; how PRTRs differ; and the identification, selection, and adaptation of releaseestimation techniques that industry can use in the calculation of pollutant releases and transfers. The OECD work on PRTRs is

WLC Template
file:///E|/Dropbox/WaterHealthNewFinal/Course4/discussion/WH40M060D004PRTR.htm[12/17/2014 12:52:40 AM]
overseen by an OECD Task Force on PRTRs.
PRTR systems are key resources for identifying pollution prevention priorities, supporting the assessment and risk management of
chemicals and environmental modelling activities, and the development of pollution reduction strategies (policy, regulations,
communications), and improving technological methods, research and understanding among industry, government and the public.
PRTRs are integral to the public's "right to know" and environmental policy making.
Examples of PRTRs are:
The U.S. Toxics Release Inventory (TRI) established in 1986 www2.epa.gov/toxics-release-inventory-tri-program (Internet AccessRequired)
Canada's National Pollutant Release Inventory www.ec.gc.ca/inrp-npri (Internet Access Required)
A listing and links to information on PRTRs established in countries around the world is available at www.prtr.net (Internet AccessRequired)

WLC Template
file:///E|/Dropbox/WaterHealthNewFinal/Course4/discussion/WH40M060D006susdevel.htm[12/17/2014 12:52:40 AM]
WATER and HEALTH - Moving Forward Managing Watersheds for Health
Environmental health has been broadly defined as "the theory and practice of assessing and controlling factors in the environment thatcan potentially affect adversely the health of present and future generations" World Health Organization (WHO), 1993, p 18. cited inParkes et al., 2003
The Nexus Between Water Energy and Food Security
"In recent years, there has been considerable debate in the international community about understanding the nexus between water,energy and food security; while some interesting approaches have emerged from that discussion, implementation pf this concept throughsector-focused government agencies an various stakeholders remains a challenge.....
Emerging studies point to the consideration that decentralization, social media, and novel ways to raise capital should be used toempower local populaitons to create their own solutions......
more concerted efforts at all levels are required to create the enabling environment necessary to implement solutions and that suchefforts will have to be broader than just dealing directly with water issues."
The above quotation is from the Preface, page iii, to the UNU and UNOSD, 2013 Report entitled, Water for Sustainability: FramingWater within the Post-2015 Development Agenda. United Nations University Institute for Water, Environment and Health, UN Office ofSustainable Development and Stockholm Environment Institute.
Everyone has an interest in water issues
"Rather than catalysing action, the importance of water, and sanitation, to human health, livelihoods, ecosystems and economicproductivity means that while everyone has an interest in water issues, these interests are often at odds or fragmented" (Doczi et al.,2013)
Drivers of demand will encourage investment in water and sanitation infrastructure.
Growing global population - will need more food,more energy, more water resources for improved drinking water sources andhygiene and access to sanitationIndustrial development - will need more energy and access to more energy, more water resourcesClimate change impactsChanging polital landscapes
Image: quote on water landscape changing. Source: UNU and UNOSD, 2013
Many water-based proposals that have emerged since 2013 for moving forward fall into three groupings.
Water as a Sector - These tend to prioritize WaSH, water resources management, wastewater, water quality and pollution, butnot explicitly address the overall development agenda and economic growth. All proposals in this grouping have the water sectorper se as their main focus.Water as an Enabler - These are aimed at tackling key obstacles to increasing economic growth and productivity (e.g., growthand poverty reduction, integrated water management for sustainable growth, water value chains). Emphasis is on waterdevelopment to promote agricultural growth, energy production, water use in industry and commerce, and in creating employment.Water is intimately tied to key processes of state water implementation, including public expenditure, institutional roles andresponsibilities, sector-wide approaches, and government reform.Water as a Supporter (to development and economic growth) - Thes focus on the high-level development agendaand theprincipal transformational changes in global development assisstance. By embedding water issues in health and agriculture andother high level goals or targets, water is viewed as a supporter to acheiving overarching policy objectives for development. For

WLC Template
file:///E|/Dropbox/WaterHealthNewFinal/Course4/discussion/WH40M060D006susdevel.htm[12/17/2014 12:52:40 AM]
example, Integration of water under global partnershps for the eradication of poverty through sustainabledevelopment.
The Water Value Chain. Source: UNU and UNOSD, 2013
A comparative analysis across clusters of water-related proposals shows convergence in key areas involving water and human healthand ecosystem services
Table comparison of water clusters. Source: UNU and UNOSD, 2013.
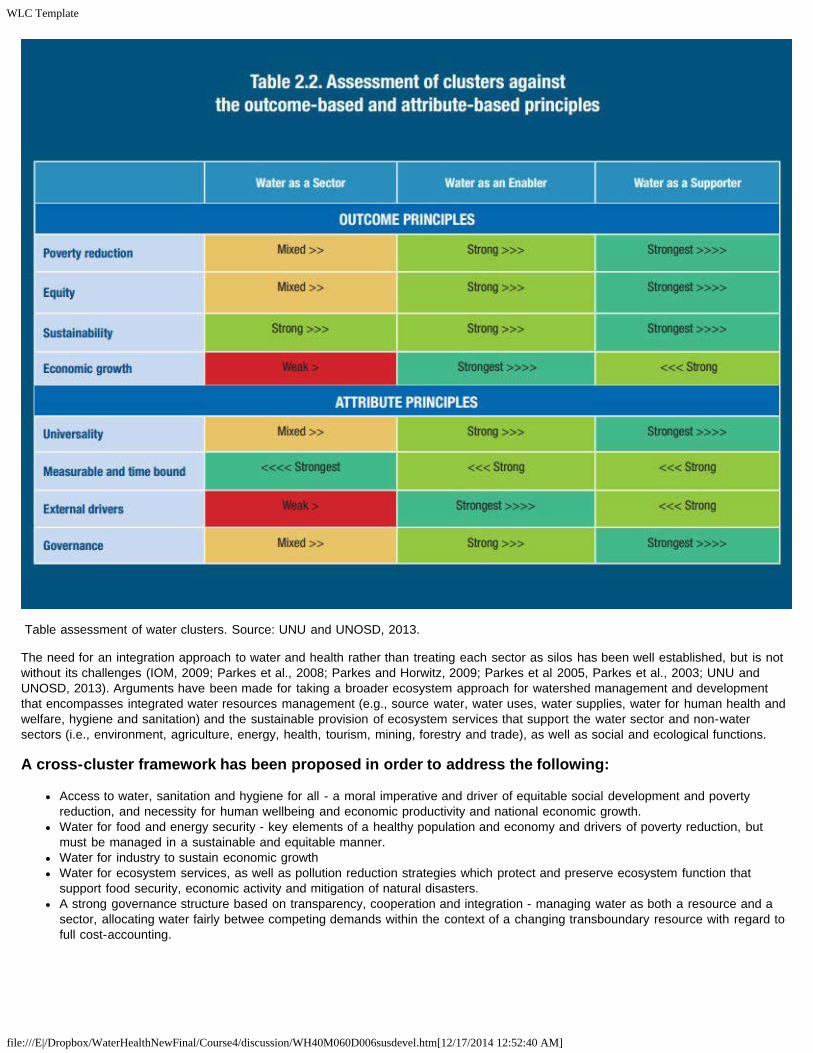
WLC Template
file:///E|/Dropbox/WaterHealthNewFinal/Course4/discussion/WH40M060D006susdevel.htm[12/17/2014 12:52:40 AM]
Table assessment of water clusters. Source: UNU and UNOSD, 2013.
The need for an integration approach to water and health rather than treating each sector as silos has been well established, but is notwithout its challenges (IOM, 2009; Parkes et al., 2008; Parkes and Horwitz, 2009; Parkes et al 2005, Parkes et al., 2003; UNU andUNOSD, 2013). Arguments have been made for taking a broader ecosystem approach for watershed management and developmentthat encompasses integrated water resources management (e.g., source water, water uses, water supplies, water for human health andwelfare, hygiene and sanitation) and the sustainable provision of ecosystem services that support the water sector and non-watersectors (i.e., environment, agriculture, energy, health, tourism, mining, forestry and trade), as well as social and ecological functions.
A cross-cluster framework has been proposed in order to address the following:
Access to water, sanitation and hygiene for all - a moral imperative and driver of equitable social development and povertyreduction, and necessity for human wellbeing and economic productivity and national economic growth.Water for food and energy security - key elements of a healthy population and economy and drivers of poverty reduction, butmust be managed in a sustainable and equitable manner.Water for industry to sustain economic growthWater for ecosystem services, as well as pollution reduction strategies which protect and preserve ecosystem function thatsupport food security, economic activity and mitigation of natural disasters.A strong governance structure based on transparency, cooperation and integration - managing water as both a resource and asector, allocating water fairly betwee competing demands within the context of a changing transboundary resource with regard tofull cost-accounting.

WLC Template
file:///E|/Dropbox/WaterHealthNewFinal/Course4/discussion/WH40M060D006susdevel.htm[12/17/2014 12:52:40 AM]
Cross-cluster framework Source: UNU and UNOSD, 2013.
The complex, reciprocal interactions among ecosystems, society and health demand an integrated approach (Parkes et al., 2008;Parkes et al., 2010).
Policy, management, health care delivery, reseach and understanding of human health and disease has largely been organized on thebasis of government borders and agencies, such as municipalities, counties, provinces and states and the corresponding healthauthorities. These boundaries influence environemtnal and resources management, but often overlook the structure and function ofecosystems, thereby creating a disconnection betwee the objects of managment and biophysical processes that exist between healthand nature.

WLC Template
file:///E|/Dropbox/WaterHealthNewFinal/Course4/discussion/WH40M060D006susdevel.htm[12/17/2014 12:52:40 AM]
Mapping ecosystems, community and determinants of health. Source: (Parkes et al., 2008).
Prioritizing watersheds as appropriate spatial units around which to organize management for natural resources and health enables amore integrated framework for policy- and decision-making on water and health and the management conservation and protection ofecosystem services. The application of combined watershed management and ecosystem-health approaches have the potential toimprove our ability to reducevulnerablity to natural hazards, maintain ecological flows ogf water and the provision of other ecosystemservices. All of which are necessary for the long-term sustainability of human and natural systems. The development of integrative andcollaborative frameworks, such as the Prism Framework (discussed previously in this unit), for decision-making that speak not only topublic health professionals, but also to ecologists, water managers, planners and the development community is challenging, and reflectsthe limitations of addressing separate parts of social-ecological systems, in addition to the interconnections of human and naturalsystems (Parkes et al, 2008). The inter-relationships between ecosystems, health and well-being can be described in terms of direct andindirect impacts. Direct impacts are those associated with risks and hazards from direct exposure to the physical environment, forexample impacts on the ecosystem services required for water quality and sanitation and water-related diseases. Whereas indirectimpacts are associated with "side-effects" of ecosystem disruption and their influence on the social determinants of health and well-being. For further discussion, of direct and indirect impacts in the context of inter-relationships between ecosystem and health and well-being see page 38 in Parkes et al. 2008 which is provided in the resources for this course. Exposure and environmental exposurepathways have been dealt with in more detail in the Water and Health Course 2 entitled Water Related Impacts on Health -Principles,Methods and Applications.

WLC Template
file:///E|/Dropbox/WaterHealthNewFinal/Course4/discussion/WH40M060D006susdevel.htm[12/17/2014 12:52:40 AM]
Challenges Gaps and Opportunities Relating to the Integration of Watershed-based Management andEcohealth
Several challenges and opportunities are identified and discussed in the report entitled Ecohealth and Watersheds. EcosystemApproaches to Re-integrate Water Resources Management with Health and Well-being. (Parkes et al., 2008). These include thefollowing,
Governance Challenge and Opportunities
Spatio-temporal Scale
The Public Health Paradox
Ecological Goods and Services on a Watershed Basis
Poverty and Watersheds
"New-generation" Policy Instruments
Building Capacity for a Paradigm Shift
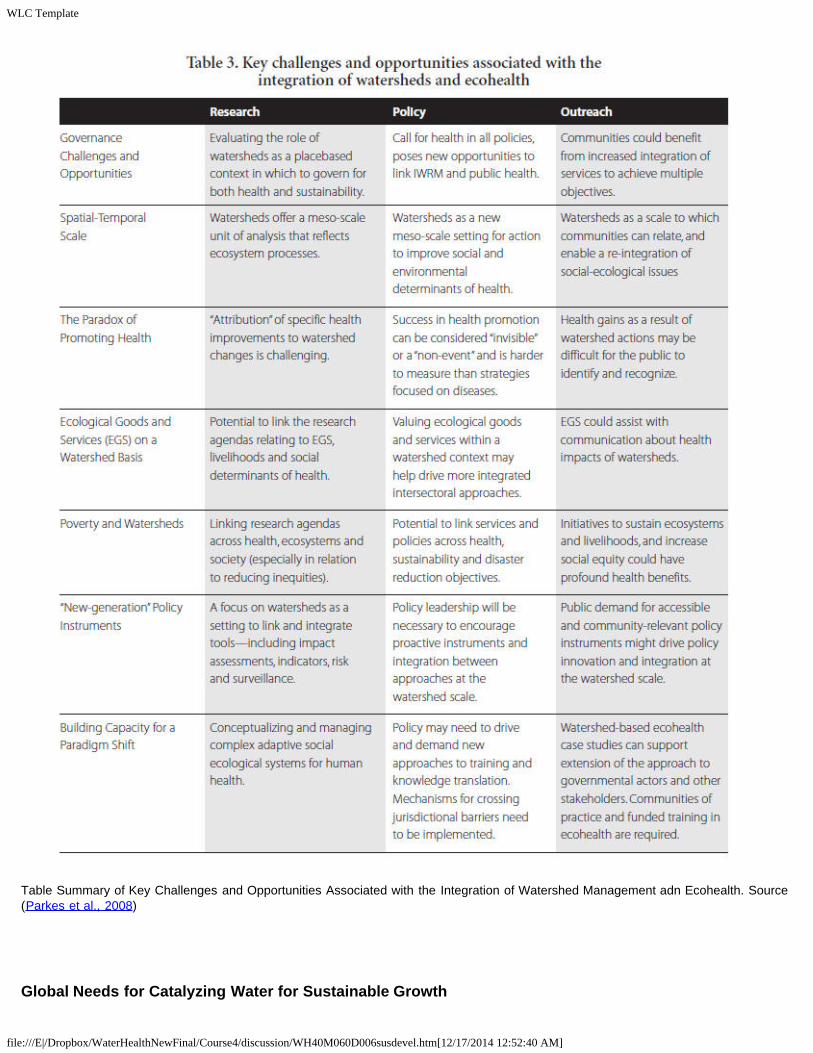
WLC Template
file:///E|/Dropbox/WaterHealthNewFinal/Course4/discussion/WH40M060D006susdevel.htm[12/17/2014 12:52:40 AM]
Table Summary of Key Challenges and Opportunities Associated with the Integration of Watershed Management adn Ecohealth. Source(Parkes et al., 2008)
Global Needs for Catalyzing Water for Sustainable Growth

WLC Template
file:///E|/Dropbox/WaterHealthNewFinal/Course4/discussion/WH40M060D006susdevel.htm[12/17/2014 12:52:40 AM]
The following global needs have been identified for catalyzing water for sustainable growth:
Governance
Accountability and Transparency
WaSH
Infrastructure
Wastewater Treatment
Water Resources Management
Agriculture
Energy
Environmental Services
Capacity
Rapid Assessment of Current Status Elements Required to Deliver on a Post-2015 Water Framework Across the Globe
Different starting points, needs, challenges and opportunities for implementing a post-2015 agenda exist in different countries andregions around the world. A rapid assessment of the current status of elements required to deliver on a post-2015 water framework which addresses the 8 keyprinciples and related sector development is preent in the Table below. These focus on member countries of the Organisation forEconomic Co-operation and Development (OECD), Mexico, Indonesia and Chile and, Brazil, India, and China (MIC and BRIC) and LeastDeveloped Countries (LDCs), which are analysed separately according to continent (i.e. Africa and Asia).
Countries and regions with different levels of development will face different entry points to the common challenges, will be building fromdifferent strengths, and will therefore engage in the implementation process in different ways. Clearly these starting points will have implications for the regional andnational investment requirements. A next step in this analysis would be specific case studies articulating both needs and the cost of meeting those needs.
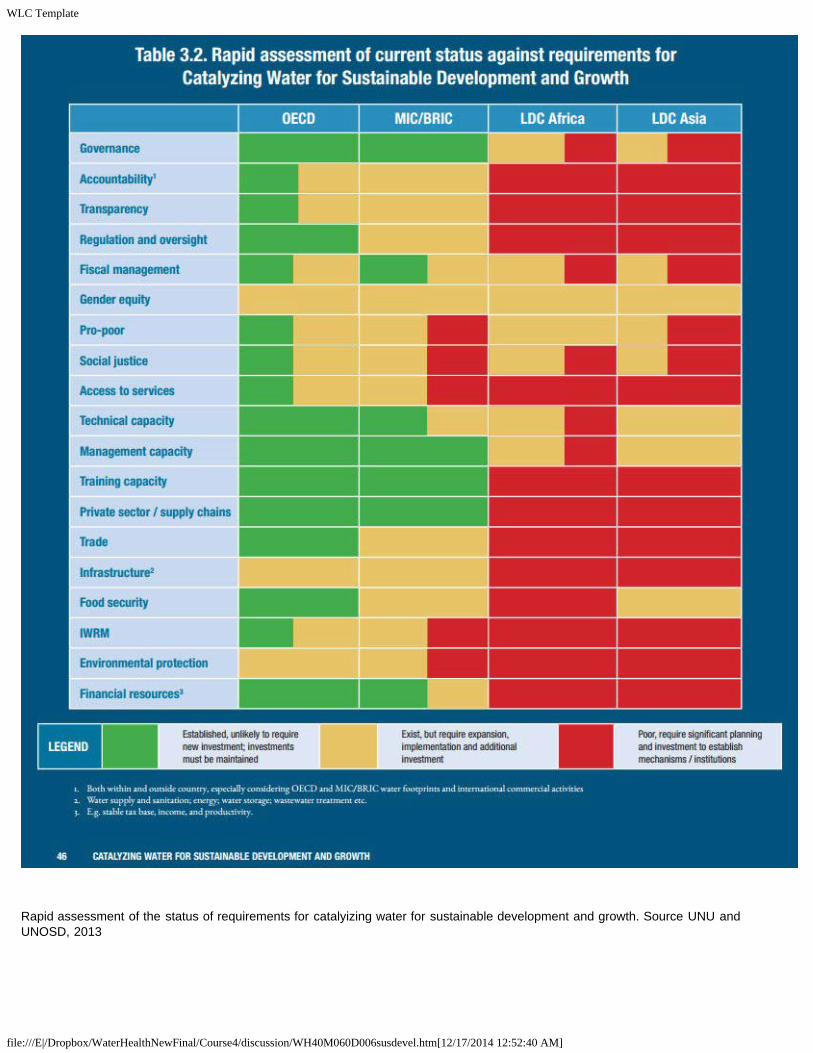
WLC Template
file:///E|/Dropbox/WaterHealthNewFinal/Course4/discussion/WH40M060D006susdevel.htm[12/17/2014 12:52:40 AM]
Rapid assessment of the status of requirements for catalyizing water for sustainable development and growth. Source UNU andUNOSD, 2013

WLC Template
file:///E|/Dropbox/WaterHealthNewFinal/Course4/discussion/WH40M060D006susdevel.htm[12/17/2014 12:52:40 AM]
Implementation Scenarios of an Integrated Framework for Water and Non Water-Sectors. Source: UNU and UNOSD, 2013.
Challenges for Implementation of Sustainable Development Goals
Monitoring and reporting - requires setting of targets and robust systems to monitor them; targets and milestones should be set in atransparent manner and could build on monitoring and reporting systems that are already in place (e.g., JMP, IWRM, GLAAS).
Stakeholder engagement - requires engagement of a wide spectrum of stakeholders, including involvement of governments, donoragencies, civil society and the UN, the general public, private sector, lending instituions and research and academic communities inimplementing, monitoirng and assessing performance, and may require new instituional mechanisms.
Mobilizing financial resources - a critical challenge for financing is the scale and continuity in investment that may be achieved throughfinancing mechanisms such as taxation at local and national levels, user charges, cross-subsidies, private investment. For example, inthe recent past financing for water-related infrastructure has been raised at the local level, and this is likely to continue. In the 1990smost financing of water and sanitation originated from domestic public sectors (65-70%) and private sectors (5%), with only 10-15%from international donors and 10-15% from international private companies. China and India are home to more than half the globalunserved population, the source of funds for those countries to reach sustainable development goals would probably remain domestic,

WLC Template
file:///E|/Dropbox/WaterHealthNewFinal/Course4/discussion/WH40M060D006susdevel.htm[12/17/2014 12:52:40 AM]
and similar arguments can be made for other rapidly developing countries. In the poorest countries, primarily Africa, funding shortfallsand need are the greatest. Sustainable funding must be found for infrastructure, operations and maintenance. Governments of low-income countries are unlikely to be able to afford service subsidies to help housholds to access utilities, and ineligible subsidy capture isa significant source of corruption which undermines efforts to support marginalised groups (UNU and UNOSD, 2013).
Possible mechanisms for moving forward on implementation of and integrated management framework are:
Non-traditional engagement mechansims - internatinal coalitions like the Association of Southeast Asian Nations (ASEAN), theArab League, the European Union (EU), G20, Organization for Economic Cooperation and Development (OECD), theOrganisation of Islamic Cooperation (OIC).Global mechanisms and global capacity builiding network for the aggregation and scaling up of water servicesInnovative financing- micro-credit schemes, online crowdsourcing, reinvestment of efficiency savingsMonitoirng and reporting - SMART indicators to monitor progress and global accountability. For example, every country should bestriving towards key essential monitoring and surveillance systems that provide socio-economic data, hydro-meteorological data, health data and financial flows data, whichare rolled up from local to national scales through established reporting mechanisms.
Examples of indicators for monitoring and reporting on progress of change are presented in the table below.

WLC Template
file:///E|/Dropbox/WaterHealthNewFinal/Course4/discussion/WH40M060D006susdevel.htm[12/17/2014 12:52:40 AM]

WLC Template
file:///E|/Dropbox/WaterHealthNewFinal/Course4/discussion/WH40M060D006susdevel.htm[12/17/2014 12:52:40 AM]
Table Exemplars of Indicators of Progress of Change. Source: UNU and UNOSD, 2013.
Indicators and Expected Outcomes
Compound indicators, with stated expected outcomes highlighting and mainstreaming water and health connectivity should be requisitefor reporting on progress at the regional, national, and international level. Some possible suggestions include:
• Infant mortality reduced by 3 per 1000 live births, with a reduction of 1 per 1000 associated with access to drinking water andsanitation (This is based on Cheng et al. (2012) “An ecological quantification of the relationships between water, sanitation and infant,child, and maternal mortality” http://www.ehjournal.net/content/11/1/4 which found that for every quartile improvement in WSS, infant mortality rates were reduced by 1.4 per1000 live births)
• Diarrhoea rates reduced by 50% (This is based on Cheng et al. (2012) “An ecological quantification of the relationships between water, sanitation and infant, child, and maternal mortality” http://www.ehjournal.net/content/11/1/4 (Internet Access Required)
WLC Template
file:///E|/Dropbox/WaterHealthNewFinal/Course4/discussion/WH40M060D006susdevel.htm[12/17/2014 12:52:40 AM]
which found that for every quartile improvement in WSS, infant mortality rates were reduced by 1.4 per 1000 live births)
• Source water quality does not exceed selected (chemical and microbiological) WHO guidelines in 8/10 samples
• Every country incorporates integrated water resources management plans into their G&PRS that address universal access, economicgrowth, allocation (including transboundary) and climate change impacts
• Improved water efficiency in different sectors (less drops per dollar or more dollars per drop)
Conclusions - Moving Forward Managing Watersheds for Health
Despite the many challenges that have been identified, the integration of Ecohealth and a Watershed-based integrated water resourcesmanagement (IWRM) approach to environmental management holds promise for addressing the gaps and linkages between ecosystemsand natural resources management and poverty reduction.
Changes affecting climate and atmospheric process, land uses, ecological process, social networks, livelihoods and lifestyles, add to thecomplexity of understanding social-ecological systems, involving transboundary movement of people, animals, disease and pollutants,spatial-temporal scaling, and countless physical chemical biological social and ecological relationships.
A next step in this analysis would be specific case studies articulating both the needs and the cost of meeting those needs for thedevelopment and implementation of an integrated approach to water and health.
Questions
1. What are linkages between watersheds and human health?
2. What are examples of indicators that could be used to monitor progress of changes integrating water and health at the local, regionaland national level?
3. What are the key challenges and opportunities to integrating watershed management and ecosystem health and how might these beaddressed through research, policy and outreach?
4. Describe how watershed management and public health systems could be aligned to improve community resiliency and adaptivecapacity to climate change?
References
Doczi J., Dorr T., Mason N. and Scott A. (2013) “The post-2015 delivery of universal and sustainable access to infrastructure services.ODI Working Paper” http://www.odi.org.uk/sites/odi.org.uk/files/odi-assets/publications-opinion-files/8445.pdf Cited in UNU and UNOSD, 2013.
FAO (2012) “Towards the Future We Want: End hunger and make the transition to sustainable agricultural and food systems”http://www.fao.org/docrep/015/an894e/an894e00.pdf Cited in UNU and UNOSD, 2013.
Granit, J. (2012) “The Collective Action Dilemma in Managing Transboundary Freshwaters – An analysis of an outcome-drivenframework” Dissertations from the department of Physical Geography and Quaternary Geology, No 33. Stockholm: Stockholm University . Cited in UNU and UNOSD,2013.
GWP (2013) “National Stakeholder Consultations on Water: Supporting the Post-2015 Development Agenda GWP”http://www.worldwewant2015.org/node/349243 (Internet Access required)Cited in UNU and UNOSD, 2013.
IOM (Institute of Medicine). 2009. Global Environmental Health: Research Gaps and Barriers for Providing Sustainable Water,
WLC Template
file:///E|/Dropbox/WaterHealthNewFinal/Course4/discussion/WH40M060D006susdevel.htm[12/17/2014 12:52:40 AM]
Sanitation, and Hygiene Services. Washington, DC: The National Academies Press.
Joint Monitoring Programme (2013) “Progress on Sanitation and Drinking Water: Update 2013” WHO and UNICEFhttp://www.wssinfo.org/fileadmin/user_upload/resources/JMPreport2013.pdf Cited in UNU and UNOSD, 2013.
Parkes, M., Panelli, R., and Weinstein, P. 2003. Converging Paradigms for Environmental Health Theory and Practice. EnvironemtalHealth Perspectives 111 (5): 669- 675.
Parkes, M., Bienen, L. Breilh, J., Hsu,L-N. McDonald, M., Patz, J.A., Rosenthal, J.P., Sahani, M, Sleigh, A. Waltner-Toews, D. andYassi, A. 2005. All hands on deck: Transdisciplinary approaches to emerging infectious diseae. EcoHealth 2: 258-272.
Parkes, M.W.m Morrison, K.E., Bunch, M.J., and Venema, H.D. 2008. Ecohelath and Watersheds: Ecosystem Approaches to Re-integrate Water Resources Management with Health and Well-being. Network for Ecosystem Sustainability and Health (PublicationsSeries No. 2) and the International Institute for Sustainable Development, Winnipeg, MB. Available online athttp://www.iisd.org/pdf/2008/ecohealth_watersheds.pdf (Internet Access required)
Parkes, M., and Horwitz, P. 2009. Water ecology and health: ecosystems as settings for promoting health and sustainability. HealthPromotion International 1: 94-102.
Parkes, M., Morrison, K.E., Bunch, M.J.,m Hallstrom, L.K., Neudoerffer, R.C., Venema, H.D. and Waltner-Toews, D. 2010. Towardsintegrated governance for water, health and social-ecological systems: The watershed governance prism. Global Environmental Change.20:693-704
Transparency International (2008) “Global Corruption Report 2008 - Corruption in the Water Sector”http://issuu.com/transparencyinternational/docs/global_corruption_report_2008?e=2496456/2011923 Cited in UNU and UNOSD, 2013.
UN-Water (2012) “Status Report on the Application of Integrated Approaches to Water Resources Management”http://www.un.org/waterforlifedecade/pdf/un_water_status_report_2012.pdf Cited in UNU and UNOSD, 2013.
UNU and UNOSD, 2013 Report entitled, Water for Sustainability: Framing Water within the Post-2015 Development Agenda. UnitedNations University Institute for Water, Environment and Health, UN Office of Sustainable Development and Stockholm EnvironmentInstitute.
WHO, 1993. A Report of a World Health Organisation Consultation on Health and Environment in Preparation for 2nd EuropeanCOnference on Environment and Health, Helsinki 20-22 June, 1994, Sofia Bulgaria WOrld Health Organisation. cited in Parkes et al.,2003.
WHO/UN-Water (2012) “GLAAS 2012 Report UN-Water Assessment of Sanitation and Drinking Water”http://www.un.org/waterforlifedecade/pdf/glaas_report_2012_eng.pdf Cited in UNU and UNOSD, 2013.

WLC Template
file:///E|/Dropbox/WaterHealthNewFinal/Course4/discussion/WH40M070D001References.htm[12/17/2014 12:52:41 AM]
WATER and HEALTH - References Used in Course 4 Social Perspectives on Water and Health
Adeel, Z. (2012). Water as a Human Right: A Panacea to the Global Water Crisis? Presentation to theUniversity of Waterloo. UNU-INWEH, March 23rd.
Ansell, C. and Gash, A. (2008). Collaborative governance in theory and practice. Journal of PublicAdministration Research and Theory 18(4): 543-571.
Backstraand, K. (2004). Scientisation vs. Civic Expertise in Environmental Governance: Eco-feminist, Eco-modern and Post-modern Responses. Environmental Politics. 13 (4): 695-714.
Bakker, K. (2007). The “Commons” Versus the “Commodity”: Alter-globalization, Anti-privatization and theHuman Right to Water in the Global South. Antipode. Vol. 39, 3: 430-455.
Bal R., Bijker, W., & Hendriks, (2004). Democratization of scientific evidence. BMJ. 329: 1339-41.
Barlow, M. & Clarke, T. (2004). Water, Privatization., The Global Policy Forum. Availableat: http://www.globalpolicy.org/component/content/article/209/43398.html
Bell, Derrick A. Ethical Ambition: Living a Life of Meaning and Worth. New York: Bloomsbury, 2002.
Bjornlund, H. & McKay, J. (2002). Aspects of water markets for developing countries: experiences fromAustralia, Chile, and the US. Environment and Development Economics 7: 769–795.
Blackmore, C. (2007). What kinds of knowledge, knowing and learning are required for addressing resourcedilemmas? A theoretical overview. Environmental Science and Policy, 10 (6), 512-525.
Boelens, R. & Zwarteveen, M. (2005). Prices and Politics in Andean Water Reforms. Development andChange. 36 (4): 735–758
Borrás, S. and Ejrnæs, A. (2011). The legitimacy of new modes of governance in the EU: Studying nationalstakeholders' support. European Union Politics 12(1): 107-126.
Borresch, R., Maas, S., Schmitz, K., Schmitz, P. M. (2009) Modelling the value of a multifunctional landscape– A discrete choice experiment. International Association of Agricultural Economists Conference, Beijing,China, August 16-22, 2009, 13 pages. Available from:http://ageconsearch.umn.edu/bitstream/51641/2/IAAE2009_692.pdf [Accessed 10 January2014]
Boyd, D. (2011). The Environmental Rights Revolution. UBC Press.
Connelly, S., T. Richardson, and T. Miles. (2006). Situated legitimacy: deliberative arenas and the new ruralgovernance. Journal of Rural Studies 22(3): 267-277.
Davidson-Hunt, I.J. & Berkes, F. (2010). Innovating through commons use: community-basedenterprises. International Journal of the Commons. Vol. 4 (1): 1-7. [online]. Availableat: http://www.thecommonsjournal.org (Internet Access Required)
de Albuquerque, C. (2012). On the Right Track: Good Practices to Realising the Rights to Water andSanitation. United Nations Special Rapporteur on the Human Right to Safe Drinking Water andSanitation. With Virginia Road.
Dean, Mitchell. (1999). Governmentality: Power and Rule in Modern Society. Thousand Oaks, CA: SagePublications.

WLC Template
file:///E|/Dropbox/WaterHealthNewFinal/Course4/discussion/WH40M070D001References.htm[12/17/2014 12:52:41 AM]
de Loë, R.C. 2009. Sharing the Waters of the Red River Basin: A Review of Options for TransboundaryWater Governance. Prepared for International Red Rivers Board, International Joint Commission. Guelph,ON: Rob de Loë Consulting Services
de Loë, R., Di Giantomasso, S., and Kreutzwiser, R. D. (2002). Local capacity for groundwater protection inOntario. Environmental Management, 29 (2), 217-233.
de Loë, R. C. and Kreutzwiser, R. D. (2007). Challenging the status quo: the evolution of water governancein Canada. In Eau Canada: The Future of Canada’s Water, ed. K. Bakker, 85-103. Vancouver: University of British Columbia Press.
De Vos, H. et al, (2006). Formal Law and Local Water Control in the Andean Region: A Fiercely ContestedField. Water Resources Development., Vol. 22, No. 1, 37–48.
Dewulf, A., M. Mancero, G. Cárdenas, and D. Sucozhañay. (2011). The fragmentation and connection offrames in collaborative water governance. A case study of river catchment management in SouthernEcuador. International Review of Administrative Sciences 77 (1): 50-75.
Doern, B. & Reed, E.J. (2000). Risky Business: Canada’s Changing Science-Based Policy and RegulatoryRegime. Toronto: University of Toronto Press.
Driedger, S.M. & Eyles, J. (2003). “Different frames, different fears: communicating about chlorinateddrinking water and cancer in the Canadian media”. Social Science & Medicine. Vol. 56: 1279-1293.
Eden, S; Donaldson, A; Walker, G. (2006). Green groups and grey areas: scientific boundary-work,nongovernmental organisations, and environmental knowledge. Environment and Planning A. Vol. 38, No.6: 1061-1076.
Edge, S. (2011). Environmental Health Governance and Socio-spatial Struggles for Legitimacy: The Caseof Chemical Risk Management in Canada. Paper presentation at the International Medical GeographySymposium. Durham University, Durham, United Kingdom.
Edge, S. & McAllister, ML. (2009). Place-based local governance and sustainable communities: lessonsfrom Canadian biosphere reserves. Journal of Environmental Planning & Management. 52:3, 279-295.
Edge, Sara. & Eyles, J. (in press). The socio-spatial (re)configuration of legitimacy, knowledge & practice inchemical risk governance: an exploratory integration of boundary-work & scale-frameanalytics. Environmental Politics.
Entman, R. M. (1993). Framing: toward clarification of a fractured paradigm. Journal of Communication.43:51-58.
Feitelson, E. (2012). What is Water? A Normative Perspective. Water Policy. 52-64. doi:10.2166/wp.2012.003
Feitelson, E. & Fischhendler, I. (2009). Spaces of water governance: the case of Israel and itsneighbors. Annals of the Association of American Geographers. 99, 728–745.
Ferreyra, C., de Loë, R. C., and Kreutzwiser, R. D. 2008. Imagined communities, contested watersheds:challenges to integrated water resources management in agricultural areas. Journal of Rural Studies, 24 (3),304-321.
Fischer, F. (2005). Environmental Regulation and Risk-Benefit Analysis: From Technical to DeliberativePolicy Making. In: Robert Paehlke & Douglas Torgerson (eds). Managing Leviathan: Environmental Politics

WLC Template
file:///E|/Dropbox/WaterHealthNewFinal/Course4/discussion/WH40M070D001References.htm[12/17/2014 12:52:41 AM]
and the Administrative State. 2nd Edition. Peterborough, ON: Broadview Press, pp. 59-80.
Fischhendler, I. & Feitelson, E. (2005). The formation and viability of non-basin transboundary watermanagement: The case of the U.S.–Canada boundary water. Geoforum 36:792–804.
Folke, C., Hahn, T., Olsson, P., and Norberg, J. (2005). Adaptive governance of social-ecologicalsystems. Annual Review of Environment and Resources, 30: 441-473.
Gearey, M. and P. Jeffrey. (2006). Concepts of legitimacy within the context of adaptive water managementstrategies. Ecological Economics 60(1): 129-137.
Giordano, M. A. and Wolf, A. T. 2003. Sharing waters: post-Rio international water management. NaturalResources Forum, 27 (2), 163-171.
Gleick, P. et al. (2004) The World’s Water 2004-5: The Biennial Report on FreshwaterResources. Washington, DC and London: Island Press.
Global Water Partnership (2000). Integrated Water Resources Management. TAC Background Papers No.4,Global Water Partnership, Technical Advisory Committee, Stockholm, Sweden. Available at:http://www.gwpforum.org/servlet/PSP?iNodeID=215&itemId=24Heath, T. (2010). Pragmatic but Principled:Background Report on IWRM. Cranfield Univeristy and WASUP.
Guston, D. (2001). Boundary Organizations in Environmental Science and Policy: An Introduction. Science,Technology & Human Values. 26 (4): 339-408.
Harris, L. (2002). Water and conflict geographies of the Southeastern Anatolia Project. Society and NaturalResources, 15, 743-759.
Harris, L. & Alatout, S. (2010). Negotiating hydro-scales, forging states: Comparison of the upperTigris/Euphrates and Jordan River basins. Political Geography. 29: 148-56.
Hattingh, J., el. (2007). A trialogue model for ecosystem governaance.Water Policy 9 Supplement 2: 11–18.
Holley, C., Gunningham, N. & Shearing, C. (2012). The New Environmental Governance. EarthscanPublishing. New York, New York.
Ingram, H. (2008) Beyond Universal Remedies for Good Water Governance. Paper presented at theRosenberg International Forum on Water Policy, Zaragoza, June 24-27.
Kurtz, H. (2003). Scale frames and counter-scale frames: constructing the problem of environmentaljustice Political Geography 22 887–916
Lach, D., Rayner, S. & Ingram, H. (2005). Taming the waters: strategies to domesticate the wicked problemsof water resource management. International Journal of Water. 3(1), 1517.
Lancaster, K. (1966) A New Approach to Consumer Theory. Journal of Political Economy, Vol. 74, pp. 132--157.
Lejano, R. & Ingram, H. (2009). Collaborative networks and new ways of knowing. Environmental Scienceand Policy. 12: 653-62.
Lemos, M. C. and Agrawal, A. (2006). Environmental governance. Annual Review of Environment andResources 31: 297-325.

WLC Template
file:///E|/Dropbox/WaterHealthNewFinal/Course4/discussion/WH40M070D001References.htm[12/17/2014 12:52:41 AM]
Mansfield, B., & Haas, J. (2006). Scale framing of scientific uncertainty in controversy over the EndangeredSteller sea lion. Environmental Politics: Vol. 15 (1): 78-94.
Marin, L. E., Sandoval, R., Tagle, F., Sanchez, E. & Martinez, V. H. (2009). Water as a human right and asan economic resource: an example from Mexico. In: Water Ethics. Llamas, M. R., Martinez-Cortina, L. &Mukherji, A. (eds). CRC Press/Balkema, Leiden, pp. 115–125.
Marston, S.A. (2000). The social construction of scale. Progress in Human Geography. Vol. 24: 219-42.
McCarthy, J. (2005). Scale, Sovereignty and Strategy in Environmental Governance. Antipode. 732-53.
McCarthy, J., (2007). States of nature: theorizing the state in environmental governance. Review ofInternational Political Economy. 14: 176–194.
McCloskey, M. (1999). Problems with Using Collaboration to Shape Environmental Public Policy,34 Valparaiso University Law Review. 32(2): 423-3. Available at: http://scholar.valpo.edu/vulr/vol34/iss2/6
Millenium Ecosystem Assessment. (2005). Synthesis. Island Press, Washington, DC Available onlineat: http://www.millenniumassessment.org/ (Internet Access Required)
Meadowcroft, J. 2002. Politics and scale: some implications for environmental governance. Landscape andUrban Planning 61(2-4): 169-179.
Mehta, L. (2001). Water, difference, and power: Unpacking notions of water “users” in Kutch,India. International Journal of Water. 1 (3-4).
Miller, C. (2001). Hybrid Management: Boundary Organizations, Science Policy, and EnvironmentalGovernance in the Climate Regime. Science, Technology & Human Values. 26 (4): 478-500.
Molden, D., Douglan, M., (2002). Managing water from farmers’ fields to river basin: implications of scale. In:Turton, A.R.Henwood, (Eds.). Hydropolitics in the Developing World: a Southern African Perspective. AfricanWater Issues Research Unit, Pretoria.
Norgaard, R., Kallis, G. & Kiparsky, M. (2009). Collectively engaging complex socio-ecological systems: re-envisioning science, governance, and the California Delta. Environmental Science and Policy. 12: 644-52.
Ostrom, E. 1990. Governing the commons: The evolution of institutions for collective action. Cambridge, UK:Cambridge University Press.Pahl-Wostl, C., et al. (2007). Social Learning and Water ResourcesManagement. Ecology and Society. 12 (2): 5.
Parkes, M. et al, (2010). Towards integrated governance for water, health and social-ecological systems:The watershed governance prism. Global Environmental Change. Vol. 20: 693-704.
Pahl-Wostl, C. (2007). Transitions towards adaptive management of water facing climate and global change.Water Resources Management, 21(1), 49-62.
Pedynowski, D. (2003). Sciences(s): which, when and whose? Probing the metanarrative of scientificknowledge in the social construction of nature. Progress in Human Geography. Vol. 27, No. 6: 735-52.
Pollock, R.M. & Whitelaw, G.S. Community-Based Monitoring in Support of Local Sustainability. LocalEnvironment 10: 3: 211-228.
Prasad, N. (2006). Privatisation Results: Private Sector Participation in Water Services After 15Years. Development Policy Review. 24 (6): 669-692

WLC Template
file:///E|/Dropbox/WaterHealthNewFinal/Course4/discussion/WH40M070D001References.htm[12/17/2014 12:52:41 AM]
Pruss-Ustun, A., Corvalan, C. (2005). Preventing Disease through Healthy Environments: Towards anEstimate of the Environmental Burden of Disease. World Health Organisation, Geneva.
Reed, M. (2010). Guess who's (not) coming for dinner: Expanding the terms of public involvement insustainable forest management. Scandinavian Journal of Forest Research. 25(Suppl 9): 45-54.
Reed, M. & Bruyneel, S. (2010). Rescaling environmental governance, rethinking the state: A three-dimensional review. Progress in Human Geography. Published online: doi:10.1177/0309132509354836
Rogers, A. and Taylor, P. (1998), Participatory Curriculum Development in Agricultural Education. A TrainingGuide. Rome: FAO.
Roth, D., Boelens, R., & Zwarteveen, M. (Eds.). (2005). Liquid relations: contested water rights and legalcomplexity. Rutgers University Press.
Scarpa, R., Rose, J.M. (2008) "Design efficiency for non-market valuation with choice modelling: how tomeasure it, what to report and why." Australian Journal of Agricultural and Resource Economics, Vol. 52,253-282
Shiva V (2002) Water Wars: Privatization, Pollution and Profit. London: Pluto Press
Simms, G. And R.C. de Loë. 2010. Challenges for Water Governance in Canada: A Discussion Paper.Governance for Source Water Protection in Canada Report No. 2. Waterloo, ON: Water Policy andGovernance Group
Sneddon, C. (2003). Reconfiguring scale and power: the Khong-Chi-Mun Project in NortheastThailand. Environment and Planning A, 35, 2229-2250.
Swyngedouw, E. (1999). Modernity and hybridity: nature, regeneracionismo, and the production of theSpanish waterscape. Annals of the Association of American Geographers, 89(1), 443-465.
Taylor, P. (2006) The Urban Governance Index: A tool to measure the quality of urban governance,Presentation to UNESCO UN-HABITAT meeting, Paris, December 2006.
Trawick, P. (2003) Against the privatization of water: an indigenous model for improving existing laws andsuccessfully governing the commons, World Development, 31(6), pp. 977–996.
United Nation Environmental Program (UNEP), (2002). Atlas of International Freshwater Agreements.UNEP, Nairobi, Kenya.
United Nations Food and Agriculture Organization (UNFAO). (1984). Systematic Index of International WaterResources Treaties, Declarations, Acts and Cases, by Basin. Volume II. Legislative Study 34 Rome: Foodand Agriculture Organization of the United Nations.
United Nations General Assembly. (1945). UN Declaration of Human Rights, New York: UN,.
United Nations General Assembly. (1966). International Covenant on Civil and Political Rights. New York.
United Nations General Assembly. International Covenant on Economic, Social and Cultural Rights. NewYork: 1966.
United Nations General Assembly. (1979). Convention on the Elimination of All Forms of Discriminationagainst Women New York.

WLC Template
file:///E|/Dropbox/WaterHealthNewFinal/Course4/discussion/WH40M070D001References.htm[12/17/2014 12:52:41 AM]
United Nations General Assembly. (1990). Convention on the Rights of the Child. New York.
United Nations General Assembly. (2007). Declaration on the Rights of Indigenous Peoples. New York.
United Nations General Assembly. (2008).Convention on the Rights of Persons with Disabilities. New York.
United Nations World Water Assessment Programme. (2003). Water for People, Water for Life: The UnitedNations World Water Development Report. New York: UNESCO Publishing.
Van Buuren, A. (2009). Knowledge for Governance, Governance of Knowledge: Inclusive KnowledgeManagement in Collaborative Governance Processes. International Public Management Journal. 12(2): 208-35.
Van Kammen, J., de Savigny, D. & Sewankamboc, N. (2006). Using knowledge brokering to promoteevidence-based policy-making: the need for support structures. Bulletin of the WorldHealth Organization. Vol. 84, pp. 608-612.
van Lieshout, M., Dewulf, A., Aarts, M. & C. Termeer. (2011). Do Scale Frames Matter? Scale FrameMismatches in the Decision Making Process of a “Mega Farm” in a Small Dutch Village. Ecology &Society. 16(1): 38..
Wolf, A. et al, (1999). International river basins of the world. International Journal of Water ResourcesDevelopment. 15 (4): 387–427.
World Bank (2005). World Development Report 2006: Equity and Development. New York: Oxford UniversityPress for the World Bank.
World Bank (2006). A Decade of Measuring the Quality of Governance. Worldwide Governance IndicatorsProject. Available at: http://siteresources.worldbank.org/INTWBIGOVANTCOR/Resources/1740479-1150402582357/2661829-1158008871017/booklet_decade_of_measuring_governance.pdf (Internet AccessRequired)
World Health Organization. Preamble to the Constitution of the World Health Organization as adopted by theInternational Health Conference, New York, 19-22 June, 1946; signed on 22 July 1946 by therepresentatives of 61 States (Official Records of the World Health Organization, no. 2, p. 100) and enteredinto force on 7 April 1948.
World Water Council (2006) Costing MDG Target 10 on Water Supply and Sanitation: Comparative Analysis,Obstacles and Recommendations. Available at: www.worldwatercouncil.org
World Water Forum (2000) Forum session conclusions ‘Water and Indigenous Peoples’ of the SecondWorldWater Forum, March 2000 (available at: http://www.worldwaterforum.org). (Internet Access Required)
WHO and UNICEF (2004). Meeting the MDG Drinking Water and Sanitation Target: A Mid-Term Assessmentof Progress. New York: WHO and UNICEF.
n.a. Water Law and Indigenous Rights - WALIR Towards recognition of indigenous water rights andmanagement rules in national legislation, Summary of the presentations at the public meeting (7 March2002) on the occasion of the International WALIR Seminar, 4-8 March 2002, Wageningen, TheNetherlandsWater Governance Facility, (nd). Training Manual on Water Integrity
Wilde, O. (1890) The Picture of Dorian Gray. Chapter 4.

WLC Template
file:///E|/Dropbox/WaterHealthNewFinal/Course4/discussion/WH40M070D004ReadingMaterials_EnvironValuation.htm[12/17/2014 12:52:41 AM]
WATER and HEALTH - Course 4 Social Perspectives on Warer and Health
Economics of Valuation of Land Degradation (Environmental Degradation and Restoration)
and Economic Valuation for Wetland Conservation
Key Readings
This page is identical to the Discussion Page
Indicative textbook
Perman, R., Ma, Y., Common, M., Maddison, D., Mcgilvray, J. (2011) Natural Resource andEnvironmental Economics, 4th Edition. Pearson Education. 712p.
This textbook is written as an introductory textbook and covers all the material described inthis unit. It contains clear text descriptions as well as illustrative graphs and mathematicalequations. The companion website also provides example files. Depending on your ownproficiency in maths you may find other textbooks more suited to your needs but thistextbook should constitute a good starting point.
All sections
ELD Initiative (2013). The rewards of investing in sustainable land management. InterimReport for the Economics of Land Degradation Initiative: A global strategy for sustainableland management. Thomas, R.J., Quillérou, E., Stewart, N. (Coordinators and Eds.), 124pp.Available at: www.eld-initiative.org/ or http://inweh.unu.edu/reports/ [17 September 2013]
This report provides a good complement to this course. It details selected case studies andthe general background for the initiative and briefly reviews the methods detailed in thiscourse.
Section 1 WH40M05D001Challenges1
Pagiola, S., von Ritter, K., Bishop, J. (2004). Section 1 Introduction & Section 2 Ecosystemsand the services they provide. In: How much is an ecosystem worth? Assessing theEconomic Value of Ecosystem Conservation. In collaboration with The Nature Conservancyand IUCN - The World Conservation Union (Ed.). The World Bank Environment Departmentpaper, pp. 1-8. Available from: http://www.cbd.int/doc/case-studies/inc/cs-inc-iucn-nc-wb-en.pdf [22 November 2011]
The first part of this report outlines the key questions an economic analysis can help answerto complement other disciplinary perspectives.
Perman, R., Ma, Y., Common, M., Maddison, D., Mcgilvray, J. (2011) Chapter 2: The originsof the Sustainability Problem. In: Natural Resource and Environmental Economics, 4thEdition. Pearson Education, pp. 16-58.
This chapter provides an overview of the discussion on why we as a society should aim forsustainability.

WLC Template
file:///E|/Dropbox/WaterHealthNewFinal/Course4/discussion/WH40M070D004ReadingMaterials_EnvironValuation.htm[12/17/2014 12:52:41 AM]
Perman, R., Ma, Y., Common, M., Maddison, D., Mcgilvray, J. (2011) Chapter 3: Ethics,Economics and the Environment. In: Natural Resource and Environmental Economics, 4thEdition. Pearson Education, pp. 59-91.
This chapter provides an overview of utilititarism, that is the economic perspective adoptedin this unit, and its consequences for the definition of sustainability.
Shanahan, M. (2008) Entangled in the web of life: biodiversity and the media. IIED BriefingPapers, May 2008, 4pp. Available from: http://pubs.iied.org/pdfs/17037IIED.pdf [01 May2012]
This breifing paper details some ecosystem services provides by nature and outlines theimportance of using a communication language relevant to the target audience to triggereffective management.
Section 2 WH40M05D003Challenges2
Pagiola, S., von Ritter, K., Bishop, J. (2004). Section 3 Valuing ecosystem services. In: Howmuch is an ecosystem worth? Assessing the Economic Value of Ecosystem Conservation.In collaboration with The Nature Conservancy and IUCN - The World Conservation Union(Ed.). The World Bank Environment Department paper, pp. 9-12. Available from:http://www.cbd.int/doc/case-studies/inc/cs-inc-iucn-nc-wb-en.pdf [22 November 2011]
The second part of this report briefly describes methods available to decision-makers forenvironmental valuation.
Perman, R., Ma, Y., Common, M., Maddison, D., Mcgilvray, J. (2011) Chapter 4: Welfareeconomics and the Environment. In: Natural Resource and Environmental Economics, 4thEdition. Pearson Education, pp. 92-136.
This chapter provides an overview of the economics tools for analysis of environmentalchange. It describes the conditions for efficient allocation, how a market system woulddeliver this efficient allocation and why allocation is not always efficient as the rationale forgovernment intervention through public policy-making. In particular, it details the keyproblems of externalities and market failure arising in relation to the environment.
Perman, R., Ma, Y., Common, M., Maddison, D., Mcgilvray, J. (2011) Chapter 12: Valuingthe environment. In: Natural Resource and Environmental Economics, 4th Edition. PearsonEducation, pp. 411-454.
This chapter details the total economic value framework, the concepts of willingness to payand to accept, compensating surplus and equivalent surplus. It explains how to use differentmethods to conduct environmental valuation.
Section 3 WH40M05D006Challenges3 Cost-benefit
Pagiola, S., von Ritter, K., Bishop, J. (2004). Section 3 Valuing ecosystem services. In: Howmuch is an ecosystem worth? Assessing the Economic Value of Ecosystem Conservation.In collaboration with The Nature Conservancy and IUCN - The World Conservation Union(Ed.). The World Bank Environment Department paper, pp. 13-33. Available from:

WLC Template
file:///E|/Dropbox/WaterHealthNewFinal/Course4/discussion/WH40M070D004ReadingMaterials_EnvironValuation.htm[12/17/2014 12:52:41 AM]
http://www.cbd.int/doc/case-studies/inc/cs-inc-iucn-nc-wb-en.pdf [22 November 2011]
The last part of this report outlines general principles of cost-benefit analysis and potentialscenarios to be considered for assessment.
Perman, R., Ma, Y., Common, M., Maddison, D., Mcgilvray, J. (2011) Chapter 11: Cost-Benefit Analysis. In: Natural Resource and Environmental Economics, 4th Edition. PearsonEducation, pp. 367-410.
This chapter details the economic principles behind cost-benefit analysis. It outlines theimpact of the timing of costs and benefits on decisions made.
Perman, R., Ma, Y., Common, M., Maddison, D., Mcgilvray, J. (2011) Chapter 13:Irreversibility, risk and Uncertainty. In: Natural Resource and Environmental Economics, 4thEdition. Pearson Education, pp. 455-481.
This chapter explains the difference between risk and uncertainty and their consequencesfor decision-making at the individual and the society levels.
Key Readings on Economic Valuation for Wetland Conservation
GIZ. 2012. Integrating Ecosystem Services into Development Planning. A stepwise approach for practitioners based on the TEEBapproach.
Irwin, F. and J. Ranganathan. 2007. Restoring Nature’s Capital. An Action Agenda to Sustain Ecosystem Services. World ResearchInstitute, Washington, DC. Available at: http://pdf.wri.org/restoring_natures_capital.pdf
Millennium Ecosystem Assessment, 2005. Ecosystems and Human Well-being: Synthesis. Island Press, Washington, DC..Available at: www.maweb.org
Russi D., ten Brink P., Farmer A., Badura T., Coates D., Förster J., Kumar R. and Davidson N. 2013. The Economics ofEcosystems and Biodiversity for Water and Wetlands. IEEP, London and Brussels; Ramsar Secretariat, Gland. Available at:http://data.iucn.org/dbtw-wpd/edocs/2013-001.pdf
TEEB .2010. The Economics of Ecosystems and Biodiversity Ecological and Economic Foundations. Edited by Pushpam Kumar.Earthscan, London and Washington.
UNEP-WCMC. 2011. Marine and coastal ecosystem services: Valuation methods and their application. UNEP-WCMC BiodiversitySeries No. 33. 46 pp. Available at: http://www.unep.org/dewa/Portals/67/pdf/Marine_and_Coastal_Ecosystem.pdf (Internet AccessRequired)
Conservation International. 2008. Economic Values of Coral Reefs, Mangroves, and Seagrasses: A Global Compilation. Center forApplied Biodiversity Science, Conservation International, Arlington, VA, USA. Available at:http://www.conservation.org/documents/CI_Marine_CI_Economic_Values_Coral_Reefs_Mangroves_Seagrasses_compilation_2008.pdf (Internet Access Required)
Further Readings
The following readings have been selected because the description of the methodologies is still relevant. They aim to develop anunderstanding of the methods, their applications and some of their limitations. The methods detailed in this unit were primarilydeveloped in the 1990s and 2000s and methodological steps have not changed much since. Current research is still beingconducted on reducing empirical biases for improvement of the empirical results derived from these methods. The economic valuesdetailed in these readings would need to be updated and should be considered with caution. This list is far from being exhaustive,you can check your local university libraries, the Internet and other available sources for more examples.

WLC Template
file:///E|/Dropbox/WaterHealthNewFinal/Course4/discussion/WH40M070D004ReadingMaterials_EnvironValuation.htm[12/17/2014 12:52:41 AM]
Bennett, J., Birol, E. (2010) Choice Experiment in Developing Countries: Implementation, Challenges and PolicyImplications. Edward Elgar, 321pp.
This is an excellent reference book on applications of the choice experiment method in developing countries. Itcan be used in the first half of Section 4 as an example case study.
Bromley, D.-W. (1995) Part V: The Valuation Problem, Chapters 24 to 30. In: The Handbook of EnvironmentalEconomics. Massachusetts: Blackwell Publishers, pp. 543-686.
This reading details economic methods for environmental valuation, their theoretical basis, the main steps andtheir main limitations.
Commission on the Measurement of Economic Performance and Social Progress (2009) The Report of thecommission on the measurement of economic performance et social progress. Available from:http://www.stiglitz-sen-fitoussi.fr/en/ [Accessed 01 May 2012]
Also known as the "Stiglitz-Sen-Fitoussi" report. The Commission was set up to look at the (in)adequacy ofcurrent measures of economic performance and their relevance for measuring societal well-being as well aseconomic, environmental and social sustainability and propose new tools for improved assessment. The reportsummarises their findings.
Grafton, Q., Adamowicz, W., Dupont, D., Nelson, H., Hill, R. J., & Renzetti, S. (2004) Part III: EnvironmentalValuation, Chapters 8 to 10. In: The Economics of the Environment and Natural Resources. Wiley-Blackwell,pp. 219-311.
This reading details the economic methods for environmental valuation: their theoretical foundations, main stepsand limitations.
Hanley, N., Shogren, J. F., White, B. (1997) Chapter 12: The Theory of Nonmarket Valuation. In: EnvironmentalEconomics in Theory and Practice. Basingstoke, Hampshire: Palgrave Macmillan, pp. 356-382.
This reading details the economic methods for environmental valuation: their theoretical foundations, main stepsand limitations.
Hanley, N. (1999) Chapter 57: Cost–benefit Analysis of Environmental Policy and Management. In: van denBergh, J. C. J. M. (ed). Handbook Of Environmental And Resource Economics. Cheltenham, United Kingdom:Edward Elgar, pp. 824-836
This reading details principles of environmental cost-benefit analysis: its theoretical foundations, main steps andlimitations.
Stern, N. (2007) Stern Review on the Economics of Climate Change. Cabinet Office - HM Treasury. ISBN:9780521700801. 712p. Available from:
http://webarchive.nationalarchives.gov.uk/+/http://www.hm-treasury.gov.uk/sternreview_index.htm
(Internet Access Required)
This review compared the economic cost of action versus the costs of inaction for mitigating climate change.The results of this review triggered a very strong political support for climate change mitigation strategiesthroughout the world and a reorientation of economic development towards green growth. This political supportwas associated with huge investments for climate change mitigation technology development, financial support

WLC Template
file:///E|/Dropbox/WaterHealthNewFinal/Course4/discussion/WH40M070D004ReadingMaterials_EnvironValuation.htm[12/17/2014 12:52:41 AM]
for adoption of green technologies and implementation of climate change-related policies. This economicanalysis constitutes the current reference for economic assessment to induce action.
Scarpa, R., Rose, J.M. (2008) Design efficiency for non-market valuation with choice modelling: how tomeasure it, what to report and why. Australian Journal of Agricultural and Resource Economics, Vol. 52, 253-282
This paper details why efficient designs should be preferred to design choice modeling cards.
"For the student" paper series, The Australian Economic Review. Available from:http://onlinelibrary.wiley.com/journal/10.1111/%28ISSN%291467-8462 (Internet Access Required)
These papers explain basic economic concepts in simple terms for people training in economics in more detailsthan in a traditional academic paper.
References
Borresch, R., Maas, S., Schmitz, K., Schmitz, P. M. (2009) Modelling the value of amultifunctional landscape – A discrete choice experiment. International Association of
Agricultural Economists Conference, Beijing, China, August 16-22, 2009, 13 pages.Available from: http://ageconsearch.umn.edu/bitstream/51641/2/IAAE2009_692.pdf (InternetAccess Required)
Lancaster, K. (1966) A New Approach to Consumer Theory. Journal of Political Economy,Vol. 74, pp. 132--157.
Wilde, O. (1890) The Picture of Dorian Gray. Chapter 4.
Scarpa, R., Rose, J.M. (2008) "Design efficiency for non-market valuation with choicemodelling: how to measure it, what to report and why." Australian Journal of Agricultural andResource Economics, Vol. 52, 253-282
Weblinks and Portals
EnvironmentalValuation ReferenceInventory (EVRI)
The EVRI is a Canadian-run searchable storehouse of empiricalstudies on the economic value of environmental benefits andhuman health effects using various valuation methods. Thisstorehouse has been developed as a tool to help policy analystsuse the benefit transfer method.
https://www.evri.ca/ (Internet Access Required)
[Accessed 01 May 2012]
Envalue The ENVALUE environmental valuation database is an Australian-run systematic collection of environmental valuation studiespresented in an on-line database. It is expected that the ENVALUE

WLC Template
file:///E|/Dropbox/WaterHealthNewFinal/Course4/discussion/WH40M070D004ReadingMaterials_EnvironValuation.htm[12/17/2014 12:52:41 AM]
database will assist decision makers in government and industry aswell as academics, consultants and environmental groups, toincorporate environmental values into cost-benefit analyses,environmental impact statements, project appraisals and overallvaluation of changes in environmental quality.
http://www.environment.nsw.gov.au/envalueapp/ (Internet AccessRequired)
The EnvironmentalValuation and Cost-benefit website
A source of case studies, examples and further references
http://www.costbenefitanalysis.org/ (Internet Access Required)
[Accessed 01 May 2012]
Venice Platform The Coastal Wiki : Internet encyclopedia for coastal and marineprofessionals
http://www.coastalwiki.org/coastalwiki/ (Internet Access Required)
[Accessed 01 May 2012]
The World Bank,Environment Section
A good source of examples of policies, green growth strategies andindicators
http://go.worldbank.org/B28KB6VQQ0 (Internet Access Required)
Economic Valuation for Wetland Conservation -
Ecosystem Valuation: www.ecosystemvaluation.org (Internet Access Required)
The Natural Capital Project: http://www.naturalcapitalproject.org/ (Internet Access Required)
The Economics of Ecosystems and Biodiversity (TEEB): http://www.teebweb.org/ (Internet Access Required)
Multimedia
Pavan Sukhdev (2011) Put a value on nature! Technology Education and Design (TED) Talk July 2011.Available from: http://www.ted.com/talks/pavan_sukhdev_what_s_the_price_of_nature.html (Internet AccessRequired) [Accessed 01 May 2012]