
WASWebserverplug
60
WebSphere Application Server V5 Understanding the WebSphere Application Server Web server plug-in Sharad Cocasse Makarand Kulkarni IBM WebSphere Execution Team October 2003
description
Webserver plugin details and troubleshooting
Transcript of WASWebserverplug

WebSphere Application Server V5
Understanding the WebSphere Application Server
Web server plug-in
Sharad Cocasse Makarand Kulkarni
IBM WebSphere Execution Team October 2003

2
About the authors Sharad Cocasse is a Staff Software Engineer on the WebSphere Execution Team. His experience includes several years of writing object-oriented applications and developing/delivering WebSphere education to Customers and IBM field technical personnel. Most recently, he has been directly helping customers succeed with their use of the WebSphere Application Server. Sharad holds a Masters Degree in Electrical Engineering from the University of Alabama and lives and works in Rochester, Minnesota. Sharad can be reached at [email protected] Makarand Kulkarni is a Staff Software Engineer on the WebSphere Execution Team. He has more than three years experience working with WebSphere-based solutions, and has helped many customers integrate and test WebSphere solutions on various platforms. His areas of expertise are J2EE client/server applications, CORBA interoperability and WebSphere work load management. Makarand works at the IBM Pittsburgh, PA, lab and can be reached at [email protected] Acknowledgements We would like to thank the following people for their invaluable contributions to this paper:
• Daniel Julin, Technical Area Lead, WebSphere Support • Jim Stetor, Manager, WebSphere Execution Team • Arvind Srinivasan, WebSphere Application Server Development
3
Table of Contents
Introduction ………………………………………………………………………………………
1 Understanding the Web server plug-in …………………………………………………
1.1 Plug-in basics …………………………………………………………… 1.2 Plug-in architecture …………………………………………………………… 1.3 Plug-in operation …………………………………………………………… 1.4 Operation of the HttpTransport module ………………………………
2 Plug-in configuration parameters …………………………………………………
2.1 Parameters on application server node ……………………………… 2.2 Parameters on the Web server side ………………………………………
3 Problem determination ……………………………………………………………………
3.1 Logs and traces …………………………………………………………… 3.1.1 Logs and traces on the plug-in side …………………… 3.1.2 Logs and traces on the application server side ……………
3.2 Debugging tools and techniques ……………………………………… 3.2.1 Using OS command: netstat ……………………………… 3.2.2 Using telnet as a debugging tool ……………………………… 3.2.3 Using a Web browser to diagnose the problem …………… 3.2.4 Using Tivoli Performance Viewer ……………………………… 3.2.5 Generating javacore files ……………………………………… 3.2.6 Server-status utility in IBM HTTP Server ……………………
3.3 Debugging WebSphere hangs ………………………………………
4 Miscellaneous topics …………………………………………………………………… 4.1 Configuring IHS 2.0 plug-in ………………………………………………… 4.2 Merging two plug-in files together ………………………………………
Conclusion ………………………………………………………………………………………
Appendix A TCP/IP backlog and application server hang conditions ……………………
Appendix B Summary of references ……………………………………………………………
4 5 5 6 8 18 20 20 25 29 29 29 35 35 39 41 42 45 46 48 52 52 52 54 55 59
4
Introduction What is the WebSphere Application Server Web server plug-in? The IBM® WebSphere® Application Server Web server plug-in is the “glue” between a Web server and WebSphere Application Server. The primary responsibility of the plug-in is to forward HTTP requests from the Web server to the WebSphere Application Server. The plug-in is shipped along with a WebSphere Application Server installation CD and is comprised of a native library. Although the plug-in code varies with the Web server type and the operating system that it’s running on, its overall functionality remains the same. Who should read this document? This is a technical paper intended for audiences such as application developers, architects, system administrators or anyone wanting to understand or debug the plug-in. Although this paper has been written and tested for WebSphere Application Server V5, it will be very useful for Version 4 users as well. This paper puts special emphasis on understanding and rectifying failure situations related to the plug-in, especially such failures which are caused due to overloaded or hung systems. This paper does not discuss the workings of a Web server.
5
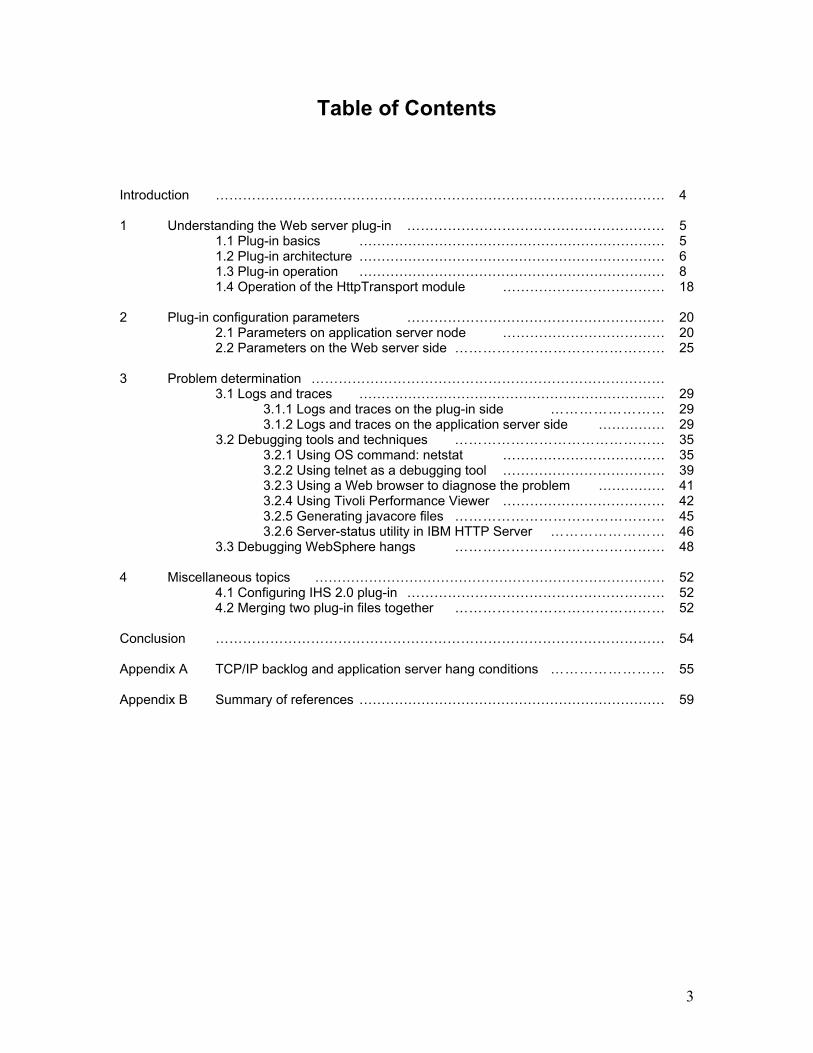
1 Understanding the Web server plug-in An in-depth understanding of the plug-in will not only help you troubleshoot plug-in-related issues more quickly, but it will also help you make better application architecture decisions. The WebSphere plug-in is developed using the native programming language C which, unlike Java™, is used for developing the application server. The plug-in code varies slightly depending on the operating system (OS) and the Web server being used, but in spite of these slight differences, its operation is very similar on all operating systems and Web servers. The examples provided in this section are based on IBM HTTP Server version 1.3.26 running on Windows® 2000. The application server used is WebSphere Application Server V5 running on the same Windows node. Although we used a single node for our testing, all the concepts discussed in this section will apply to multi-node scenarios as well. 1.1 Plug-in basics WebSphere Application Server can be front-ended by a variety of supported Web servers. These Web servers can be from different vendors running on many different operating systems1. As seen in Figure 1, an HTTP request from a Web browser enters the Web server and is then redirected to the application server. This redirection is performed by the WebSphere plug-in. You can think of the WebSphere plug-in as an “agent” redirecting HTTP requests from the Web server to the application server using the HTTP protocol. Figure 1. The plug-in agent
1 List of supported Web servers available at: http://www-3.ibm.com/software/webservers/appserv/doc/latest/prereq.html
Web Server
plugin “agent”
AppServer
WWW Internet browsers like IE or NS
Http Transport
HTTP HTTP
6
This redirection is based on a set of rules dependent upon the WebSphere Application Server configuration. The Web server gives the WebSphere plug-in an opportunity to handle every request first, and only when WebSphere is not configured to service that URL does the request go to the Web server for servicing. The plug-in code is in the form of a DLL library on Windows, an SO library on AIX®, Solaris®, and so on. This library resides on the Web server machine and is loaded by the Web server startup process. The plug-in “sends” HTTP requests, and so is essentially an HTTP client. The application server receives those requests, and is therefore an HTTP Server. The component inside the application server which does the job of an HTTP Server is known as the HttpTransport. The HttpTransport receives requests over a port that’s unique to that application server (e.g. port 9081). An application server can be configured to receive requests over multiple ports (e.g. ports 9081 and 9082), in which case there would be two instances of the HttpTransport component in that application server. Note that while a certain application server is using ports 9081 and 9082, no other application servers on that node can be configured to use these same ports.
Question:
Why not send the HTTP requests from the Web server directly to HttpTransport and thus bypass the Web server/plug-in combination?
Answer:
Using the plug-in has many advantages: • The plug-in provides work load management and failover capabilities by
distributing requests evenly to multiple application servers and routing requests away from a failed application server.
• Static content can be served by the Web server without doing a full round trip to the application server, thus providing better performance.
• The Web server provides an additional hardware layer between the Web browser and the application server, thus strengthening the application server’s security.
1.2 Plug-in architecture Now, let’s look at the details. To understand the plug-in’s operation, let’s start by looking at the figure below:

7
Figure 2. Detailed view of the plug-in operation
1. Web Server Process – native code: This is where the request first comes in. The default port through which it comes in is port 80.
2. httpd.conf: The default configuration file of the IBM HTTP Server (HIS) Web server. It contains the location of the plug-in DLL and plugin-cfg.xml. The plug-in DLL and plugin-cfg.xml are loaded during the startup of the Web server.
3. Plug-in: DLL residing on the same system as the Web server. This DLL is shipped along with WebSphere Application Server (if WebSphere is on a different machine than IHS, this file has to be copied over to the IHS node). It is loaded into memory by the Web server during startup and runs inside the same process as the Web server.
Tip:
Web servers can be multi-process/single-threaded or single-process/multi-threaded. For multi-process Web servers, each HTTP request is associated with a separate PID on the Web server machine, and a separate copy of the plug-in is loaded in each Web server process. An example of a multi-process Web server is IHS 1.3.x on AIX. A single process Web server is one in which each HTTP request is associated with a separate thread in the same PID, and therefore only a single copy of the plug-in is loaded. Examples of single-process Web servers are IHS 2.0 on AIX, and IHS 1.3.x on Windows and iPlanet®.
4. plugin-cfg.xml: This is WebSphere’s plug-in configuration file and
contains information about which URLs should be serviced by WebSphere.
Web server APIs
HTTP Transport
Web server Process – native code AppServer process – Java code
DoGet()
DoPost ()
Web Container Plugin-cfg.xml
Parse request
Plug-in
TCP/IP port number arbitrarily assigned
Configurable TCP/IP port number Example: 9080
httpd.conf
Web server Port Example: 80
Request from browser
Send request
Recv response
TCP/IP backlog
TCP/IP backlog

8
This configuration file is generated by WebSphere at a cell level based on all the Web modules installed in that cell. If WebSphere is on a different machine than IHS, this file has to be copied over to the IHS node. A single Web server/plug-in can service multiple cells. To do that, the plugin-cfg.xml file from all the cells have to be manually merged into one; details in Section 4.
5. HttpTransport: This component is an HTTP Server implemented in Java. Its job is to accept the HTTP request from the plug-in, and then forward it to the Web container. This is a part of the product code that runs inside WebSphere Application Server.
6. Web container: Implements the J2EE servlet specification. It is responsible for processing data inside the request and giving the response data back to the plug-in-in.
Question:
Can we mix operating systems? For instance, can we architect a solution with a Web server and plug-in on Linux and the application server on AIX?
Answer:
Yes. Make sure you have the Linux version of the plug-in, not the AIX version.
Question:
Can we mix WebSphere Application Server versions?
Answer:
Yes. A V3.5.x Open Servlet Engine (OSE) plug-in and the V5 HTTP plug-in can be run inthe same Web server installation. The V5 plug-in can spray requests to a V4 ApplicationServer as well. See: http://www.redbooks.ibm.com/redbooks/pdfs/sg246910.pdf orhttp://publib.boulder.ibm.com/infocenter/wasinfo/topic/com.ibm.websphere.base.doc/info/aes/ae/tins_websmig2.html.
1.3 Plug-in operation Essentially, there are four functions of the plug-in:
a. Initialization b. URL matching and clone determination c. Sending requests to the application server d. Receiving responses from the application server
Let’s discuss each of these steps in detail. a. Initialization When IHS is started (using the command <IHS_HOME>\apache –k start), the IHS configuration file <IHS_HOME>\conf\httpd.conf is read during the

9
initialization. If WebSphere is configured to use that instance of IHS, the httpd.conf file contains the following two directives:
LoadModule ibm_app_server_http_module <WASDIR>/bin/mod_ibm_app_server_http.dll
WebSpherePluginConfig <WAS5_HOME>\config\cells\plugin-cfg.xml
LoadModule points to the plug-in DLL, and WebSpherePluginConfig points to the plugin-cfg.xml file, which lists all the URLs that are to be serviced by the WebSphere cell.
Question:
Can two or more WebSphere cells be sprayed by a single plug-in?
Answer:
Yes. You have to merge the two plug-in files (generated by the two cells) into one single file. Details in Section 4.
When the Web server is starting, it loads the plug-in DLL, and then:
1. loads the plugin-cfg.xml into the plug-in process 2. parses and validates the plug-in configuration file.
Once the DLL has been found and loaded, and the configuration file has been found, loaded and successfully parsed, then initialization is complete and the plug-in is ready to receive HTTP requests.
Debug tip:
The plug-in will not load successfully if: - The plug-in DLL and/or plugin-cfg.xml are not in the location specified. - The version of the DLL is incorrect. (e.g. using WebSphere Application Server
V4’s DLL with V5. - The XML file has a format error or content error detected during parsing.
The reason for failure can be found in:
- The command prompt from where the Web server Start command has been initiated, and
- In the plug-in log file <WAS_HOME>\logs\http_plugin.log. See Section 3 for detailed information about debugging plug-in initialization failures.
- Modifying and reloading the plug-in file When new applications are installed in WebSphere Application Server, or when existing ones are modified, it may be necessary to update plugin-cfg.xml. The plug-in configuration file can be modified in the following ways:

10
- Use the Web-based administration user interface (webui). - Run the command line utility GenPluginCfg.bat2. - Manually edit plugin-cfg.xml in a text editor3.
If the Web server resides on a machine other than the application server machine, the plug-in file needs to be copied or FTP’d from the application server machine to the Web server machine. If plugin-cfg.xml is updated, it can automatically be reloaded by the plug-in without requiring a restart of the Web server. By default, the plug-in attempts to reload the plug-in configuration file every 60 seconds. The plug-in does this by checking the timestamp of plugin-cfg.xml, and if the timestamp has changed since the previous check, it reloads it. The default poll rate is 60 seconds and should be sufficient for most applications. However, if you need to change it, insert the RefreshInterval attribute into the Config tag of plugin-cfg.xml. Please note that this integer represents seconds, so in this example, we are reloading the plug-in file every 5 minutes: <?xml version="1.0"?><Config RefreshInterval=”300”>
<Log LogLevel="Warn" Name="D:\WebSphere\AppServer/logs/http_plugin.log"/>
<Property Name="ESIEnable" Value="false"/><Property Name="ESIMaxCacheSize" Value="1024"/>
The plug-in polls the timestamp on plugin-cfg.xml only when a new request comes in. Therefore, the updated plug-in is not loaded into the process memory until a new request is received, after the RefreshInterval period has elapsed. A lower value for RefreshInterval may be needed in some test/development environments where applications are continually being updated. A higher value may be needed in stable production environments where the applications don’t change very frequently. This is a fairly low intensity function and not likely to provide a big performance boost for most environments. b. URL matching and Clone determination Whenever the Web server receives a new HTTP request, it first passes that request to the plug-in. If the plug-in is not configured to service that URI, then, and only then, does the Web server handle the request. The plug-in determines whether this request should be handled by WebSphere by matching the URL requested to all the URLs defined in plugin-cfg.xml. Before looking at the
2 http://publib7b.boulder.ibm.com/wasinfo1/en/info/aes/ae/trun_app_regen.html 3 http://publib7b.boulder.ibm.com/wasinfo1/en/info/aes/ae/trun_plugin_edit.html

11
flowchart in Figure 3, let’s understand the structure of a bare-bones plug-in configuration file, with many of the attributes stripped off for the sake of simplicity. <Config><Log LogLevel="Error" Name="<WAS_HOME>\logs\http_plugin.log"/>
<VirtualHostGroup Name="default_host"><VirtualHost Name="*:80"/>
</VirtualHostGroup><ServerCluster Name="MyCluster">
<Server Name="CL1"><Transport Hostname="SHARAD" Port="9080" Protocol="http"/>
</Server></ServerCluster>
<UriGroup Name="MyURIs"><Uri Name="/MyPath/*"/>
</UriGroup><Route ServerCluster="MyCluster"
UriGroup="MyURIs" VirtualHostGroup="default_host"/></Config> The purpose of a plug-in configuration file is to take a request and associate it with a server (clone) in a ServerCluster. The basic algorithm is very simple:
• The plug-in compares the request to each route. • If a match for URIGroup and VirtualHostGroup is found, the plug-in sends
the request to the associated ServerCluster • If there are multiple servers in the server cluster, the request is sent to one
of them depending upon various factors such as WLM policy, session information, etc.
If you are interested in learning more about the terminology used in the flowchart, refer to the following WebSphere Application Server InfoCenter URL: http://publib.boulder.ibm.com/infocenter/wasinfo/index.jsp?topic=/com.ibm.websphere.nd.doc/info/ae/ae/rrun_plugin.html

12
Figure 3. Flowchart describing the selection of the clone that will handle an HTTP request
Step 1: HTTP request enters the plug-in, http://www.xyz.com/MyPath/MyPage.
Step 2: Plug-in breaks down the URL into 2 parts: 1st, www.xyz.com:80 is the hostname or the Virtual Host, and 2nd, /MyPath/MyPage is the URI.
Step 4: Compare the Virtual Host of the request with all Virtual Hosts defined in the VirtualHostGroup of the Route.
Step 7: Compare the URI of request with all the URIs defined in the UriGroup of the Route. (start with 1st URI)
Yes
Step 11: ServerCluster in the selected Route to handle the request. Next step is to determine which Clone will handle the request.
Step 8: Find URI match?
Step 13: Same Clone to handle request. Prepare and send request to Clone. Yes
Step 12: Find existing CloneID in request?
No
Step 14: Determine Clone based on LoadBalanceWeight, ClusterAddress and the Random/RoundRobin algorithm.
Step 15: Prepare and send request to the selected Clone.
Step 9: More routes?
Step 10b: WebSphere not to handle request. Return control to Web server. END.
Step 5: Find Route match?
Step 6: More Routes?
Yes. Next Route
Step 3: Find a Route in plugin-cfg.xml that will service this Virtual Host and URI. Start with the last Route listed in plugin-cfg.xml and then work upwards.
No
No
Yes, get Next route
Yes No
No
Step 10a: Route selected. WebSphere will handle the request.
Yes
No Step 8a: More URIs?

13
Step1: When the Web server receives a request, it is immediately passed to the plug-in (assuming no other plug-ins have been configured to take the request before the WebSphere Application Server plug-in). Step 2: The plug-in takes the request and splits it into two parts, the VirtualHost and the URI. Steps 3, 4, 5 and 6: The plug-in looks at each Route defined in the plugin-cfg.xml file, one at a time, from the bottom up. It compares the VirtualHost of the request with those defined in each Route. If a VirtualHostGroup is not defined for a route, the plug-in assumes the Route will match any hostname and port and moves on to Step 7. Note that if a request matches multiple Route tags, the Route nearest the end of the file will always match first. If there is no Route that matches the VirtualHost, the request is passed back to the Web server (Step 10b). Steps 7, 8, 8a and 9: Plug-in matches the URI of the request with those defined in the URIGroup in that Route. If a URIGroup is not present, then every request will match during the URI match portion of Route determination. Once the VirtualHost and URI have been matched to a Route, the plug-in knows that the request is intended for WebSphere. Steps 10a and 10b: If the VirtualHostGroup and URI match fail, the request is returned back to the Web server. Otherwise, it is sent to the ServerCluster that has been identified to handle the request. Steps 11, 12 and 13: The plug-in then checks the request's cookie or URL for the jsessionid parameter. If a jsessionid is found, the plug-in parses it, and removes the CloneID from the end. If the ServerCluster contains a Server identified by this CloneID, the request gets sent to the specified Server. If there is no jsessionid, or the ID does not correspond to a running Server, the request goes to step 14. Step 14: If there is no jsessionid, the plug-in uses LoadBalanceWeight, ClusterAddress and the Random/RoundRobin algorithm to determine the target Server. All these settings can be specified by the user. Step 15: HTTP request sent to the target Server. If the Server does not respond it is marked as "down", and the request is sent to another Server according to the selection policy. The plug-in will test the downed Server according to the RetryInterval value specified for the ServerCluster to see if it has come back up. The default RetryInterval value is 60 seconds. c. Sending the request to the application server This is a two step process:

14
1. Populate the HTTP client object: The plug-in does more than simply “forward” the browser’s request to the application server. Once the clone determination has been made, the plug-in actually breaks down the original HTTP request into its various components such as HTTP header, GET/POST data, etc. A new data packet is created by populating an empty HTTP client object with data from the user request. Once this new HTTP client object has been populated, it is ready to be sent. If the plug-in is configured to communicate with the HttpTransport over SSL, it is required to perform security functions as well.
2. The request is sent over the wire by flushing out the client object stream to the network using TCP/IP.
The plug-in knows that the request has been successfully sent to the application server if it receives a successful TCP/IP acknowledgement back from the application server’s TCP/IP layer. If the TCP/IP response does not come back within the timeout period, an HTTP error 500 is returned to the Web browser. This timeout is either the OS level TCP/IP timeout or the ConnectTimeout parameter in plugin-cfg.xml, whichever is lower. These timeouts are discussed in detail later in this section. Marking the server down If the plug-in is unable to send a request to a particular application server, it will mark that application server as being unreachable and will redirect that request (and all future requests) to the next clone in that ServerCluster. This failure/redirection step will cause a delayed response to the first request which detects the failed application server. If session sharing is enabled (using either persistence or in-memory session replication), the new clone will pick up the session information, and there will be no loss of session. But if the session is not being shared, it will cause the session information to be lost, and the user will have to create a new session. The browser gets an HTTP error 500 if every clone in the ServerCluster is down. The plug-in will not send future requests to the failed application server for a period specified by the RetryInterval attribute on the ServerCluster tag in plugin-cfg.xml. The unit of the RetryInterval is in seconds. It is modified as shown below: <ServerCluster Name="server1_Cluster" RetryInterval=”10”>
<Server Name="server1"><Transport Hostname="localhost" Port="9080" Protocol="http"/>
The application server will be marked as being down when it is unreachable in situations such as:
- the application server has been stopped - it is restarting

15
- it is hung (and its TCP/IP backlog is full, etc.). Choosing a RetryInterval value for your application The default value is 60 seconds, which should work well for most applications. Depending on your unique needs, you may consider increasing or decreasing that value for your environment. As a general rule, you don’t want to set a RetryInterval value too high, because then the failed clone will be out of loop for that much longer. In case of a heavily loaded application, this may overburden the remaining clones. However, with a high RetryInterval value, you will send a request to the failed clone less often, resulting in fewer response delays caused by the clone that is down. Retrying the application server when it is up again The plug-in retries sending a request to a downed application server every <RetryInterval> seconds. If the failed application server has recovered in that time, then it is marked as being “up” once again. Only new requests will be forwarded to this application server, and requests currently associated with other clones in this cluster will continue to go only to the old ones. Removing the CloneID from plugin-cfg.xml Sometimes, disabling the CloneID-checking step in the plug-in may provide performance enhancement to the plug-in. We saw in Figure 3 that every request that comes into the plug-in is checked for a pre-exiting CloneID and if the CloneID is found, than the request is sent to the same clone that had serviced that session earlier. If the applications running under this application server do not use HTTP sessions, then the CloneID check is extra overhead. To disable the CloneID check, open the plug-in file in any text editor and remove the CloneID attribute. After the CloneID attribute is removed, every request coming into the plug-in will be sprayed according to a simple round robin or random algorithm. This spraying rule is specified in plugin-cfg.xml (default is RoundRobin). Here’s how the CloneID attribute can be removed: Before removing the CloneID attribute, the ServerCluster entry in plugin-cfg.xml looks like this: <ServerCluster Name="SimpleSessionCluster">
<Server CloneID="uji3uo25" LoadBalanceWeight="2" Name="SessionServerA"><Transport Hostname="SHARAD.rchland.ibm.com" Port="9085" Protocol="http"/><Transport Hostname="SHARAD.rchland.ibm.com" Port="9448" Protocol="https">
<Property name="keyring" value="<WAS5_HOME>\etc\plugin-key.kdb"/><Property name="stashfile" value="<WAS5_HOME>\etc\plugin-key.sth"/>
</Transport></Server><Server CloneID="uji3uq4g" LoadBalanceWeight="2" Name="SessionServerB">
<Transport Hostname="SHARAD.rchland.ibm.com" Port="9086" Protocol="http"/>

16
<Transport Hostname="SHARAD.rchland.ibm.com" Port="9449" Protocol="https"><Property name="keyring" value="<WAS5_HOME>\etc\plugin-key.kdb"/><Property name="stashfile" value="<WAS5_HOME>\etc\plugin-key.sth"/>
</Transport></Server><PrimaryServers>
<Server Name="SessionServerA"/><Server Name="SessionServerB"/>
</PrimaryServers></ServerCluster>
After removing the CloneID attribute, the ServerCluster entry in plugin-cfg.xml looks like this: <ServerCluster Name="SimpleSessionCluster">
<Server LoadBalanceWeight="2" Name="SessionServerA"><Transport Hostname="SHARAD.rchland.ibm.com" Port="9085" Protocol="http"/><Transport Hostname="SHARAD.rchland.ibm.com" Port="9448" Protocol="https">
<Property name="keyring" value="<WAS5_HOME>\etc\plugin-key.kdb"/><Property name="stashfile" value="<WAS5_HOME>\etc\plugin-key.sth"/>
</Transport></Server><Server LoadBalanceWeight="2" Name="SessionServerB">
<Transport Hostname="SHARAD.rchland.ibm.com" Port="9086" Protocol="http"/><Transport Hostname="SHARAD.rchland.ibm.com" Port="9449" Protocol="https">
<Property name="keyring" value="<WAS5_HOME>\etc\plugin-key.kdb"/><Property name="stashfile" value="<WAS5_HOME>\etc\plugin-key.sth"/>
</Transport></Server><PrimaryServers>
<Server Name="SessionServerA"/><Server Name="SessionServerB"/>
</PrimaryServers></ServerCluster>
Warning:
For lightly loaded systems, removing the CloneID attribute may not necessarily show measurable improvement. It’s best not to hand-edit the plugin-cfg.xml file unless necessary. Bear in mind the following points before you remove the CloneID attribute:
- Removing the CloneID attribute will offer only marginal performance enhancement. The CloneID check is only one of the many checks that the plug-in does for a request.
- Hand-editing the configuration file is prone to human error. - Any hand editing to the configuration file may be overwritten the next time it is
regenerated by WebSphere.
d. Receiving response from the application server After sending a request to the application server, the plug-in goes into a wait state (waiting for the response). The end of this wait state can be reached in the following ways:
17
a. Expected behavior: When a response from the application server has been received by the plug-in, the response is passed on to the Web server and then to the Web browser.
b. Unexpected behavior: The request times out at a network level; the OS level TCP/IP times out because the destination (application server) is unreachable. This default TCP/IP timeout value varies depending on the OS. The OS level error seen in http_plugin.log is ETIMEDOUT.
c. Unexpected behavior: The request times out at a network level due to the ConnectTimeout parameter specified in plugin-cfg.xml. The OS level error in http_plugin.log is EINPROGRESS.
d. Unexpected behavior: If the application server’s IP address is reachable but the port is not up (for example, if the application server is in the stopped state), the request will fail with the OS level error ECONNREFUSED. This error is received instantly and is not dependent on long network timeouts. You will see this error in http_plugin.log.
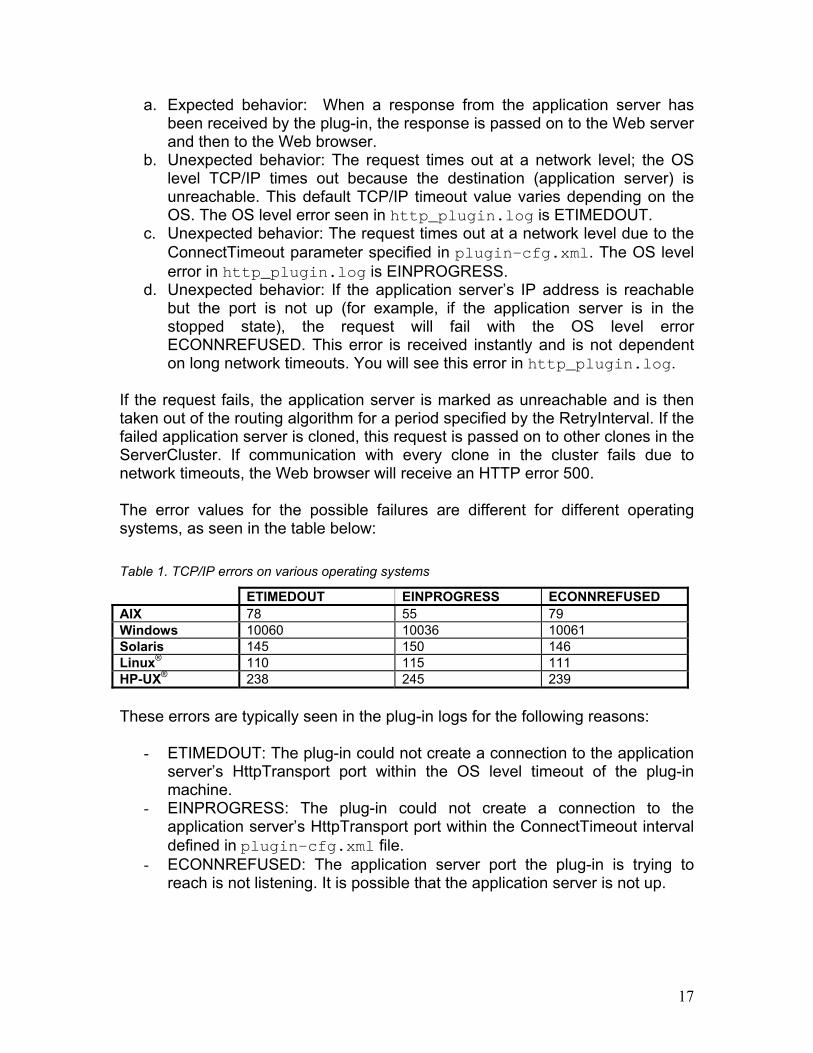
If the request fails, the application server is marked as unreachable and is then taken out of the routing algorithm for a period specified by the RetryInterval. If the failed application server is cloned, this request is passed on to other clones in the ServerCluster. If communication with every clone in the cluster fails due to network timeouts, the Web browser will receive an HTTP error 500. The error values for the possible failures are different for different operating systems, as seen in the table below: Table 1. TCP/IP errors on various operating systems
ETIMEDOUT EINPROGRESS ECONNREFUSED AIX 78 55 79 Windows 10060 10036 10061 Solaris 145 150 146 Linux® 110 115 111 HP-UX® 238 245 239 These errors are typically seen in the plug-in logs for the following reasons:
- ETIMEDOUT: The plug-in could not create a connection to the application server’s HttpTransport port within the OS level timeout of the plug-in machine.
- EINPROGRESS: The plug-in could not create a connection to the application server’s HttpTransport port within the ConnectTimeout interval defined in plugin-cfg.xml file.
- ECONNREFUSED: The application server port the plug-in is trying to reach is not listening. It is possible that the application server is not up.
18
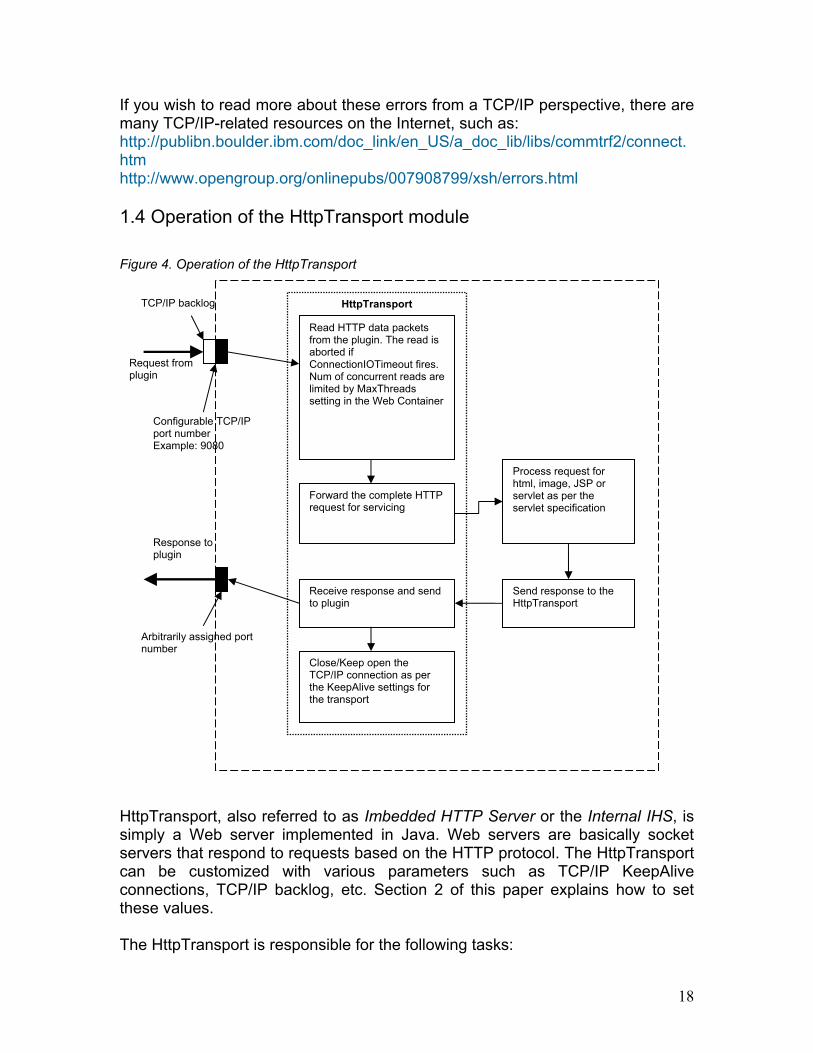
If you wish to read more about these errors from a TCP/IP perspective, there are many TCP/IP-related resources on the Internet, such as: http://publibn.boulder.ibm.com/doc_link/en_US/a_doc_lib/libs/commtrf2/connect.htm http://www.opengroup.org/onlinepubs/007908799/xsh/errors.html 1.4 Operation of the HttpTransport module Figure 4. Operation of the HttpTransport
HttpTransport, also referred to as Imbedded HTTP Server or the Internal IHS, is simply a Web server implemented in Java. Web servers are basically socket servers that respond to requests based on the HTTP protocol. The HttpTransport can be customized with various parameters such as TCP/IP KeepAlive connections, TCP/IP backlog, etc. Section 2 of this paper explains how to set these values. The HttpTransport is responsible for the following tasks:
Configurable TCP/IP port number Example: 9080
Response to plugin
HttpTransport
Arbitrarily assigned port number
Close/Keep open the TCP/IP connection as per the KeepAlive settings for the transport
Receive response and send to plugin
Forward the complete HTTP request for servicing
Read HTTP data packets from the plugin. The read is aborted if ConnectionIOTimeout fires. Num of concurrent reads are limited by MaxThreads setting in the Web Container
Process request for html, image, JSP or servlet as per the servlet specification
Send response to the HttpTransport
Request from plugin
TCP/IP backlog

19
- Initialization when the application server is started: the configuration parameters, such as TCP/IP KeepAlive parameters and the backlog, are initialized at this stage (if changes are made to the HttpTransport settings, it requires a restart of the app server).
- Receiving the request from the plug-in on the HttpTransport port, e.g. 9080.
- Forwarding the request to the Web container for handling. - Receiving the response from the Web container. - Closing the TCP/IP connection depending on the KeepAlive settings on
the HttpTransport.
Debug tip:
If you suspect an error to be in the HttpTransport component, trace the following packages:
- com.ibm.ws.http.*- com.ibm.ws.webcontainer.*
Summary In this section, we acquired a deeper understanding of how the plug-in is initialized and how it processes requests. We will use this understanding of the plug-in in Sections 2 and 3, where we discuss plug-in tuning parameters and plug-in problem determination.

20
2 Plug-in configuration parameters In this section, we discuss the many configuration parameters that can be tuned so that your plug-in performs at its optimal level. These parameters can be operating system parameters, plug-in parameters, or WebSphere Application Server parameters. This section is split into two parts: Section 2.1 discusses tunable parameters on the application server side; Section 2.2 discusses those on the plug-in side. 2.1 Parameters on application server node These parameters are set using the Web-based administrative console (webui) of WebSphere Application Server V5 (alternatively you could do this from a command line using wsadmin). These parameters are:
a. Maximum Web container threads, set on the Web container b. ConnectionIOTimeout, set on the HttpTransport c. ConnectionKeepAliveTimeout, set on the HttpTransport d. MaxConnectBacklog, set on the HttpTransport e. MaxKeepAliveConnections, set on the HttpTransport f. MaxKeepAliveRequests, set on the HttpTransport
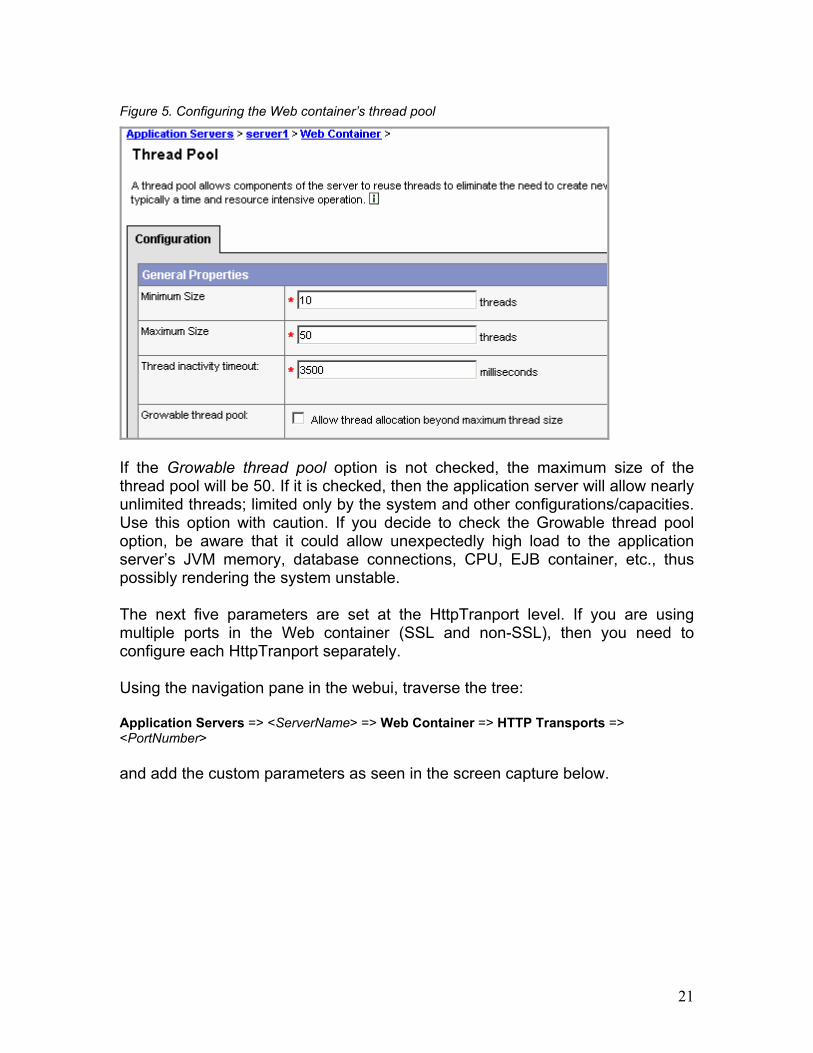
a. Maximum Web container threads This parameter determines how many concurrent requests can be serviced by the application server. In the figure below, you can see that the maximum size of the thread pool is set to 50. This means that no more than 50 concurrent threads can be serviced by this Web container. To modify this value, use the webui by navigating to the Web container setting in the application server, as shown below:
21
Figure 5. Configuring the Web container’s thread pool
If the Growable thread pool option is not checked, the maximum size of the thread pool will be 50. If it is checked, then the application server will allow nearly unlimited threads; limited only by the system and other configurations/capacities. Use this option with caution. If you decide to check the Growable thread pool option, be aware that it could allow unexpectedly high load to the application server’s JVM memory, database connections, CPU, EJB container, etc., thus possibly rendering the system unstable. The next five parameters are set at the HttpTranport level. If you are using multiple ports in the Web container (SSL and non-SSL), then you need to configure each HttpTranport separately. Using the navigation pane in the webui, traverse the tree: Application Servers => <ServerName> => Web Container => HTTP Transports => <PortNumber> and add the custom parameters as seen in the screen capture below.

22
Figure 6. Custom properties for an HttpTransport
Let’s discuss each of these custom properties one by one. b. ConnectionIOTimeout This is the maximum time (in seconds) to wait when trying to read data during the request. The default value is 5 seconds. This timeout determines how long to wait to read at least one byte of data. The default value will work fine for most environments. You may have to increase it if you experience extremely slow network connections where two subsequent data packets come in spaced more than 5 seconds apart. Example: Data can dribble in one byte at a time every 4 seconds, and the 5 second timer would never fire.

23
Some Web servers also have a similar setting to control the data flow to port 80. Ensure that the corresponding Web server parameter is tuned in accordance with the one on the HttpTransport. c. ConnectionKeepAliveTimeout This is the maximum time to wait for the next request on a KeepAlive connection. The default value is 5 seconds. If the next request on this KeepAlive connection is not received within this time, the connection will be closed. This value should be set after studying the typical load on the application server. This custom property is ignored if MaxKeepAliveConnections is equal to zero. d. MaxConnectBacklog This parameter plays a very important role when the WebSphere Application Server system experiences unexpected spikes in load. If the application server’s Web container receives more concurrent requests than it is configured for (Max threads setting on the Web container), the requests start queuing up at a TCP/IP level. The MaxConnectBacklog setting controls the number of such requests that get queued up before the plug-in is refused more connection requests. If this number is exceeded, the requests from the plug-in will not be able to connect to the HttpTransport port. If not specified by the user, the default value of this parameter is 512. Example: If a Web container is configured for a maximum of 50 concurrent threads and 512 requests in the backlog, we can have 512 + 50 = 562 concurrent requests from the plug-in to port 9080. Fifty of these are in the application server and the rest are waiting in the backlog’s FIFO queue in the OS kernel. If the 563rd request from the plug-in comes into port 9080, it will be rejected and the plug-in will get an ETIMEDOUT error in http_plugin.log.
Tip:
The TCP/IP protocol gives a lot of flexibility to the operating system vendor on how to implement the TCP/IP backlog parameter. As a result, different OS vendors add a margin of safety to the backlog buffer. In this document we refer to this margin of safety as the “Fudge Factor”.
For the MaxConnectBacklog parameter to work correctly, the corresponding OS level value of the backlog parameter should be equal to or greater than the one defined in WebSphere Application Server’s HttpTransport configuration. Most operating systems provide commands to set a system wide global parameter for the maximum backlogged connections. Note that the upper limit for the MaxConnectBacklog setting in the HttpTransport properties is limited by this global OS setting.
24
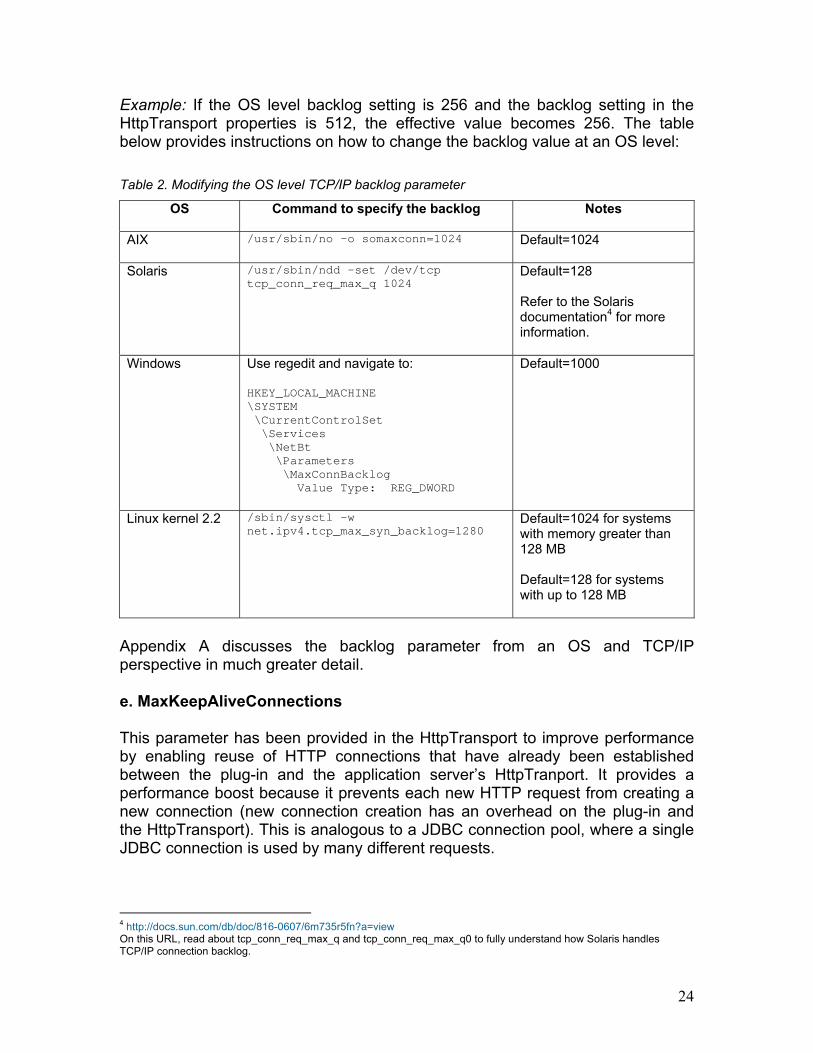
Example: If the OS level backlog setting is 256 and the backlog setting in the HttpTransport properties is 512, the effective value becomes 256. The table below provides instructions on how to change the backlog value at an OS level: Table 2. Modifying the OS level TCP/IP backlog parameter
OS Command to specify the backlog Notes
AIX
/usr/sbin/no –o somaxconn=1024 Default=1024
Solaris
/usr/sbin/ndd –set /dev/tcptcp_conn_req_max_q 1024
Default=128 Refer to the Solaris documentation4 for more information.
Windows
Use regedit and navigate to: HKEY_LOCAL_MACHINE\SYSTEM\CurrentControlSet\Services\NetBt\Parameters\MaxConnBacklog
Value Type: REG_DWORD
Default=1000
Linux kernel 2.2
/sbin/sysctl –wnet.ipv4.tcp_max_syn_backlog=1280
Default=1024 for systems with memory greater than 128 MB Default=128 for systems with up to 128 MB
Appendix A discusses the backlog parameter from an OS and TCP/IP perspective in much greater detail. e. MaxKeepAliveConnections This parameter has been provided in the HttpTransport to improve performance by enabling reuse of HTTP connections that have already been established between the plug-in and the application server’s HttpTranport. It provides a performance boost because it prevents each new HTTP request from creating a new connection (new connection creation has an overhead on the plug-in and the HttpTransport). This is analogous to a JDBC connection pool, where a single JDBC connection is used by many different requests.
4 http://docs.sun.com/db/doc/816-0607/6m735r5fn?a=view On this URL, read about tcp_conn_req_max_q and tcp_conn_req_max_q0 to fully understand how Solaris handles TCP/IP connection backlog.

25
The maximum number of concurrent KeepAlive connections across all the HTTP transports in a Web container should be less than the maximum number of concurrent threads allowed in that Web container. This prevents all of the threads from being held by keep alive connections so that there are threads available to handle new incoming connect requests. The default value is 90% of the maximum number of threads in the Web container’s thread pool. This percentage could be optimized for your environment depending on your loading pattern and other factors. The KeepAlive connections will be terminated by either the MaxKeepAliveRequests parameter or the ConnectionKeepAliveTimeout parameter, described next. f. MaxKeepAliveRequests This parameter specifies the maximum number of requests which can be processed on a single KeepAlive connection. This is an integer value which defaults to 100 if not specified by the user. Setting this property to a high value provides better performance. Setting this property to a low value can help prevent denial of service attacks if a client tries to hold on to a KeepAlive connection indefinitely. This custom property is ignored if MaxKeepAliveConnections is equal to zero. 2.2 Parameters on the Web server side There are two types of configurable parameters on the Web server node. The first category is of the OS level parameters, and the second category is of the WebSphere-specific parameters specified in plugin-cfg.xml. We will limit our discussion here to only those parameters that play a major role in failover and peak load scenarios. These parameters are:
a. OS parameter: TCP/IP timeout b. Plugin-cfg.xml parameter: ConnectTimeout c. Plugin-cfg.xml parameter: RetryInterval
a. OS parameter: TCP/IP timeout When a TCP/IP client is not able to communicate with a TCP/IP server in the time specified by the TCP/IP timeout, that request is aborted. This is one of the ways in which a request from the plug-in (TCP/IP client) to the HttpTransport (TCP/IP server) fails, thus marking that the application server down. Once this setting is changed, it not only affects the plug-in, but also every other TCP/IP client application running on that node. Therefore, always exercise caution when changing this value.
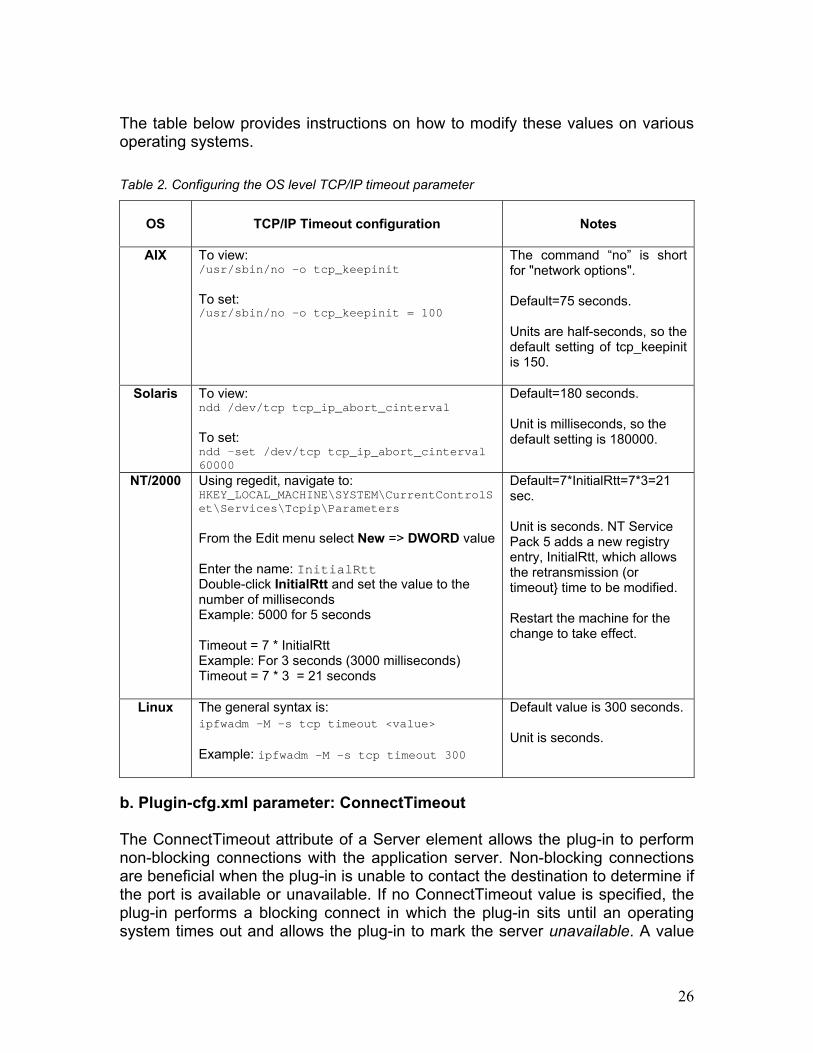
26
The table below provides instructions on how to modify these values on various operating systems. Table 2. Configuring the OS level TCP/IP timeout parameter
OS
TCP/IP Timeout configuration
Notes
AIX To view: /usr/sbin/no -o tcp_keepinit To set: /usr/sbin/no -o tcp_keepinit = 100
The command “no” is short for "network options". Default=75 seconds. Units are half-seconds, so the default setting of tcp_keepinit is 150.
Solaris
To view: ndd /dev/tcp tcp_ip_abort_cinterval To set: ndd -set /dev/tcp tcp_ip_abort_cinterval60000
Default=180 seconds. Unit is milliseconds, so the default setting is 180000.
NT/2000
Using regedit, navigate to: HKEY_LOCAL_MACHINE\SYSTEM\CurrentControlSet\Services\Tcpip\Parameters From the Edit menu select New => DWORD value Enter the name: InitialRttDouble-click InitialRtt and set the value to the number of milliseconds Example: 5000 for 5 seconds Timeout = 7 * InitialRtt Example: For 3 seconds (3000 milliseconds) Timeout = 7 * 3 = 21 seconds
Default=7*InitialRtt=7*3=21 sec. Unit is seconds. NT Service Pack 5 adds a new registry entry, InitialRtt, which allows the retransmission (or timeout} time to be modified. Restart the machine for the change to take effect.
Linux
The general syntax is: ipfwadm -M -s tcp timeout <value> Example: ipfwadm –M –s tcp timeout 300
Default value is 300 seconds. Unit is seconds.
b. Plugin-cfg.xml parameter: ConnectTimeout The ConnectTimeout attribute of a Server element allows the plug-in to perform non-blocking connections with the application server. Non-blocking connections are beneficial when the plug-in is unable to contact the destination to determine if the port is available or unavailable. If no ConnectTimeout value is specified, the plug-in performs a blocking connect in which the plug-in sits until an operating system times out and allows the plug-in to mark the server unavailable. A value

27
of 0 causes the plug-in to perform a blocking connect. A value greater than 0 specifies the number of seconds you want the plug-in to wait for a successful connection. If a connection does not occur after that time interval, the plug-in marks the server unavailable and fails over to one of the other servers defined in the server group. If no clone responds within ConnectTimeout seconds, HTTP error 500 is returned to the Web browser. If this value is lower than the TCP/IP timeout on that machine, it will always fire before the TCP/IP timeout. One of the advantages of using this attribute is that we can attain a lower value for the timeout without having to change it at an OS level. If a clone has been marked down, the plug-in will retry that server after the RetryInterval (default value 60 seconds). Bear in mind that keeping it too low could produce false positives and make the plug-in think that the application server is down, when you simply may have network congestion. This would cause the slow application server to be inaccurately marked as down, resulting in extra load for the remaining application servers. The ConnectTimeout attribute is set in the following manner: <Server CloneID="uad0905b" LoadBalanceWeight="2" Name="LNCluster1Clone1"
ConnectTimeout="3"><Transport Hostname="gladiator.transarc.ibm.com" Port="9083"
Protocol="http"/><Transport Hostname="gladiator.transarc.ibm.com" Port="9446"
Protocol="https"><Property name="keyring" value="/opt/WebSphere/AppServer5/
etc/plugin-key.kdb"/><Property name="stashfile"value="/opt/WebSphere/AppServer5/
etc/plugin- sth"/></Transport>
</Server>
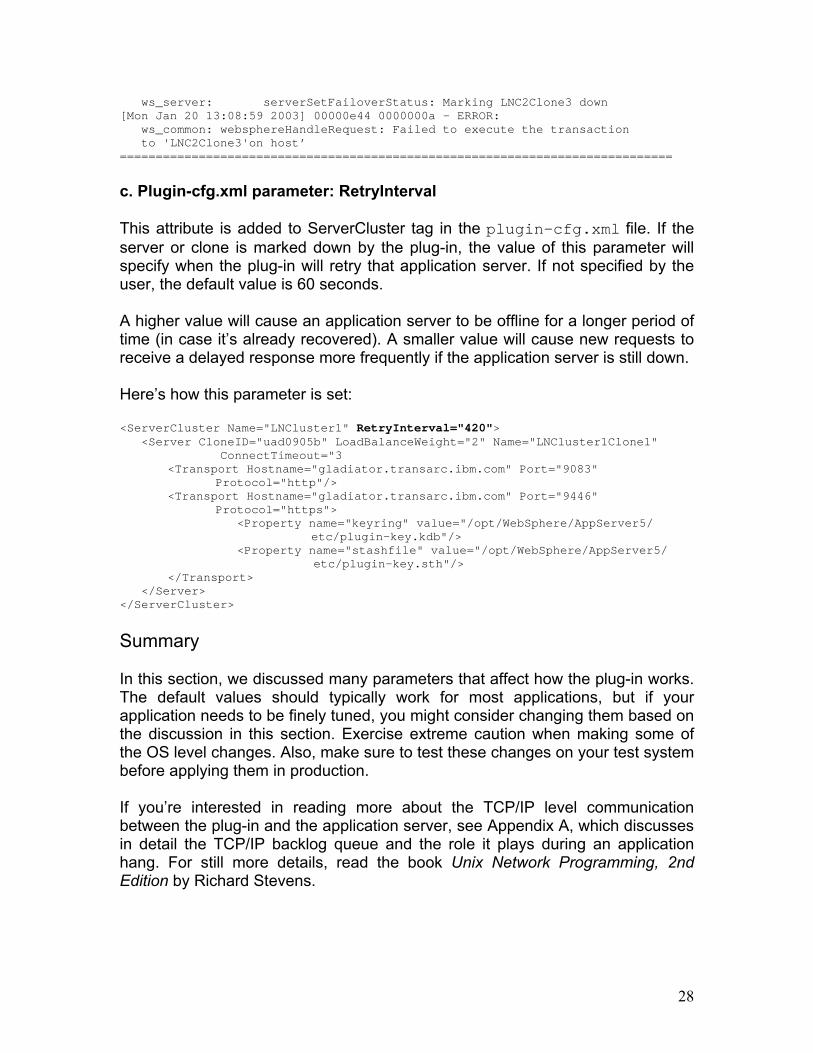
If the ConnectTimeout fires, you can see this logged in the plug-in log as shown below: =============================================================================[Mon Jan 20 13:08:59 2003] 00000e44 0000000f - ERROR:
ws_common: websphereGetStream: Connect timeout fired[Mon Jan 20 13:08:59 2003] 00000e44 0000000f - ERROR:
ws_common: websphereExecute: Failed to create the stream[Mon Jan 20 13:08:59 2003] 00000e44 0000000f - ERROR:
ws_server: serverSetFailoverStatus: Marking LNC2Clone3 down[Mon Jan 20 13:08:59 2003] 00000e44 0000000f - ERROR:
ws_common: websphereHandleRequest: Failed to execute the transactionto 'LNC2Clone3'on host 'hercules.transarc.ibm.com'; will try another one
[Mon Jan 20 13:08:59 2003] 00000e44 0000000a - ERROR:ws_common: websphereGetStream: Connect timeout fired
[Mon Jan 20 13:08:59 2003] 00000e44 0000000a - ERROR:ws_common: websphereExecute: Failed to create the stream
[Mon Jan 20 13:08:59 2003] 00000e44 0000000a - ERROR:
28
ws_server: serverSetFailoverStatus: Marking LNC2Clone3 down[Mon Jan 20 13:08:59 2003] 00000e44 0000000a - ERROR:
ws_common: websphereHandleRequest: Failed to execute the transactionto 'LNC2Clone3'on host’
============================================================================= c. Plugin-cfg.xml parameter: RetryInterval This attribute is added to ServerCluster tag in the plugin-cfg.xml file. If the server or clone is marked down by the plug-in, the value of this parameter will specify when the plug-in will retry that application server. If not specified by the user, the default value is 60 seconds. A higher value will cause an application server to be offline for a longer period of time (in case it’s already recovered). A smaller value will cause new requests to receive a delayed response more frequently if the application server is still down. Here’s how this parameter is set: <ServerCluster Name="LNCluster1" RetryInterval="420">
<Server CloneID="uad0905b" LoadBalanceWeight="2" Name="LNCluster1Clone1"ConnectTimeout="3
<Transport Hostname="gladiator.transarc.ibm.com" Port="9083"Protocol="http"/>
<Transport Hostname="gladiator.transarc.ibm.com" Port="9446"Protocol="https">
<Property name="keyring" value="/opt/WebSphere/AppServer5/etc/plugin-key.kdb"/>
<Property name="stashfile" value="/opt/WebSphere/AppServer5/etc/plugin-key.sth"/>
</Transport></Server>
</ServerCluster>
Summary In this section, we discussed many parameters that affect how the plug-in works. The default values should typically work for most applications, but if your application needs to be finely tuned, you might consider changing them based on the discussion in this section. Exercise extreme caution when making some of the OS level changes. Also, make sure to test these changes on your test system before applying them in production. If you’re interested in reading more about the TCP/IP level communication between the plug-in and the application server, see Appendix A, which discusses in detail the TCP/IP backlog queue and the role it plays during an application hang. For still more details, read the book Unix Network Programming, 2nd Edition by Richard Stevens.

29
3 Problem determination Sometimes it becomes very difficult to identify the failing WebSphere component, and what may initially seem as a plug-in problem may in the end turn out to be completely unrelated to it. In this section, we introduce tools and techniques that will help you with the task of problem source isolation and troubleshooting. We place special emphasis on understanding failure situations due to overloaded or hung systems. If the information provided herein does not help solve the problem, see the Troubleshooting section of the WebSphere Application Server V5 InfoCenter at: http://publib.boulder.ibm.com/infocenter/wasinfo/topic/com.ibm.websphere.base.doc/info/aes/ae/welc_troubleshooting.html. 3.1 Logs and traces 3.1.1 Logs and traces on the plug-in side Let’s discuss in detail the various log files on the plug-in side. 1. Plug-in log file: http_plugin.log When to use: plug-in initialization failures, HTTP errors 500, 403, 404 etc., application server hangs, unavailable application servers, network problems, timeout errors in a Web browser. If you suspect a plug-in problem, the plug-in log file is where you should first look for clues. The exact location of this file is specified in the plug-in configuration file, but the default location is <WAS5_HOME>\logs\http_plugin.log. Associated with this log file is also a LogLevel attribute as seen below, which determines how much error detail will be provided: <?xml version="1.0" encoding="ISO-8859-1"?><Config>
<Log LogLevel=”Error" Name="D:\WebSphere\DeploymentManager50\logs\http_plugin.log"/>
LogLevel can have one of three possible values: Error, Warn or Trace. The Error level (default) prints the least information, followed by Warn, which gives more details, followed by Trace, which provides very detailed trace statements from the entire plug-in code. Under normal working conditions, you should run the plug-in with the default LogLevel Error, since this results in the most efficient operation. If you run into problems, only then increase the log level to Warn or Trace. Before making this change in a production environment, you must fully study its performance impact by running load tests on a test system. If you do decide to change the LogLevel, note that it is not necessary to restart anything for the new setting to take effect. The updated plug-in will load automatically, as
30
per the RefreshInterval setting in the plug-in log file. The default value of RefreshInterval is 60 seconds. This hot reload capability is very beneficial for production systems, because it ensures continuous operation and still provides a way to add diagnostic features to the environment.
Best practice:
Turning on tracing always has some performance impact. Before turning on any tracing, make sure you’ve looked at things like:
- application server logs, discussed later in this section. - application logs (if different from application server logs) - javacores of the application server JVM, discussed later in this section - CPU utilization, native memory, Java memory, I/O etc.
Sometimes the plug-in log can be up to several megabytes in size. It can take some practice to understand the log file, so let’s discuss the format of a typical log entry. Every line in the log is of the following format. [ddd mm dd hh:mm:ss yyyy] PID TID - MsgType: Component: Task: Message
PID is the process ID of the Apache process. TID is the thread ID of a specific request within that PID. Both PID and TID are in hexadecimal format. MsgType can either be PLUGIN or it can be one of the three LogLevels. When MsgType is PLUGIN, it means the accompanying message is an informational message about the normal operation of the plug-in. When MsgType is one of the three log levels, the message is an ERROR, WARNing or a TRACE statement. When looking at the plug-in trace, you will typically see two types of trace statements:
- Initialization trace statements: These provide information about the loading of the plug-in configuration file when the Web server is started (or restarted). Note that the plug-in does not try to connect to the application server when initializing. It does this only when a request comes in. A successfully initialized plug-in does not necessarily guarantee a successful request/response with the application server.
- Request processing trace statements: These provide information about plug-in tasks such as receiving the request from the Web server, sending the request to the application server and such other tasks which are described in Section 1.

31
Following is an example of trace statements, which are printed when a response is being received from the HttpTransport by the plug-in (with LogLevel set to TRACE): ============================================================================
[Thu May 01 12:39:05 2003] 000006d0 00000750 - TRACE: ws_common:websphereExecute: Wrote the request; reading the response
[Thu May 01 12:39:05 2003] 000006d0 00000750 - TRACE: lib_htresponse:htresponseRead: Reading the response:
[Thu May 01 12:39:05 2003] 000006d0 00000750 - TRACE: HTTP/1.1 200 OK
[Thu May 01 12:39:05 2003] 000006d0 00000750 - TRACE: Server: WebSphereApplication Server/5.0
[Thu May 01 12:39:05 2003] 000006d0 00000750 - TRACE: Set-Cookie:JSESSIONID=0000NIK0UC2LBSJ00VVNHITUAEQ:uji3uq4g;Path=/
[Thu May 01 12:39:05 2003] 000006d0 00000750 - TRACE: Cache-Control: no-cache="set-cookie,set-cookie2"
[Thu May 01 12:39:05 2003] 000006d0 00000750 - TRACE: Expires: Thu, 01 Dec 199416:00:00 GMT
[Thu May 01 12:39:05 2003] 000006d0 00000750 - TRACE: Content-Type: text/html
[Thu May 01 12:39:05 2003] 000006d0 00000750 - TRACE: Content-Language: en-US
[Thu May 01 12:39:05 2003] 000006d0 00000750 - TRACE: Transfer-Encoding:chunked
[Thu May 01 12:39:05 2003] 000006d0 00000750 - TRACE: ws_common:websphereExecute: Read the response; breaking out of loop
============================================================================
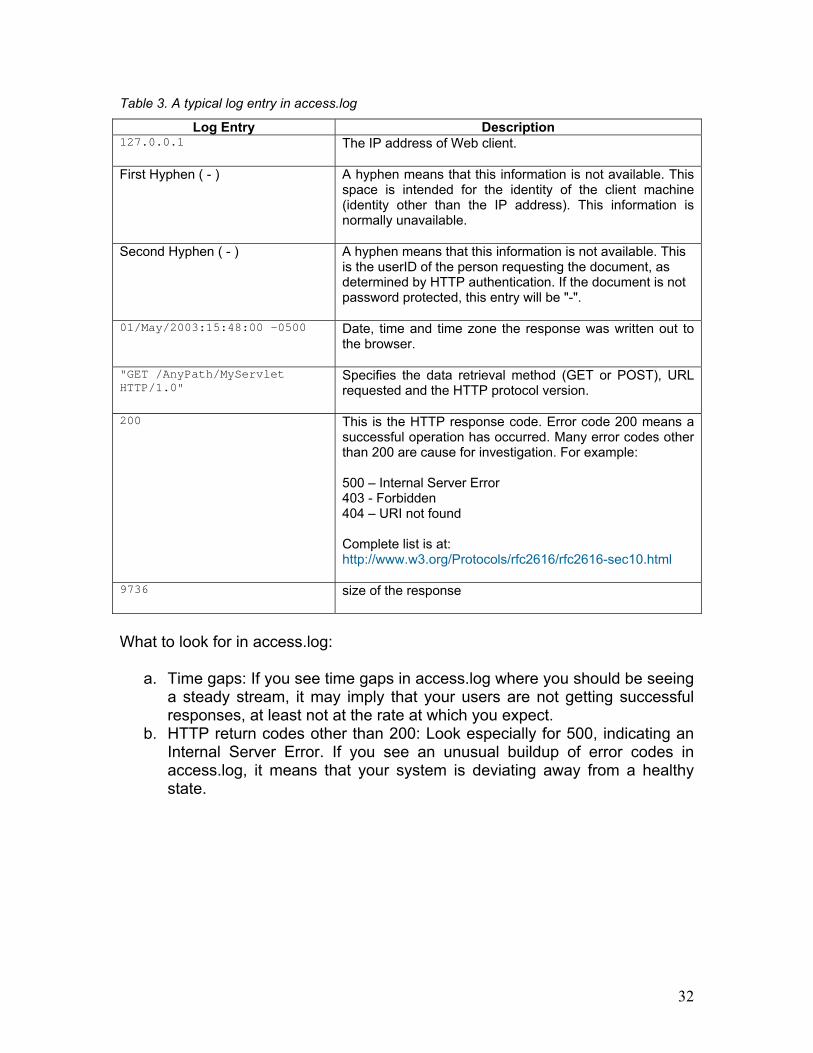
2. Web server logs: access.log and error.log When to use: HTTP errors 500, 403, 404 etc., Web server initialization errors, Web server errors, application server hangs, unavailable application servers, network problems, overloaded Web servers. IHS provides two types of log files: access.log: This file logs every response going back to the Web browser. If a Web browser initiates a request and never gets a response back because it is indefinitely hung inside the plug-in or the application server, you will never see a corresponding response entry of that request in this file. The detailed format of this log file is at: http://httpd.apache.org/docs/logs.html. Here’s a quick tour: Every entry in access.log is of the following format: 127.0.0.1 - - [01/May/2003:15:48:00 -0500] "GET /AnyPath/MyServlet HTTP/1.0"200 9736
Table 4 shows an explanation of the log entry.
32
Table 3. A typical log entry in access.log
Log Entry Description 127.0.0.1 The IP address of Web client.
First Hyphen ( - ) A hyphen means that this information is not available. This
space is intended for the identity of the client machine (identity other than the IP address). This information is normally unavailable.
Second Hyphen ( - ) A hyphen means that this information is not available. This is the userID of the person requesting the document, as determined by HTTP authentication. If the document is not password protected, this entry will be "-".
01/May/2003:15:48:00 -0500 Date, time and time zone the response was written out to the browser.
"GET /AnyPath/MyServletHTTP/1.0"
Specifies the data retrieval method (GET or POST), URL requested and the HTTP protocol version.
200 This is the HTTP response code. Error code 200 means a successful operation has occurred. Many error codes other than 200 are cause for investigation. For example: 500 – Internal Server Error 403 - Forbidden 404 – URI not found Complete list is at: http://www.w3.org/Protocols/rfc2616/rfc2616-sec10.html
9736 size of the response
What to look for in access.log:
a. Time gaps: If you see time gaps in access.log where you should be seeing a steady stream, it may imply that your users are not getting successful responses, at least not at the rate at which you expect.
b. HTTP return codes other than 200: Look especially for 500, indicating an Internal Server Error. If you see an unusual buildup of error codes in access.log, it means that your system is deviating away from a healthy state.

33
Monitoring tip:
A healthy system should contain a steady stream of response entries in access.log. By plotting Requests-per-second, versus Time for a 7-day period, you can estimate your weekly loading pattern. Be ware that access.log logs ALL responses: those serviced by WebSphere as well as those serviced by the Web server alone. A distinction can be made between the two by looking at the URL serviced. The plug-in configuration file contains a listing of all the URLs serviced by WebSphere. Those not listed there are serviced by the Web server.
error.log: This file logs diagnostic information if IHS encounters any errors. The log level in this file can be increased or decreased by modifying httpd.conf (for more information, see http://httpd.apache.org/docs/logs.html). You shouldn’t have to look inside this log unless you suspect IHS to have a problem. 3.1.2 Logs and traces on the application server side 1. HttpTransport logs (requires WebSphere Application Server V5 Fix Pack 2 or higher) When to use: HttpTransport failures, plug-in failures, hung application server. There are two types of log files available:
a. Access log file: Logs the completion of every request to the HttpTransport. All responses will be logged, whether they are received directly from a Web browser or via the plug-in. Default location of the access log file is: <WAS5_HOME>/<server instance>/http_access.log
b. Error log file: Logs any errors encountered by the HttpTransport component. On a healthy system, this file will usually be error free. Default location of the error log file is: <WAS5_HOME>/<serverinstance>/http.log.
These files log information similar to the corresponding logs in the IBM HTTP Server, discussed in the previous section.
WebSphere Application Server V5, FixPack 2 required:
Access log and error log for the HttpTransport are available with WebSphere Application Server V5 plus Fix Pack 2 or higher.
Logging is disabled by default. To enable logging, open the webui by pointing your Web browser to http://<machine>:9090/admin. Navigate down to the HttpTransport you wish to configure and add the custom properties AccessLogDisable and ErrorLogDisable. To enable logging, enter the value False for these two properties.

34
Figure 7. Enabling logging in the HttpTransport
Optionally, you may also add the custom properties AccessLog and ErrorLog to specify the log file names. If you do not specify the log file names, the access and error log entries will be written into the default file names http_access.log and http.log, respectively. 2. Tracing the HttpTransport When to use: HttpTransport failures If you are still unable to tell what’s going wrong after viewing the Web server logs and the HttpTransport logs, tracing the plug-in code, analyzing Java ThreadDumps and collecting netstat results (both discussed later), etc., you might consider tracing the HttpTransport code. Tracing can be enabled using the webui or using command line tools. Instructions for setting up trace are available at: http://publib.boulder.ibm.com/infocenter/wasinfo/topic/com.ibm.websphere.nd.doc/info/ae/ae/utrb_traceservice.html
35
Trace the following packages:
• com.ibm.ws.http.*• com.ibm.ws.webcontainer.*
WebSphere support teams will be able to understand the trace, but you want to try to interpret the trace yourself, information to help you can be found here: http://publib.boulder.ibm.com/infocenter/wasinfo/topic/com.ibm.websphere.nd.doc/info/ae/ae/ctrb_readtrc.html 3. Application server logs: SystemOut.log and SystemErr.log When to use: User application failures, application server failures, HTTP errors, application server hangs, unavailable application servers, timeout errors in a Web browser. It is possible that what initially may appear to be a plug-in problem is really not a plug-in problem, but is instead due to some other component, such as the application server or the user applications that run inside it. By default, the application server logs are written to the directory <WAS5_HOME>logs\<ServerName>. Check these logs to see if some indication of any error can be found. If the user application uses the stdout and stderr parameters of the application server for its own logging, the application logs will also be written out to SystemOut.log and SystemErr.log. 3.2 Debugging tools and techniques When the logs haven’t led you to the cause of the problem, you can use the next group of tools and techniques to better understand the problem. 3.2.1 Using OS command: netstat When to use: network problems, application server hangs, unavailable application servers, timeout errors in a Web browser. We’ve found the netstat command to be an invaluable tool in diagnosing some of most difficult problems related to the plug-in, as well as other problems, such as when the database connection hangs, etc. This single command and its many (elusive!) options can come in very handy while debugging problems. The netstat command can be run on the production system continuously without any significant performance impact. Here’s an example of a typical netstat output:
36
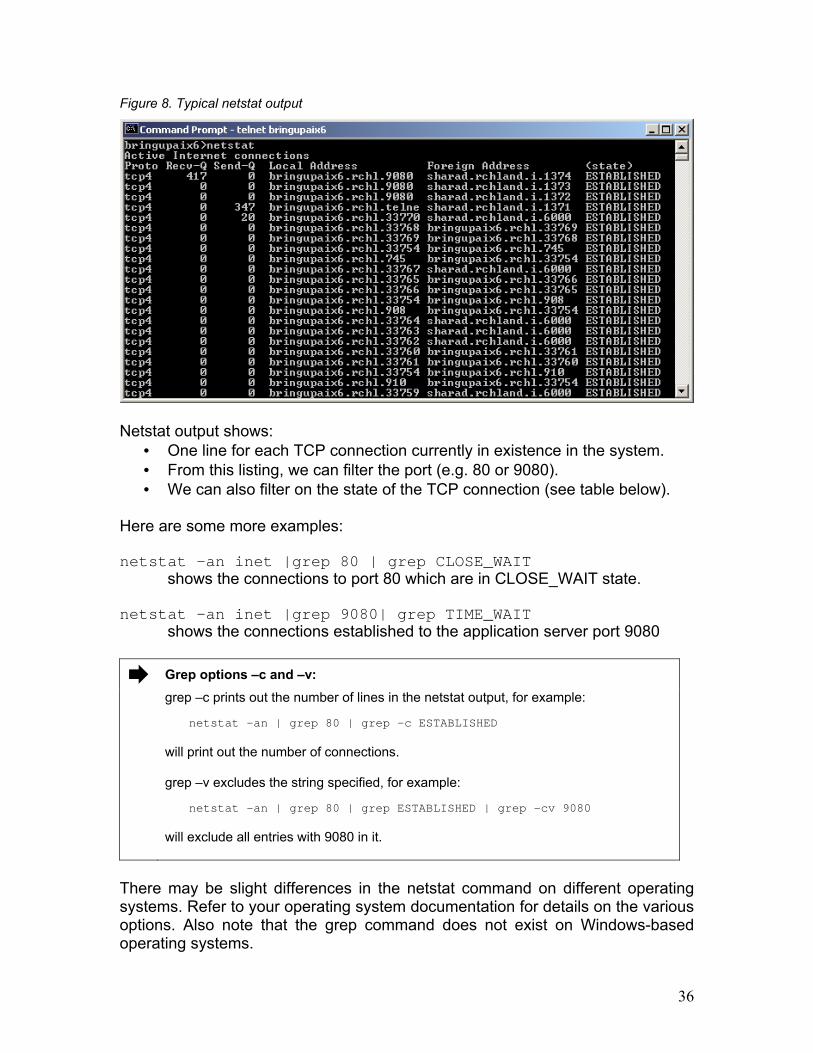
Figure 8. Typical netstat output
Netstat output shows:
• One line for each TCP connection currently in existence in the system. • From this listing, we can filter the port (e.g. 80 or 9080). • We can also filter on the state of the TCP connection (see table below).
Here are some more examples: netstat –an inet |grep 80 | grep CLOSE_WAIT
shows the connections to port 80 which are in CLOSE_WAIT state. netstat –an inet |grep 9080| grep TIME_WAIT
shows the connections established to the application server port 9080
Grep options –c and –v:
grep –c prints out the number of lines in the netstat output, for example:
netstat –an | grep 80 | grep –c ESTABLISHED will print out the number of connections. grep –v excludes the string specified, for example:
netstat –an | grep 80 | grep ESTABLISHED | grep –cv 9080 will exclude all entries with 9080 in it.
There may be slight differences in the netstat command on different operating systems. Refer to your operating system documentation for details on the various options. Also note that the grep command does not exist on Windows-based operating systems.

37
Continuously running a script that monitors netstat output When we’re dealing with plug-in problems that could occur randomly, and for random periods, it becomes important to monitor the system continuously at all times. One way to automate this monitoring is to write a script that will detect a connection spike to a certain port and then send a pager/email out to the production support staff. A sample script ns_9080.ksh is shown below. You can use the script as is, or customize it for your environment by changing these four lines:
• mailto: Notification list. Multiple email addresses can be specified,
separated by a space. • maxconn: Maximum connection spike that you expect during steady state
operation. • alertwait: Number of seconds to wait before sending out the next e-
mail alert. • pollwait: Number of seconds to wait before gathering the next netstat
output. Table 5. Continuous monitoring using the netstat command
#!/bin/ksh# ns_9080.ksh# Check netstat connection count and send alert# History:# May 5, 2003 Sharad Cocasse
mailto="[email protected] [email protected]"maxconn=25alertwait=600pollwait=10
function netstat_9080{
netstat -an | grep 9080 | grep -c ESTABLISHED | read numconn restif (( $numconn > $maxconn )) ; then
echo - "$numconn connections on port 9080 detected!" | mail –s"Websphere ALERT - $numconn CONNECTIONS" ${mailto}sleep $alertwaitfi
}
while (( 1 )); donetstat_9080sleep $pollwait
done
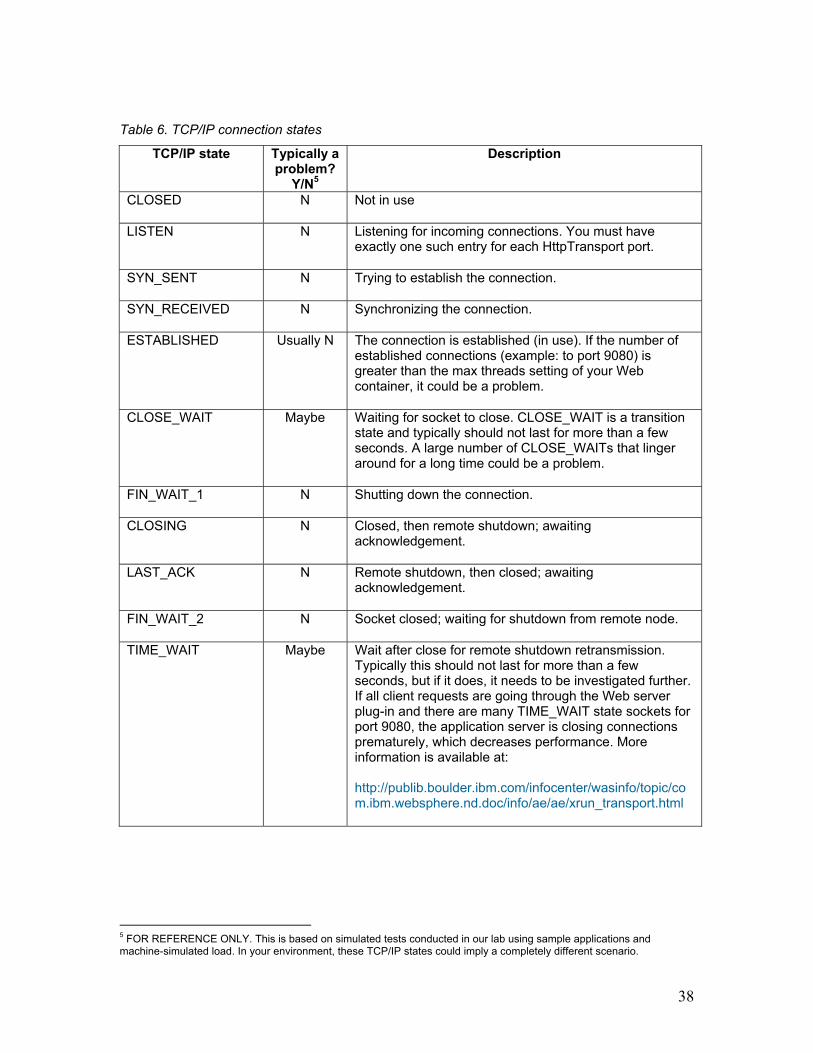
Let’s discuss the various TCP/IP states. A netstat output shows the state of all connections to a certain port. Below is a brief explanation about each TCP/IP state and what they mean for connections going from the plug-in to the HttpTransport.
38
Table 6. TCP/IP connection states
TCP/IP state Typically a problem?
Y/N5
Description
CLOSED N Not in use
LISTEN N Listening for incoming connections. You must have exactly one such entry for each HttpTransport port.
SYN_SENT N Trying to establish the connection.
SYN_RECEIVED N Synchronizing the connection.
ESTABLISHED Usually N The connection is established (in use). If the number of established connections (example: to port 9080) is greater than the max threads setting of your Web container, it could be a problem.
CLOSE_WAIT Maybe Waiting for socket to close. CLOSE_WAIT is a transition state and typically should not last for more than a few seconds. A large number of CLOSE_WAITs that linger around for a long time could be a problem.
FIN_WAIT_1 N Shutting down the connection.
CLOSING N Closed, then remote shutdown; awaiting acknowledgement.
LAST_ACK N Remote shutdown, then closed; awaiting acknowledgement.
FIN_WAIT_2 N Socket closed; waiting for shutdown from remote node.
TIME_WAIT Maybe Wait after close for remote shutdown retransmission. Typically this should not last for more than a few seconds, but if it does, it needs to be investigated further. If all client requests are going through the Web server plug-in and there are many TIME_WAIT state sockets for port 9080, the application server is closing connections prematurely, which decreases performance. More information is available at: http://publib.boulder.ibm.com/infocenter/wasinfo/topic/com.ibm.websphere.nd.doc/info/ae/ae/xrun_transport.html
5 FOR REFERENCE ONLY. This is based on simulated tests conducted in our lab using sample applications and machine-simulated load. In your environment, these TCP/IP states could imply a completely different scenario.

39
3.2.2 Using telnet as a debugging tool When to use: TCP/IP backlog full conditions, application server hangs, unavailable application servers, network problems, timeout errors in a Web browser. We can use the telnet program to check the state of a TCP/IP port on the WebSphere machine, such as the application server port 9080. We obviously do not expect a successful telnet session when doing this; after all, port 9080 is an HTTP Server, not a telnet sever. We can, however, use telnet to tell us the state of the port. Here’s how: a. Detecting a backlog full condition When the TCP/IP backlog is full, a TCP/IP connection is not accepted by the port. To find out if this is your problem, first ensure that your HttpTransport port is up and running (perform a netstat to make sure that the port is in LISTEN mode). Next, run the telnet command: telnet <TargetMachineNameOrIPAddr> 9080
Figure 9. Using telnet to test status of the HttpTransport port
Hit ENTER. If the backlog is full, you will see a Connecting To <MachineName> message that lasts for the OS timeout period, followed by a Connect failed message. See the screen captures below for details:
40
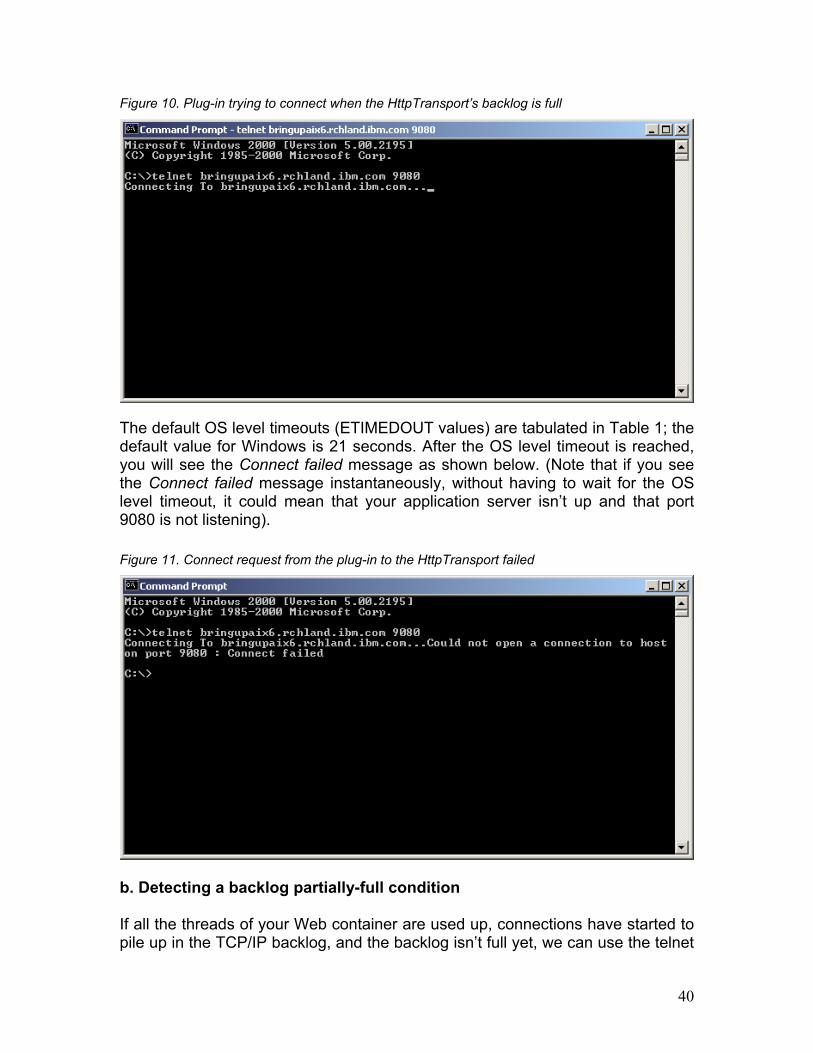
Figure 10. Plug-in trying to connect when the HttpTransport’s backlog is full
The default OS level timeouts (ETIMEDOUT values) are tabulated in Table 1; the default value for Windows is 21 seconds. After the OS level timeout is reached, you will see the Connect failed message as shown below. (Note that if you see the Connect failed message instantaneously, without having to wait for the OS level timeout, it could mean that your application server isn’t up and that port 9080 is not listening).
Figure 11. Connect request from the plug-in to the HttpTransport failed
b. Detecting a backlog partially-full condition If all the threads of your Web container are used up, connections have started to pile up in the TCP/IP backlog, and the backlog isn’t full yet, we can use the telnet
41
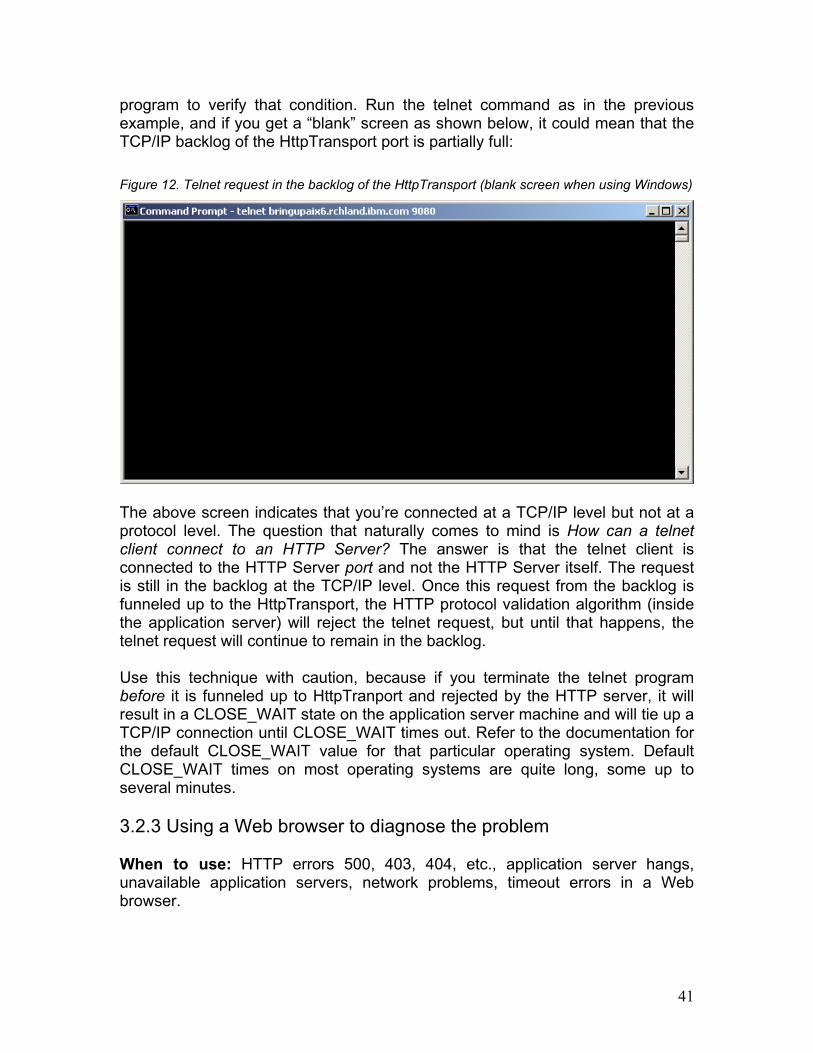
program to verify that condition. Run the telnet command as in the previous example, and if you get a “blank” screen as shown below, it could mean that the TCP/IP backlog of the HttpTransport port is partially full: Figure 12. Telnet request in the backlog of the HttpTransport (blank screen when using Windows)
The above screen indicates that you’re connected at a TCP/IP level but not at a protocol level. The question that naturally comes to mind is How can a telnet client connect to an HTTP Server? The answer is that the telnet client is connected to the HTTP Server port and not the HTTP Server itself. The request is still in the backlog at the TCP/IP level. Once this request from the backlog is funneled up to the HttpTransport, the HTTP protocol validation algorithm (inside the application server) will reject the telnet request, but until that happens, the telnet request will continue to remain in the backlog. Use this technique with caution, because if you terminate the telnet program before it is funneled up to HttpTranport and rejected by the HTTP server, it will result in a CLOSE_WAIT state on the application server machine and will tie up a TCP/IP connection until CLOSE_WAIT times out. Refer to the documentation for the default CLOSE_WAIT value for that particular operating system. Default CLOSE_WAIT times on most operating systems are quite long, some up to several minutes. 3.2.3 Using a Web browser to diagnose the problem When to use: HTTP errors 500, 403, 404, etc., application server hangs, unavailable application servers, network problems, timeout errors in a Web browser.

42
You can use a Web browser in the following ways to better understand the problem:
a. Netscape® and Microsoft Internet Explorer handle errors differently. Try using both to see if there’s any difference in the response.
b. Try pointing the browser directly to port 9080. Do you still get an error? If you get the same error, it may be an indication that the plug-in isn’t the problem component and that you should be troubleshooting the application server instead.
c. Try to retrieve static HTML content from the Web server. If this works, you may be able to eliminate at least the Web server as the problem component. If your Web server is not configured to serve even a single static file (e.g. HTML, jpg, gif), it might be a good idea to configure your Web server to serve a sample HTML page just in case you ever need it to perform such troubleshooting.
d. Try to retrieve static content from inside the application server. This can sometimes help to verify the basic health of that application server. Static content can be included in an EAR file, see the following URL for details: http://publib.boulder.ibm.com/infocenter/wasinfo/topic/com.ibm.websphere.nd.doc/info/ae/ae/uweb_rsfiles.html.
3.2.4 Using Tivoli Performance Viewer When to use: failures due to load spikes, application server hangs, timeout errors in a Web browser. If you suspect the plug-in to be failing, one of the questions that comes to mind is What’s the state of the active servlet threads inside the application server? This question can be answered by doing two things:
1. using Tivoli® Performance Viewer (TPV) 2. taking javacores (discussed later in this section).
In order to get an estimated count of the number of Web requests currently being serviced inside the application server, use TPV to monitor the Web container threads as shown below:
43
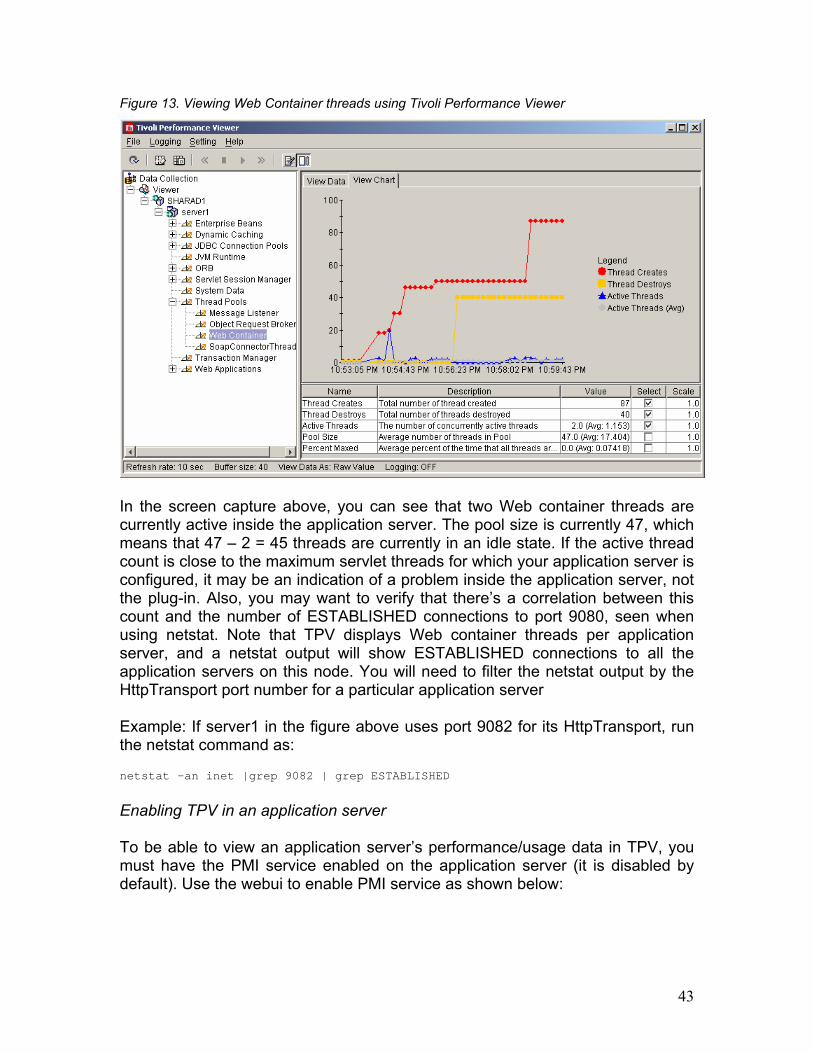
Figure 13. Viewing Web Container threads using Tivoli Performance Viewer
In the screen capture above, you can see that two Web container threads are currently active inside the application server. The pool size is currently 47, which means that 47 – 2 = 45 threads are currently in an idle state. If the active thread count is close to the maximum servlet threads for which your application server is configured, it may be an indication of a problem inside the application server, not the plug-in. Also, you may want to verify that there’s a correlation between this count and the number of ESTABLISHED connections to port 9080, seen when using netstat. Note that TPV displays Web container threads per application server, and a netstat output will show ESTABLISHED connections to all the application servers on this node. You will need to filter the netstat output by the HttpTransport port number for a particular application server Example: If server1 in the figure above uses port 9082 for its HttpTransport, run the netstat command as: netstat –an inet |grep 9082 | grep ESTABLISHED
Enabling TPV in an application server To be able to view an application server’s performance/usage data in TPV, you must have the PMI service enabled on the application server (it is disabled by default). Use the webui to enable PMI service as shown below:
44
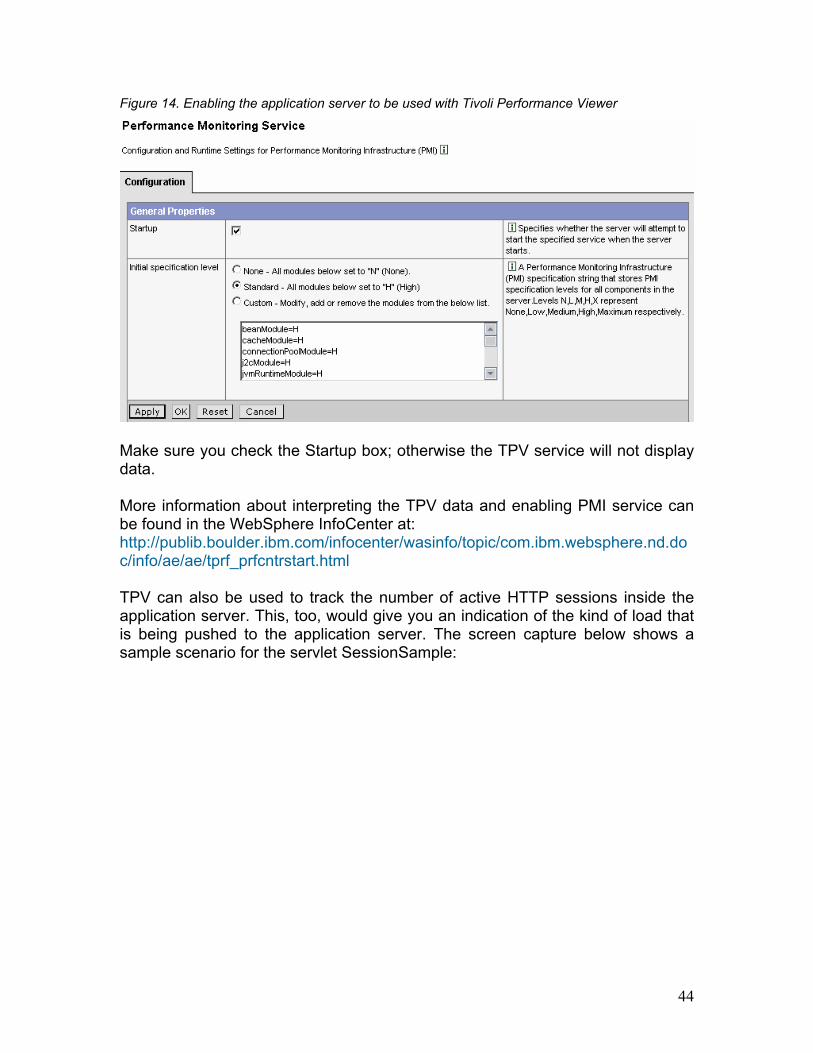
Figure 14. Enabling the application server to be used with Tivoli Performance Viewer
Make sure you check the Startup box; otherwise the TPV service will not display data. More information about interpreting the TPV data and enabling PMI service can be found in the WebSphere InfoCenter at: http://publib.boulder.ibm.com/infocenter/wasinfo/topic/com.ibm.websphere.nd.doc/info/ae/ae/tprf_prfcntrstart.html TPV can also be used to track the number of active HTTP sessions inside the application server. This, too, would give you an indication of the kind of load that is being pushed to the application server. The screen capture below shows a sample scenario for the servlet SessionSample:
45
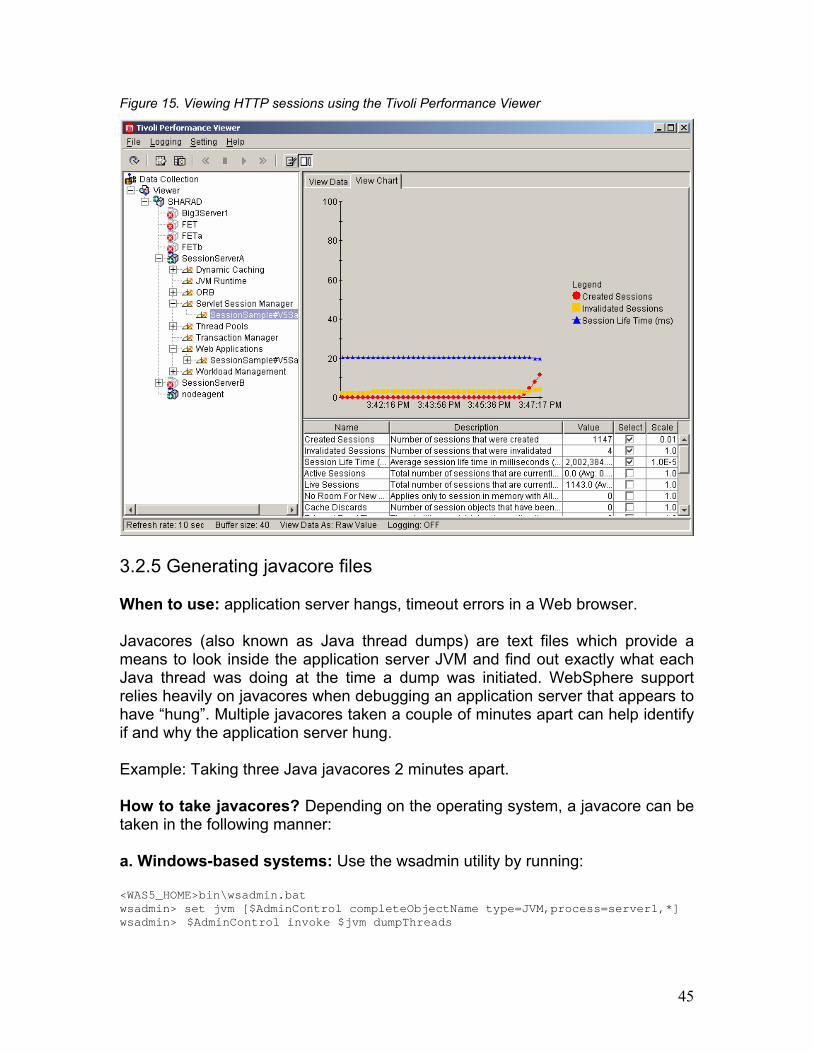
Figure 15. Viewing HTTP sessions using the Tivoli Performance Viewer
3.2.5 Generating javacore files When to use: application server hangs, timeout errors in a Web browser. Javacores (also known as Java thread dumps) are text files which provide a means to look inside the application server JVM and find out exactly what each Java thread was doing at the time a dump was initiated. WebSphere support relies heavily on javacores when debugging an application server that appears to have “hung”. Multiple javacores taken a couple of minutes apart can help identify if and why the application server hung. Example: Taking three Java javacores 2 minutes apart. How to take javacores? Depending on the operating system, a javacore can be taken in the following manner: a. Windows-based systems: Use the wsadmin utility by running: <WAS5_HOME>bin\wsadmin.batwsadmin> set jvm [$AdminControl completeObjectName type=JVM,process=server1,*]wsadmin> $AdminControl invoke $jvm dumpThreads

46
In this example, server1 is the JVM whose javacores you wish to take. b. UNIX-based systems: Use the wsadmin utility discussed earlier or use the kill -3 PID command. Example: If the PID of your application server is 23456, run the command: kill -3 23456
Once the threads have been successfully dumped, they will be written into the working directory of the application server under the file name javacore.yyyymmdd.hhmmss.pid.txt. The default working directory is the home directory of the application server; for example: <path>/WebSphere/AppServer. More information about javacores can be found at: http://publib.boulder.ibm.com/infocenter/wasinfo/topic/com.ibm.websphere.nd.doc/info/ae/ae/rtrb_appdies.html It takes some practice to understand a javacore. IBM provides a utility called Thread Analyzer which makes it possible to see the javacore through a user friendly GUI interface. Thread Analyzer is currently a technology preview and can be downloaded from: http://www7b.software.ibm.com/wsdd/downloads/thread_analyzer.html 3.2.6 Server-status utility in IBM HTTP Server When to use: HTTP errors 500, 403, 404 etc., application server hangs, unavailable application servers, network problems, timeout errors in a Web browser. The server-status utility in IBM HTTP Server (IHS) allows a system administrator to view the state of every HTTP request passing though it. This utility comes in very handy when debugging or monitoring plug-in related problems. Once the server-status utility has been enabled in IHS, you can view the status by simply pointing your browser to the URL http://ihs_machine_name/server-status, as seen in the figure below:

47
Figure 16. Server-status utility in IBM HTTP Server
The screen capture above shows that there are a total of five HTTP requests currently being processed by IHS. Three requests are in K state which means that they’re performing a read over a KeepAlive connection. One process is in W state which means that it is sending a reply. One process is in “_” state which means that it is idle and waiting for a request to come in. Refer to http://httpd.apache.org/docs/mod/mod_status.html for a list of all possible states. Enabling the server-status utility Open <IHS_HOME>/conf/httpd.conf and uncomment the following lines (note that these lines are at different places in httpd.conf):
LoadModule status_module libexec/mod_status.so
AddModule mod_status.c
<Location /server-status>SetHandler server-statusorder deny,allowdeny from allallow from .your_domain.com</Location>
For security reasons, you can limit the domain from which the server status can be requested. Replace .your_domain.com with your organization’s domain so that no one outside your organization will be provided this status. On Windows-based platforms, you need to also uncomment the following line in httpd.conf:

48
#LoadModule status_module modules/ApacheModuleStatus.dll
The information at http://httpd.apache.org/docs/mod/mod_status.html explains advanced usage scenarios of the server-status module in IHS. 3.3 Debugging WebSphere hangs The term WebSphere hang is often used inappropriately to refer to many different types of system hangs. In many instances, the problem may be due to a variety of system or configuration issues, such as database connection hangs and deadlocks, Java thread locking conditions, application code problems, etc. In very few cases is the hang actually due to a WebSphere product defect. Whatever the cause of the hang, a solid understanding of the plug-in is very helpful in isolating and resolving such problems. Most types of hang conditions manifest themselves in the form of TCP/IP connection clogging between the plug-in and the application server. What makes these problems especially difficult to resolve is the fact that when the problem occurs, a specific error code is not returned to the user (Web browser). If the user sends a request after a hang condition occurs, the user may wait a long time and then only receive a generic error code, if any. To get a better understanding of TCP/IP level clogging between the plug-in and the HttpTransport, let’s look at the figure below: Figure 17. TCP/IP backlog full
In the figure above, we see a Web server forwarding requests to the application server via the plug-in. All servlet threads on the application server side are used up (Tmax) and the backlog of port 9080 is full. When this happens, port 9080 becomes completely unresponsive to any new requests coming in from the plug-in.
T1 T2 Tn Tmax + BackLog
netstat –af inet | grep 9080
Web Server Layer
80
P L U G I N
netstat –af inet | grep 80
WebContainer layer
Backlog Full
T1 T2 Tn Tmax
9080
49
See Appendix A:
Appendix A discusses the buildup of such a condition in detail.
The connections coming in from the plug-in should ideally have a 1-to-1 relationship with the Java threads in the Web container. If all the current threads in the Web container are hung, new connections will start piling up in the TCP/IP backlog buffer and will never make it to the application server. This will cause of large number of TCP/IP connections to show up when you do a netstat. These connections will be released only if the hung threads somehow terminate or if the application server is recycled. Here is the step-by-step scenario:
1. Threads inside the application server hang or appear to be hung. 2. The application server cannot accept any more requests. 3. New requests from the plug-in start piling up on the HttpTransport port
(e.g. port 9080). 4. The TCP/IP backlog parameter, plus the fudge factor determine how many
requests get backlogged. 5. When an application server's backlog buffer is full, the requests will not be
accepted by the TCP/IP port of that application server. How do you know that you are experiencing this kind of hang? Errors are printed out in the plug-in log file when this happens. Look for the OS errors ETIMEDOUT or EINPROGRESS. Detailed explanations of these errors are provided in Section 1. The plug-in log will contain a log similar to the one below, indicating that you’ve hit this condition (IHS running on Solaris): ============================================================
[Wed Mar 12 14:35:56 2003] 0000247f 00000001 - ERROR: ws_common:
websphereGetStream: Failed to connect to app server on host 'localhost', [Wed
Mar 12 14:35:56 2003] 0000247f 00000001 - ERROR: ws_common: websphereGetStream:Failed to connect to app server on host 'localhost', OS err=145
[Wed Mar 12 14:35:56 2003] 0000247f 00000001 - ERROR: ws_common:
websphereExecute: Failed to create the stream[Wed Mar 12 14:35:56 2003] 0000247f 00000001 - ERROR: ws_server:serverSetFailoverStatus: Marking server1 down========================================================== We can see after referring to Table 1 that OS error 145 on Solaris means ETIMEDOUT.

50
Alternatively, you can use the netstat command and the telnet program to diagnose this situation. Details are in the sections titled 3.2.1 Using OS command netstat and 3.2.2 Using telnet as a debugging tool. How do you get relief from such a situation? Requests piling up in the backlog can be caused by two factors: system capacity overflow or code defects. 1. System capacity overflow: There are no bugs in any code, but the requests/sec load is more than what the WebSphere application is configured to handle. Performance tuning is beyond the scope of this paper, but you can refer to the online performance tuning documentation on: http://publib.boulder.ibm.com/infocenter/wasinfo/topic/com.ibm.websphere.nd.doc/info/ae/ae/tprf_tuneprf.html. From a plug-in standpoint, here are some tunable parameters that often play an important role during these conditions:
a. Maximum Web container threads: Increasing this value allows the application server to accept more concurrent requests. Refer to Section 2 for details on how to modify this value.
b. ConnectTimeout setting in plugin-cfg.xml: A low value helps the plug-in detect a hung application server sooner, and thus returns an error message to the user faster. A higher value will allow the plug-in more time to make a connection with the application server which may be beneficial when the network is slow. Refer to Section 2 for details on setting and modifying this value.
c. TCP/IP timeout on the operating system: This works similar to the ConnectTimeout attribute. It fires if the ConnectTimeout parameter is not specified or is higher than the TCP/IP timeout. This value is set at an OS level. Refer to Section 2 for details.
Several other parameters that affect capacity and performance are discussed throughout this paper. Also refer to the online performance tuning documentation when debugging capacity/performance issues. 2. Code defect: A hang condition could also be due to a code defect. Some examples are:
a. A servlet or EJB does not close database connections in its catch{} and finally{} blocks. When this happens, an application runs the risk of running out of available database connections, which may result in a hang-like condition.
b. A servlet calling a very long-running database query which causes that thread to be in use for a long time. If many such queries run
51
concurrently, it will cause new requests to get backed up, causing the system to appear hung.
c. Thread lock conditions in a multi-threaded application. d. Deviations from servlet/EJB specifications. e. Defect in WebSphere, operating system, database, or database driver
code. The following Web site lists some coding best practices that may be of interest to developers of WebSphere based applications: http://www7b.software.ibm.com/wsdd/zones/bp/. Summary There is a wide variety configuration parameters available to you to help you diagnose and fix plug-in related issues. Getting several javacores several minutes apart can help identify the cause of a “hung” application server. While troubleshooting some really tough problems, we often have to resort to the process of elimination methodology to gradually hone in on what the real problem actually is.
52
4 Miscellaneous topics IBM HTTP Server (IHS) 2.0 offers a multi-threaded model rather than a multiprocess model, which was offered in previous versions of IHS. This section provides a brief description of how to configure IHS 2.0 with WebSphere Application Server V5, and also explains the process of front-ending multiple WebSphere domains with a single plug-in. 4.1 Configuring IHS 2.0 plug-in Early versions of WebSphere Application Server V5 in a UNIX installation with IHS V2.0 sometimes resulted in an incorrect LoadModule to be written into the httpd.conf file. To correct this, you can manually edit httpd.conf to fix the problem, as shown below: LoadModule was_ap20_module <path to file named mod_was_ap20_http.so>WebSpherePluginConfig <full path to config file>
For example, on the Solaris operating system it should be edited as follows: LoadModule was_ap20_module /opt/WebSphere/AppServer/bin/mod_was_ap20_http.soWebSpherePluginConfig /opt/WebSphere/AppServer/config/cells/plugin-cfg.xml
Detailed information about this configuration task is available on: http://publib.boulder.ibm.com/infocenter/wasinfo/topic/com.ibm.websphere.base.doc/info/aes/ae/tins_installIHS2.html. 4.2 Merging two plug-in files together If you wish to front-end two or more WebSphere cells with the same Web server and plug-in, you will need to manually merge the plug-in files from each cell into one file. Front-ending multiple cells with a single plug-in can be useful for tasks such as providing a higher level of failover capability, phased migration of WebSphere versions, etc. When merging the files, follow the suggestions below:
1. Make sure you have unique names for the following tags:
a. ServerCluster b. VirtualHostGroup c. UriGroup d. Route.
2. The contents of the following tags cannot be duplicated:
a. You cannot have more than one Route with the identical contents, even if they have different names.
b. The same URI should not be defined in more than one URIGroup.

53
c. You cannot have two VirtualHostGroups configured for the same port number.
Detailed information is available on-line on: http://publib.boulder.ibm.com/infocenter/wasinfo/topic/com.ibm.websphere.base.doc/info/aes/ae/tins_websmig2.html. Summary This section provides a high level idea of how to configure IHS 2.0 and also introduces the concept of supporting multiple WebSphere Application Server cells/domains using the same plug-in.

54
Conclusion The Web server plug-in is one of the main entry points into WebSphere Application Server, and for that reason we must continuously ensure that it’s providing optimal service. With customers enabling more and more of their enterprise functions to be accessible via the Web, the plug-in is handling more load as time goes on. Therefore, the optimal plug-in configuration also changes with time, which means that monitoring and tuning the plug-in for stability becomes an iterative process as load is continuously increased. Although the intent of this paper was to provide practical, hands-on advice on ways to monitor, tune and troubleshoot the plug-in, our discussion was not restricted to the plug-in layer alone. We also discussed the HttpTransport layer and the operating system and basic guidelines on how to tune them for optimal plug-in operation, since they play an important role in how the plug-in responds during high load conditions. We hope this paper helps answer questions and provides guidance with your Web application development using the WebSphere Application Server plug-in.
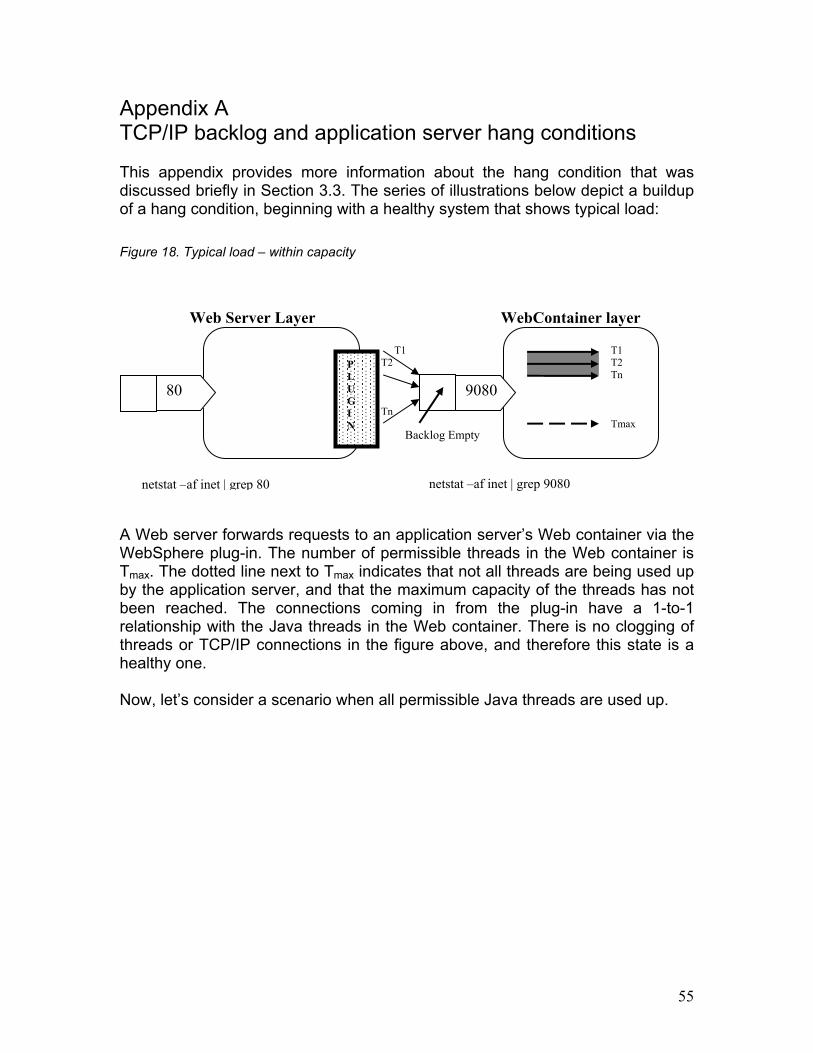
55
Appendix A TCP/IP backlog and application server hang conditions This appendix provides more information about the hang condition that was discussed briefly in Section 3.3. The series of illustrations below depict a buildup of a hang condition, beginning with a healthy system that shows typical load: Figure 18. Typical load – within capacity
A Web server forwards requests to an application server’s Web container via the WebSphere plug-in. The number of permissible threads in the Web container is Tmax. The dotted line next to Tmax indicates that not all threads are being used up by the application server, and that the maximum capacity of the threads has not been reached. The connections coming in from the plug-in have a 1-to-1 relationship with the Java threads in the Web container. There is no clogging of threads or TCP/IP connections in the figure above, and therefore this state is a healthy one. Now, let’s consider a scenario when all permissible Java threads are used up.
T1 T2 Tn
netstat –af inet | grep 9080
Web Server Layer
80
P L U G I N
netstat –af inet | grep 80
WebContainer layer
T1 T2 Tn Tmax
9080
Backlog Empty
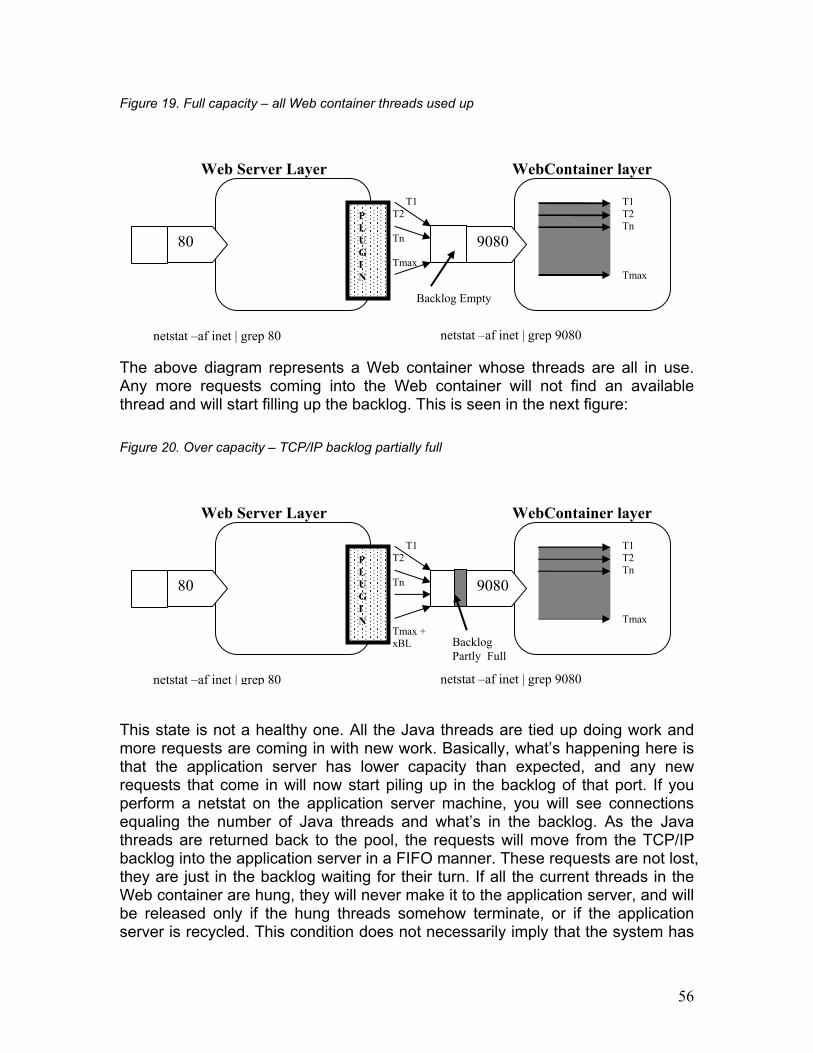
56
Figure 19. Full capacity – all Web container threads used up
The above diagram represents a Web container whose threads are all in use. Any more requests coming into the Web container will not find an available thread and will start filling up the backlog. This is seen in the next figure: Figure 20. Over capacity – TCP/IP backlog partially full
This state is not a healthy one. All the Java threads are tied up doing work and more requests are coming in with new work. Basically, what’s happening here is that the application server has lower capacity than expected, and any new requests that come in will now start piling up in the backlog of that port. If you perform a netstat on the application server machine, you will see connections equaling the number of Java threads and what’s in the backlog. As the Java threads are returned back to the pool, the requests will move from the TCP/IP backlog into the application server in a FIFO manner. These requests are not lost, they are just in the backlog waiting for their turn. If all the current threads in the Web container are hung, they will never make it to the application server, and will be released only if the hung threads somehow terminate, or if the application server is recycled. This condition does not necessarily imply that the system has
Backlog Partly Full
T1 T2 Tn Tmax + xBL
Web Server Layer
80
P L U G I N
netstat –af inet | grep 80
WebContainer layer
9080
netstat –af inet | grep 9080
T1 T2 Tn Tmax
T1 T2 Tn Tmax
netstat –af inet | grep 9080
Web Server Layer
80
P L U G I N
netstat –af inet | grep 80
WebContainer layer
9080
T1 T2 Tn Tmax
Backlog Empty
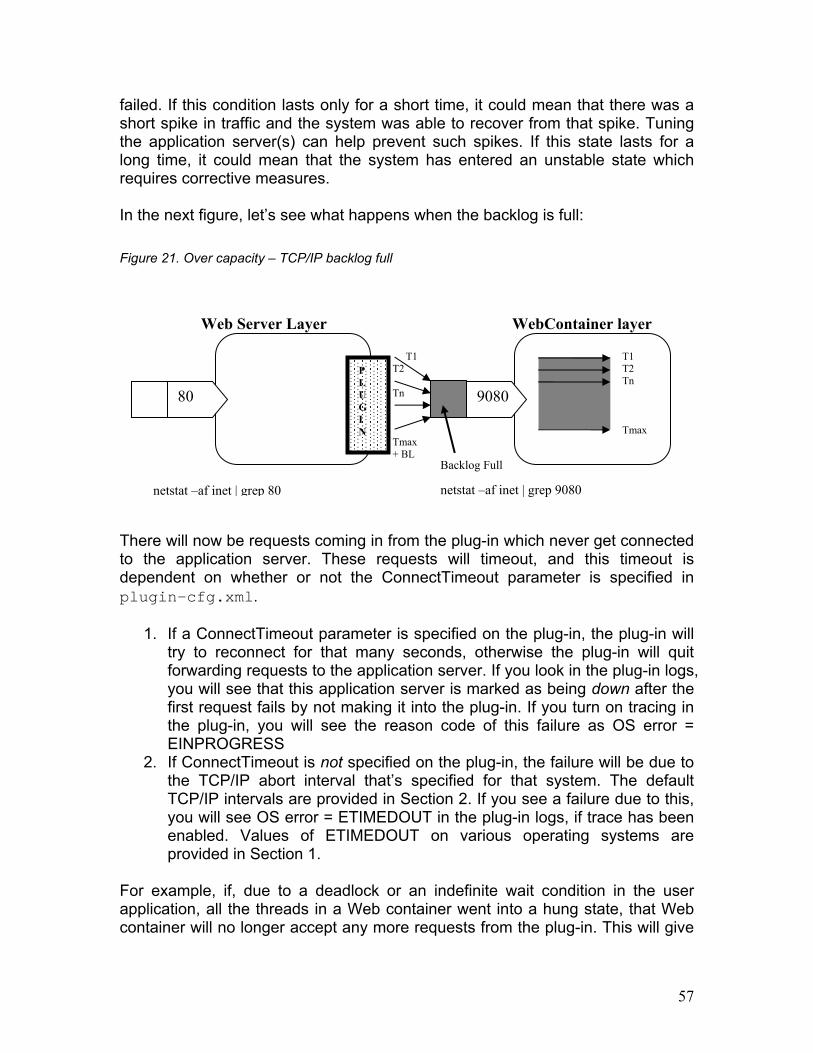
57
failed. If this condition lasts only for a short time, it could mean that there was a short spike in traffic and the system was able to recover from that spike. Tuning the application server(s) can help prevent such spikes. If this state lasts for a long time, it could mean that the system has entered an unstable state which requires corrective measures. In the next figure, let’s see what happens when the backlog is full: Figure 21. Over capacity – TCP/IP backlog full
There will now be requests coming in from the plug-in which never get connected to the application server. These requests will timeout, and this timeout is dependent on whether or not the ConnectTimeout parameter is specified in plugin-cfg.xml.
1. If a ConnectTimeout parameter is specified on the plug-in, the plug-in will try to reconnect for that many seconds, otherwise the plug-in will quit forwarding requests to the application server. If you look in the plug-in logs, you will see that this application server is marked as being down after the first request fails by not making it into the plug-in. If you turn on tracing in the plug-in, you will see the reason code of this failure as OS error = EINPROGRESS
2. If ConnectTimeout is not specified on the plug-in, the failure will be due to the TCP/IP abort interval that’s specified for that system. The default TCP/IP intervals are provided in Section 2. If you see a failure due to this, you will see OS error = ETIMEDOUT in the plug-in logs, if trace has been enabled. Values of ETIMEDOUT on various operating systems are provided in Section 1.
For example, if, due to a deadlock or an indefinite wait condition in the user application, all the threads in a Web container went into a hung state, that Web container will no longer accept any more requests from the plug-in. This will give
Backlog Full
T1 T2 Tn Tmax + BL
netstat –af inet | grep 9080
Web Server Layer
80
P L U G I N
netstat –af inet | grep 80
WebContainer layer
9080
T1 T2 Tn Tmax
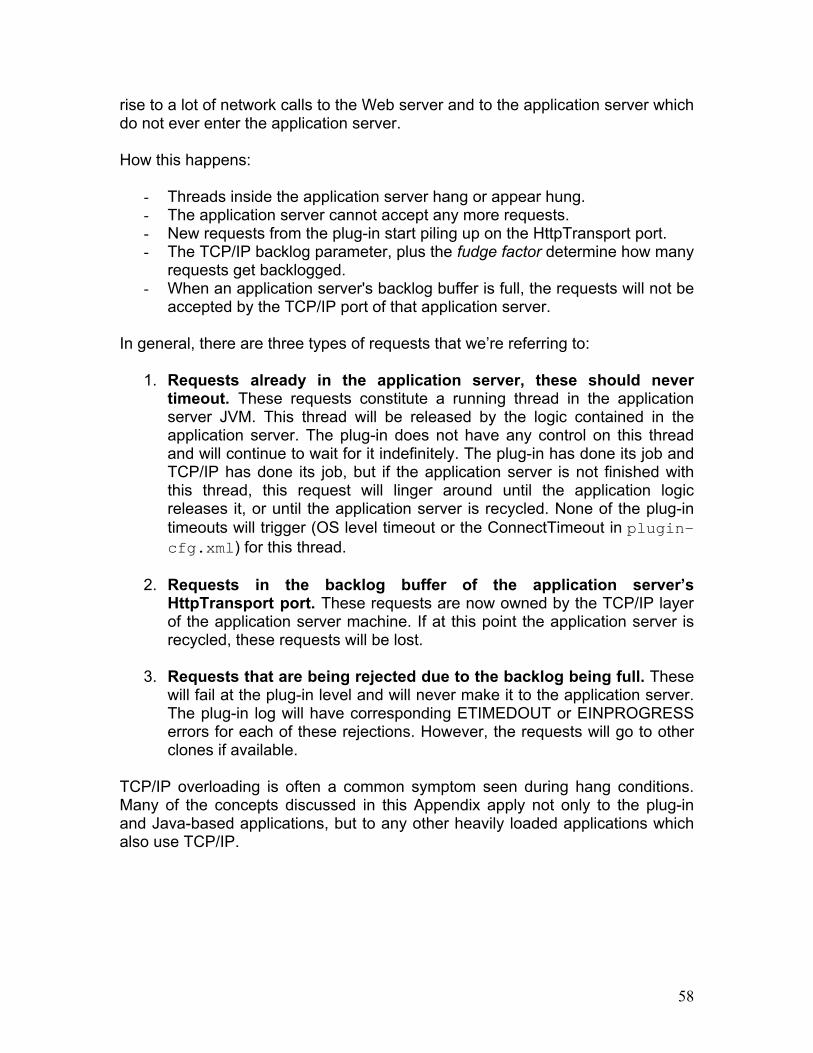
58
rise to a lot of network calls to the Web server and to the application server which do not ever enter the application server. How this happens:
- Threads inside the application server hang or appear hung. - The application server cannot accept any more requests. - New requests from the plug-in start piling up on the HttpTransport port. - The TCP/IP backlog parameter, plus the fudge factor determine how many
requests get backlogged. - When an application server's backlog buffer is full, the requests will not be
accepted by the TCP/IP port of that application server. In general, there are three types of requests that we’re referring to:
1. Requests already in the application server, these should never timeout. These requests constitute a running thread in the application server JVM. This thread will be released by the logic contained in the application server. The plug-in does not have any control on this thread and will continue to wait for it indefinitely. The plug-in has done its job and TCP/IP has done its job, but if the application server is not finished with this thread, this request will linger around until the application logic releases it, or until the application server is recycled. None of the plug-in timeouts will trigger (OS level timeout or the ConnectTimeout in plugin-cfg.xml) for this thread.
2. Requests in the backlog buffer of the application server’s
HttpTransport port. These requests are now owned by the TCP/IP layer of the application server machine. If at this point the application server is recycled, these requests will be lost.
3. Requests that are being rejected due to the backlog being full. These
will fail at the plug-in level and will never make it to the application server. The plug-in log will have corresponding ETIMEDOUT or EINPROGRESS errors for each of these rejections. However, the requests will go to other clones if available.
TCP/IP overloading is often a common symptom seen during hang conditions. Many of the concepts discussed in this Appendix apply not only to the plug-in and Java-based applications, but to any other heavily loaded applications which also use TCP/IP.

59
Appendix B Summary of references Below is a consolidated list of all the references in this paper. IBM references Multiple WebSphere Application Server domains front-ended by the same plug-in http://publib.boulder.ibm.com/infocenter/wasinfo/topic/com.ibm.websphere.base.doc/info/aes/ae/tins_websmig2.html Syntax of plugin-cfg.xml file http://publib.boulder.ibm.com/infocenter/wasinfo/index.jsp?topic=/com.ibm.websphere.nd.doc/info/ae/ae/rrun_plugin.html WebSphere troubleshooting page http://publib.boulder.ibm.com/infocenter/wasinfo/topic/com.ibm.websphere.base.doc/info/aes/ae/welc_troubleshooting.html Instructions to trace the WebSphere Application Server product code http://publib.boulder.ibm.com/infocenter/wasinfo/topic/com.ibm.websphere.nd.doc/info/ae/ae/utrb_traceservice.html Interpreting the WebSphere Application Server trace output http://publib.boulder.ibm.com/infocenter/wasinfo/topic/com.ibm.websphere.nd.doc/info/ae/ae/ctrb_readtrc.html Configuring custom properties on the HttpTransport layer http://publib.boulder.ibm.com/infocenter/wasinfo/topic/com.ibm.websphere.nd.doc/info/ae/ae/xrun_transport.html Serving static content from an EAR file http://publib.boulder.ibm.com/infocenter/wasinfo/topic/com.ibm.websphere.nd.doc/info/ae/ae/uweb_rsfiles.html Using the Tivoli Performance Viewer http://publib.boulder.ibm.com/infocenter/wasinfo/topic/com.ibm.websphere.nd.doc/info/ae/ae/tprf_prfcntrstart.html Debugging the JVM http://publib.boulder.ibm.com/infocenter/wasinfo/topic/com.ibm.websphere.nd.doc/info/ae/ae/rtrb_appdies.html Using the Thread Analyzer utility to view the javacore output http://www7b.software.ibm.com/wsdd/downloads/thread_analyzer.html

60
Tuning WebSphere Application Server performance http://publib.boulder.ibm.com/infocenter/wasinfo/topic/com.ibm.websphere.nd.doc/info/ae/ae/tprf_tuneprf.html WebSphere Best Practices Zone http://www7b.software.ibm.com/wsdd/zones/bp/. Installing and configuring IBM HTTP Server 2.0 http://publib.boulder.ibm.com/infocenter/wasinfo/topic/com.ibm.websphere.base.doc/info/aes/ae/tins_installIHS2.html TCP/IP errors http://publibn.boulder.ibm.com/doc_link/en_US/a_doc_lib/libs/commtrf2/connect.htm Other references Interpreting Apache logs http://httpd.apache.org/docs/logs.html Understanding HTTP return codes http://www.w3.org/Protocols/rfc2616/rfc2616-sec10.html Using the Server Status utility in IBM HTTP Server http://httpd.apache.org/docs/mod/mod_status.html TCP/IP errors http://www.opengroup.org/onlinepubs/007908799/xsh/errors.html Book: Unix Network Programming, 2nd Edition by Richard Stevens


