Wastewater Master Plan - Detroit Water and Sewerage...
67
Detroit Water and Sewerage Department Wastewater Master Plan DWSD Project No. CS-1314 Basis of Cost Estimates Technical Memorandum Original Date: May 8, 2003 Revision Date: September 2003 Author: Tucker, Young, Jackson, Tull Inc.
Transcript of Wastewater Master Plan - Detroit Water and Sewerage...

Detroit Water and Sewerage Department
Wastewater Master Plan
DWSD Project No. CS-1314
Basis of Cost Estimates
Technical Memorandum Original Date: May 8, 2003 Revision Date: September 2003 Author: Tucker, Young, Jackson, Tull Inc.

September 2003 i
Table of Contents 1 Purpose ................................................................................................................................... 1 2 Methodology .......................................................................................................................... 1
2.1 Wastewater Conveyance Facilities ...............................................................................................1 2.2 Wastewater Treatment Facilities ..................................................................................................2
3 Limitations.............................................................................................................................. 3 4 Allowances and Contingencies............................................................................................ 3 5 Cost Index............................................................................................................................... 5 6. Program 1: Sewer Infrastructure Program........................................................................ 7
6.1 Subprogram No. 1A: Lateral and Connector Sewers – Cleaning, Sediment Disposal & Condition Assessment ....................................................................................................................7 6.2 Subprogram No. 1B: Interceptor and Trunk Sewer Cleaning, Disposal and Condition Assessment .......................................................................................................................................8 6.3 Subprogram No. 1C: Lateral & Connector Sewer Improvements ......................................9 6.4 Subprogram No. 1D: Interceptor and Trunk Sewer Improvements.................................10 6.5 Subprogram No. 1E: Manholes and Catch Basin Improvements......................................13 6.6 Subprogram No. 1F: Regulators, Outfalls, Backwater Gates, Diversion Dams and In- System Storage ...............................................................................................................................14 6.7 Subprogram No. 1G: Pump Stations....................................................................................19 6.8 Subprogram No. 1H: Meters .................................................................................................20
7. Program 2: CSO and SSO Control Program ................................................................... 21 7.1 Ongoing CIP Projects ..............................................................................................................21 7.2 New Projects.............................................................................................................................21 7.3 CSO Rehabilitation ..................................................................................................................22
8 Program 3: System Control and Wastewater Treatment Program............................... 22 8.1 Wastewater Treatment Plant Ongoing and Major Rehabilitation ....................................22
Appendix A: Data Tables Used for CIP Appendix A – Data Tables Used for CIP ....... 26 Appendix B – Data Tables Not Used for CIP ..................................................................... 38
B.1 Alternate Data Category Tables ............................................................................................38 B.1.5 Historical References ...........................................................................................................47 B.1.6 Means and Manufacturers’ Estimates ...............................................................................48 B.1.7 Mean’s Unit Cost Estimates ................................................................................................53
Appendix C: Unit Costs for Treatment Facilities ............................................................... 56 Appendix D: Wastewater Treatment Plant Ongoing Repair and Replacement Cost Estimates .................................................................................................................................. 64 Link to Complete Spreadsheets ........................................................................................... 65

September 2003 1
Basis of Cost Estimates 1 Purpose In the development of a Master Plan for wastewater conveyance and treatment that extends 50 years into the future, it is necessary to utilize a set of common assumptions as to the capital cost of facility construction. The cost assumptions provide the basis for establishing the estimated annual expenditure in the capital improvement plan (CIP) that was developed as a component of the Detroit Wastewater Master Plan (WWMP).
The guidelines are intended to provide unit costs for construction and rehabilitation of conveyance and treatment facilities. These unit costs can then be used to establish total costs of planning alternatives for comparative purposes. Unit costs can also be applied to recommended system upgrades, improvements, and rehabilitation projects to develop total project costs for CIP development.
While conveyance facilities are common elements of the DWSD system, the treatment facilities being investigated are each somewhat unique in nature and thus not as readily subjected to the application of generalized unit cost factors. For this reason, a different approach to cost development has been employed for treatment facilities.
2 Methodology Development of component costs for a Master Plan covering the range of potential project types anticipated within the DWSD planning area over a 50-year time frame required evaluation of historic costs as well as “ground up” estimates. These costs can be applied to proposed projects with varying site conditions and complexities throughout the planning area.
2.1 Wastewater Conveyance Facilities To better account for a range of conditions, if possible, the unit costs were derived from a convergence of two sources. The cost estimates for wastewater conveyance facilities are based on an assembly and comparison of historical construction costs from multiple cost estimates and reports compiled from 1971 to present, and construction estimates using the R.S. Means Sitework and Landscaping Data and methodology.
Since, in many cases, the two methods produced differing results final, unit costs were established within the range of estimated costs through review by experienced design construction professionals. Section B.1.5 in Appendix B presents the historical cost development. Section B.1.6 in Appendix B presents the Means method cost development. In some cases, one of the two estimating methods was applicable for conveyance facilities.

Detroit Water and Sewerage Department Basis of Cost Estimates
September 2003 2
It was necessary to establish a time reference for historical data reviewed as part of the cost evaluation. The year 2003 was selected as this reference point for the CIP development.
The CIP developed for the Wastewater Master Plan (WWMP) used 2003 as the base year. Section 2 contains the base data for the CIP estimates. Cost data tables that were used for the CIP estimates are contained in Appendix A. The 2000 costs from these tables were escalated to 2003 costs using the ENR Construction Cost Index (CCI) shown in Table 1.
Both Means estimates and historical costs were calculated to use the year 2003 as a base. Historical sources, which are taken from the year in which they were reported, were adjusted to 2003 unit costs using the ENR Construction Cost Index (CCI). Costs for specific items were then averaged to determine the historical unit cost in year 2003 dollars. It should be noted that some projects with costs that were extremely high or low compared to the others for the same type of facility were excluded from the average. Some assumptions were made for the historical data due to a lack of detail in the original estimates. For example, many of the pipe depths were assumed based on size. For sections where variable depths are shown, the original estimate, which is based upon a shallower depth, is multiplied by a factor to obtain a number for the deeper depths.
These factors were obtained from the RS Means estimates and then applied to the historical data. Where historical costs were not available, manufacturers estimates were used.
Section B.1.6 in Appendix B shows the estimates based on RS Means costs for the same material and the same assumed conditions as in the cost guidelines section. The RS Means numbers were taken from the 2002 Means data then converted to the year 2000 using the suggested Means factors for year and location (Detroit) adjustment. For example, an item costing $23 in 2002 would be multiplied by the index in 2000 (95.9) then divided by the index for 2002 (100) to obtain $22.06 then adjusted for the location by multiplying by .962, the Means city cost index, to give an adjusted 2000 price of $21.22. These 2000 values were then escalated to 2003 values for the unit costs used in the CIP development.
2.2 Wastewater Treatment Facilities To address the treatment needs within the planning area over the 50-year planning period a series of treatment alternatives were developed by Tetra Tech MPS. These ranged from expansion of treatment capacity at the existing Detroit WWTP; to utilization of existing outlying (satellite) facilities with upgrade and expansion in Pontiac, Warren and/or Mt. Clemens; to construction of dedicated facilities to treat wet weather flow and the dewatered flows from CSO and SSO storage facilities. Each of these alternatives has been documented in technical memoranda specific to the alternative type.

Detroit Water and Sewerage Department Basis of Cost Estimates
September 2003 3
The three technical memoranda describing alternatives– Expanded Facilities within the City of Detroit, Technical Feasibility of Satellite Treatment, and Technical Feasibility of a Wet Weather Flow Treatment Facility- contain detailed descriptions of the proposed facilities and include, as appendices, the complete cost estimates for each facility.
As part of the alternatives development, conceptual (planning level) cost estimates were developed for the facilities being proposed. These estimates would be based on specific facility locations, preliminary facility layouts and defined treatment process capacities. Because this additional detail is available, more detailed estimates could be prepared than could be expected for conveyance facilities.
These estimates used standard construction cost estimating procedures and formats. Designers broke down facilities by each component process and prepared cost estimates at the process level for the specific size and configuration appropriate for each facility.
Appendix C contains the treatment facility unit cost tables derived from the alternatives. Any unit costs for conveyance items used in these alternative estimates, such as pipes, were used with other data in calculating the CIP costs.
3 Limitations Every construction project presents unique conditions with respect to location, site constraints, and soil or geotechnical considerations. Also, construction industry market conditions can greatly affect project costing. By considering both historical costs as well as current cost estimating methods, an attempt was made to account for the range of potential costs. However, no estimates can be considered final until complete construction plans and specifications have been prepared. At the Master Planning stage, these unit costs, as well project costs derived from them, need to be evaluated appropriately. Thus, these generalized costs are appropriate for comparison of alternative approaches to providing service, but additional detail should be provided for site-specific construction estimates.
4 Allowances and Contingencies At every stage of construction cost estimating, certain unknown factors need to be accounted for in the development of estimated costs. This is even true at the time final plans and specifications are completed for a specific project. It is especially critical at the planning stage. The unit costs presented throughout this technical memorandum are base construction costs, for the most part. This means that, in most cases, no allowances or contingencies of any type have been applied. Contingencies need to be added to cost estimates prior to inclusion in the CIP.
The following cost categories need to be considered in the development of complete cost estimates: Contractor Overhead and Profit; Contingency; and Engineering, Legal, Administrative, and Management.

Detroit Water and Sewerage Department Basis of Cost Estimates
September 2003 4
Contractor Overhead and Profit accounts for the markup that contractors employ to cover costs, such as mobilization, and the profit they would expect to garner from the project.
The Contingency markup has two main parts, Planning Level Contingency and Contractor Contingency. The Planning Level Contingency accounts for the uncertainty of the cost estimate due to the basic level of design development appropriate at the planning level. This contingency should decrease significantly as each project proceeds from the Master Plan stage through the Project Plan stage, the Preliminary Design Stage and the Final Design Stage. For a Master Plan looking 50 years into the future, the contingency will be a considerable portion of the total costs. The contractor contingency allows for uncertainty in the final contract cost due to market conditions at the time the project is bid, and for potential changes to the project during the construction stage (change orders).
Engineering, Legal, Administrative, and Management markups account for several aspects of the projects. These include providing funds for performing the engineering design calculations, preparing plans and specifications, bidding the construction contract and awarding the work, contractor oversight, shop drawing review and approval, on site inspection services, change order development, development of record drawings, and contract close out. They also account for the costs associated with legal review of construction contracts and, when necessary, the involvement of financial professionals in preparation of bond statements and the sale of bonds.
A review of contingencies used in other recent DWSD projects led to the use of the following multipliers. For new construction (replacement) or major rehabilitation, the multipliers applied are:
Contractor Overhead and Profit: 25% of base construction costs
Contingency: 30% of total construction cost, including contractor overhead and profit
Engineering, Legal, 20% of total construction cost, including
Administrative, and Management: contractor overhead and profit
For all other categories (inspection, cleaning, rehabilitation, etc.), the multipliers applied are:
Contractor Overhead and Profit: 25% of base construction costs
Contingency: 15% of total construction cost, including contractor overhead and profit
Engineering, Legal, 10% of total construction cost, including
Administrative, and Management: contractor overhead and profit
Detroit Water and Sewerage Department Basis of Cost Estimates
September 2003 5
Most unit costs presented in this technical memorandum are basic construction costs without contingencies. The above contingencies needed to be added to the base costs as project specific estimates are developed. The estimates that are based on actual costs from past projects already include these contingencies.
5 Cost Index Historical costs have been adjusted using data from the Engineering News Record (ENR) Construction Cost Index History, which provides annual cost indices from 1913 to present. Table 1 shows the annual cost indices from 1969 to 2002. Extrapolation of this data gives the annual indices for the year 2003.
The cost estimates developed for the CIP used a 2003 cost. The 2003 costs were obtained by escalating any base data used from their base year to 2003 using the CCI. Using the example for a 1990 estimated cost for 12" sanitary line of $212 per linear foot, convert it to 2003 cost by dividing the unit price by the year’s index (212/4732). Then multiply by the year 2003 index (6698) to get the escalated 2003 unit cost of $300.

Detroit Water and Sewerage Department Basis of Cost Estimates
September 2003 6
Table 1 ENR Construction Cost Index (CCI)
Year Index Year Index
1969 1269 1986 4295
1970 1381 1987 4406
1971 1581 1988 4519
1972 1753 1989 4615
1973 1895 1990 4732
1974 2020 1991 4835
1975 2212 1992 4985
1976 2401 1993 5210
1977 2576 1994 5408
1978 2776 1995 5471
1979 3003 1996 5620
1980 3237 1997 5825
1981 3535 1998 5920
1982 3825 1999 6060
1983 4066 2000 6221
1984 4146 2001 6342
1985 4195 2002 6538
2003 6698** Index for 2002 was averaged in 12/02 using 11 months of data. ** This number was forecasted

Detroit Water and Sewerage Department Basis of Cost Estimates
September 2003 7
Cost Guideline Summaries The following pages contain cost guidelines for those items included in the CIP and rate model, including pipe installation, special structures and manholes; pump stations, pipe rehabilitation, miscellaneous repair, and pipeline inspection and cleaning. The categories and layout correspond to the CIP cost estimating spreadsheets.
For each category, the material and assumed construction conditions are identified. These include type and depth of excavation, utility and pavement restoration anticipated, and number of manholes or other structures included in the estimate. Additionally, a useful life expectancy for the specific type of facility is provided for use in CIP development.
6. Program 1: Sewer Infrastructure Program This section of the CIP development includes the inspection, cleaning, rehabilitation, and replacement of DWSD sewers.
6.1 Subprogram No. 1A: Lateral and Connector Sewers – Cleaning, Sediment Disposal & Condition Assessment Lateral and Connector sewers were defined previously in consultation with DWSD. A lateral sewer collects flows from homes and businesses for discharge into trunk sewers. These sewers range in size from 6” to 24” in diameter, with an average size of 18”. A connector sewer is a pipe that carries the wastewater flow from a lateral sewer to a trunk sewer. Connector sewers range from 24” in diameter to a 4’ by 6’ egg shape, with an average size of 30” in diameter. An assessment of DWSD sewers from the technical memorandum Lateral Sewers and Connection Sewers indicates that there are 2,258 miles of laterals and 559 miles of connector sewers in the DWSD sewer system.
6.1.1 Inspection The CIP costs for inspection of lateral and connector sewers were developed with the assumption that this inspection would be accomplished through sewer televising. Sewer televising consists of remote televising of sewers using robotically controlled cameras. The estimate includes mobilization, set up for camera entry, and furnishing of all incidentals.
The actual CIP cost estimation was derived from the technical memorandum entitled Physical Inspection of Lateral and Connector Sewers, revised May 2003, which describes a recent pilot project performed by Inland Waters Pollution Control, Inc. for DWSD. Inspections occurred in June, July, and October of 2002. This project inspected several DWSD sewers in the lateral and connector categories using TV inspection methods. The selected sewers for these inspections included varying pipe diameters as well as material types. The average inspection costs from the pilot project are used for the CIP. Table A-1 in Appendix A shows an alternate cost estimation for sewer inspections based on historical data. These unit costs in Table A

Detroit Water and Sewerage Department Basis of Cost Estimates
September 2003 8
do not include contingencies. Note that the pilot project costs are within the ranges set in Table A.
2003 Lateral and Connector Sewer Inspection Costs = $2.11 per linear foot ($11,141 per mile)
6.1.2 Cleaning Sewer Cleaning consists of preparatory cleaning (also called light cleaning) or heavy cleaning utilizing a hydraulic sewer jet/vacuum unit. The estimate includes mobilization, set up for jet/vacuum truck, and furnishing of all incidentals.
The CIP costs for the cleaning of lateral and connector sewers were taken from the technical memorandum entitled Physical Inspection of Lateral and Connector Sewers, revised May 2003, which describes a recent pilot project performed by Inland Waters Pollution Control, Inc. for DWSD. Table A-2 in Appendix A shows an alternate cost estimation for sewer cleaning based on historical data.
The unit costs do not include contingencies.
2003 Lateral and Connector Sewer Light Cleaning Costs = $3.25 per linear foot ($17,160 per mile) 2003 Lateral and Connector Sewer Heavy Cleaning Costs = $9.00 per linear foot ($47,520 per mile) 6.1.3 Sediment Testing A concern regarding the pipes in the DWSD system is that the buildup of sludge contains toxic materials, such as PCBs or mercury. This sludge should be removed and disposed of in a different manner than the current sewer jet / vacuum unit practices (washing sludgedown the sewers to the WWTP). Sludge removal should therefore include a sampling station to test the sludge components. If sludge tests indicate hazardous materials, the sludge will need to be disposed of in an apporpiate landfill. The cost per truckload comes from CDM and assumes two tests, one for PCB’s and one for mercury, would be performed on each load.
2003 Lateral and Connector Sewer Sediment Testing Costs = $200 per truck load (10 truck loads per mile.)
6.2 Subprogram No. 1B: Interceptor and Trunk Sewer Cleaning, Disposal and Condition Assessment Interceptor and trunk sewers are defined previously in the Interceptor and Trunk Sewers technical memorandum. A trunk sewer collects flows from lateral and connector sewers for discharge into interceptor sewers. These sewers are generally larger than laterals, ranging in size from 18” to 10’ in diameter. An interceptor sewer is a large sewer that carries the wastewater flow from a number of trunk sewers to the wastewater treatment plant. These sewers do not connect to any homes, buildings, or

Detroit Water and Sewerage Department Basis of Cost Estimates
September 2003 9
catch basins. Interceptor sewers are generally larger than trunk sewers (10’ or larger). An assessment of DWSD sewers indicated that there are 483 miles of trunk sewers and 83 miles of interceptors (39 miles serving Macomb County only) in the DWSD sewer system.
6.2.1 Inspection The CIP costs for inspection of interceptor and trunk sewers were developed with the assumption that inspection would be accomplished through sewer televising. Other methods such as diving may be more effective because of the larger sizes of pipes. Sewer televising consists of remote televising of sewers using robotically controlled cameras. The estimate includes mobilization, set up for camera entry, and furnishing of all incidentals. The estimate is unit cost per mile of pipe. The CIP costs for the inspection of interceptor and trunk sewers were taken from Table A-1, which is based on historical data. This unit cost does not include contingencies.
2003 Interceptor and Trunk Sewer Inspection Costs = $4.31 per linear foot ($22,747 per mile)
6.3 Subprogram No. 1C: Lateral & Connector Sewer Improvements Costs for improvements to the lateral and connector sewers in the DWSD system were derived. These improvements can include the rehabilitation of the existing sewers or the construction of new sewers to replace existing sewers to enhance the sewer system where there are deficiencies. This memorandum only considers the rehabilitation of lateral and connector sewers.
6.3.1 Rehabilitation - Lateral and Connector Relining There are a few different methods of rehabilitating sewers that were considered for lateral and connector sewers. These include chemical grouting of joints, sliplining and cured-in-place-pipe (CIPP). CIPP was the preferred method used for the CIP estimates.
CIPP Lining CIPP lining is considered to be major rehabilitation. CIPP installation includes the installation of Cured-In-Place Pipe, mobilization, sewer preparation, and furnishing of all incidentals.
The service life of CIPP Lining is 50 years. The CIP cost estimation for lateral and connector sewer rehabilitation was derived from the recent pilot project performed by Inland Waters for DWSD. This information is found in the technical memorandum entitled Physical Inspection of Lateral and Connector Sewers. For this project, CIPP was installed for several lengths of laterals and connectors within the DWSD system. These unit costs do not include contingencies.
2003 Lateral Sewer CIPP Rehabilitation Costs = $122.35 per linear foot ($646,000 per mile) 2003 Connector Sewer CIPP Rehabilitation Costs = $220.30 per linear foot ($1,163,184 per mile)

Detroit Water and Sewerage Department Basis of Cost Estimates
September 2003 10
Table A-3 in Appendix A shows an alternate cost estimation for CIPP Lining based on historical data.
6.4 Subprogram No. 1D: Interceptor and Trunk Sewer Improvements Costs for improvements to the interceptor and trunk sewers in the DWSD system were derived. These improvements include the rehabilitation of the existing sewers and the construction of new sewers to replace existing sewers, or to enhance the sewer system where there are deficiencies.
6.4.1 Rehabilitation – Structural Repairs The rehabilitation of the larger interceptor and trunk sewers requires methods different than for lateral and connector sewers. In addition to a CIPP relining, specific structural repairs can be accomplished because the sewers are large enough to be entered. As a result of recent inspections of some of the interceptors and trunk sewers in the DWSD system, some structural repairs were identified. These can be found in the CS-1158 report called Long Term CSO Plan for the Detroit and Rouge Rivers, 1996. These inspections covered approximately 886,400 linear feet, or about 30% of the system, with structural repair costs (mostly CIPP lining) estimated at $18,000,000.
Table A-3 shows the CIPP lining cost estimation based on historical data. This table, however, only goes up to 48” pipe, while the pipes used in this structural repair calculation range from 24” to 177”. The unit cost below is an extrapolation of Table A-3 and does not include contingencies.
2003 Interceptor and Trunk Sewer Structural Repair Costs = $1,000 per linear foot
6.4.2 Cleaning Sewer Cleaning of the interceptor and trunk sewers consists of heavy cleaning utilizing a hydraulic sewer jet/vacuum unit. The estimate includes mobilization, set up for jet/vacuum truck, and furnishing of all incidentals. The CIP costs for the cleaning of interceptor and trunk sewers were taken from Table A-2, which is based on historical data. This unit cost does not include contingencies.
2003 Interceptor and Trunk Sewer Heavy Cleaning Costs = $16.41 per linear foot
6.4.3 Sludge Removal An analysis of inspection reports on interceptor and trunk sewers by TYJT calculated that sludge removal and disposal for 30% of the system would cost approximately $1,867,043. These can be found in the CS-1158 report called Long Term CSO Plan for the Detroit and Rouge Rivers, 1996. This sludge removal is considered to be heavy cleaning and uses the costs from the historical data in Table A-2.
2003 Interceptor and Trunk Sewer Sludge Removal Costs = $16.41 per linear foot

Detroit Water and Sewerage Department Basis of Cost Estimates
September 2003 11
6.4.4 Sediment Testing A concern regarding the pipes in the DWSD system is that the buildup of sludge contains toxic materials, such as PCBs or mercury. This sludge should be removed and disposed of in a different manner than the current sewer jet / vacuum unit practices (washing sludge down the sewers to the WWTP). Sludge removal should therefore include a sampling station to test the sludge components and disposal of hazardous material in a landfill. Sludge amounts were obtained from inspection reports found in the CS-1158 report called Long Term CSO Plan for the Detroit and Rouge Rivers, 1996. The cost per truckload comes from CDM and assumes two tests, one each for PCBs and mercury, would be performed on each load.
2003 Interceptor and Trunk Sewer Sediment Testing Costs $200 per truck load (10 cu. yds.)
6.4.5 New Relief Sewers DWSD previously identified areas of the system where relief sewers were needed. These areas were defined in Status Report on Storm Relief Sewer Program, by DWSD, issued July 1975, reissued July 1978. The Wastewater Master Plan (WWMP) team has reviewed these relief sewers (Local Alternatives for SSO Control technical memorandum) and concluded that the following may be needed; pending further system inspections and cleaning:
7 Mile Road Relief o 7,920 ft. of 120” at depth of 30’ o 13,200 ft. of 120” at depth of 25’
Fenkell Relief o 7,920 ft. of 156” at depth of 25’ o 13,200 ft. of 192” at depth of 10’
Schoolcraft Relief o 10,560 ft. of 192” at depth of 15’
Hubbell Relief o 10,660 ft. of 144” at depth of 10’ o 7,920 ft. of 144” at depth of 20’
Joy / Clark Relief o 6,833 ft. of 192” at depth of 25’ o 27,216 ft. of 192” at depth of 15’ o 169 ft. of 120” at depth of 10’
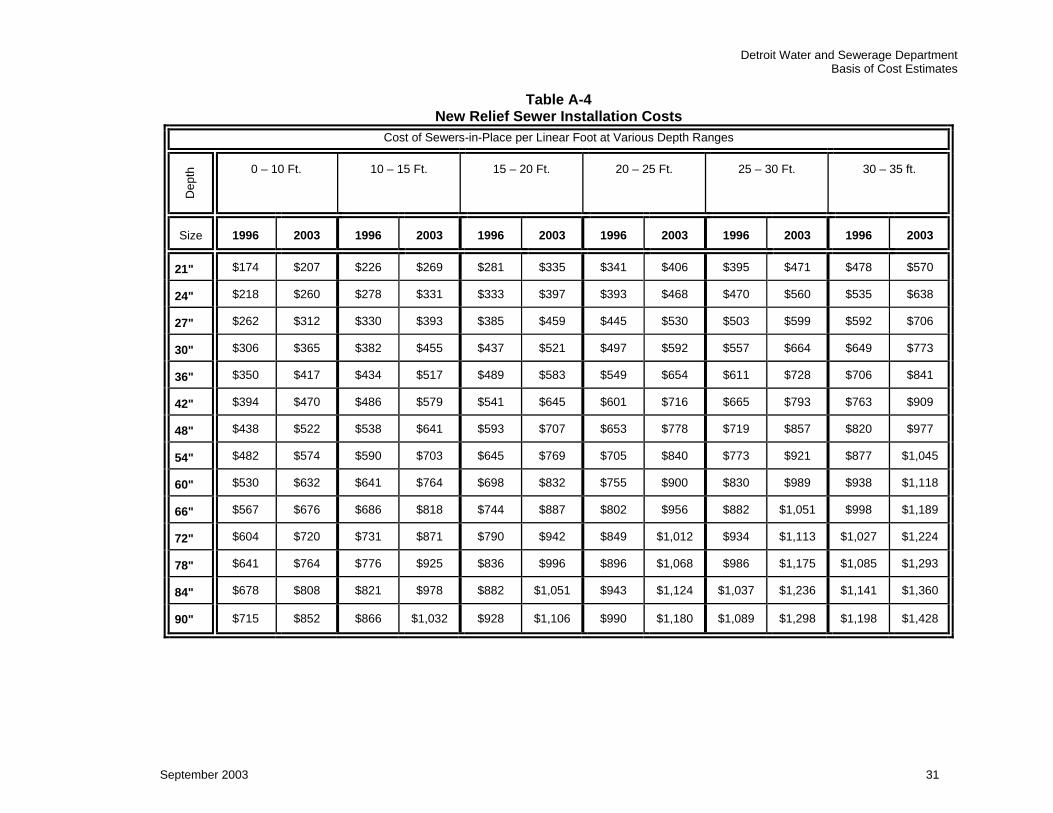
The cost of construction of relief sewers was estimated in 1978 and again in 1996 for the CS-1158 Long Term CSO Control Plan for the Detroit and Rouge Rivers, Volume 3, 10.04 C1 Alternative Evaluations (Table C.4 in Alternative 6). Table A-4 shows the 1996 estimates as well as the 2003 costs, derived by escalation using the CCI. The costs from this table used for the new relief sewer cost are shown here.
120” at depth of 10’ Costs = $1,289 per linear foot
120” at depth of 25’ Costs = $1,557 per linear foot

Detroit Water and Sewerage Department Basis of Cost Estimates
September 2003 12
120” at depth of 30’ Costs = $1,712 per linear foot
144” at depth of 10’ Costs = $1,389 per linear foot
144” at depth of 20’ Costs = $1,579 per linear foot
156” at depth of 25’ Costs = $1,938 per linear foot
192” at depth of 10’ to 15’ Costs = $2,399 per linear foot
192” at depth of 25’ Costs = $2,771 per linear foot
6.4.6 Future Modeling The CIP cost estimation has included future modeling of the DWSD sewer system. This modeling of data from the Segmented Facilities plan is scheduled to take place from 2008 to 2010. The estimate, from CDM, includes contingencies.
2003 Future Modeling Costs = $100,000
6.4.7 Oakwood Interceptor A cost estimate was prepared for the installation of a new redundant sewer system parallel to the Oakwood Interceptor section of the NW Interceptor. This estimate was performed by Tetra Tech MPS and can be found in the CS-1314 technical memorandum entitled Conceptual Plan for Oakwood Northwest Interceptor, revised May 2003. The estimate does not include contingencies.
2003 Oakwood Redundant Interceptor Costs = $8,700,000
6.4.8 Macomb Meter Stop Gates A project is proposed to install stop gates at meters CV-3 and MB-25 in Macomb County. The estimate, from SDA and found in the technical memorandum entitled Capital Improvement Programs for Macomb County, does not include contingencies.
2003 Stop Gate Installation Costs = $1,700,000 each
6.4.9 North Gratiot Interceptor This project will install the new North Gratiot Interceptor Sewer (NGIS) in Macomb County. The estimate, from SDA and found in the technical memorandum entitled Capital Improvement Program for Macomb County, includes contingencies.
2003 NGIS Installation Costs = $40,000,000
6.4.10 Northwest Interceptor Improvements This project includes improvements to the Northwest Interceptor Sewer (NWIS) from 8 Mile Road to the WWTP. This estimate was performed by Tetra Tech MPS and can

Detroit Water and Sewerage Department Basis of Cost Estimates
September 2003 13
be found in the technical memorandum entitled Conceptual Plan for Oakwood Northwest Interceptor. The estimate does not include contingencies.
2003 10’ Diameter Lining Costs = $1,000 per linear foot
2003 10’ Diameter Replacement Sewer Costs = $2,500 per linear foot
6.5 Subprogram No. 1E: Manholes and Catch Basin Improvements Inspection and repair of sewer structures in the DWSD system are required to ensure the system operates efficiently. Therefore, the CIP estimated costs for the inspection and repair of manholes and catch basins.
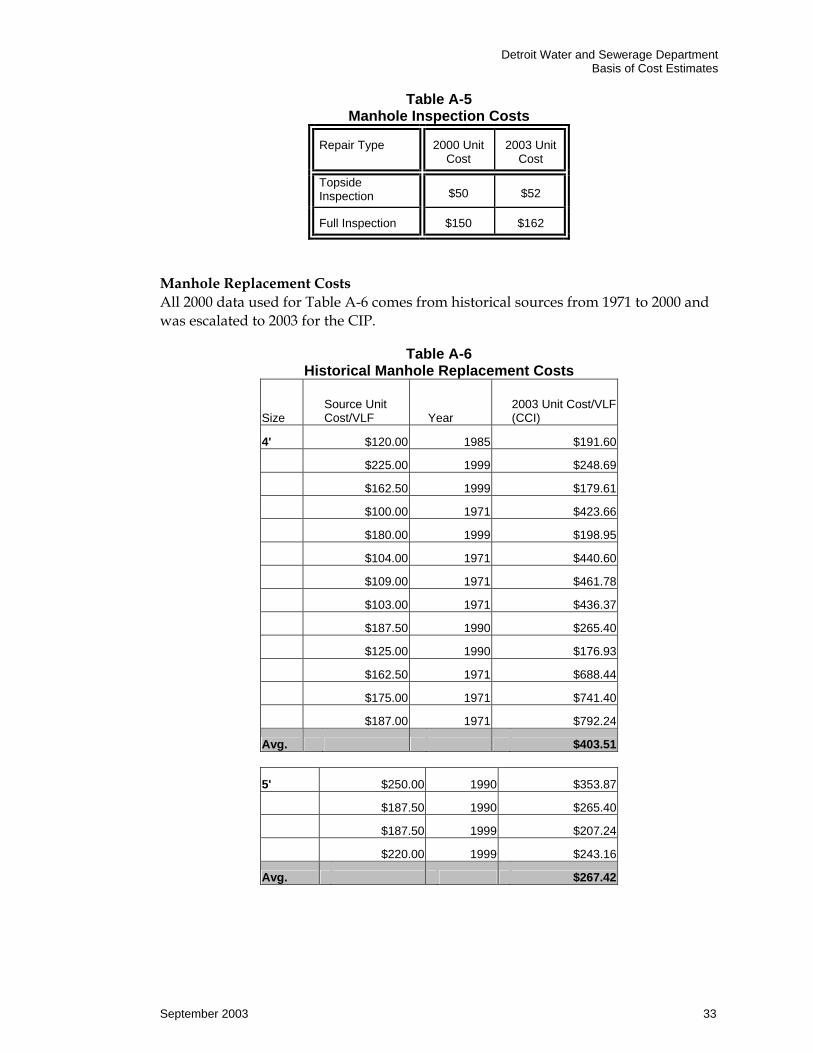
6.5.1 Manhole Inspections Manhole inspection consists of either topside inspection or full inspection. Table A-5 in Appendix A shows the estimate in unit cost per manhole inspection based on historical data. The CIP estimate for manhole inspections assumes 5% of the manholes in the system will undergo topside inspection every year. This unit cost does not include contingencies.
2003 Manhole Inspection Costs = $52 per structure
6.5.2 Manhole Repairs Manhole repairs can consist of:
Manhole wrapping External chemical grout Manhole shelf repair Manhole channel repair Pipe connection repair Raising / replacing manhole frames
Each repair is separate. The CIP estimate assumes that the quantity of manholes needing the above categories of repairs varies, with the amounts per inspection cycle as follows:
5% need manhole wrapping 8% need external chemical grout 10% need manhole shelf repair 10% need manhole channel repair 10% need pipe connection repair 15% need raising / replacing manhole frames
2003 Manhole Wrapping Costs = $215 per structure
2003 External Chemical Grouting Costs = $1,938 per structure
Detroit Water and Sewerage Department Basis of Cost Estimates
September 2003 14
2003 Manhole Shelf Repair Costs = $646 per structure
2003 Manhole Channel Repair Costs = $646 per structure
2003 Pipe Connection Repair Costs = $538 per structure
2003 Manhole Frame Replacement / Repair Costs = $646 per structure
6.5.3 Manhole Replacement Manhole installation (replacement) includes:
Pre-cast reinforced concrete manholes risers and cones, cast-in-place bases, frames, castings, steps
Excavation and backfill of common earth Sheeting, shoring, bracing and dewatering Up to 6” of bituminous pavement removal and replacement And furnishing of all incidentals.
Table A-6 in Appendix A shows the estimate in unit cost per vertical linear foot of installation based on historical information. This estimate for manhole replacement assumes that manholes are 4' in diameter and 15' deep and that 2% would need to be replaced for each inspection cycle (20 years). This unit cost does not include contingencies. 2003 Manhole Replacement Costs = $6,053 per manhole
6.5.4 Catch Basin Cleaning The CIP cost estimations assume that all 200,000 catch basins will be cleaned every cycle. Table A-7 in Appendix A shows the cost per catch basin. Catch basin cleaning includes labor, trucks, and disposal. This unit cost does not include contingencies.
2003 Catch Basin Cleaning Costs = $59 per catch basin
6.5.5 Catch Basin Repair The CIP cost estimation for catch basin repair assumes that the repairs will be pipe connection repair and frame replacement as shown in Section 6.5.2 for manholes. These unit costs do not include contingencies.
2003 Catch Basin Pipe Connection Repair Costs = $538 per catch basin 2003 Catch Basin Frame Replacement Costs = $646 per catch basin
6.6 Subprogram No. 1F: Regulators, Outfalls, Backwater Gates, Diversion Dams and In-System Storage 6.6.1 Outfall Flow Regulators Inspection Outfall regulator inspection includes inspection and report writing.

Detroit Water and Sewerage Department Basis of Cost Estimates
September 2003 15
The cost estimate assumes that a five-person crew can dive and inspect two outfall regulators each day. The cost per day for a five-person crew is $6,000/day, as shown in an invoice for the installation of backwater gate sensors for the Baby Creek outfall. It should be noted that some outfall regulators might cost more to inspect than others, depending on regulator accessibility and condition. This unit cost does not include contingencies.
2003 Outfall Regulator Inspection Costs = $3,000 per average outfall regulator
6.6.2 Outfall Flow Regulators Rehabilitation Outfall regulator rehabilitation includes cleaning and inspection of the regulator, float, and sump chamber; removal of existing regulator gates and associated components; removal of flap gates and sluice gates, rehabilitation of regulator, float; replacement of access manhole frames and covers; installation of new slide gates and flexible flap gates and temporary diversion of sewage flow.
Regulator rehabilitation was performed under Contract PC-695 Regulator / Remote Flow Control Structures and Dam Rehabilitation. This project rehabilitated 40 gates for a total cost of $7,708,000. The average cost of $192,700 per gate is rounded to $200,000 per gate. This contract ended in 2000, so the cost is escalated to $218,000 using a CCI escalation factor of 1.077. It should be noted that some outfall regulators might cost more to rehabilitate than others, depending on regulator accessibility and condition. This cost estimate includes any contingencies.
2003 Outfall Regulator Rehabilitation Costs = $218,000 per average outfall regulator
6.6.3 Outfall Flow Regulators Replacement Outfall regulator replacement includes the mechanical work described in the outfall regulator rehabilitation work described above and, additionally, replacement of the concrete regulator chamber.
As noted above, the cost for the mechanical equipment replacement is $218,000 per outfall regulator. It is assumed that the regulator junction chamber replacement costs would be similar to the influent junction chamber construction costs for the St. Aubin Screening and Disinfection Facility, Contract PC-731. The contractor has provided a detailed cost estimate, which indicates that the construction cost for this junction chamber would be $105,000. An additional $10,000 is added for destruction and removal of the existing regulator chamber. In summary, the regulator replacement costs are:
Installation of mechanical components = $218,000
Construction of new regulator chamber = $105,000
Destruction/removal of existing regulator chamber = $10,000
Total = $333,000

Detroit Water and Sewerage Department Basis of Cost Estimates
September 2003 16
Although the mechanical components portion includes some contingencies, the unit cost here does not include contingencies.
2003 Outfall Regulator Replacement Costs = $333,000 per average outfall regulator
6.6.4 Outfall, Backwater Gate, and Diversion Dam Inspection Outfall inspection includes inspection and report writing. Backwater gates and diversion dams are inspected at the same time as outfalls and do not require any additional costs. The cost estimate assumes that a five-person crew can dive and inspect two outfalls each day.
The cost per day for a five-person crew is $6,000/day as shown in an invoice for the installation of backwater gate sensors for the Baby Creek outfall. It should be noted that some outfalls might cost more to inspect than others, depending on outfall size, depth, number of conduits, and condition. This unit cost does not include contingencies.
2003 Outfall Inspection Costs = $3,000 per average outfall
6.6.5 Outfall Rehabilitation Outfall rehabilitation includes repair work at each outfall, as needed.
The cost estimate is based on outfall rehabilitation costs budgeted for the DWSD contract DWS 849/850, Inspection and In-place Rehabilitation of Outfalls. The cost for this project is $15,540,000 for rehabilitation of twelve outfalls. This results in an average cost of $1,295,000 per outfall. The cost shown is an average amount for all outfalls. Outfall rehabilitation costs can vary widely, because the work involved could range from nothing to significant structural repairs. This unit cost does include contingencies.
2003 Outfall Rehabilitation Costs = $1,295,000 per average outfall
6.6.6 Outfall Replacement Outfall replacement includes removal of the existing outfall and installation of a new outfall from the junction chamber to the river.
Outfall replacement costs are estimated based on the equivalent installation of a sewer line for the average size, length, and depth outfall. The average outfall calculations assume that outfalls with multiple barrels can be represented by a longer length of single barrel outfall. For example, a double barrel outfall with a length of 15 ft. can be considered a single barrel outfall with length 30 ft. Similarly, outfalls with box, egg, or arch shapes are converted to cylinders with equivalent diameters. For example, a 10 ft. x 10 ft. box sewer is considered equivalent to an 11.3 ft. diameter cylinder. These considerations are used to calculate the average length and diameter for all outfalls. The average outfall is 8.5 ft. in diameter and 1,280 ft. in length. Outfall depth is not readily available and is assumed to be 10 ft.

Detroit Water and Sewerage Department Basis of Cost Estimates
September 2003 17
The replacement cost for the average size and length outfall can then be calculated based on the cost of installation of a new sewer with these dimensions. The costs for sewer installation as a function of size and depth are displayed in Table A-4. This table indicates that the replacement cost for an 8.5 ft. diameter, 1,280 ft. long, and 10 ft. deep outfall would be about $12,600,000. It should be noted that outfall replacement costs would vary significantly because of differences in size, number of conduits, and depth below the surface. This unit cost does not include contingencies.
2003 Outfall Replacement Costs = $12,619,680 per average outfall
6.6.7 Backwater Gate Rehabilitation Backwater gate rehabilitation includes cleaning, leak repair, repair/replacement of rotted or deteriorated timber, and repair/replacement of hardware.
The estimated total cost for repair of twelve backwater gates under Contract CS-1158 Long Term CSO Control Plan for the Detroit and Rouge Rivers (1996) is $182,000. This results in an average cost of $15,200 per gate. This cost is then multiplied by a CCI escalation factor, resulting in an average 2003 cost of $18,100 per gate. This cost is then rounded to $20,000 for the estimate. Actual backwater gate rehabilitation costs will vary considerably depending on the condition and accessibility of the gate. This unit cost does include contingencies.
2003 Backwater Gate Rehabilitation Costs = $20,000 per average backwater gate
6.6.8 Backwater Gate Replacement Backwater gate replacement includes replacement of the backwater gates and associated stop logs.
The cost for installation of two backwater gates and associated stop logs at the St. Aubin Screening and Disinfection Facility is $336,000, according to the detailed cost breakdown for Contract PC-731 St. Aubin Screening and Disinfection Facility. It is assumed that removal of the existing gates and other site work would cost approximately $14,000. This results in a total cost of $350,000 for the installation of two gates at one location. There are 154 gates at 54 locations, or an average of 2.81 gates per location. It is assumed that the cost of gate replacement is proportional to the total number of gates. Hence, the cost for replacing all of the gates would be:
$350,000/ 2 gates * 154 gates/ all locations = $26,460,000
$26,460,000/ 54 locations = $490,000 per location
This cost was then multiplied by a CCI escalation factor to obtain a 2003 average cost of $517,000 per location. It should be noted that the cost at each location would vary based on the number and size of backwater gates and stop logs. This unit cost does not include contingencies.
2003 Backwater Gate Replacement Costs = $517,000 per average backwater gate
Detroit Water and Sewerage Department Basis of Cost Estimates
September 2003 18
6.6.9 Diversion Dam Rehabilitation Diversion dam rehabilitation includes cleaning and repair of deteriorated dam surfaces, restoration of connection between dam surface and bottom of flashboards, and repair/replacement of associated stop logs.
The needed repairs are identified in the CS-1314 Review of Collection System Regulators and Outfalls technical memorandum, revised May 2003. The cost for diversion dam rehabilitation is based on simple cost estimates for a three man crew working two days. The average cost for diversion dam rehabilitation based on three locations is $1,000 per dam. It should be noted that diversion dam rehabilitation costs will vary based on the size, type, and condition of the diversion dam. This unit cost does not include contingencies.
2003 Diversion Dam Rehabilitation Costs = $1,000 per average diversion dam
6.6.10 Diversion Dam Replacement Diversion dam replacement includes the installation of a new inflatable dam at the existing location. This cost also includes the cost of removing the existing diversion dam.
The cost for diversion dam replacement is based on the detailed cost breakdown for Contract PC-731 St. Aubin Screening and Disinfection Facility. The installation cost for an inflatable diversion dam, according to this contract, is $70,000. This cost is multiplied by a CCI escalation factor to get a 2003 installation cost of $74,000. It is assumed that there is an additional cost of $10,000 for destruction and removal of the existing diversion dam and other site work. The total cost for diversion dam replacement is $84,000 per dam. The cost of each diversion dam will vary based on dam size and accessibility. This unit cost does not include contingencies.
2003 Diversion Dam Replacement Costs = $84,000 per average diversion dam
6.6.11 In-System Storage Devices & System Gate Inspection In-system storage device (ISSD) inspection includes inspection and report writing. The cost estimate assumes that a three-person crew can inspect one ISSD each day. The cost for one three-person crew should be about $3,000. This unit cost does not include contingencies.
2003 ISSD Inspection Costs = $3,000 per ISSD
6.6.12 In-System Storage Devices & System Gate Rehabilitation ISSD rehabilitation includes removal of existing regulator gates and associated components; removal of existing operating systems for the regulator gates; installation of new slide gates with self-enclosed hydraulic operating systems; installation of instrumentation and control systems for remote operation of the slide gates from the SCC.

Detroit Water and Sewerage Department Basis of Cost Estimates
September 2003 19
This type of work was performed under Contract PC-695 Regulator / Remote Flow Control Structures and Dam Rehabilitation. This project rehabilitated 40 gates for a total cost of $7,708,000. The average cost of $192,700 per gate was rounded to $200,000 per gate. This contract ended in 2000, so the cost was then escalated to $218,000 using a construction cost escalation factor. It should be noted that some ISSDs cost more to rehabilitate than others, depending on ISSD type, accessibility, and condition. This unit cost does include contingencies.
2003 ISSD Rehabilitation Costs = $218,000 per ISSD
6.6.13 In-System Storage Devices & System Gate Replacement ISSD replacement includes removal of all existing ISSD mechanical, electrical, and instrumentation components and replacement with new components.
ISSD replacement costs are based on Contract PC-747 In-System Storage. Under this contract, thirteen new ISSDs were installed for a total cost of $26,400,000. This would result in an average cost of $2,030,000 per ISSD. It is assumed that this installation cost is comparable to the average ISSD replacement cost. It should be noted that ISSD replacement costs would vary depending on the size, type, and accessibility of the device. This unit cost does include contingencies.
2003 ISSD Replacement Costs = $2,030,000 per ISSD
6.7 Subprogram No. 1G: Pump Stations 6.7.1 Inspections Pump station inspection includes inspection of the structural condition of the station and wet well (if equipped), pump testing, and inspection of the instrumentation and control devices.
The pump station inspection costs are estimated to run about $1,000 per pump for testing, based on a cost breakdown from Contract PC-744 Wastewater Treatment Plant Rehabilitation and Program Management. It was assumed that it would take an engineer about 2.5 weeks to inspect the pump station and write a report. At $100 per hour, this would cost $10,000 per pump station. This unit cost does not include contingencies. In summary, pump station inspection costs include:
Pump testing = $1,000 per pump
Pump station inspection and report writing = $10,000 per pump station
2003 Pump Station Inspection Costs = $10,000 per pump station + $1,000 per pump
6.7.2 Rehabilitation Pump station rehabilitation includes pump and motor testing; station cleaning, painting, and repair; repair/replacement of damaged pump, motor, control panel parts; and minor pump station structural repairs.

Detroit Water and Sewerage Department Basis of Cost Estimates
September 2003 20
The pump station rehabilitation costs can be estimated based on the total pump station rehabilitation costs, estimated for Contract PC-744 Wastewater Treatment Plant Rehabilitation and Program Management. In the PC-744 report, the total cost for immediate, short-term, and long term rehabilitation; routine and long lead time spare parts: CMMS system; and motor repair/replacement was $7,737,500. It is assumed that this cost is representative of pump rehabilitation needs for each five-year interval. This cost does not include contingencies.
2003 Pump Station Rehabilitation Costs = $7,737,500 for rehabilitation of all pump stations
6.7.3 Major Rehabilitation Major rehabilitation of pump stations includes the capital cost of renovating a wastewater pump station, including all pumps and related equipment.
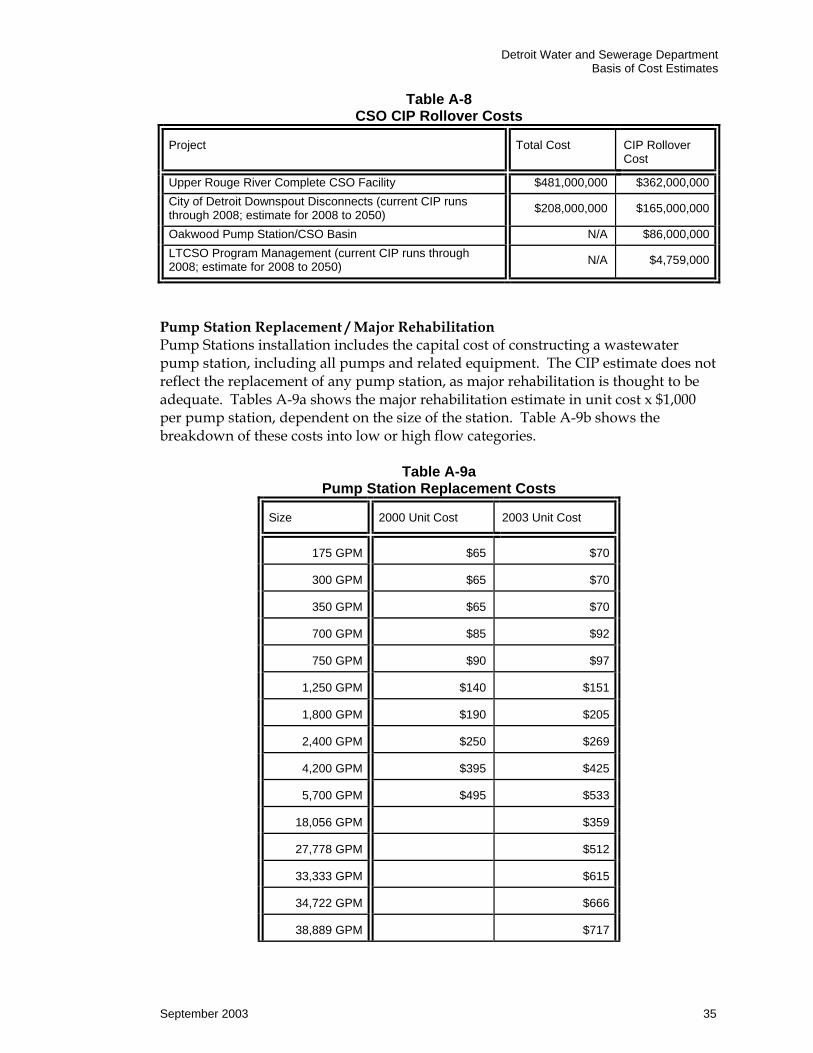
The cost for pump station major rehabilitation was estimated by CDM and for the Tetra Tech MPS alternatives development (technical memoranda Expanded Facilities within the City of Detroit, Technical Feasibility of Satellite Treatment, and Technical Feasibility of a Wet Weather Flow Treatment Facility) and is found in Table A-9a. Pump station major rehabilitation will vary considerably depending on pump station and wet well condition, number and capacity of pumps, and instrumentation and control requirements. Table A-9b shows the breakdown of these costs into low or high flow categories. The average flow of DWSD pump stations is more than 500 MGD, so the high flow cost is used for the CIP. This unit cost does not include contingencies.
2003 Pump Station Major Rehabilitation Costs (500 + MGD)= $20,000,000 for the average pump station
6.7.4 Energy Management The CIP estimates reflect the need for better energy management in terms of pumps at the pump stations. This is expected to be accomplished through the installation of variable-frequency drives (VFD) on these pumps. The CIP includes VFD installation at the Clintondale and Woodmere Pump Stations. The estimate, based on the technical memorandum entitled Energy Management, was made by TYJT and did not include contingencies. The following estimate has had contingencies added.
2003 Energy Management Costs (VFD installation at Clintondale and Woodmere) = $682,500
6.8 Subprogram No. 1H: Meters 6.8.1 Inspection and Maintenance Flow meter maintenance includes maintenance, repair and some replacement (mostly mechanical, but some structural) of current meters; billing and database management; and dye testing/flow accuracy. The costs shown are based on the maintenance budget for CS-1249 Greater Detroit Regional Sewer System Model – Billing Meter
Detroit Water and Sewerage Department Basis of Cost Estimates
September 2003 21
Program. This project maintains 50 meters with an annual budget of $2,000,000. This unit cost does include contingencies.
2003 Meter Maintenance Costs = $40,000/average meter
6.8.2 Replacement Flow meter replacement includes meter equipment and installation costs, as well as meter vault replacement. The CIP cost is based on a CDM estimate from the CS-1249 Greater Detroit Regional Sewer System Model – Billing Meter Program and is representative of the average meter. Meter replacement costs may vary considerably depending on the type and location of the meter. This unit cost does not include contingencies.
2003 Meter Replacement Costs = $500,000/average meter
6.8.3 Macomb Odor Control Some additional specific projects were included in the CIP estimation. These involve odor control measures at 12 Macomb County meter chambers through the installation of carbon adsorption units. The estimates are based on the CS-1292 Task Order Nos. 33 and 34 Final Draft Report that did not include contingencies. The following estimate has had contingencies added.
2003 Macomb County Odor Control Costs = $772,500
7. Program 2: CSO and SSO Control Program 7.1 Ongoing CIP Projects The WWMP CIP estimation has identified several projects included in the current CIP that have carry-over costs. These rollover CIP costs are as shown in Table A-8 and include any contingencies.
2003 Ongoing CIPRollover Costs = $617,759,000
7.2 New Projects The WWMP CIP estimation has identified some new CSO projects. These CIP costs are as shown below and include any contingencies. The Detroit River CSO is based on an estimate of $25,000,000 per outfall, assuming the construction of a screening and disinfection facility.
Table 2: New CSO Project Costs Project CIP Cost
Lower Rouge River Outfalls $25,000,000Detroit River CSO's – Upper Range $750,000,000Detroit River CSO's – Lower Range* $375,000,000
* Based on half as many outfalls constrd

Detroit Water and Sewerage Department Basis of Cost Estimates
September 2003 22
7.3 CSO Rehabilitation The WWMP also considered the rehabilitation of the CSO’s in the DWSD system. The upper range estimate assumes that the rehabilitation costs would be approximately 1% of the CSO construction costs. The table below shows the construction and CIP rehabilitation costs, without contingencies. It is assumed that each facility will be rehabilitated annually from 2008 to 2050. The lower range estimate assumes a yearly rehabilitation cost.
Table 3: Upper Range CSO Rehabilitation Costs Facility
Construction Cost
Rehabilitation Cost (each)
Conner Creek CSO $199,049,172 $1,990,492 Fox Creek CSO $11,582,891 $ 115,829 Leib CSO $31,327,898 $ 313,279 St. Aubin CSO $21,540,250 $ 215,403 Upper Rouge CSO $418,000,000 $4,180,000 Baby Creek CSO $50,389,000 $ 503,890 7 Mile CSO $17,638,861 $ 176,389 Fenkell CSO $22,281,777 $ 222,818 Hubbell Southfield CSO $67,975,783 $ 679,758 Belle Isle CSO $14,960,000 $ 149,600
2003 Lower Range CSO Rehab Costs = $6,000,000 per year
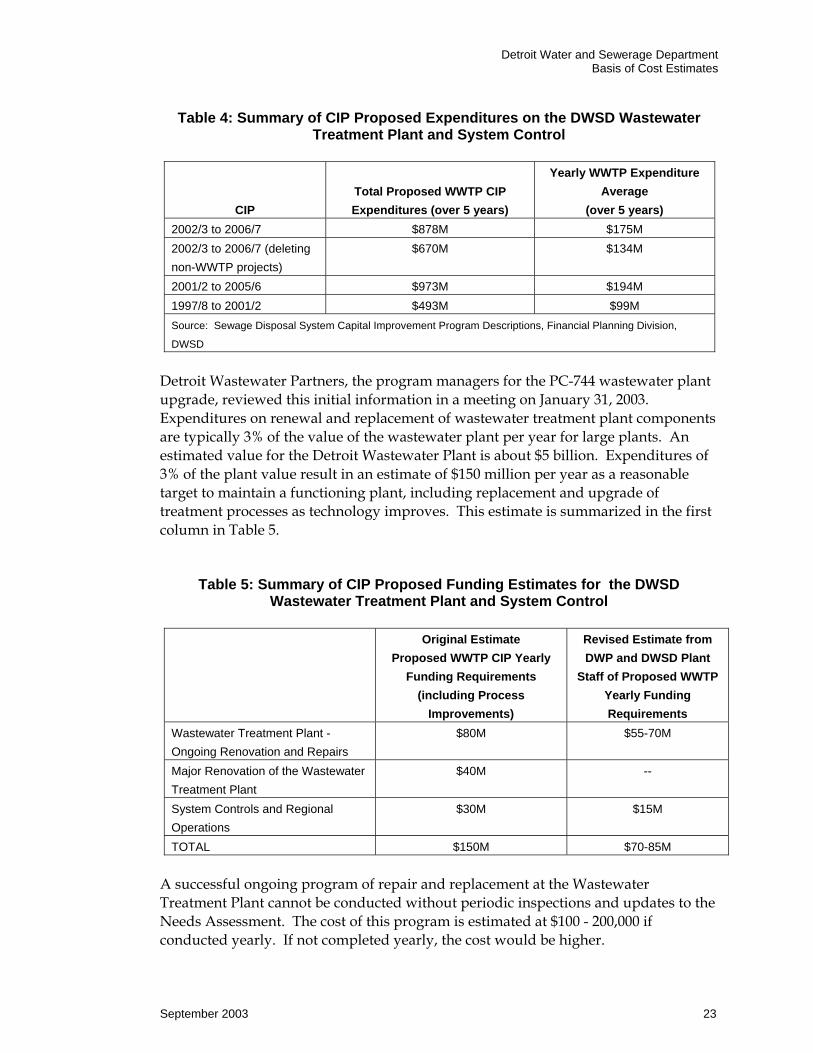
8 Program 3: System Control and Wastewater Treatment Program 8.1 Wastewater Treatment Plant Ongoing and Major Rehabilitation The DWSD Wastewater Treatment Plant (WWTP) is the largest facility in the DWSD sewer system. An overall assessment of funding needed for the Wastewater Treatment Plant Program was first estimated for planning purposes by summarizing the current yearly funding for wastewater treatment plant programs. This data is summarized in Table 6.1, and additional information is presented in Table A.11 in Appendix A. Table 4 shows that current proposed expenditures have increased from about $99 million from the 1997-2002 CIP to $175 million in the 2002-07 CIP. However, this amount includes many projects that are not directly related to the Wastewater Treatment Plant, such as work at system pump stations. Deleting these projects, the total is closer to $134 million per year.
Detroit Water and Sewerage Department Basis of Cost Estimates
September 2003 23
Table 4: Summary of CIP Proposed Expenditures on the DWSD Wastewater
Treatment Plant and System Control
CIP Total Proposed WWTP CIP Expenditures (over 5 years)
Yearly WWTP Expenditure Average
(over 5 years) 2002/3 to 2006/7 $878M $175M 2002/3 to 2006/7 (deleting non-WWTP projects)
$670M $134M
2001/2 to 2005/6 $973M $194M 1997/8 to 2001/2 $493M $99M Source: Sewage Disposal System Capital Improvement Program Descriptions, Financial Planning Division,
DWSD
Detroit Wastewater Partners, the program managers for the PC-744 wastewater plant upgrade, reviewed this initial information in a meeting on January 31, 2003. Expenditures on renewal and replacement of wastewater treatment plant components are typically 3% of the value of the wastewater plant per year for large plants. An estimated value for the Detroit Wastewater Plant is about $5 billion. Expenditures of 3% of the plant value result in an estimate of $150 million per year as a reasonable target to maintain a functioning plant, including replacement and upgrade of treatment processes as technology improves. This estimate is summarized in the first column in Table 5.
Table 5: Summary of CIP Proposed Funding Estimates for the DWSD Wastewater Treatment Plant and System Control
Original Estimate Proposed WWTP CIP Yearly
Funding Requirements (including Process
Improvements)
Revised Estimate from DWP and DWSD Plant
Staff of Proposed WWTP Yearly Funding Requirements
Wastewater Treatment Plant - Ongoing Renovation and Repairs
$80M $55-70M
Major Renovation of the Wastewater Treatment Plant
$40M --
System Controls and Regional Operations
$30M $15M
TOTAL $150M $70-85M A successful ongoing program of repair and replacement at the Wastewater Treatment Plant cannot be conducted without periodic inspections and updates to the Needs Assessment. The cost of this program is estimated at $100 - 200,000 if conducted yearly. If not completed yearly, the cost would be higher.

Detroit Water and Sewerage Department Basis of Cost Estimates
September 2003 24
For the 50-year Capital Improvements Program, the estimate of $150M for the Wastewater Treatment Plant and System Controls was used for assessing rate impacts, as it is a realistic (see Volume 5: Customer Service and Technical Support Program). Subsequently, in July 2003, a more detailed review of facility needs for the Wastewater Treatment Plant and System Controls by Detroit Wastewater Partners and the Wastewater Treatment Plant staff resulted in a revised estimate, shown in the second column in Table 5. Note that this estimate includes a much lower cost for ongoing renovations to System Controls. Also, this estimate does not include major renovations that would change the treatment process. The Detroit Wastewater Partner's estimate of yearly funding requirements was based on an assessment of the anticipated life and replacement cost of assets at the Wastewater Treatment Plant. This estimate is summarized in Table D.1 in Appendix D of this report. Background data from this analysis is included in the spreadsheets linked to Appendix D. Historical information summarizing expenditures on the plant over the last ten years was compared to the $150M estimate. Figure 1 shows the magnitude of the dramatic increase in project expenditures at the Wastewater Treatment Plant in the last four years to address the requirements of the Federal Court. Upgrades were required to treatment units that were last renovated more than 20 years ago. These upgrades did not include totally new treatment technologies. While this level of expenditure is not expected to continue indefinitely, the average level of expenditures over the next fifty years may approach $150M if new treatment technologies are required to replace the current system. This would become necessary if: 1) permit limits or other regulatory requirements change, or 2) if space constraints and growth in the amount of wastewater treated made expansion of the plant necessary. Even without these changes, another major renovation of the plant is likely 20 years after the current renovation, or in the decade 2020-2030. If only ongoing replacement and repair of the Wastewater Plant and System Controls is required, however, the estimated CIP requirements for the Wastewater Treatment Plant and System Controls may be considerably less.

Detroit Water and Sewerage Department Basis of Cost Estimates
September 2003 25
Figure 1
Detroit Wastewater Treatment Plant Capital Expenditures - 10 Years
$-
$50
$100
$150
$200
$250
1992-1993
1993-1994
1994-1995
1995-1996
1996-1997
1997-1998
1998-1999
1999-2000
2000-2001
2001-2002
Fiscal Year
Mill
ions

Detroit Water and Sewerage Department Basis of Cost Estimates
September 2003 26
Appendix A: Data Tables Used for CIP

Detroit Water and Sewerage Department Basis of Cost Estimates
September 2003 27
Appendix A – Data Tables Used for CIP The April 2002 version of this technical memo contained several tables that were used for the actual CIP cost estimates for the WWMP. These tables use 2000 costs, sometimes based on historical data escalated using the BCI instead of the CCI. The CIP estimates use 2003 data with CCI escalations. This section contains these original tables, as well as the recalculated tables. The sources listed in these tables are shown in table B-10 in section B.1.5.
Sewer Inspection Costs The only number from Table A-1 used for the CIP estimation is the unit cost for the 54-90” category. Table A-1 shows this data escalated using the CCI. The averages from the 2003 CCI category are used for the CIP.
Table A-1 Historical Sewer Inspection Costs
Size Source Unit
Cost/LF Year 2003 Unit Cost/LF
(CCI) Source
8" - 24" $1.30 1982 $2.28 5
$1.25 2000 $1.35 15
$0.80 1988 $1.19 8
$1.50 2000 $1.62 21
Avg. $1.61
27" - 48" $1.00 1999 $1.11 2
$2.25 1999 $2.49 11
$2.25 1996 $2.68 13
$2.00 2000 $2.15 21
Avg. $2.11
54" - 90" $3.00 2000 $3.23 21
$5.00 2000 $5.38 21
Avg. $4.31 Sewer Cleaning Costs All 2000 data used for Table A-2 comes from historical sources from 1988 to 2000. The averages from the 2003 CCI category are used for the CIP.

Detroit Water and Sewerage Department Basis of Cost Estimates
September 2003 28
Table A-2 Historical Sewer Cleaning Costs
Task Source Unit
Cost/LF Year 2003 Unit
Cost/LF (CCI) Source
Prep Cleaning $0.85 1988 $1.26 8
$1.25 2000 $1.35 15
$2.00 2000 $2.15 21
$3.00 2000 $3.23 21
$4.00 2000 $4.31 21
$5.00 2000 $5.38 21
Avg. $2.95
Heavy Cleaning $17.50 1999 $19.34 2
$12.00 2000 $12.92 20
$15.00 2000 $16.15 20
$16.00 2000 $17.23 20
Avg. $16.41
CIPP Lining Costs All 2000 data used for Table A-3 comes from historical sources from 1988 to 2000 and was escalated to 2000 using the BCI. The averages from the 2003 CCI category are used for the CIP.
Table A-3 Historical CIPP Lining Costs
Size Source Unit
Cost/LF Year 2003 Unit Cost/LF
(CCI) Source
8" $58.00 1982 $101.56 5
$60.00 1982 $105.07 5
$65.00 1999 $71.84 6
Avg. $92.82
10" $80.00 1999 $88.42 6
$86.00 1988 $127.47 8
Avg. $107.95

Detroit Water and Sewerage Department Basis of Cost Estimates
September 2003 29
Size Source Unit
Cost/LF Year 2003 Unit Cost/LF
(CCI) Source
12" $60.00 1982 $105.07 5
$95.00 1999 $105.00 6
$128.00 1988 $189.72 8
$94.00 1988 $139.33 8
Avg. $134.78
15" $128.00 1988 $189.72 8
$108.00 1988 $160.08 8
Avg. $174.90
18" $128.00 1988 $189.72 8
Avg. $189.72
21" $105.00 1982 $183.87 5
$230.00 2000 $247.64 20
Avg. $215.75
24" $163.00 1988 $241.60 8
$273.00 2000 $293.93 20
Avg. $267.76
27" $300.00 2000 $323.00 20
Avg. $323.00
30" $360.00 2000 $387.60 20
Avg. $387.60
36" $445.00 2000 $479.12 20
Avg. $479.12
42" $533.00 2000 $573.87 20
Avg. $573.87
48" $620.00 2000 $667.54 20
Avg. $667.54
Detroit Water and Sewerage Department Basis of Cost Estimates
September 2003 31
Table A-4 New Relief Sewer Installation Costs
Cost of Sewers-in-Place per Linear Foot at Various Depth Ranges
D
epth
0 – 10 Ft.
10 – 15 Ft.
15 – 20 Ft.
20 – 25 Ft.
25 – 30 Ft.
30 – 35 ft.
Size
1996
2003
1996
2003
1996
2003
1996
2003
1996
2003
1996
2003
21" $174 $207 $226 $269 $281 $335 $341 $406 $395 $471 $478 $570 24" $218 $260 $278 $331 $333 $397 $393 $468 $470 $560 $535 $638 27" $262 $312 $330 $393 $385 $459 $445 $530 $503 $599 $592 $706 30" $306 $365 $382 $455 $437 $521 $497 $592 $557 $664 $649 $773 36" $350 $417 $434 $517 $489 $583 $549 $654 $611 $728 $706 $841 42" $394 $470 $486 $579 $541 $645 $601 $716 $665 $793 $763 $909 48" $438 $522 $538 $641 $593 $707 $653 $778 $719 $857 $820 $977 54" $482 $574 $590 $703 $645 $769 $705 $840 $773 $921 $877 $1,045 60" $530 $632 $641 $764 $698 $832 $755 $900 $830 $989 $938 $1,118 66" $567 $676 $686 $818 $744 $887 $802 $956 $882 $1,051 $998 $1,189 72" $604 $720 $731 $871 $790 $942 $849 $1,012 $934 $1,113 $1,027 $1,224 78" $641 $764 $776 $925 $836 $996 $896 $1,068 $986 $1,175 $1,085 $1,293 84" $678 $808 $821 $978 $882 $1,051 $943 $1,124 $1,037 $1,236 $1,141 $1,360 90" $715 $852 $866 $1,032 $928 $1,106 $990 $1,180 $1,089 $1,298 $1,198 $1,428

Detroit Water and Sewerage Department Basis of Cost Estimates
September 2003 32
Cost of Sewers-in-Place per Linear Foot at Various Depth Ranges
D
epth
0 – 10 Ft.
10 – 15 Ft.
15 – 20 Ft.
20 – 25 Ft.
25 – 30 Ft.
30 – 35 ft.
Size
1996
2003
1996
2003
1996
2003
1996
2003
1996
2003
1996
2003
96" $753 $897 $911 $1,086 $974 $1,161 $1,037 $1,236 $1,140 $1,359 $1,254 $1,495 102" $953 $1,136 $1,018 $1,213 $1,084 $1,292 $1,181 $1,408 $1,299 $1,548 108" $995 $1,186 $1,063 $1,267 $1,131 $1,348 $1,222 $1,456 $1,344 $1,602 114" $1,037 $1,236 $1,107 $1,319 $1,178 $1,404 $1,263 $1,505 $1,389 $1,655 120" $1,081 $1,288 $1,153 $1,374 $1,225 $1,460 $1,306 $1,557 $1,437 $1,713 132" $1,123 $1,338 $1,197 $1,427 $1,272 $1,516 $1,372 $1,635 $1,509 $1,798 144" $1,165 $1,388 $1,245 $1,484 $1,325 $1,579 $1,439 $1,715 $1,583 $1,887 156" $1,407 $1,677 $1,497 $1,784 $1,626 $1,938 $1,789 $2,132 168" $1,590 $1,895 $1,692 $2,017 $1,837 $2,189 $2,022 $2,410 180" $1,797 $2,142 $1,912 $2,279 $2,076 $2,474 $2,285 $2,723 192" $2,013 $2,399 $2,141 $2,552 $2,325 $2,771 $2,559 $3,050 204" $2,254 $2,686 $2,398 $2,858 $2,604 $3,103 $2,866 $3,416
Detroit Water and Sewerage Department Basis of Cost Estimates
September 2003 33
Table A-5 Manhole Inspection Costs
Repair Type
2000 Unit
Cost
2003 Unit
Cost
Topside Inspection
$50
$52
Full Inspection
$150
$162
Manhole Replacement Costs All 2000 data used for Table A-6 comes from historical sources from 1971 to 2000 and was escalated to 2003 for the CIP.
Table A-6 Historical Manhole Replacement Costs
Size Source Unit Cost/VLF Year
2003 Unit Cost/VLF (CCI)
4' $120.00 1985 $191.60
$225.00 1999 $248.69
$162.50 1999 $179.61
$100.00 1971 $423.66
$180.00 1999 $198.95
$104.00 1971 $440.60
$109.00 1971 $461.78
$103.00 1971 $436.37
$187.50 1990 $265.40
$125.00 1990 $176.93
$162.50 1971 $688.44
$175.00 1971 $741.40
$187.00 1971 $792.24
Avg. $403.51
5' $250.00 1990 $353.87
$187.50 1990 $265.40
$187.50 1999 $207.24
$220.00 1999 $243.16
Avg. $267.42

Detroit Water and Sewerage Department Basis of Cost Estimates
September 2003 34
Size Source Unit Cost/VLF Year
2003 Unit Cost/VLF (CCI)
6' $290.00 1999 $320.53
$212.50 1999 $234.87
Avg. $277.70
7' $260.00 1998 $294.17
$350.00 1998 $396.00
$187.50 1985 $299.37
$250.00 1985 $399.17
$370.00 1999 $408.95
Avg. $359.53
8' $1,187.50 1999 $1,312.52
$950.00 1996 $1,132.22
Avg. $1,222.37 The manhole replacement for the CIP assumes the average manhole is 4' in diameter and 15' deep. This calculates as follows: Each manhole installation = $403.51 X 15 = $6,052.65
Table A-7 Catch Basin Cleaning Costs
Item
Quantity
Unit
Cost
Total
Per Year
Labor Cost 33 each $50 per hour $3,432,000 $3,432,000 Truck Cost 12 each $350,000 $4,200,000 $420,000 Disposal Cost 66,667 each $1 $66,667 $66,667
Cost per Catch Basin $59
Detroit Water and Sewerage Department Basis of Cost Estimates
September 2003 35
Table A-8 CSO CIP Rollover Costs
Project
Total Cost
CIP Rollover Cost
Upper Rouge River Complete CSO Facility $481,000,000 $362,000,000City of Detroit Downspout Disconnects (current CIP runs through 2008; estimate for 2008 to 2050) $208,000,000 $165,000,000
Oakwood Pump Station/CSO Basin N/A $86,000,000LTCSO Program Management (current CIP runs through 2008; estimate for 2008 to 2050) N/A $4,759,000
Pump Station Replacement / Major Rehabilitation Pump Stations installation includes the capital cost of constructing a wastewater pump station, including all pumps and related equipment. The CIP estimate does not reflect the replacement of any pump station, as major rehabilitation is thought to be adequate. Tables A-9a shows the major rehabilitation estimate in unit cost x $1,000 per pump station, dependent on the size of the station. Table A-9b shows the breakdown of these costs into low or high flow categories.
Table A-9a Pump Station Replacement Costs
Size
2000 Unit Cost
2003 Unit Cost
175 GPM
$65
$70
300 GPM
$65
$70
350 GPM
$65
$70
700 GPM
$85
$92
750 GPM
$90
$97
1,250 GPM
$140
$151
1,800 GPM
$190
$205
2,400 GPM
$250
$269
4,200 GPM
$395
$425
5,700 GPM
$495
$533
18,056 GPM
$359
27,778 GPM
$512
33,333 GPM
$615
34,722 GPM
$666
38,889 GPM
$717

Detroit Water and Sewerage Department Basis of Cost Estimates
September 2003 36
Size
2000 Unit Cost
2003 Unit Cost
49,000 GPM
$1,080
$2,380
59,722 GPM
$1,127
66,667 GPM
$1,229
78,472 GPM
$1,434
700,000 GPM
$12,000
$12,920
Table A-9b
Pump Station Replacement Costs Size
2003 Unit Cost
0 - 500 GPM $1,567,000
500 + GPM $20,000,000

Detroit Water and Sewerage Department Basis of Cost Estimates
September 2003 37
Appendix B: Data Tables Not Used for CIP

Detroit Water and Sewerage Department Basis of Cost Estimates
September 2003 38
Appendix B – Data Tables Not Used for CIP The April 2002 version of this technical memo contained several tables that were not used for the actual CIP cost estimates for the WWMP. The CIP either used different data sources or did not include the categories covered in these tables.
B.1 Alternate Data Category Tables B.1.1 Chemical Grouting of Joints Chemical Grouting of Joints consists of utilizing chemical products to eliminate leaks in pipe joints. The estimate includes mobilization, set up, and furnishing of all incidentals. The estimate is shown and is in unit cost per pipe joint. All 2000 data used for Table B-1 comes from historical sources from 1982 to 1999 and was escalated to 2003 using the CCI.
Table B-1 Historical Chemical Grouting of Joints Costs
Size Source Unit Cost/Joint Year
2003 Unit Cost/Joint (CCI) Source
All $60.00 1985 $95.80 1
$35.00 1982 $61.29 5
$24.00 1988 $35.57 8
$35.00 1999 $38.68 11
$35.00 1996 $41.71 13
Avg. $54.61 B.1.2 Sliplining Sliplining is considered to be a light rehabilitation method. Sliplining installation includes:
Installation of HPDE Pipe into existing sewer pipe Excavation and backfill of insertion pits in common earth Annular space grouting Mobilization Sewer preparation And furnishing of all incidentals.
The service life of Sliplining is 50 years. Sizes are the ID of the Slipliner pipe; for example, to reline a 20” sewer, use the cost for the 16” Slipliner. The estimate in Table B-2 is unit cost x $1,000 per mile of installation.

Detroit Water and Sewerage Department Basis of Cost Estimates
September 2003 39
Table B-2 Sliplining Costs
Size
2003 Unit Cost / Mile
4” $20 6” $50 8” $90 10” $130 12” $190 14” $230
16” $290 18” $370 20” $460 22” $560 24” $660 26” $780 28” $900 30” $1,040 32” $1,180 36” $1,490 42” $2,030 48” $2,650 52” $3,060 54” $3,360
B.1.3 Sewer Pipe Replacement It has been determined that the improvements to the DWSD sewer system would not include the replacement of any sewer pipes. However, the costs for the construction of new sewers were investigated. The results of this investigation follow. Note that the costs included in these tables (Table B-3 through B-13) are the recommended costs from Table 5.1-1.
Ductile Iron Force Main Ductile Iron Force Main installation includes:
Cement lined ductile iron pipe (6-24") Excavation and backfill of common earth 3 – 3.5 feet of cover to crown of the pipe Minimum utility relocation Up to 6” of bituminous pavement removal and replacement Furnishing of all incidentals.

Detroit Water and Sewerage Department Basis of Cost Estimates
September 2003 40
Table B-3 shows the ductile iron force main installation estimate in unit cost x $1,000 per mile of pipe installation, escalated using the CCI. The service life of ductile iron force mains is 30 years.
Table B-3 Historical New Ductile Iron Force Main Installation Costs
Size
Source Unit Cost/LF Year 2003 Unit Cost/LF (CCI) Source
4" $10.00 1985 $15.97 1
$15.00 1985 $23.95 1
Avg. $19.96
6" $16.00 1985 $25.55 1
$19.00 1985 $30.34 1
$27.00 2000 $29.07 10
$18.40 1971 $77.95 14
$16.00 1971 $67.78 14
Avg. $46.14
8" $30.00 2000 $32.30 10
Avg. $32.30
10" $33.00 2000 $35.53 10
Avg. $35.53
12" $37.00 2000 $39.84 10
$16.00 1971 $67.78 14
$28.00 1990 $39.63 16
Avg. $49.09
14" $41.00 2000 $44.14 10
Avg. $44.14
16" $45.00 2000 $48.45 10
Avg. $48.45

Detroit Water and Sewerage Department Basis of Cost Estimates
September 2003 41
Size
Source Unit Cost/LF Year 2003 Unit Cost/LF (CCI) Source
18" $42.00 1990 $59.45 16
Avg. $59.45
20" $53.00 2000 $57.06 10
$47.50 1971 $201.24 14
Avg. $129.15
24" $60.00 2000 $64.60 10
Avg. $64.60
48" $107.00 2000 $115.20 10
Avg. $115.20 Service Leads Service Lead installation includes:
6" SDR 35 PVC pipe and fittings Excavation and backfill of common earth Min. 4’ cover to crown of the pipe Tie-in to existing sewer Reseeding Furnishing of all incidentals.
Table B-4 shows the estimate for service lead installation in unit cost per foot of pipe with the historical data escalated using the CCI. The service life of service leads is 25 years.
Table B-4 Historical New Service Lead Installation Costs
Size Source unit Cost/LF Year
2003 Unit Cost/LF (CCI) Source
6" $14.00 1971 $59.31 14
$15.60 1971 $66.09 14
Avg. $62.70

Detroit Water and Sewerage Department Basis of Cost Estimates
September 2003 42
Sanitary Laterals Sanitary Lateral installation includes:
Plain concrete pipe (8-12") Excavation and backfill of common earth, including trench shield or box 48” diameter manholes at 300 feet Minimum utility relocation Up to 6” of bituminous pavement removal and replacement Furnishing of all incidentals.
Table B-5 shows the estimate for sanitary laterals in unit cost x $1,000 per mile of pipe installation, with the historical data escalated using the CCI. The service life of sanitary laterals is 50 years.
Table B-5 Historical New Sanitary Lateral Installation Costs
Size Source Unit Cost/LF Year
2003 Unit Cost/LF (CCI) Source
8" $22.50 1985 $35.92 1
$35.00 1999 $38.68 6
$29.00 1971 $122.86 14
$26.00 1971 $110.15 14
$25.40 1971 $107.61 14
$32.60 1971 $138.11 14
$35.00 1990 $49.54 16
$35.00 1990 $49.54 19
Avg. $77.06
10" $24.00 1985 $38.32 1
$25.00 1985 $39.92 1
$40.00 1999 $44.21 6
$56.00 2000 $60.29 10
$30.00 1971 $127.10 14
$57.00 1971 $241.48 14
Avg. $91.89
12" $55.00 1999 $60.79 6
$45.00 1990 $63.70 16
Avg. $62.24

Detroit Water and Sewerage Department Basis of Cost Estimates
September 2003 43
Storm and Combined Laterals Storm and combined lateral installation includes:
Reinforced concrete pipe (12-24") Excavation and backfill of common earth Sheeting, shoring and bracing. Trench shield or box at 8’ 48” Diameter manholes at 300 feet Min. bury to the crown of the pipe as listed below Minimum utility relocation Up to 6” of bituminous pavement removal and replacement And furnishing of all incidentals.
Tables B-6 shows the estimates for storm and combined laterals in unit cost x $1,000 per mile of pipe installation at various depths, with the historical data escalated using the CCI. However, the depth of installation is unknown. The service life of storm and combined laterals is 50 years.
Table B-6 Historical New Storm and Combined Lateral Installation Costs
Size Source Unit
Cost/LF Year 2003 Unit Cost/LF
(CCI) Source
12" $25.00 1985 $39.92 1
$30.00 1985 $47.90 1
$45.00 1989 $65.31 9
$61.00 2000 $65.68 10
$43.50 1971 $184.29 14
$39.00 1971 $165.23 14
$27.00 1990 $38.22 16
$48.90 1971 $207.17 14
$45.00 1990 $63.70 16
$45.00 1990 $63.70 19
$27.00 1990 $38.22 19
Avg. $81.61
15" $27.50 1985 $43.91 1
$67.00 2000 $72.14 10
$49.00 1971 $207.59 14
$33.75 1990 $47.77 16
$56.25 1990 $79.62 16
$33.75 1990 $47.77 19

Detroit Water and Sewerage Department Basis of Cost Estimates
September 2003 44
Size Source Unit
Cost/LF Year 2003 Unit Cost/LF
(CCI) Source
15" $56.25 1990 $79.62 19
$31.00 1999 $34.26 11
Avg. $68.08
18" $30.00 1985 $47.90 1
$73.00 2000 $78.60 10
$32.55 1990 $46.07 16
$40.50 1990 $57.33 16
$40.50 1990 $57.33 19
$67.50 1990 $95.54 19
Avg. $63.79
21" $80.00 2000 $86.13 10
$52.00 1971 $220.30 14
$48.00 1971 $203.35 14
$47.00 1971 $199.12 14
$47.25 1990 $66.88 16
$47.20 1990 $66.81 19
Avg. $140.43
24" $88.00 2000 $94.75 10
$54.00 1971 $228.77 14
$50.60 1971 $214.37 14
$44.30 1990 $62.71 16
$54.00 1990 $76.44 19
$54.00 1990 $76.44 16
Avg. $125.58 Trunk Sewers Trunk Sewer installation includes:
Reinforced concrete pipe (27-66") Excavation and backfill of common earth Sheeting, shoring and bracing. Manholes at 300 feet. Diameters as follows:
o Pipe size 27” – 36”; 60” diameter manholes

Detroit Water and Sewerage Department Basis of Cost Estimates
September 2003 45
o Pipe size 42”- 48”; 72” diameter manholes o Pipe size 54” – 66”; 84” diameter manholes
Min. bury to the crown of the pipe as listed below Minimum utility relocation Up to 6” of bituminous pavement removal and replacement And furnishing of all incidentals
Table B-7 shows the estimates in unit cost x $1,000 per mile of pipe installation at various depths, with the historical data escalated using the CCI. However, the depth of installation is unknown. The service life of trunk sewers is 50 years.
Table B-7 Historical New Trunk Sewer Installation Costs
Size Source Unit Cost/LF Year 2003 Unit Cost/LF (CCI) Source
27" $96.00 2000 $103.36 10
$50.00 1971 $211.83 14
Avg. $157.59
30" $104.00 2000 $111.97 10
$135.00 1996 $160.90 13
Avg. $136.43
36" $93.00 1982 $162.85 5
$275.00 1998 $311.14 3
$275.00 1997 $316.21 7
$270.00 1999 $298.43 11
$145.00 1996 $172.81 13
Avg. $252.29
42" $290.00 1997 $333.46 7
$330.00 1999 $364.74 11
$132.00 2000 $142.12 10
Avg. $280.11
48" $300.00 1997 $344.96 7
$285.00 1999 $315.00 11
Avg. $329.98
Size Source Unit Cost/LF Year 2003 Unit Cost/LF (CCI) Source
54" $310.00 1997 $356.46 7

Detroit Water and Sewerage Department Basis of Cost Estimates
September 2003 46
Avg. $356.46
60" $340.00 1997 $390.96 7
Avg. $390.96
66" $470.00 1998 $531.77 3
$500.00 1998 $565.71 3
Avg. $548.74 Interceptors / Tunnels Interceptor / tunnel installation includes:
Reinforced concrete pipe (78-120") Excavation and backfill of common earth Sheeting, shoring and bracing 8’ Diameter manholes at 600 feet Min. bury to the crown of the pipe as listed below Minimum utility relocation Up to 6” of bituminous pavement removal and replacement And furnishing of all incidentals.
Table B-8 shows the estimates in unit cost x $1,000 per mile of pipe installation at various depths, with the historical data escalated using the CCI. However, the depth of installation is unknown. The service life of interceptors / tunnels is 50 years.
Table B-8 Historical New Interceptors / Tunnels Installation Costs
Size Source Unit Cost/LF Year 2003 Unit Cost/LF (CCI) Source
78" $600.00 1998 $678.85 3
Avg. $678.85
84" $620.00 1998 $701.48 3
Avg. $701.48
96" $700.00 1998 $791.99 3
Avg. $791.99
Size Source Unit Cost/LF Year 2003 Unit Cost/LF (CCI) Source
102" $750.00 1998 $848.56 3

Detroit Water and Sewerage Department Basis of Cost Estimates
September 2003 47
Avg. $848.56
108" 800.00 1998 $905.14 3
Avg. $905.14
120" $900.00 1985 $1,437.00 1
Avg. $1,437.00
B.1.4 Miscellaneous Repairs This cost estimating technical memorandum reviewed the costs for various sewer system repairs that were not scheduled or included in the WWMP CIP development. This section contains the results of this repair cost review.
Sump Pump Disconnection Sump Pump Disconnection consists of removal of sump, valves electrical connections and restoration. These costs, in unit cost per connection, are estimated at $6,720 in 2000 dollars. Root Control Root Control consists of utilizing chemical methods. The estimate includes mobilization, set up, and furnishing of all incidentals. Table B-9 shows the estimate in unit cost per linear foot of pipe, with the historical data escalated using the CCI.
Table B-9 Historical Root Control Costs
Size Source Unit
Cost/LF Year 2003 Unit Cost/LF (CCI) Source
All $2.00 1982 $3.50 5
$2.00 1988 $2.96 8
$1.40 1989 $2.03 9
$2.00 2000 $2.15 20
$2.25 2000 $2.42 20
$2.75 2000 $2.96 20
Avg. $2.67
B.1.5 Historical References Shown on each spreadsheet is a reference code to the source of individual unit prices. Table B-10 shows the references used for the historical estimates in Appendices A and B.

Detroit Water and Sewerage Department Basis of Cost Estimates
September 2003 48
Table B-10 Historical References
Source Title Date
1 Unidentified CDM Documents 1985
2 Beaconsfield Relief Sewer Cleaning, Manholes Inspection for South Macomb Sanitary District 1999
3 SOCSDS Project Plan 1998
4 Cost Effective Analysis 1998
5 Grosse Pointe Infrastructure 1982
6 City of Rochester Hills / SDA 1999
7 HRC Detailed Cost Estimates 1997
8 Beverly Hills Local Sewer Study / Rehabilitation Program 1988
9 Unidentified CDM Documents 1989
10 Unidentified Construction Cost Estimate
11 South Macomb Sanitary District 1999
12 City of Rochester Hills Sanitary Sewer Evaluation Survey 1996
13 South Macomb Sanitary District, Appendix J 1996
14 Clinton-Oakland Sewage Disposal System 1971
15 City of Hazel Park, MI
16 Farmington, MI, Sewer Seperation / Improvements 1990
17 Basic Requirements Report Evergreen-Farmington Relief 1985
18 Cost Estimate 1975
19 Pre-Rehabilitation Local Sewer Costs 1990
20 Ann Arbor SSO Prevention Task Force 2000
B.1.6 Means and Manufacturers’ Estimates The calculation of construction costs using the R.W. Means methodology requires prices for component materials and construction activities (i.e. excavation or backfilling). The following table presents the component costs used in the development of construction cost guidelines.

Detroit Water and Sewerage Department Basis of Cost Estimates
September 2003 49
Table B-11 Component Costs for Means and Manufacturers’ Estimates
Item Size Description Unit Cost Units Source
Excavation Excavation, common earth, hauling away fill up to 4 mi. $15.49 CY Means
Backfill Common earth, front-end loader, Compaction 12" lifts $8.82 CY Means
Select Fill Crushed bank run gravel, compaction 6" lifts $26.50 CY Means
Sheeting 8' Deep Wood solid sheeting incl. Wales, braces and spacers. Drive & Extract $6.68 SF Means
16' Deep Wood solid sheeting incl. Wales, braces and spacers. Drive & Extract $8.76 SF Means
24' Deep Wood solid sheeting incl. Wales, braces and spacers. Drive & Extract $10.74 SF Means
32" Deep Wood solid sheeting incl. Wales, braces and spacers. Drive & Extract $11.99 SF Means
Pavement Removal Bituminous 4" to 6" thick $5.72 SY Means
Saw Cutting Asphalt 6" thick $2.81 LF Means
Pavement Replacement Over Trench 6" thick $43.33 SY Means
Non-Reinforced Concrete Pipe 8" Bell and Spigot Joints, Extra strength $12.31 LF Means
10" Bell and Spigot Joints, Extra strength $13.05 LF Means
12" Bell and Spigot Joints, Extra strength $14.80 LF Means
Reinforced Concrete Pipe 12" Class 3, B&S or T&G Joints, w/gaskets $18.90 LF Means
15" Class 3, B&S or T&G Joints, w/gaskets $21.67 LF Means
18" Class 3, B&S or T&G Joints, w/gaskets $25.36 LF Means

Detroit Water and Sewerage Department Basis of Cost Estimates
September 2003 50
Item Size Description Unit Cost Units Source
Reinforced Concrete Pipe 21" Class 3, B&S or T&G Joints, w/o gaskets $31.35 LF Means
24" Class 3, B&S or T&G Joints, w/gaskets $35.04 LF Means
27" Class 3, B&S or T&G Joints, w/o gaskets $53.02 LF Means
30" Class 3, B&S or T&G Joints, w/gaskets $65.92 LF Means
36" Class 3, B&S or T&G Joints, w/gaskets $89.90 LF Means
42" Class 3, B&S or T&G Joints, w/o gaskets $92.20 LF Means
48" Class 3, B&S or T&G Joints, w/gaskets $131.85 LF Means
54" Class 3, B&S or T&G Joints, w/gaskets $148.45 LF Means
60" Class 3, B&S or T&G Joints, w/o gaskets $165.04 LF Means
66" Class 3, B&S or T&G Joints, w/o gaskets $230.04 LF Means
72" Class 3, B&S or T&G Joints, w/gaskets $295.04 LF Means
78" Class 3, B&S or T&G Joints, w/o gaskets $325.00 LF Means
84" Class 3, B&S or T&G Joints, w/o gaskets $354.97 LF Means
96" Class 3, B&S or T&G Joints, w/gaskets $437.95 LF Means
102" Class 3, B&S or T&G Joints, w/o gaskets $460.00 LF Means
108" Class 3, B&S or T&G Joints, w/o gaskets $483.00 LF Means
120" Class 3, B&S or T&G Joints, w/o gaskets $530.00 LF Means

Detroit Water and Sewerage Department Basis of Cost Estimates
September 2003 51
Item Size Description Unit Cost Units Source
Ductile Iron Pipe 4" Class 50, Cement Lined, Mech. Joint $19.82 LF Means
6" Class 50, Cement Lined, Mech. Joint $23.05 LF Means
8" Class 50, Cement Lined, Mech. Joint $28.12 LF Means
10" Class 50, Cement Lined, Mech. Joint $34.58 LF Means
12" Class 50, Cement Lined, Mech. Joint $41.03 LF Means
14" Class 50, Cement Lined, Mech. Joint $46.56 LF Means
16" Class 50, Cement Lined, Mech. Joint $56.70 LF Means
18" Class 50, Cement Lined, Mech. Joint $67.31 LF Means
20" Class 50, Cement Lined, Mech. Joint $77.45 LF Means
24" Class 50, Cement Lined, Mech. Joint $99.58 LF Means
48" Class 50, Cement Lined, Mech. Joint $232.34 LF Est.
PVC Pipe (SDR35) 6" SDR 35, B&S $5.12 LF Means
6" SDR 35, B&S 45 Degree Bend $73.76 LF Means
HDPEPipe for Sliplining 4" HDPE Pipe, PE3408, DR21 (80 psi), price installed. $4.42 LF Manufact.
6" HDPE Pipe, PE3408, DR21 (80 psi), price installed. $9.58 LF Manufact.
8" HDPE Pipe, PE3408, DR21 (80 psi), price installed. $16.23 LF Manufact.
10" HDPE Pipe, PE3408, DR21 (80 psi), price installed. $25.21 LF Manufact.
12" HDPE Pipe, PE3408, DR21 (80 psi), price installed. $35.47 LF Manufact.

Detroit Water and Sewerage Department Basis of Cost Estimates
September 2003 52
Item Size Description Unit Cost Units Source
HDPEPipe for Sliplining 14" HDPE Pipe, PE3408, DR21 (80 psi), price installed. $42.76 LF Manufact.
16" HDPE Pipe, PE3408, DR21 (80 psi), price installed. $55.86 LF Manufact.
18" HDPE Pipe, PE3408, DR21 (80 psi), price installed. $70.69 LF Manufact.
20" HDPE Pipe, PE3408, DR21 (80 psi), price installed. $87.28 LF Manufact.
22" HDPE Pipe, PE3408, DR21 (80 psi), price installed. $105.60 LF Manufact.
24" HDPE Pipe, PE3408, DR21 (80 psi), price installed. $125.67 LF Manufact.
26" HDPE Pipe, PE3408, DR21 (80 psi), price installed. $147.49 LF Manufact.
28" HDPE Pipe, PE3408, DR21 (80 psi), price installed. $171.06 LF Manufact.
30" HDPE Pipe, PE3408, DR21 (80 psi), price installed. $196.37 LF Manufact.
32" HDPE Pipe, PE3408, DR21 (80 psi), price installed. $223.42 LF Manufact.
36" HDPE Pipe, PE3408, DR21 (80 psi), price installed. $282.77 LF Manufact.
42" HDPE Pipe, PE3408, DR21 (80 psi), price installed. $384.88 LF Manufact.
48" HDPE Pipe, PE3408, DR21 (80 psi), price installed. $502.70 LF Manufact.
52" HDPE Pipe, PE3408, DR21 (80 psi), price installed. $578.69 LF Manufact.
54" HDPE Pipe, PE3408, DR21 (80 psi), price installed. $636.23 LF Manufact.
Manholes 4' Dia. Precast Concrete, not incl. Excav, backfill, frame, cover, sheeting $179.79 VLF Means
5' Dia. Precast Concrete, not incl. Excav, backfill, frame, cover, sheeting $188.09 VLF Means

Detroit Water and Sewerage Department Basis of Cost Estimates
September 2003 53
Item Size Description Unit Cost Units Source
Manholes 6' Dia. Precast Concrete, not incl. Excav, backfill, frame, cover, sheeting $285.82 VLF Means
7' Dia. Precast Concrete, not incl. Excav, backfill, frame, cover, sheeting $383.55 VLF Means
8' Dia. Precast Concrete, not incl. Excav, backfill, frame, cover, sheeting $481.28 VLF Means
B.1.7 Mean’s Unit Cost Estimates Table B-12 contains a sample estimating sheet for calculating each component cost using the material and labor costs identified in the previous section.

Detroit Water and Sewerage Department Basis of Cost Estimates
September 2003 54
Table B-12 Sample Component Costs Estimator
Quick Sewer Estimator
Force Mains
Dimensions
Pipe Size 14 in.
Trench Width 4 Ft. not less than 3.2
Trench Depth 6 Ft.
Length 1 Ft.
Material Costs
Pipe Cost/LF 66 $/LF
Excav. Cost/CY 13 $/CY
Backfill Cost/ CY 10 $/CY
Select Fill Cost/CY 12 $/CY
Pavament Demo.Cost / SY 7 $/SY
New Pavement Cost / SY 29 $/SY
Saw Cut Per LF 4 $/LF
Sheeting Cost / SF * 0 $/SF
* May not be required for excavations under 5' deep
Pavement A (sy)= 0.44
Vexcav (cy) = Vbfill (cy) =
0.89 0.49
Hbfill (ft)
Sheeting (sf) Common Fill 3.33333
12
Vsfill (cy) =
0.36 Hsfill (ft)
Select Fill 2.66667
W (ft) = 4
Total Costs

Detroit Water and Sewerage Department Basis of Cost Estimates
September 2003 55
Pipe $66.00
Excav. $6.22
Backfill $4.94
Select Fill $4.27
Pavement Demo $3.11
New Pavement $12.89
Saw Cut $8.00
Sheeting Cost $0.00
Total Price $105.43
Price Per Foot $105.43 /LF

Detroit Water and Sewerage Department Basis of Cost Estimates
September 2003 56
Appendix C: Unit Costs for Treatment Facilities
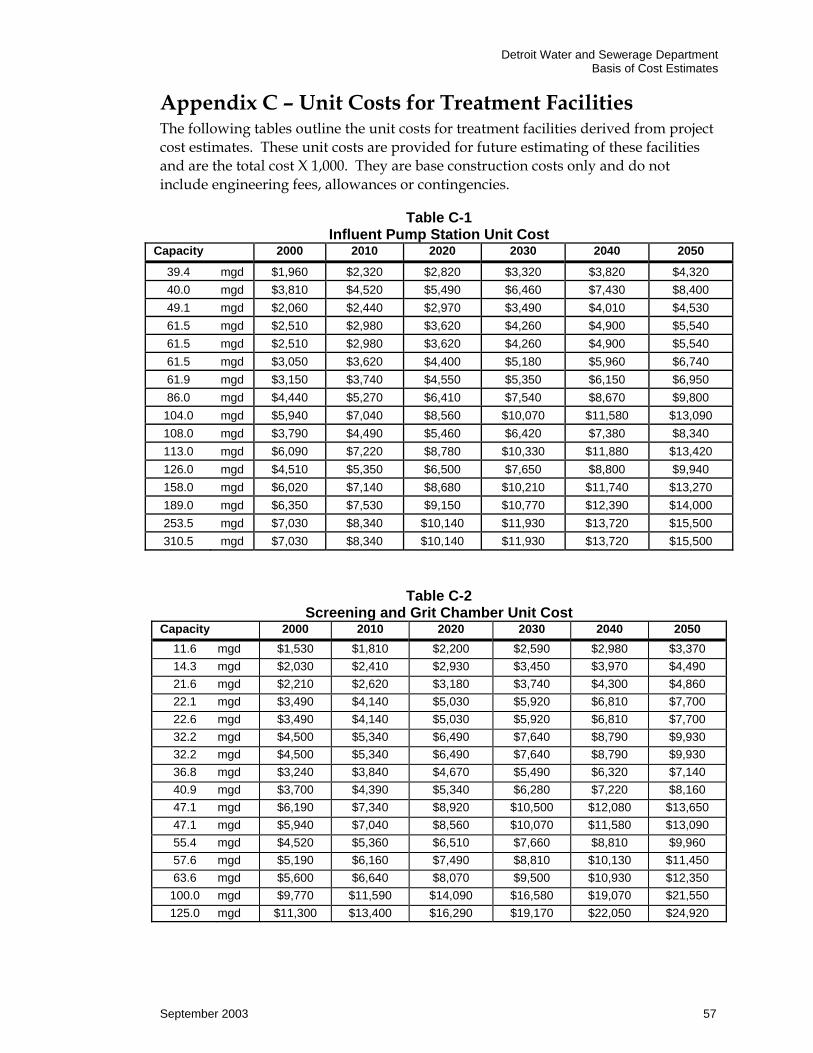
Detroit Water and Sewerage Department Basis of Cost Estimates
September 2003 57
Appendix C – Unit Costs for Treatment Facilities The following tables outline the unit costs for treatment facilities derived from project cost estimates. These unit costs are provided for future estimating of these facilities and are the total cost X 1,000. They are base construction costs only and do not include engineering fees, allowances or contingencies.
Table C-1 Influent Pump Station Unit Cost
Capacity 2000 2010 2020 2030 2040 2050
39.4 mgd $1,960 $2,320 $2,820 $3,320 $3,820 $4,320 40.0 mgd $3,810 $4,520 $5,490 $6,460 $7,430 $8,400 49.1 mgd $2,060 $2,440 $2,970 $3,490 $4,010 $4,530 61.5 mgd $2,510 $2,980 $3,620 $4,260 $4,900 $5,540 61.5 mgd $2,510 $2,980 $3,620 $4,260 $4,900 $5,540 61.5 mgd $3,050 $3,620 $4,400 $5,180 $5,960 $6,740 61.9 mgd $3,150 $3,740 $4,550 $5,350 $6,150 $6,950 86.0 mgd $4,440 $5,270 $6,410 $7,540 $8,670 $9,800
104.0 mgd $5,940 $7,040 $8,560 $10,070 $11,580 $13,090 108.0 mgd $3,790 $4,490 $5,460 $6,420 $7,380 $8,340 113.0 mgd $6,090 $7,220 $8,780 $10,330 $11,880 $13,420 126.0 mgd $4,510 $5,350 $6,500 $7,650 $8,800 $9,940 158.0 mgd $6,020 $7,140 $8,680 $10,210 $11,740 $13,270 189.0 mgd $6,350 $7,530 $9,150 $10,770 $12,390 $14,000 253.5 mgd $7,030 $8,340 $10,140 $11,930 $13,720 $15,500 310.5 mgd $7,030 $8,340 $10,140 $11,930 $13,720 $15,500
Table C-2 Screening and Grit Chamber Unit Cost
Capacity 2000 2010 2020 2030 2040 2050 11.6 mgd $1,530 $1,810 $2,200 $2,590 $2,980 $3,370 14.3 mgd $2,030 $2,410 $2,930 $3,450 $3,970 $4,490 21.6 mgd $2,210 $2,620 $3,180 $3,740 $4,300 $4,860 22.1 mgd $3,490 $4,140 $5,030 $5,920 $6,810 $7,700 22.6 mgd $3,490 $4,140 $5,030 $5,920 $6,810 $7,700 32.2 mgd $4,500 $5,340 $6,490 $7,640 $8,790 $9,930 32.2 mgd $4,500 $5,340 $6,490 $7,640 $8,790 $9,930 36.8 mgd $3,240 $3,840 $4,670 $5,490 $6,320 $7,140 40.9 mgd $3,700 $4,390 $5,340 $6,280 $7,220 $8,160 47.1 mgd $6,190 $7,340 $8,920 $10,500 $12,080 $13,650 47.1 mgd $5,940 $7,040 $8,560 $10,070 $11,580 $13,090 55.4 mgd $4,520 $5,360 $6,510 $7,660 $8,810 $9,960 57.6 mgd $5,190 $6,160 $7,490 $8,810 $10,130 $11,450 63.6 mgd $5,600 $6,640 $8,070 $9,500 $10,930 $12,350
100.0 mgd $9,770 $11,590 $14,090 $16,580 $19,070 $21,550 125.0 mgd $11,300 $13,400 $16,290 $19,170 $22,050 $24,920

Detroit Water and Sewerage Department Basis of Cost Estimates
September 2003 58
Table C-3 Aeration Basin with Nitrification Unit Cost
Capacity 2000 2010 2020 2030 2040 2050 11.3 mgd $10,400 $12,330 $14,990 $17,640 $20,290 $22,930 14.0 mgd $11,200 $13,280 $16,140 $18,990 $21,840 $24,680 21.1 mgd $17,300 $20,520 $24,940 $29,350 $33,760 $38,150 21.1 mgd $17,300 $20,520 $24,940 $29,350 $33,760 $38,150 21.1 mgd $16,000 $18,980 $23,070 $27,150 $31,230 $35,290 30.8 mgd $22,600 $26,800 $32,570 $38,320 $44,080 $49,810 30.8 mgd $22,600 $26,800 $32,570 $38,320 $44,080 $49,810 35.9 mgd $24,200 $28,700 $34,880 $41,040 $47,210 $53,350 40.0 mgd $22,600 $26,800 $32,570 $38,320 $44,080 $49,810 45.0 mgd $32,300 $38,310 $46,560 $54,780 $63,010 $71,200 45.0 mgd $31,800 $37,710 $45,830 $53,930 $62,040 $70,110 54.0 mgd $35,300 $41,860 $50,880 $59,870 $68,870 $77,830 56.3 mgd $36,800 $43,640 $53,040 $62,410 $71,790 $81,130 62.2 mgd $39,300 $46,610 $56,650 $66,660 $76,680 $86,650
Table C-4 Primary Clarifiers Unit Cost
Capacity 2000 2010 2020 2030 2040 2050 11.6 mgd $1,530 $1,810 $2,200 $2,590 $2,980 $3,370 14.3 mgd $2,030 $2,410 $2,930 $3,450 $3,970 $4,490 21.6 mgd $2,210 $2,620 $3,180 $3,740 $4,300 $4,860 22.1 mgd $3,490 $4,140 $5,030 $5,920 $6,810 $7,700 22.6 mgd $3,490 $4,140 $5,030 $5,920 $6,810 $7,700 32.2 mgd $4,500 $5,340 $6,490 $7,640 $8,790 $9,930 32.2 mgd $4,500 $5,340 $6,490 $7,640 $8,790 $9,930 36.8 mgd $3,240 $3,840 $4,670 $5,490 $6,320 $7,140 40.9 mgd $3,700 $4,390 $5,340 $6,280 $7,220 $8,160 47.1 mgd $6,190 $7,340 $8,920 $10,500 $12,080 $13,650 47.1 mgd $5,940 $7,040 $8,560 $10,070 $11,580 $13,090 55.4 mgd $4,520 $5,360 $6,510 $7,660 $8,810 $9,960 57.6 mgd $5,190 $6,160 $7,490 $8,810 $10,130 $11,450 63.6 mgd $5,600 $6,640 $8,070 $9,500 $10,930 $12,350 100.0 mgd $9,770 $11,590 $14,090 $16,580 $19,070 $21,550 125.0 mgd $11,300 $13,400 $16,290 $19,170 $22,050 $24,920
Table C-5
Complete Mix Activated Sludge Unit Cost Capacity 2000 2010 2020 2030 2040 2050
100 mgd $21,800 $25,850 $31,420 $36,970 $42,530 $48,060 125 mgd $25,300 $30,000 $36,460 $42,900 $49,350 $55,770

Detroit Water and Sewerage Department Basis of Cost Estimates
September 2003 59
Table C-6 Iron Feed System Unit Cost
Capacity 2000 2010 2020 2030 2040 2050 11.3 mgd $152 $180 $220 $260 $300 $340 14.0 mgd $152 $180 $220 $260 $300 $340 21.1 mgd $152 $180 $220 $260 $300 $340 21.1 mgd $152 $180 $220 $260 $300 $340 21.1 mgd $152 $180 $220 $260 $300 $340 30.8 mgd $156 $190 $230 $270 $310 $350 30.8 mgd $156 $190 $230 $270 $310 $350 35.9 mgd $175 $210 $260 $310 $360 $410 40.0 mgd $164 $190 $230 $270 $310 $350 45.0 mgd $182 $220 $270 $320 $370 $420 45.0 mgd $182 $220 $270 $320 $370 $420 54.0 mgd $208 $250 $300 $350 $400 $450 56.3 mgd $189 $220 $270 $320 $370 $420 62.2 mgd $197 $230 $280 $330 $380 $430
100.0 mgd $205 $240 $290 $340 $390 $440 125.0 mgd $225 $270 $330 $390 $450 $510
Table C-7
Coagulation-Flocculation Unit Cost Capacity 2000 2010 2020 2030 2040 2050
100 mgd $19,700 $23,360 $28,390 $33,410 $38,430 $43,430 125 mgd $24,100 $28,580 $34,740 $40,880 $47,020 $53,130
Table C-8
Secondary Clarifiers Unit Cost Capacity 2000 2010 2020 2030 2040 2050
11.3 mgd $3,050 $3,620 $4,400 $5,180 $5,960 $6,740 14.0 mgd $3,800 $4,510 $5,480 $6,450 $7,420 $8,380 21.1 mgd $4,430 $5,250 $6,380 $7,510 $8,640 $9,760 21.1 mgd $4,430 $5,250 $6,380 $7,510 $8,640 $9,760 21.1 mgd $4,870 $5,780 $7,030 $8,270 $9,510 $10,750 30.8 mgd $5,800 $6,880 $8,360 $9,840 $11,320 $12,790 30.8 mgd $5,800 $6,880 $8,360 $9,840 $11,320 $12,790 35.9 mgd $7,120 $8,440 $10,260 $12,070 $13,880 $15,680 40.0 mgd $6,280 $7,450 $9,050 $10,650 $12,250 $13,840 45.0 mgd $8,070 $9,570 $11,630 $13,680 $15,740 $17,790 45.0 mgd $8,070 $9,570 $11,630 $13,680 $15,740 $17,790 54.0 mgd $10,400 $12,330 $14,990 $17,640 $20,290 $22,930 56.3 mgd $11,500 $13,640 $16,580 $19,510 $22,440 $25,360 62.2 mgd $12,400 $14,710 $17,880 $21,040 $24,200 $27,350
100.0 mgd $13,700 $16,250 $19,750 $23,240 $26,730 $30,210 125.0 mgd $15,200 $18,030 $21,910 $25,780 $29,650 $33,510
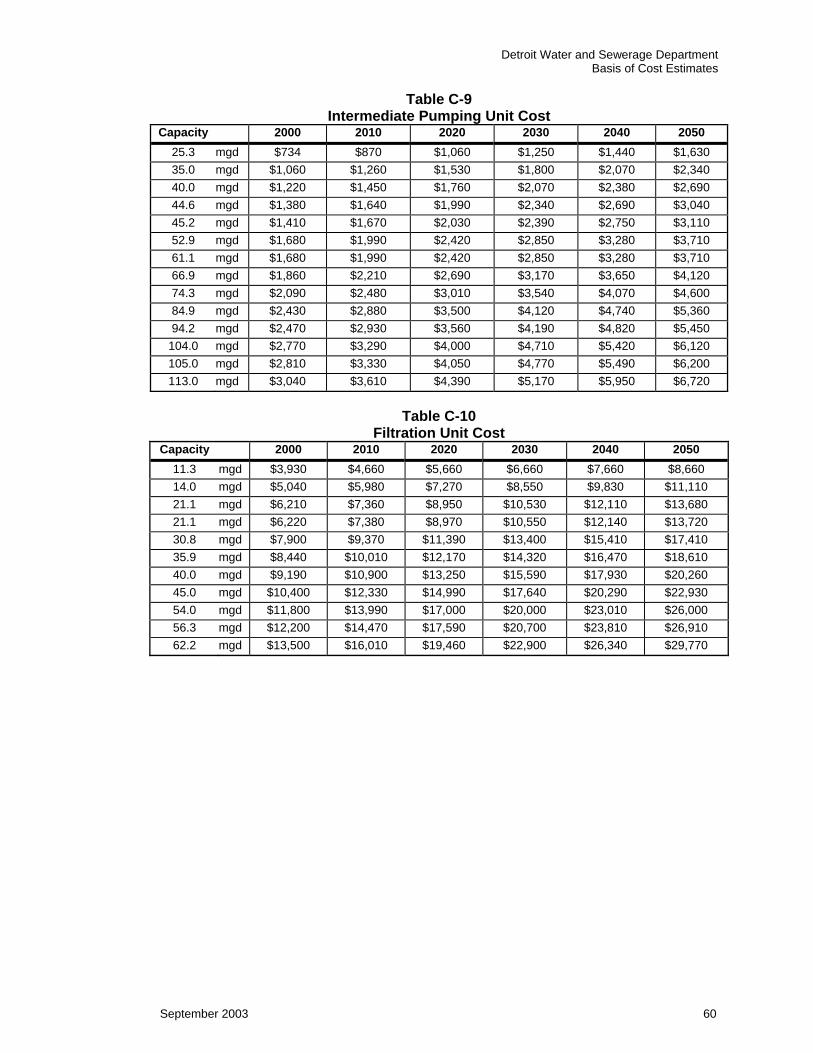
Detroit Water and Sewerage Department Basis of Cost Estimates
September 2003 60
Table C-9 Intermediate Pumping Unit Cost
Capacity 2000 2010 2020 2030 2040 2050 25.3 mgd $734 $870 $1,060 $1,250 $1,440 $1,630 35.0 mgd $1,060 $1,260 $1,530 $1,800 $2,070 $2,340 40.0 mgd $1,220 $1,450 $1,760 $2,070 $2,380 $2,690 44.6 mgd $1,380 $1,640 $1,990 $2,340 $2,690 $3,040 45.2 mgd $1,410 $1,670 $2,030 $2,390 $2,750 $3,110 52.9 mgd $1,680 $1,990 $2,420 $2,850 $3,280 $3,710 61.1 mgd $1,680 $1,990 $2,420 $2,850 $3,280 $3,710 66.9 mgd $1,860 $2,210 $2,690 $3,170 $3,650 $4,120 74.3 mgd $2,090 $2,480 $3,010 $3,540 $4,070 $4,600 84.9 mgd $2,430 $2,880 $3,500 $4,120 $4,740 $5,360 94.2 mgd $2,470 $2,930 $3,560 $4,190 $4,820 $5,450
104.0 mgd $2,770 $3,290 $4,000 $4,710 $5,420 $6,120 105.0 mgd $2,810 $3,330 $4,050 $4,770 $5,490 $6,200 113.0 mgd $3,040 $3,610 $4,390 $5,170 $5,950 $6,720
Table C-10
Filtration Unit Cost Capacity 2000 2010 2020 2030 2040 2050
11.3 mgd $3,930 $4,660 $5,660 $6,660 $7,660 $8,660 14.0 mgd $5,040 $5,980 $7,270 $8,550 $9,830 $11,110 21.1 mgd $6,210 $7,360 $8,950 $10,530 $12,110 $13,680 21.1 mgd $6,220 $7,380 $8,970 $10,550 $12,140 $13,720 30.8 mgd $7,900 $9,370 $11,390 $13,400 $15,410 $17,410 35.9 mgd $8,440 $10,010 $12,170 $14,320 $16,470 $18,610 40.0 mgd $9,190 $10,900 $13,250 $15,590 $17,930 $20,260 45.0 mgd $10,400 $12,330 $14,990 $17,640 $20,290 $22,930 54.0 mgd $11,800 $13,990 $17,000 $20,000 $23,010 $26,000 56.3 mgd $12,200 $14,470 $17,590 $20,700 $23,810 $26,910 62.2 mgd $13,500 $16,010 $19,460 $22,900 $26,340 $29,770

Detroit Water and Sewerage Department Basis of Cost Estimates
September 2003 61
Table C-11 Ultraviolet Disinfection Unit Cost
Capacity 2000 2010 2020 2030 2040 2050 25.9 mgd $912 $1,080 $1,310 $1,540 $1,770 $2,000 35.1 mgd $1,280 $1,520 $1,850 $2,180 $2,510 $2,840 40.0 mgd $1,530 $1,810 $2,200 $2,590 $2,980 $3,370 45.2 mgd $2,040 $2,420 $2,940 $3,460 $3,980 $4,500 45.2 mgd $3,310 $3,930 $4,780 $5,620 $6,460 $7,300 45.2 mgd $1,750 $2,080 $2,530 $2,980 $3,430 $3,880 61.9 mgd $1,750 $2,080 $2,530 $2,980 $3,430 $3,880 61.9 mgd $2,280 $2,700 $3,280 $3,860 $4,440 $5,020 67.9 mgd $2,550 $3,020 $3,670 $4,320 $4,970 $5,620 86.0 mgd $3,830 $4,540 $5,520 $6,500 $7,480 $8,450 86.0 mgd $3,060 $3,630 $4,410 $5,190 $5,970 $6,750 95.6 mgd $3,400 $4,030 $4,900 $5,770 $6,640 $7,500
103.6 mgd $3,830 $4,540 $5,520 $6,500 $7,480 $8,450 112.6 mgd $4,100 $4,860 $5,910 $6,950 $7,990 $9,030 175.0 mgd $8,270 $9,810 $11,920 $14,030 $16,140 $18,240 200.0 mgd $8,620 $10,220 $12,420 $14,610 $16,810 $19,000
Table C-12 Post Aeration Unit Cost
Capacity 2000 2010 2020 2030 2040 2050 11.3 mgd $114 $140 $170 $200 $230 $260 14.0 mgd $134 $160 $190 $220 $250 $280 21.1 mgd $142 $170 $210 $250 $290 $330 21.1 mgd $142 $170 $210 $250 $290 $330 21.1 mgd $167 $200 $240 $280 $320 $360 30.8 mgd $182 $220 $270 $320 $370 $420 30.8 mgd $182 $220 $270 $320 $370 $420 35.9 mgd $260 $310 $380 $450 $520 $590 40.0 mgd $273 $320 $390 $460 $530 $600 45.0 mgd $237 $280 $340 $400 $460 $520 45.0 mgd $237 $280 $340 $400 $460 $520 54.0 mgd $363 $430 $520 $610 $700 $790 56.3 mgd $358 $420 $510 $600 $690 $780 62.2 mgd $388 $460 $560 $660 $760 $860
100.0 mgd $455 $540 $660 $780 $900 $1,020 125.0 mgd $554 $660 $800 $940 $1,080 $1,220
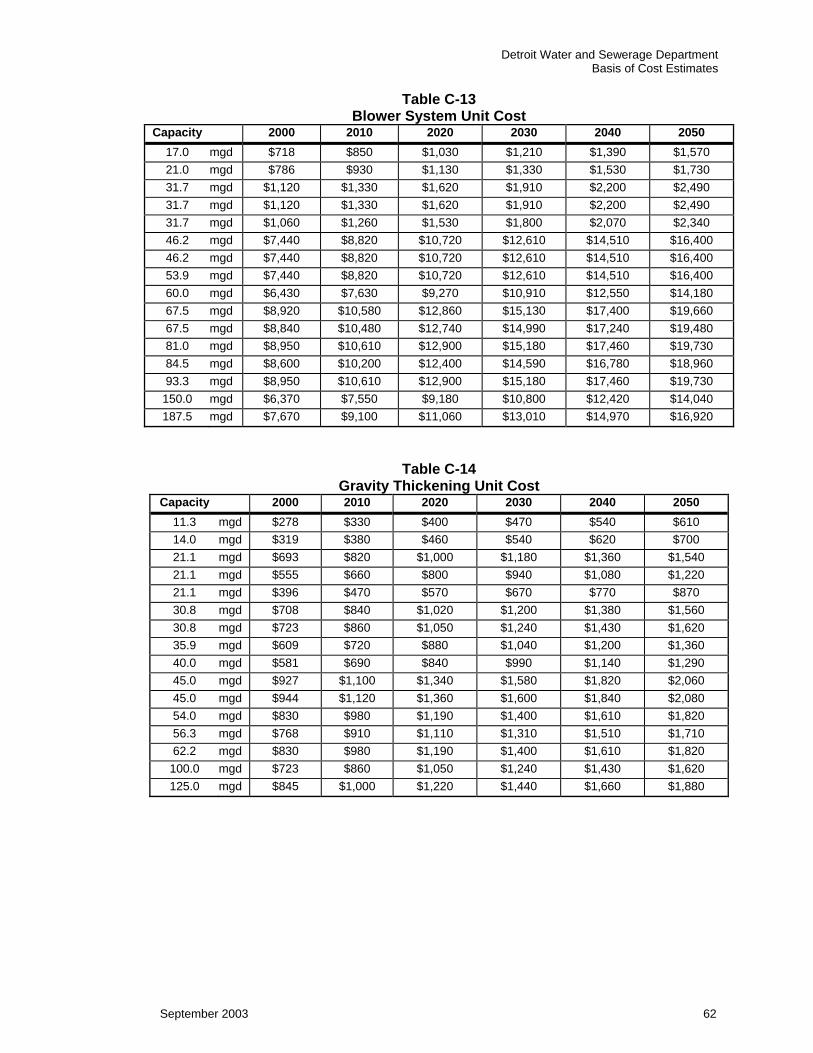
Detroit Water and Sewerage Department Basis of Cost Estimates
September 2003 62
Table C-13 Blower System Unit Cost
Capacity 2000 2010 2020 2030 2040 2050 17.0 mgd $718 $850 $1,030 $1,210 $1,390 $1,570 21.0 mgd $786 $930 $1,130 $1,330 $1,530 $1,730 31.7 mgd $1,120 $1,330 $1,620 $1,910 $2,200 $2,490 31.7 mgd $1,120 $1,330 $1,620 $1,910 $2,200 $2,490 31.7 mgd $1,060 $1,260 $1,530 $1,800 $2,070 $2,340 46.2 mgd $7,440 $8,820 $10,720 $12,610 $14,510 $16,400 46.2 mgd $7,440 $8,820 $10,720 $12,610 $14,510 $16,400 53.9 mgd $7,440 $8,820 $10,720 $12,610 $14,510 $16,400 60.0 mgd $6,430 $7,630 $9,270 $10,910 $12,550 $14,180 67.5 mgd $8,920 $10,580 $12,860 $15,130 $17,400 $19,660 67.5 mgd $8,840 $10,480 $12,740 $14,990 $17,240 $19,480 81.0 mgd $8,950 $10,610 $12,900 $15,180 $17,460 $19,730 84.5 mgd $8,600 $10,200 $12,400 $14,590 $16,780 $18,960 93.3 mgd $8,950 $10,610 $12,900 $15,180 $17,460 $19,730
150.0 mgd $6,370 $7,550 $9,180 $10,800 $12,420 $14,040 187.5 mgd $7,670 $9,100 $11,060 $13,010 $14,970 $16,920
Table C-14
Gravity Thickening Unit Cost Capacity 2000 2010 2020 2030 2040 2050
11.3 mgd $278 $330 $400 $470 $540 $610 14.0 mgd $319 $380 $460 $540 $620 $700 21.1 mgd $693 $820 $1,000 $1,180 $1,360 $1,540 21.1 mgd $555 $660 $800 $940 $1,080 $1,220 21.1 mgd $396 $470 $570 $670 $770 $870 30.8 mgd $708 $840 $1,020 $1,200 $1,380 $1,560 30.8 mgd $723 $860 $1,050 $1,240 $1,430 $1,620 35.9 mgd $609 $720 $880 $1,040 $1,200 $1,360 40.0 mgd $581 $690 $840 $990 $1,140 $1,290 45.0 mgd $927 $1,100 $1,340 $1,580 $1,820 $2,060 45.0 mgd $944 $1,120 $1,360 $1,600 $1,840 $2,080 54.0 mgd $830 $980 $1,190 $1,400 $1,610 $1,820 56.3 mgd $768 $910 $1,110 $1,310 $1,510 $1,710 62.2 mgd $830 $980 $1,190 $1,400 $1,610 $1,820 100.0 mgd $723 $860 $1,050 $1,240 $1,430 $1,620 125.0 mgd $845 $1,000 $1,220 $1,440 $1,660 $1,880

Detroit Water and Sewerage Department Basis of Cost Estimates
September 2003 63
Table C-15 Centrifugation Unit Cost
Capacity 2000 2010 2020 2030 2040 2050 11.3 mgd $2,050 $2,430 $2,950 $3,470 $3,990 $4,510 14 mgd $2,440 $2,890 $3,510 $4,130 $4,750 $5,370
21.1 mgd $2,930 $3,470 $4,220 $4,970 $5,720 $6,460 21.1 mgd $2,220 $2,630 $3,200 $3,770 $4,340 $4,900 21.1 mgd $4,160 $4,930 $5,990 $7,050 $8,110 $9,160 30.8 mgd $2,990 $3,550 $4,310 $5,070 $5,830 $6,590 30.8 mgd $3,040 $3,610 $4,390 $5,170 $5,950 $6,720 35.9 mgd $6,200 $7,350 $8,930 $10,510 $12,090 $13,660 40 mgd $6,150 $7,290 $8,860 $10,430 $12,000 $13,560 45 mgd $4,420 $5,240 $6,370 $7,500 $8,630 $9,750 45 mgd $4,500 $5,340 $6,490 $7,640 $8,790 $9,930 54 mgd $9,210 $10,920 $13,270 $15,610 $17,960 $20,300
56.3 mgd $10,700 $12,690 $15,420 $18,140 $20,870 $23,580 62.2 mgd $11,900 $14,110 $17,150 $20,180 $23,210 $26,230 100 mgd $15,000 $17,790 $21,620 $25,440 $29,260 $33,060 125 mgd $17,900 $21,230 $25,800 $30,360 $34,920 $39,460
Table C-16 Hauling and Landfilling Unit Cost
Capacity 2000 2010 2020 2030 2040 2050 11.3 mgd $438 $520 $630 $740 $850 $960 14.0 mgd $546 $650 $790 $930 $1,070 $1,210 21.1 mgd $1,060 $1,260 $1,530 $1,800 $2,070 $2,340 21.1 mgd $788 $930 $1,130 $1,330 $1,530 $1,730 21.1 mgd $810 $960 $1,170 $1,380 $1,590 $1,800 30.8 mgd $1,090 $1,290 $1,570 $1,850 $2,130 $2,410 30.8 mgd $1,100 $1,300 $1,580 $1,860 $2,140 $2,420 35.9 mgd $1,400 $1,660 $2,020 $2,380 $2,740 $3,100 40.0 mgd $1,370 $1,620 $1,970 $2,320 $2,670 $3,020 45.0 mgd $1,530 $1,810 $2,200 $2,590 $2,980 $3,370 45.0 mgd $1,560 $1,850 $2,250 $2,650 $3,050 $3,450 54.0 mgd $2,150 $2,550 $3,100 $3,650 $4,200 $4,750 56.3 mgd $2,030 $2,410 $2,930 $3,450 $3,970 $4,490 62.2 mgd $2,220 $2,630 $3,200 $3,770 $4,340 $4,900
100.0 mgd $2,360 $2,800 $3,400 $4,000 $4,600 $5,200 125.0 mgd $2,950 $3,500 $4,250 $5,000 $5,750 $6,500

Detroit Water and Sewerage Department Basis of Cost Estimates
September 2003 64
Appendix D: Wastewater Treatment Plant Ongoing Repair and
Replacement Cost Estimates

Detroit Water and Sewerage Department Basis of Cost Estimates
September 2003 65
SUMMARY OF CAPITAL IMPROVEMENT PROJECT COSTS
Explanation of Capital Improvement Costs
NOTE: This analysis was provided by the staff of the Detroit Wastewater Partners (DWSD Project PC-744 - Wastewater Treatment Plant Upgrade) and DWSD Wastewater Plant staff. It was completed in July 2003. General:
1. Capital costs are presented by major process and non-process areas. The project costs assume a major capital improvement project for the specified life cycle based on recent capital improvements performed under PC-744, other recent capital improvement projects (i.e., PC-740, PC-720, etc) and best engineering judgment. The line items listed in each area are intended to provide a basis for the cost estimate to give an understanding of the level of cost estimate, assumptions used, and items included/not included in the cost estimate. It is unlikely, and not intended, that the major capital projects would include all of the items listed at the specified cycle. Rather, it is more likely that the overall cost would be broken into smaller projects spread across a ~10 year period at the specified cycle. 2. The percentages listed below were applied to each of the base construction costs. These are similar to the percentages used in the Wastewater Master Plan (see Master Plan Technical Memo "Basis of Cost Estimates", dated August 15, 2003). - 30% Contingency (for miscellaneous items not included in the general cost estimate) - 25% Contractor Overhead and Profit and General Conditions - 20% Engineering, Legal, Administration and Management
3. Capital costs presented assume continued use of the existing processes in place at the WWTP. It does not assume major changes to the treatment process, such as a new form of primary treatment or biological treatment. The costs also do not include potentially new processes that may be required for regulatory or other reasons, such as filtration of the secondary effluent, sludge digestion, or major change to the type of effluent disinfection. 4. Capital costs presented for each process area do not include maintenance related costs for routine maintenance between the major capital improvement cycles. It is assumed that maintenance activities will be performed on the equipment at the required frequencies to maintain the equipment in good worknig order between major rehabilitation or replacement projects.
Link to Complete Spreadsheets is found on the Wastewater Master Plan CD. DWP Est. of Capital Improvements for WWTP - 50-yr.xls

Detroit Water and Sewerage Department Basis of Cost Estimates
September 2003 66
Table D.1:
SUMMARY OF CAPITAL IMPROVEMENT PROJECT COSTS
Area Life Cycle Start of Cycle 2003 Costs ($M) PROCESS RELATED Pump Station No. 1 20 2025 $ 63 Pump Station No. 2 20 2006 $ 66 Chemical Addition 20 2023 $ 9 Rectangular Primary Clarifiers 20 2013 $ 86 Circular Primary Clarifiers 20 2025 $ 84 ILP Nos. 1, 2, 3, 4, 7 20 2025 $ 29 Aeration Basins 20 2025 $ 55 Cryo Plants 10 2015 $ 1 Secondary Clarifiers 20 2020 $ 140 SFE Pump Station 20 2010 $ 13 Chlorination 20 2022 $ 16 Dechlorination 20 2023 $ 12 Hydraulic Structures 20 2020 $ 7 Complex A and B 20 2025 $ 32 C-I Dewatering 15 2020 $ 31 C-II Lower Level Dewatering 15 2019 $ 35 C-II Upper Level Dewatering 15 2015 $ 42 C-I and C-II Incineration 15 2009 $ 139 Sludge Offloading 20 2025 $ 19 NON-PROCESS RELATED Admin/Ragland Buildings 20 2025 $ 10 Plant Security 10 2015 $ 10 Plant-wide Paving 15 2020 $ 6 Parking Structure 20 2025 $ 7 Work Environment Improvements 10 2015 $ 5 Rehab of O&M Bldgs, Warehouses 20 2007 $ 40 Plant-wide Instrumentation 15 2020 $ 100 General Electrical 20 2045 $ 29 Plant-wide Secondary Water 15 2025 $ 6 Plant-wide Steam System 15 2023 $ 6 Plant-wide Potable Water 15 2010 $ 2 Plant -wide Drainage 15 2010 $ 2 Fire Protection Improvements 20 2006 $ 4 Plant-Wide JOCs/ As-Needed Eng. 1 2005 $ 3 Total $ 1,107