Wastelands Atlas of India - Department of Land Resources
47
nrsc
Transcript of Wastelands Atlas of India - Department of Land Resources
nrscnrsc
India as seen from Resourcesat - 1 Satellite Wastelands map of India - 2010
2010
i
Govt. of India
Ministry of Rural DevelopmentDepartment of Land Resources
New Delhi
Land Use Division, Land Resources GroupRS & GIS Applications Area
National Remote Sensing CentreIndian Space Research Organisation
Hyderabad
nrsc
2010

ii
iii
Land resources are under tremendous pressure with growing
needs of development and exploding population with attendant increase
in the demand for food, fuel, fodder and fiber. The advent of modern age
and newer forces, exacerbated by short-term gain driven motives often
lead to over-exploitation of natural resources, including depletion of soil
fertility and degradation of land resources. Government of India has
created the Department of Land Resources (DoLR) in the Ministry of
Rural Development (MRD) for development of rainfed areas including
wastelands in drought prone and desert prone areas. Having the mandate
of developing the valuable land resources of India, the Department
endeavors to prevent further degradation of these resources through
appropriate management strategies. At the instance of Govt. of India,
the Indian Space Research Organisation (ISRO), took the first step in
the direction of creating reliable database on the wastelands of the country
on 1:50,000 scale. National Remote Sensing Centre (erstwhile National
Remote Sensing Agency) has executed the project using satellite data
of different periods (1986 – 2000). An atlas showing the spatial distribution
and district-wise area under wastelands was released by the Prime
Minister of India in 2000. Apart from Department of Land Resources this
∫y Á uÃã“Á
RITA SINHA
SECRETARYGovernment of india
Department of Land Resources
Ministry of Rural Development
FOREWORDAtlas is being consulted by various user government departments and
non-governmental organizations extensively for implementing various
development programmes.
In order to update the information on severity of degradation which
helps in wasteland reclamation programmes, DoLR has again initiated a
project titled “National Wasteland Updation Mission (NWUM)“ in
collaboration with NRSC, during 2003. Using Rabi season IRS LISS III
of 2003, the status of wastelands with 28 categories was mapped.
According to these estimates, wastelands accounted for 55.64 million
ha. The collateral data and ancillary information like watershed
boundaries, village boundaries and base details such as settlement
locations, transport network, drainage, notified forest boundaries are
organized in different layers using standard codification system. The
results are published as a National Atlas titled ‘Wasteland Atlas of India
– 2005‘, providing district level information.
In order to monitor the changes in wastelands in the country,
DoLR had initiated a project titled ‘National Wastelands Monitoring Project
ÃuYƒ
ßÁ∫o Ã∫N˛Á∫
ßÓu™ ÃÊÃÁáå uƒßÁT
T¿Á™ym uƒN˛Áà ™ÊfiÁ¬Æ
o
iv
(NWMP)‘, in collaboration with NRSC, Department of Space. The
emphasis in this project was on the study of the dynamics of wastelands
through comparison of spatial statistics of different categories between
2006 and 2003, enabling better understanding of changes in some of the
wastelands areas. The results of findings of the project have been brought
out as ‘ Wasteland Atlas of India – 2006 ‘ which provide category-wise
and district-wise information on wastelands in various states in the country
along with change over the previous study (2003).
I hope this publication will be very useful for all those involved in the
implementation of various wastelands reclamation programme in the
country.
Icongratulate all those associated with this national endeavor,
which is of great relevance in rural development.
New DelhiDate:11-03-2010
Rita Sinha
v
Optimal management of natural resources in the wake of the ever-
increasing demand for food, fuel and fodder pose complex problems for
the country’s growth and development. Strategies for solving such complex
issues lie in understanding the potential of land and water resources,
designing appropriate plans to circumvent them, while meeting the basic
needs of the nation.
India occupies 2.4% of the global geographical area, shares 16% of human
population and 15% of livestock population. This scenario has necessitated
proper demarcation of productive and non-productive lands, particularly
the wastelands that could be treated and reclaimed for productive use.
Applications of Satellite Remote Sensing have proved to be successful in
mapping and characterising the wastelands and prioritising them for
reclamation. Wasteland mapping at national level has been done at regular
time intervals by ISRO/DOS, during past 2 decades, using data from Indian
Remote Sensing Satellites. The area occupied by wastelands, at national
level, was assessed as 63.85 mha during 1986-2000; while a similar
exercise carried out during 2003 depicted a reduction by 8.21 mha.
Dr. K. RadhakrishnanSecretary PREFACE
The present exercise of mapping wastelands was carried out during 2005-
2006, by using three-season satellite data for the first time. This effort
resulted in estimating the current extent of wastelands as 47.22 mha,
showing further reduction to the tune of 8.41 mha. These figures, along
with maps, are being utilised by the Ministry of Rural Development. (MoRD),
regularly, towards planning and implementing the reclamation of
wastelands.
I compliment the efforts of all the individuals and institutions, who have
contributed in successful completion of this project at national level. I am
sure; the database generated will continue to contribute towards better
management of wastelands in the country.
BangaloreDate: 01-04-2010
K. Radhakrishnan
GOVERNMENT OF INDIA
DEPARTMENT OF SPACEAntariksh Bhavan, New BEL Road
Bangalore - 560 231, IndiaGrams : Space Fax : +91-80-23415328Telephone : +91-80-23415241, 22172333
e-mail : [email protected]
ßÁ∫o Ã∫N˛Á∫
Eãou∫q uƒßÁTEãou∫q ߃å, ãÆÓ §y F| L¬ ∫Ázg
§ıT¬Ó∫ - 560 231, ßÁ∫ooÁ∫ : Àúzà ¢{̨ Mà : +91-80-23415328
tÓ∫ßÁ : +91-80-23415241, 22172333

vi
vii
The rapid industrialization and economic development in many countries
have resulted in achievement of improved standards of living as evident
from improved GDP per capita. However, one of the prices to be paid for
such a rapid development is environmental degradation by way of soil
erosion by water and wind, soil salinization / alkalization / acidification,
water logging etc. In order to increase the biomass production and to
restore the environmental health, preventive and curative measures need
to be employed for rehabilitation of wastelands / degraded lands.
Information on the nature, extent, severity and dynamics of degradation
is vital in this endeavour. The available estimates of degraded lands in
India range from 30 to 175 M ha. These variations are mainly due to the
lack of mutually agreed definitions on various classes of wastelands,
variations in database used, and the methodologies adopted for deriving
information on wastelands.
Realizing the potential of satellite remote sensing and GIS, National
Wasteland Development Board, Government of India initiated a
collaborative project with NRSC (erstwhile NRSA) to identify wastelands
and their location up to village and micro-watershed level on 1:50,000
PREAMBLEscale using Landsat – TM, IRS LISS-I, LISS-II and LISS-III images for the
periods 1986-1999. Wastelands were grouped into thirteen categories
and the maps were prepared for entire country. This database has been
extensively used in various wasteland and watershed development
schemes by various user departments, including Non-Governmental
Organisations (NGOs). Based on the above, an Atlas was also brought
out in 2000.
The Ministry of Rural Development, once again requested NRSC in 2003
for a follow-up study to update the wasteland database. Accordingly, a
national level project titled “National Wastelands Updation Project” was
taken up to generate database for entire country using one time rabiseason IRS LISS-III data of 2003. Several partner institutions like State
Remote Sensing Applications Centres, Regional Remote Sensing Centres
(erstwhile RRSSCs), and academia were involved. An atlas on wastelands
titled “Wasteland Atlas of India – 2005 “was brought out. This publication,
again, proved to be very useful in the implementation of various wasteland
reclamation schemes.
Government of India
Department of Space
National Remote Sensing CentreBalanagar, Hyderabad-500 625, A P, India
Telephone : +040-23878360
+040-23884000-04
Fax : +040-23877210
Dr. V. Jayaraman
Director
viii
To understand the spatial and temporal changes in wastelands, the current
project on “National Wastelands Monitoring” was initiated in 2006 with
the objective of assessing the status of wastelands and to monitor its
changes in their vegetation conditions. The unique features of this project
are usage of three season (kharif, rabi and zaid) satellite data for deriving
information on wastelands, and development of digital database as per
NNRMS standards. This exercise is envisaged to improve the delineation
of various wastelands categories, and help refining the delineation of
wastelands made during the earlier exercise. The development of digital
database as per NNRMS standards is yet another improvement. The
current Wasteland Atlas provides the status of wastelands of our country
during the period 2005-06. The classification scheme adopted,
methodology followed for creation of database have been explained in a
lucid manner to facilitate the usage of the data for rehabilitation of
wastelands. I am sure, as in the past, this Atlas will also be used by many
stakeholders involved in wasteland reclamation activities.
HyderabadDate: 05-03-2010
V. JayaramanDirector, NRSC

ix
The National Remote Sensing Centre (NRSC) acknowledges with greatappreciation, the initiative taken by the Department of Land Resources,MoRD,Govt of India for entrusting the study on “ National WastelandMonitoring Project”. The mapping efforts have generated valuable datasetson unutilized / vacant lands and their use in watershed management andamelioration purpose.
In this context, National Wastelands Monitoring Project teamacknowledges the keen interest and support provided by Mrs. Rita Sinha,Secretary and Shri. Chinmay Basu, Additional Secretary, Ministry of RuralDevelopment, Government of India for using satellite remote sensingtechnology for wastelands updation in scientific manner during theexecution of the project.
Our deep sense of gratitude is due to Dr. K Radhakrishnan, Chairman,Indian Space Research Organisation (ISRO) and Secretary, Departmentof Space, Government of India for his constant guidance and support.The project team is grateful to Dr. V Jayaraman, Director, National RemoteSensing Centre (NRSC), Hyderabad, Government of India for guidanceand providing necessary facilities during execution of the mission.
A national level project of this magnitude could not be successfullycompleted without active support from a large number of partner institutionsnamely State Remote Sensing Application Centers, Regional RemoteSensing Centers, BITS-Ranchi, NATMO-Kolkata and IRS-Chennai. Theproject team also acknowledges the support extended by the Heads/Directors and Scientists of all the partner institutes for taking up and wholeheartedly supporting a national mission project and successful completionof the project.
ACKNOWLEDGEMENTSWe also place on record our sincere thanks to external quality teamswithout whose active support, an output of this fine quality would nothave been possible.
Special thanks are due to Dr. D. Ramakrishnaiah, Dr. C.P. Reddy and Dr.R. M. Misra, Department of Land Resources, Ministry of RuralDevelopment, Government of India, Dr. V. S. Hegde, Director, EarthObservation System and Scientific Secretary, ISRO Headquarters,Bangalore for their continued support in this endeavor.
The support provided by Dr. R Nagaraja, Group Head, NDC and theircolleagues during satellite data planning & procurement in time is dulyacknowledged. The job taken up by Map Records & Archival facility andMap Printing Section from time to time during project execution andpublishing of Atlas is acknowledged
Dr S. Sudhakar, Head, Land Use Division and Dr G. Ravi Shankar, Scientist‘SF’ has coordinated the project at NRSC. Their contribution is dulyacknowledged.
Finally, we sincerely place on record the co-operation extended by variousareas / divisions /sections of NRSC for their valuable support in completingthe project.
HyderabadDate: 29-03-2010
P S RoyDeputy Director (RS & GIS-AA)
NRSC
x
xi
PROJECT TEAMAndhra PradeshAPSRAC, HyderabadDr. K. Mruthyunjaya ReddyMr. G. Mehar Baba, Mr. D V J SastryMr.S. V. Raghava ReddyMr. Ch. Tata Babu, Mr. G. Kumaraswamy
BiharBIT, Mesra, RanchiDr. M. S. NathawatDr. A. C. Pandey, Dr.V.S.RathoreMr. Nitish Kumar Sinha, Mr.Suraj Kumar Singh
ChattisgarhNATMO, KolkataDr.P.NagMr.A.Mukherji, Dr.Rajendra PrasadMs.Madhuri Mukherji, Ms.Sudeshna Bhar
NRSC, HyderabadDr. Manoj Raj Saxena, Dr. G.Padma RaniMr. Girish S Pujar, Dr.Arijit RoyMs. Shivam Trivedi, Dr.T.R.Kiran Chand
GoaEOS , ISRO HQDr.J.Krishnamurthy,Dr. Rajeev Kumar JaiswalDr.M. Sameena, Mr.T.R.S.V.S. Sastry
GujaratBISAG, GandhinagarMr.T. P. SinghMr.Ajay Patel, Mr. Vijay SinghMr. Khalid Mahmood, Mr. Navnit Patel
HaryanaHARSAC, HissarDr. R. S. HoodaDr.V. S. AryaDr. Sandeep Arya, Mr S S KhatriMs. Heena Sharma, Mr. Vijay SinghMr. Prem Prakash Sharma
Himachal PradeshRRSC, Dehradun HPRSC, ShimlaDr. K P Sharma Dr. R. K. SoodDr. M. Kudrat Dr. R. S. ThapaDr. Hitendra Padalia
Jammu & KashmirRSAC, J & KDr. Ravi Kumar KesarDr. S. A. NaqashDr.Tasneem Keng, Mr.Tanveer ShaikhMs. Muzammil Amin
JharkhandJSAC, RanchiDr. A.T. JeyaseelanDr. Neeraj Kumar Sharma, Mr. Najmul Hoda
Mr. Rahul Kumar Singh, Ms. Swetta SinghMr. Mukesh Kumar, Mr Ritesh Kumar SinhaMr. Pradip Kumar Swain, Mr. Lakhan Lal MahtoMr. Amit Kumar, Mr. Mukesh BooriMrs. Jyoti Bala Lamay, Mr. N K MishraMr. Ajay Kumar, Mr. V H Vinod KumarMs. Shashi Poonam IndwarDr. Vivek Kumar Singh, Ms. Nishi Jaya Kullu
KarnatakaKSRSAC, BangaloreDr. M.H. BalakrishnaiahDr. V. ShreedharaMr. Mohd. Saleem I. Shaikh, Mr. T. PraveenDr. M. C. Jayaprakash, Mr. D.Ramesh NayakMr. B.C. Santhosh Kumar, Mr. D.C.Lingadevaru
KeralaKSREC, ThiruvananthapuramMr. R. P.SharmaMr. A.Nizamudeen, Mr. N.Thrideep KumarMr. B. R. Hareesh
Madhya PradeshRSAC, BhopalDr.P.K.VarmaDr. Vivek Katare, Dr. Narendra ShivhareMr. S. N. Rajak, Mr. Sanjay SamuelMs. Seema Khan, Mr. Kiran KanungoMr. Shailendra Pandey
xii
MaharashtraMRSAC, NagpurDr. A.K.SinhaMr. Vivek Kale, Mr.Sanjeev VermaMs. Tutu Sengupta, Mr. Prashant RajankarDr. Ajay Deshpande, Ms. Sapna DeotaleMs. Neelima Srivastava, Ms. Archana KolheMr. Bhau Gavit, Mr.Sanjay Patil, Mr.Arun AtkareMs. Smita Dhirde, Mr.Sanjay Balamwar, Mr.S.Khandare
OrissaORSAC, BhubaneswarMr. A. K. MohapatraMr. P. Mishra, Ms.B.TripathyMrs. S. Devi, Mr.A.Das
PunjabPRSC, LudhianaDr. P. K. SharmaDr. D. C. Loshali, Dr.V.K.VermaDr. Anil Sood, Dr.MinakshiMr. Narinder Singh, Dr.Ajay mathur
RajasthanRRSC, JodhpurDr. J. R. SharmaMr. Suparn Pathak, Dr.Rakesh Paliwal
Tamil NaduIRS, Anna University, ChennaiDr. M. RamalingamMr. A. Ravindran, Ms.C.SivakamiMs. R. J. Manonmani
Uttar PradeshRSAC, LucknowDr. Alok MathurMs.Manisha Mishra, Dr.Manoj KumarMr.Ranjit Singh Rawat, Mr.A.R.SiddiquiDr.P.P.S. Yadav, Mr. Sajan A. PunnooseMr. Sushil Chandra, Mr.K.K.Mishra,Mr. Sandeep Singh
UttarakhandUSAC, DehradunDr. M. M.KimothiMr. Sunil Chandra Dhanwal
West BengalRS Cell, WBCST, KolkataDr. P. ChakrabartiMs. Subrata B. DuttaMs. Komalika Paul, Ms.Maitreyee Banerjee
Union TerritoriesNRSC, HyderabadMr. Rajiv Kumar
North Eastern StatesNESAC, ShillongDr.P.P.Nageswara Rao, Dr. K.K.Sarma
Arunachal PradeshARSAC, ItanagarDr. G.Ch. ChennaiahMr.H. K. Datta, Mr. Chauken ManlongMs.Binuta Barua
AssamAssam RSAC, GuwahatiMr. Niraj VermaMr. Utpal Sarma, Mr. Abhijit BoraMr.Jagdish Bhattacharya
ManipurManipur RSAC, ImphalMr. N. Shamungou SinghMr. O.Nodiachand Singh, Mr.Y.NilakantaMr.N.Gaganchand
MeghalayaNESAC, ShillongMs.H.Suchitra Devi, Mr.Victor SaikhomMr.Pebam Rocky
MizoramMIRSAC, AizawlDr. R. K. LallianthangaMr. Hmingthanpuii, Mr.Robert L SailoMr.H.Lalhamachhuana
xiii
NagalandNS & TC, KohimaDr. Zavei Hiese, Dr.Nesatalu HieseMr. Ditho Katiry
SikkimRRSC, KharagpurDr. A. JeyaramDr. V. M. ChowdaryMs. Swati SinghMs. Anju Bajpai
TripuraTSAC, AgartalaDr. N. DattaMr. Abhisek Dasgupta, Mr.Subrata PaulMr.Subrajyothi Choudhury, Mr.Sujit DasMs.Banani Bhattacharjee,Mr. Parthasarathi Goswami
Project Management
Project DirectorDr.P.S.Roy
Technical GuidanceDr.R.S.Dwivedi
Project CoordinatorsDr. S. Sudhakar, Dr.G.Ravi Shankar
Technical Lead Team
Dr. G. Ravi Shankar –Rajasthan, North-Eastern States(Meghalaya, Mizoram, Nagaland, Sikkim,Arunachal Pradesh)
Dr. S. V. C. Kameswara Rao –Bihar, Uttar Pradesh, Maharashtra
Dr. Manoj Raj Saxena –Orissa, West Bengal, Madhya Pradesh,Jharkhand
Dr. G. Padma Rani -Andhra Pradesh, Kerala, Tamil Nadu
Mr. Rajiv Kumar –Union Territories, Tripura, Goa,Jammu & Kashmir
Mr. B. Shyam Sunder –Gujarat, Haryana, Uttarakhand, Punjab,Karnataka, Himachal Pradesh
Mr. Girish S. Pujar -Chhattisgarh
Quality Assurance Team
NRSC, HyderabadDr. S. SudhakarDr.G. Ravi ShankarDr. S. V. C. Kameswara RaoDr. Manoj Raj Saxena, Dr. G. Padma RaniMr. Rajiv Kumar, Mr. B. Shyam SunderMr.A.Lesslie, Mr.Arul Raj, Ms.R.Binutha
IIRS, DehradunDr.Jitendra Prasad, Dr.A.P.SubudhiSAC, AhmedabadDr. R Ghosh, Dr.T.S.Singh
Atlas Compilation Team
Content layout, text and designDr. S. Sudhakar, Dr. G. Ravi Shankar
Geodatabase compilation & analysisMr. B.Shyam Sunder, Ms. R.Binutha
Technical supportDr. S.V.C.Kameswara Rao, Dr. Manoj RajSaxena, Dr.G.Padma Rani, Mr.Rajiv Kumar
Printing SupportMr.K.Shankar RaoMr.E.Vijayasekhar Reddy
Operations SupportMr.S. ThirunavukkarasuMr.D.Janardhan Rao, Mr.P.G.Vijaya KumarMr.P.Venugopal, Mr.Sanjay Kumar RathodMr.O.S.N.Murthy, Mr. A.V.Raju, Mr.K.SanathananMr.Solomon John, Mr.K.S.Vijaya KumarMr.D.N.Rao, Mr.N.Raghunandan, P.RevathiMr.R.N.Bera, Mr.Rajam Raju, Mr.BSS Prasad
Secretarial SupportMs. Malini Raj Kumar, Mr. K. Narasing Rao

xiv
xv
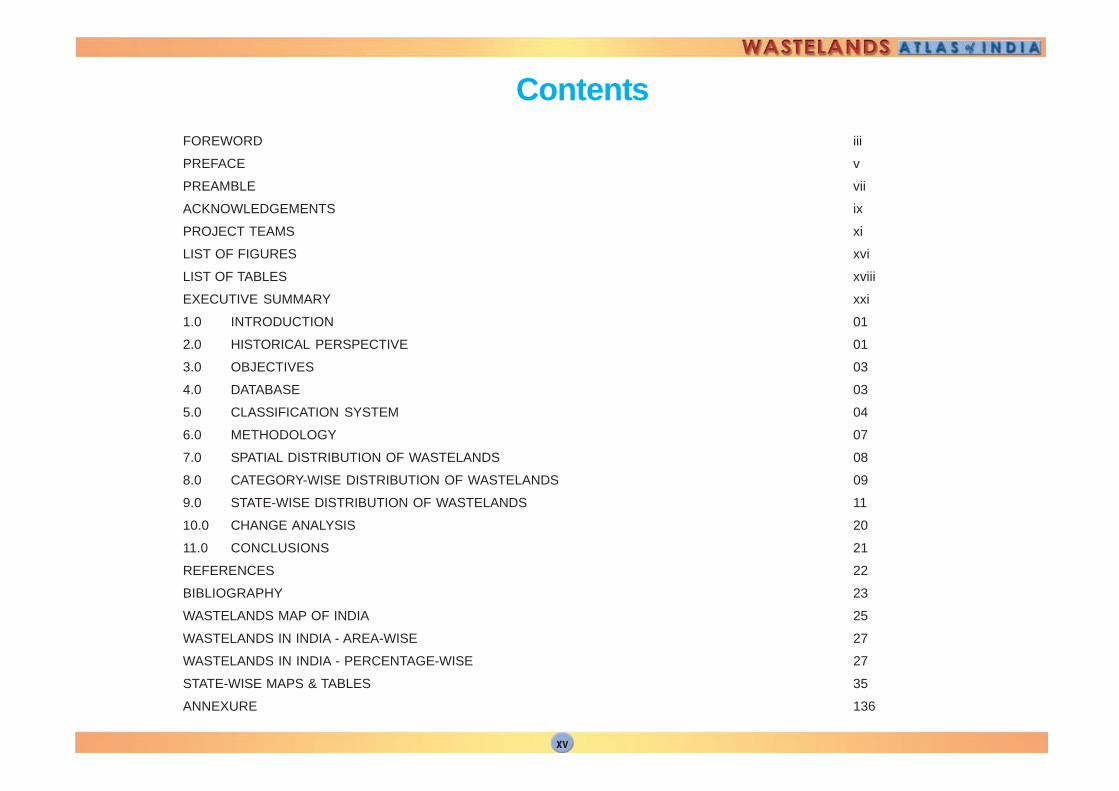
ContentsFOREWORD iii
PREFACE v
PREAMBLE vii
ACKNOWLEDGEMENTS ix
PROJECT TEAMS xi
LIST OF FIGURES xvi
LIST OF TABLES xviii
EXECUTIVE SUMMARY xxi
1.0 INTRODUCTION 01
2.0 HISTORICAL PERSPECTIVE 01
3.0 OBJECTIVES 03
4.0 DATABASE 03
5.0 CLASSIFICATION SYSTEM 04
6.0 METHODOLOGY 07
7.0 SPATIAL DISTRIBUTION OF WASTELANDS 08
8.0 CATEGORY-WISE DISTRIBUTION OF WASTELANDS 09
9.0 STATE-WISE DISTRIBUTION OF WASTELANDS 11
10.0 CHANGE ANALYSIS 20
11.0 CONCLUSIONS 21
REFERENCES 22
BIBLIOGRAPHY 23
WASTELANDS MAP OF INDIA 25
WASTELANDS IN INDIA - AREA-WISE 27
WASTELANDS IN INDIA - PERCENTAGE-WISE 27
STATE-WISE MAPS & TABLES 35
ANNEXURE 136
xvi
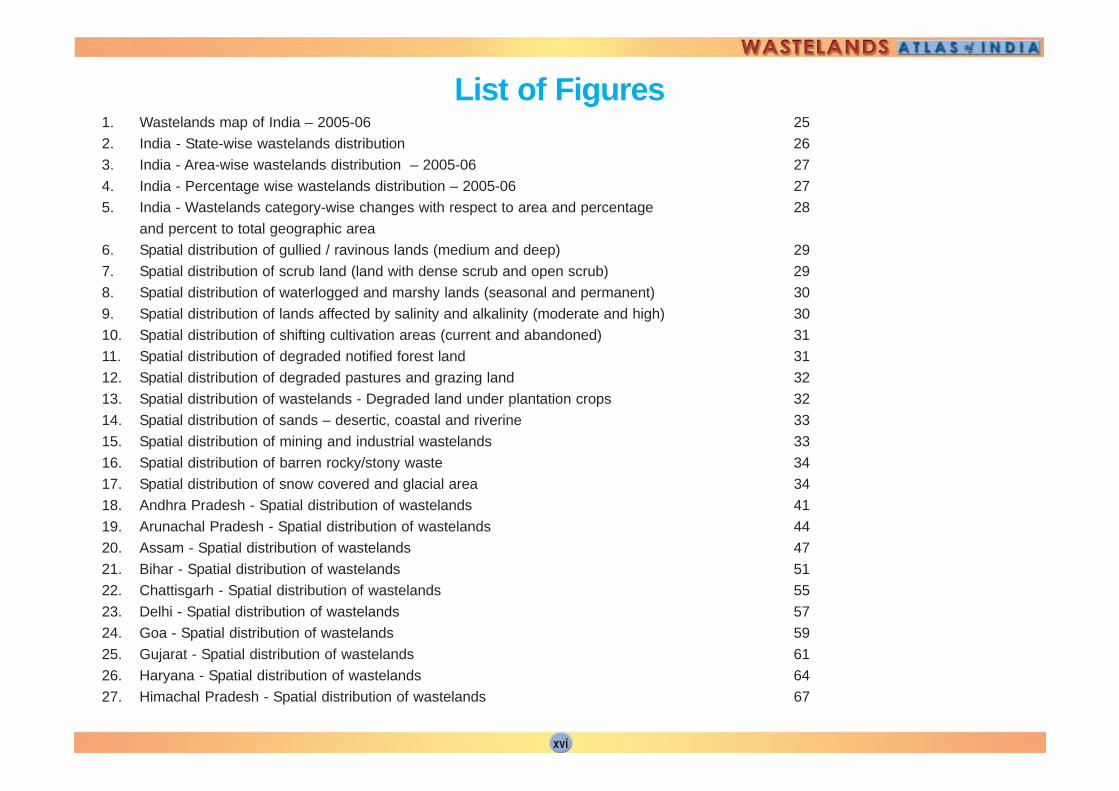
List of Figures1. Wastelands map of India – 2005-06 25
2. India - State-wise wastelands distribution 26
3. India - Area-wise wastelands distribution – 2005-06 27
4. India - Percentage wise wastelands distribution – 2005-06 27
5. India - Wastelands category-wise changes with respect to area and percentage 28
and percent to total geographic area
6. Spatial distribution of gullied / ravinous lands (medium and deep) 29
7. Spatial distribution of scrub land (land with dense scrub and open scrub) 29
8. Spatial distribution of waterlogged and marshy lands (seasonal and permanent) 30
9. Spatial distribution of lands affected by salinity and alkalinity (moderate and high) 30
10. Spatial distribution of shifting cultivation areas (current and abandoned) 31
11. Spatial distribution of degraded notified forest land 31
12. Spatial distribution of degraded pastures and grazing land 32
13. Spatial distribution of wastelands - Degraded land under plantation crops 32
14. Spatial distribution of sands – desertic, coastal and riverine 33
15. Spatial distribution of mining and industrial wastelands 33
16. Spatial distribution of barren rocky/stony waste 34
17. Spatial distribution of snow covered and glacial area 34
18. Andhra Pradesh - Spatial distribution of wastelands 41
19. Arunachal Pradesh - Spatial distribution of wastelands 44
20. Assam - Spatial distribution of wastelands 47
21. Bihar - Spatial distribution of wastelands 51
22. Chattisgarh - Spatial distribution of wastelands 55
23. Delhi - Spatial distribution of wastelands 57
24. Goa - Spatial distribution of wastelands 59
25. Gujarat - Spatial distribution of wastelands 61
26. Haryana - Spatial distribution of wastelands 64
27. Himachal Pradesh - Spatial distribution of wastelands 67
xvii
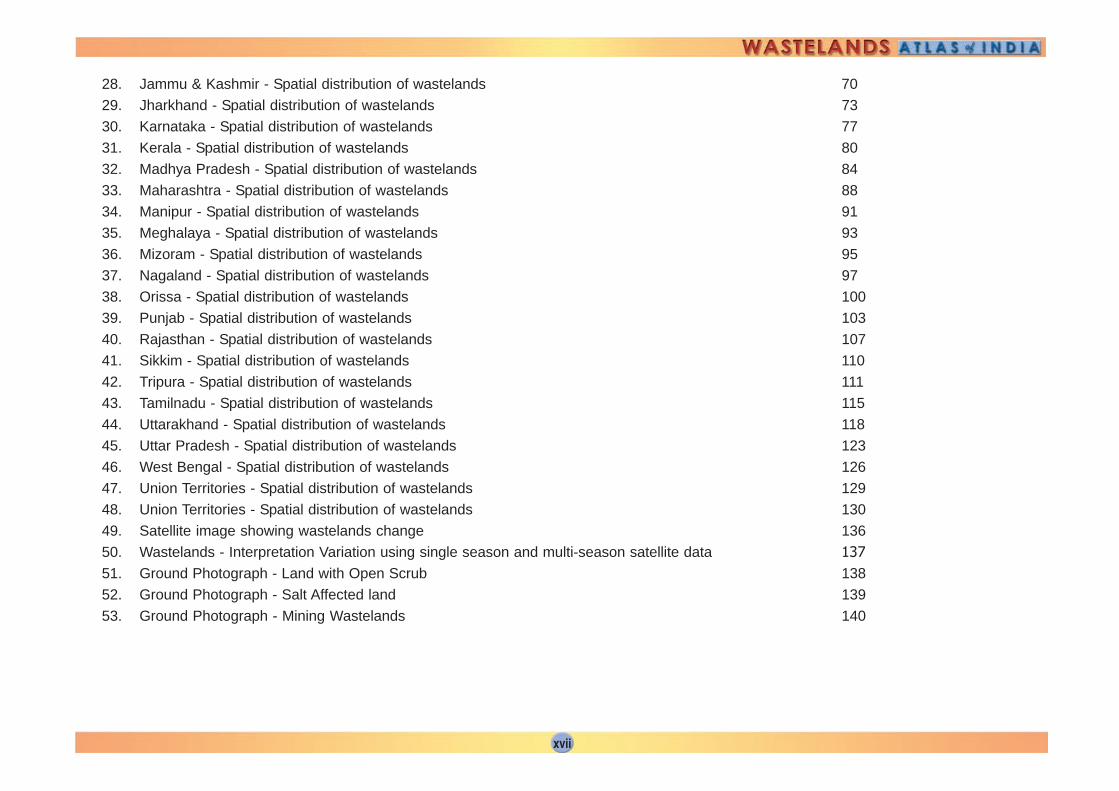
28. Jammu & Kashmir - Spatial distribution of wastelands 70
29. Jharkhand - Spatial distribution of wastelands 73
30. Karnataka - Spatial distribution of wastelands 77
31. Kerala - Spatial distribution of wastelands 80
32. Madhya Pradesh - Spatial distribution of wastelands 84
33. Maharashtra - Spatial distribution of wastelands 88
34. Manipur - Spatial distribution of wastelands 91
35. Meghalaya - Spatial distribution of wastelands 93
36. Mizoram - Spatial distribution of wastelands 95
37. Nagaland - Spatial distribution of wastelands 97
38. Orissa - Spatial distribution of wastelands 100
39. Punjab - Spatial distribution of wastelands 103
40. Rajasthan - Spatial distribution of wastelands 107
41. Sikkim - Spatial distribution of wastelands 110
42. Tripura - Spatial distribution of wastelands 111
43. Tamilnadu - Spatial distribution of wastelands 115
44. Uttarakhand - Spatial distribution of wastelands 118
45. Uttar Pradesh - Spatial distribution of wastelands 123
46. West Bengal - Spatial distribution of wastelands 126
47. Union Territories - Spatial distribution of wastelands 129
48. Union Territories - Spatial distribution of wastelands 130
49. Satellite image showing wastelands change 136
50. Wastelands - Interpretation Variation using single season and multi-season satellite data 137
51. Ground Photograph - Land with Open Scrub 138
52. Ground Photograph - Salt Affected land 139
53. Ground Photograph - Mining Wastelands 140
xviii
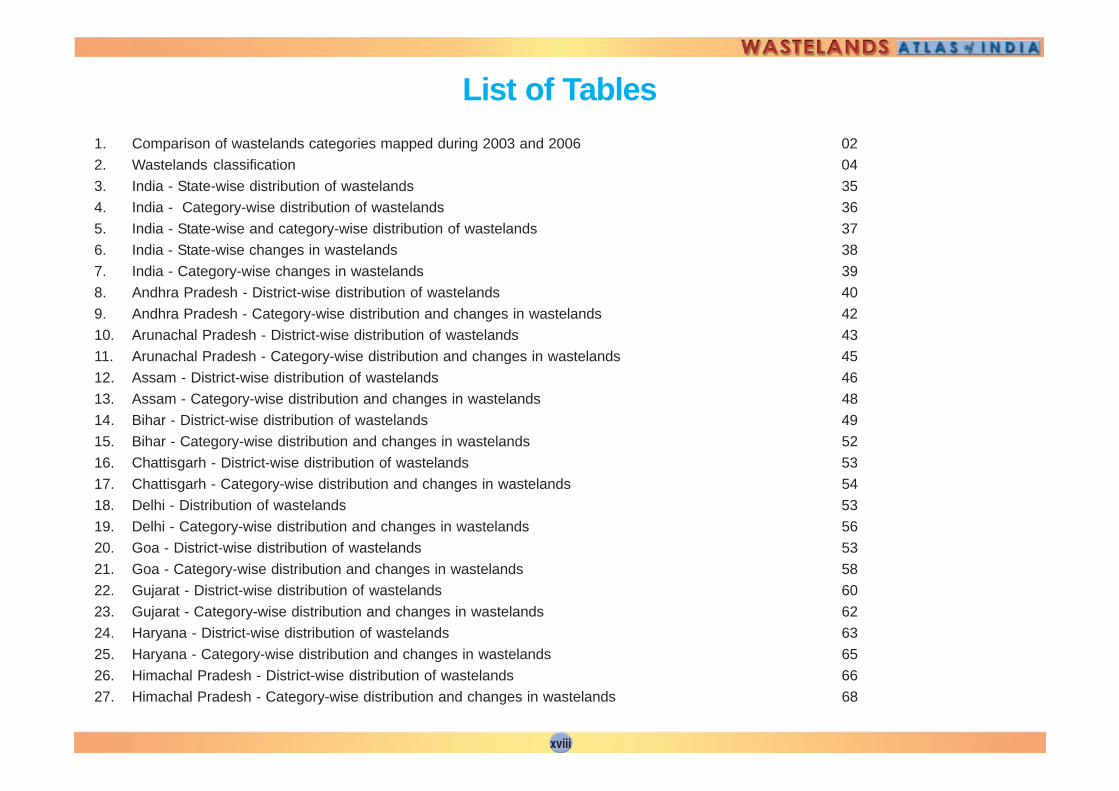
List of Tables
1. Comparison of wastelands categories mapped during 2003 and 2006 02
2. Wastelands classification 04
3. India - State-wise distribution of wastelands 35
4. India - Category-wise distribution of wastelands 36
5. India - State-wise and category-wise distribution of wastelands 37
6. India - State-wise changes in wastelands 38
7. India - Category-wise changes in wastelands 39
8. Andhra Pradesh - District-wise distribution of wastelands 40
9. Andhra Pradesh - Category-wise distribution and changes in wastelands 42
10. Arunachal Pradesh - District-wise distribution of wastelands 43
11. Arunachal Pradesh - Category-wise distribution and changes in wastelands 45
12. Assam - District-wise distribution of wastelands 46
13. Assam - Category-wise distribution and changes in wastelands 48
14. Bihar - District-wise distribution of wastelands 49
15. Bihar - Category-wise distribution and changes in wastelands 52
16. Chattisgarh - District-wise distribution of wastelands 53
17. Chattisgarh - Category-wise distribution and changes in wastelands 54
18. Delhi - Distribution of wastelands 53
19. Delhi - Category-wise distribution and changes in wastelands 56
20. Goa - District-wise distribution of wastelands 53
21. Goa - Category-wise distribution and changes in wastelands 58
22. Gujarat - District-wise distribution of wastelands 60
23. Gujarat - Category-wise distribution and changes in wastelands 62
24. Haryana - District-wise distribution of wastelands 63
25. Haryana - Category-wise distribution and changes in wastelands 65
26. Himachal Pradesh - District-wise distribution of wastelands 66
27. Himachal Pradesh - Category-wise distribution and changes in wastelands 68
xix
28. Jammu & Kashmir - District-wise distribution of wastelands 69
29. Jammu & Kashmir - Category-wise distribution and changes in wastelands 71
30. Jharkhand - District-wise distribution of wastelands 72
31. Jharkhand - Category-wise distribution and changes in wastelands 74
32. Karnataka - District-wise distribution of wastelands 75
33. Karnataka - Category-wise distribution and changes in wastelands 78
34. Kerala - District-wise distribution of wastelands 79
35. Kerala - Category-wise distribution and changes in wastelands 81
36. Madhya Pradesh - District-wise distribution of wastelands 82
37. Madhya Pradesh - Category-wise distribution and changes in wastelands 85
38. Maharashtra - District-wise distribution of wastelands 86
39. Maharashtra - Category-wise distribution and changes in wastelands 89
40. Manipur - District-wise distribution of wastelands 90
41. Manipur - Category-wise distribution and changes in wastelands 92
42. Meghalaya - District-wise distribution of wastelands 90
43. Meghalaya - Category-wise distribution and changes in wastelands 92
44. Mizoram - District-wise distribution of wastelands 94
45. Mizoram - Category-wise distribution and changes in wastelands 96
46. Nagaland - District-wise distribution of wastelands 94
47. Nagaland - Category-wise distribution and changes in wastelands 96
48. Orissa - District-wise distribution of wastelands 98
49. Orissa - Category-wise distribution and changes in wastelands 101
50. Punjab - District-wise distribution of wastelands 102
51. Punjab - Category-wise distribution and changes in wastelands 104
52. Rajasthan - District-wise distribution of wastelands 105
53. Rajasthan - Category-wise distribution and changes in wastelands 108
54. Sikkim - District-wise distribution of wastelands 109
55. Sikkim - Category-wise distribution and changes in wastelands 112
56. Tripura - District-wise distribution of wastelands 109
57. Tripura - Category-wise distribution and changes in wastelands 112
xx
58. Tamilnadu - District-wise distribution of wastelands 113
59. Tamilnadu - Category-wise distribution and changes in wastelands 116
60. Uttarakhand - District-wise distribution of wastelands 117
61. Uttarakhand - Category-wise distribution and changes in wastelands 119
62. Uttar Pradesh - District-wise distribution of wastelands 120
63. Uttar Pradesh - Category-wise distribution and changes in wastelands 124
64. West Bengal - District-wise distribution of wastelands 125
65. West Bengal - Category-wise distribution and changes in wastelands 127
66. Union Territories - Distribution of wastelands 128
67. Union Territories - Category-wise distribution and changes in wastelands 131
68. Andaman & Nicobar Islands - Category-wise distribution and changes in wastelands 132
69. Chandigarh - Category-wise distribution and changes in wastelands 132
70. Dadra & Nagar Haveli - Category-wise distribution and changes in wastelands 133
71. Daman - Category-wise distribution and changes in wastelands 133
72. Diu - Category-wise distribution and changes in wastelands 134
73. Karaikal - Category-wise distribution and changes in wastelands 134
74. Pondicherry - Category-wise distribution and changes in wastelands 135
xxi
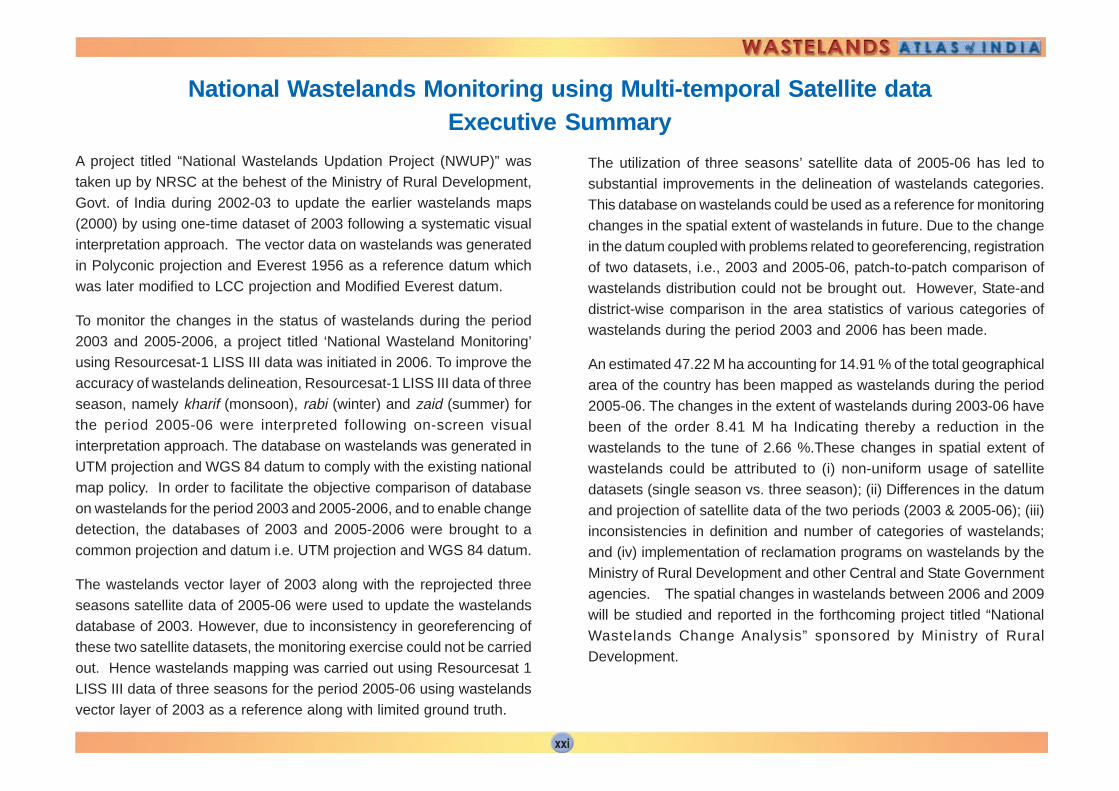
A project titled “National Wastelands Updation Project (NWUP)” wastaken up by NRSC at the behest of the Ministry of Rural Development,Govt. of India during 2002-03 to update the earlier wastelands maps(2000) by using one-time dataset of 2003 following a systematic visualinterpretation approach. The vector data on wastelands was generatedin Polyconic projection and Everest 1956 as a reference datum whichwas later modified to LCC projection and Modified Everest datum.
To monitor the changes in the status of wastelands during the period2003 and 2005-2006, a project titled ‘National Wasteland Monitoring’using Resourcesat-1 LISS III data was initiated in 2006. To improve theaccuracy of wastelands delineation, Resourcesat-1 LISS III data of threeseason, namely kharif (monsoon), rabi (winter) and zaid (summer) forthe period 2005-06 were interpreted following on-screen visualinterpretation approach. The database on wastelands was generated inUTM projection and WGS 84 datum to comply with the existing nationalmap policy. In order to facilitate the objective comparison of databaseon wastelands for the period 2003 and 2005-2006, and to enable changedetection, the databases of 2003 and 2005-2006 were brought to acommon projection and datum i.e. UTM projection and WGS 84 datum.
The wastelands vector layer of 2003 along with the reprojected threeseasons satellite data of 2005-06 were used to update the wastelandsdatabase of 2003. However, due to inconsistency in georeferencing ofthese two satellite datasets, the monitoring exercise could not be carriedout. Hence wastelands mapping was carried out using Resourcesat 1LISS III data of three seasons for the period 2005-06 using wastelandsvector layer of 2003 as a reference along with limited ground truth.
The utilization of three seasons’ satellite data of 2005-06 has led tosubstantial improvements in the delineation of wastelands categories.This database on wastelands could be used as a reference for monitoringchanges in the spatial extent of wastelands in future. Due to the changein the datum coupled with problems related to georeferencing, registrationof two datasets, i.e., 2003 and 2005-06, patch-to-patch comparison ofwastelands distribution could not be brought out. However, State-anddistrict-wise comparison in the area statistics of various categories ofwastelands during the period 2003 and 2006 has been made.
An estimated 47.22 M ha accounting for 14.91 % of the total geographicalarea of the country has been mapped as wastelands during the period2005-06. The changes in the extent of wastelands during 2003-06 havebeen of the order 8.41 M ha Indicating thereby a reduction in thewastelands to the tune of 2.66 %.These changes in spatial extent ofwastelands could be attributed to (i) non-uniform usage of satellitedatasets (single season vs. three season); (ii) Differences in the datumand projection of satellite data of the two periods (2003 & 2005-06); (iii)inconsistencies in definition and number of categories of wastelands;and (iv) implementation of reclamation programs on wastelands by theMinistry of Rural Development and other Central and State Governmentagencies. The spatial changes in wastelands between 2006 and 2009will be studied and reported in the forthcoming project titled “NationalWastelands Change Analysis” sponsored by Ministry of RuralDevelopment.
National Wastelands Monitoring using Multi-temporal Satellite dataExecutive Summary
xxii
1
1.0 Introduction
Land being a non-renewable resource, is the central to all primaryproduction systems. In India, the excessive demand of land for bothagricultural and non-agricultural uses has resulted in the development ofvast stretches of different kinds of wastelands such as salt-affected land,waterlogged areas, gullied/ravinous lands etc. Planned efforts are neededfor their rehabilitation. Over the years, the country’s landmass has sufferedfrom different types of degradation caused by biotic and abiotic pressures.An ever increasing population places enormous demand on land resourceswhich are indispensable for a country like India with 2.4 % of the worlds’geographical area supporting over 16 % of the world’s population. Further,the country has 0.5 % of the worlds grazing lands but has over 18 % ofworld’s cattle population. The tremendous pressure on land has led toconversion of forest lands into urban and industrial areas.
Spatial information on wastelands with respect to their nature, magnitudeof degradation, extent, spatial distribution and temporal behavior is a pre-requisite for development and implementation of plans for theirrehabilitation. The spaceborne spectral measurements, GIS and GlobalPositioning Systems (GPS) offer immense potential in deriving informationon wastelands in a timely and cost-effective manner. The demonstrationof the potential of coarse spatial resolution Landsat MSS data forgenerating information on wastelands at 1 : 1 million scale showing 8categories of wastelands for entire country by NRSC (erstwhile NRSA) in1984-85 has revealed the fact that 53.30 M ha corresponding to 16.40per cent of the geographical area of the country are lying waste. Realizingthe need to rehabilitate these lands, the National Wastelands DevelopmentBoard was established in 1986 with the objective of bringing five M ha ofland every year under fuel wood and fodder plantations.At the instance of Ministry of Rural Development, spatial assessment ofwastelands across the country was taken up on a larger scale i.e. 1:50,000
scale by Department of Space (DoS) to serve as a useful database forimplementing various wastelands developmental schemes.
2.0 Historical Perspective
2.1 National Wastelands Inventory Project (NWIP-2000)
Wastelands mapping was carried out in different phases considering thecritically-affected districts on priority. A 13-fold wastelands classificationsystem was adopted for mapping wastelands at 1 : 50,000 scale for entirecountry in five phases using Landsat Thematic Mapper (TM) IRS LISS IIand IRS 1C LISS III data. An estimated 63.85 M ha of land covering20.17% of total geographical area of the country were mapped aswastelands.
2.2 National Wastelands Updation Project (NWUP-2003)
Since mapping of wastelands was carried out using satellite datasetscorresponding to different years (1986 – 2000), the updation of wastelandswas taken up by NRSC using one season data set of 2003. A modifiedclassification system, with the inclusion of more classes to indicate theseverity of degradation totalling 28 classes, was adopted for derivinginformation on wastelands. As different categories of wastelands requiredifferent treatment to reclaim, the new wastelands classification wouldhelp priotrizing them for reclamation. Similar to earlier wastelands mappingexercise, datasets were organized into four geospatial layers, namelybase, village, wasteland and watershed. An estimated 55.64 M ha or17.57% of the country’s geographical area was mapped as wastelands.
A wastelands atlas was prepared to present the results emanating fromthis wastelands mapping exercise using satellite data for year 2003. TheWastelands Atlas describes the project background, wastelands
2
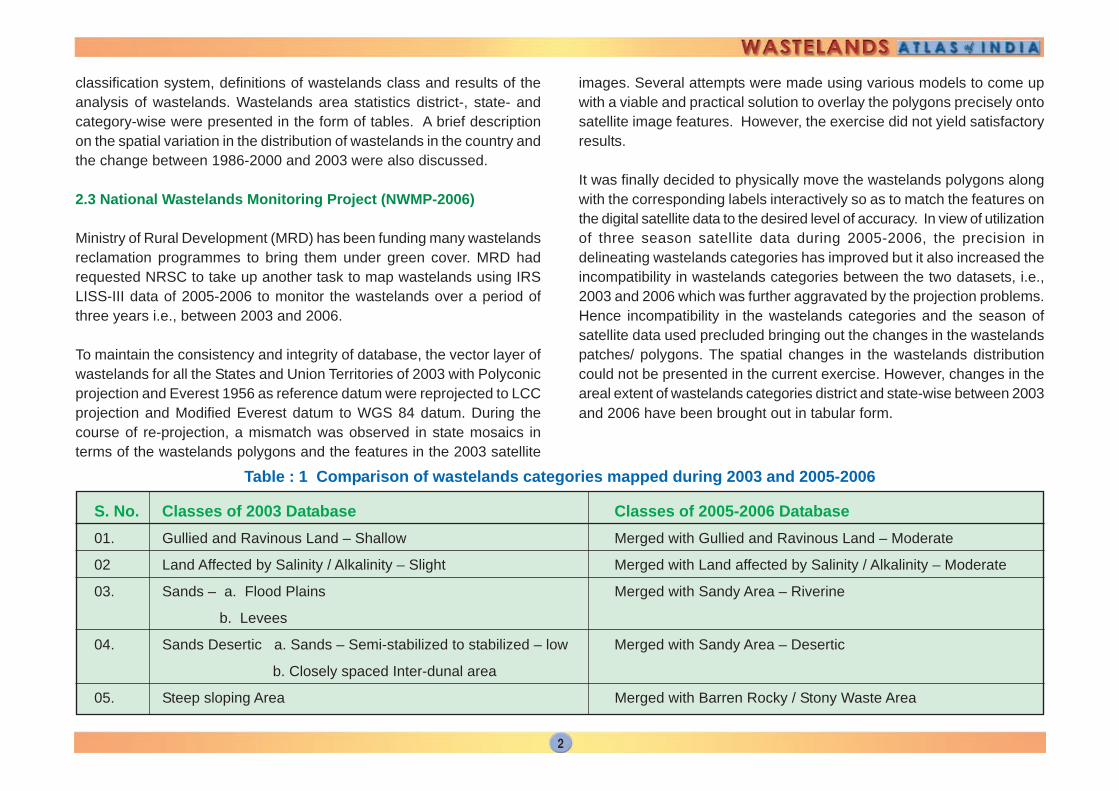
S. No. Classes of 2003 Database Classes of 2005-2006 Database01. Gullied and Ravinous Land – Shallow Merged with Gullied and Ravinous Land – Moderate
02 Land Affected by Salinity / Alkalinity – Slight Merged with Land affected by Salinity / Alkalinity – Moderate
03. Sands – a. Flood Plains Merged with Sandy Area – Riverine
b. Levees
04. Sands Desertic a. Sands – Semi-stabilized to stabilized – low Merged with Sandy Area – Desertic
b. Closely spaced Inter-dunal area
05. Steep sloping Area Merged with Barren Rocky / Stony Waste Area
Table : 1 Comparison of wastelands categories mapped during 2003 and 2005-2006
classification system, definitions of wastelands class and results of theanalysis of wastelands. Wastelands area statistics district-, state- andcategory-wise were presented in the form of tables. A brief descriptionon the spatial variation in the distribution of wastelands in the country andthe change between 1986-2000 and 2003 were also discussed.
2.3 National Wastelands Monitoring Project (NWMP-2006)
Ministry of Rural Development (MRD) has been funding many wastelandsreclamation programmes to bring them under green cover. MRD hadrequested NRSC to take up another task to map wastelands using IRSLISS-III data of 2005-2006 to monitor the wastelands over a period ofthree years i.e., between 2003 and 2006.
To maintain the consistency and integrity of database, the vector layer ofwastelands for all the States and Union Territories of 2003 with Polyconicprojection and Everest 1956 as reference datum were reprojected to LCCprojection and Modified Everest datum to WGS 84 datum. During thecourse of re-projection, a mismatch was observed in state mosaics interms of the wastelands polygons and the features in the 2003 satellite
images. Several attempts were made using various models to come upwith a viable and practical solution to overlay the polygons precisely ontosatellite image features. However, the exercise did not yield satisfactoryresults.
It was finally decided to physically move the wastelands polygons alongwith the corresponding labels interactively so as to match the features onthe digital satellite data to the desired level of accuracy. In view of utilizationof three season satellite data during 2005-2006, the precision indelineating wastelands categories has improved but it also increased theincompatibility in wastelands categories between the two datasets, i.e.,2003 and 2006 which was further aggravated by the projection problems.Hence incompatibility in the wastelands categories and the season ofsatellite data used precluded bringing out the changes in the wastelandspatches/ polygons. The spatial changes in the wastelands distributioncould not be presented in the current exercise. However, changes in theareal extent of wastelands categories district and state-wise between 2003and 2006 have been brought out in tabular form.
3
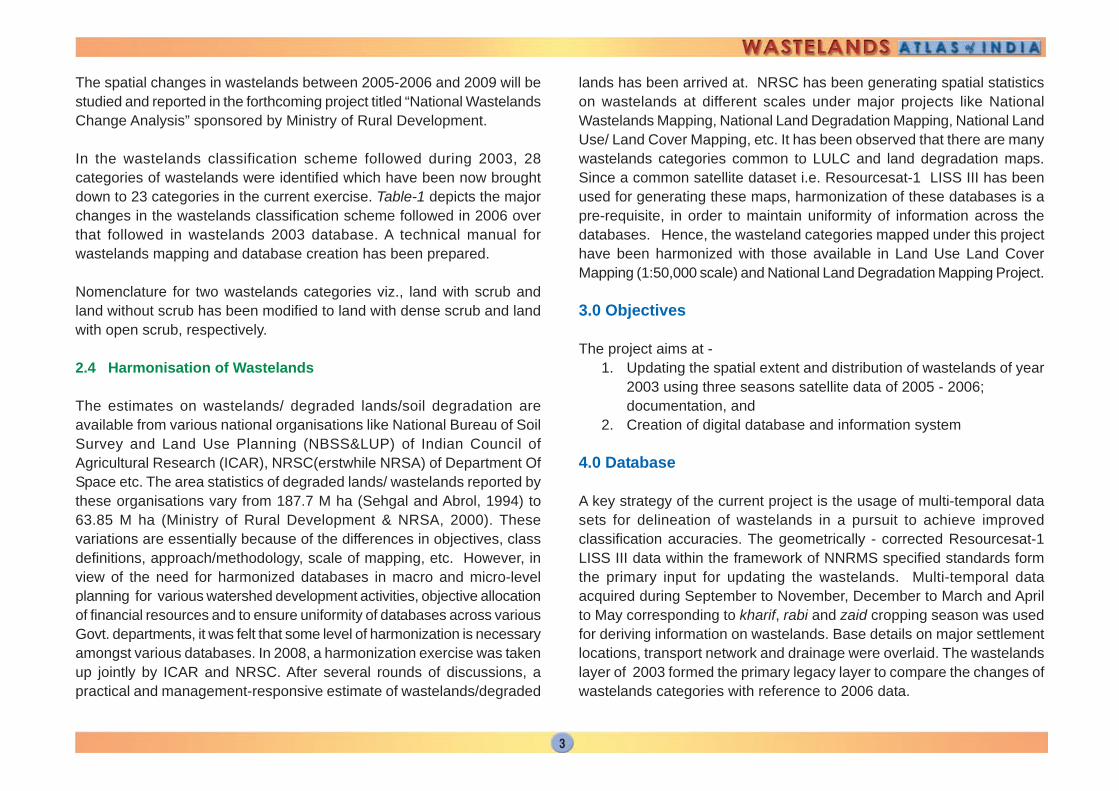
The spatial changes in wastelands between 2005-2006 and 2009 will bestudied and reported in the forthcoming project titled “National WastelandsChange Analysis” sponsored by Ministry of Rural Development.
In the wastelands classification scheme followed during 2003, 28categories of wastelands were identified which have been now broughtdown to 23 categories in the current exercise. Table-1 depicts the majorchanges in the wastelands classification scheme followed in 2006 overthat followed in wastelands 2003 database. A technical manual forwastelands mapping and database creation has been prepared.
Nomenclature for two wastelands categories viz., land with scrub andland without scrub has been modified to land with dense scrub and landwith open scrub, respectively.
2.4 Harmonisation of Wastelands
The estimates on wastelands/ degraded lands/soil degradation areavailable from various national organisations like National Bureau of SoilSurvey and Land Use Planning (NBSS&LUP) of Indian Council ofAgricultural Research (ICAR), NRSC(erstwhile NRSA) of Department OfSpace etc. The area statistics of degraded lands/ wastelands reported bythese organisations vary from 187.7 M ha (Sehgal and Abrol, 1994) to63.85 M ha (Ministry of Rural Development & NRSA, 2000). Thesevariations are essentially because of the differences in objectives, classdefinitions, approach/methodology, scale of mapping, etc. However, inview of the need for harmonized databases in macro and micro-levelplanning for various watershed development activities, objective allocationof financial resources and to ensure uniformity of databases across variousGovt. departments, it was felt that some level of harmonization is necessaryamongst various databases. In 2008, a harmonization exercise was takenup jointly by ICAR and NRSC. After several rounds of discussions, apractical and management-responsive estimate of wastelands/degraded
lands has been arrived at. NRSC has been generating spatial statisticson wastelands at different scales under major projects like NationalWastelands Mapping, National Land Degradation Mapping, National LandUse/ Land Cover Mapping, etc. It has been observed that there are manywastelands categories common to LULC and land degradation maps.Since a common satellite dataset i.e. Resourcesat-1 LISS III has beenused for generating these maps, harmonization of these databases is apre-requisite, in order to maintain uniformity of information across thedatabases. Hence, the wasteland categories mapped under this projecthave been harmonized with those available in Land Use Land CoverMapping (1:50,000 scale) and National Land Degradation Mapping Project.
3.0 Objectives
The project aims at -1. Updating the spatial extent and distribution of wastelands of year
2003 using three seasons satellite data of 2005 - 2006;documentation, and
2. Creation of digital database and information system
4.0 Database
A key strategy of the current project is the usage of multi-temporal datasets for delineation of wastelands in a pursuit to achieve improvedclassification accuracies. The geometrically - corrected Resourcesat-1LISS III data within the framework of NNRMS specified standards formthe primary input for updating the wastelands. Multi-temporal dataacquired during September to November, December to March and Aprilto May corresponding to kharif, rabi and zaid cropping season was usedfor deriving information on wastelands. Base details on major settlementlocations, transport network and drainage were overlaid. The wastelandslayer of 2003 formed the primary legacy layer to compare the changes ofwastelands categories with reference to 2006 data.
4
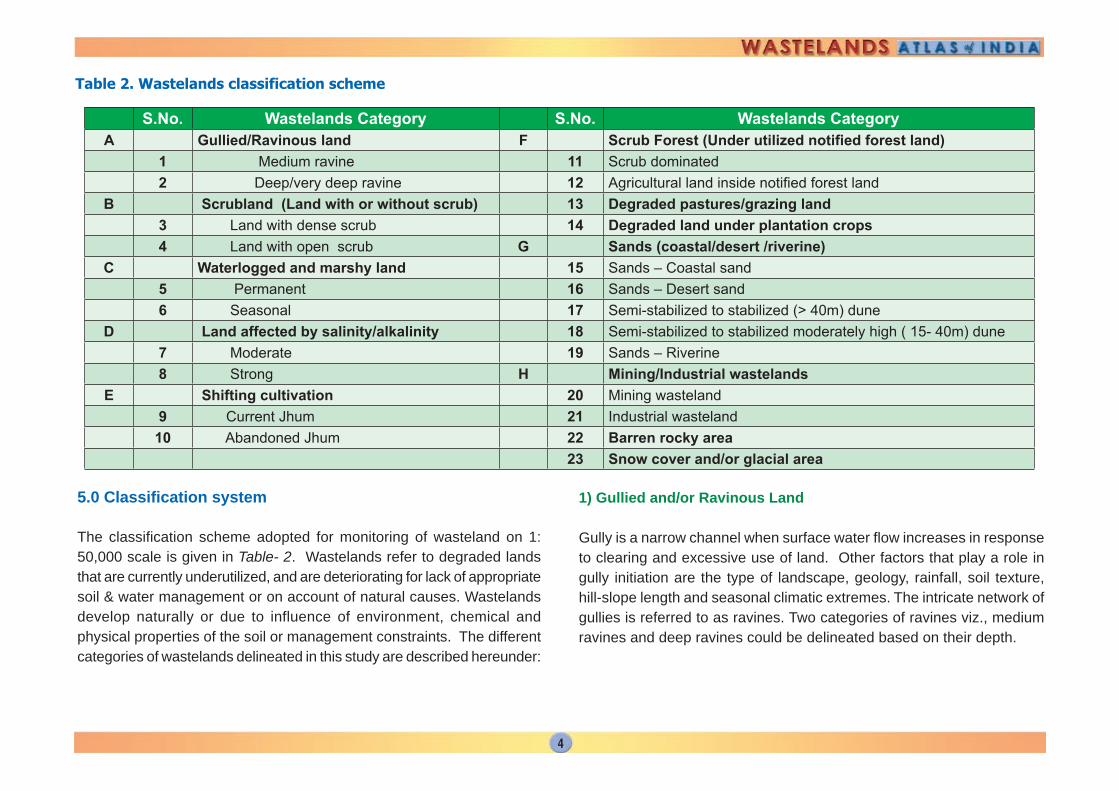
Table 2. Wastelands classification scheme
5.0 Classification system
The classification scheme adopted for monitoring of wasteland on 1:50,000 scale is given in Table- 2. Wastelands refer to degraded landsthat are currently underutilized, and are deteriorating for lack of appropriatesoil & water management or on account of natural causes. Wastelandsdevelop naturally or due to influence of environment, chemical andphysical properties of the soil or management constraints. The differentcategories of wastelands delineated in this study are described hereunder:
1) Gullied and/or Ravinous Land
Gully is a narrow channel when surface water flow increases in responseto clearing and excessive use of land. Other factors that play a role ingully initiation are the type of landscape, geology, rainfall, soil texture,hill-slope length and seasonal climatic extremes. The intricate network ofgullies is referred to as ravines. Two categories of ravines viz., mediumravines and deep ravines could be delineated based on their depth.
S.No. Wastelands Category S.No. Wastelands Category
A Gullied/Ravinous land F Scrub Forest (Under utilized notifi ed forest land)1 Medium ravine 11 Scrub dominated2 Deep/very deep ravine 12 Agricultural land inside notifi ed forest land
B Scrubland (Land with or without scrub) 13 Degraded pastures/grazing land3 Land with dense scrub 14 Degraded land under plantation crops4 Land with open scrub G Sands (coastal/desert /riverine)
C Waterlogged and marshy land 15 Sands – Coastal sand5 Permanent 16 Sands – Desert sand6 Seasonal 17 Semi-stabilized to stabilized (> 40m) dune
D Land affected by salinity/alkalinity 18 Semi-stabilized to stabilized moderately high ( 15- 40m) dune7 Moderate 19 Sands – Riverine8 Strong H Mining/Industrial wastelands
E Shifting cultivation 20 Mining wasteland9 Current Jhum 21 Industrial wasteland10 Abandoned Jhum 22 Barren rocky area
23 Snow cover and/or glacial area
5
Medium Ravines: These are the ravines with a depth of gulliesranging between 2.5 and 5 meters. Generally, these are seenconfined to the head region of the stream close to agriculturalland.
Deep Ravines: The depth of ravines is more than 5 meters. Deepravines, generally, occur along the higher order stream areas thatare close to the main river.
2) Scrubland
This is the land, which is generally prone to deterioration due to erosion.Such lands generally occupy topographically high locations, excludinghilly/mountainous terrain. Based on the presence of vegetation cover,two sub-classes could be delineated i.e., land with dense scrub and landwith open scrub.
Land with dense scrubThese areas have shallow and skeletal soils, at times chemicallydegraded, extremes of slopes, severely eroded and are subjectedto excessive aridity with scrubs dominating the landscape. Theyhave a tendency for intermixing with croplands.
Land with open scrubThis category is same as mentioned in the earlier category exceptthat it has sparse vegetative cover or is devoid of scrub and has athin soil covers.
3) Waterlogged / Marshy Land
Waterlogged land is that low lying land where the water is at/or near thesurface and the water stands for most part of the year. Depending on
duration of waterlogging, two sub-classes viz., permanently waterloggedand seasonally waterlogged areas could be delineated.
Permanent: Permanently waterlogged areas are those wherethe waterlogging conditions prevail during most part of the year.These areas are mostly located in low-lying areas, with impervioussubstratum along the canals/ river banks, coastal inlands, etc.
Seasonal: Seasonally waterlogged areas are those where thewaterlogging condition prevails usually during the monsoon period.These lands are mostly located in plain areas associated with thedrainage congestion. Use of multi-season satellite data enablesdelineation of this category.
4) Land affected by salinity/alkalinity
Land affected by salinity/alkalinity have excess soluble salts (saline) orhigh exchangeable sodium. Salinity is caused due to capillary movementof water, during extreme weather conditions leaving salt encrustation onthe surface. Alkali soils have exchangeable sodium percentage (ESP)values of 15 or more, which is generally considered as the limit betweennormal and alkali soils. The predominant salts in alkali soils are carbonatesand bicarbonates of sodium.
Considering the degree of salinity and or alkalinity, the following two sub-classes viz., moderately saline / alkali and strongly saline / alkali areascould be delineated.
Moderately Saline/Alkali land : These are the areas located inthe fluvial plains with the degree of salinity (ECe) ranging from 8to 30 (dS/m), pH between 9.0 – 9.8 and the Exchangeable SodiumPercentage (ESP) values ranging between 15 – 40.
6
Strongly Saline/Alkali land : These are the salt-affected landswith ECe values greater than 30 dS/m, pH values more than 9.8and ESP values of >40.
5) Shifting Cultivation Areas
Shifting cultivation is a traditional practice of growing crops on forested/vegetated hill-slope by the slash and burn method.
Current : The areas that are used for cultivation by the slash andburn practices and are clearly perceptible on the satellite image inpre-burnt /post-burnt conditions.
Abandoned: Are those areas that were earlier under shiftingcultivation but subsequently left idle for more than one year butless than 5 years, thereby giving a scope for the regeneration ofsecondary vegetation such as bamboo or grasses. This categoryhas a tendency to get mixed with forests.
6) Scrub Forest
Two sub-classes viz., scrub dominated degraded forest land andagriculture land inside notified forest area have been delineated
Scrub dominated: Land, as notified under the Forest Act andthose lands with various types of forest cover with less than 20 %of vegetative cover, are classified as degraded forest. These landsare generally confined to the fringe areas of notified forest.
Agricultural land inside notified forest land: This category refersto land that have been notified under the Forest Act, in whichagriculture is being practiced, (except for the de-notified forestareas)
7) Degraded pastures/grazing land
These are the lands in non-forest areas that are either under permanentpastures or meadows, which have degraded due to lack of proper soiland water conservation and drainage development measures.
8) Degraded land under plantation crop
These are the degraded lands that have been brought under plantationcrops after reclamation, and are located outside the notified forest areas.
9) Sand (coastal / desert / riverine)
This category refers to land with accumulation of sand, in coastal, riverineor inland areas. Generally, these lands vary in size, occur in various shapeswith contiguous to linear pattern. These lands are mostly found in deserts,riverbeds and along the shores.
10) Coastal sand
Coastal sands are the sands that are accumulated as a strip along theseacoast due to action of seawater. These are not being used for anypurpose like recreation.
11) Desertic sand
Desertic sands are those confined to arid environment where the rainfallis scanty. These lands are characterized by accumulation of sand in theform of varying size of sand dunes and height that have developed as aresult of transportation of soil through aeolian processes. The followingtwo categories of desert sands could be mapped based on their verticalapproximate heights.
7
Semi-stabilized to stabilized dunes with >40 m heightSemi-stabilized to stabilized moderately high dunes withheights ranging between 15 and 40 m
12) Riverine sand
Riverine sands are those that are accumulated in the flood plain of theriver as sheets, or sand bars. It also includes inland sand which wasaccumulated along the abandoned river courses or by reworking of sanddeposits by wind action leading to long stretches of sand dunes or sandcover areas noticed in Indo-Gangetic alluvial plains
13) Mining /Industrial wastelands
Mine dumps: are those lands where waste debris is accumulatedafter extraction of minerals. Included in this category is the mine /quarry areas subject to removal of different earth material (bothsurface and sub-surface) by manual and mechanized operations.Large scale quarrying and mechanical operations result in creationof mine dumps. It includes surface rocks and stone quarries, sandand gravel pits, soil excavation for brick kilns, etc
Industrial: These are areas of stockpile of storage dump ofindustrial raw material or slag/effluents or waste material orquarried/mixed debris from earth’s surface.
14) Barren Rocky Area
These are rock exposures of varying lithology often barren and devoid ofsoil and vegetative cover. They occur amidst hill-forests as openings oras isolated exposures on plateau and plains. Barren rocky areas occur
on steep isolated hillocks/hill slopes, crests, plateau and eroded plainsassociated with barren and exposed rocky/stony wastes, lateritic out-crops,mining and quarrying sites. The category also includes steep slopingareas devoid of vegetation cover that were classified separately in theearlier exercise.
15) Snow Covered and / or Glacial Area
These lands are under perpetual snow cover and are confined to theHimalayan region. The mountain peaks and slopes and high relief areasare the places where snow/glacial areas occurs
6.0 Methodology
The methodology essentially involves geo-referencing of satellite data,delineation of wastelands categories through on-screen visualinterpretation technique based on legacy data and limited ground truth,quality check, harmonization with land degradation, land use/ land coverdatasets and seamless database creation.
6.1 Satellite Data
Three season Resourcesat-1 LISS III satellite data viz. kharif, rabi andzaid for 2005-2006 were used for delineation of wastelands. Eisht hundredand fifty Resourcesat-1 LISS-III images were used in this exercise.
6.2 Data preparation
The Resourcesat 1 (LISS – III) data were geocoded and rectified usingorthorectified Landsat ETM+ images.
8
6.3 Delineation of Wastelands
The three-season images (normally as FCC) were displayed and thewastelands categories were delineated based on ground truth and legacydata. Resultant output was in vector format, which supports complex GISanalysis. Initially, classification of rabi season data was carried out.Resultant vector was overlaid onto kharif and zaid season’s satellite imageto incorporate the features which were better delineable in kharif as wellas zaid season’s image.
6.4 Quality Assurance Standards and Mechanism
The Quality Assurance and Standardization (QAS) mechanism includeschecking parameters such as interpretation, classification, area estimationand data base, etc. A two tier i.e. internal and external quality assessmentapproach was followed to ensure the quality of wastelands delineation.In order to maintain the quality of the outputs, two levels of QAS team i.e.Internal QAS team consisting of experts from participating organization,and external QAS team with experts drawn from NRSC, SAC and otherISRO / DOS centers had evaluated the mapping accuracies. A samplesize of approximately 10 per cent of the polygons in a state have beenevaluated. An over all mapping accuracy of about 90 per cent has beenachieved.
7.0 Spatial Distribution of Wastelands
A seamless mosaic showing the spatial distribution of wastelands in thecountry is given in Figure-1. An area of 18620 sq km covering Rann inGujarat, and 211.26 sq km in Rajasthan has not been included underwastelands, as it has been considered a separate land cover (seasonallywaterlogged category).
State-wise distribution of wastelands is given in Figure-2 and Table- 3.As evident from the figure and table, Jammu and Kashmir has more than50 per cent of its area under wastelands. There are two States viz.,Himachal Pradesh and Sikkim that have wastelands ranging between40 - 50 per cent. Five States viz., Uttarakhand, Rajasthan, Nagaland,Manipur and Mizoram have wastelands ranging between 20 to 40 percent while in Meghalaya wastelands occupy only 15 to 20%. There are 9States that accounted for the extent of wastelands ranging between 10 to15 per cent. Eight other States have wastelands ranging between 5 to 10per cent. Only 3 States and Union Territories have less than 5 per centarea under wastelands.
District-wise distribution of wastelands is given in Figure-3. In all, thereare 9 districts in the country with more than 5,00,000 ha. of geographicalarea under wastelands. Of these, 4 districts are located in Rajasthan, 3districts in Jammu and Kashmir, and one district each in Himachal Pradeshand Gujarat. There are 33 districts with an areal extent of wastelandsranging between 2,00,000 ha to 5,00,000 ha. These districts are mostlyconfined to the southern part of Andhra Pradesh, Western Maharashtra,eastern Rajasthan and northern parts of Uttarakhand and HimachalPradesh. There are 83 districts with areal extent of wastelands rangingfrom 1,00,000 ha to 2,00,000 ha. These are located in Andhra Pradesh,Himachal Pradesh, Uttarakhand, and 4 districts in the North EasternRegion. There are 106 districts with area of wastelands ranging between50,000 to 1,00,000 and 109 districts with areal extent of wastelands rangingbetween 25,000 to 50,000 ha that are predominantly confined to theDeccan Plateau and the central highlands of the country. 254 districts ofthe country have an areal extent of less than 25,000 ha of area underwastelands. These are mainly confined to the districts in the Indo-GangeticPlains of Punjab, Haryana, Uttar Pradesh, Bihar and West Bengal; coastaldistricts of Kerala and Tamilnadu and eastern part of Arunachal Pradesh.
9
The distribution of wastelands with respect to the percentage to totalgeographical area of each district is given in Figure-4. There are 10 districtsin the country which accounted for more than 50 per cent of thegeographical area of the district under wastelands. Of these, 4 districtsare located in Jammu and Kashmir, three districts in the north easternregion, two districts in Himachal Pradesh and one district in Rajasthan.81 districts of the country have accounted for wastelands ranging between20 to 50 per cent. These are confined to the States of Rajasthan, districtslocated in the western Himalayan foothills in the States of Jammu andKashmir, Himachal Pradesh, Uttarakhand and the north eastern statesof Mizoram, Manipur, Nagaland and eastern Meghalaya. There are 312districts that have an areal extent ranging between 5 to 20 per cent of thegeographical area under wastelands. The districts are predominantlyconfined to the Deccan Plateau, the Central high lands and to some extentthe Gangetic Plains of the country. There are 191 districts that have lessthan 5 per cent of the geographical area under wastelands. These arelocated in the Indo-gangetic plains, eastern Arunachal Pradesh, easternTamilnadu and Kerala.
Category-wise distribution of wastelands with respect to area andpercentage to the total geographical area are given in Table- 4. Of the 23categories of wastelands delineated in the country, 5 categories ofwastelands viz., land with dense scrub (2.95 %), land with open scrub(2.89 %), under-utilized degraded notified forest – scrub dominated ( 2.71%), barren rocky (2.19 %) and snow covered/glacial area (1.29 %) arethe dominant categories prevalent in the country. The other categories ofwastelands are having an areal extent of less than 1 % of the geographicalarea under wastelands. State-wise and category-wise distribution ofwastelands is given in Table- 5.
State-wise distribution of wastelands along with changes in wastelandsduring the period 2003 and 2006 is portrayed in Table- 6 and category-
wise changes in wastelands in Table- 7. The sub-categories of wastelandshave been collapsed to level 1 to facilitate analysis which is detailed below.Wastelands category-wise changes with respect to area and percentageto total Wastelands area for entire country are given in Figure-5.
8.0 Category-wise distribution of wastelands
8.1 Gullied and ravinous land (Medium and deep)
There are 228 districts that have a spatial extent of less than 5 per cent ofthis category spread across the country barring the north eastern region(Figure-6). This category is predominantly distributed along the Chambaland Yamuna river courses. The State of Rajasthan has the maximumarea under this category accounting to 1884.92 sq km of the area. This isfollowed by Madhya Pradesh (1502.06 sq km), and Uttar Pradesh (1481.11sq km). There are seven districts in Rajasthan viz., Alwar, Baran, Bundi,Dhaulpur, Karauli, Kota and Sawai Madhopur; three districts in MadhyaPradesh viz. Bhind, Morena and Sheopuri - Kalan; 7 districts in UttarPradesh, viz., Agra, Banda, Firozabad, Hamirpur, Jalaun, Jhansi andKanpur in which the areal extent of this category is more than 100 sq kmin each of the district.
8.2 Scrub land (Land with dense Scrub and open scrub)
This category has the tendency to be associated with all the physiographicregions in the country. There are 338 districts with less than 5 per cent ofthis category spread across the country. While in 184 districts that havea spatial extent ranging between 5 to 20 per cent of the geographicalarea under this category. There are 16 districts with 20 to 50 per cent ofthe area scattered across the country. This category, is confined mostlyto the States of Rajasthan, Maharashtra, Madhya Pradesh, Gujarat and
10
Andhra Pradesh wherein more than 15,000 sq km of the area has beenestimated under this category in each of the State (Figure-7).
8.3 Waterlogged / marshy land (seasonal and permanent)
This category has been found to be with in the districts located in GangeticPlains, the Brahmaputra Valley, Eastern Coastal plain and the districtslocated in western Rajasthan (Indira Gandhi canal command area). It isclear from Figure-8 that 202 districts that are affected by waterlogging.Of these, there is one district in Bihar that account for an area rangingbetween 10-15 per cent under this category; 6 districts have an arearanging between 5 – 10 per cent of the area under this category distributedin Bihar, Orissa and Assam. Remaining have less than 5 per cent of thearea under this category.
8.4 Land affected by salinity and alkalinity (Moderate and strong)
This category is mainly found inthe districts located in Gangetic Plains. Itwas estimated that 142 districts are affected by soil salinity/ or alkalinity,and are distributed in the States of Gujarat, Rajasthan, Punjab, Haryana,Uttar Pradesh, Karnataka, Andhra Pradesh and Tamilnadu (Figure-9). Ofthese, 3 districts that account for an area ranging between 5 to 10 percent are located in the State of Uttar Pradesh.
8.5 Shifting cultivation – current and abandoned
It is a land use practice prevalent in the Eastern Himalayan States and tosome extent in the State of Orissa. There are 20 districts located in thenorth eastern states with 5 to 50 per cent (7 districts with 15 to 50 percent and the remaining 13 districts with 5 to 15 per cent) of the geographicalarea. Contrastingly there are 44 districts accounting for less than 5 per
cent of the geographical area that are distributed in Orissa and NE States(Figure-10).
8.6 Under Utilized Degraded Notified Forest Land – Scrub Dominated
This category is confined to notified forest areas. There are 15 districtswith percentage of this category ranging between 15 to 50 per cent, 102districts with percentage varying between 5 to 15, and 329 districts thathave an areal extent of less than 5 per cent. (Figure-11).
8.7 Degraded pastures / grazing lands
Degraded pastures / grazing lands occur in the districts of west, north-west and northern States of the country viz., Gujarat, Rajasthan, Jammuand Kashmir and Uttarakhand. There are 111 districts having Degradedpastures / grazing lands. The spatial distribution of which is shown inFigure-12.
8.8 Degraded land under plantation crops
These are the areas mostly under agricultural plantations that aredistributed in the peninsular states of Tamilnadu, Andhra Pradesh,Karnataka, Maharashtra and Gujarat and to some extent in Haryana andJammu and Kashmir. There are 61 districts that accounted for less than5 per cent of the geographical area under this category (Figure-13).
8.9 Sands (desertic, coastal and riverine)
This category is seen distributed in 167 districts located in westernRajasthan, Punjab, Gujarat, east coast and few districts in the Gangeticplains (Figure-14). Of these, there are 4 districts in Rajasthan with anarea ranging between 10 – 50 per cent under desert sand.
11
8.10 Mining and Industrial wastelands
This category has an areal extent of less than 5 per cent of the geographicalarea of the state and are distributed in 128 districts. However, it ispredominant in southern Rajasthan, eastern Himachal Pradesh, northernOrissa, eastern Maharashtra, Karnataka and western Tamilnadu(Figure-15).
8.11 Barren rocky/stony waste
This category is distributed in almost all the districts in the country exceptthe Indo-Gangetic Plains and the Brahmaputra valley. There are 319districts with less than 5 per cent of the geographical area under thiscategory. However, there are only 7 districts with 5 - 10 per cent of thearea accounted for this category and there are 5 districts with an arealextent admeasuring more than 10 per cent under this category(Figure-16).
8.12 Snow covered / glacial area
There are 39 districts spread in the States of Jammu and Kashmir,Himachal Pradesh, Uttarakhand, Sikkim and Arunachal Pradesh that havesnow covered / glacial areas (Figure-17). Of these, 1 district in Sikkimhas an areal spread of more than 50 per cent of the area under thiscategory; 9 districts of Jammu & Kashmir, 4 districts each in Uttarakhandand Himachal Pradesh with areal extent ranging between 10 to 50 percent of the area. There are 3 districts wherein area under this categoryoccupies 5 - 10 per cent of the area.
9.0 State-wise distribution of wastelands
State-wise distribution of wastelands along with their temporal changesduring 2003 and 2005-2006 are given as figures and tables.
9.1 Andhra Pradesh
An area of 38,788 sq km corresponding to 14.10 % of the geographicalarea of the State has been estimated to be under wastelands (Figure-18,Table- 8). There has been a reduction in the spatial extent of wastelandsto the tune of 2.36 % with reference to the year 2003. In terms ofpredominance of wastelands category, degraded land under notified foresthas a maximum areal extent - 13123 sq. km (20097 sq. km in 2003 period).Kadapa district ranks first in the area under wastelands with 27.15 %while West Godavari district, located in the East Coast deltaic region hasthe least (1.59 %). Changes in wastelands with respect to 2003 are givenin Table- 9.
9.2 Arunachal Pradesh
The State shares international boundary with Bhutan, Tibet, China andMyanmar to the west, north-east, north and east respectively, and hasboundaries with Assam and Nagaland. The terrain consists of sub-montaneand mountainous ranges, sloping down to the plains of Assam, dividedinto valleys by the rivers Kameng, Subansiri, Siang, Lohit and Tirap.
The spatial database on wastelands generated for the State reveals anarea of 5743.84 sq km accounting for 6.86 % of total geographical area ofthe State (Figure-19, Table- 10) under wastelands. There has been adecrease in the area under wastelands to the tune of 14.85 % as comparedto 2003. Table- 11 depicts the changes in spatial extent of wastelands in
12
the state with respect to 2003. The district of Tawang accounts for 48.44% of area under wastelands while Upper Subansiri district has 1.15 %.
9.3 Assam
Assam is the sentinel of north-east India and gateway to the North-EasternStates. The State is close to India’s international borders with Bangladeshand Bhutan. Assam is surrounded by Bhutan and Arunachal Pradesh onthe north, Manipur, Nagaland and Arunachal Pradesh on the east andMeghalaya, Tripura and Mizoram on the south.
An area of 8778.02 sq km corresponding to 11.19 % of the totalgeographical area of the State has been delineated as wastelands (Figure-20, Table- 12). This estimate is less by 6.7 % as compared to that of2003. Details of changes in the spatial extent of wastelands are given inTable- 13. North Cachar Hills district recorded the maximum area of30.47 % under wastelands while Darrang district recorded the minimum.
9.4 Bihar
Bihar is bound on the north by Nepal, on the east by West Bengal, on thewest by Uttar Pradesh and on the south by Jharkhand. An estimated areaof 6841.09 sq km equivalent to 7.26 % of the area of the state is underwastelands (Figure-21, Table- 14). There has been a marginal increase(1.48 %) in the areal extent of wastelands (Table- 15). Jamul district with25.57 % area of the state under wastelands while Nalanda district hasthe least (0.15 %).
9.5 Chattisgarh
Chattisgarh is a state in central India, it takes its name from 36 (Chattis isthirty-six in Hindi and Garh is Fort) princely states in this region.
Chhattisgarh is bordered by Bihar, Jharkhand and Uttar Pradesh in thenorth, Andhra Pradesh in the south, Orissa in the east and MadhyaPradesh in the west
The total geographic area of Chattisgarh is 135194 sq. km, out of which11817.82 sq km is under wastelands (Figure-22, Table- 16). Degradedforest-scrub dominated is the major wasteland category that covers anarea of 3616.45 sq. km. In terms of the change in the wastelands ascompared to 2003, there has been an increase of 0.38 % in the areaunder wastelands (Table- 17). The district with maximum area underwastelands is Surguja with 17.80% of its area and the district with leastarea is Bastar with 3.55% of its total geographic area.
9.6 Delhi
Delhi became the centre of all activities after the capital was shifted fromKolkata (Calcutta). It was made a Union Territory in 1956. Lying in thenorthern part of the country, Delhi is surrounded by Haryana on all sidesexcept the east where it borders with Uttar Pradesh. The 69thConstitutional amendment is a milestone in Delhi’s history as it got aLegislative Assembly with the enactment of the National Capital TerritoryAct, 1991.
The total geographic area of Delhi is 1483 sq. km out of which 83.34 sq.km is under wastelands which accounts for 5.62 % of its area (Figure-23,Table- 18). Land with open scrub is the major wasteland category whichcovers an area of 58.09 sq. km. In terms of the change in the area underwastelands as compared to 2003, there has been a marginal increase ofthe order of 15.18 sq. km (Table- 19)
13
9.7 Goa
Goa is situated on the western coast of the Indian Peninsula. On its northruns the Terekhol river which separates Goa from Maharashtra and onthe south lies North Canara district of Karnataka. On the east lie theWestern Ghats and in the west the Arabian Sea. Panaji, Margao, Vasco,Mapusa and Ponda are the main towns of Goa.
The total geographic area of Goa is 3702.00 sq km, out of which 496.27sq. km is under wastelands which accounts for 13.41% of its geographicalarea (Figure-24, Table- 20). Spreading over an area of 216.38 sq. km,land with open scrub is the major wasteland category. In terms of thechange in the wastelands as compared to 2003, there has been a decreaseto the tune of 35.02 sq. km which is 0.95% of the geographical area ofthe State (Table- 21). North Goa district has maximum area: 15.76 % ofits total geographic area, under wastelands.
9.8 Gujarat
Gujarat is situated on the west coast of India. The state is bound by theArabian Sea on the west, Pakistan and Rajasthan in the north and north-east respectively, Madhya Pradesh in the south–east and Maharashtra inthe south.
The total geographic area of Gujarat is 196024.sq. km out of which21350.38 sq. km is under wastelands which accounts for 10.89% of itsgeographical area (Figure-25, Table- 22). Land with dense scrub is themajor wasteland category which covers an area of 11,614.83 sq. km. Interms of the change in the wastelands as compared to 2003, there hasbeen an increase in the wastelands to the tune of 972.64 sq. km (Table-23). The district with the maximum area of wastelands is Valsad with38.36 % and Kheda, the least 6.07 % of its total geographic area under
wastelands. The Rann area in Kutch district admeasuring an area of18,620 sq km has not been considered in estimating the wastelands ofthe State.
9.9 Haryana
Haryana is bound by Uttar Pradesh in the east, Punjab on the west,Himachal Pradesh on the north and Rajasthan on the south. NationalCapital Territory of Delhi juts into Haryana.
The total geographic area of Haryana is 44212.00 sq. km, out of which2347.05 sq. km is under wastelands which accounts for 5.31 % of itsgeographical area (Figure-26, Table- 24). Degraded pasture/grazing landis the major wasteland category that cover an area of 914.58 sq. km.There has been shrinkage to the tune of 919.40 sq. km as compared to2003 in wastelands (Table- 25). The district with the highest percentageof wastelands is Mewat with 15.81 % of its area and Kurukshetra with1.41 % of its total geographic area, the least.
9.10 Himachal Pradesh
Himachal situated in the heart of the Western Himalaya, identified as“Dev Bhumi” is believed to be the abode of God and Goddesses. Theshadowy valleys, rugged crags, glaciers and gigantic pines and roaringrivers and exquisite flora and fauna are the hallmark of Himachal Pradesh.
Out of the total geographic area of 55,673 sq. km, 22,470.05 sq. km isunder wastelands which accounts for 40.36 % of the geographical area(Figure-27, Table- 26). Apart from snow and glacier cover which accountsfor 21% of the total wastelands, barren and rocky area is the majorwasteland category covering an area of 5314.17 sq.km in the State. Theareal extent of this category generally depends upon the presence and
14
absence of snow cover at higher reaches and, in turn depends on theuse of season of satellite data used (Jan-Feb peak snow period and Marchon wards snow melts and barren rocks exposes), and availability of cloud-free satellite data. Since the satellite data was of March, 06 most of theareas are exposed and depicted as barren. In terms of the change in thewastelands as compared to 2003, there has been a decrease to the tuneof 5866.75 sq. km which is 10.54% of its geographic area (Table- 27).
9.11 Jammu and Kashmir
Geographically, the State can be divided into four zones. First, themountainous and semi-mountainous plain commonly known as Kandi belt,the second, hills including Shivalik ranges, the third mountains of KashmirValley and Pir Panjal range and the fourth is Tibetan tract of Ladakh andKargil. Geographically and culturally the state has three distinct regions -Jammu, Kashmir and Ladakh.
Out of the total geographic area of 1, 01,387 sq. km, 73,754.38 sq.km isunder wastelands which accounts for 72.75 % of its total geographicalarea (Figure-28, Table- 28). Barren Rocky area covering an area of46,379.45 sq.km constitutes the major wasteland category. In terms ofthe change in the wastelands as compared to 2003, there has been aincrease in the extent of wastelands by 3,552.39 sq. km correspondingto 3.5 %. (Table- 29).
9.12 Jharkhand
Jharkhand largely comprises of the forest tracks of Chhotanagpur plateauand Santhal Parganas. The State is characterized by thickly wooded areasand succession of hills.
The total geographic area of Jharkhand is 79,706 sq. km, out of which11670.14 sq.km is under wastelands which accounts for 14.64% of itstotal geographical area (Figure-29, Table- 30). Under utilised / degradednotified forest land-scrub dominated is the major wasteland category, whichcovers an area of 4400.59 sq. km. In terms of the change in thewastelands as compared to 2003, there has been an increase of 504.88sq. km (Table- 31). The district with the highest percentage of wastelandsis Simdega with 28.00 % of its area under wastelands and Godda districtwith 4.84% of its total geographic area, the least.
9.13 Karnataka
Karnataka is one of the southern states’ and the topography is variedwith the low lying coastal plains the rugged Western Ghats The totalgeographic area of Karnataka is 1,91,791 sq. km, out of which 14438.12sq. km is under wastelands which accounts for 7.53% of its geographicalarea (Figure-30, Table- 32). Under-utilsed /degraded notified forest land-scrub dominated is the major wasteland category, that covers an area of5245.32 sq.km. In terms of the change in the wastelands as comparedto 2003, there has been an increase to the tune of 901.54 sq.km (Table-33). The district with the highest percentage of wastelands is Bellary with17.37% of its area under wastelands, while Dakshin Kannanda with 2.13%of its total geographic area, has the least, wastelands.
9.14 Kerala
Kerala is in the extreme south-west of the Indian subcontinent. In betweenthe high Western Ghats on the east and the Arabian Sea on the west, thewidth of the state varies from 35 km to 120 km. According to thegeographical features, the state can be divided into hills, valleys, midlandplains and costal belt.
15
The total geographic area of Kerala is 38863 sq. km, out of which 2458.69sq.km is under wastelands which accounts for 6.33% (Figure-31, Table-34). Covering an area of 787.78 sq. km, land with open scrub is themajor wasteland category. In terms of the change in the wastelands ascompared to 2003, there has been an increase of 669.89 sq.km which is1.72 % of its geographical area (Table- 35). The district with highestpercentage of wastelands is Kasargod (16.45 % of its area) while Alappuzadistrict has the minimum area under wastelands.
9.15 Madhya Pradesh
Madhya Pradesh is the second largest Indian Sate in size in the country.Geographically it occupies pivotal position in the country. Madhya Pradeshcame into being on 1 November 1956. It was re-organised on 1 November2000 to create a new Chhattisgarh state. The successive state is boundin north by Uttar Pradesh, east by Chhattisgarh, south by Maharashtraand west by Gujarat and Rajasthan.
The total geographic area of Madhya Pradesh is 308252 sq. km, out ofwhich 40,042.98 sq. km is under wastelands corresponding to 12.99 percent of the geographical area of the State (Figure-32, Table- 36). Landwith open scrub is the major wasteland category, accounting for an areaof 16231.47 sq.km. There has been a decrease in area under wastelandsto the tune of 17091.05 sq.km (5.54%) as compared to 2003 (Table- 37).Shyopur and Kalanl district recorded a maximum of 28.44 % of its areaunder wastelands while Hoshangabad district with 3.13 %, the least.
9.16 Maharashtra
Maharashtra forms part of the Deccan plateau, its western upturned rimsrising to form the Sahayadri Range parallel to the sea-coast and its slopesgently descending towards the east and south-east. Satpura ranges cover
northern part of the State, while Ajanta and Satmala ranges run throughcentral part of State. Arabian Sea guards the western boundary ofMaharashtra, while Gujarat and Madhya Pradesh are on the northernside. Chhattisgarh covers the eastern boundary of the State. Karnatakaand Andhra Pradesh are on its southern side.
The total geographic area of Maharashtra is 3,07,690 sq. km, out of which38,262.81 sq.km is under wastelands accounting for 12.44% of thegeographical area of the State (Figure-33, Table- 38). Land with openscrub is the major wasteland category, accounting for an area of 13,242.14sq. km. There has been a decrease in the areal extent of wastelands tothe tune of 11012.60 sq. km (Table- 39). The district with the highestpercentage of wastelands is Raygad with 29.92% while Gondia districtwith 5.28 %, has the least percentage of wastelands.
9.17 Manipur
Manipur is situated on the eastern frontier of India. It is bound on the eastby Myanmar (Burma), on the north by the State of Nagaland, on the westby the State of Assam and on the south by the State of Mizoram andMyanmar. Physically Manipur comprises of two parts, the hills and thevalley. The valley is at the centre surrounded by hills on all sides. ManipurValley is about 790 metres above the sea level. The hill ranges are higheron the north and gradually diminish in height as they reach the southernpart of the State. The valley itself slopes down towards the south.
The total geographic area of Manipur is 22,327 sq. km, out of which anarea of 7,027.47 sq. km corresponding to 31.48 per cent of thegeographical area of the State under wastelands (Figure-34, Table- 40).Land with dense scrub is the major wasteland category which accountsfor an area of 3,718.87 sq. km. There has been a decrease in the areaunder wastelands to the tune of 6,147.27 sq. km corresponding to 27.53
16
per cent of its area (Table- 41). Senapati district has the maximum areaunder wastelands (35.10% of its area), while Bishnupur district (2.70 %of its area), has the least.
9.18 Meghalaya
Meghalaya literally means ‘the Abode of Clouds’ is essentially a hilly state.It is bound on the north and east by Assam and in the south and west byBangladesh. The Khasi Hills and Jaintia Hills which form the central andeastern part of Meghalaya is an imposing plateau with rolling grasslands,hills and river valleys. The southern face of the plateau is marked bydeep gorges and abrupt slopes, at the foot of which, a narrow strip ofplain land runs along the international border with Bangladesh.
Meghalaya has an areal extent of 22,429 sq. km out of which an area of3,865.76 sq.km accounting for 17.24 per cent of the geographical area ofthe State is estimated under wastelands (Figure-35, Table- 42). Landwith open scrub is the predominant wasteland category with an estimatedareal extent of 2640.10 sq. km. There has been an increase in the arealextent of wastelands to the tune of 454.35 sq. km as compared to 2003(Table- 43). Jaintia Hills districts with 25.36% of its area under wastelands,ranks first in the areal extent of wastelands with 25.36 %, while the SouthGaro Hills district has the least (10.11 % of its area).
9.19 Mizoram
In between Myanmar in the east and the south and Bangladesh in thewest, Mizoram occupies an area of great strategic importance in thenortheastern corner of India. Mizoram has great natural beauty and anendless variety of landscape.
The total geographic area of Mizoram is 21,081 sq. km, out of which6,021.14 sq. km accounting for 28.56 per cent of the geographical areaof the State is under wastelands (Figure-36, Table- 44). With an area of3,367.26 sq.km, Under utilised/degraded notified forest land-scrubdominated is the predominant wasteland category. There has been anincrease in the area under wastelands to a tune of 1,551.26 sq.km ascompared to 2003 (Table- 45). Champai district recorded a maximumextent of wastelands (43.21% of its area), while Mamit district (22.47 %,of its area) has the least.
9.20 Nagaland
The State is mostly mountainous except those areas bordering Assamvalley. Mount Saramati is the highest peak in Nagaland with a height of3,840 metres and its range forms a natural barrier between Nagalandand Myanmar.
Nagaland has an areal extent of 16,579 sq. km, out of which an area of4,815.18 sq. km corresponding to 29.04 per cent of the geographicalarea of the State is under wastelands (Figure-37, Table- 46). Admeasuringan areal extent of 1,588.65 sq. km, Abandoned shifting cultivation is thepredominant wasteland category. There has been an increase in the arealextent under wastelands to the tune of 1,105.78 sq. km (Table- 47). Mondistrict with 58.66 % has the maximum area under wastelands, whileWokha district, has the least areal extent with 18.29 %.
9.21 Orissa
Orissa is situated in the north-eastern part of the Indian peninsula. It isbound by the Bay of Bengal on the east, West Bengal on the north-east,Jharkhand on the north, Chhattisgarh on the west and Andhra Pradeshon the south. The state may be broadly divided into four geographical
17
regions-the northern plateau, central river basin, eastern hills and coastalplains.
Orissa has a geographical extent of 1,55,707 sq. km, out of which16,648.27 sq. km corresponding to 10.69 per cent to the total geographicalarea of the State is under wastelands (Figure-38, Table-48). Thepredominant wasteland category comprises land with dense scrubaccounting for an area of 5445.08 sq. km. A decrease in the areal extentin wastelands to the tune of 2,304.47 sq. km was observed in comparisonto 2003 (Table-49). It was observed that Gajapati district has maximumarea under wastelands with 25.02 %, while Bhadrak district, accountingfor 1.37 % of its geographical area, the least.
9.22 Punjab
Situated in the north-western corner of the country, Punjab is bound inthe west by Pakistan, in the north by Jammu and Kashmir, in the north-east by Himachal Pradesh and in the south by Haryana and Rajasthan.
The State has an areal extent of 50,362 sq. km, out of which 1,019.50 sq.km corresponding to 2.02 per cent of the total geographical area of theState is under wastelands (Figure-39, Table-50). Admeasuring an area of394.35 sq. km, Sands-Desertic is the predominant wasteland category.There has been a decrease in the areal extent of wastelands in the Stateto the tune of 153.34 sq. km (Table- 51). Rupnagar district with 7.08 % ofits area ranks highest in the areal extent of wastelands while FatehgarhSahib district with 0.04 % of its area, ranks the least.
9.23 Rajasthan
The entire western flank of the state borders with Pakistan, while Punjab,Haryana, Uttar Pradesh and Madhya Pradesh bind Rajasthan in north-east, south–east and Gujarat in south-west.
Out of 3,42,239 sq. km the total geographic area of Rajasthan, 93,689.47sq. km corresponding to 27.38 per cent of the total geographical area ofthe State is under wastelands (Figure-40, Table-52). With an area of15,586.44 sq. km, Sands-semi-stabilised- stabilised moderate high (15-40m) is the major wasteland category in the State. There has been adecrease to the tune of 7,764.39 sq. km in the area under wastelands ascompared to the year 2003 (Table- 53). Jaisalmer district in westernRajasthan recorded the maximum extent under wastelands with 68.34 %while, Churu district the minimum (4.24 % of its area). An areaadmeasuring 211.26 sq km covering the districts of Jalore (162.86 sqkm) and Barmer (48.40 sq km) has not been considered for estimatingthe wastelands of the State as the area is an extension of Rann of Kachchhfrom Gujarat State.
9.24 Sikkim
Sikkim is a small hilly state, bounded by vast stretches of Tibetan Plateauin the North, the Chumbi Valley of Tibet and the Kingdom of Bhutan in theEast, the Kingdom of Nepal in the West and Darjeeling district of WestBengal in the South.
The State has an areal extent of 7,096 sq. km, out of which 3,280.88 sq.km of the area corresponding to 46.24 per cent of the total geographicalarea of the State is under wastelands (Figure-41, Table- 54). Admeasuringan area of 2,633.66 sq. km, snow covered and glacial area is the majorwasteland category followed by barren rocky area with an areal extent of579.90 sq. km. There has been a decrease in the areal extent underwastelands by 527.33 sq. km as compared to 2003 (Table- 55). NorthSikkim has the maximum area (67.49% of its area) under wastelandswhile South Sikkim accounted for 6.88%, with the lowest extent.
18
9.25 Tripura
Tripura is strategically situated between the river valleys of Myanmar andBangladesh. Encircled almost on three sides by Bangladesh, it is linkedwith Assam and Mizoram in the North-East.
Tripura has an area of 10,486 sq. km, out of which 1315.17 sq. kmcorresponding to 12.54 per cent of the total geographical area of the Stateis under wastelands (Figure-42, Table- 56). Under utilised/degradednotified forest land-scrub dominated is the predominant wastelandcategory, which account for an area of 522.52 sq. km. There has been amarginal decrease in the spatial extent of wastelands to the tune of 7.80sq. km as compared to 2003 (Table- 57). West Tripura district recordedthe maximum area with 15.56 % of its geographical area under wastelandswhile South Tripura with 8.72 %, ranks the least.
9.26 Tamilnadu
Located in the south-eastern part of the country, Tamil Nadu is boundedin north by Andhra Pradesh and Karnataka in west by Kerala, in east bythe Bay of Bengal and in south by the Indian Ocean.The State has an areal extent of 1,30,058 sq. km, out of which an areaadmeasuring 9,125.56 sq. km is under wastelands corresponding to 7.02per cent of the geographical area of the State (Figure-43, Table- 58). Thepredominant wasteland category covering an area of 2600.55 sq.km isunderutilized degraded notified forest-scrub dominated category. Therehas been a decrease in the extent of wastelands to the tune of 8,177.73sq. km corresponding to 6.29 per cent of its geographical area. (Table-59). Erode district with 18.06 % accounted for the maximum area underwastelands , while Chennai (1.26 % of its area), ranks the least.
9.27 Uttarakhand
Located in the foothills of the Himalayas, the State has internationalboundaries with China (Tibet) in the north and Nepal in the east. On itsnorthwest lies Himachal Pradesh while in the south it is bound by UttarPradesh.
The State of Uttarakhand has a geographical extent of 53,483 sq. km, outof which 12790.06 sq. km corresponding to 23.91 per cent of thegeographical area is under wastelands (Figure-44, Table- 60). Threemajor categories of wastelands viz., snow cover and glacial area with aspatial extent of 9,216.87 sq km, land with open scrub and barren rocky/stony waste area accounting for a spatial extent of 1,142.16 sq km eachare the major categories occurring in the State. There has been a decreasein the areal extent of wastelands to the tune of 3307.40 sq. km as comparedto 2003 (Table- 61) Pithoragarh district with 48.88 % of its geographicalarea has the maximum extent of wastelands in the State while UdhamSingh Nagar district with 0.64 % of the area has the least extent ofwastelands.
9.28 Uttar Pradesh
Uttar Pradesh is bound by Uttaranchal and Himachal Pradesh in the north,Haryana in the west, Madhya Pradesh in the South and Bihar in the east.Uttar Pradesh can be divided into two distinct regions (i) Southern Hills(ii) Gangetic Plain.
The State has a geographical extent of 2,40,922 sq.km, out of which anestimated of 10988.59 sq. km corresponding to 4.56 per cent of thegeographical area of the State is mapped as wastelands (Figure-45,Table- 62). Land affected by salinity/alkalinity-moderate is the predominantwasteland category that covers an area of 2,193.28 sq. km. There has
19
been a decrease in the spatial extent of wastelands by 5995.57 sq. kmcorresponding to 2.49 per cent as compared to 2003 (Table- 63). Etawahdistrict has a maximum extent of wastelands (12.50 % of its area), whileBijnor district (0.09 % of its area) has the minimum area under wastelands.
9.29 West Bengal
The land frontiers of the State touch Bangladesh in the east and areseparated from Nepal in the west, Bhutan lies in the north-east, whileSikkim in the north. On the west are the states of Bihar, Jharkhand, whilein the south lies Orissa, and the Bay of Bengal washing its southernfrontiers.
The State of West Bengal has a spatial extent of 88,752 sq. km, out ofwhich 1994.41 sq. km corresponding to 2.25 per cent of the geographicalarea of the State is under wastelands (Figure-46, Table-64). With an areaof 802.46 sq. km, Land with open scrub is the predominant wastelandcategory . There has been a decrease in the spatial extent of wastelandsto the tune of 2,403.15 sq. km which is mainly due to the usage of threeseason satellite data (Table- 65). Puruliya district has maximum area(9.66 % of its geographical area) under wastelands while Koch Bihar,Murshidabad and Nadia districts (0.01 % of its area), ranks the least.
9.30 Union Territories
There are 6 Union Territories, namely, Andaman and Nicobar Islands,Chandigarh, Dadra and Nagar Haveli, Daman and Diu, Lakshadweepand Pondicherry (Figures-47, 48).
i) Andaman and Nicobar Islands The group of 572 islands/ Isletslies in the Bay of Bengal, 193 km from Cape Negaris in Myanmar,
1,255 km from Kolkata and 1,190 km from Chennai. Two principalgroups of islets are the Ritchie’s Archipelago and LabyrinthIslands. The Nicobar Islands are situated to the south of AndamanIslands, 121 km from Little Andaman Island. There are 38inhabited islands, including 25 in the Andaman district and 13 inthe Nicobar district.
ii) Chandigarh is a fully grown town of most modern architecturalsplendor. The city nestles in a picturesque setting in the foothillsof Shivalik hills and enjoys the popular epithet the “City Beautiful”.
iii) Dadra has an area of 491 sq km and it is surrounded by Gujaratand Maharashtra. It consists of two pockets namely, Dadra andNagar Haveli.
iv) Daman and Diu It is bound on the east by Gujarat, on the westby the Arabian Sea, on the north by the Kolak river and on thesouth by Kalai river. The neighboring district of Daman is Valsadin Gujarat. Diu is an island connected by two bridges. Theneighboring district of Diu is Junagadh (Gujarat).
v) Lakshadweep a group of coral islands consist of 12 atolls, threereefs and submerged sand banks. Of the 27 islands, only 11 areinhabited. These lie scattered in the Arabian Sea about 280 km to480 km off Kerala coast.
vi) Pondicherry is bound on the east by the Bay of Bengal and onthe three sides by Tamil Nadu. About 150 km south of Pondicherryon the East Coast lies Karaikal. Mahe is situated on the MalabarCoast on the Western Ghats surrounded by Kerala. It can bereached from Calicut Airport, which is 70 km from Mahe. Yanam

20
is situated adjoining the East Godavari district of Andhra Pradeshand is about 200 km from Visakhapatnam airport
The total geographical area of all the Union territories is 9490 sq km, ofwhich of 337.30 sq km corresponding to 3.55 per cent of its geographicalarea is under wastelands (Table- 66) There is an increase to the tune of22.92 sq km under wastelands in these areas as compared to 2003 (Table-67). Change in area under wastelands in each of the union territories isgiven in Tables 68 to 74. It is observed that the percentage of land underwastelands in all the union territories is marginal, with the maximum inDadra (accounting for 10.85 % of its area), followed by Daman (8.72% ofits area).The remaining Union Territories have an average of less than3% with Lakshadweep Islands having only 1.87% of wastelands.
10.0 Change analysis
As mentioned earlier, wastelands mapping was carried out earlier for twotime periods i.e. 1986-2000 and 2003. During the first time, analysiscarried out in five phases using three period satellite data sets i.e. 1986-88, 1991-92 and 1997-98 in fourteen years. The second cycle of mappingwas carried out using satellite data acquired during February-March 2003.The third cycle has now been completed with the satellite data of 2005-06. However, there has not been consistency in satellite data used,definition and number of categories of wastelands and methodologyfollowed for their delineation. In the first cycle spanning from 1986-2000,Landsat – TM data with 30m spatial resolution, IRS-1A LISS-II data with36.25 m resolution and IRS-1C & ID LISS III data with 23.5m spatialresolution acquired during rabi (dry) season at 1:50,000 scale wasinterpreted visually. Furthermore as mentioned earlier, the mappingexercise was carried out in five phases spanning over a period of 14years. In the second cycle of 2003, IRS 1C & ID LISS III digital data of
rabi (dry) season was used to delineate wastelands through on-screenvisual interpretation.The minimum mappable area in the first cycle works out to be 2.25 haconsidering 3x3 mm as a minimum mappable unit whereas on-screenvisual interpretation of LISS-III digital data enabled not only enlarging theimage to 1:35,000 scale but also provided the scope for various kinds ofimage enhancements that helped improved delineation of wastelandscategories particularly those exhibiting poor spectral contrast.
Another major difference between these two cycles of wastelands mappingwas in the classification scheme followed. Whereas 13 categories ofwastelands were mapped in the first cycle (1986-2000), further divisionwithin each of these categories indicating the magnitude of the problem,very important from rehabilitation of wastelands, were made in the secondcycle (2003) in which a total of 28 categories were mapped.
The present cycle involves generation of wastelands maps at 1:50,000scale for the entire country from three cropping seasons i.e. kharif, rabiand zaid from Resourcesat- 1 LISS-III digital and georectified data for2005-06. The LISS-III data of 2005-06 was brought to UTM projectionand WGS 84 datum to comply with the national map policy. In the first twocycles of mapping i.e. 1986-2000 and 2003, the satellite data used werein polyconic projection and Everest 1956 datum. The vector layer ofwastelands for 2003 period was subsequently converted to LCC projectionand modified Everest datum.
In order to study the temporal behaviour of wastelands during 2003 and2005-06, the vector layer of wastelands of 2003 which was in LCCprojection and modified Everest datum was re-projected to UTM projectionand WGS84 datum. As evident from the preceding, efforts were made tomake both the datasets i.e. IRS-1C/1D LISS-III of 2003 and Resourcesat-
21
1 LISS-III to a common projection and datum, still there is a substantialdifference in these two datasets. The differences are as follows:
• Seasonality of satellite data: While only dry season (rabi)data was used in 2003, three cropping season data formed thedatabase for delineation of wastelands during 2005-06.
• Definition and categories of wastelands: Whereas 28categories of wastelands were delineated in 2003, in 2005-06,based on previous experience, some of the categories with verylittle spatial extent were merged with corresponding majorcategories, thus making the total number of wastelandscategories as 23. For instance, slightly salt-affected land hasbeen merged with moderately salt-affected land. Similarly,shallow ravines have been merged with medium ravinescategory. Conversely, the category land with or without scrubwas segregated into ‘land with dense scrub’ and ‘land with openscrub’ (Table-2).
• Satellite data projection and datum: The two datasets i.e.2003 and 2005-06 differed in map projection and datum.Whereas LCC and Modified Everest datum was maintained in2003 dataset, in case of 2005-06, the satellite data had UTMprojection and WGS84 datum. As mentioned earlier, thoughthe efforts were made to change the projection and datum ofthe LISS-III data of 2003, in consonance with LISS-III data 2005-06, required precision in terms of positional accuracy could notbe achieved. Hence, instead of change detection with the helpof 2003 vector layer of wastelands, a fresh mapping ofwastelands was carried out using three season i.e. kharif, rabiand zaid season LISS-III data.
In view of the above mentioned differences in two datasets i.e. 2003and 2005-06, a patch-by-patch comparison of wastelands could notbe carried out. Consequently only area statistics in a tabular form hasbeen provided.
A comparative analysis of the areal extent of wastelands shows areduction of 8.21 M ha (63.85 to 55.64 M ha) area between first andsecond cycles. Furthermore, in the current cycle, there is furtherreduction in the area under wastelands to the order of 8.41 M ha (47.22M ha.) over the 2003 cycle.
11.0 Conclusions
The analysis of three cropping season Resourcesat-1 LISS-III imageshas enabled improved delineation of various categories of wastelandswith limited field checks (Figures-51, 52, 53). During 2003, only singleseason (rabi) satellite data was used that precluded discrimination ofcategories like fallow lands, seasonally waterlogged, scrubs orpastures, snow-covered areas displaying intra-annual variations in thespectral response pattern (Figures-50).
An estimated 47.22 M ha. has been found to be under wastelands in2006, which is 14.91 % of the total geographical area of the country.
The temporal analysis of the areal extent of wastelands between2005-06 and 2003 shows a reduction of 8.41 M ha which is equivalentof 2.66% of the wastelands in 2003. (Figure-5). This is in comparisonto the change reported during 2000 and 2003, wherein there was ashrinkage in the area under wastelands by 8.21 M ha, which isequivalent to 2.60 per cent of the wastelands area in the year 2000.
22
REFERENCES
1. Ministry of Rural Development and National Remote SensingAgency (NRSA), Wastelands Atlas of India 2000, NationalRemote Sensing Agency, Dept. of Space, Govt. of India,Hyderabad 2000.
2. Sehgal, J. and Abrol, I. P. (1994), Soil degradation in India: Status
& Impact, Oxford & IBH Publishing Co. Pvt Ltd, New Delhi.
The differences observed in the area of various wastelands categoriesduring 2003 and 2005-06 could be attributed to one or a combinationof the following:
Changes in the datum and projection of satellite data.Usage of single (dry) season satellite data versus three seasonsatellite data. (Figure-50).Inconsistencies in the definition and the number of categories ofwastelands, andReclamation efforts made by various central, state and non-governmental organisations.
The unique feature of the current project has been on-screeninterpretation of three-season satellite images with projection and datumcompatible with Open Series Map (OSM) of Survey of India which willfacilitate dissemination of the data to a wider user community.Furthermore, the database, thus created, will serve as the soundreference base on wastelands for studying their temporal behaviour.
23
1. India. National Rainfed Area Authority, Min. of Agriculture,Govt. of India, New Delhi.
2. Abrol, I. P. and Dhruva Narayana, V. V. (Technical Eds.) (1990): Technologies for Wasteland Development; Publication andInformation Division, ICAR, New Delhi.
3. Aggarwal J. P. (1988) : Role of remote sensing techniques insite identification for afforestation programme in wasteland areas.Wasteland Development for fuel-wood and fodder productionEd. G. P. Maithana, Forest Research Institute, Dehradun. pp11 – 13.
4. Anderson, J. (1971) : Land use classification schemes used inselected recent geographic application of remote sensing. PE& RS, 37 : 379 – 387.
5. Aronoff, S. (1982) Classification accuracy: a user approach.Photogrammetric Engineering and Remote Sensing, 48, pp.1299 – 1307.
6. Belward, Alan S. and Valenzuela, Carlos R. (Ed.) (1991) :Remote Sensing and Geographical Information Systems forResource Management in Developing Countries ; KluwerAcademic Publishers, Dordrecht.
7. CAZRI (1998) : Inventory of geographical distribution of aridwastelands and testing of existing technologies in participatorymode. Jodhpur.
8. Congalton, R. G. (1991) : A review of assessing the accuracyof classifications of remotely sensed data. Remote Sensing ofEnvironment, 37, pp. 35 – 46.
9. Dass H. C., Harsh L. N., Shankarnarayana K. A. (1988) :Techniques for wasteland afforestation of arid areas in Rajasthan.Wasteland development for fuel-wood and fodder production.Ed. G. P. Maithana, Forest Research Institute, Dehradun, pp265 – 275.
10. Edwards JR, T. C., Moisen, G. G. and Cutler, D. R. (1998) :Assessing map accuracy in a remotely sensed, eco-region-scalecover map. Remote Sensing of Environment, 63, pp. 73 – 83.
11. Forest Research Institute (1988) : Wasteland Development forFuel-wood and Fodder Production. FRI Press, New Delhi.
12. Gadgil M., Guha R. (1995) : Ecology and Equity : The Use andAbuse of Nature in Contemporary India (Routledge, London).
13. Government of India Ministry of Environment and Forests (1990): Developing India’s Wastelands (Government of India, NewDelhi).
14. Hoeschele, (2000) : Geographic information engineering andsocial ground truth in Attappadi, Kerala State, India. Annals ofthe Association of American Geographers 90 293 – 321.
15. Hooja B (1984) : Rajasthan 2000 A. D. and the challenges ofland management. Resource Management in Drylands Eds. H.G. Mensching, R. C. Sharma. Rajesh Publications, New Delhi,pp 237 – 254.
16. Karale, R. L., Saini, K. M. & Narula, K. K. (1988) : Mapping andmonitoring ravines using remotely sensed data, Journal SoilWater Conservation India 31 (1, 2), 76.
17. Khan, I (1987) : Wasteland Afforestation (Techniques andSystems), Oxford and I. B. H. Pub. Co. Pvt. Ltd., New Delhi.
BIBLIOGRAPHY
24
18. Lillesand T. M., Kiefer R. W. (1994) : Remote sensing and imageinterpretation. John Wiley, New York.
19. Ma, Z., Hart, M. M. and Redmond, R. L. (2001) : Mappingvegetation across large geographic areas : integration of remotesensing and GIS to classify multi-resource data. PERS 67, pp.295 – 307.
20. Muthana K. D. (1988) : Afforestation of arid zones wastelandsfor fuelwood and fodder production. Wasteland developmentfor fuel-wood and fodder production. Ed. G. P. Maithani, ForestResearch Institute, Dehradun, pp 40 – 42.
21. NRSA (1987): Manual of procedure for wasteland mapping usingremote sensing techniques.
22. NRSA (1989) : Manual of nationwide land use / land covermapping using satellite imagery.
23. NRSA (1990) : IRS – Utilisation programme ; soil erosionmapping. Project report.
24. NRSA (1991) : Guidelines to use wasteland maps pp 1 – 72.25. NRSA (1997) : Manual of procedure for preparation of wasteland
digital data base using remote sensing & GIS techniques, pp 1– 90.
26. NRSA (2001) : Management of salt affected soils and rationalland use at village level using remote sensing and GIStechniques in part of south coastal region of Andhra Pradesh.Project Report.
27. NRSA (2002) : Integrated Mission for Sustainable Development– Path to Progress.
27. NRSA and Ministry of Rural Development (2005) : WastelandsAtlas of India, 2005. NRSA, Dept. of Space, Govt of India,Hyderabad.
28. NRSA (2006) : Manual of national land use/land cover mappingusing multi-temporal satellite data.
29. NRSA (2007) : Manual of national wastelands monitoring usingmulti-temporal satellite data.
30. NWDB (1991) : Description and classification of wastelands.National Wastelands Development Board, Ministry ofEnvironment & Forests, Government of India, New Delhi.
31. Robbins P. (2001) : Interrogating land cover categories :metaphor and method. Remote Sensing, Cartography andGeographic Information Science.
32. Roy, A. K. and Verma S. K. (2001). Wasteland Managementand Environment. Scientific Publishers, Jodhpur, India.