Waste to Energy - Universiti Kebangsaan Malaysia to ENERGY: Upgrade BioGas To Methane For Engine
36
Waste to Energy Muhammad Kismurtono UPT-BPPTKimia,LIPI Jl.Giading-Wonosari Km.7, Gading, Playen, Gunungkidul
Transcript of Waste to Energy - Universiti Kebangsaan Malaysia to ENERGY: Upgrade BioGas To Methane For Engine

Waste to Energy Muhammad Kismurtono
UPT-BPPTKimia,LIPI
Jl.Giading-Wonosari Km.7,
Gading, Playen, Gunungkidul
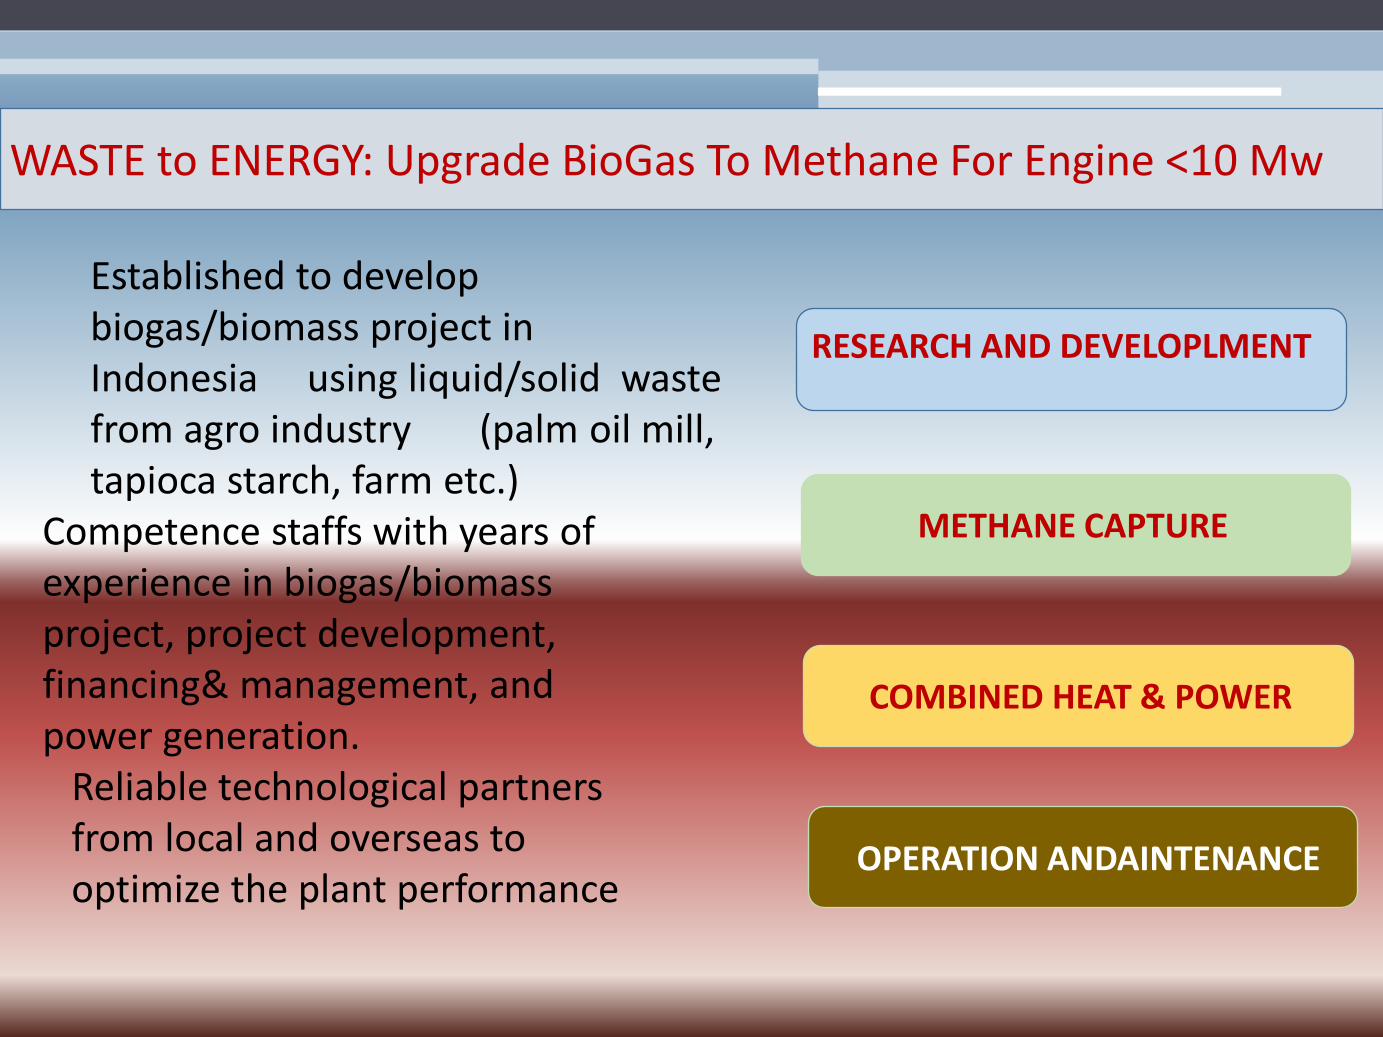
WASTE to ENERGY: Upgrade BioGas To Methane For Engine <10 Mw
RESEARCH AND DEVELOPLMENT
METHANE CAPTURE
COMBINED HEAT & POWER
OPERATION ANDAINTENANCE
Established to develop biogas/biomass project in Indonesia using liquid/solid waste from agro industry (palm oil mill, tapioca starch, farm etc.)
Competence staffs with years of experience in biogas/biomass project, project development, financing& management, and power generation. Reliable technological partners from local and overseas to optimize the plant performance

POME Biogas System; Bioflow Anaerobic Pond Capped Process Control and Monitoring Data recording Biogas Distribution system Biogas Treatment system Biogas Utilization - Heat & Power
Palm Biomass System
Fuel preparation system Heat recovery system
EFB Pelletizing plant
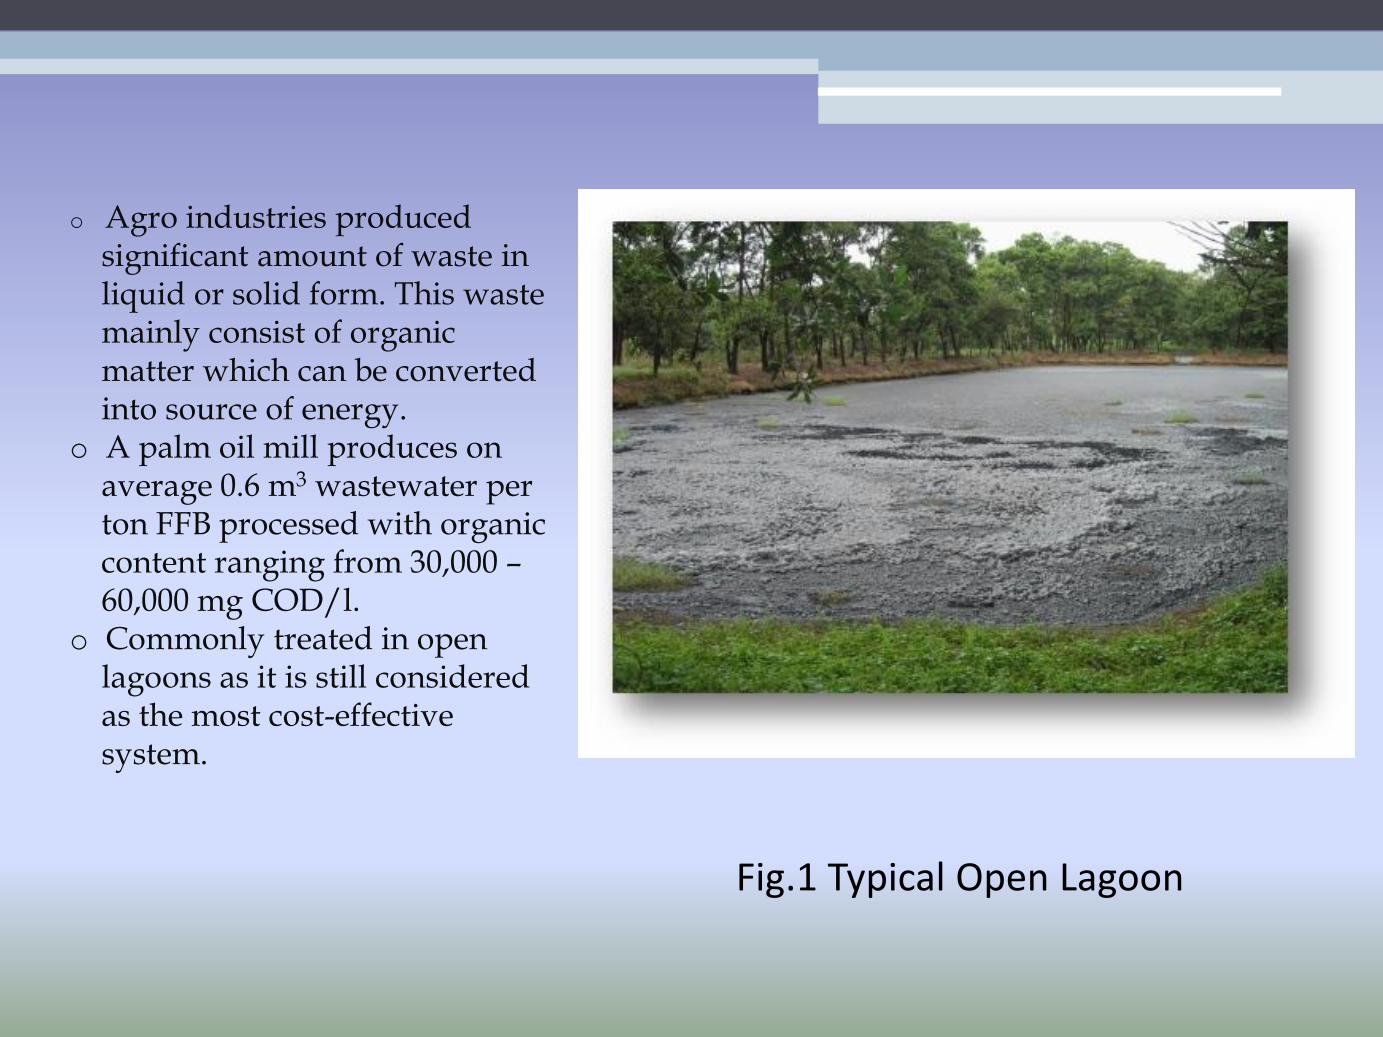
o Agro industries produced significant amount of waste in liquid or solid form. This waste mainly consist of organic matter which can be converted into source of energy. o A palm oil mill produces on average 0.6 m3 wastewater per ton FFB processed with organic content ranging from 30,000 – 60,000 mg COD/l. o Commonly treated in open lagoons as it is still considered as the most cost-effective system.
Fig.1 Typical Open Lagoon

Road Map: Potensi BioMasa untuk Energi Alternative

Palm Oil Mill Effluent (POME) Characteristics
Parameters Value
COD total
pH 4.2 ±0 mgCOD1
Suspended Solids
COD soluble
Carbohydrate total
Volatile Suspended Solids
Lipids total
Proteins total
Minerals
Ca: 860, Mg: 800, Fe:126, Zn:1.1, K: 2,470, Na: 130, B: 5.18, Mn: 9.22 mg/l
89,933 + 32,621
38,850 + 11,950
30,054 + 10,742
27,226 + 9,156
29,384 + 17,983
25,340 + 7,580
19,427 + 3,781
mgCOD1
mg/l
mg/l
mg/l
mg/l
mg/l
mg/l

Palm Oil Mill Effluent (POME)

Temperature
range
°C
Methanobacterium 37 – 45
Methanobrivibacter 37 – 40
Methanosphaera 35 – 40 6.8
Methanothermus 83 – 88 6.5
Methanococcus 35 – 40
Methanocorpusculum 30 – 40
Methanoculleus 35 – 40
Methanogenium 20 – 40 7.0
Methanoplanus 30 – 40
Methanospirillum 35 – 40 7.0 – 7.5
Methanococcoides 30 – 35 7.0 – 7.5
Methanohalobium 50 – 55 6.5 – 7.5
Methanolobus 35 – 40 6.5 – 6.8
Methanosarcina 30 – 40
Methanothrix 35 – 50 7.1 – 7.8
Genus pH
Optimal growth temperature and optimal pH
of some methane-producing bacteria
Substance Gas yield
m³/kg
CH4 Content
% by volume
Carbohydrates 0.830 50
Proteins 0.610 65
Lipids 1.430 71
Specific biogas yields
Michael H. Gerardi: The Microbiology of Anaerobic Digesters, 2003

Temperature
CH4 H2O
CO2 H2
reduction of carbon dioxide
CO2 + 4 H2 → CH4 + 2 H2O ∆ G0 = - 135,6 kJ
Feature
Mesophilic Thermophilic
Digester Digester
Loading rates Lower Higher
Destruction of pathogens Lower Higher
Sensitivity of toxicants Lower Higher
Operational costs Lower Higher
Temperature control Less difficult More difficult
Michael H. Gerardi: The Microbiology of Anaerobic Digesters, 2003
CH3COOH
CH4 H2O
CH3COO־ H+
decarboxylation of acetic acid
CH3COOHà CH4 + CO2 ∆ G0 = - 31 kJ
Temperature Range for Methane Production
Temperature [°C] Methane Production
35 Optimum
32 - 34 Minimum
21 – 31 Little, digester going „sour“
< 21 Nil, digester is „sour“
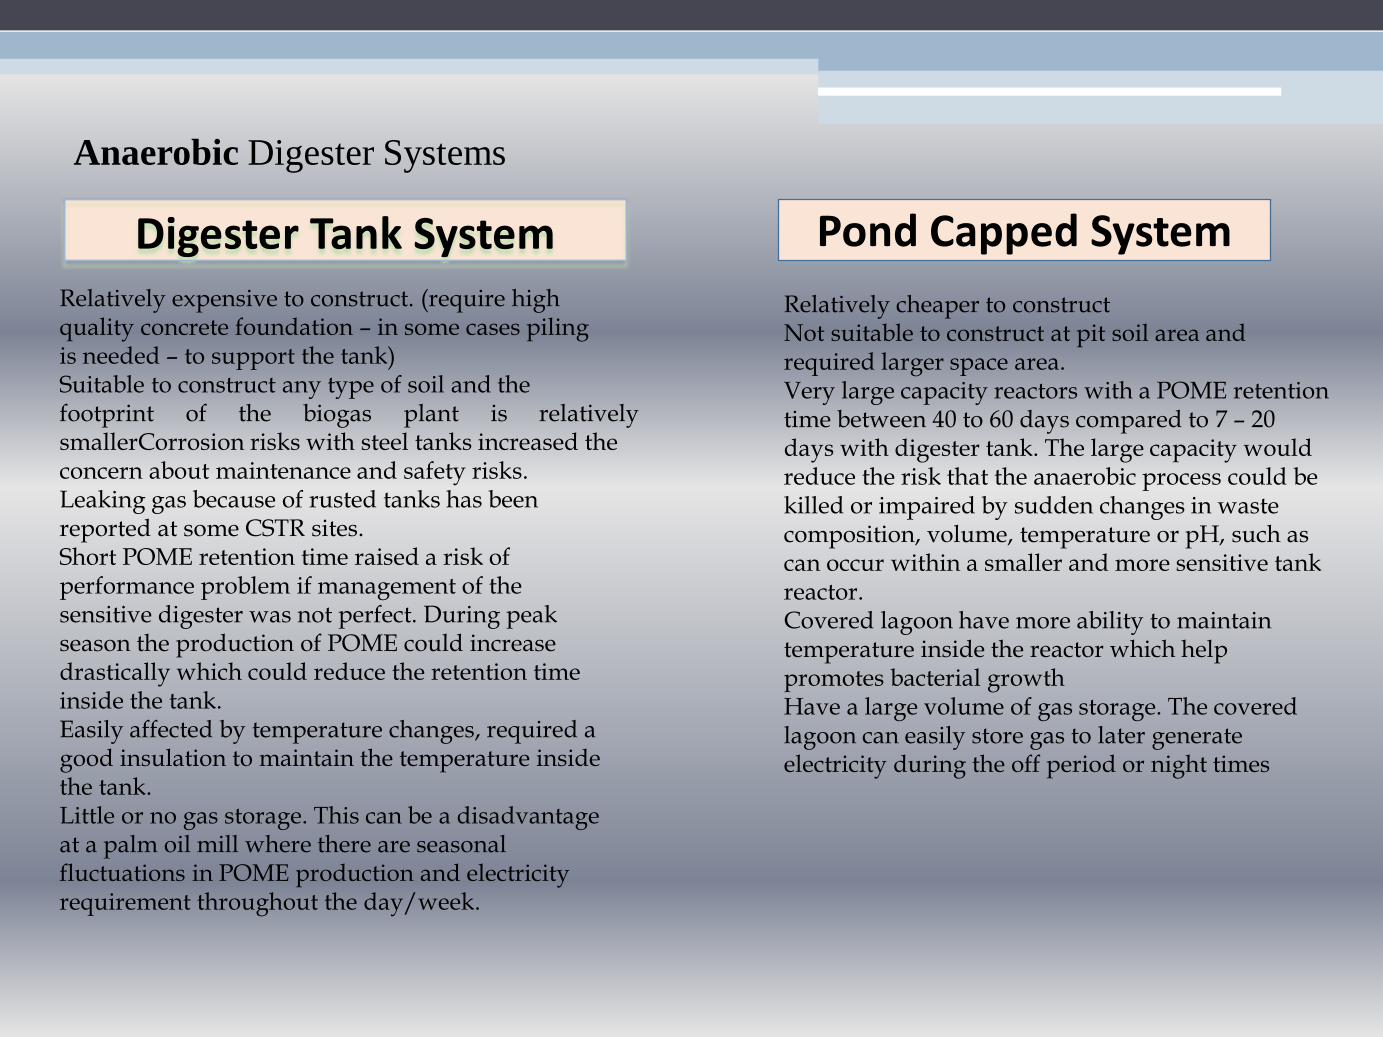
Anaerobic Digester Systems
Digester Tank System Relatively expensive to construct. (require high quality concrete foundation – in some cases piling is needed – to support the tank) Suitable to construct any type of soil and the footprint of the biogas plant is relatively smallerCorrosion risks with steel tanks increased the concern about maintenance and safety risks. Leaking gas because of rusted tanks has been reported at some CSTR sites. Short POME retention time raised a risk of performance problem if management of the sensitive digester was not perfect. During peak season the production of POME could increase drastically which could reduce the retention time inside the tank. Easily affected by temperature changes, required a good insulation to maintain the temperature inside the tank. Little or no gas storage. This can be a disadvantage at a palm oil mill where there are seasonal fluctuations in POME production and electricity requirement throughout the day/week.
Relatively cheaper to construct Not suitable to construct at pit soil area and required larger space area. Very large capacity reactors with a POME retention time between 40 to 60 days compared to 7 – 20 days with digester tank. The large capacity would reduce the risk that the anaerobic process could be killed or impaired by sudden changes in waste composition, volume, temperature or pH, such as can occur within a smaller and more sensitive tank reactor. Covered lagoon have more ability to maintain temperature inside the reactor which help promotes bacterial growth Have a large volume of gas storage. The covered lagoon can easily store gas to later generate electricity during the off period or night times
Pond Capped System

Bioflow Anaerobic Pond Capped System
Mill throughput and operational hours (past, present and future) POME characteristics and quantity Project direction – thermal application, power application or combine heat and power Site location and space availability Required power or heat and future extension Sludge and wastewater processing facility Current heat and power situation (fuel consumption etc)

Bioflow Anaerobic Pond Capped System
Parameters 30 ton/h mill 45 ton/h mill 60 ton/h mill
Design biogas plant rate 20 30 40
m3/hour m3/hour m3/hour
COD/BOD reduction 90% 90% 90%
Est. biogas 500 – 815 815 – 1,000
production Nm3/hour Nm3/hour
Methane % 55 – 65 % 55 – 65 % 55 – 65 %
Equivalent energy 4,204 – 6,852 6,852 – 8,400 8,400 – 11,088
MJ/hour MJ/hour MJ/hour
Equivalent shell 0.8 – 1.3 1.3 – 1.6 1.3 – 1.6
ton/hour ton/hour ton/hour
Electricity potency ±1000 ±1,500 ±2,000
kWe kWe kWe
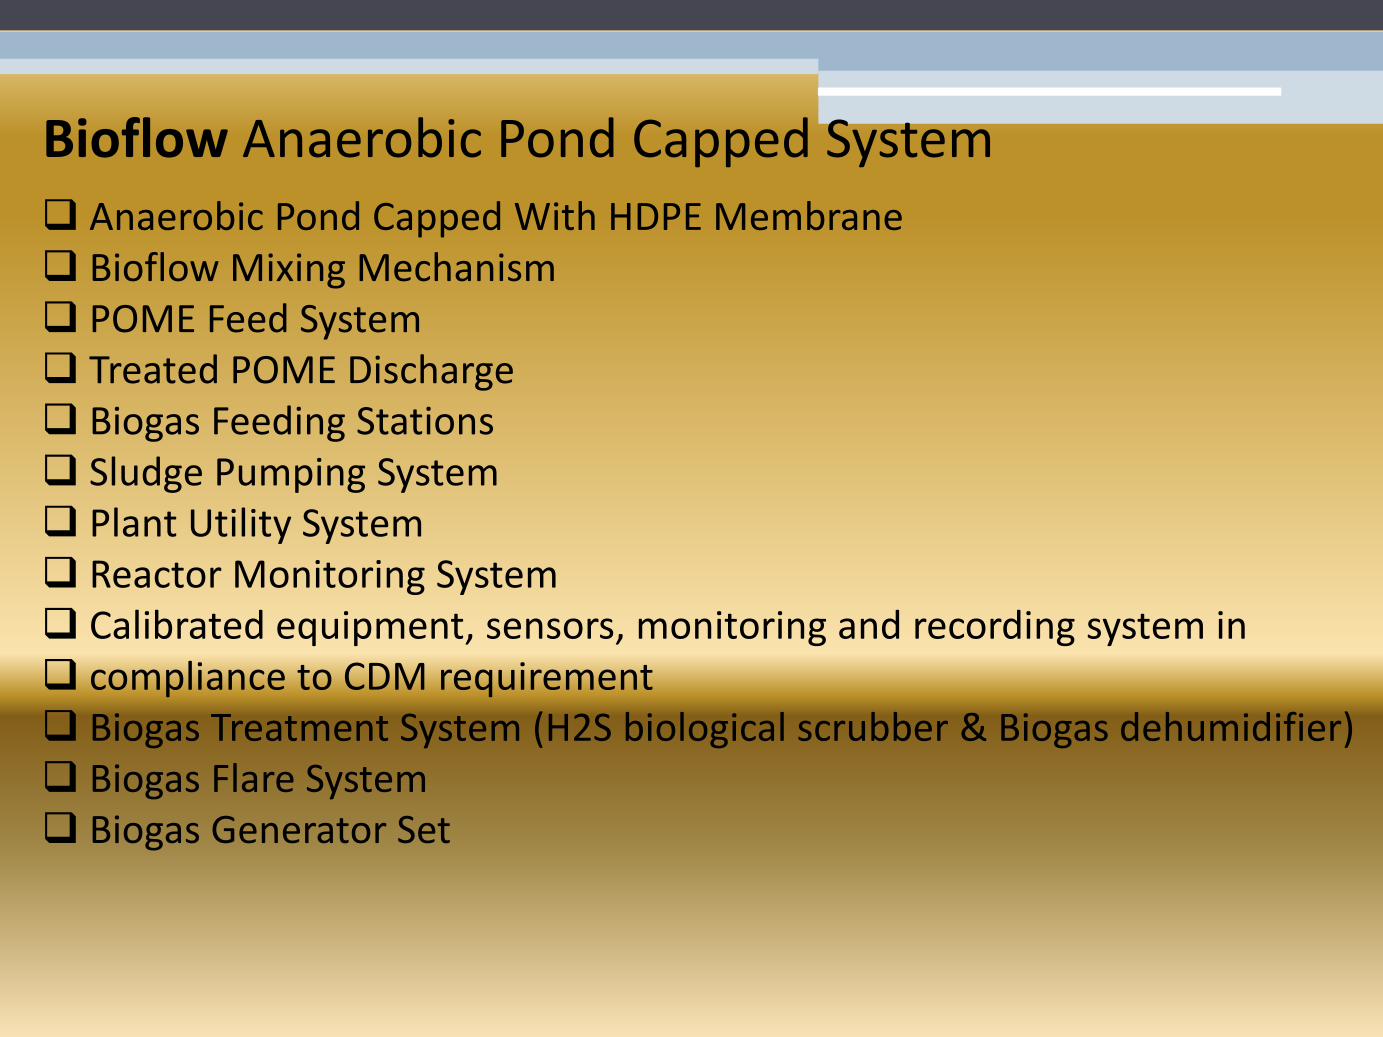
Bioflow Anaerobic Pond Capped System Anaerobic Pond Capped With HDPE Membrane Bioflow Mixing Mechanism POME Feed System Treated POME Discharge Biogas Feeding Stations Sludge Pumping System Plant Utility System Reactor Monitoring System Calibrated equipment, sensors, monitoring and recording system in compliance to CDM requirement Biogas Treatment System (H2S biological scrubber & Biogas dehumidifier) Biogas Flare System Biogas Generator Set

Bioflow Anaerobic Pond Capped System

Anaerobic Pond Retrofitting

Bioflow Diffuser Mixing Mechanism

HDPE Skirting & Biogas Collection Pipe

HDPE Capping Process

HDPE Capping Process

HDPE Cap Welding Process

Anaerobic pond started to generate biogas

Skid Mounted – Biogas Plant System

Skid Mounted – Biogas Scrubber Feeder System
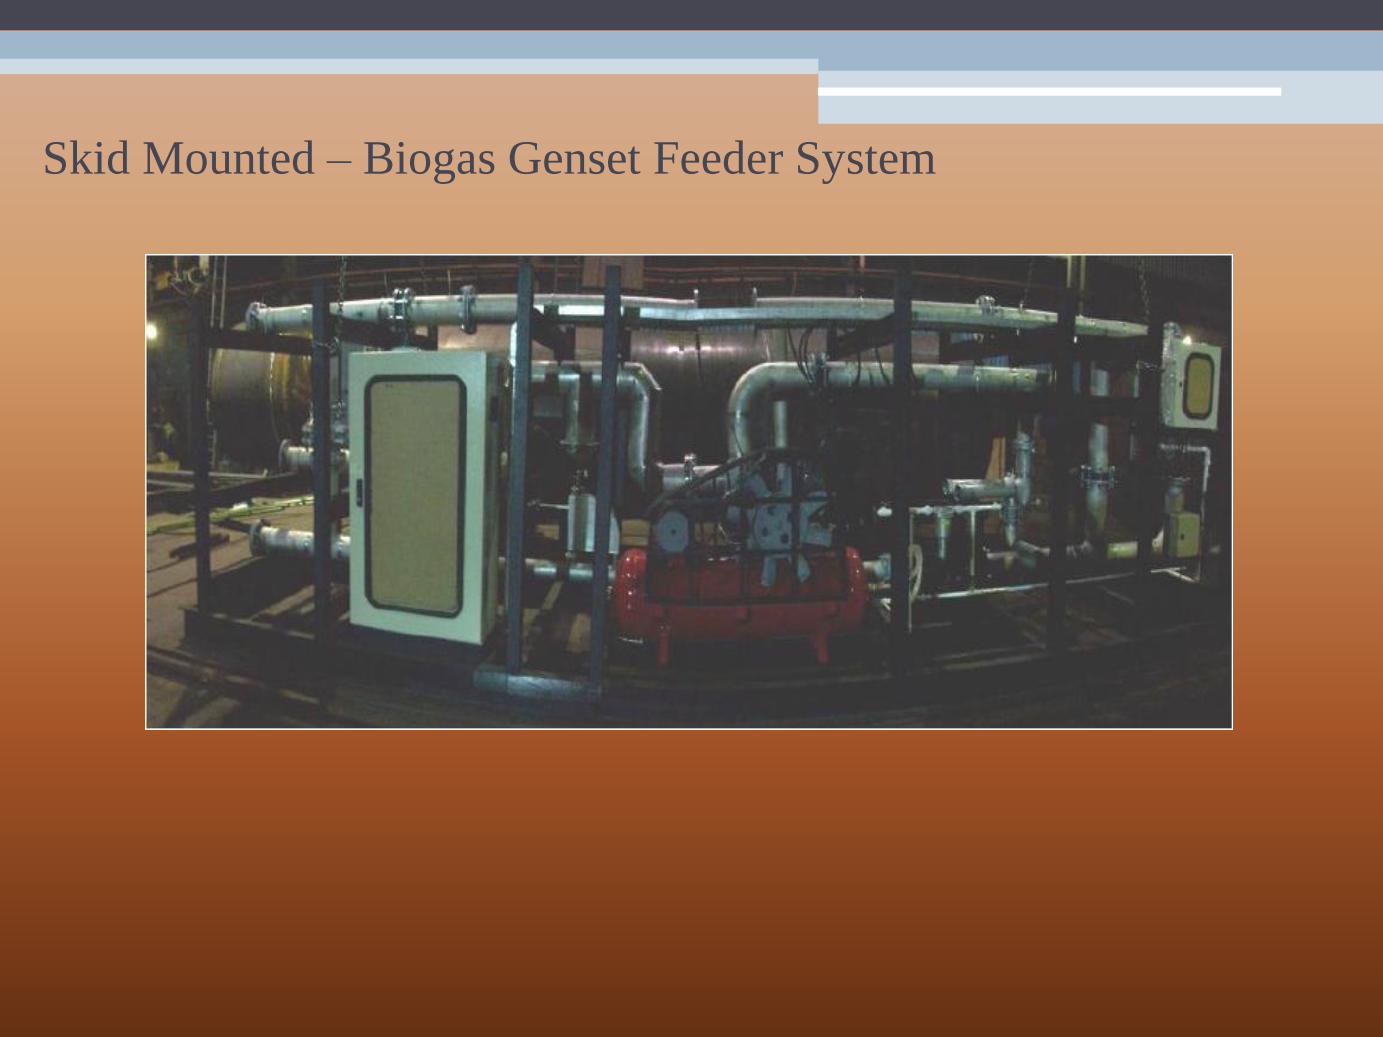
Skid Mounted – Biogas Genset Feeder System

Skid Mounted – Pome & Utilities System

Skid Mounted – Treated POME Discharge

Biogas Flare

Biological H2S Scrubber System

Biogas Dehumidifier

Human Machine Interphase – Plant Automation

Human Machine Interphase – Plant Automation

Containerised - Biogas Generator Set

Containerised - Biogas Generator Set

Load Test Result

Bird Eye View of The Plant


![[energy from biogas] Biogasanlage Strem - lko.at 2017. 1. 6. · RENEWABLE ENERGY NETWORK AUSTRIA [energy from biogas] Partner: AAT •Bioenergetica •GE Jenbacher •Öko Energie](https://static.fdocuments.in/doc/165x107/5fe241d0983eeb67cf6afd3c/energy-from-biogas-biogasanlage-strem-lkoat-2017-1-6-renewable-energy.jpg)