Waste Management & Research Soil chemistry and pollution ... · Selangor has a total of 20 landfill...
14
Waste Management & Research 31(6) 599–612 © The Author(s) 2013 Reprints and permissions: sagepub.co.uk/journalsPermissions.nav DOI: 10.1177/0734242X13482031 wmr.sagepub.com Introduction Land, or soil, is one of the most complex and valuable natural resources in the world. It can be formed or deformed by the action of climate, vegetation and/or topography changes. Its usage and utilization must be managed efficiently with minimal adverse effect on the environment. There has been an exponential growth of people’s understanding of soil’s physical properties, geochemistry and heavy metal contamination in tropical soils over the last decade. The Selangor series (surface soil) is one of the established soil series mapped in Malaysia by Paramananthan (2000). The soil series provides relevant soil reference of and around certain areas. This reference can only be used for agricul- tural planning, rehabilitation of surface soil and vegetation activi- ties. However, the reference is limited, and scarce in depth and its chemical properties. Studies and research about soil and its con- tamination are increasing, yet the sediment quality guidelines are still inadequate, especially for managing and rehabilitating con- taminated soils and its catchment areas. Selangor has a total of 20 landfill sites: 6 active and 14 closed. Among the six active landfill sites, only Jeram and Bukit Tagar sites are operating with a level IV sanitary landfill with leachate treat- ment facilities. However, 12 landfill sites (closed and operating) are open dumpsites with level 0 sanitary classifications, which generate the highest risk of contamination and leachate migration. The 20 landfill sites are situated in 5 main river basins. The Sungai Selangor Basin has the highest number of operating landfills (three) and four closed landfills. The Sungai Langat Basin has a total number of six landfills (two landfills—Ampar Tenang and Sungai Sedu Landfills—are level I landfills and four landfills—Hulu Langat, Sungai Kembong, Tanjung Sepat and Banting landfills—are level 0 landfills) (NAHRIM and NRE, 2010) (Figure 1). The most common heavy metal contaminations at the landfill area are from iron (Fe), cadmium (Cd), copper (Cu), zinc (Zn) and nickel (Ni) (Elwali et al., 2008). The Ampar Tenang surface water quality has exceeded the value of the standard limits for lead (Pb), Zn and Cu, while its groundwater was contaminated with mercury Soil chemistry and pollution study of a closed landfill site at Ampar Tenang, Selangor, Malaysia Siti Nur Syahirah Binti Mohd Adnan 1 , Sumiani Yusoff 1 and Chua Yan Piaw 2 Abstract A total of 20 landfills are located in State of Selangor, Malaysia. This includes the Ampar Tenang landfill site, which was closed on 26 January 2010. It was reported that the landfill has been upgraded to a level I type of sanitary classification. However, the dumpsite area is not being covered according to the classification. In addition, municipal solid waste was dumped directly on top of the unlined natural alluvium formation. This does not only contaminate surface and subsurface soils, but also initiates the potential risk of groundwater pollution. Based on previous studies, the Ampar Tenang soil has been proven to no longer be capable of preventing pollution migration. In this study, metal concentrations of soil samples up to 30 m depth were analyzed based on statistical analysis. It is very significant because research of this type has not been carried out before. The subsurface soils were significantly polluted by arsenic (As), lead (Pb), iron (Fe), copper (Cu) and aluminium (Al). As and Pb exceeded the safe limit values of 5.90 mg/kg and 31.00 mg/kg, respectively, based on Provincial Sediment Quality Guidelines for Metals and the Interim Sediment Quality Values. Furthermore, only Cu concentrations showed a significantly decreasing trend with increasing depth. Most metals were found on clay-type soils based on the cluster analysis method. Moreover, the analysis also differentiates two clusters: cluster I—Pb, As, zinc, Cu, manganese, calcium, sodium, magnesium, potassium and Fe; cluster II—Al. Different clustering may suggest a different contamination source of metals. Keywords Metal, soil, pollution, landfill 1 Department of Civil Engineering, Faculty of Engineering, University of Malaya, Kuala Lumpur, Malaysia 2 Institute of Principalship Studies, University of Malaya, Kuala Lumpur, Malaysia Corresponding author: Siti Nur Syahirah Binti Mohd Adnan, Department of Civil Engineering, Faculty of Engineering, University of Malaya, 50603 Kuala Lumpur, Malaysia. Email: [email protected] 482031WMR 31 6 10.1177/0734242X13482031Waste Management & ResearchMohd Adnan et al. 2013 Original Article
Transcript of Waste Management & Research Soil chemistry and pollution ... · Selangor has a total of 20 landfill...

Waste Management & Research31(6) 599 –612© The Author(s) 2013Reprints and permissions: sagepub.co.uk/journalsPermissions.navDOI: 10.1177/0734242X13482031wmr.sagepub.com
Introduction
Land, or soil, is one of the most complex and valuable natural resources in the world. It can be formed or deformed by the action of climate, vegetation and/or topography changes. Its usage and utilization must be managed efficiently with minimal adverse effect on the environment. There has been an exponential growth of people’s understanding of soil’s physical properties, geochemistry and heavy metal contamination in tropical soils over the last decade. The Selangor series (surface soil) is one of the established soil series mapped in Malaysia by Paramananthan (2000). The soil series provides relevant soil reference of and around certain areas. This reference can only be used for agricul-tural planning, rehabilitation of surface soil and vegetation activi-ties. However, the reference is limited, and scarce in depth and its chemical properties. Studies and research about soil and its con-tamination are increasing, yet the sediment quality guidelines are still inadequate, especially for managing and rehabilitating con-taminated soils and its catchment areas.
Selangor has a total of 20 landfill sites: 6 active and 14 closed. Among the six active landfill sites, only Jeram and Bukit Tagar sites are operating with a level IV sanitary landfill with leachate treat-ment facilities. However, 12 landfill sites (closed and operating) are open dumpsites with level 0 sanitary classifications, which generate
the highest risk of contamination and leachate migration. The 20 landfill sites are situated in 5 main river basins. The Sungai Selangor Basin has the highest number of operating landfills (three) and four closed landfills. The Sungai Langat Basin has a total number of six landfills (two landfills—Ampar Tenang and Sungai Sedu Landfills—are level I landfills and four landfills—Hulu Langat, Sungai Kembong, Tanjung Sepat and Banting landfills—are level 0 landfills) (NAHRIM and NRE, 2010) (Figure 1).
The most common heavy metal contaminations at the landfill area are from iron (Fe), cadmium (Cd), copper (Cu), zinc (Zn) and nickel (Ni) (Elwali et al., 2008). The Ampar Tenang surface water quality has exceeded the value of the standard limits for lead (Pb), Zn and Cu, while its groundwater was contaminated with mercury
Soil chemistry and pollution study of a closed landfill site at Ampar Tenang, Selangor, Malaysia
Siti Nur Syahirah Binti Mohd Adnan1, Sumiani Yusoff1 and Chua Yan Piaw2
AbstractA total of 20 landfills are located in State of Selangor, Malaysia. This includes the Ampar Tenang landfill site, which was closed on 26 January 2010. It was reported that the landfill has been upgraded to a level I type of sanitary classification. However, the dumpsite area is not being covered according to the classification. In addition, municipal solid waste was dumped directly on top of the unlined natural alluvium formation. This does not only contaminate surface and subsurface soils, but also initiates the potential risk of groundwater pollution. Based on previous studies, the Ampar Tenang soil has been proven to no longer be capable of preventing pollution migration. In this study, metal concentrations of soil samples up to 30 m depth were analyzed based on statistical analysis. It is very significant because research of this type has not been carried out before. The subsurface soils were significantly polluted by arsenic (As), lead (Pb), iron (Fe), copper (Cu) and aluminium (Al). As and Pb exceeded the safe limit values of 5.90 mg/kg and 31.00 mg/kg, respectively, based on Provincial Sediment Quality Guidelines for Metals and the Interim Sediment Quality Values. Furthermore, only Cu concentrations showed a significantly decreasing trend with increasing depth. Most metals were found on clay-type soils based on the cluster analysis method. Moreover, the analysis also differentiates two clusters: cluster I—Pb, As, zinc, Cu, manganese, calcium, sodium, magnesium, potassium and Fe; cluster II—Al. Different clustering may suggest a different contamination source of metals.
KeywordsMetal, soil, pollution, landfill
1 Department of Civil Engineering, Faculty of Engineering, University of Malaya, Kuala Lumpur, Malaysia
2 Institute of Principalship Studies, University of Malaya, Kuala Lumpur, Malaysia
Corresponding author:Siti Nur Syahirah Binti Mohd Adnan, Department of Civil Engineering, Faculty of Engineering, University of Malaya, 50603 Kuala Lumpur, Malaysia. Email: [email protected]
482031WMR31610.1177/0734242X13482031Waste Management & ResearchMohd Adnan et al.2013
Original Article

600 Waste Management & Research 31(6)
(Hg), manganese (Mn), selenium (Se), Fe, Cd, Pb and Cu (NAHRIM and NRE, 2010). The river alluvium soil beneath the landfill has the highest metal concentrations of Cu, Zn and Pb (Elwali et al., 2008), lowest pH (3.96–4.08), 7.25–8.20% of carbonate content, 12.04–13.05% of organic content, 6.68–8.48 meq/100 g of cation exchange capacity and a high adsorption capability of Pb > Cu > Ni (Ismail et al., 2005). Its retention capability value with a relative concentra-tion towards heavy metal is Ce/Co (10−1–10−4), while the buffering capacity of the heavy metal follows the order of Cu > Zn > Pb > Ni (Ridwan et al., 2005). The contaminated subsurface water and soil showed lower resistivity values with a leachate resistivity value of significance of <2.0 ohm.m (Samsudin et al., 2006, 2007).
It was found that Ampar Tenang landfill soils were incapable of preventing contamination migration vertically and/or horizon-tally, and the contamination migrated through the clay layers by diffusion and advection transport mechanism (Mohamed et al., 2009). A shallow and a fluctuation of the periodic water table, water infiltration during the rainy season, acidic soil environment and local groundwater flow direction were the main reasons that had enhanced the contamination migration through the soil for-mation into the groundwater (Elwali et al., 2008). It was also revealed that the groundwater body below the site was a highly
contaminated leachate with ~13.5% of a high ionic balance error (Elwali et al., 2010). This article discusses the soil properties at deeper depths at the contaminated Ampar Tenang landfill site in Selangor and provides the geochemistry and heavy metal con-tamination data based on statistical analysis.
Description and geology of the study area
The Ampar Tenang landfill area was about 510 m2 and was active for open tipping for 10 years before it was closed on 26 January 2010. It was managed by Alam Flora Sdn Bhd. It received about 100 tons/day of domestic solid waste and its average thickness was 6.6 m (range: 4.5–9.0 m) (Elwali et al., 2010). It was a natu-ral attenuation landfill as no engineered liner materials were used on top of the natural river alluvium before the waste was dumped (Mohamed et al., 2009). The landfill is surrounded by a palm oil plantation in Dengkil, located at Sepang District, Selangor, Malaysia. It is located at a latitude of N02o49’10” and longitude of E101040’50” (Figure 2). It was upgraded from level 0 (open dumping) to level I (controlled tipping) of sanitary classification before it was closed (Table 1). It was scheduled to be closed in 2006 (Krishnan, 2008); however, it was still operating until it was
Figure 1. Landfill sites in Selangor.Source: NAHRIM and NRE (2010).

Mohd Adnan et al. 601
congested. Level I type landfills require weekly waste spreading, compaction and cover. However, it was found to be uncovered according to the classification during the drillings. The tempera-ture and the annual rainfall of the basin area range from 24 to 32°C and 2200 to 2700 mm respectively (Elwali et al., 2010). Both the drilling and the soil sampling were done during good and sunny weather conditions in July 2010.
The study area is covered mainly by weathered Kenny Hill formation (Formasi Kenny Hill) (Figure 3) and quarternary allu-vium of Beruas and Gula formations. Kenny Hill formation is made of shale, sandstone, phyllite and quartzite, while Beruas (0.00–2.58 Ma) and Gula (0.012–2.58 Ma) Formations comprise unconsolidated to semi-consolidated peat, clay, silt, sand and gravel. There are four layers—peat/peaty clay layer, clayey soil layer, sandy layer and gravelly soil layer—which cover the area with bedrock at 30–40 m below sea level (NAHRIM & NRE, 2010). With increasing depth, the residual soil has a firm and hard consistency, and has changed into silty clay loam (Elwali et al., 2010). The dominant clay mineralogy component is kaolin-ite, followed by the presence of montmorillonite and illite (Elwali et al., 2008). Different clay mineralogy possesses different reten-tion capacity to hold dissolved metals in leachate migration (Regadío et al., 2012). The drilling exploration of five bore-holes—BH1, BH2, BH3, BH4 and BH5 (up to 30 m depth each)—at the site revealed that the upper part of layers is clayey
material and the deeper part is sandy material. These materials resemble aquitard and aquifer.
MethodsBoreholes, sampling and preparation
Five boreholes were drilled up to 30 m depth for sampling and mon-itoring using a rotary wash boring method. The boreholes were used as piezometric wells for groundwater level and quality monitoring. One borehole (BH3: N02049’13.00”, E101040’54.31”) was installed in the up-slope and two boreholes (BH4: N02049’07.20”, E101040’46.90”; BH5: N02049’06.14”, E101040’47.14”) were at the edge of the tipping area. The other two (BH1: N02049’02.02”, E101040’47.22”; BH2: N02049’04.24”, E101040’46.27”) were located at the down-slope of the area (Figure 4). The samples from BH3 were considered as the control samples because the borehole was situated at the up-slope area of the groundwater flow direction. Figure 5 shows the cross-section of the study area based on the soil samples that have been analyzed.
There were 90 representative disturbed (D) and undisturbed (UD) soil samples taken from 5 boreholes for analyses. D samples were taken from the soils at different depths that emerged at the surface while drilling, while UD samples were taken specifically at chosen depths inside the boreholes using a 1-m length metal rod during the drilling. Twenty-seven of the samples were UD sam-ples from four boreholes (as UD samples from BH5 were stolen). The D samples were stored in plastic bags, while the UD samples were stored in metal rods before being sent to the laboratory. The samples were preserved in a refrigerator before analyses. The UD samples were carefully removed from the metal rods intact using a hydraulic pump within 2 weeks to avoid Fe contamination. The UD and D samples were oven-dried at 70°C for 2 days and ground gently using a ceramic pestle and mortar. Ground samples were then passed through a 2-mm sieve to separate fine from coarser particles. Fine particles (<2 mm) were used for metal analysis.
Figure 2. Location of the study area.Source: Elwali et al. (2010).
Table 1. Sanitary landfill classification (Department of Local Government, 2006; NAHRIM and NRE, 2010).
Level Description
Level 0 Open dumpsiteLevel I Controlled tippingLevel II Sanitary landfill with bund and daily coverLevel III Sanitary landfill with leachate
recirculation systemLevel IV Sanitary landfill with leachate treatment
facilities

602 Waste Management & Research 31(6)
Metal analysis
Dried soil samples were crushed using an agate mortar and digested using soil dissolution procedure (Lamthothe et al., 1986). The average concentrations of metals (triplicate measurements taken) in the digested solutions were determined using inductively coupled plasma with optical emission spectrometry (Perkin Elmer Model Optima 43000 Dual View; Perkin Elmer, USA). Eleven elements—Cu, arsenic (As), Mn, Fe, aluminium (Al), potassium (K), sodium (Na), magnesium (Mg), Zn, Pb and calcium (Ca)—were measured and expressed in mg/kg.
Statistical analysis
The descriptive statistical analyses that define the distribution significance were performed using the SPSS statistical software package, PASW Statistics 18, v. 18.0.0 (SPSS, Chicago, IL,
USA). The collection of data was presented in terms of averages (multiple measurements taken) and within 95% confidence inter-vals. The distributions of data were tested using skewness and kurtosis. Statistical evaluation was performed using analysis of variance (ANOVA) and Pearson correlation. Comparison for sta-tistical differences at probability P ≤ 0.05 (significant) and P ≤ 0.01 (highly significant) are presented. The same 11 elements as in the metal analysis were used and expressed in mg/kg.
Results and discussionDescriptive analysis and statistical summary of the metal concentrations of Ampar Tenang landfill soils
Descriptive analysis and a statistical summary are shown in Table 2. As normal distribution of skewness and kurtosis was
Figure 3. Geological map for Langat River Basin.Source: Mokhtar (2007).
Figure 4. Plane map of the landfill area.

Mohd Adnan et al. 603
Figure 5. Cross-sectional view based on the five boreholes of the landfill area.
between (−1.96 < X < 1.96), the concentrations of Cu were heav-ily skewed in BH1, BH2 and BH5. The highest skewness of Cu was recorded in BH2 (skew = 3.57) with the highest kurtosis (kurt. = 13.66) value of all the soil samples. This suggested that several locations in BH2 had a high concentration of Cu contamination.
The kurtosis of Zn, Pb and Mg in BH3 were larger than the normal distribution value of 1.96. These suggested that the three elements were not distributed normally in BH3. Furthermore, the range of Pb in BH3 (189.76 – 30.58 = 159.18 mg/kg dry wt) (between the minimum and maximum values) was the highest between all boreholes and it was also skewed (skew = 2.37) the

604 Waste Management & Research 31(6)
Tabl
e 2.
Sta
tistic
al s
umm
ary
of h
eavy
met
als
in A
mpa
r Te
nang
land
fill s
oils
(uni
ts u
sed
are
mg/
kg d
ry w
t, ex
cept
for
skew
and
kur
t.).
BH
1K
Ca
Mg
Pb
Al
Mn
Cu
ZnFe
As
Na
Min
imum
500.
8112
5.50
147.
4820
.79
3997
.04
13.4
68.
021.
3365
0.21
13.6
343
0.45
Max
imum
13,1
65.4
611
35.0
550
37.7
085
.36
117,
442.
6121
6.06
31.5
582
.08
29,1
66.2
785
.03
1826
.46
Mea
n82
34.0
351
6.94
2188
.11
51.1
762
,724
.63
113.
5712
.95
35.8
512
,656
.96
40.4
012
71.2
5Sk
ew−1
.04
0.81
0.37
−0.0
40.
030.
273.
050.
200.
470.
58−0
.78
Kur
t.0.
090.
17−0
.99
−1.1
5−1
.54
−0.1
211
.68
−0.4
9−0
.69
−0.4
0−0
.46
BH
2M
inim
um27
4.58
142.
1812
6.59
12.3
557
43.4
727
.52
7.77
1.19
1753
.92
7.71
266.
69M
axim
um13
,807
.73
1377
.74
7470
.92
68.4
111
3,98
8.63
292.
8359
.33
67.6
022
,211
.70
62.2
458
41.4
4M
ean
8314
.51
710.
5740
15.1
239
.13
68,0
01.4
415
6.48
14.5
241
.46
15,3
09.3
032
.34
2021
.10
Skew
−0.4
4−0
.06
−0.5
00.
32−0
.20
−0.2
23.
57−1
.09
−0.8
70.
270.
94K
urt.
−1.1
8−0
.58
−1.1
1−0
.93
−1.4
6−0
.70
13.6
6−0
.03
−1.1
1−1
.32
2.59
BH
3M
inim
um18
32.7
513
4.98
370.
4330
.58
6462
.75
53.3
98.
428.
9834
26.9
317
.86
668.
73M
axim
um12
,438
.21
1765
.83
4476
.77
189.
7611
,621
6.37
209.
3324
.20
218.
8021
,474
.19
71.1
158
23.3
3M
ean
8283
.89
699.
8814
87.2
163
.68
34,7
94.4
113
4.88
13.9
263
.07
8430
.21
43.5
221
90.5
2Sk
ew−0
.95
0.73
1.59
2.37
1.42
0.05
1.03
1.20
1.49
0.28
1.08
Kur
t.0.
130.
232.
926.
081.
17−1
.03
−0.5
24.
361.
43−1
.66
−0.5
0B
H4
Min
imum
3112
.70
157.
8727
3.83
7.43
30,7
85.9
418
.20
10.7
75.
8752
86.7
713
.58
356.
96M
axim
um16
,814
.88
571.
6954
20.0
461
.27
14,7
246.
5016
4.91
344.
7634
.91
26,8
86.4
291
.33
1475
.18
Mea
n91
51.9
629
4.74
2357
.56
36.2
2766
,089
.44
99.1
381
.20
17.9
195
78.8
547
.19
906.
59Sk
ew0.
351.
220.
25−0
.40
1.44
−0.1
51.
640.
162.
50−0
.21
0.35
Kur
t.−1
.38
0.71
−1.6
6−0
.87
1.32
−1.6
31.
87−1
.33
6.45
−1.2
3−1
.27
BH
5M
inim
um53
5.87
350.
5616
1.21
23.4
594
65.8
038
.35
8.54
12.0
818
56.5
414
.70
621.
77M
axim
um19
805.
2611
,740
.11
5405
.90
59.3
616
6,66
4.30
187.
3323
.57
1857
.19
48,2
07.6
727
4.64
3015
.96
Mea
n76
74.1
064
0.12
2056
.99
37.7
048
,543
.18
92.3
613
.44
232.
5617
,769
.89
71.1
319
75.7
5Sk
ew0.
580.
610.
730.
531.
730.
751.
702.
850.
922.
37−0
.80
Kur
t.0.
65−0
.33
−0.4
8−0
.91
3.38
−0.8
24.
518.
060.
416.
070.
45Va
lues
con
side
red
to b
e to
xic
base
d on
low
est v
alue
of L
ELa
and
ISQ
Vb
31.0
046
0.00
16.0
012
0.00
17,0
00.0
05.
90
a Low
est e
ffec
t lev
el (L
EL) b
y (i)
New
Yor
k Se
dim
ent S
cree
ning
Cri
teri
a 19
99 fr
om th
e D
epar
tmen
t of E
nvir
onm
enta
l Con
serv
atio
n, N
ew Y
ork,
USA
and
(ii)
Pro
vinc
ial S
edim
ent Q
ualit
y G
uide
lines
for
Met
als
by th
e O
ntar
io M
inis
try
of E
nvir
onm
ent,
Can
ada.
b Int
erim
Sed
imen
t Qua
lity
Valu
es (I
SQVs
) fro
m H
ong
Kon
g (C
hapm
an e
t al.,
199
9).
K: p
otas
sium
; Ca:
cal
cium
; Mg:
mag
nesi
um; P
b: le
ad; A
l: al
umin
ium
; Mn:
man
gane
se; C
u: c
oppe
r; Z
n: z
inc;
Fe:
iron
; As:
ars
enic
; Na:
sod
ium
; Kur
t.: k
urto
sis.

Mohd Adnan et al. 605
most. These results suggested that Pb contamination was higher in BH3 than other boreholes (Figure 6). In BH4, only Fe was not normally distributed (skew = 2.50; kurt. = 6.45). However, in BH5, three other elements—As (skew = 2.37; kurt. = 6.07), Zn (skew = 2.85; kurt. = 8.06) and Al (kurt. = 3.38) —were not nor-mally distributed. The highest contamination of As occurred in BH5 with highest mean of 71.13 mg/kg, and the range of As (274.64 – 14.70 = 259.94 mg/kg) was also the highest of all bore-holes samples.
In addition, the minimum values of As in all boreholes exceeded the safe limit value of 5.90 mg/kg based on (i) the New York Sediment Screening Criteria 1999, by the Department of Environmental Conservation, New York; (ii) the Provincial Sediment Quality Guidelines for Metals by the Ontario Ministry of Environment, Canada; and (iii) the Interim Sediment Quality Values (ISQVs) of Hong Kong (Chapman et al., 1999). The con-centration of Pb in the soil samples also exceeded the safe limit value of 31.00 mg/kg. However, the concentration of Mn in all boreholes did not exceed the safe limit value for soil quality guidelines (460.00 mg/kg).
Correlations between the concentrations of metals in soils based on cluster analysis
Cluster analysis was performed using the metal concentrations data based on a hierarchical clustering method. The results are shown in dendrograms (Figure 7). The degree of correlation between metals was represented by the cluster distance. The correlation is more sig-nificant with smaller value of cluster distance (Luo et al., 2007). The cluster distance is indicated by the ANOVA results.
Based on the ANOVA results of the cluster analysis, there are significant differences between two clusters in all boreholes. In BH1, the clay layer at −1.90 m depth [F(1,9) = 37.84, P < 0.05], mean value for cluster I was significantly greater than the other cluster. At deeper layers—the clay layer at −3.50 m [F(1,9) =
250.18, P < 0.05], at −10.90 m [F(1,9) = 621.08, P < 0.05] and at −12.00 m [F(1,9) = 868.84, P < 0.05]—the mean values for clus-ter II were significantly greater than the other cluster.
In BH2, the mean values for cluster I were significantly greater than the other cluster for the clay layer at −6.95 m [F(1,9) = 200.99, P < 0.05] and another clay layer at −9.95 m [F(1,9) = 43.54, P < 0.05]. The mean values for cluster II were signifi-cantly greater than other cluster for clay layers at −3.00 m [F(1,9) = 282.85, P < 0.05], at −3.50 m [F(1,9) = 242.27, P < 0.05] and at −6.45 m [F(1,9) = 246.14, P < 0.05].
In BH3, the mean value for cluster I was significantly greater than the other cluster for the clay layer at −6.00 m [F(1,9) = 17.18, P < 0.05]. For the clay layer at −9.50 m [F(1,9) = 843.06, P < 0.05] the mean value for cluster II was significantly greater than the other cluster. In BH4, the mean value for cluster I was significantly greater than the other cluster for the organic layer at −12.00 m [F(1,9) = 49.34, P < 0.05]. The mean value for cluster II was significantly greater than the other cluster for the clay layer at −4.00 m [F(1,9) = 447.64, P < 0.05]. In BH5, the mean value for cluster I was significantly greater than the other cluster fort the clay layer at −10.50 m [F(1,9) = 160.54, P < 0.05],. The mean value for cluster II was significantly greater than the other cluster for the clay layer at −4.50 m [F(1,9) = 451.85, P < 0.05].
In the Ampar Tenang soil, the two distinct clusters identified (Figure 7) were cluster I, which contained Pb, As, Zn, Cu, Mn, Ca, Na, Mg, K and Fe, and cluster II, which contained Al. The mean concentrations of Al in four boreholes represented consid-erable amounts greater than in the control sample (BH3). The soils have been significantly contaminated by cluster I metals particularly because of the effect of leachate seepage (Elwali et al., 2008).
Correlations between the concentrations of metals in soils based on Pearson correlation analysis
A Pearson correlation analysis was performed to determine the extent of relationships among the metals vertically in soils of dif-ferent boreholes in discrete locations. The correlation is signifi-cant at P < 0.05 and its strength depends on the Pearson correlation coefficient (r) value. According to Chua (2009) the Pearson cor-relation is satisfactory at r > ± 0.31 and is strong at r > ± 0.71. Positive correlation signifies an increasing amount of metal con-centrations in deeper (increasing depth of) soil and a negative correlation means a decreasing amount of metal concentrations in deeper (increasing depth of) soil.
The first analysis was performed between combinations of all metal concentrations data (all boreholes) with depth. Generally, this analysis showed metal concentration trends with increasing depth. Based on Table 3, the correlation of Pb, Zn and As concen-trations from all borehole locations were not significant with depth (P > 0.05). Only Cu showed significantly negative correla-tion with depth, suggesting that Cu concentration decreased with increasing depth.
L
Figure 6. Boxplots of mean of lead (Pb) concentrations in Ampar Tenang landfill soils (mg/kg dry wt).

606 Waste Management & Research 31(6)
Figure 7. Dendrogram of the cluster analysis of five boreholes in Ampar Tenang landfill soils based on metal concentrations. Pb: lead; As: arsenic; Cu: copper; Zn: zinc; Mn: manganese; Ca: calcium; Na: sodium; Mg: magnesium; K: potassium; Fe: iron; Al: aluminium.
The second analysis was done using metal concentration data from individual boreholes. This analysis resulted in determining relationships of all the metals in each borehole. Significantly
positive relationships suggested that both metals show increased concentrations towards each other. While significantly negative correlations show a decrease in concentration of one metal with

Mohd Adnan et al. 607
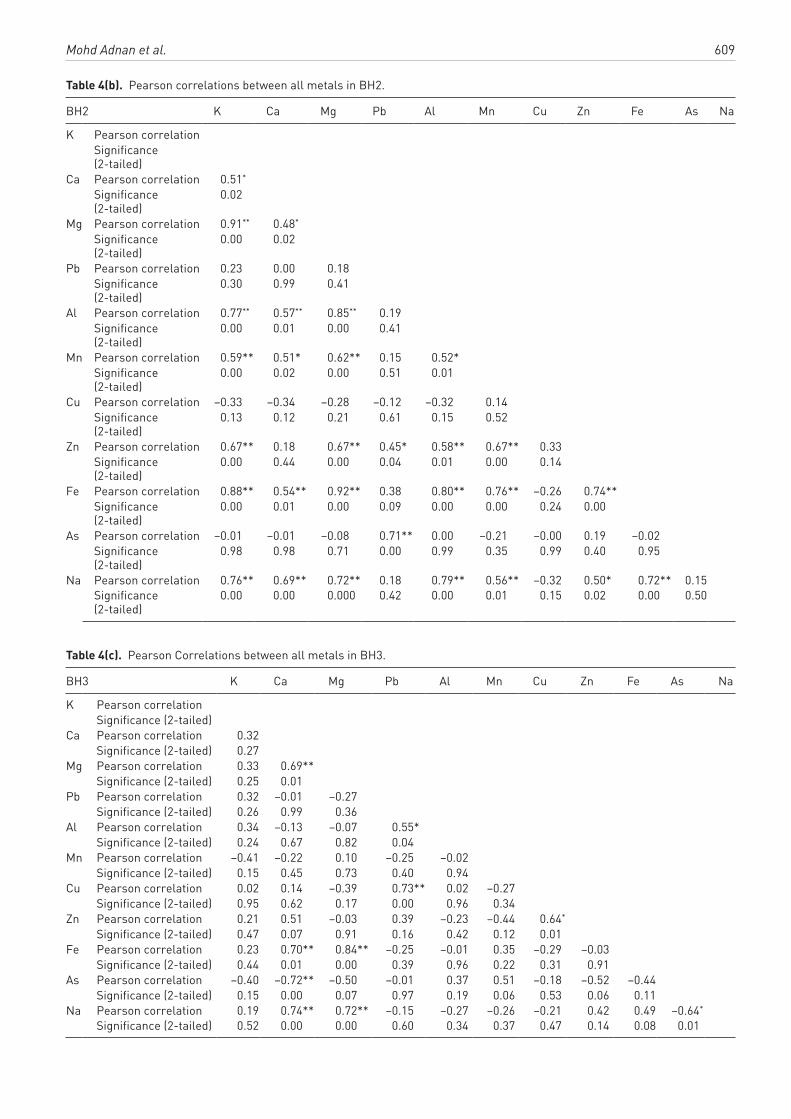
an increase in concentration of another. The correlation matrix in Table 4 (a –e) shows that despite the fact that Cu has had a sig-nificantly negative correlation in overall samples with depth in previous analysis, Cu in discrete samples from BH1 and BH2 did not correlate significantly with any metals (P > 0.05). This might suggest that Cu originated from different sources than other met-als from other areas. Potassium, Mg, Pb, As and Na were closely related to each other in BH1 and BH2 (r = 0.71, P < 0.05), sug-gesting they might have a common source. Interestingly, there were significantly negative correlations in BH1 for Pb–Zn, Pb–Mg and As–Mg (r = −0.51, P < 0.05). However, there was no significantly negative correlation in BH2.
Meanwhile, in BH3, K and Mn showed no significant correla-tion with other metals (P > 0.05), and Al and Zn were poorly correlated (r = 0.51, P < 0.05). Arsenic–Ca and As–Na formed another group based on their significantly negative correlation (r = −0.61, P < 0.05). In BH4, no significant correlation was shown for Ca, Al and Fe (P > 0.05). BH4 has the most negative correla-tions among other BHs. Mg–Na, Mg–Zn and Mn–K were related closely to each other negatively (r = −0.81, P < 0.05).
In BH5, there were no significant correlation for Pb and Cu (P > 0.05). This suggested that the two metals did not correlate with other metals and might have a different source from them. Other metals, except Pb and Cu, showed good-to-strong correlations with each other (r = 0.51, P < 0.05). There was only one nega-tively correlated group of As and Mg (r = −0.51, P < 0.05), indi-cating a decrease in concentration of As with an increase in concentration of Mg. Arsenic has a lot of negative relationships owing to its characteristic that it reacts with ions (Mg, Ca, Fe, Al, Mn and Pb) in solution (US EPA, 1998).
Effects of lithologies on concentrations of metals in soils of the Ampar Tenang landfill site
Four types of lithologies were classified for the analysis of the studied area (clay, organic/peat, sand and gravel). The concentra-tions of metals in soils of different types are presented in Table 5. Based on the ANOVA of metal concentrations in different lithol-ogies (Table 6) there were significant differences between differ-ent lithologies for K, Ca, Mg, Al, Mn, Cu, As and Na, and no significant differences for Pb, Zn and Fe. Using post hoc tests with Tukey’s honestly significant difference (as shown in mean values of Table 5), it was found that significantly greater metal
concentrations of K, Mg, Al and Na were found in clay-type soils. Soils with a higher clay content adsorb more metals than sandier soils with lower clay content (US EPA, 1998). However, Cu concentration was found to be significantly greater in organic/peat layer, and As concentration was found to be significantly greater in the sandy layer.
Conclusion
Soils of the Ampar Tenang closed landfill site are significantly polluted by As, Pb, Fe, Cu and Al. These problematic metal con-taminations originated mainly from the disposed materials/wastes that have lead to leachate seepage through the underlying soils (Elwali, 2005). Copper was found to be higher in BH1, BH2 and BH5. In BH3, Pb was found to be the highest than in all the other boreholes. Iron contamination was discovered to be highest in BH4, while in BH5, As and Al contamination was found to be higher than in the other samples. Moreover, problematic metals, such as As and Pb, exceeded the safe limit values of the Provincial Sediment Quality Guidelines for Metals and ISQVs of 5.90 mg/kg and 31.00 mg/kg respectively. However, Mn values in all soil samples were below the contamination limit of 460.00 mg/kg.
Based on the correlation analysis of metal concentrations and depth in all samples, only Cu showed a significantly negative correlation. This means Cu concentration decreased with increasing depth, whereas K, Mg, Fe, Mn, Al, Na and Ca showed significantly positive correlation with depth, suggesting that these metal concentrations increased with increasing depth. Correlation analysis among metal concentrations showed that K, Mg, Pb, As and Na were closely related to each other in BH1 and BH2. Negative correlations were found in BH1 for Pb–Zn, Pb–Mg and As–Mg, indicating decreasing concentration of one metal with increasing concentration of another, while no nega-tive correlation was found in BH2. Arsenic was found to be sig-nificantly negatively related to Ca and Na in BH3, and to Mg in BH5. BH4 has the most significantly negative correlations among the boreholes. To be precise, BH1, BH4 and BH5 showed the similar trend of significantly negative correlation of As and Mg. However, this trend was different from the trends shown in the control sample (BH3) data.
Cluster analysis has proven that clay has the highest retention capability among the other lithologies, as most metals were found in that layer. However, Cu was found to be highest in the organic/peaty layer and As was found to be highest in the sandy layer.
Table 3. Pearson correlations between combinations of all metals with depth.
K Ca Mg Pb Al Mn Cu Zn Fe As Na
Depth Pearson correlation coefficient (r)
0.28** 0.29** 0.33** 0.20 0.57** 0.41** −0.28** −0.20 0.35** −0.14 0.37**
Significance (2-tailed)
0.01 0.01 0.00 0.06 0.00 0.00 0.01 0.06 0.00 0.18 0.00
*Correlation is significant at the 0.05 level (2-tailed).**Correlation is significant at the 0.01 level (2-tailed).K: potassium; Ca: calcium; Mg: magnesium; Pb: lead; Al: aluminium; Mn: manganese; Cu: copper; Zn: zinc; Fe: iron; As: arsenic; Na: sodium.

608 Waste Management & Research 31(6)
Tabl
e 4
(a).
Pea
rson
cor
rela
tions
bet
wee
n al
l met
als
in B
H1.
BH
1K
Ca
Mg
Pb
Al
Mn
Cu
ZnFe
As
Na
KP
ears
on c
orre
latio
n
Si
gnifi
canc
e (2
-tai
led)
C
aP
ears
on c
orre
latio
n0.
24
Si
gnifi
canc
e (2
-tai
led)
0.30
M
gP
ears
on c
orre
latio
n0.
73**
0.29
Sign
ifica
nce
(2-t
aile
d)0.
000.
21
Pb
Pea
rson
cor
rela
tion
−0.1
9−0
.50*
−0.5
8**
Sign
ifica
nce
(2-t
aile
d)0.
430.
030.
01
Al
Pea
rson
cor
rela
tion
0.64
**−0
.06
0.40
0.16
Sign
ifica
nce
(2-t
aile
d)0.
000.
820.
080.
50
Mn
Pea
rson
cor
rela
tion
0.35
0.21
0.16
−0.3
20.
03
Si
gnifi
canc
e (2
-tai
led)
0.13
0.37
0.50
0.18
0.91
C
uP
ears
on c
orre
latio
n0.
01−0
.21
−0.1
00.
280.
210.
35
Si
gnifi
canc
e (2
-tai
led)
0.95
0.38
0.67
0.23
0.38
0.13
Zn
Pea
rson
cor
rela
tion
0.67
**0.
68**
0.54
*−0
.55*
0.38
0.52
*−0
.08
Sign
ifica
nce
(2-t
aile
d)0.
000.
000.
010.
010.
100.
020.
74
FeP
ears
on c
orre
latio
n0.
52*
0.37
0.63
**−0
.38
0.22
0.49
*0.
180.
60**
Sign
ifica
nce
(2-t
aile
d)0.
020.
110.
000.
100.
350.
030
0.44
0.01
A
sP
ears
on c
orre
latio
n−0
.07
−0.2
7−0
.59*
*0.
73**
0.27
−0.2
60.
22−0
.21
−0.3
7
Si
gnifi
canc
e (2
-tai
led)
0.76
0.25
0.01
0.00
0.25
0.27
0.36
0.38
0.11
N
aP
ears
on c
orre
latio
n0.
87**
0.60
**0.
64**
−0.3
30.
49*
0.31
−0.0
30.
76**
0.43
−0.1
2
Si
gnifi
canc
e (2
-tai
led)
0.00
0.01
0.00
0.16
0.03
0.18
0.90
0.00
0.06
0.62
Mohd Adnan et al. 609
Table 4(b). Pearson correlations between all metals in BH2.
BH2 K Ca Mg Pb Al Mn Cu Zn Fe As Na
K Pearson correlation Significance (2-tailed)
Ca Pearson correlation 0.51* Significance (2-tailed)
0.02
Mg Pearson correlation 0.91** 0.48* Significance (2-tailed)
0.00 0.02
Pb Pearson correlation 0.23 0.00 0.18 Significance (2-tailed)
0.30 0.99 0.41
Al Pearson correlation 0.77** 0.57** 0.85** 0.19 Significance (2-tailed)
0.00 0.01 0.00 0.41
Mn Pearson correlation 0.59** 0.51* 0.62** 0.15 0.52* Significance (2-tailed)
0.00 0.02 0.00 0.51 0.01
Cu Pearson correlation −0.33 −0.34 −0.28 −0.12 −0.32 0.14 Significance (2-tailed)
0.13 0.12 0.21 0.61 0.15 0.52
Zn Pearson correlation 0.67** 0.18 0.67** 0.45* 0.58** 0.67** 0.33 Significance (2-tailed)
0.00 0.44 0.00 0.04 0.01 0.00 0.14
Fe Pearson correlation 0.88** 0.54** 0.92** 0.38 0.80** 0.76** −0.26 0.74** Significance (2-tailed)
0.00 0.01 0.00 0.09 0.00 0.00 0.24 0.00
As Pearson correlation −0.01 −0.01 −0.08 0.71** 0.00 −0.21 −0.00 0.19 −0.02 Significance (2-tailed)
0.98 0.98 0.71 0.00 0.99 0.35 0.99 0.40 0.95
Na Pearson correlation 0.76** 0.69** 0.72** 0.18 0.79** 0.56** −0.32 0.50* 0.72** 0.15 Significance (2-tailed)
0.00 0.00 0.000 0.42 0.00 0.01 0.15 0.02 0.00 0.50
Table 4(c). Pearson Correlations between all metals in BH3.
BH3 K Ca Mg Pb Al Mn Cu Zn Fe As Na
K Pearson correlation Significance (2-tailed) Ca Pearson correlation 0.32 Significance (2-tailed) 0.27 Mg Pearson correlation 0.33 0.69** Significance (2-tailed) 0.25 0.01 Pb Pearson correlation 0.32 −0.01 −0.27 Significance (2-tailed) 0.26 0.99 0.36 Al Pearson correlation 0.34 −0.13 −0.07 0.55* Significance (2-tailed) 0.24 0.67 0.82 0.04 Mn Pearson correlation −0.41 −0.22 0.10 −0.25 −0.02 Significance (2-tailed) 0.15 0.45 0.73 0.40 0.94 Cu Pearson correlation 0.02 0.14 −0.39 0.73** 0.02 −0.27 Significance (2-tailed) 0.95 0.62 0.17 0.00 0.96 0.34 Zn Pearson correlation 0.21 0.51 −0.03 0.39 −0.23 −0.44 0.64* Significance (2-tailed) 0.47 0.07 0.91 0.16 0.42 0.12 0.01 Fe Pearson correlation 0.23 0.70** 0.84** −0.25 −0.01 0.35 −0.29 −0.03 Significance (2-tailed) 0.44 0.01 0.00 0.39 0.96 0.22 0.31 0.91 As Pearson correlation −0.40 −0.72** −0.50 −0.01 0.37 0.51 −0.18 −0.52 −0.44 Significance (2-tailed) 0.15 0.00 0.07 0.97 0.19 0.06 0.53 0.06 0.11 Na Pearson correlation 0.19 0.74** 0.72** −0.15 −0.27 −0.26 −0.21 0.42 0.49 −0.64* Significance (2-tailed) 0.52 0.00 0.00 0.60 0.34 0.37 0.47 0.14 0.08 0.01

610 Waste Management & Research 31(6)
Table 4(d). Pearson correlations between all metals in BH4.
BH4 K Ca Mg Pb Al Mn Cu Zn Fe As Na
K Pearson correlation Significance (2-tailed)
Ca Pearson correlation 0.05 Significance (2-tailed) 0.84
Mg Pearson correlation 0.68** −0.25 Significance (2-tailed) 0.00 0.29
Pb Pearson correlation −0.69** 0.02 −0.71** Significance (2-tailed) 0.00 0.93 0.00
Al Pearson correlation −0.39 −0.02 −0.38 0.26 Significance (2-tailed) 0.09 0.94 0.10 0.26
Mn Pearson correlation −0.83** 0.06 −0.81** 0.68** 0.26 Significance (2-tailed) 0.00 0.79 0.00 0.00 0.28
Cu Pearson correlation 0.43 0.06 0.68** −0.64** −0.25 −0.62** Significance (2-tailed) 0.06 0.82 0.00 0.00 0.29 0.00
Zn Pearson correlation −0.75** 0.38 −0.90** 0.67** 0.25 0.87** −0.53* Significance (2-tailed) 0.00 0.10 0.00 0.00 0.28 0.00 0.02
Fe Pearson correlation −0.22 −0.05 0.14 0.17 0.34 0.07 0.19 −0.12 Significance (2-tailed) 0.36 0.84 0.57 0.48 0.14 0.76 0.42 0.62
As Pearson correlation −0.70** −0.08 −0.65** 0.89** 0.43 0.61** −0.61** 0.62** 0.05 Significance (2-tailed) 0.00 0.73 0.00 0.00 0.06 0.00 0.00 0.00 0.82
Na Pearson correlation −0.66** 0.24 −0.82** 0.76** 0.34 0.66** −0.63** 0.81** −0.14 0.77** Significance (2-tailed) 0.00 0.31 0.00 0.00 0.15 0.00 0.00 0.00 0.56 0.00
Table 4(e). Pearson correlations between all metals in BH5.
BH5 K Ca Mg Pb Al Mn Cu Zn Fe As Na
K Pearson correlation Significance (2-tailed)
Ca Pearson correlation 0.35 Significance (2-tailed) 0.23
Mg Pearson correlation 0.78** 0.35 Significance (2-tailed) 0.00 0.22
Pb Pearson correlation −0.33 −0.21 −0.42 Significance (2-tailed) 0.25 0.47 0.14
Al Pearson correlation 0.59* 0.16 0.89** −0.30 Significance (2-tailed) 0.03 0.58 0.00 0.29
Mn Pearson correlation 0.61* 0.59* 0.66* −0.05 0.49 Significance (2-tailed) 0.02 0.03 0.01 0.86 0.07
Cu Pearson Correlation −0.01 0.37 −0.02 0.42 0.13 0.12 Significance (2-tailed) 0.97 0.19 0.95 0.14 0.67 0.68
Zn Pearson correlation −0.34 −0.16 −0.39 −0.35 −0.31 −0.35 −0.25 Significance (2-tailed) 0.23 0.59 0.17 0.22 0.29 0.22 0.39
Fe Pearson correlation −0.13 −0.07 −0.13 −0.19 0.03 −0.03 0.08 0.65* Significance (2-tailed) 0.65 0.83 0.67 0.51 0.92 0.91 0.80 0.01
As Pearson correlation −0.44 −0.32 −0.57* −0.06 −0.46 −0.46 −0.04 0.71** 0.73** Significance (2-tailed) 0.11 0.26 0.03 0.84 0.10 0.10 0.89 0.00 0.00
Na Pearson correlation 0.74** 0.61* 0.60* −0.14 0.45 0.52 0.44 −0.47 −0.01 −0.27 Significance (2-tailed) 0.00 0.02 0.02 0.63 0.11 0.06 0.11 0.09 0.96 0.34
*Correlation is significant at the 0.05 level (2-tailed).**Correlation is significant at the 0.01 level (2-tailed).K: potassium; Ca: calcium; Mg: magnesium; Pb: lead; Al: aluminium; Mn: manganese; Cu: copper; Zn: zinc; Fe: iron; As: arsenic; Na: sodium.

Mohd Adnan et al. 611
Table 5. Concentrations of heavy metals in different type of soils (mg/kg dry wt).
Heavy Metal Lithology Mean SD Minimum Maximum
K Clay 9443.51 3225.00 868.18 19,805.26Organic 6880.35 4833.58 1398.31 15,189.79Sand 4636.99 4472.50 500.81 13,942.63Gravel 7444.87 7282.57 274.58 16,814.88
Ca Clay 620.09 328.38 131.92 1765.83Organic 690.59 418.40 254.46 1263.31Sand 401.04 329.74 125.50 1377.74Gravel 239.40 74.88 142.18 315.82
Mg Clay 2902.97 2035.93 232.38 7470.92Organic 2091.95 1498.28 167.51 4184.40Sand 1238.88 1699.59 147.48 5420.04Gravel 2006.03 1735.30 126.59 3729.14
Pb Clay 47.87 25.27 19.99 189.76Organic 36.46 27.94 7.43 88.64Sand 41.50 16.16 11.78 63.61Gravel 29.49 22.71 12.35 68.41
Al Clay 70,966.02 37,368.61 6462.75 166,664.30Organic 29,019.06 22,799.96 7026.54 64,959.34Sand 23,247.68 17,842.62 3997.04 52,338.97Gravel 34,868.21 22,217.19 5743.47 55,865.48
Mn Clay 132.30 59.52 24.21 292.83Organic 72.38 39.29 18.20 123.55Sand 105.39 65.93 13.46 216.06Gravel 101.43 83.78 27.52 244.51
Cu Clay 19.33 34.77 8.42 272.65Organic 96.28 140.17 7.77 344.76Sand 24.93 33.42 8.02 115.22Gravel 67.93 49.56 10.92 118.91
Zn Clay 42.54 23.02 5.87 142.81Organic 49.05 76.11 6.38 218.80Sand 197.60 513.01 1.33 1857.19Gravel 26.99 30.50 1.19 63.82
Fe Clay 13,567.42 7203.56 1856.54 30,876.04Organic 8834.67 8514.05 1795.58 26,886.42Sand 10,983.35 13,432.00 650.21 48,207.67Gravel 7870.28 4289.88 1753.92 11,777.31
As Clay 44.10 21.29 11.16 91.33Organic 24.72 13.64 7.71 45.47Sand 67.11 67.33 13.58 274.64Gravel 28.20 19.93 11.90 56.58
Na Clay 1907.94 1057.21 621.77 5841.44Organic 1332.25 1422.21 416.32 4376.14Sand 1065.83 1115.63 430.45 4904.45Gravel 489.49 278.84 266.69 956.55
Clay (n = 66); organic (n = 7); sand (n = 12); gravel (n = 5).K: potassium; Pb: lead; Al: aluminium; Cu: copper; Zn: zinc; Fe: iron; As: arsenic; Na: sodium.
Table 6. Result of analysis of variance of heavy metals for different type of soils.
K Ca Mg Pb Al Mn Cu Zn Fe As Na
F 6.61 3.79 3.21 1.37 11.05 2.68 5.81 2.22 1.38 3.47 4.77Significance 0.00 0.01 0.03 0.26 0.00 0.05 0.00 0.09 0.26 0.02 0.00
K: potassium; Ca: calcium; Mg: magnesium; Pb: lead; Al: aluminium; Mn: manganese; Cu: copper; Zn: zinc; Fe: iron; As: arsenic; Na: sodium.

612 Waste Management & Research 31(6)
Soluble As has great mobility and can be carried long distances by nature. Thus, the As contamination must have migrated fur-ther than the other metals. This analysis also differentiates two clusters: cluster I—Pb, As, Zn, Cu, Mn, Ca, Na, Mg, K and Fe; and cluster II—Al. This means that the contamination source of metals in cluster I must have been different than in cluster II. Further study, such as X-ray diffraction analysis of soil particles for detailed minerology, is needed to explain the reasons behind the cluster differences and fluctuating concentrations of the met-als in the soil samples.
Treatment of municipal solid waste landfill will be more dif-ficult when the wastes are discharged and dumped openly with-out separation. Furthermore, this will also lead to diffused pollution—the most subtle and least remediable form of pollu-tion (Cossu, 2012). This study has highlighted that the Ampar Tenang soil was no longer capable of preventing pollution migration (Elwali et al., 2008) and the soil quality data shows pollution migration threats to the human health and environ-ment. As the sediment quality guideline is likely to assist in the risk assessment procedure, this collection and analysis of data may be further evaluated for proposing integrated aftercare/post-closure measures. Landfill aftercare needs to be imple-mented immediately so that the threats and mass flow emissions (e.g. leachate flow) can be monitored and be rehabilitated for the short and long term.
AcknowledgementsThe authors are grateful to Associate Professor Dr Ismail Yusoff, Department of Geology, University of Malaya, for his fieldwork assistance.
FundingThis study was supported financially by the University of Malaya under FRGS grant No. THEQS-2010A and PPP grant No. PS361-2010B.
ReferencesChapman PM, Allard PJ and Vigers GA (1999) Development of sedi-
ment quality values for Hong Kong special administrative region: a possible model for other jurisdictions. Marine Pollution Bulletin 38: 161–169.
Chua YP (2009) Advanced Research Statistics Book 5 : Regression Test, Factor Analysis and SEM. Shah Alam, Selangor, Malaysia: McGraw Hill Education.
Cossu R (2012) The environmentally sustainable geological repository: The modern role of landfilling. Waste Management 32: 243–244.
Department of Environment (2008) Pollution Sources Inventory. Putrajaya, Malaysia: Department of Environment of Malaysia.
Elwali B-EEAR (2005) The migration of inorganic contaminants from land-fill sites into the soil and groundwater systems. Unpublished Msc Thesis, University Kebangsaan Malaysia, Malaysia.
Elwali B-EEAR, Yusoff I, Samsudin AR, Yaacob WZW and Ghani MRA (2008) Heavy metal contamination of soil beneath a waste disposal site at Dengkil, Selangor, Malaysia. Soil and Sediment Contamination 17: 449–466.
Elwali B-EEAR, Yusoff I, Samsudin AR, Yaacob WZW and Rafek AGM (2010) Deterioration of groundwater quality in the vacinity of an active open-tipping site in west Malaysia. Hydrogeology Journal 18: 997–1006.
Ismail S, Yaacob WZW and Samsudin AR (2005) Geochemistry and heavy metal adsorption of Selangor soils. Geological Society of Malaysia 51: 59–62.
Krishnan G (2008) Dumpsite almost full at Ampar Tenang. The Star, 20 June, 08. Lamthothe PJ, Fries TL and Consul JJ (1986) Evaluation of a microwave
oven system for the dissolution of geologic samples. Anal Chem 53: 1886–1887.
Luo W, Lu Y, Giesy JP, Wang T, Shi Y, Wang G and Xing Y (2007) Effects of land use on concentrations of metals in surface soils and ecological risk around Guanting Reservoir, China. Environmental Geochemisty and Health 29: 459–471.
Mohamed AF, Yaacob WZW, Taha MR and Samsudin AR (2009) Groundwater and soil vulnerability in the Langat Basin Malaysia. European Journal of Scientific Research 27: 628–635.
Mokhtar ASB (2007) Geological and chemical studies of water bodies in Langat Basin. Unpublished Bachelor Thesis, University of Malaya, Malaysia.
NAHRIM and NRE (2010) Desktop Study on Groundwater Contamination at Landfill Sites in Selangor. Seminar of Geological Society of Malaysia: National Hydraulic Research Institute of Malaysia, Ministry of Natural Resources and Environment & Geological Society of Malaysia, Groundwater Night.
Paramananthan S (2000) Soils Of Malaysia; Their Characteristics and Identification. Kuala Lumpur: Academy of Sciences Malaysia.
Regadío M, Ruiz AI, De Soto IS, Rodriguezrastrero M, Sanchez N, Gismera MJ, et al. (2012) Pollution profiles and physicochemical parameters in old uncontrolled landfills. Waste Management 32: 482–497.
Ridwan N, Yaacob WZW and Samsudin AR (2005) The retention capabili-ties of soils at Batang Berjuntai and Ampar Tenang as natural clay liners for landfill systems using leaching column test and selective sequential extraction analysis. Geological Society of Malaysia Bulletin 51: 47–57.
Samsudin AR, Elwali B-e EAR, Yaacob WZW and Hamzah U (2006) Mapping of contamination plumes at municipal solid waste disposal sites using geoelectric imaging technique: case studies in Malaysia. Journal of Spatial Hydrology 6: Journal of Spatial Hydrology 6: 13–22.
Samsudin AR, Elwali B-e EAR and Yaacob WZW (2007) Delineation of leachate plumes at two waste disposal sites, Selangor. Geological Society of Malaysia 53: 47–50.
US EPA (United States Environmental Protection Agency) (1998). Locating and Estimating Air Emissions from Sources of Arsenic and Arsenic Compounds. EPA-454/R-98-013. Research Triangle Park, NC: Office of Air Quality, Planning And Standards. Available at: http: //www.epa.gov/ttnchie1/le/arsenic.pdf: Office of Air Quality Planning and Standards, US EPA (accessed 7 March 2013).