Waste Management and Minimisation Plan 2012 · Waste Management and Minimisation Plan 2012 ... 5.3...
58
Waste Management and Minimisation Plan 2012 PALMERSTON NORTH CITY COUNCIL DECEMBER 2012
Transcript of Waste Management and Minimisation Plan 2012 · Waste Management and Minimisation Plan 2012 ... 5.3...
Waste Management and Minimisation Plan 2012
PALMERSTON NORTH CITY COUNCIL
DECEMBER 2012
September 2012 i i PNCC W MMP 2012
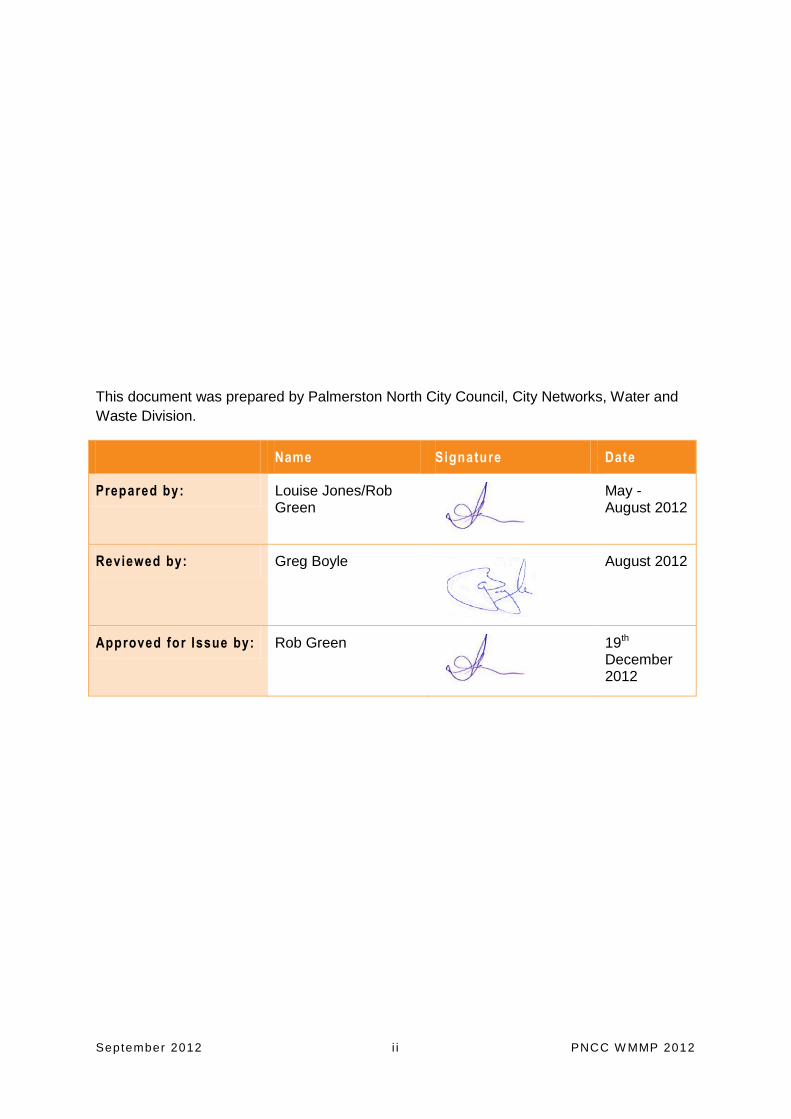
This document was prepared by Palmerston North City Council, City Networks, Water and
Waste Division.
Name Signature Date
Prepared by: Louise Jones/Rob Green
May - August 2012
Reviewed by: Greg Boyle
August 2012
Approved for Issue by: Rob Green
19th December 2012
September 2012 i i i PNCC W MMP 2012
Version No. Reason for Amendment Date
1 Original Issue May 2012
2 -4 Development Edits May – July 2012
5 -7 Editorial Changes July – September 2012
8 – 10 Changes after Planning & Policy Committee Meeting
September 2012
11 Final Formatting Changes September 2012
12 Final Issue – For Public Consultation 27th September 2012
13 Officer’s recommended changes as a result of submissions presented to Planning & Policy Committee Meeting 3 December 2012
26th November 2012
14 Changes requested after Planning & Policy Committee Meeting 3 December. Present to full Council 17th December 2012 for Final Adoption
4th December 2012
PNCC Reference No: DMS-#814857
Water & Waste Division Palmerston North City Council l Private Bag 11034 l Palmerston North
P: +64 (6) 3568199 l F: +64 (6) 3514489 l www.pncc.govt.nz
September 2012 iv PNCC W MMP 2012
Waste Management and Minimisation Plan
Contents 1 Introduction .................................................................................................. 1
1.1 Purpose of the Plan .................................................................................................. 1
1.2 Scope of the Plan ..................................................................................................... 1
1.3 Current Status of the Plan ........................................................................................ 1
1.4 Levels of Service Considerations ............................................................................. 2
1.5 Plan Review ............................................................................................................. 2
2 Visions, Goals and Targets ......................................................................... 2
2.1 Council Vision and Goals ......................................................................................... 2
2.2 Sustainable City Strategy ......................................................................................... 2
2.3 Waste Minimisation Targets ..................................................................................... 3
2.4 Public Health Protection ........................................................................................... 3
2.5 Climate Change ....................................................................................................... 3
3 Policies, Plans and Regulations .................................................................. 4
3.1 Summary of Policies and Legislation ........................................................................ 4
3.1.1 Waste Minimisation Act 2008 ............................................................................. 4
3.1.2 New Zealand Waste Strategy 2010.................................................................... 5
3.1.3 Local Government Act 2002............................................................................... 5
3.1.4 The Health Act 1956 .......................................................................................... 5
3.1.5 The Resource Management Act 1991 ................................................................ 5
3.1.6 PNCC Nuisance Bylaw 2011 ............................................................................. 6
4 The Waste Problem ...................................................................................... 6
4.1 Overview of Existing Waste Management ................................................................ 6
4.2 How Much Waste is generated in Palmerston North? ............................................... 7
4.2.1 How Much of the Waste Stream is Controlled by Council? ................................ 8
4.3 How is Waste Collected in Palmerston North? ......................................................... 9
4.4 How is Waste Disposed of in Palmerston North? ................................................... 10
4.5 How Much Waste Can we Divert from Landfill? ...................................................... 11
5 Proposed Methods for Waste Management and Minimisation ................ 14
5.1 Areas of focus in 2012 Waste Management and Minimisation Plan........................ 14
5.2 Options for the Future ............................................................................................ 14
5.3 Council’s Existing Waste Management Services .................................................... 15
5.4 Council’s Intended Role ......................................................................................... 15
September 2012 v PNCC W MMP 2012
5.5 Action Plan ............................................................................................................. 16
6 Funding the Plan ........................................................................................ 23
6.1 How Rubbish and Recycling Activities in the City are Funded ................................ 23
6.1.1 Rubbish Collection and Disposal ..................................................................... 23
6.1.2 Recycling Collection and Processing ............................................................... 23
6.1.3 Composting Operations ................................................................................... 23
6.1.4 Other revenues ................................................................................................ 23
6.2 Waste Minimisation Levy Funding .......................................................................... 23
6.3 Direct Funding of Initiatives in the 2012 WMMP ..................................................... 24
6.4 Indirect Funding of Initiatives in the 2012 WMMP ................................................... 24
7 Monitoring and Progress Reporting ......................................................... 24
7.1 Monitoring .............................................................................................................. 25
7.2 Reporting ............................................................................................................... 25
Appendices External Organisations Involved in Recycling & Waste Minimisation Appendix A.
Activities ..................................................................................................................... 26
Waste Assessment - Executive Summary ................................................ 28 Appendix B.
Table of Figures Figure 1: Overview of Waste Management in the District ...................................................... 7
Figure 2: Palmerston North Waste Stream Control and Composition .................................... 9
Figure 3: Potentially Recoverable Landfill Materials in Palmerston North ............................ 13
Table of Tables Table 1: Overall Waste Breakdown for Palmerston North ..................................................... 7
Table 2: Council Control of Overall Waste Flows from Palmerston North .............................. 8
Table 3: Collection Services Provided ................................................................................. 10
Table 4: Drop-off and Transfer Stations .............................................................................. 10
Table 5: Composition of Landfilled Waste ........................................................................... 12
Table 6: Non-recyclable volumes ........................................................................................ 13
Table 7: Palmerston North City Council Waste Minimisation Action Plan ............................ 17
September 2012 vi PNCC W MMP 2012
Waste Management and Minimisation Plan
Foreword
This Waste Management and Minimisation Plan (WMMP) has been developed following
preparation of a detailed waste assessment in early 2012 and review of the previous, 2009
WMMP, in accordance with the Waste Minimisation Act 2008. Whilst limited actual progress
has been made in some areas since adoption of the 2009 WMMP, introduction of the
recycling wheelie bin service in 2010 and construction of the recycling processing facility at
the Awapuni Resource Recovery Park were major achievements for the Council and provide
most residents in the City the opportunity to readily participate in recycling.
The waste assessment has shown that approximately 60% of the Palmerston North waste
stream has been diverted from landfills since 2009, largely as a result of the above recycling
initiatives. This Plan retains the four strategic focus areas from 2009 and introduces a series
of aims and objectives designed to facilitate achievement of the community’s target of 75%
diversion of waste to beneficial use by 2015.
Acknowledgements and References
The Council wishes to acknowledge the work of Eunomia Research and Consulting Ltd and
Waste Not Consulting Ltd in preparing the 2012 Waste Assessment that was subsequently
used to inform and guide this WMMP. A link to this document can be found on Council’s
website: www.pncc.govt.nz
September 2012 vi i PNCC W MMP 2012
Executive Summary
The Council’s 2009 Waste Management and Minimisation Plan has been reviewed to take
account of the preparatory Waste Assessment completed in 2012 and to bring it up to date
with current initiatives towards achieving the community target of diverting 75% of waste to
beneficial use by 2015.
This WMMP builds on the strategic focus areas from 2009, being:
Reduction and diversion
Collection of residual waste
Disposal of residual waste
Means of implementation and funding
Aims, objectives and actions in the Plan have been updated to reflect Council’s role in
facilitating waste minimisation practices and linkages to Council’s Sustainable City Strategy
and 2012-22 Long Term Plan have been made.
The WMMP includes:
A waste assessment
Aims and objectives for achieving effective and efficient waste management and
minimisation within the City
A series of actions to achieve the aims and objectives of the WMMP
Details of how the WMMP is to be implemented and funded
Monitoring, reporting and review procedures
The key features of this WMMP include:
The role of Council – collaboration, facilitation and promotion of waste management
and minimisation
Measures to improve control of the waste stream and to improve accessibility to
recycling outlets
Processes to improve financial management of the activity
Measures to collaborate with and improve the involvement of community
organisations and businesses
Steps to improve access to waste data
Investigations into opportunities for waste minimisation to inform decisions regarding
programme development for the 2015-25 Long term Plan
September 2012 1 PNCC W MMP 2012
1 Introduction
1.1 Purpose of the Plan
The Waste Management and Minimisation Plan (WMMP) provides a summary of Palmerston
North City Council’s areas of strategic focus, aims, and objectives with respect to waste
management and minimisation. It describes how Council intends to achieve these objectives
through selected waste management activities.
The overriding goal is to divert as much waste material as is practicable from disposal to
landfill and convert it to some form of beneficial use through a 6-step hierarchal waste
minimisation process, starting with reduction and finishing with disposal of any residual
waste.
The Palmerston North City Council has an important role in promoting effective and efficient
waste management and minimisation within the City. It is not a role that it can fulfil in
isolation from other parts of the community and has therefore adopted a collaborative
approach involving facilitation, education and coordination of service delivery arrangements
with community organisations, the commercial sector, and government departments.
This Plan identifies how Council intends to combine the key contributors to waste
management and minimisation to collectively work towards achieving the community goal of
diverting 75% of waste to beneficial use by 2015.
This WMMP fulfils the requirements of the Waste Minimisation Act 2008.
1.2 Scope of the Plan
This WMMP covers waste minimisation for the whole of Palmerston North. It includes solid
waste collected and disposed of by commercial enterprise as well as waste collected by
Palmerston North City Council.
The WMMP also considers disposal of biosolids, specifically waste products from the
wastewater treatment (sludge).
1.3 Current Status of the Plan
This is the third version of the WMMP. First written in 2005 the WMMP was thoroughly
reviewed in 2009 when the current strategic focus areas were developed, being:
Reduction and diversion of waste
Collection of residual waste
Disposal of residual waste
Means of implementation and funding
The current (2012) review of the WMMP updates the aims and objectives in line with
current best practice, and builds on the progress made on waste minimisation targets
since 2009.
September 2012 2 PNCC W MMP 2012
1.4 Levels of Service Considerations
In preparing the WMMP, as well as ensuring compliance with all relevant legislation,
consideration has been given to national and international policy and best practice for waste
minimisation and recycling.
The WMMP has been prepared to ensure that the Levels of Service provided for the
Rubbish and Recycling Activity, as stated in the 2012-22 Long Term Plan, are achieved, and
that Council’s Vision and Goals and the ethos of key strategies and policies are upheld.
1.5 Plan Review
The WMMP will be next reviewed in 2015 and thereafter at intervals not exceeding six years.
2 Visions, Goals and Targets
2.1 Council Vision and Goals
Palmerston North City Council’s vision is that:
Palmerston North is recognised as a
vibrant, caring, innovative and sustainable
city
This Vision is supported by a number of Goals, in particular:
Palmerston North is a leading city in the quest to become
environmentally sustainable
2.2 Sustainable City Strategy
In 2010 Council adopted a Sustainable City Strategy. This strategy developed the Council
Vision and Goals with regard to creating a sustainable city. The Sustainable City Strategy
contains a number of goals around environmental sustainability one of which specifically
seeks to decrease waste:
Driver Four: Decreasing Waste
Reduce production of waste materials
Increase recycling by residents and business
Increase diversion of waste to productive uses
The WMMP is a key planning document in achieving the aims of the Sustainable City
Strategy.
September 2012 3 PNCC W MMP 2012
2.3 Waste Minimisation Targets
Palmerston North City Council (PNCC) has set the following community target for waste
minimisation in the City:
By 2015, Palmerston North will divert
75% of waste to beneficial use
2.4 Public Health Protection
Protecting public health is one of the original reasons for local authority involvement in waste
management. This was set out in the Heath Act 1956, although the requirements relating to
the removal of rubbish have now been repealed.
The NZ Waste Strategy (2010) contains the twin high level goals of “reducing the harmful
effects of waste” and “improving the efficiency of resource use”. In terms of addressing
waste management in a strategic context, protection of public health should be considered
one of the components entailed in ‘reducing harmful effects’.
In considering the manner in which public health issues should be addressed in the context
of this WMMP, it has been assumed that public health issues are likely to be present at
some level across all options. Public health issues should not therefore drive strategic
decisions about waste management activities, but should be evaluated across all options.
Issues can be flagged where a level of risk is likely to require specific management controls
or interventions, or where risks are so great as to override other considerations.
In most cases, public health issues will be addressed through setting appropriate
performance standards for waste services contracts, ensuring monitoring and reporting of
performance and that there are appropriate structures within contracts for addressing public
health issues that may arise.
2.5 Climate Change
In November 2011 Council, reinforced its commitment to being a sustainable city by signing
the Global Cities Covenant on Climate (The Mexico City Pact1). The principles of the Pact
include a commitment for Palmerston North City to reduce its greenhouse gas emissions
voluntarily, implementing measures to meet its goals, and registering emissions inventories
in a measurable, reportable and verifiable manner. The City’s progress is reported on the
Cities Climate Registry2.
At a City level the Council will measure progress against the Government's goals of:
•A 50% reduction in greenhouse gas emissions from 1990 levels by 2050
•A reduction of between 10% and 20% below 1990 levels by 2020.
1 www.mexicocitypact.org/en/
2 citiesclimateregistry.org/
September 2012 4 PNCC W MMP 2012
The Council uses the International Emissions Analysis Protocol supplemented with New
Zealand specific emissions factors to produce its inventories. Waste is an analysis sector of
the protocol, and one of the main sources of emissions for the City. The waste estimate for
the City in this plan will be used to inform future community scale estimates of greenhouse
gas emissions.
The Council also adopted a Climate Change Action Plan to reduce greenhouse gas
emissions from its own operations. The Waste Management and Minimisation Plan’s goal for
the City was adopted as a corporate goal. The full set of the Council’s goals is:
Council will:
1. Strive to be a zero carbon organisation by 2050
On the journey towards becoming a zero carbon organisation Council will aim to:
2. Use a 100% renewable electricity supply by 2015
3. Reduce energy use by 10% by 2015
4. Divert 75% of Council's waste from landfill by 2015
5. Have 35% of employees travel to work by active transport by 2015
3 Policies, Plans and Regulations
3.1 Summary of Policies and Legislation
In preparing the WMMP, Palmerston North City Council has taken into account national
legislation and policies that place a commitment on territorial authorities when considering
waste minimisation and waste collection and disposal practices. The following section
summarises the key legislation.
3.1.1 Waste Minimisation Act 2008
The Waste Minimisation Act 2008 (WMA (2008)) aims to encourage waste minimisation and
decrease waste disposal in order to protect the environment from harm and to provide
environmental, social, economic and cultural benefits.
The Act describes the relationship between a waste management and waste minimisation
plan to the waste hierarchy of:
Reduction
Reuse
Recycling
Recovery
Treatment and disposal
(in descending order of importance).
The main elements of the Act include:
A levy placed on waste disposal to landfill to generate funding for local government,
communities and businesses to reduce the amount of waste.
September 2012 5 PNCC W MMP 2012
Development of product stewardship.
Regulation to assist in reporting on waste minimisation.
Definition of roles and responsibilities of territorial authorities with regard to waste
minimisation, including the requirements for a Waste Assessment, a Waste
Management and Minimisation Plan (this document), the requirement to spend levy
funding on waste minimisation activities and provision for creation of Waste Bylaws.
Enforcement provisions
Establishment of an independent Board to advise the Minister for Environment on
waste minimisation issues.
3.1.2 New Zealand Waste Strategy 2010
The WMA (2008) requires that territorial authorities have regard to the New Zealand Waste
Strategy (NZWS) when preparing and developing their WMMP. The NZWS has two main
goals:
reducing the harmful effects of waste, and
improving the efficiency of resource use.
These two goals form the fundamental basis of this WMMP (refer to Clause 5.5)
3.1.3 Local Government Act 2002
The Local Government Act 2002 (LGA) requires that territorial authorities produce and
review a Long Term Plan (LTP) every three years which outlines the Council’s vision and
goals, financial strategy, community outcomes and programme of work for the next ten
years. The WMMP must reflect the outcomes of the LTP.
The LGA also empowers territorial authorities to make bylaws to protect the public from
nuisance and maintain public health and safety and provides powers to enforce such bylaws.
3.1.4 The Health Act 1956
The Health Act 1956 places obligations on territorial authorities to provide sanitary works for
the collection and disposal of refuse for the purpose of public health protection.
The Health Act provides that a territorial authority must:
improve, promote and protect public health within its district
employ Environmental Health Officers, whose duties include enforcing nuisance
provisions, regulations and bylaws
identify and abate nuisances
It is the Health Act that compels territorial authorities to ensure litter and other rubbish and
refuse is removed from public places so as not to cause a nuisance or public health risk.
3.1.5 The Resource Management Act 1991
The Resource Management Act 1991 (RMA) provides guidelines and regulation for the
sustainable management of natural resources. The RMA allows regional councils to control
the discharge of contaminants to air, land or water through the resource consent process. All
waste minimisation activities must comply with the requirements of the RMA and any specific
resource consents issued.
September 2012 6 PNCC W MMP 2012
3.1.6 PNCC Nuisance Bylaw 2011
Palmerston North City Council Nuisance Bylaw 2011 sets out the specific requirements for
refuse disposal and recycling in Palmerston North to ensure:
That refuse is disposed of in a safe and sanitary manner in the interests of public
health
That obstruction of the streets by refuse and recyclable material is kept to a minimum
4 The Waste Problem
4.1 Overview of Exist ing Waste Management
Palmerston North, located in the heart of the Manawatu, is a major service centre for
surrounding rural areas. Its economy is based substantially on being a distribution hub to the
central North Island, on research and education related to the agricultural sector and also as
a base for the defence sector. Although there is some manufacturing activity the
manufacturing base is relatively small compared to national profiles and is projected to
diminish in importance in the coming years. Key waste streams now and in the future
therefore are related to agricultural processing, distribution, retail, healthcare and
administration type activities.
Palmerston North’s population is expected to steadily increase at a rate of 0.7% p.a. over the
next ten years, reducing to 0.6% p.a. over the following ten year period, to reaching
approximately 94,000 people by 2031. The small towns of Longburn and Bunnythorpe
(combined population of approximately 2,500), previously serviced by Manawatu District
Council, have become part of PNCC from 1 July 2012.
A waste assessment carried out in 2012 in accordance with section 51 of the Waste
Minimisation Act 2008 identified, inter alia, the current status of and future demand for waste
management and minimisation services in the City (Refer to Appendix B). A full copy of the
waste assessment can be found on Council’s website: www.pncc.govt.nz
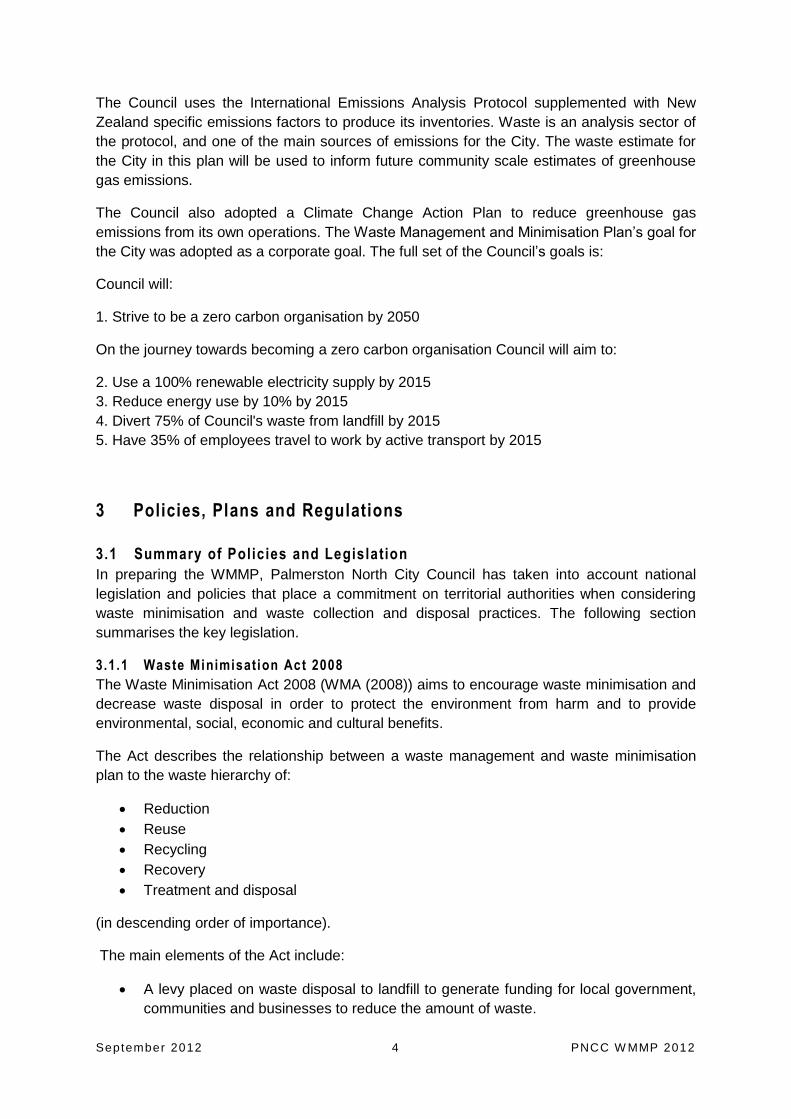
Waste services in the City, including refuse and recycling collection, transfer station and
operation of drop-off facilities and processing and disposal facilities are provided by a mix of
private sector, community and Council organisations. Figure 1 shows an overview of waste
management in the City.
September 2012 7 PNCC W MMP 2012
Figure 1: Overview of Waste Management in the District
** Note Cairns Group have subsequently been placed into receivership and are no longer
operating a Transfer Station at Mathews Avenue
4.2 How Much Waste is generated in Palmerston North ?
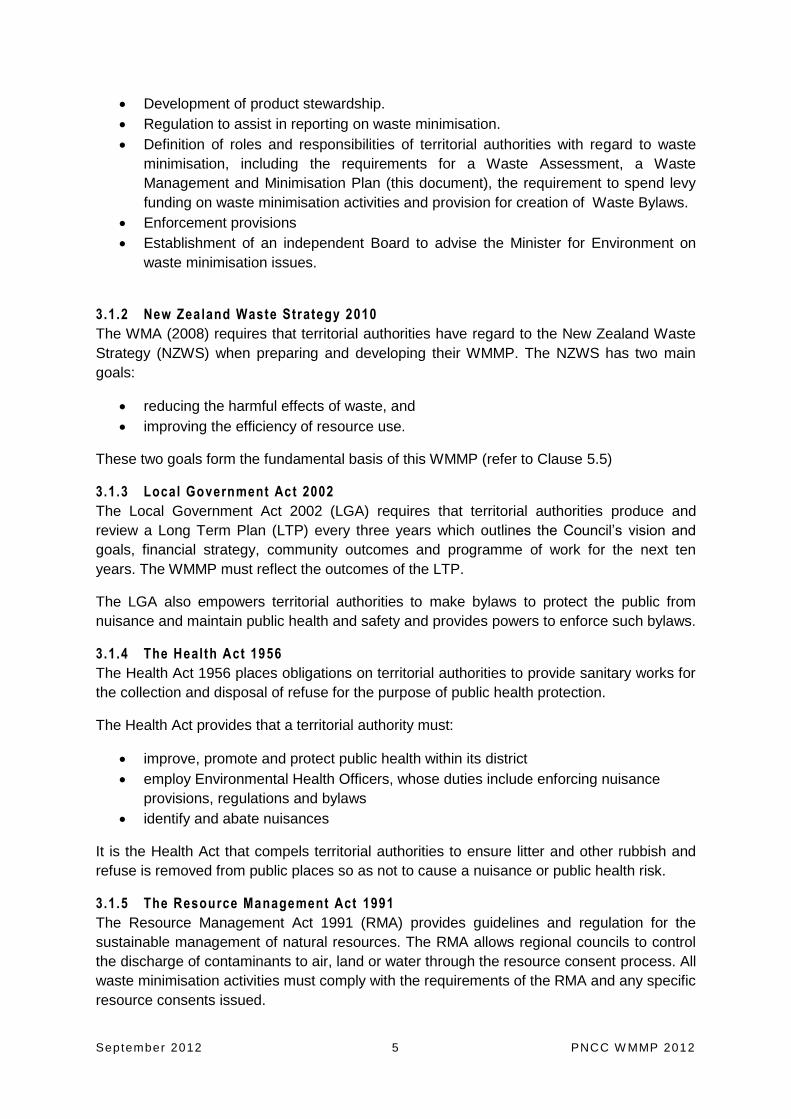
Based on the generalised waste figures for New Zealand in the 2012 Waste Assessment, it
has been estimated that approximately 108,000 tonnes of waste per annum was produced in
Palmerston North City during the 2011/2012 financial year. The overall waste stream is
broken down into four basic waste types as shown in Table 1.
Type of waste T/annum 2011/2012 % of total
Landfilled waste 44,000 T/annum 41%
Recycled waste 20,070 T/annum 18%
Composted waste 19,124 T/annum 18%
Cleanfilled waste 25,000 T/annum 23%
Total 108,194 T/annum 100%
Table 1: Overall Waste Breakdown for Palmerston North
Bonny Glen
Landfill
Midwest
Disposal
(TPI &
ESL)
Matthews Ave Transfer Station
(Cairns Group)
Malden St Transfer Station
(Manuwatu Waste)
Budget
Waste
(ESL)
Waste
Management
(TPI)
Council
(City Enterprises)
Domestic Kerbside
Collections
Ferguson St
Recycle
Depot
Medical Medichem
Ashhurst RTS(PNCC)
Out of district
waste
(mainly C&D)
Construction &
Demolition
Industrial/
Commercial/
Institutional
Landscaping
Residential
General Waste
MRF
Greenwaste
Strongs Metal
FullCircle
Awapuni RRP
Cleanfill
Waste to landfill
Recycling
Green waste
Cleanfill
Hazardous waste
Civil works &
excavations
KEY
September 2012 8 PNCC W MMP 2012
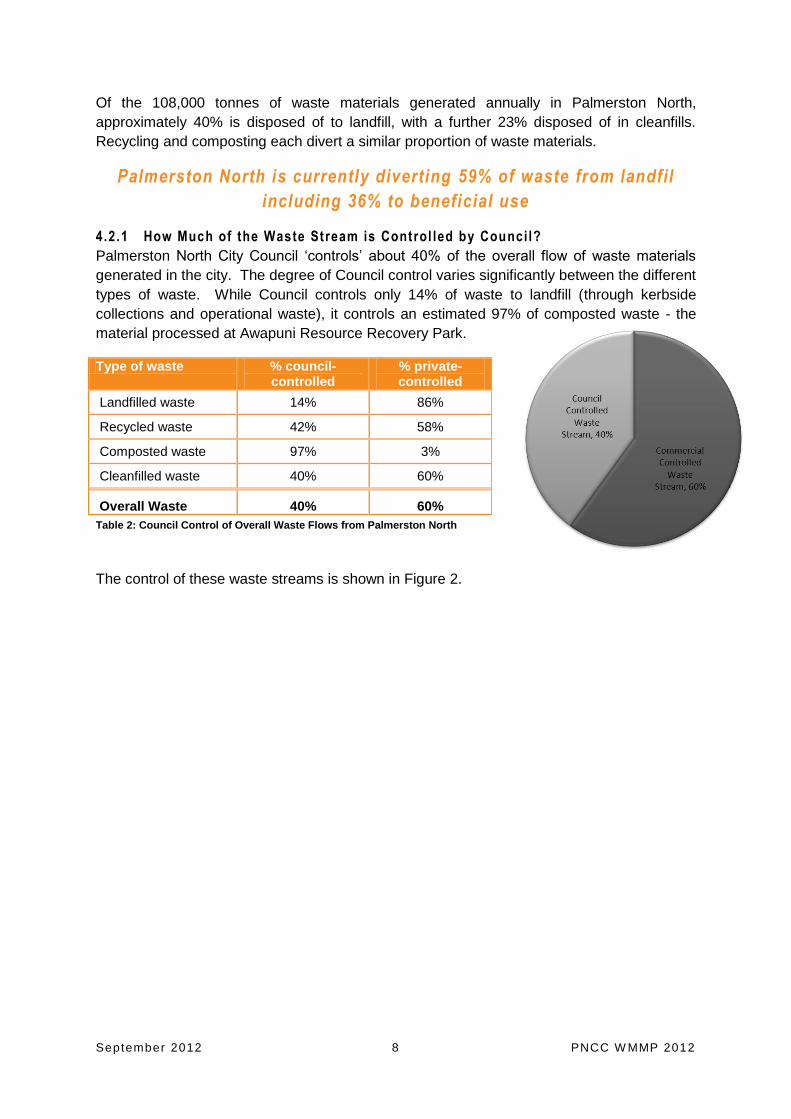
Of the 108,000 tonnes of waste materials generated annually in Palmerston North,
approximately 40% is disposed of to landfill, with a further 23% disposed of in cleanfills.
Recycling and composting each divert a similar proportion of waste materials.
Palmerston North is currently diverting 59% of waste from landfil
including 36% to beneficial use
4.2.1 How Much of the Waste Stream is Control led by Council?
Palmerston North City Council ‘controls’ about 40% of the overall flow of waste materials
generated in the city. The degree of Council control varies significantly between the different
types of waste. While Council controls only 14% of waste to landfill (through kerbside
collections and operational waste), it controls an estimated 97% of composted waste - the
material processed at Awapuni Resource Recovery Park.
Type of waste % council-controlled
% private-controlled
Landfilled waste 14% 86%
Recycled waste 42% 58%
Composted waste 97% 3%
Cleanfilled waste 40% 60%
Overall Waste 40% 60%
Table 2: Council Control of Overall Waste Flows from Palmerston North
The control of these waste streams is shown in Figure 2.
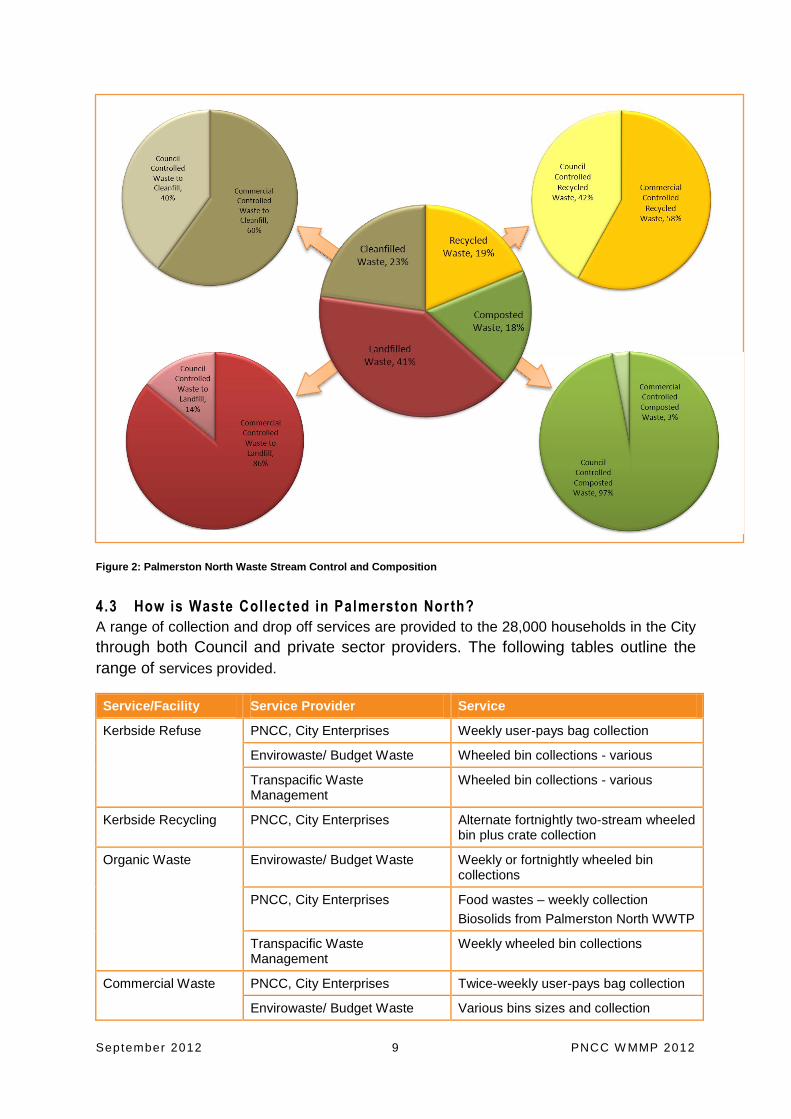
September 2012 9 PNCC W MMP 2012
Figure 2: Palmerston North Waste Stream Control and Composition
4.3 How is Waste Collected in Palmerston Nor th?
A range of collection and drop off services are provided to the 28,000 households in the City
through both Council and private sector providers. The following tables outline the
range of services provided.
Service/Facility Service Provider Service
Kerbside Refuse PNCC, City Enterprises Weekly user-pays bag collection
Envirowaste/ Budget Waste Wheeled bin collections - various
Transpacific Waste Management
Wheeled bin collections - various
Kerbside Recycling PNCC, City Enterprises Alternate fortnightly two-stream wheeled bin plus crate collection
Organic Waste Envirowaste/ Budget Waste Weekly or fortnightly wheeled bin collections
PNCC, City Enterprises Food wastes – weekly collection
Biosolids from Palmerston North WWTP
Transpacific Waste Management
Weekly wheeled bin collections
Commercial Waste PNCC, City Enterprises Twice-weekly user-pays bag collection
Envirowaste/ Budget Waste Various bins sizes and collection
September 2012 10 PNCC W MMP 2012
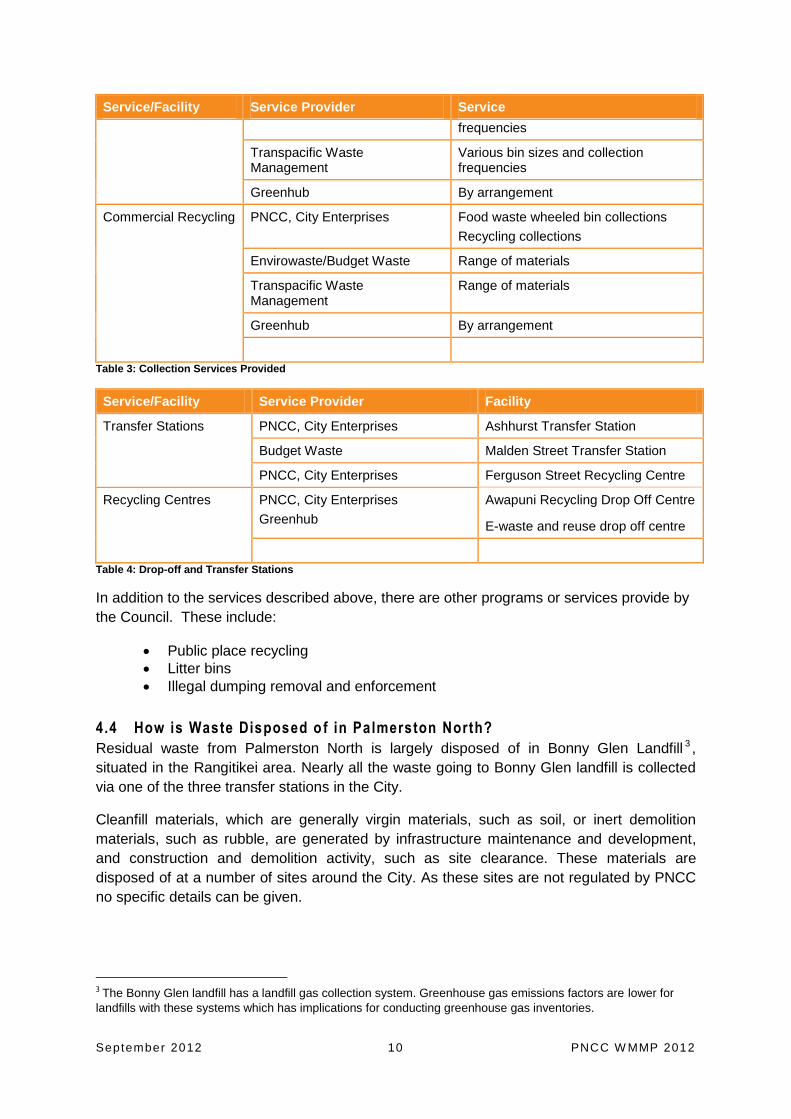
Service/Facility Service Provider Service
frequencies
Transpacific Waste Management
Various bin sizes and collection frequencies
Greenhub By arrangement
Commercial Recycling PNCC, City Enterprises Food waste wheeled bin collections
Recycling collections
Envirowaste/Budget Waste Range of materials
Transpacific Waste Management
Range of materials
Greenhub By arrangement
Table 3: Collection Services Provided
Service/Facility Service Provider Facility
Transfer Stations PNCC, City Enterprises Ashhurst Transfer Station
Budget Waste Malden Street Transfer Station
PNCC, City Enterprises Ferguson Street Recycling Centre
Recycling Centres PNCC, City Enterprises
Greenhub
Awapuni Recycling Drop Off Centre
E-waste and reuse drop off centre
Table 4: Drop-off and Transfer Stations
In addition to the services described above, there are other programs or services provide by
the Council. These include:
Public place recycling
Litter bins
Illegal dumping removal and enforcement
4.4 How is Waste Disposed o f in Palmerston North?
Residual waste from Palmerston North is largely disposed of in Bonny Glen Landfill 3 ,
situated in the Rangitikei area. Nearly all the waste going to Bonny Glen landfill is collected
via one of the three transfer stations in the City.
Cleanfill materials, which are generally virgin materials, such as soil, or inert demolition
materials, such as rubble, are generated by infrastructure maintenance and development,
and construction and demolition activity, such as site clearance. These materials are
disposed of at a number of sites around the City. As these sites are not regulated by PNCC
no specific details can be given.
3 The Bonny Glen landfill has a landfill gas collection system. Greenhouse gas emissions factors are lower for
landfills with these systems which has implications for conducting greenhouse gas inventories.
September 2012 11 PNCC W MMP 2012
Almost all greenwaste and other organic materials are processed at the Council-owned
Awapuni Resource Recovery Park. A small amount of greenwaste is removed from the City
by a private waste operator for composting elsewhere.
Recycled materials, or diverted waste, are disposed of to a variety of buyers. Approximately
20,000 tonnes of waste materials are estimated to be recycled annually from Palmerston
North. The largest component of recycled waste is paper/cardboard that is collected and
processed by the private sector. Paper/cardboard represents 64% of all recycled waste in
the city. Council’s kerbside mixed recycling material is the second largest component,
comprising 21% of the total. Council recycling materials are sold to a variety of buyers all of
which are vetted to ensure reliability and integrity of the statements made about the final
destination of the materials. Where possible Council endeavours to sell recycled products to
companies that have sound environmental management and safe ethical work practices.
The final destination of the recycled materials collected by the private sector is not known.
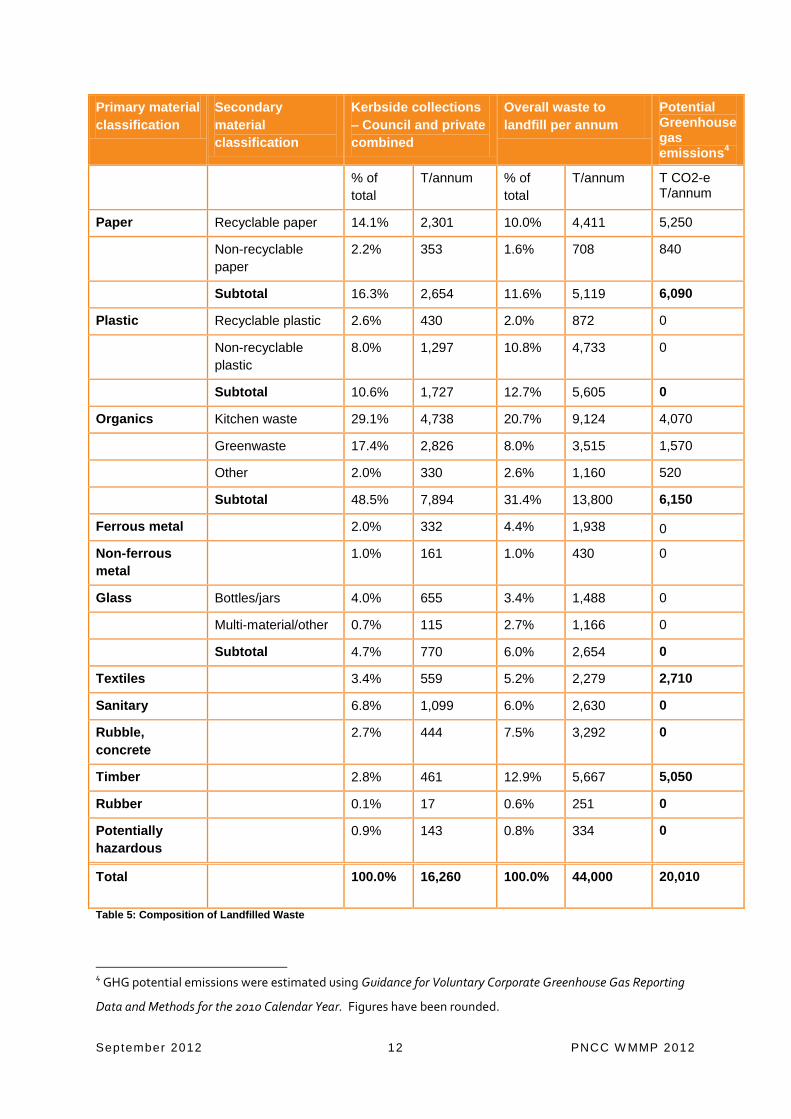
4.5 How Much Waste Can we Divert from Landfi l l?
It is estimated that on average 44,000 tonnes of waste goes to landfill from Palmerston North
each year. It is estimated that as much as 65% to 70% of the residual waste can be
recovered for beneficial use. Table 5 shows the composition of this landfilled waste and
Figure 3 shows the figures in a graphical form highlighting the quantities of potentially
recoverable materials
September 2012 12 PNCC W MMP 2012
Primary material
classification
Secondary
material
classification
Kerbside collections
– Council and private
combined
Overall waste to
landfill per annum
Potential Greenhouse gas emissions
4
% of
total
T/annum % of
total
T/annum T CO2-e T/annum
Paper Recyclable paper 14.1% 2,301 10.0% 4,411 5,250
Non-recyclable
paper
2.2% 353 1.6% 708 840
Subtotal 16.3% 2,654 11.6% 5,119 6,090
Plastic Recyclable plastic 2.6% 430 2.0% 872 0
Non-recyclable
plastic
8.0% 1,297 10.8% 4,733 0
Subtotal 10.6% 1,727 12.7% 5,605 0
Organics Kitchen waste 29.1% 4,738 20.7% 9,124 4,070
Greenwaste 17.4% 2,826 8.0% 3,515 1,570
Other 2.0% 330 2.6% 1,160 520
Subtotal 48.5% 7,894 31.4% 13,800 6,150
Ferrous metal 2.0% 332 4.4% 1,938 0
Non-ferrous
metal
1.0% 161 1.0% 430 0
Glass Bottles/jars 4.0% 655 3.4% 1,488 0
Multi-material/other 0.7% 115 2.7% 1,166 0
Subtotal 4.7% 770 6.0% 2,654 0
Textiles 3.4% 559 5.2% 2,279 2,710
Sanitary 6.8% 1,099 6.0% 2,630 0
Rubble,
concrete
2.7% 444 7.5% 3,292 0
Timber 2.8% 461 12.9% 5,667 5,050
Rubber 0.1% 17 0.6% 251 0
Potentially
hazardous
0.9% 143 0.8% 334 0
Total 100.0% 16,260 100.0% 44,000 20,010
Table 5: Composition of Landfilled Waste
4 GHG potential emissions were estimated using Guidance for Voluntary Corporate Greenhouse Gas Reporting
Data and Methods for the 2010 Calendar Year. Figures have been rounded.
September 2012 13 PNCC W MMP 2012
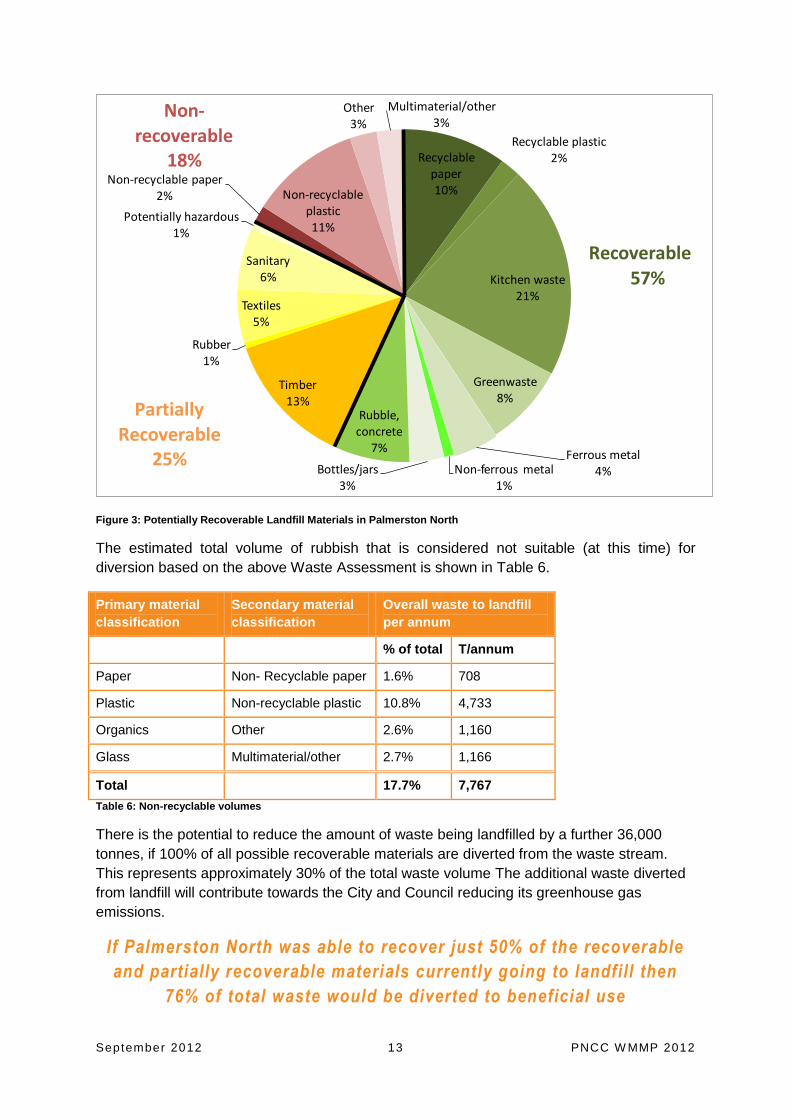
Figure 3: Potentially Recoverable Landfill Materials in Palmerston North
The estimated total volume of rubbish that is considered not suitable (at this time) for
diversion based on the above Waste Assessment is shown in Table 6.
Primary material
classification
Secondary material
classification
Overall waste to landfill
per annum
% of total T/annum
Paper Non- Recyclable paper 1.6% 708
Plastic Non-recyclable plastic 10.8% 4,733
Organics Other 2.6% 1,160
Glass Multimaterial/other 2.7% 1,166
Total 17.7% 7,767
Table 6: Non-recyclable volumes
There is the potential to reduce the amount of waste being landfilled by a further 36,000
tonnes, if 100% of all possible recoverable materials are diverted from the waste stream.
This represents approximately 30% of the total waste volume The additional waste diverted
from landfill will contribute towards the City and Council reducing its greenhouse gas
emissions.
If Palmerston North was able to recover just 50% of the recoverable
and partially recoverable materials currently going to landfill then
76% of total waste would be diverted to beneficial use
Recyclable paper10%
Recyclable plastic2%
Kitchen waste21%
Greenwaste8%
Ferrous metal4%Non-ferrous metal
1%Bottles/jars
3%
Rubble, concrete
7%
Timber13%
Rubber1%
Textiles5%
Sanitary6%
Potentially hazardous1%
Non-recyclable paper2% Non-recyclable
plastic11%
Other3%
Multimaterial/other3%
Recoverable57%
PartiallyRecoverable
25%
Non-
recoverable18%
September 2012 14 PNCC W MMP 2012
These recoverable and partially recoverable materials have been the focus for Council’s
development of the 2012 WMMP.
5 Proposed Methods for Waste Management and Minimisation
5.1 Areas of focus in 2012 Waste Management and Minimisation Plan
The 2012 WMMP retains the following strategic focus areas from the 2009 WMMP:
1. Reduction and Diversion of Waste
This area focuses on ways for providing services and funding that encourage the
avoidance of waste and its disposal to landfills. The major initiative in this area post the
2009 WMMP was the very successful introduction of recycling wheelie bins and
construction of the recycling processing facility in 2009/10. Other initiatives focus on
organic waste, which has been partially progressed through the development of a pilot
composting operation at Awapuni, and the provision of a resource recovery park. This
will be further addressed through the planned upgrades of Ferguson Street Recycling
Drop-Off Point in 2012/13. This area also includes the education programmes that have
been developed for primary and intermediate schools as well as continued support for
the Zero Waste Academy partnership with Massey University.
2. Collection of Residual Waste
This area focuses on ensuring residual waste is collected efficiently and hygienically. It is
intended to regularly review the refuse collection services in Palmerston North and
Council’s role in that activity.
3. Disposal of Residual Waste
This area focuses on ensuring residual waste disposal is carried out with minimal
environmental impact. It is intended to look at options for cleanfill and hazardous waste
disposal.
4. Implementation and Funding
This area focuses on ensuring appropriate funding and charging mechanisms are in
place to provide the required services and recover the costs of waste minimisation
activities. Initiatives include determining best use of the MfE Waste Levy funding,
developing partnerships with the private sector for the provision of waste services and
looking at ways that Council could provide leadership in the area of waste minimisation
in Palmerston North. Although some work has already been done in this area, very little
progress has been made.
5.2 Options for the Future
In developing the 2012 WMMP it has become clear that there is still considerable progress
to be made on the four strategic focus areas from the 2009 WMMP, so these focus areas
have been retained. In addition, the Council has updated and consolidated the Aims and
September 2012 15 PNCC W MMP 2012
Objectives from the 2009 plan into five Aims and methods for implementation of waste
management and minimisation in Palmerston North City
The five Aims and methods are:
1. To continue existing activities and find new activities to divert
waste to beneficial use
2. To control and regulate waste collection so as to ensure that
maximum waste is diverted to beneficial use and to minimise
environmental impact
3. To fund waste management activities in a way that promotes
waste minimisation and recycling and appropriately apportions
the costs to users, rate payers and suppliers
4. To work with community groups and the private sector to
achieve waste minimisation goals in collaboration with
developing Council funded activities or assets
5. To continue to educate the community as to the benefits and
methods of waste minimisation and thereby improve the
participation in waste minimisation activities
5.3 Council ’s Existing Waste Management Services
Council’s involvement in waste management activities has been reviewed as part of the
WMMP review. Consideration was given to alternative models for provision of rubbish and
recycling services in the City. The Council’s view is that it is important that it retains, and in
fact attempts to increase, control over rubbish and recycling services in the City to ensure
that Palmerston North is able to continue towards its goal of becoming a sustainable city.
Therefore, Council will continue to provide the same levels of service for its Rubbish and
Recycling activity through the collection of rubbish and recycling in the City and provision of
transfer stations and recycling drop off points where the need can be justified. Council will
also continue existing education and other waste minimisation programmes.
5.4 Council ’s Intended Role
Palmerston North City Council has an integral role in management of waste in the City.
Council has a number of statutory obligations with respect to the planning and provision of
waste services. In determining its role Council has endeavoured to ensure that these
obligations are met. Council’s view is that waste is not just a ‘Council’ problem but ultimately
resides with all sectors of the community to solve. While Council, through its statutory
obligations and its traditional involvement in waste management activities, has a natural
September 2012 16 PNCC W MMP 2012
leadership role, it is vital that part of the role entails securing commitments from all sectors
and ensuring that there are clear action plans for each sector to follow to minimise waste
disposal to landfills . On that basis Council’s intended role is one of collaboration, promotion
and facilitation.
It is proposed that part of the Council’s role may be to provide appropriate regulatory and
economic incentive frameworks to steer solid waste activity.
Council will provide leadership in advocating waste minimisation, including promotion and
education programmes, establishing partnerships, and information sharing where
appropriate.
In addition, Council proposes to continue provision of a range of waste minimisation services
similar to those currently delivered, and in a manner that provides cost effective solutions for
the City as a whole. This role may include facilitation of services provided by the private
sector.
5.5 Action Plan
In order to put the five aims into practice Council has developed an Action Plan.
The following table outlines the five aims and objectives for waste management and
minimisation for the City and the actions and timeframes required to achieve the objectives:
September 2012 17 PNCC W MMP 2012
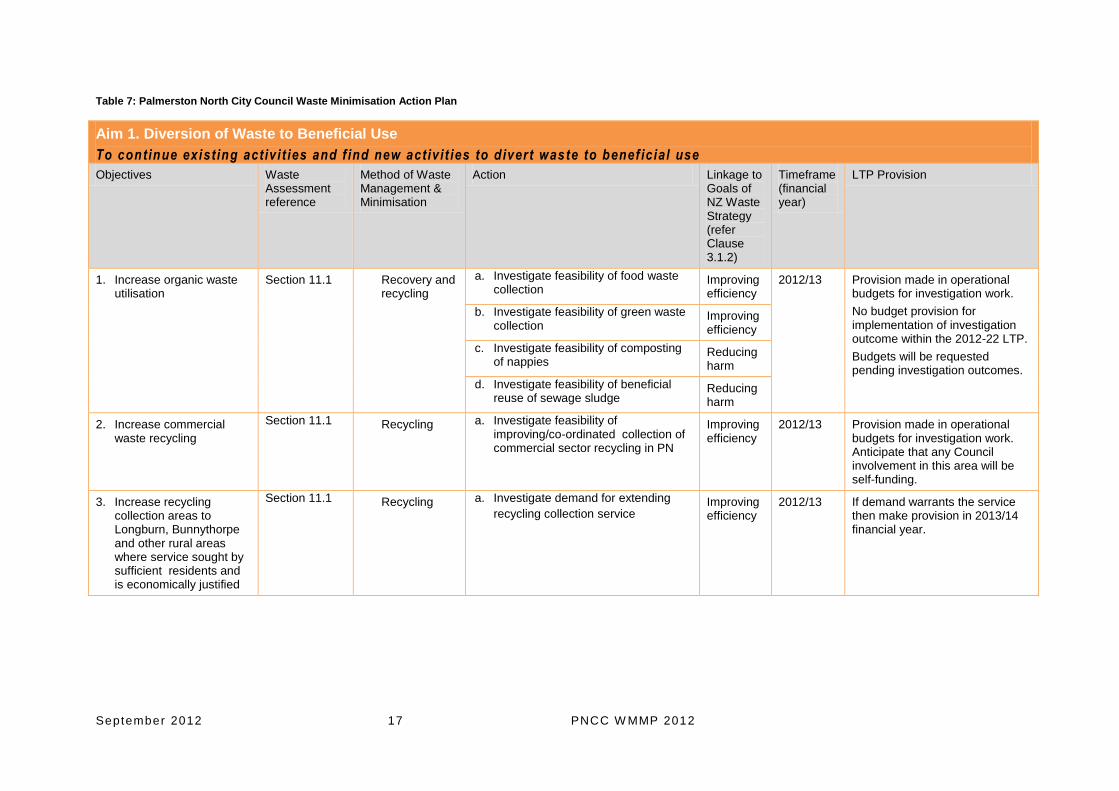
Table 7: Palmerston North City Council Waste Minimisation Action Plan
Aim 1. Diversion of Waste to Beneficial Use
To continue exist ing activi t ies and f ind new activit ies to d ivert waste to benef icial use
Objectives Waste Assessment reference
Method of Waste Management & Minimisation
Action Linkage to Goals of NZ Waste Strategy (refer Clause 3.1.2)
Timeframe (financial year)
LTP Provision
1. Increase organic waste utilisation
Section 11.1 Recovery and recycling
a. Investigate feasibility of food waste collection
Improving efficiency
2012/13
Provision made in operational budgets for investigation work.
No budget provision for implementation of investigation outcome within the 2012-22 LTP.
Budgets will be requested pending investigation outcomes.
b. Investigate feasibility of green waste collection
Improving efficiency
c. Investigate feasibility of composting of nappies
Reducing harm
d. Investigate feasibility of beneficial reuse of sewage sludge
Reducing harm
2. Increase commercial waste recycling
Section 11.1 Recycling a. Investigate feasibility of improving/co-ordinated collection of commercial sector recycling in PN
Improving efficiency
2012/13 Provision made in operational budgets for investigation work. Anticipate that any Council involvement in this area will be self-funding.
3. Increase recycling collection areas to Longburn, Bunnythorpe and other rural areas where service sought by sufficient residents and is economically justified
Section 11.1 Recycling a. Investigate demand for extending
recycling collection service Improving efficiency
2012/13 If demand warrants the service then make provision in 2013/14 financial year.
September 2012 18 PNCC W MMP 2012
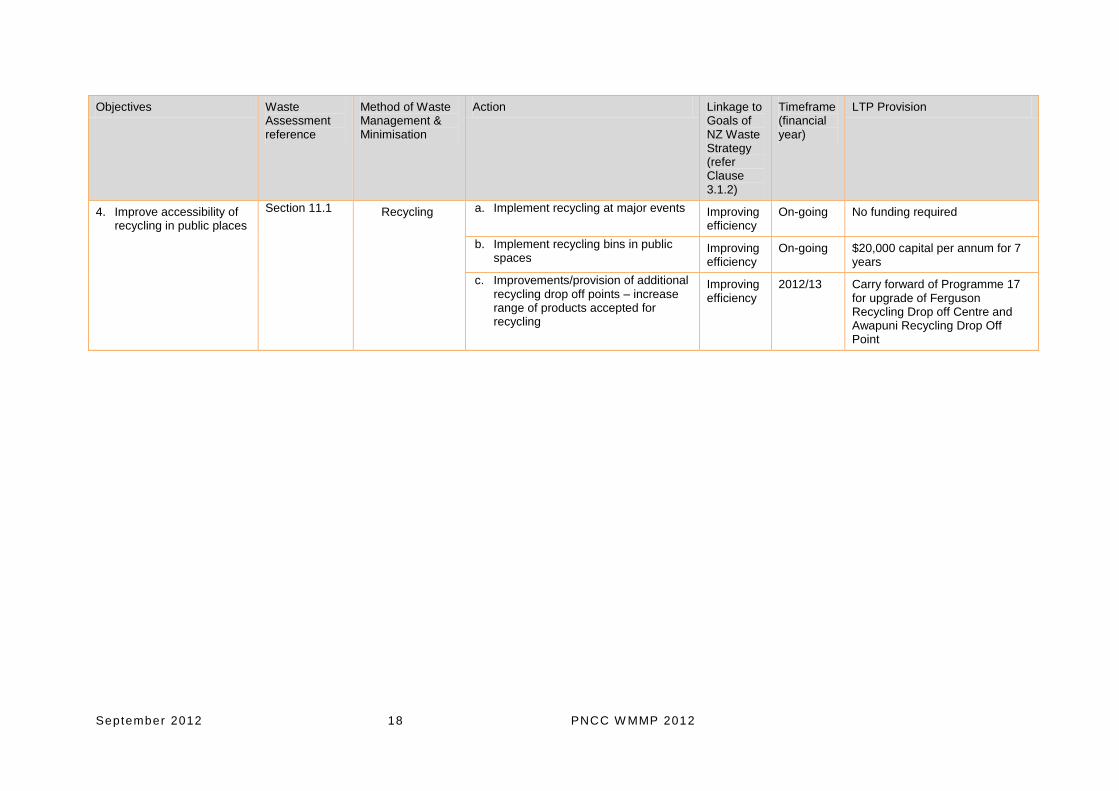
Objectives Waste Assessment reference
Method of Waste Management & Minimisation
Action Linkage to Goals of NZ Waste Strategy (refer Clause 3.1.2)
Timeframe (financial year)
LTP Provision
4. Improve accessibility of recycling in public places
Section 11.1 Recycling a. Implement recycling at major events Improving efficiency
On-going No funding required
b. Implement recycling bins in public spaces
Improving efficiency
On-going $20,000 capital per annum for 7 years
c. Improvements/provision of additional recycling drop off points – increase range of products accepted for recycling
Improving efficiency
2012/13 Carry forward of Programme 17 for upgrade of Ferguson Recycling Drop off Centre and Awapuni Recycling Drop Off Point
September 2012 19 PNCC W MMP 2012
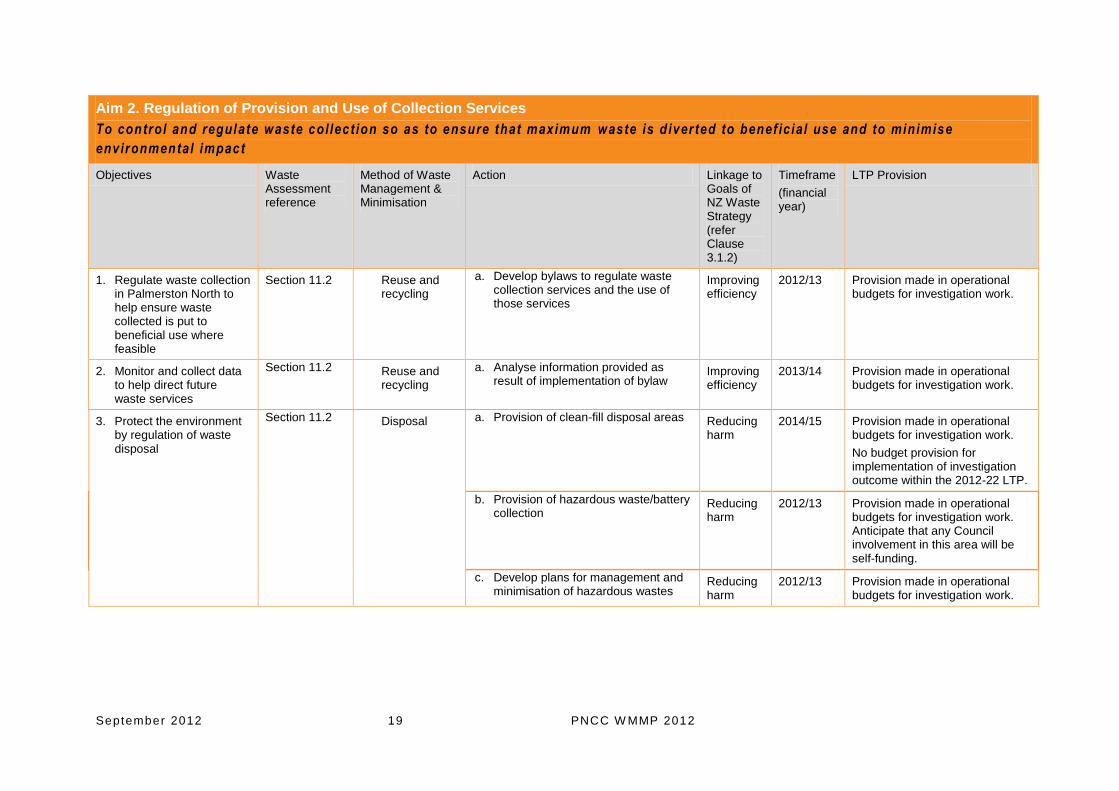
Aim 2. Regulation of Provision and Use of Collection Services
To control and regulate waste col lection so as to ensure that maximum waste is d iverted to benef icial use and to minimise
environmental impact
Objectives Waste Assessment reference
Method of Waste Management & Minimisation
Action Linkage to Goals of NZ Waste Strategy (refer Clause 3.1.2)
Timeframe
(financial year)
LTP Provision
1. Regulate waste collection in Palmerston North to help ensure waste collected is put to beneficial use where feasible
Section 11.2 Reuse and recycling
a. Develop bylaws to regulate waste collection services and the use of those services
Improving efficiency
2012/13 Provision made in operational budgets for investigation work.
2. Monitor and collect data to help direct future waste services
Section 11.2 Reuse and recycling
a. Analyse information provided as result of implementation of bylaw
Improving efficiency
2013/14 Provision made in operational budgets for investigation work.
3. Protect the environment by regulation of waste disposal
Section 11.2 Disposal a. Provision of clean-fill disposal areas Reducing harm
2014/15 Provision made in operational budgets for investigation work.
No budget provision for implementation of investigation outcome within the 2012-22 LTP.
b. Provision of hazardous waste/battery collection
Reducing harm
2012/13 Provision made in operational budgets for investigation work. Anticipate that any Council involvement in this area will be self-funding.
c. Develop plans for management and minimisation of hazardous wastes
Reducing harm
2012/13 Provision made in operational budgets for investigation work.
September 2012 20 PNCC W MMP 2012
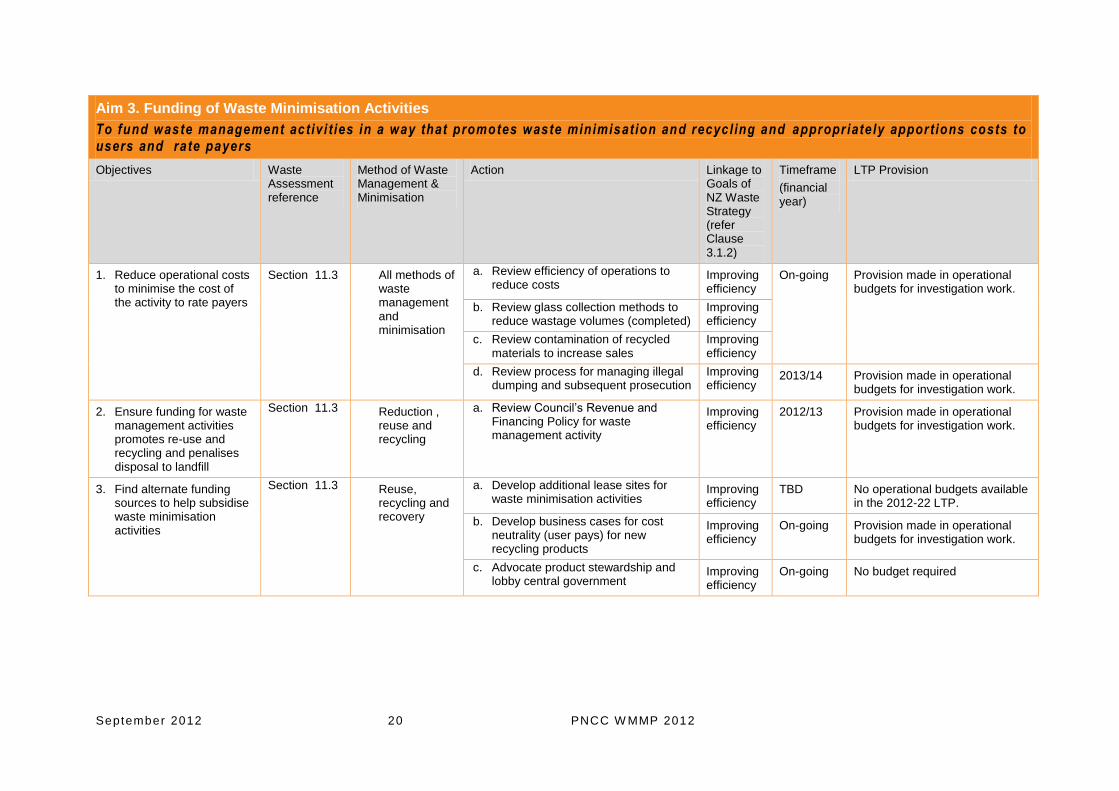
Aim 3. Funding of Waste Minimisation Activities
To fund waste management activi t ies in a way that promotes waste minimisation and recycl ing and appropriate ly apport ions costs to users and rate payers
Objectives Waste Assessment reference
Method of Waste Management & Minimisation
Action Linkage to Goals of NZ Waste Strategy (refer Clause 3.1.2)
Timeframe
(financial year)
LTP Provision
1. Reduce operational costs to minimise the cost of the activity to rate payers
Section 11.3 All methods of waste management and minimisation
a. Review efficiency of operations to reduce costs
Improving efficiency
On-going Provision made in operational budgets for investigation work.
b. Review glass collection methods to reduce wastage volumes (completed)
Improving efficiency
c. Review contamination of recycled materials to increase sales
Improving efficiency
d. Review process for managing illegal dumping and subsequent prosecution
Improving efficiency
2013/14 Provision made in operational budgets for investigation work.
2. Ensure funding for waste management activities promotes re-use and recycling and penalises disposal to landfill
Section 11.3 Reduction , reuse and recycling
a. Review Council’s Revenue and Financing Policy for waste management activity
Improving efficiency
2012/13 Provision made in operational budgets for investigation work.
3. Find alternate funding sources to help subsidise waste minimisation activities
Section 11.3 Reuse, recycling and recovery
a. Develop additional lease sites for waste minimisation activities
Improving efficiency
TBD No operational budgets available in the 2012-22 LTP.
b. Develop business cases for cost neutrality (user pays) for new recycling products
Improving efficiency
On-going Provision made in operational budgets for investigation work.
c. Advocate product stewardship and lobby central government
Improving efficiency
On-going No budget required
September 2012 21 PNCC W MMP 2012
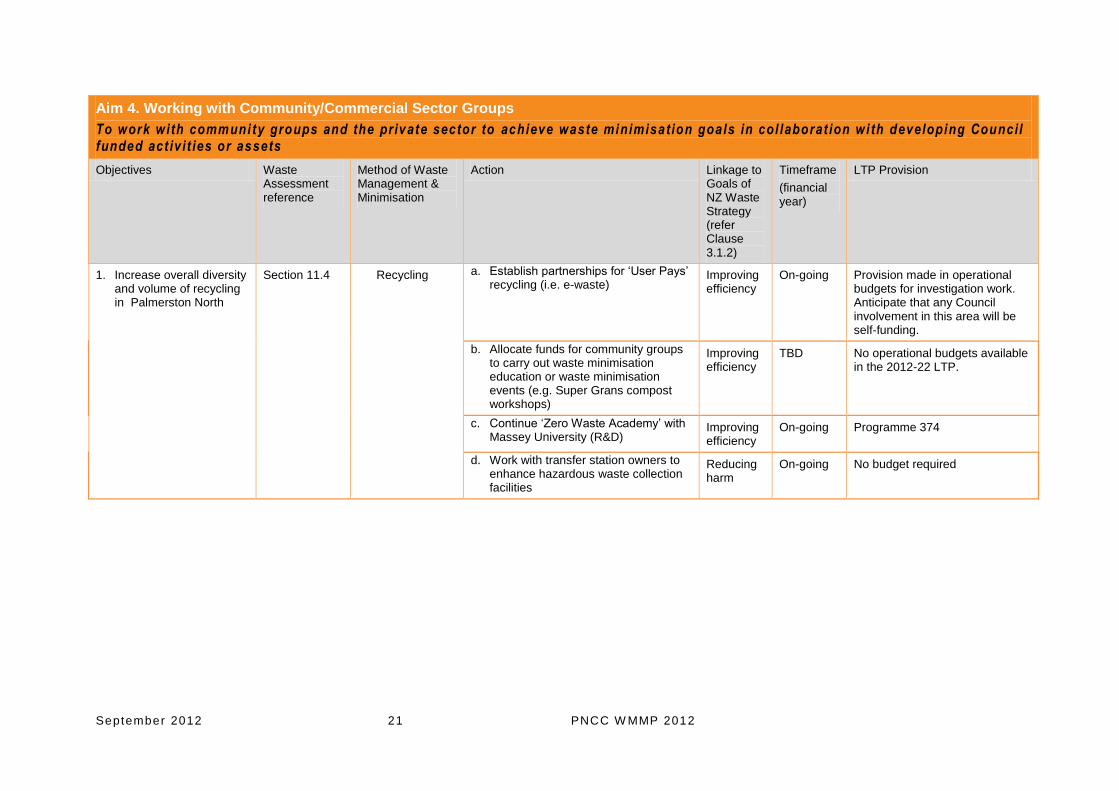
Aim 4. Working with Community/Commercial Sector Groups
To work with community groups and the private sector to achieve waste minimisation goals in col laborat ion wi th developing Council funded act ivit ies or assets
Objectives Waste Assessment reference
Method of Waste Management & Minimisation
Action Linkage to Goals of NZ Waste Strategy (refer Clause 3.1.2)
Timeframe
(financial year)
LTP Provision
1. Increase overall diversity and volume of recycling in Palmerston North
Section 11.4 Recycling a. Establish partnerships for ‘User Pays’ recycling (i.e. e-waste)
Improving efficiency
On-going Provision made in operational budgets for investigation work. Anticipate that any Council involvement in this area will be self-funding.
b. Allocate funds for community groups to carry out waste minimisation education or waste minimisation events (e.g. Super Grans compost workshops)
Improving efficiency
TBD No operational budgets available in the 2012-22 LTP.
c. Continue ‘Zero Waste Academy’ with Massey University (R&D)
Improving efficiency
On-going Programme 374
d. Work with transfer station owners to enhance hazardous waste collection facilities
Reducing harm
On-going No budget required
September 2012 22 PNCC W MMP 2012
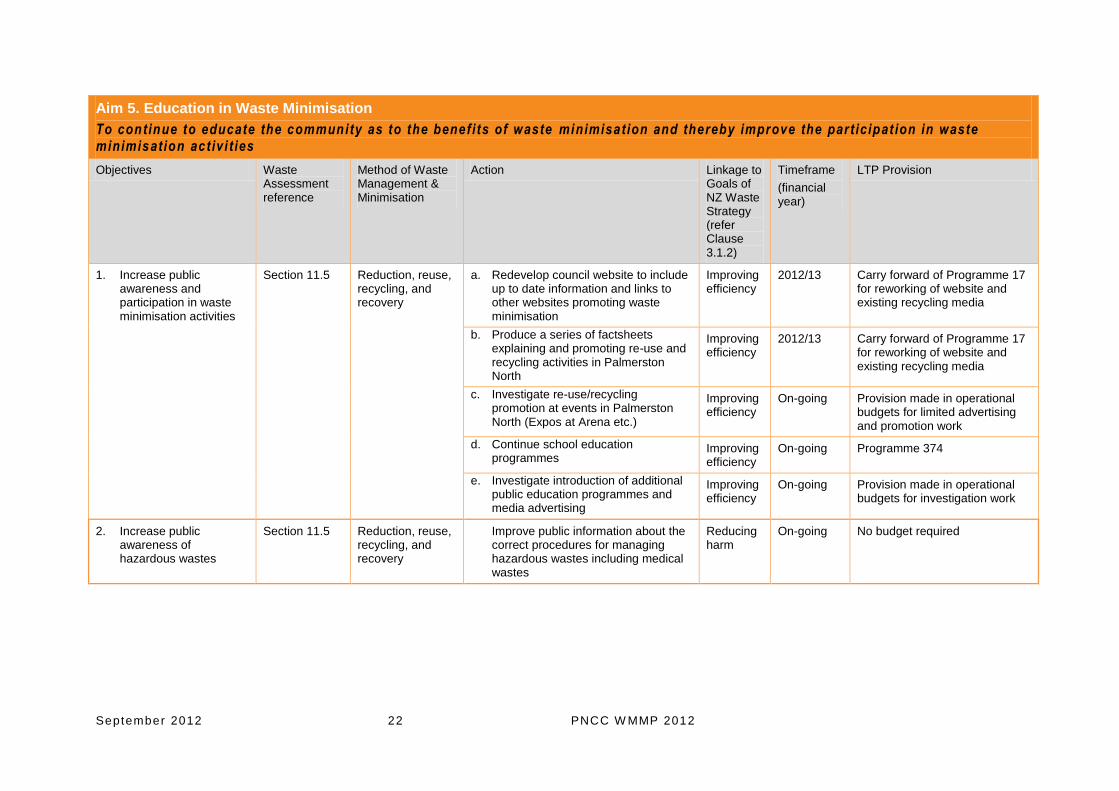
Aim 5. Education in Waste Minimisation
To continue to educate the community as to the benefi ts of waste minimisation and thereby improve the part icipat ion in waste minimisation activi t ies
Objectives Waste Assessment reference
Method of Waste Management & Minimisation
Action Linkage to Goals of NZ Waste Strategy (refer Clause 3.1.2)
Timeframe
(financial year)
LTP Provision
1. Increase public awareness and participation in waste minimisation activities
Section 11.5 Reduction, reuse, recycling, and recovery
a. Redevelop council website to include up to date information and links to other websites promoting waste minimisation
Improving efficiency
2012/13 Carry forward of Programme 17 for reworking of website and existing recycling media
b. Produce a series of factsheets explaining and promoting re-use and recycling activities in Palmerston North
Improving efficiency
2012/13 Carry forward of Programme 17 for reworking of website and existing recycling media
c. Investigate re-use/recycling promotion at events in Palmerston North (Expos at Arena etc.)
Improving efficiency
On-going Provision made in operational budgets for limited advertising and promotion work
d. Continue school education programmes
Improving efficiency
On-going Programme 374
e. Investigate introduction of additional public education programmes and media advertising
Improving efficiency
On-going Provision made in operational budgets for investigation work
2. Increase public awareness of hazardous wastes
Section 11.5 Reduction, reuse, recycling, and recovery
Improve public information about the correct procedures for managing hazardous wastes including medical wastes
Reducing harm
On-going No budget required
September 2012 23 PNCC W MMP 2012
6 Funding the Plan
6.1 How Rubbish and Recycling Activi ties in the City are Funded
Rubbish and recycling activities in the City are funded in a number of ways.
6.1.1 Rubbish Col lection and Disposal
Council rubbish bag collection is funded through the sale of rubbish bags. In theory the
revenue from bag sales should fund the kerbside collection, transport and disposal of
rubbish. In recent years there has been a shortfall in bag sales revenue compared to
operational costs and the bag price has been increased to try and make this activity self-
funding. Residents using private sector rubbish collection services are charged directly for
the service by their provider.
Council owned Transfer Stations are funded by the gate fee charged to residents for the
materials dropped off. A similar system operates for non-Council owned transfer stations and
rubbish drop off points with a gate fee charged to cover the cost of processing and disposal.
6.1.2 Recycl ing Col lect ion and Processing
The recycling wheelie bin service is funded by a targeted rate, whereby each residential
property able to receive the service pays the same rate. Most residential and some
commercial properties are rated for the collection service. The targeted rate covers the cost
of the recycling collection service, operation of the recycling processing facility and the cost
of operating the Ferguson Street Recycling Centre. Rates are offset by any revenue
resulting from the sale of recyclable materials such as glass, plastics and metals. Council
also generates a small amount of revenue from processing recycling materials collected
from commercial operators.
Any extension to recycling collected areas would be funded by the targeted rate.
6.1.3 Composting Operat ions
Composting operations are partly funded by the fee charged to residents at the gate for the
green waste dropped off and partly funded by the targeted rate for recycling. There are also
several commercial operators who pay a fee to dispose of organic waste at the composting
site.
6.1.4 Other revenues
Council generates a small amount of revenue from the lease of commercial sites at the
Awapuni Closed Landfill site.
6.2 Waste Minimisation Levy Funding
Council receives approximately $220,000 plus GST a year in waste levy funding. This levy
amount is forecast to decrease slightly in future years as the volume of waste to landfill
decreases. The funding is primarily used for education programmes (approximately
$155,000 per year) with the remainder being used for smaller projects such as introduction
of recycling bins in public places. In summary, waste minimisation projects to be funded from
the levy include:
Waste minimisation education material
September 2012 24 PNCC W MMP 2012
Waste minimisation advertising and promotion
Provision of recycling bins in public areas (parks, event venues etc.)
Refurbishment of recycling drop-off points
Community based recycling initiatives
Investigations of waste minimisation proposals
Research and development activities in partnership with the Zero Waste Academy
6.3 Direct Funding of Ini t iatives in the 2012 WMMP
The majority of the initiatives proposed in the 2012 plan are of an investigative nature. These
investigations will either be carried out within Council and are thereby funded as general
Council labour costs or will be carried out by external consultants. Specific operational
budgets have been set in the 2012-22 Long Term Plan for completion of such consultant
studies.
There is an on-going operational programme for education programmes identified in the
Long Term Plan as well as a programme for renewals works for the recycling processing
facility and the wheelie bins.
There are few new works planned in the rubbish and recycling area for the next three years
as the preliminary preparation of the 2012 WMMP did not identify specific areas that were
ready for capital investment. It is likely that completion of the investigations identified in this
plan will result in the identification of new capital works for consideration in subsequent
Annual Plans or the 2015-25 Long Term Plan.
6.4 Indirect Funding of Initiat ives in the 2012 WMMP
It is the Council’s intention that, until such a time that product stewardship necessitates the
take back of consumer goods by the manufacturer, the expansion of recycling activities or
other waste minimisation activities within the City will, on the whole, be a cost neutral
exercise for Council.
The most effective way for Council to achieve this is to work with the private sector so that
they can bear the risk associated with capital investment and the changing recycling
commodities market.
Similarly, effort will be directed to ensure that for any Council initiated scheme a full business
case is carried out. This will enable establishment of an appropriate charging mechanism in
cases where the revenue from sales of the recycled product does not cover the cost of
collection and recycling.
7 Monitoring and Progress Reporting
By the time the next review of the WMMP is due the target of diverting 75% of waste to
beneficial use by 2015 will need to have been realised. The City is currently a long way from
this target with 59% of waste diverted to beneficial use. Monitoring of progress on the
initiatives outlined in this plan will be essential in order to achieve this target.
September 2012 25 PNCC W MMP 2012
7.1 Monitoring
It is intended to monitor progress on the Action Plan on an annual basis. In addition, Council
will undertake a high level Waste Assessment in Year 2 of the WMMP cycle to monitor
progress against the overall waste minimisation target of 75% of waste to beneficial use by
2015. The results of this monitoring will be used to direct actions in the final year of the
WMMP in order to help achieve this target.
7.2 Reporting
Council will report on the Action Plan on an annual basis.
September 2012 26 PNCC W MMP 2012
External Organisations Involved in Recycling & Waste Appendix A.
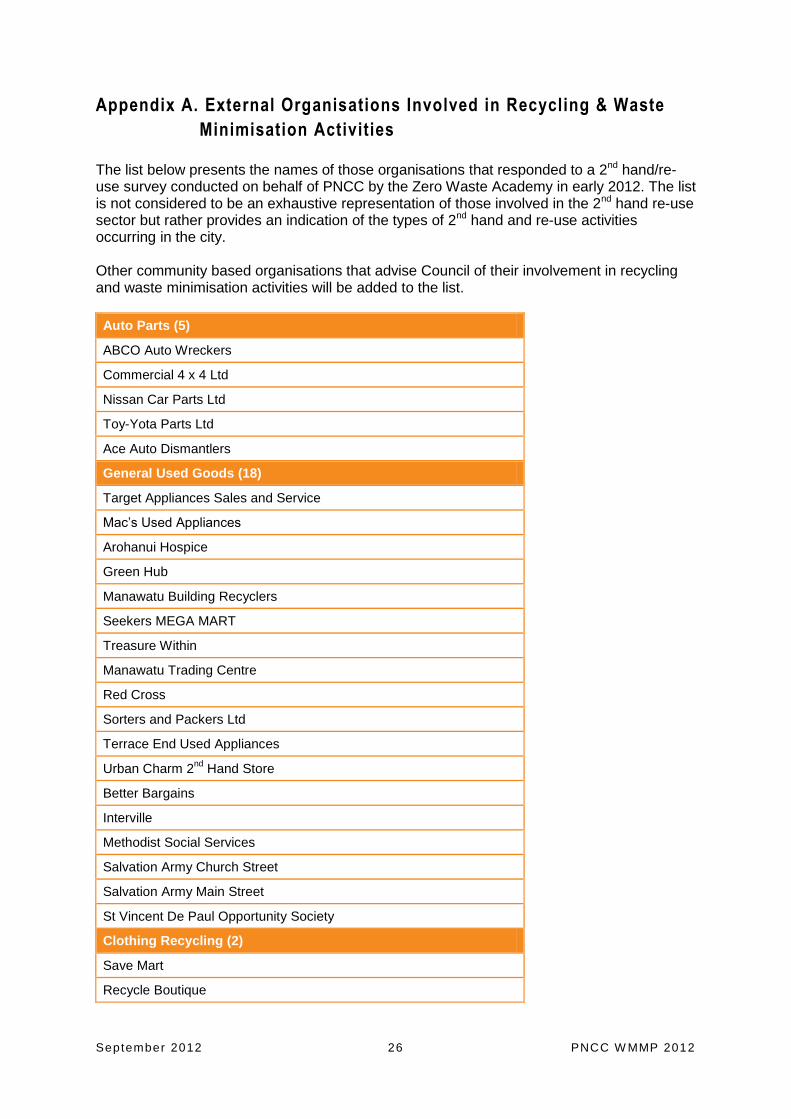
Minimisation Activities The list below presents the names of those organisations that responded to a 2nd hand/re-use survey conducted on behalf of PNCC by the Zero Waste Academy in early 2012. The list is not considered to be an exhaustive representation of those involved in the 2nd hand re-use sector but rather provides an indication of the types of 2nd hand and re-use activities occurring in the city. Other community based organisations that advise Council of their involvement in recycling and waste minimisation activities will be added to the list.
Auto Parts (5)
ABCO Auto Wreckers
Commercial 4 x 4 Ltd
Nissan Car Parts Ltd
Toy-Yota Parts Ltd
Ace Auto Dismantlers
General Used Goods (18)
Target Appliances Sales and Service
Mac’s Used Appliances
Arohanui Hospice
Green Hub
Manawatu Building Recyclers
Seekers MEGA MART
Treasure Within
Manawatu Trading Centre
Red Cross
Sorters and Packers Ltd
Terrace End Used Appliances
Urban Charm 2nd
Hand Store
Better Bargains
Interville
Methodist Social Services
Salvation Army Church Street
Salvation Army Main Street
St Vincent De Paul Opportunity Society
Clothing Recycling (2)
Save Mart
Recycle Boutique
September 2012 27 PNCC W MMP 2012
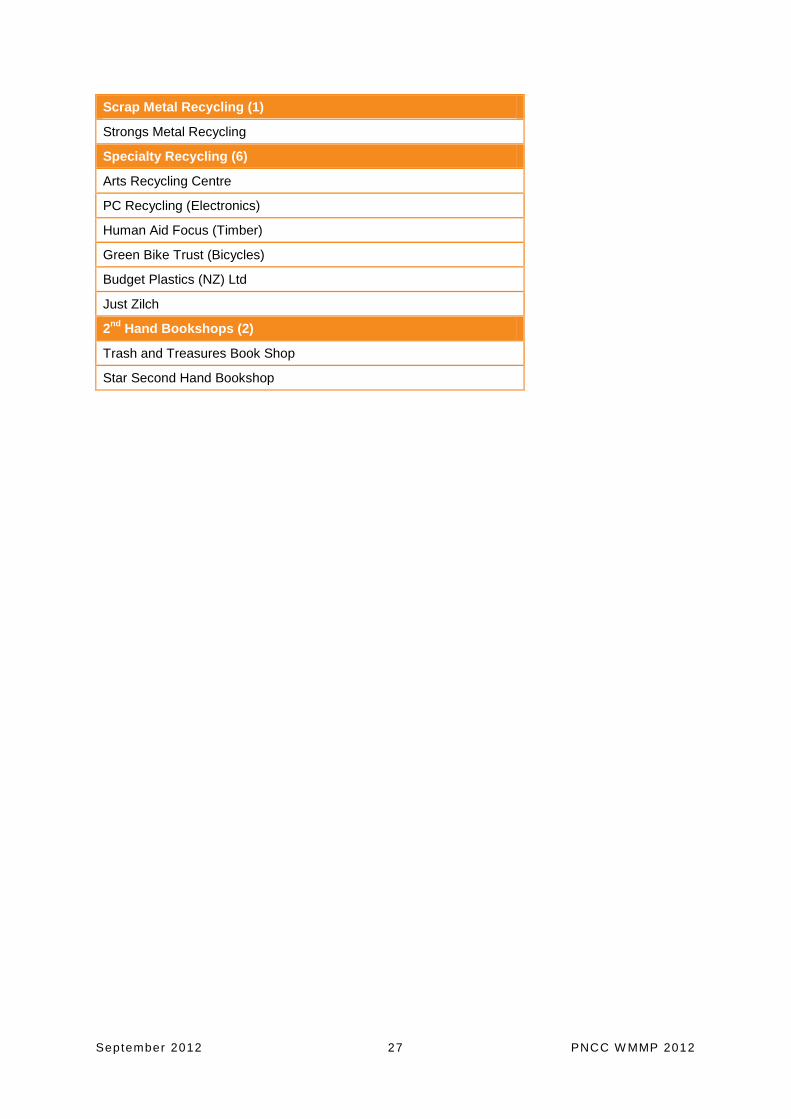
Scrap Metal Recycling (1)
Strongs Metal Recycling
Specialty Recycling (6)
Arts Recycling Centre
PC Recycling (Electronics)
Human Aid Focus (Timber)
Green Bike Trust (Bicycles)
Budget Plastics (NZ) Ltd
Just Zilch
2nd
Hand Bookshops (2)
Trash and Treasures Book Shop
Star Second Hand Bookshop
September 2012 28 PNCC W MMP 2012
Waste Assessment - Executive Summary Appendix B.(Prepared by Eunomia Research and Consulting Ltd and Waste Not
Consulting Ltd)
Waste Assessment Executive Summary
Waste Assessment for
Waste Management and Minimisation
Plan Review
Executive Summary
Prepared for Palmerston North City
Council
FINAL
6/08/2012
Waste Assessment Executive Summary i
Prepared for:
Louise Jones
Greg Boyle
Palmerston North City Council
Prepared by:
Duncan Wilson (Eunomia Research & Consulting Ltd)
Lisa Eve (Eunomia Research & Consulting Ltd)
Sunshine Yates (Waste Not Consulting Ltd)
Bruce Middleton (Waste Not Consulting Ltd)
Approved by:
Duncan Wilson
(Project Director)
Contact Details
Eunomia Research & Consulting Ltd
PO Box 78 313
Grey Lynn
Auckland 1245
New Zealand
Tel: +64 9 376 1909
Fax: +64 9 360 5187
Web: www.eunomia-consulting.co.nz
Waste Not Consulting Ltd
PO Box 78 372
Grey Lynn
Auckland 1245
New Zealand
Tel: +64 9 360 5188
Fax: +64 9 360 5187
Web: www.wastenot.co.nz
Waste Assessment Executive Summary ii
Contents of Executive Summary
E.1.0 Introduction .................................................................................................. 1
Purpose ................................................................................................................ 1 E.1.1
Scope ................................................................................................................... 1 E.1.2
E.2.0 Overview of Waste Management in the District ......................................... 2
Key Waste Flows .................................................................................................. 2 E.2.1
E.3.0 Waste Generation ......................................................................................... 3
Council control of overall waste stream ................................................................. 6 E.3.1
Estimates of kerbside refuse ................................................................................. 6 E.3.2
Potential to Divert Waste ....................................................................................... 7 E.3.3
E.4.0 Services and Tools to Manage Waste ......................................................... 8
Collection Services ............................................................................................... 8 E.4.1
Drop-off and Transfer Stations ............................................................................ 10 E.4.2
Other Council Services ....................................................................................... 10 E.4.3
Solid Waste Related Bylaws ............................................................................... 10 E.4.4
Waste Education and Minimisation Programmes ................................................ 10 E.4.5
Assessment of Services ...................................................................................... 11 E.4.6
E.5.0 Waste Infrastructure .................................................................................. 12
E.5.1 Assessment of Waste and Recovery Infrastructure ............................................. 13
E.6.0 Future Demand & Gap Analysis ................................................................ 13
E.7.0 Statement of Options ................................................................................. 14
E.8.0 Statement of Council’s Intended Role ...................................................... 16
Statutory Obligations ........................................................................................... 16 E.8.1
Overall Strategic Direction and Role ................................................................... 16 E.8.2
E.9.0 Statements of Proposal ............................................................................. 17
Aim 1. Diversion of Waste to Beneficial Use ....................................................... 17 E.9.1
Aim 2. Regulation of Collection Services ............................................................. 17 E.9.2
Aim 3. Funding of Waste Minimisation Activities ................................................. 17 E.9.3
Aim 4. Working with Community/Public Sector Groups ....................................... 17 E.9.4
Aim 5. Education in Waste Minimisation ............................................................. 17 E.9.5
E.10.0 Statement of Extent .................................................................................... 17
Protection of Public Health ............................................................................... 17 E.10.1
Effective and Efficient Waste Management and Minimisation .......................... 18 E.10.2
Waste Assessment Executive Summary iii
Table of Figures – Executive Summary
Figure 1: Schematic of Key Palmerston North Waste Flows.................................................. 3
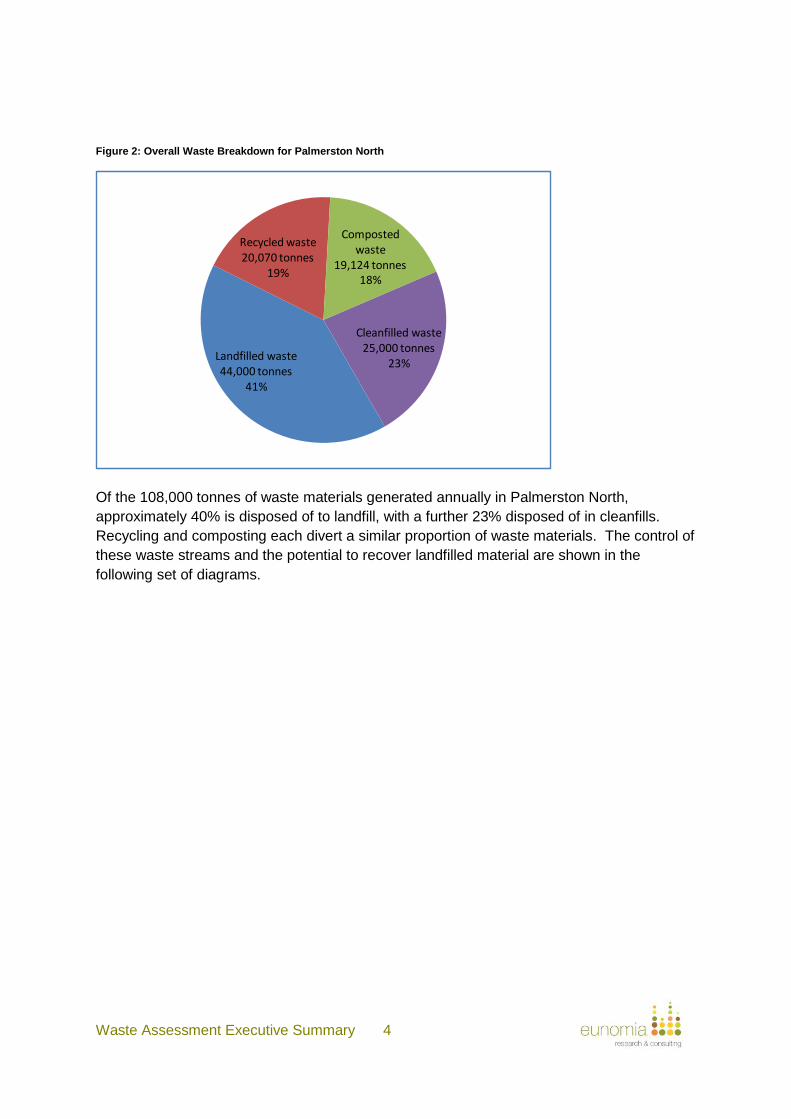
Figure 2: Overall Waste Breakdown for Palmerston North .................................................... 4
Figure 3: Palmerston North Waste Stream Control and Composition .................................... 5
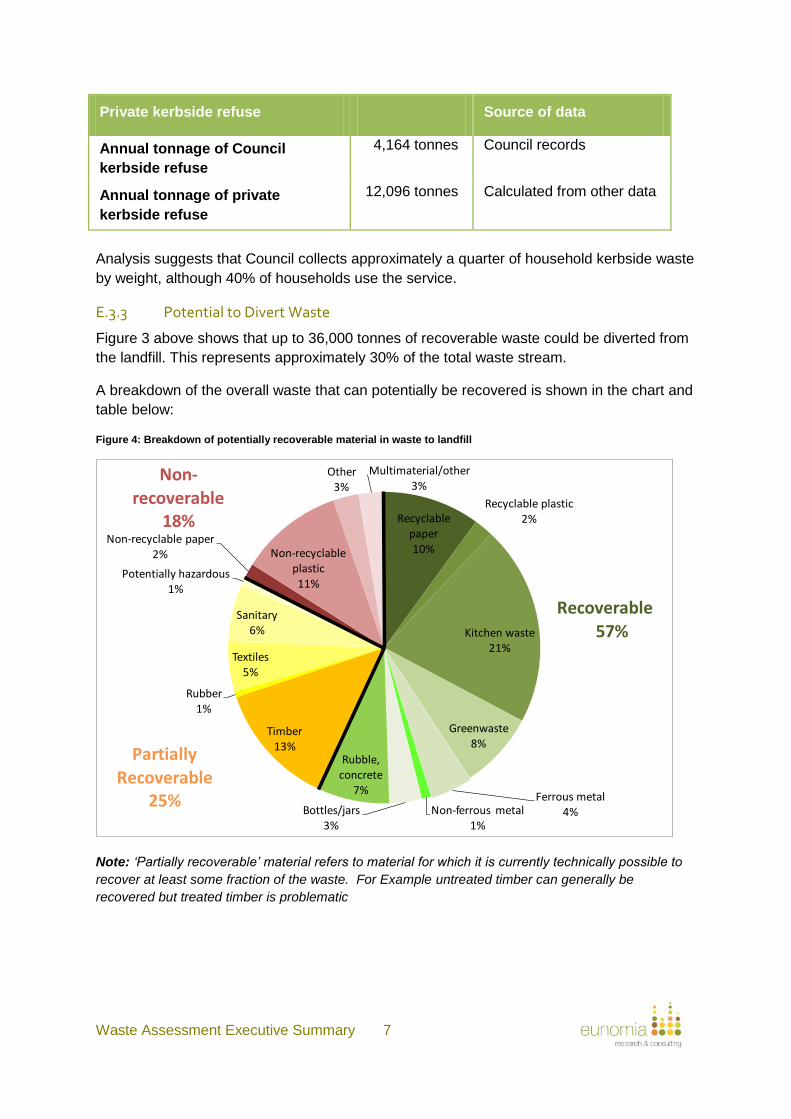
Figure 4: Breakdown of potentially recoverable material in waste to landfill .......................... 7
Figure 5: Projected Waste and Recovery Demand .............................................................. 13
Table of Tables – Executive Summary
Table 1: Overall Waste Flows from Palmerston North ........................................................... 3
Table 2: Council Control of Overall Waste Flows from Palmerston North .............................. 6
Table 3: Calculation of Privately-Collected Kerbside Refuse ................................................. 6
Table 4: Breakdown of potentially recoverable material in waste to landfill ............................ 8
Table 5: Collection Services .................................................................................................. 8
Table 6: Drop-off and Transfer Stations .............................................................................. 10
Table 7: Disposal Facilities ................................................................................................. 12
Table 8: Resource Recovery ............................................................................................... 12
Table 9: Summary Table of Potential Options ..................................................................... 15
Waste Assessment Executive Summary 1
Executive Summary
E.1.0 Introduction This is a summary of the Waste Assessment that has been prepared for the Palmerston
North City Council in accordance with the requirements of the Waste Minimisation Act 2008
(WMA). The Waste Assessment provides background information and data to support the
Palmerston North City Council’s waste management planning process.
Purpose E.1.1
The Waste Assessment is an initial step to the development of a waste management and
minimisation plan (WMMP), and sets out the information necessary to identify the key issues
and priority actions to be included in the draft WMMP.
Section 51 of the WMA outlines the requirements of a Waste Assessment, which must
include:
1. a description of the collection, recycling, recovery, treatment, and disposal services provided within the territorial authority’s district
2. a forecast of future demands
3. a statement of options
4. a statement of the territorial authority’s intended role in meeting demands
5. a statement of the territorial authority’s proposals for meeting the forecast demands
6. a statement about the extent to which the proposals will protect public health and promote effective and efficient waste management and minimisation
Scope E.1.2
The Waste Assessment covers all waste and material recovery activities within the district
whether provided by council or the private and community sectors.
This Waste Assessment, in general, takes a 10 year timeframe in terms of its planning
horizon. For some assets and services it is necessary to consider a longer timeframe and
this is taken into account where appropriate.
In line with Council’s previous waste management strategies, this assessment is focused on
solid waste. However, issues such as landfill gas, biosolids and some liquid hazardous
wastes are also noted where they relate directly to solid waste management.
In considering how public health issues should be addressed in the context of this Waste
Assessment, the view is taken that all options will present at least some level of public health
risk and that the key issue is how risks are managed. Public health issues should not
therefore drive strategic decisions but should be evaluated across all options, and issues
flagged where the level of risk is likely to require specific management controls or
interventions, or where the risks are so great as to override other considerations.
Waste Assessment Executive Summary 2
E.2.0 Overview of Waste Management in the District
Under the current Waste Management Plan (adopted in 2009) Palmerston North City has a
vision of Zero Waste. This Policy includes a target of diverting 75% of waste to landfill by
2015.
Palmerston North, located in the heart of the Manawatu, is a major service centre for the
surrounding rural areas, and its economy is based substantially on this and on research and
education related to the agricultural sector, and as a distribution hub to the central North
Island. Although there is manufacturing activity, the manufacturing base is relatively small
compared to national profiles and is projected to diminish in importance. Key waste streams
now and in the future therefore are related to agricultural processing, distribution, retail,
healthcare and administration type activities.
Waste services in the City, including refuse and recycling collection, transfer station and
drop off facilities and processing and disposal facilities are provided by a mix of private
sector, community and Council service providers. Detail on the waste services provided are
contained in sections E.4.0 and E.5.0
Key Waste Flows E.2.1
The key Palmerston North waste flows are represented in the chart below
Waste Assessment Executive Summary 3
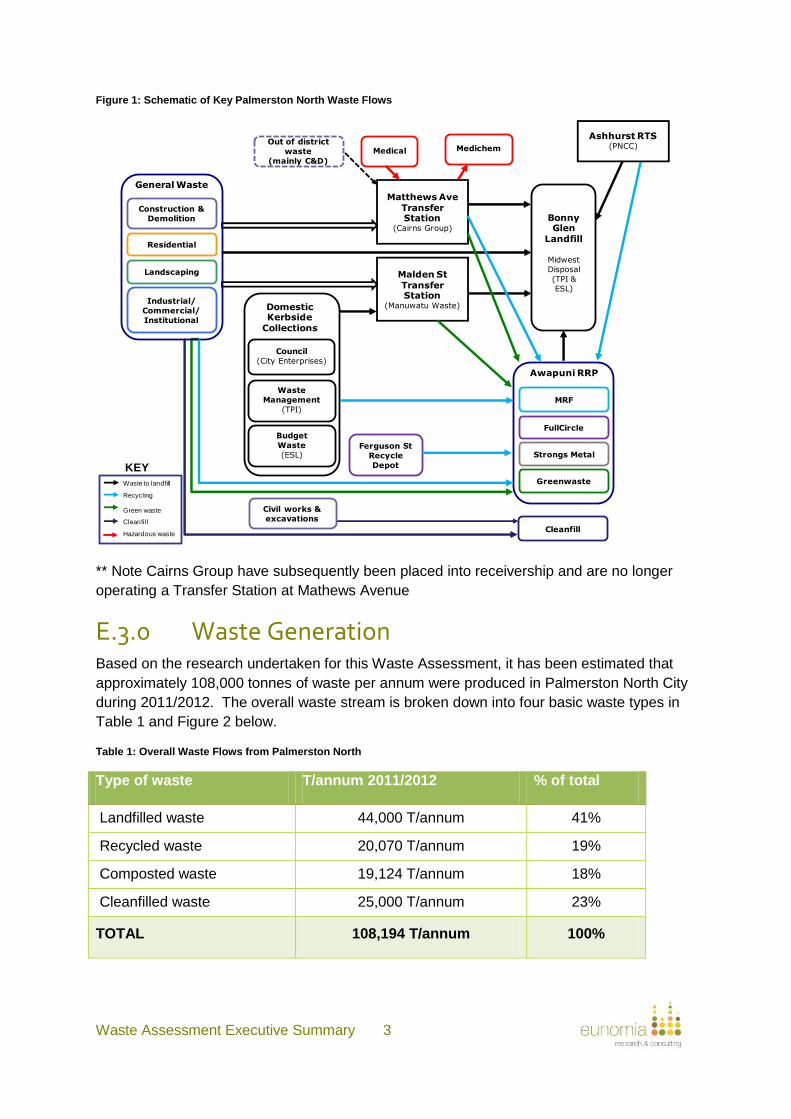
Figure 1: Schematic of Key Palmerston North Waste Flows
** Note Cairns Group have subsequently been placed into receivership and are no longer
operating a Transfer Station at Mathews Avenue
E.3.0 Waste Generation Based on the research undertaken for this Waste Assessment, it has been estimated that
approximately 108,000 tonnes of waste per annum were produced in Palmerston North City
during 2011/2012. The overall waste stream is broken down into four basic waste types in
Table 1 and Figure 2 below.
Table 1: Overall Waste Flows from Palmerston North
Type of waste T/annum 2011/2012 % of total
Landfilled waste 44,000 T/annum 41%
Recycled waste 20,070 T/annum 19%
Composted waste 19,124 T/annum 18%
Cleanfilled waste 25,000 T/annum 23%
TOTAL 108,194 T/annum 100%
Bonny Glen
Landfill
Midwest
Disposal
(TPI &
ESL)
Matthews Ave Transfer Station
(Cairns Group)
Malden St Transfer Station
(Manuwatu Waste)
Budget
Waste
(ESL)
Waste
Management
(TPI)
Council
(City Enterprises)
Domestic Kerbside
Collections
Ferguson St
Recycle
Depot
Medical Medichem
Ashhurst RTS(PNCC)
Out of district
waste
(mainly C&D)
Construction &
Demolition
Industrial/
Commercial/
Institutional
Landscaping
Residential
General Waste
MRF
Greenwaste
Strongs Metal
FullCircle
Awapuni RRP
Cleanfill
Waste to landfill
Recycling
Green waste
Cleanfill
Hazardous waste
Civil works &
excavations
KEY
Waste Assessment Executive Summary 4
Figure 2: Overall Waste Breakdown for Palmerston North
Of the 108,000 tonnes of waste materials generated annually in Palmerston North,
approximately 40% is disposed of to landfill, with a further 23% disposed of in cleanfills.
Recycling and composting each divert a similar proportion of waste materials. The control of
these waste streams and the potential to recover landfilled material are shown in the
following set of diagrams.
Landfilled waste44,000 tonnes
41%
Recycled waste 20,070 tonnes
19%
Composted waste
19,124 tonnes18%
Cleanfilled waste25,000 tonnes
23%
Waste Assessment Executive Summary 5
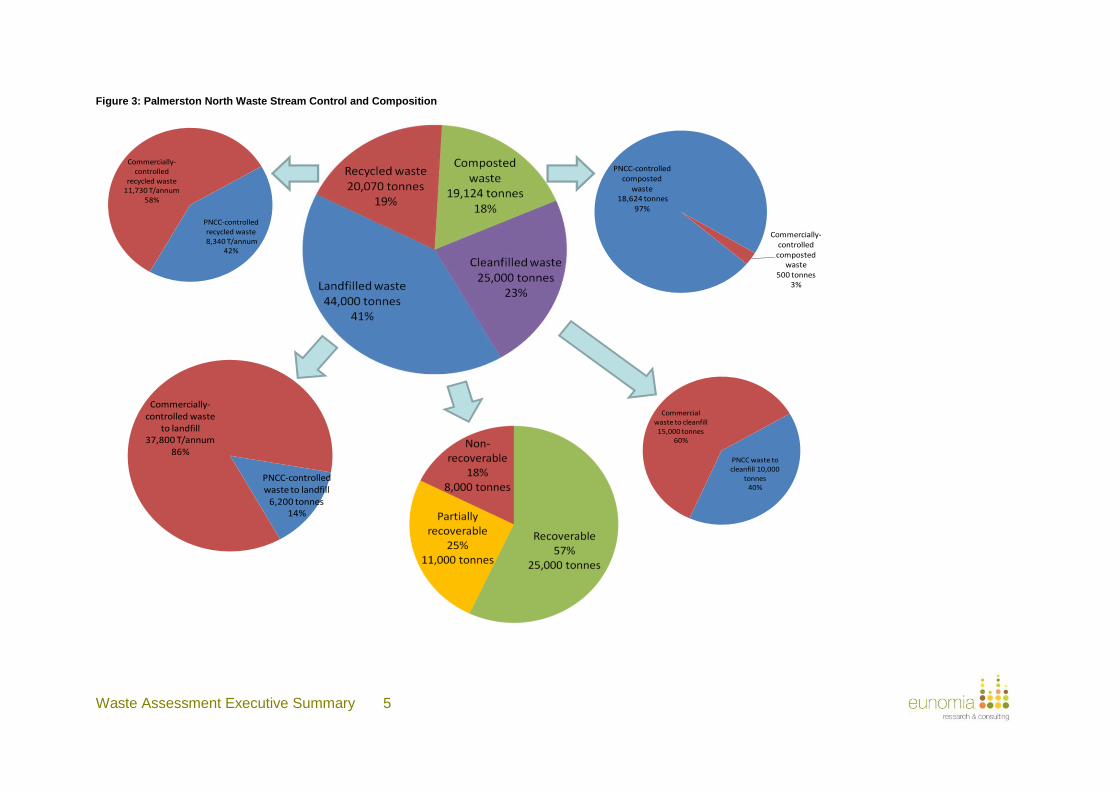
Figure 3: Palmerston North Waste Stream Control and Composition
PNCC-controlled waste to landfill
6,200 tonnes14%
Commercially-controlled waste
to landfill37,800 T/annum
86%PNCC waste to cleanfill 10,000
tonnes40%
Commercial waste to cleanfill15,000 tonnes
60%
PNCC-controlled recycled waste8,340 T/annum
42%
Commercially-controlled
recycled waste11,730 T/annum
58%
PNCC-controlled composted
waste18,624 tonnes
97%
Commercially-controlled composted
waste500 tonnes
3%
Waste Assessment Executive Summary 6
Council control of overall waste stream E.3.1
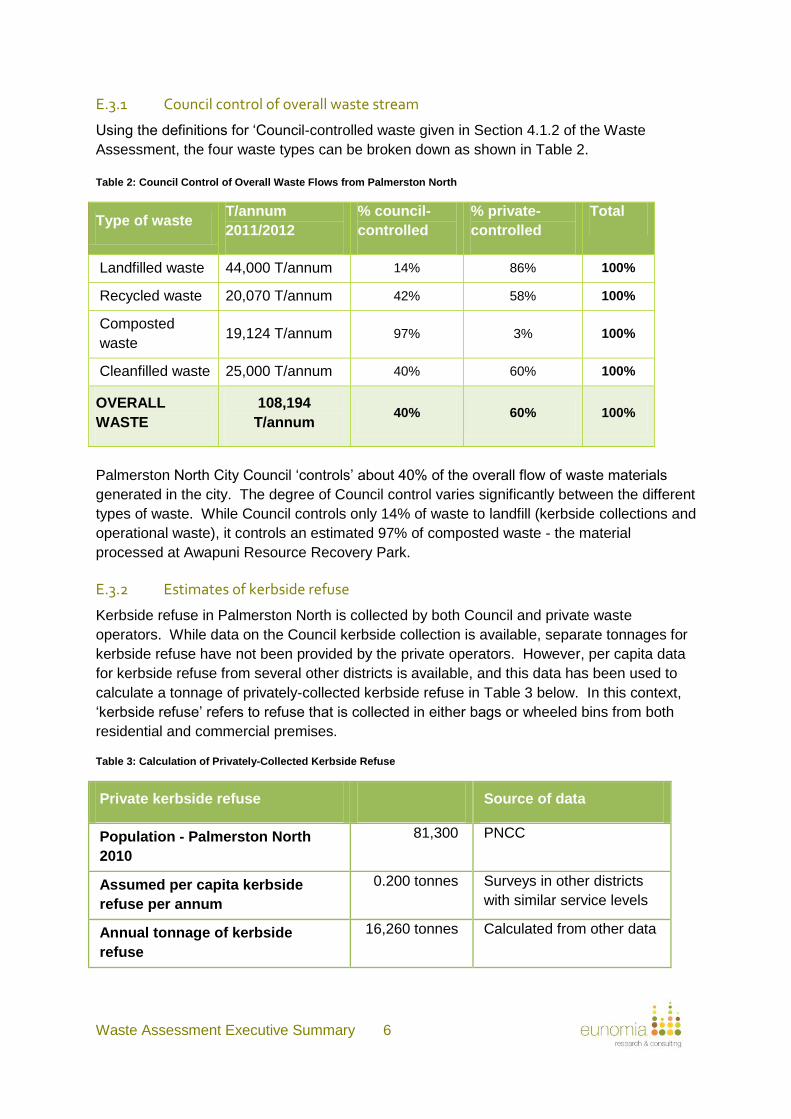
Using the definitions for ‘Council-controlled waste given in Section 4.1.2 of the Waste
Assessment, the four waste types can be broken down as shown in Table 2.
Table 2: Council Control of Overall Waste Flows from Palmerston North
Type of waste T/annum
2011/2012
% council-
controlled
% private-
controlled
Total
Landfilled waste 44,000 T/annum 14% 86% 100%
Recycled waste 20,070 T/annum 42% 58% 100%
Composted
waste 19,124 T/annum 97% 3% 100%
Cleanfilled waste 25,000 T/annum 40% 60% 100%
OVERALL
WASTE
108,194
T/annum 40% 60% 100%
Palmerston North City Council ‘controls’ about 40% of the overall flow of waste materials
generated in the city. The degree of Council control varies significantly between the different
types of waste. While Council controls only 14% of waste to landfill (kerbside collections and
operational waste), it controls an estimated 97% of composted waste - the material
processed at Awapuni Resource Recovery Park.
Estimates of kerbside refuse E.3.2
Kerbside refuse in Palmerston North is collected by both Council and private waste
operators. While data on the Council kerbside collection is available, separate tonnages for
kerbside refuse have not been provided by the private operators. However, per capita data
for kerbside refuse from several other districts is available, and this data has been used to
calculate a tonnage of privately-collected kerbside refuse in Table 3 below. In this context,
‘kerbside refuse’ refers to refuse that is collected in either bags or wheeled bins from both
residential and commercial premises.
Table 3: Calculation of Privately-Collected Kerbside Refuse
Private kerbside refuse Source of data
Population - Palmerston North
2010
81,300 PNCC
Assumed per capita kerbside
refuse per annum
0.200 tonnes Surveys in other districts
with similar service levels
Annual tonnage of kerbside
refuse
16,260 tonnes Calculated from other data
Waste Assessment Executive Summary 7
Private kerbside refuse Source of data
Annual tonnage of Council
kerbside refuse
4,164 tonnes Council records
Annual tonnage of private
kerbside refuse
12,096 tonnes Calculated from other data
Analysis suggests that Council collects approximately a quarter of household kerbside waste
by weight, although 40% of households use the service.
Potential to Divert Waste E.3.3
Figure 3 above shows that up to 36,000 tonnes of recoverable waste could be diverted from
the landfill. This represents approximately 30% of the total waste stream.
A breakdown of the overall waste that can potentially be recovered is shown in the chart and
table below:
Figure 4: Breakdown of potentially recoverable material in waste to landfill
Note: ‘Partially recoverable’ material refers to material for which it is currently technically possible to
recover at least some fraction of the waste. For Example untreated timber can generally be
recovered but treated timber is problematic
Recyclable paper10%
Recyclable plastic2%
Kitchen waste21%
Greenwaste8%
Ferrous metal4%Non-ferrous metal
1%Bottles/jars
3%
Rubble, concrete
7%
Timber13%
Rubber1%
Textiles5%
Sanitary6%
Potentially hazardous1%
Non-recyclable paper2% Non-recyclable
plastic11%
Other3%
Multimaterial/other3%
Recoverable57%
PartiallyRecoverable
25%
Non-
recoverable18%
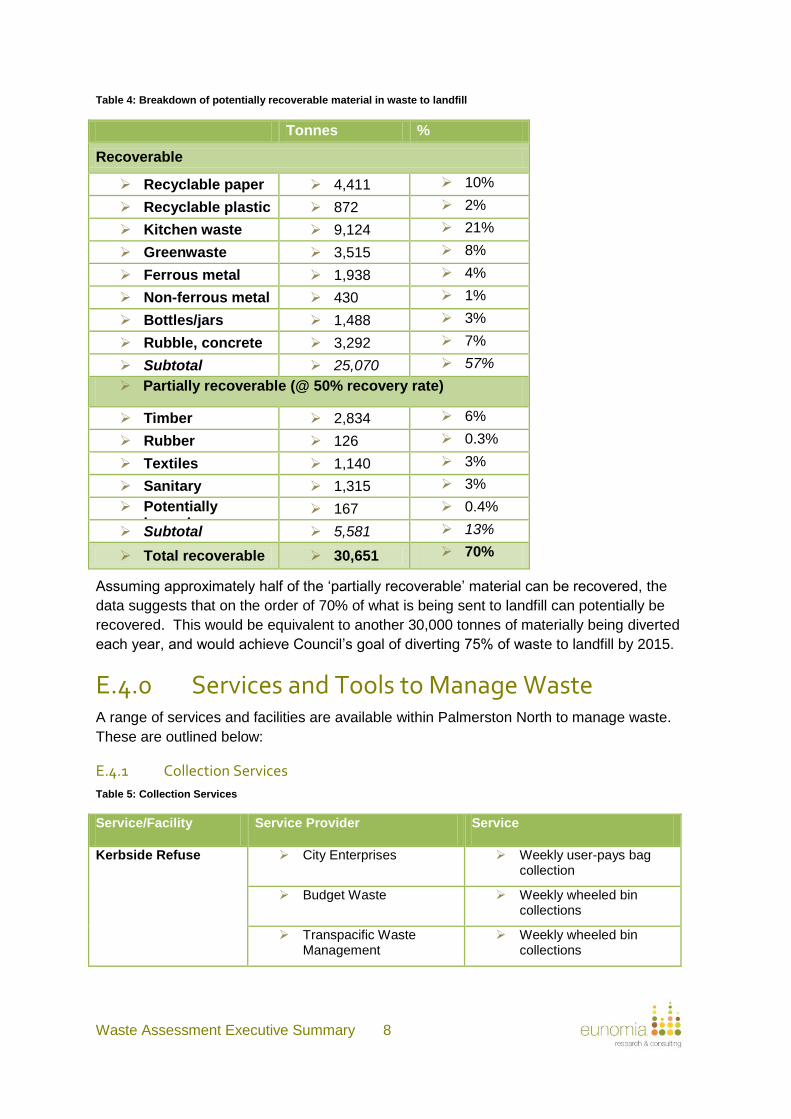
Waste Assessment Executive Summary 8
Table 4: Breakdown of potentially recoverable material in waste to landfill
Tonnes %
Recoverable
Recyclable paper 4,411 10%
Recyclable plastic 872 2%
Kitchen waste 9,124 21%
Greenwaste 3,515 8%
Ferrous metal 1,938 4%
Non-ferrous metal 430 1%
Bottles/jars 1,488 3%
Rubble, concrete 3,292 7%
Subtotal 25,070 57%
Partially recoverable (@ 50% recovery rate)
Timber 2,834 6%
Rubber 126 0.3%
Textiles 1,140 3%
Sanitary 1,315 3%
Potentially hazardous
167 0.4%
Subtotal 5,581 13%
Total recoverable 30,651 70%
Assuming approximately half of the ‘partially recoverable’ material can be recovered, the
data suggests that on the order of 70% of what is being sent to landfill can potentially be
recovered. This would be equivalent to another 30,000 tonnes of materially being diverted
each year, and would achieve Council’s goal of diverting 75% of waste to landfill by 2015.
E.4.0 Services and Tools to Manage Waste A range of services and facilities are available within Palmerston North to manage waste.
These are outlined below:
Collection Services E.4.1
Table 5: Collection Services
Service/Facility Service Provider Service
Kerbside Refuse City Enterprises Weekly user-pays bag collection
Budget Waste Weekly wheeled bin collections
Transpacific Waste Management
Weekly wheeled bin collections
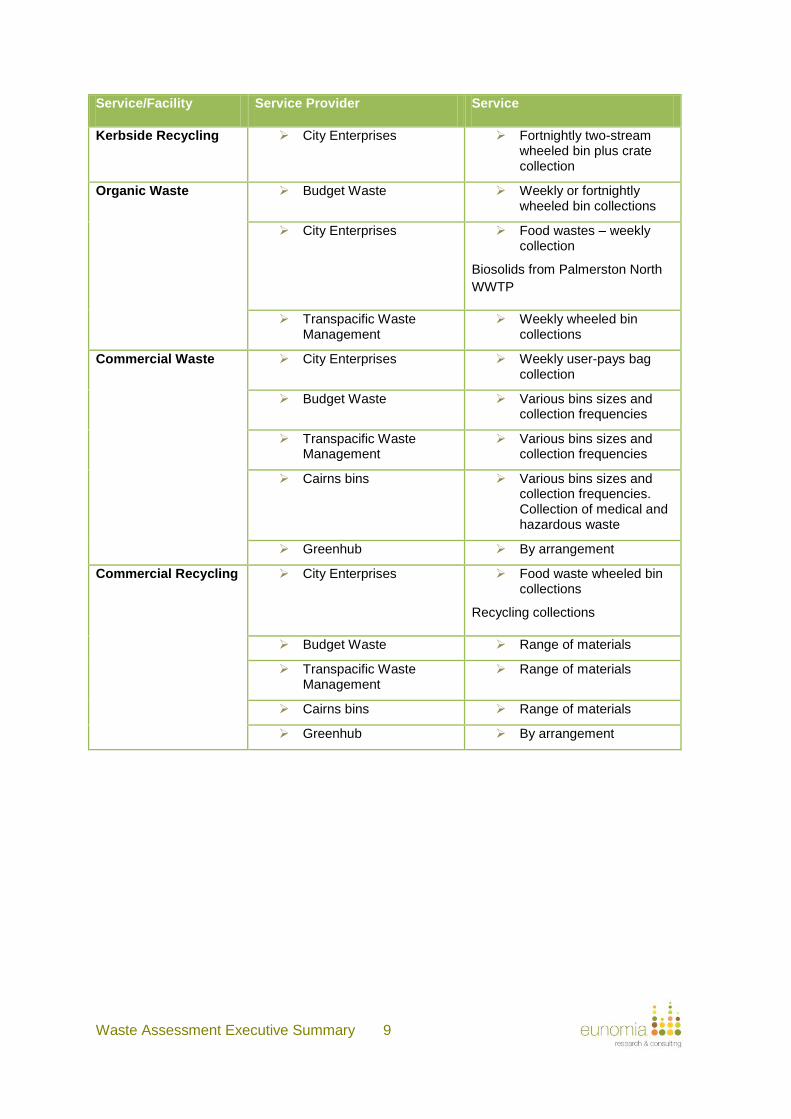
Waste Assessment Executive Summary 9
Service/Facility Service Provider Service
Kerbside Recycling City Enterprises Fortnightly two-stream wheeled bin plus crate collection
Organic Waste Budget Waste Weekly or fortnightly wheeled bin collections
City Enterprises Food wastes – weekly collection
Biosolids from Palmerston North
WWTP
Transpacific Waste Management
Weekly wheeled bin collections
Commercial Waste City Enterprises Weekly user-pays bag collection
Budget Waste Various bins sizes and collection frequencies
Transpacific Waste Management
Various bins sizes and collection frequencies
Cairns bins Various bins sizes and collection frequencies. Collection of medical and hazardous waste
Greenhub By arrangement
Commercial Recycling City Enterprises Food waste wheeled bin collections
Recycling collections
Budget Waste Range of materials
Transpacific Waste Management
Range of materials
Cairns bins Range of materials
Greenhub By arrangement
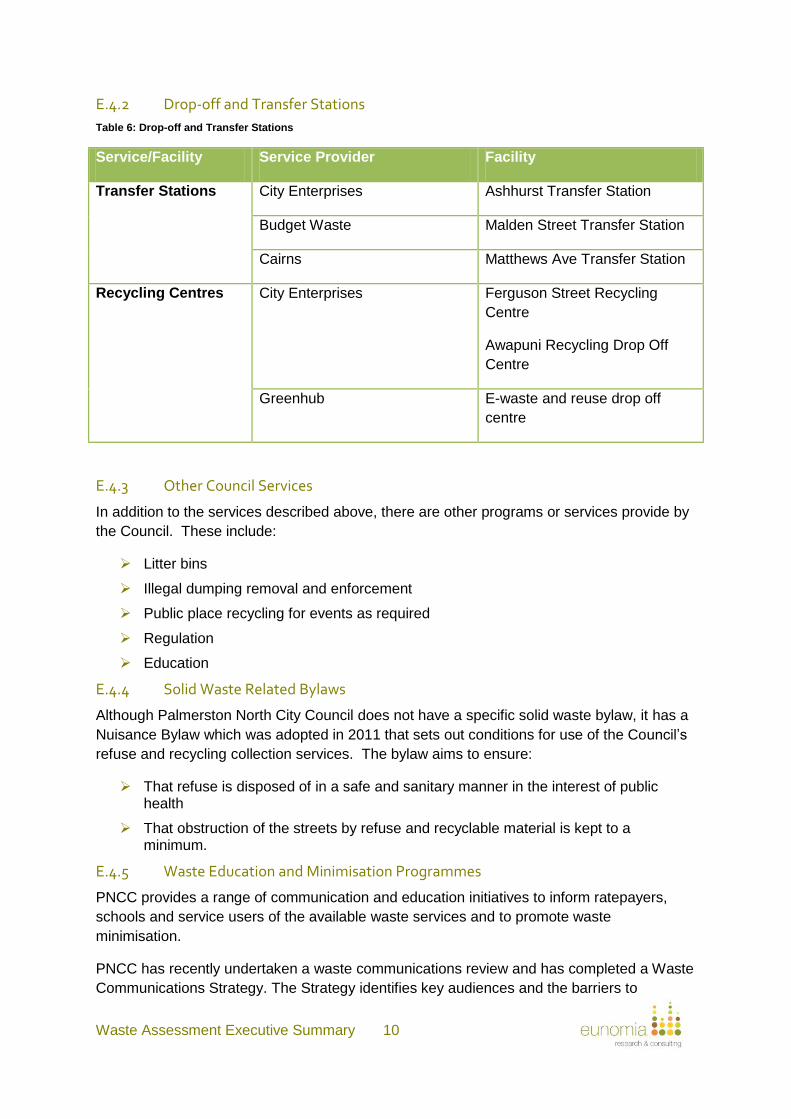
Waste Assessment Executive Summary 10
Drop-off and Transfer Stations E.4.2
Table 6: Drop-off and Transfer Stations
Service/Facility Service Provider Facility
Transfer Stations City Enterprises Ashhurst Transfer Station
Budget Waste Malden Street Transfer Station
Cairns Matthews Ave Transfer Station
Recycling Centres City Enterprises Ferguson Street Recycling
Centre
Awapuni Recycling Drop Off
Centre
Greenhub E-waste and reuse drop off
centre
Other Council Services E.4.3
In addition to the services described above, there are other programs or services provide by
the Council. These include:
Litter bins
Illegal dumping removal and enforcement
Public place recycling for events as required
Regulation
Education
Solid Waste Related Bylaws E.4.4
Although Palmerston North City Council does not have a specific solid waste bylaw, it has a
Nuisance Bylaw which was adopted in 2011 that sets out conditions for use of the Council’s
refuse and recycling collection services. The bylaw aims to ensure:
That refuse is disposed of in a safe and sanitary manner in the interest of public health
That obstruction of the streets by refuse and recyclable material is kept to a minimum.
Waste Education and Minimisation Programmes E.4.5
PNCC provides a range of communication and education initiatives to inform ratepayers,
schools and service users of the available waste services and to promote waste
minimisation.
PNCC has recently undertaken a waste communications review and has completed a Waste
Communications Strategy. The Strategy identifies key audiences and the barriers to
Waste Assessment Executive Summary 11
fostering desired waste minimisation behaviours. The Strategy proposes a coordinated
consistent approach to communications around waste services and waste minimisation.
Assessment of Services E.4.6
Key points from the assessment of services include the following:
An estimated 40% of all households use the Council refuse bag service but this accounts for 25% of the household kerbside refuse by weight. Approximately 60% of households use a private wheeled bin service but this accounts for 75% of the household collected waste.
Households with large wheeled bins discard more refuse, with a large proportion of this being greenwaste
Competition from private sector operators limits the Councils options for encouraging waste minimisation
There is no current audit data on the composition of household refuse bags and bins but extensive data from other authorities suggests the proportion of food waste is typically around 30-40%
Council’s two-stream kerbside recycling collection service appears to be popular and well utilised. Per capita recycling rates are equivalent to those in other cities with well-developed kerbside recycling systems.
Targeting organic waste is therefore likely to represent the biggest opportunity to reduce waste from kerbside refuse
There are a good range of commercial waste and recycling services available
There are likely to be opportunities for greater recovery of material from commercial sources
There is good provision of transfer station and drop off facilities
Waste recovery at the transfer stations varies significantly, with Cairns Group making significant effort to divert waste at its Matthews Ave, facility, while the Malden Street facility is focused on waste consolidation for transport to landfill
The proposed coordination of a consistent approach to communications around waste services and waste minimisation will enhance behaviour change outcomes. A key aspect that could be addressed in more depth is waste prevention.
The lack of a dedicated solid waste bylaw contributes to the general lack of data regarding waste flows in the district. It also means that Palmerston North City Council has no control over what happens with waste other than that collected by their City Enterprises and the influence of its kerbside recycling collection.
While facilities for handling of medical and hazardous and wastes exist there is room for a more comprehensive approach and provision of better information to the public regarding disposal and handling of hazardous materials.
With the increasing complexity of waste and resource recovery arrangements needed to progress towards zero waste and sustainability there will be a growing need for a diverse range of expertise. The private and community sectors are able to offer valuable skills in relation to waste management and minimisation. The roles that these sectors can play in helping the Council and community meet future challenges will need ongoing review,
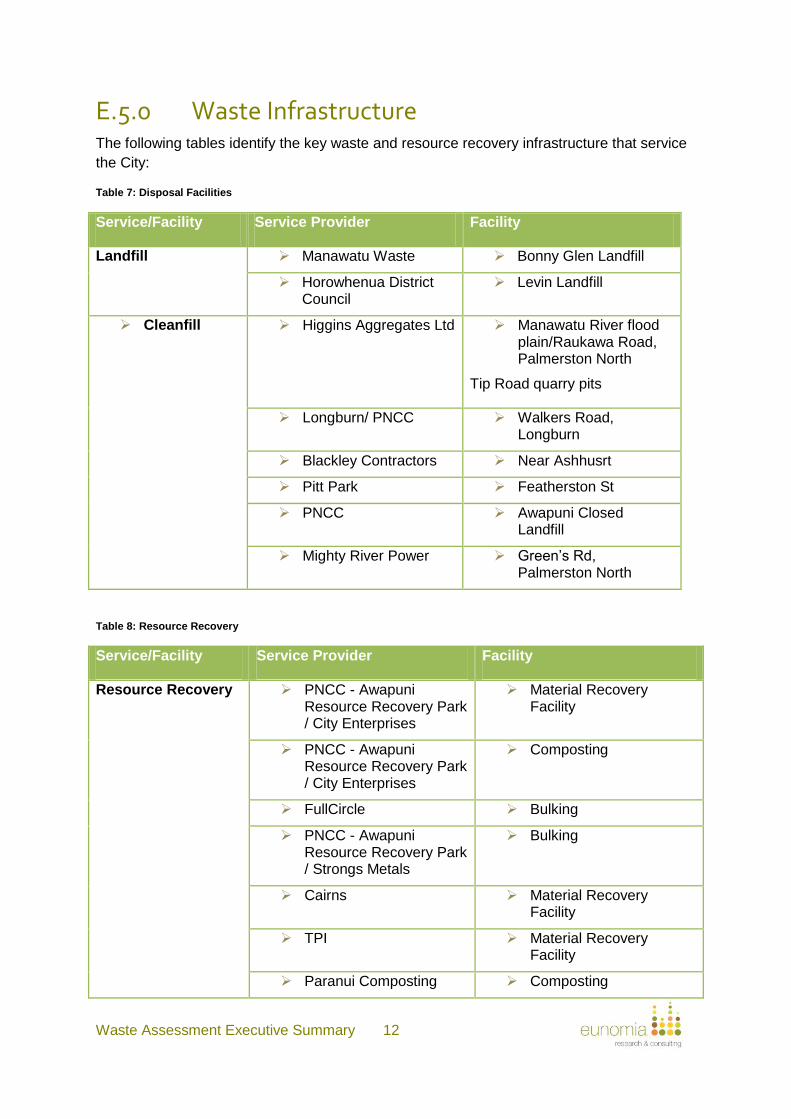
Waste Assessment Executive Summary 12
E.5.0 Waste Infrastructure The following tables identify the key waste and resource recovery infrastructure that service
the City:
Table 7: Disposal Facilities
Service/Facility Service Provider Facility
Landfill Manawatu Waste Bonny Glen Landfill
Horowhenua District Council
Levin Landfill
Cleanfill Higgins Aggregates Ltd Manawatu River flood plain/Raukawa Road, Palmerston North
Tip Road quarry pits
Longburn/ PNCC Walkers Road, Longburn
Blackley Contractors Near Ashhusrt
Pitt Park Featherston St
PNCC Awapuni Closed Landfill
Mighty River Power Green’s Rd, Palmerston North
Table 8: Resource Recovery
Service/Facility Service Provider Facility
Resource Recovery PNCC - Awapuni Resource Recovery Park / City Enterprises
Material Recovery Facility
PNCC - Awapuni Resource Recovery Park / City Enterprises
Composting
FullCircle Bulking
PNCC - Awapuni Resource Recovery Park / Strongs Metals
Bulking
Cairns Material Recovery Facility
TPI Material Recovery Facility
Paranui Composting Composting
Waste Assessment Executive Summary 13
E.5.1 Assessment of Waste and Recovery Infrastructure
Key points from the assessment of waste and recovery infrastructure include the following:
Bonny Glen landfill is the most significant disposal asset in the region and Palmerston North is effectively dependent on this for waste disposal. This can be mitigated to an extent through engagement in regional planning and collaboration between PNCC and Rangitikei District Council.
Bonny Glen is proposing to extend its capacity significantly to give a projected life of a further 50 years
Identifying alternative management options for construction and demolition waste and end-of-life tyres is an issue for the City.
The Awapuni RRP means that Palmerston North City has a good range of facilities to sort and process recovered materials.
While there is existing availability for most waste streams to be diverted, if a wider range of organic material, such as household food waste, is to be targeted, changes to the existing facilities and or management processes may be required.
The City is well served by transport routes enabling access to markets for recyclables.
E.6.0 Future Demand & Gap Analysis Total waste and recovered material quantities are estimated to grow slowly over the next 10-
20 years in line with household and economic growth. These projected rates are around 1-
1.2% per annum. For the purposes of projecting total waste quantities a figure of 1.2% per
annum has been used.
The most substantial change will come in the balance of how material is handled. If PNCC
is to meet a target of 75% diversion5, less material will need to flow to landfill and more to
recycling and organic waste processing activities. The figure below shows an estimate of
the change in tonnages that is likely to be required:
Figure 5: Projected Waste and Recovery Demand
5 For the purposes of this calculation we have excluded cleanfill material. Most cleanfill material is excavation
material (soil, gravel etc) and it is arguably not appropriate to count it either as diverted material or as disposal.
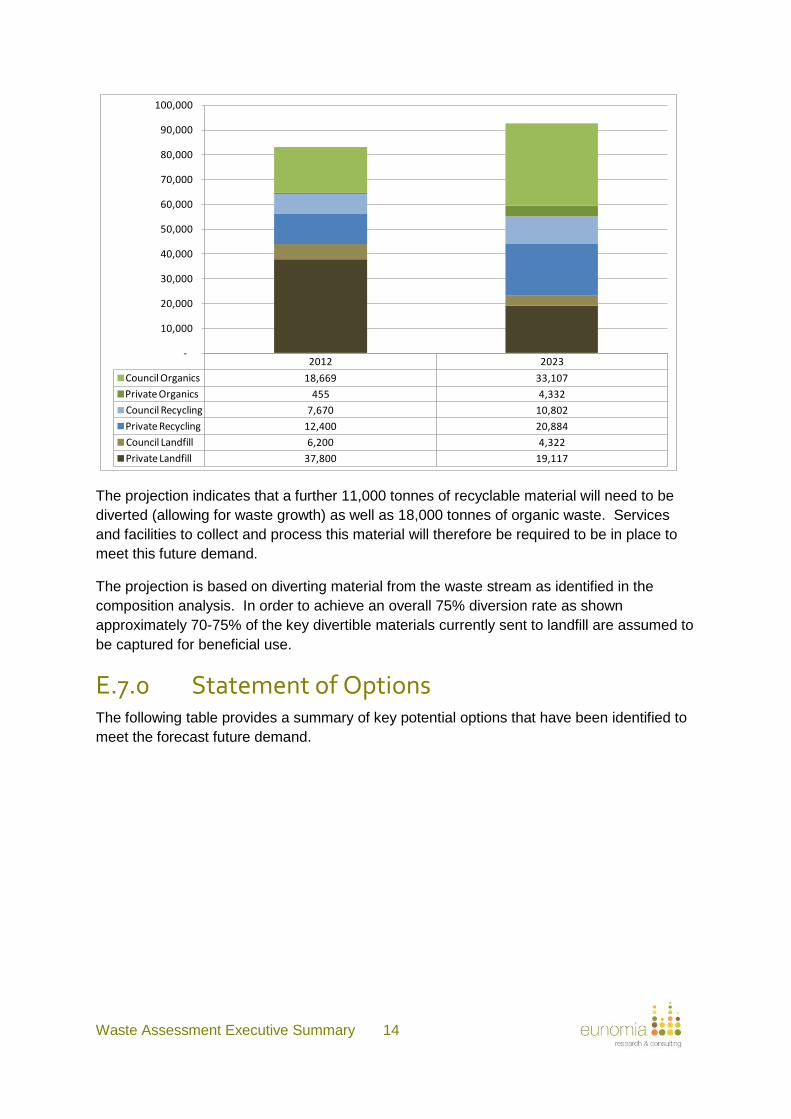
Waste Assessment Executive Summary 14
The projection indicates that a further 11,000 tonnes of recyclable material will need to be
diverted (allowing for waste growth) as well as 18,000 tonnes of organic waste. Services
and facilities to collect and process this material will therefore be required to be in place to
meet this future demand.
The projection is based on diverting material from the waste stream as identified in the
composition analysis. In order to achieve an overall 75% diversion rate as shown
approximately 70-75% of the key divertible materials currently sent to landfill are assumed to
be captured for beneficial use.
E.7.0 Statement of Options The following table provides a summary of key potential options that have been identified to
meet the forecast future demand.
2012 2023
Council Organics 18,669 33,107
Private Organics 455 4,332
Council Recycling 7,670 10,802
Private Recycling 12,400 20,884
Council Landfill 6,200 4,322
Private Landfill 37,800 19,117
-
10,000
20,000
30,000
40,000
50,000
60,000
70,000
80,000
90,000
100,000
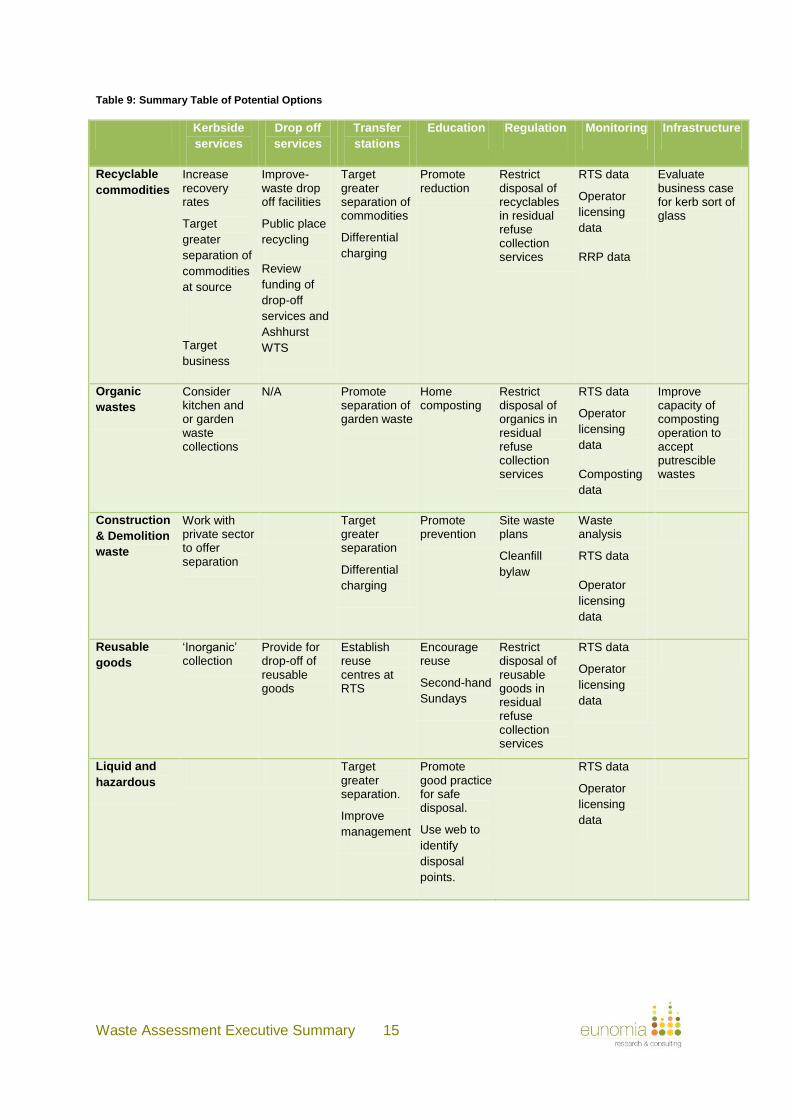
Waste Assessment Executive Summary 15
Table 9: Summary Table of Potential Options
Kerbside
services
Drop off
services
Transfer
stations
Education Regulation Monitoring Infrastructure
Recyclable
commodities
Increase recovery rates
Target
greater
separation of
commodities
at source
Target
business
Improve-waste drop off facilities
Public place
recycling
Review
funding of
drop-off
services and
Ashhurst
WTS
Target greater separation of commodities
Differential
charging
Promote reduction
Restrict disposal of recyclables in residual refuse collection services
RTS data
Operator
licensing
data
RRP data
Evaluate business case for kerb sort of glass
Organic
wastes
Consider kitchen and or garden waste collections
N/A Promote separation of garden waste
Home composting
Restrict disposal of organics in residual refuse collection services
RTS data
Operator
licensing
data
Composting
data
Improve capacity of composting operation to accept putrescible wastes
Construction
& Demolition
waste
Work with private sector to offer separation
Target greater separation
Differential
charging
Promote prevention
Site waste plans
Cleanfill
bylaw
Waste analysis
RTS data
Operator
licensing
data
Reusable
goods
‘Inorganic’ collection
Provide for drop-off of reusable goods
Establish reuse centres at RTS
Encourage reuse
Second-hand
Sundays
Restrict disposal of reusable goods in residual refuse collection services
RTS data
Operator
licensing
data
Liquid and
hazardous
Target greater separation.
Improve
management
Promote good practice for safe disposal.
Use web to
identify
disposal
points.
RTS data
Operator
licensing
data
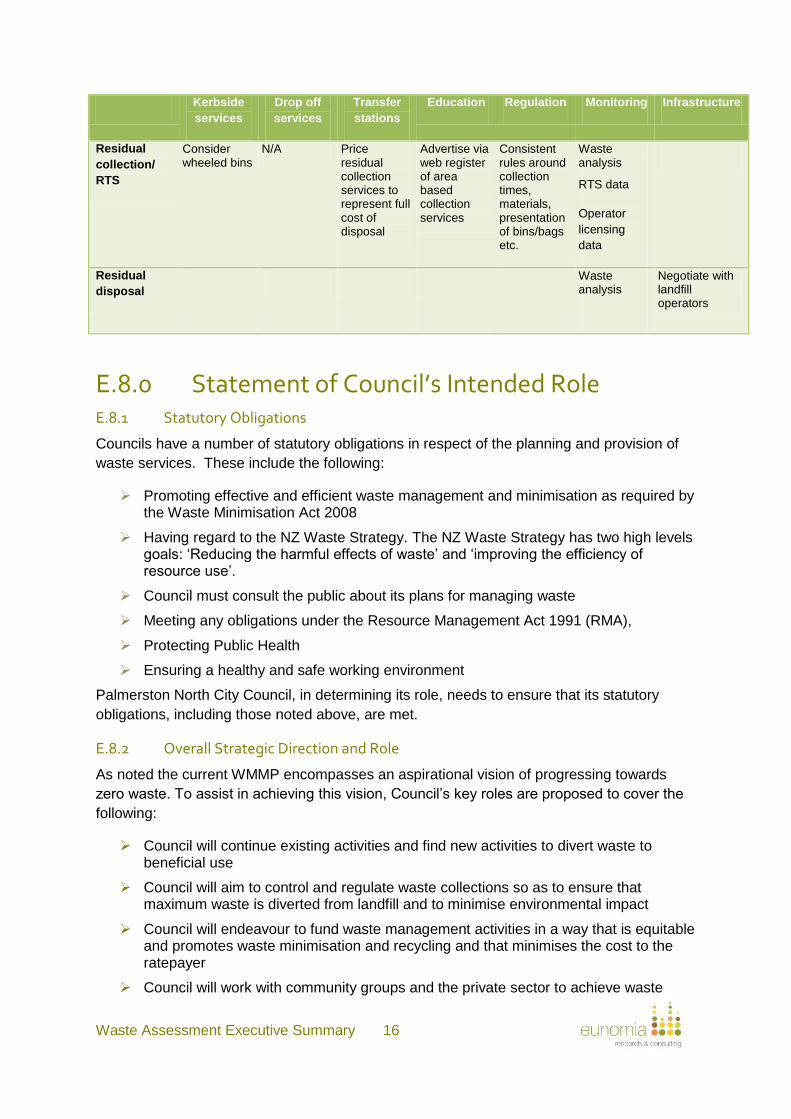
Waste Assessment Executive Summary 16
Kerbside
services
Drop off
services
Transfer
stations
Education Regulation Monitoring Infrastructure
Residual
collection/
RTS
Consider wheeled bins
N/A Price residual collection services to represent full cost of disposal
Advertise via web register of area based collection services
Consistent rules around collection times, materials, presentation of bins/bags etc.
Waste analysis
RTS data
Operator
licensing
data
Residual
disposal
Waste analysis
Negotiate with landfill operators
E.8.0 Statement of Council’s Intended Role Statutory Obligations E.8.1
Councils have a number of statutory obligations in respect of the planning and provision of
waste services. These include the following:
Promoting effective and efficient waste management and minimisation as required by the Waste Minimisation Act 2008
Having regard to the NZ Waste Strategy. The NZ Waste Strategy has two high levels goals: ‘Reducing the harmful effects of waste’ and ‘improving the efficiency of resource use’.
Council must consult the public about its plans for managing waste
Meeting any obligations under the Resource Management Act 1991 (RMA),
Protecting Public Health
Ensuring a healthy and safe working environment
Palmerston North City Council, in determining its role, needs to ensure that its statutory
obligations, including those noted above, are met.
Overall Strategic Direction and Role E.8.2
As noted the current WMMP encompasses an aspirational vision of progressing towards
zero waste. To assist in achieving this vision, Council’s key roles are proposed to cover the
following:
Council will continue existing activities and find new activities to divert waste to beneficial use
Council will aim to control and regulate waste collections so as to ensure that maximum waste is diverted from landfill and to minimise environmental impact
Council will endeavour to fund waste management activities in a way that is equitable and promotes waste minimisation and recycling and that minimises the cost to the ratepayer
Council will work with community groups and the private sector to achieve waste
Waste Assessment Executive Summary 17
minimisation goals in preference to developing additional Council-funded activities or assets
Council will continue to educate the community as to the benefits of waste minimisation and thereby improve participation in waste minimisation activities
E.9.0 Statements of Proposal Based on the options identified in this Waste Assessment and the Council’s intended role in
meeting forecast demand the following proposals are put forward. Actions and timeframes
for delivery of these proposals are identified in the Draft Waste Management and
Minimisation Plan.
Aim 1. Diversion of Waste to Beneficial Use E.9.1
Increase organic waste utilisation
Increase commercial waste recycling
Improve accessibility of recycling in public places
Aim 2. Regulation of Collection Services E.9.2
Regulate waste collection in Palmerston North to help ensure waste collected is put to beneficial use where feasible
Monitor and collect data to help direct future waste services
Protect the environment by regulation of waste disposal
Aim 3. Funding of Waste Minimisation Activities E.9.3
Reduce operational costs to minimise the cost of the activity to rate payers
Ensure funding for waste management activities promotes re-use and recycling and penalises disposal to landfill
Find alternate funding sources to help subsidise waste minimisation activities
Aim 4. Working with Community/Public Sector Groups E.9.4
Increase overall diversity and volume of recycling in Palmerston North
Aim 5. Education in Waste Minimisation E.9.5
Increase public awareness and participation in waste minimisation activities
E.10.0 Statement of Extent In accordance with section 51 (f), a Waste Assessment must include a statement about the
extent to which the proposals will (i) ensure that public health is adequately protected, (ii)
promote effective and efficient waste management and minimisation.
Protection of Public Health E.10.1
The Health Act 1956 requires PNCC to ensure the provision of waste services adequately
protects public health.
Households and organisations currently have access to a wide range of refuse and recycling
collection services which ensure that waste materials are able to be collected on a frequent
Waste Assessment Executive Summary 18
basis, and these services will be continued and enhanced to promote further waste
minimisation. Materials collected are disposed of at a modern sanitary landfill or are
processed for recovery through consented facilities.
The Waste Assessment has identified potential public health issues associated with each of
the options, and appropriate initiatives to manage these risks would be a part of any
implementation programme
In respect of Council provided waste and recycling services public health issues will be able
to be addressed through setting appropriate performance standards for waste service
contracts and ensuring performance is monitored and reported on, and that there are
appropriate structures within the contracts for addressing issues that arise.
Privately provided services will be regulated through bylaws or appropriate legislation
It is considered that, subject to any further issues identified by the Medical Officer of Health
the proposals would adequately protect public health.
Effective and Efficient Waste Management and Minimisation E.10.2
The assessment has investigated current and future quantities of waste and diverted
material, services provided in the District, future demands for waste and diverted material
services, options to meet these demands and the PNCC’s role in meeting these demands.
It is considered that the process of forecasting future demands and options to meet these
demands has been robust, and that the Council’s intended role in meeting these demands is
appropriate in the context of the overall statutory planning framework for the Council and for
promoting effective and efficient waste management and minimisation.
Therefore, it is considered that the proposals would promote effective and efficient waste
management and minimisation.