Waste benchmarking in Portfolio Manager for colleges and...
30
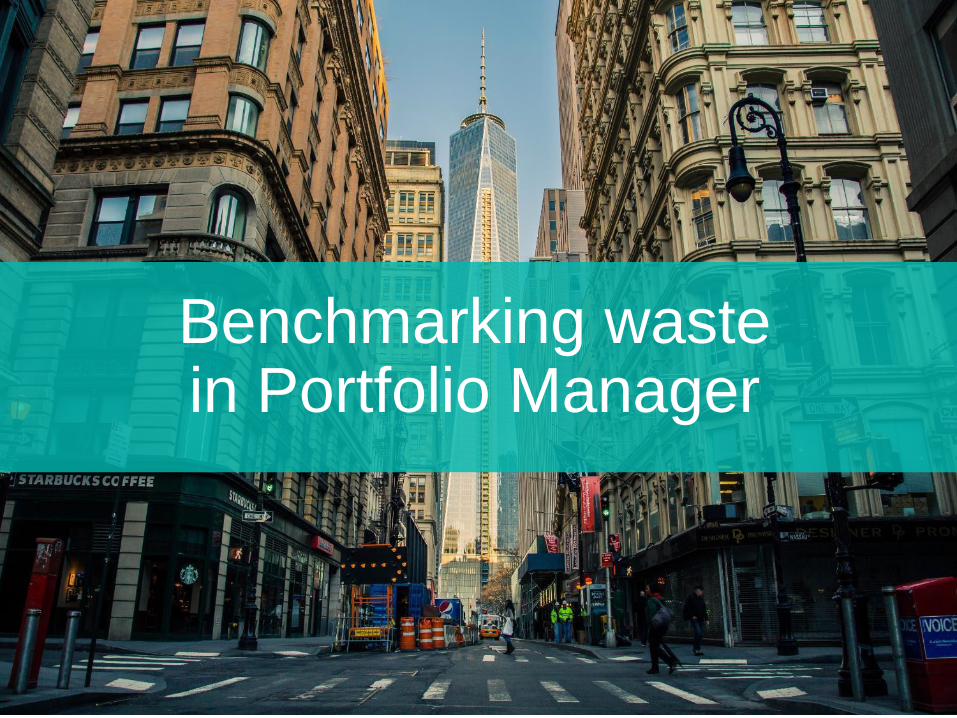
Waste benchmarking in Portfolio Manager for colleges and universities Brendan Hall Public Sector Program Manager EPA ENERGY STAR Commercial Buildings September 14, 2017
Transcript of Waste benchmarking in Portfolio Manager for colleges and...

Waste benchmarking in Portfolio Manager for
colleges and universities Brendan Hall
Public Sector Program Manager
EPA ENERGY STAR Commercial Buildings
September 14, 2017

Agenda
• Poll questions
• Why benchmark waste
• Benchmarking waste in ENERGY STAR Portfolio Manager
• ENERGY STAR Commercial Buildings program updates
• Q&A
2

Check below for whichever applies
We are currently benchmarking or tracking our campus waste data.
I have heard of ENERGY STAR Portfolio Manager.
Portfolio Manager is being used to benchmark our campus energy and/or water consumption data.
3

Why benchmark waste

Benchmarking allows you to:
Compare your
building to a
national sample
of similar
buildings
Compare your
buildings of a
similar type to
each other and
track changes
over time
Identify high and
low performers in
your portfolio and
prioritize
improvements
where investment
capital and staff
time are limited
73 88 21

Cost savings
• Orange Co. Health Dept. (FL) assessed wastes and eliminated 2 dumpsters, replaced with recycling- saving about $260/month
• One Bush Street, San Francisco – recycling and composting programs in office building resulted in annual savings of $24,000
• Synergy Health - 278 tons, saved $177,614 (2013)
• City of Tamarac, FL - 4,370 tons, net benefit $507,469 (2013)
• Georgia State Univ. - 306 tons, saved $19,046 (2014)
• Rooms to Go in Atlanta, prevented/recycled 24,880 tons (mostly wood, cardboard, paper) – netting $4.4 million (2014)
• Texas Army National Guard, Austin, TX, diverted 3,506 tons of MSW and Construction and Demolition from landfills, saving $157,849 (2015)
6

7
Sustainability
• Americans create more than 250 million tons of trash each year, excluding construction and demolition debris, hazardous waste, and industrial waste.
• 167 million tons of that waste end up in landfills and incinerators.
• From a traditional GHG accounting perspective, waste management represents <5% of US emissions. But from a systems perspective, approximately 40% of emissions are associated with the provision of goods and food.
• This problem also creates a great opportunity to improve sustainability.
Benchmarking waste in Portfolio Manager

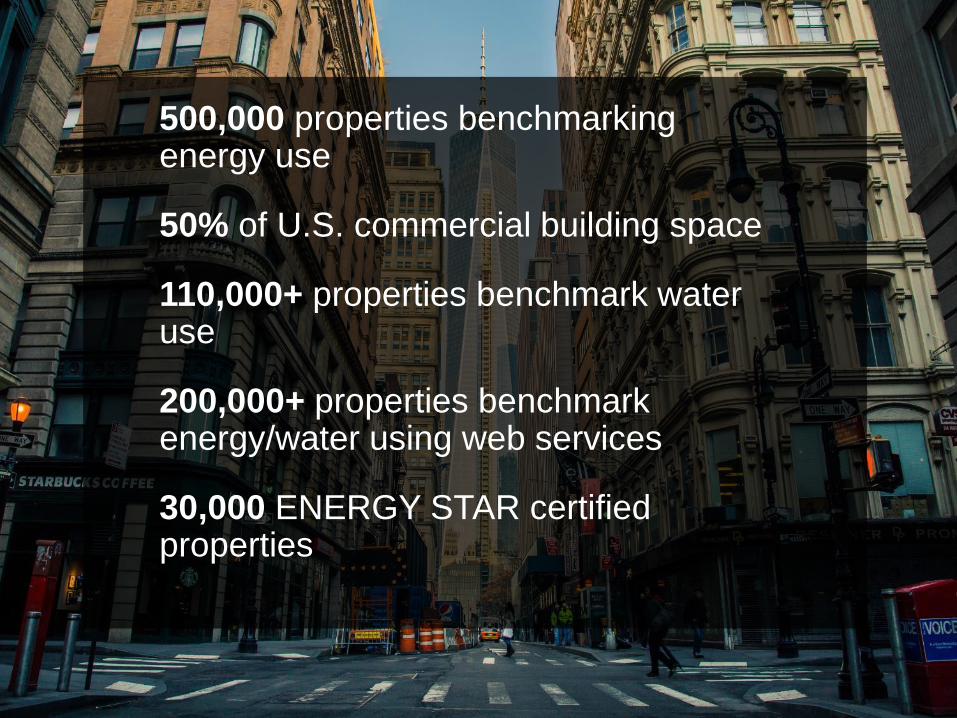
500,000 properties benchmarking energy use
50% of U.S. commercial building space
110,000+ properties benchmark water use
200,000+ properties benchmark energy/water using web services
30,000 ENERGY STAR certified properties

Waste tracking terminology
• Waste Material Type – The 29 different categories of materials
that you can track (e.g. trash, mixed recyclables, food scraps, etc.)
• Waste Management Method – One of 4 options for how you
manage your waste and materials
• Donated/Reused; Recycled; Composted; Disposed
• Disposed Waste Destination – One of 4 options for where your
disposed waste (e.g., trash) goes:
• Landfill; Incineration; Waste to Energy; Other/Unknown
• Waste Diversion – the sum of the Composted, Recycled, and
Donated/Reused Materials (i.e., everything that is not disposed) 11

12
Waste/Materials Disposed Donated/
Reused Recycled Composted
Appliances x x x
Batteries x x
Beverage Containers (aluminum, glass,
plastic) x x
Building Materials - Carpet/Carpet Padding x x x
Building Materials - Concrete x x x
Building Materials - Mixed/Other x x x
Building Materials - Steel x x x
Building Materials - Wood x x x
Cardboard/Corrugated Containers x x x x
Compostable - Mixed/Other x x
Electronics x x x
Fats/Oils/Grease x x
Food/Food Scraps x x x
Furniture x x
Glass x x x
Grass/Yard Trimmings x x
Lamps/Light Bulbs x
Mixed Recyclables x x
Office Supplies x x
Pallets x x x
Paper - Books x x x
Paper - Copy Paper x x x
Paper - Mixed x x
Plastics - Mixed x x
Plastics - Wrap/Film x x
Regulated Medical Waste x
Textiles/Clothing x x x
Trash x
Other x x x x

13

Step 1: Select Material & Management Method
• Select the Material Type you’re managing
• Trash, Cardboard, Furniture, etc.
• Select the Management Method
• Disposed, Recycled, etc.
• Add up to 10 different meters at once
14

Step 2: Tell us which kind of meter you want
• First, select Regular or Intermittent
• Page will dynamically change based on your choices
• For Regular, chose whether you will enter with a quantity, or just tell us the size of your dumpster / container
15

Data entry options
• Regular – Meters for materials that are picked up on an ongoing
basis (e.g., weekly pickup of trash and recycling). There are two
basic paths:
• Measured – Requires a weight or volume for each entry
• This can be marked as “estimated”
• Container Size – Is based on the size of the container
• Enter a container size, and specify the number of times it was emptied
and the percent full
• Intermittent – Meters for infrequent or 1-time events (e.g., annual
donation of electronics, or construction materials).
16

Step 3: Enter data • Tables to enter records for each month
• Similar to entering energy and water
• Exact fields will depend on the meter type (regular, intermittent)
• You do not need to complete this step to set up a meter
• Come back and fill in later
• Can create bulk spreadsheet upload template or get data uploaded through web services 17

Data required by meter type
• Note if the waste is disposed additional data is required
• % for each option: Landfill, Waste-to-Energy, Incineration, Unknown
• % values must add to 100; can omit options that are 0% 18
Regular Measured Regular Container Intermittent
Most like metered
energy
• Instead of a quantity,
enter number of pickups
& average percent full
• There is no “estimated”
flag
Similar to bulk energy,
with one date rather
than a range
• Start Date
• End Date
• Quantity
• Cost
• Disposal
Destination
(if applicable)
• Estimated (Y/N)
• Start Date
• End Date
• # of Times Picked Up
• Average Percent Full
• Cost
• Disposal Destination
(if applicable)
• Start Date
• Quantity
• Cost
• Disposal Destination
(If applicable)
• Estimated (Y/N)

Volume conversions
• Volume conversions
• Used to convert volume into weight
• Important because the main unit for
metrics is tons
• Materials without conversions
• Cannot use “container size” option
• For these materials you need to
provide a weight
• If you need to estimate the weight,
there is a way to mark each entry as
estimated
19
Materials without Volume Conversions
Appliances
Batteries
Electronics
Furniture
Lamps/Light Bulbs
Office Supplies
Regulated Medical Waste
Other

Step 4: Associate your waste meters
• Tell us which meters to add to your total for metrics
• Similar to the process for energy and water
• Usually, all of your meters will be associated
20
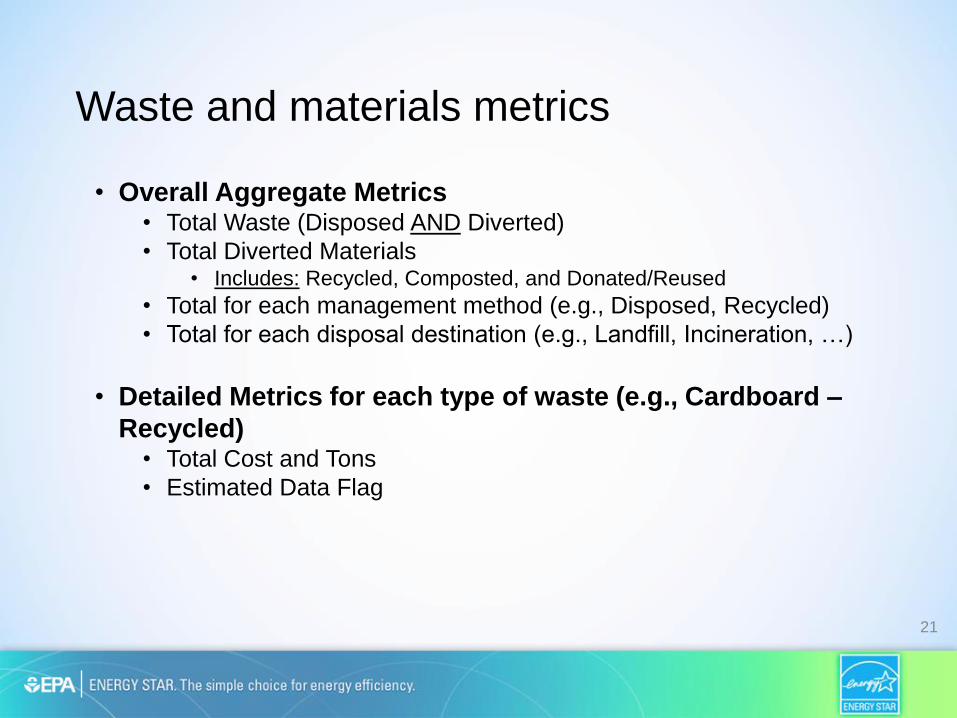
Waste and materials metrics
• Overall Aggregate Metrics • Total Waste (Disposed AND Diverted)
• Total Diverted Materials • Includes: Recycled, Composted, and Donated/Reused
• Total for each management method (e.g., Disposed, Recycled)
• Total for each disposal destination (e.g., Landfill, Incineration, …)
• Detailed Metrics for each type of waste (e.g., Cardboard –
Recycled) • Total Cost and Tons
• Estimated Data Flag
21

Where do I get this data?
• The goal of waste and materials management in Portfolio
Manager is to help you start tracking information you may not be
tracking today
• Ask your hauler if it is possible to measure the weight of your
materials • This should be your long term goal
• You can also try to estimate the weight yourself
• If you can’t get the weight, we offer the “Container” option, which
requires you to estimate a % full • When you first start using Portfolio Manager, you can enter 100% full
• Over time, try to start looking once a month
22

The value-add of using Portfolio Manager
• Encourages ongoing, monthly tracking of wastes which can lead to better management
• Standardizes tracking across your portfolio for better uniformity
• Distinguishes between measured and estimated values
• Enables everyone involved with a campus to be working from the same data, also integrating energy, water, and waste data into a single platform
• Begins a groundswell of organizations requesting better data from their haulers and technology providers
• Robust reporting functions both for you and for internal and external audiences, including sustainability-related reporting
• Eventually, could help EPA to develop rough comparative metrics
23
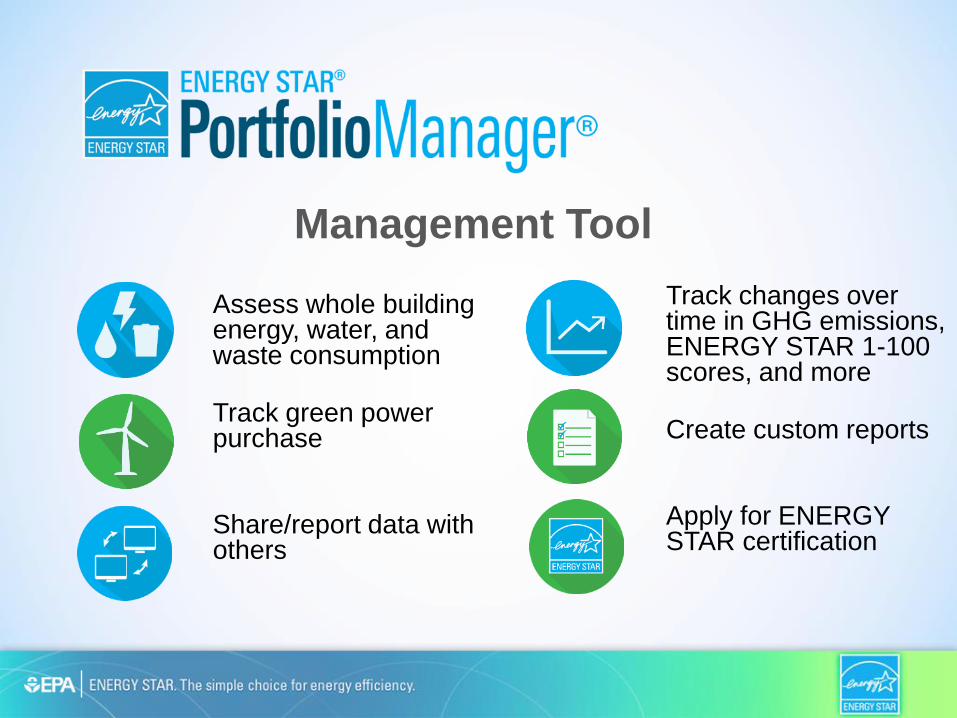
Management Tool
Track changes over time in GHG emissions, ENERGY STAR 1-100 scores, and more Create custom reports Apply for ENERGY STAR certification
Assess whole building energy, water, and waste consumption Track green power purchase Share/report data with others
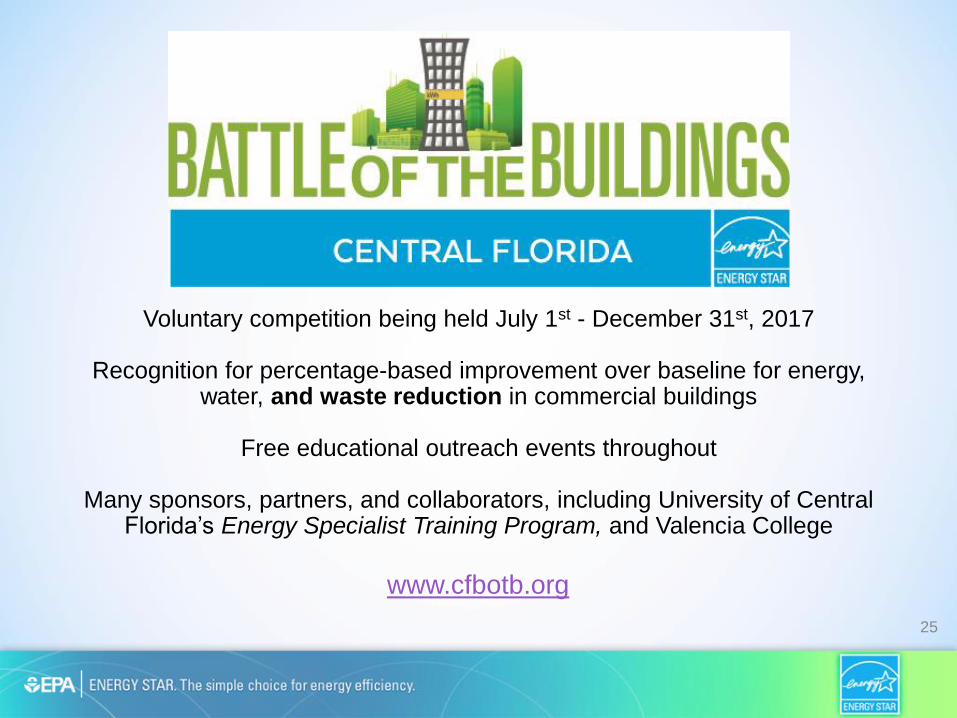
Voluntary competition being held July 1st - December 31st, 2017
Recognition for percentage-based improvement over baseline for energy,
water, and waste reduction in commercial buildings
Free educational outreach events throughout
Many sponsors, partners, and collaborators, including University of Central Florida’s Energy Specialist Training Program, and Valencia College
25
www.cfbotb.org

Program updates

27
Agenda highlights: • How to prepare for 2018 updates to 1-
100 ENERGY STAR scores
• Best practices for deploying electric
vehicle charging stations
• ENERGY STAR market insights &
program updates
• The future of lighting for commercial
applications
• Next-level advances in smart buildings
• The financial value of energy efficiency
• Reaching and engaging tenants and
occupants
• … and more! ENERGY STAR 2017
Commercial Buildings
Partner Meeting October 24 – 25 Sheraton Grand Chicago
Preview agenda & book your room now:
www.energystar.gov/BuildingsPartnerMeeting
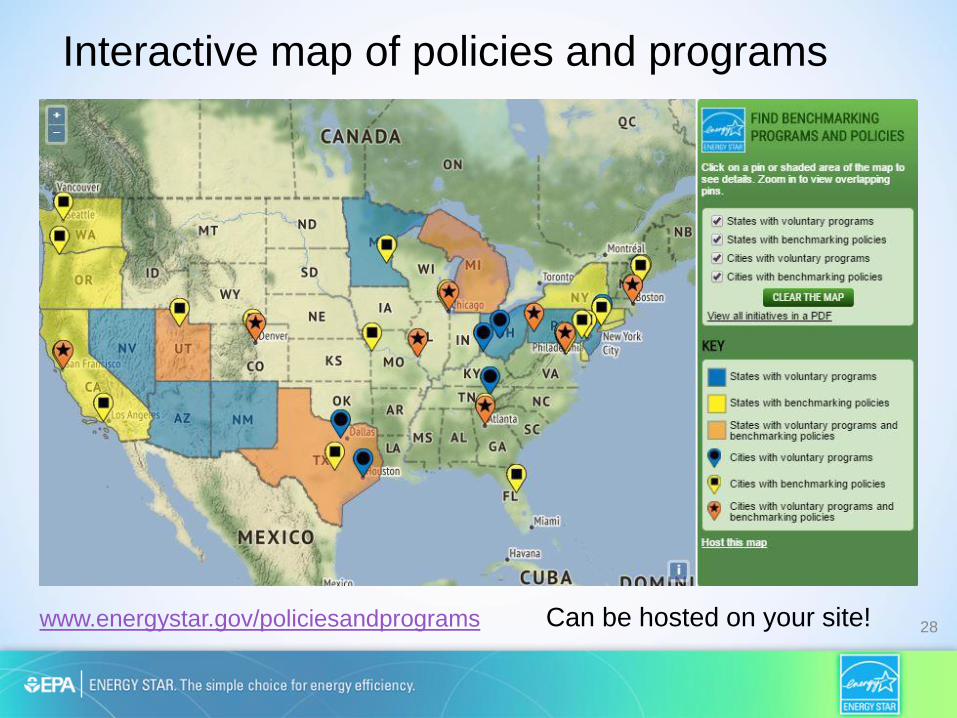
Interactive map of policies and programs
28 www.energystar.gov/policiesandprograms
Can be hosted on your site!

Step-by-step guidance on how to:
1. Set Goals
2. Define the Playing Field
3. Dedicate Resources
4. Recognize Participants
5. Keep Score
6. Plan the Launch
7. Get the Word Out
www.energystar.gov/competitionguide
Launch your own efficiency competition!

Questions?
Brendan Hall
202-343-9939 (work)
202-597-0462 (cell)
Helpful resources:
• Waste FAQs
• Managing and Reducing Wastes: A Guide for Commercial
Buildings
• EPA’s volume-to-weight conversion factors for waste
Connect with me at AASHE!
30


![Portfolio Committee on Higher Education and Training Meeting Further Education and Training Colleges Amendment Bill [B24-12] 08 August 2012 Parliament,](https://static.fdocuments.in/doc/165x107/56649da65503460f94a91662/portfolio-committee-on-higher-education-and-training-meeting-further-education.jpg)