Washington Statewide Human Services Transportation Plan · Plan Objectives and Process ... DAV...
76
Washington Statewide Human Services Transportation Plan July 2013 Contact: Don Chartock, WSDOT Rural & Coordinated Transportation Administrator 1 [email protected], 360-705-7928
Transcript of Washington Statewide Human Services Transportation Plan · Plan Objectives and Process ... DAV...

Washington Statewide Human Services Transportation Plan July 2013
Contact: Don Chartock, WSDOT Rural & Coordinated Transportation Administrator 1 [email protected], 360-705-7928
Washington Statewide Human Services Transportation Plan Contact: Don Chartock, Don [email protected], 360-705-7928 ii
Americans with Disabilities Act (ADA) Information This material can be made available in an alternate format by emailing the WSDOT Diversity/ADA Affairs team at [email protected] or by calling toll free, 855-362-4ADA(4232). Persons who are deaf or hard of hearing may make a request by calling the Washington State Relay at 711. Title VI Notice to Public It is the Washington State Department of Transportation's (WSDOT) policy to assure that no person shall, on the grounds of race, color, national origin or sex, as provided by Title VI of the Civil Rights Act of 1964, be excluded from participation in, be denied the benefits of, or be otherwise discriminated against under any of its federally funded programs and activities. Any person who believes his/her Title VI protection has been violated, may file a complaint with WSDOT's Office of Equal Opportunity (OEO). For additional information regarding Title VI complaint procedures and/or information regarding our non-discrimination obligations, please contact OEO's Title VI Coordinators, George Laue at (509) 324-6018 or Jonte' Sulton at (360) 705-7082

Washington Statewide Human Services Transportation Plan Contact: Don Chartock, Don [email protected], 360-705-7928 iii
Table of Conte nts
Section 1 Executive Summary ...................................................................................................... 1 Plan Objectives and Process .................................................................................. 1 Organization of the Final Report ............................................................................. 1 Stakeholder Collaboration ....................................................................................... 2 Integration with Statewide Policy Objectives ........................................................... 3 Statewide Coordination Efforts ................................................................................ 3 Major Findings and Outcomes ................................................................................ 4 Strategies, Recommended Actions, and Implementation ........................................ 4
Section 2 Guiding the Statewide HSTP ..................................................................................... 7
Project Goals and Objectives .............................................................................. 7 Project Methodology ............................................................................................ 7
Section 3 Relationships to Other Plans .................................................................................. 12 Federal, State Roles in Human Service Transportation Planning .......................... 12 Coordinated Public Transit/Human Services Plans ............................................... 13 Native Americans .................................................................................................. 14 Washington Transportation Plan 2030 .................................................................. 16 Moving Washington .............................................................................................. 17
Section 4 Funding Human Service Transportation ............................................................ 19 Funding Programs and Expenditures by Mode ..................................................... 21 Federal Transportation Funding Under Map-21 .................................................... 25 Urbanized Area Formula Grants (5307) ................................................................ 26 Rural Area Formula Grants (5311) ........................................................................ 27 Enhanced Mobility of Seniors and Individuals with Disabilities (5310, 5317) ......... 28 Significance of Map-21 Changes .......................................................................... 28
Section 5 Statewide HSTP Framework ..................................................................... 30 Current Demographics Summaries ....................................................................... 30 Statewide Summary .............................................................................................. 31 Office of Financial Management Population Projections ....................................... 46 Needs Assessment ............................................................................................... 47 Statewide HSTP Priority Strategies ....................................................................... 50
Section 6 Best Practices in Planning and Operations ...................................................... 52 Public Outreach and Stakeholder Consultation ..................................................... 53 Quantitative-Based Needs Assessment ................................................................ 57 Prioritization of Strategies/Potential Projects ......................................................... 58 Use of Performance Indicators for Human Service Transportation ........................ 58 Exemplary Roles of States in Coordination ........................................................... 65
Section 7 Statewide HSTP Recommendations ....................................................... 69

Washington Statewide Human Services Transportation Plan Contact: Don Chartock, Don [email protected], 360-705-7928 iv
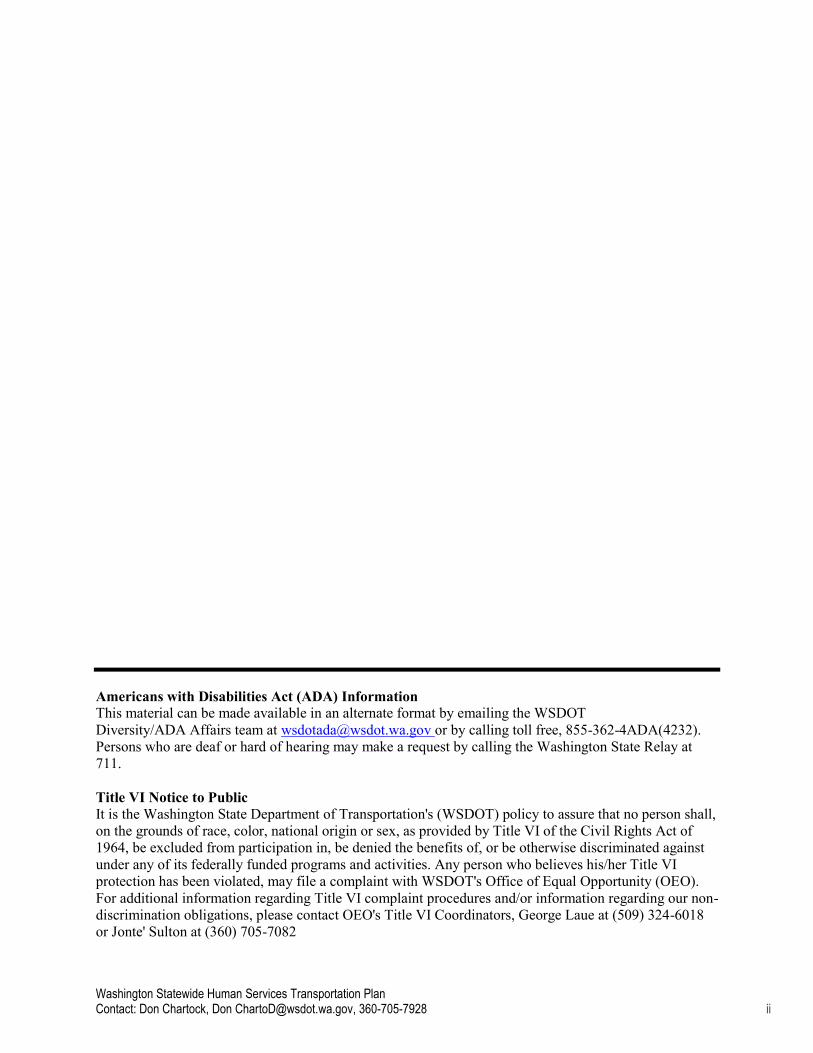
Figures Figure 1 – Statewide HSTP Planning Process .................................................................... 2 Figure 2 – Public Outreach Information ............................................................................ 10 Figure 3 – Federally Recognized Tribes of Washington State........................................... 16 Figure 4 – Moving Washington .......................................................................................... 17 Figure 5 – Public Transportation Operating Capital Investment (FY 2010-11) ................. 21 Figure 6 – Public Transit Operating Expenditures by Mode (FY 2010-11) ........................ 21 Figure 7 – Highlight of Program Changes .......................................................................... 25 Figure 8 – Population with a Disability ............................................................................... 33 Figure 9 – Percent of Population with a Disability .............................................................. 33 Figure 10 – Population Older Than 65 ................................................................................. 35 Figure 11 – Percent of Population Over 65 .......................................................................... 35 Figure 12 – Households with No Access to Vehicle ............................................................ 37 Figure 13 – Percent of Households with No Access to a Vehicles ...................................... 37 Figure 14 – Population in Poverty ........................................................................................ 39 Figure 15 – Percent of Population in Poverty....................................................................... 39 Figure 16 – Unemployed Population .................................................................................... 41 Figure 17 – Percent of Population Unemployed .................................................................. 41 Figure 18 – Veterans Population .......................................................................................... 43 Figure 19 – Percent of Population who is a Veteran ............................................................ 43 Figure 20 – Linguistically Isolated Households .................................................................... 45 Figure 21 – Percent of Households Linguistically Isolated .................................................. 45 Figure 22 – Age Distribution of Statewide Population .......................................................... 46 Figure 23 – Statewide Population Growth by Age Group from 2010 ................................... 47 Figure 24 – Social Media Outreach on Twitter ..................................................................... 54 Figure 25 – YouTube Video Town Hall ................................................................................ 56 Figure 26 – City of Richmond, CA ........................................................................................ 57 Figure 27 – TriMet Performance Dashboard........................................................................ 65 Figure 28 – United We Ride from Kansas University Transportation Center ...................... 67 Tables Table 1 – Statewide Human Services Transportation Plan Strategies ................................. 5 Table 2 – Need and Recommendation Summary ................................................................. 6 Table 3 – Native American Status ....................................................................................... 15 Table 4 – Medicaid Transportation Broker by County ......................................................... 24 Table 5 – Urbanized Areas Formula Grants (FY 2013) ...................................................... 26 Table 6 – Washington State and National Demographics Data ......................................... 31 Table 7 – Disability Status by County ................................................................................. 32 Table 8 – Population Older than 65 .................................................................................... 34 Table 9 – No Access to Vehicle .......................................................................................... 36 Table 10 – Low Income Individuals ...................................................................................... 38 Table 11 – Unemployment Status ........................................................................................ 40 Table 12 – Veteran Status.................................................................................................... 42 Table 13 – Linguistically Isolated Households .................................................................... 44 Table 14 – Statewide Human Services Transportation Plan Strategies .............................. 51 Table 15 – Need and Recommendation Summary .............................................................. 71

Washington Statewide Human Services Transportation Plan Contact: Don Chartock, Don [email protected], 360-705-7928 v
Acronyms ACCT Agency Council on Coordinated Transportation ACS U.S. Census Bureau’s American Community ADA Americans with Disabilities Act CTD Coordinated Transit Districts DAV Disabled American Veterans FTA Federal Transit Administration FY Fiscal Year HCA Washington State Health Care Authority HIPPAA Health Insurance Portability and Accountability Act HSTP Human Services Transportation Plan JARC Job Access and Reverse Commute Program KDOT Kansas Department of Transportation LOS Level of Service LEP Limited English proficient MAP-21 Moving Ahead for Progress in the 21st Century MPO Metropolitan Planning Organization NEMT Non-Emergency Medical Transportation OFM Office of Financial Management PAC Project Advisory Committee QOS Quality of Service RTPO Regional Transportation Planning Organizations SAFETEA-LU Safe Accountable Flexible Efficient Transportation Equity Act: A Legacy for
Users SHSTP Statewide Human Services Transportation Plan STAR Sweetwater (Wyo.) County Transit Authority STRAP Supplemental Transportation Rural Assistance Program TRB Transportation Research Board VA U.S. Department of Veterans Affairs WSDOT Washington State Department of Transportation WTP Washington Transportation Plan

Washington Statewide Human Services Transportation Plan July 2013
Contact: Don Chartock, WSDOT Rural & Coordinated Transportation Administrator 1 [email protected], 360-705-7928
Section 1│ Executive Summary
Plan Objectives and Process
The Statewide Human Services Transportation Plan, prepared under the auspices of the Washington State Department of Transportation, serves as a strategic framework for addressing the state’s existing and future human services transportation needs. Developed through collaboration with affected stakeholders and with public input, the Statewide HSTP provides a set of recommendations to facilitate coordination and maximize resources to meet the state’s increasing human services transportation needs.
Regional planning efforts have succeeded in revealing local needs and transportation issues specific to each region within the state of Washington. The Statewide HSTP provides a unique opportunity to advance those local findings regarding unmet needs, as well as to develop common strategies at a statewide level.
The primary project objectives of this planning effort include the following:
Identify statewide human services transportation deficiencies
Investigate best practices in improving human service transportation planning and service delivery as implemented in Washington State and nationally
Develop strategies and recommendations to improve access and enhance mobility for target populations
Align the plan with Moving Washington, the state's initiative for an integrated, corridor-based, 21st century transportation system.
Organization of the Final Report
The entire report is organized in seven sections as described below:
Section 1 includes the executive summary of the report.
Section 2 presents an overview of the project, and describes the project methodology and efforts to solicit public involvement and data collection.
Section 3 discusses the relationship of this plan with other statewide plans.
Section 4 provides an overview of funding for human service transportation programs within the state of Washington, and summarizes changes resulting from recent federal legislation.
Section 5 provides a transportation planning framework, including a detailed demographic discussion, needs assessment and development of corresponding strategies.

Washington Statewide Human Services Transportation Plan July 2013
Contact: Don Chartock, WSDOT Rural & Coordinated Transportation Administrator 2 [email protected], 360-705-7928
Section 6 highlights some best-practice examples in planning and service operations in Washington State and elsewhere.
Section 7 suggests a menu of recommendations and next steps for WSDOT to consider in moving ahead.
Stakeholder Collaboration
Throughout the planning process, guidance and input was provided by members of the Project Advisory Committee (PAC). The PAC comprised of approximately 20 members representing transit agencies, other public transportation providers, regional transportation planning organizations (RTPO), nonprofit human service agencies, WSDOT and others. A list of the PAC members is provided in Section 2 of the report.
Figure 1 – Statewide HSTP Planning Process

Washington Statewide Human Services Transportation Plan July 2013
Contact: Don Chartock, WSDOT Rural & Coordinated Transportation Administrator 3 [email protected], 360-705-7928
Four regional “Listening Sessions” were also convened throughout the state to learn more about local concerns and priorities. Each of the sessions corresponded with a “Ride Along,” during which consultant and WSDOT staff rode local public transit services and had an opportunity to speak directly to riders and drivers of those services.
A survey was conducted of all RTPOs to solicit input about their perceived priorities and service gaps, and a project website was initiated through Agency Council on Coordinated Transportation (ACCT), which allowed for public review of key project deliverables. Several presentations were made in person at ACCT meetings as major project milestones were achieved.
Integration with Statewide Policy Objectives
It is intended that the SHSTP be integrated with other ongoing statewide planning and policy objectives as described further in this document. The Washington Transportation Plan (WTP) 2030 is a statewide transportation policy plan that provides a long-range vision for meeting the state’s multimodal transportation system needs. The WTP identifies strategies and recommended actions that support transportation and mobility options for all users.
Moving Washington is WSDOT’s investment and prioritization strategy that promotes the development of a balanced, efficient, and reliable transportation system. Its objective is to encourage economic vitality, improve personal mobility, and protect the environment. With an emphasis on safety and system maintenance, the strategy takes a transportation corridor approach that views the transportation system holistically and looks beyond jurisdictional boundaries and physical capacity constraints to address the overall mobility of people and freight. The SHSTP is consistent with this philosophy by promoting the idea of a more integrated and strategic approach to identifying, prioritizing, and funding human services transportation improvements.
Statewide Coordination Efforts
The coordination of human service transportation programs is important because successful coordination can result in improved efficiency, reduced service duplication, and increased mobility options for the public. Coordination remains a challenge, however, because of the limitations inherent in funding sources, constraints that prevent inter-jurisdictional travel, or other barriers. Currently, coordination on human services transportation occurs at different levels throughout the state.
The Agency Council on Coordinated Transportation is a partnership of representatives from the state Legislature, state agencies, transportation providers and consumer advocates. The ACCT’s mission is to direct and promote activities that efficiently use all available state and community resources for human services transportation. The council serves in a lead role, working with transportation providers and planning organizations throughout the state to implement federal planning requirements.
The state’s 14 regional transportation planning organizations are required under federal guidelines for developing regional coordinated public transit-human services transportation plans which include identification and prioritization of local projects. It is WSDOT’s policy that all

Washington Statewide Human Services Transportation Plan July 2013
Contact: Don Chartock, WSDOT Rural & Coordinated Transportation Administrator 4 [email protected], 360-705-7928
state and federally funded improvements are identified in an adopted regional human services transportation plan. Some RTPOs also take a proactive role in facilitating coordination activities within their region.
In addition, numerous efforts to promote coordination and implement policies or projects are underway at the local level within the state of Washington. Some of these efforts are organized at the county level; others are multi-county in nature. Either approach generally results in collaboration between public transit agencies and their human service agency partners.
Major Findings and Outcomes
Existing statewide needs and gaps were assessed in a number of ways throughout the planning process. The assessment included RTPO staff interviews regional human service coordination plan reviews; extensive target-population demographic analysis; and Listening Sessions and Ride Alongs (as defined on page 2). The assessment revealed that human services transportation needs vary across the state by regional demographics, and land-use context. Even so, some common themes emerged. The identified needs and gaps, summarized in Section 5, are organized into three broad categories – customer needs, operational needs, and awareness needs.
The demographics assessment summarized in Section 5 shows that the statewide special needs population is expected to increase. Over the next several decades, the need for specialized transportation services also will increase as statewide population grows by more than 2 million residents by 2040, with nearly half of that growth representing individuals over age 65. This national trend will result in the population of older adults increasing from 12 percent of the total population in 2010 to 21 percent of the total population in 2040. As the population ages, more people are likely to have a disabling condition or otherwise experience limitations to their mobility (i.e. they can no longer drive), which will trigger a greater need for specialized transportation services.
Strategies, Recommended Actions and Implementation
Statewide HSTP priority strategies were developed through public participation, needs assessment, and input from the PAC. The strategies are generally consistent with the WTP policy goals. The priority strategies were instrumental in guiding development of the Plan recommendations discussed below. The SHSTP strategies, in no particular order of priority, are summarized in Table 1.

Washington Statewide Human Services Transportation Plan July 2013
Contact: Don Chartock, WSDOT Rural & Coordinated Transportation Administrator 5 [email protected], 360-705-7928
Table 1 – Statewide Human Services Transportation Plan Strategies
Statewide Human Services Transportation Planning Strategies
Coordination and Communication
Increase knowledge of available transportation options to target users
Improve coordination between regional and cross-regional transit service providers
Improve coordination between transit service providers, human service providers and users
System Efficiency
Improve cross-regional connections
Assist human service providers in guiding users to the most efficient mobility options
User Experience
Increase service levels
Promote driver training to encourage “compassionate professionalism”
Improve quality of timeliness of service
System Preservation
Maintain existing service levels and vehicle fleets
Improve utilization of existing transportation services
Further leverage available funding
Environment
Promote environmentally sustainable practices into SHSTP planning and services
Integrated Planning
Integrate infrastructure, land us, and transportation planning to address human service needs
Integration of SHSTP planning with regional and local transportation planning
Innovative Planning
Promote innovative programs, processes and tools that improve efficiency and reduce cost
Utilize performance measures to assess need and effectiveness of service
Utilize technology to provide improved efficiency and user access to mobility options
The recommendations, summarized in Section 7, are organized to align each recommendation with an identified need, recognizing that different efforts at various levels of state and regional agencies must be pursued to truly achieve coordinated human services transportation.
Table 2 summarizes the state’s human service transportation needs and recommendations.

Washington Statewide Human Services Transportation Plan July 2013
Contact: Don Chartock, WSDOT Rural & Coordinated Transportation Administrator 6 [email protected], 360-705-7928
Table 2 – Need and Recommendation Summary
Transportation Need Recommendation
Customer Needs and Gaps
Unserved or underserved geographical areas
Service Expansion – Expand fixed route and/or specialized transportation services in unserved or underserved areas. Evaluate a range of delivery methods, including: vanpool, volunteer services, shuttles, shared-vehicle programs, taxi vouchers, and other options not yet identified.
Travel distances and cross-jurisdictional travel
Improve Data – Collect travel data (i.e. travel surveys and logs) to identify where there is significant cross-jurisdictional travel. Identify important statewide major destinations and prioritize efforts to get people there.
Ease of system use Consolidated Trip Planning Portal – Building upon existing one-call systems to provide a one stop resource for users seeking information about transportation options.
Access to the system Integrated Planning – Better integrate land use and transportation planning to account for human services transportation needs. Incorporate human services transportation into state, regional, and local planning efforts to account for all users of the transportation system. Accessible Infrastructure – Improve the physical environment to improve access to the transportation system. Identify opportunities to improve accessibility for specialized transportation users with coordination on planned capital improvements.
Service expansion and capacity
Sustainable Funding – Plan and advocate for sustainable revenue sources to expand specialized transportation services to meet growing human services transportation demand. This includes additional funding for both capital and service.
Safety and security User Safety – Encourage design and operations of transit service and facilities that provides improved safety and security, perceived or real, for both riders and service providers. Travel Training – Encourage travel training programs to increase knowledge and comfort level of using both fixed route and specialized transportation services.
Operational Needs and Gaps
Service levels and vehicle fleets
Maintain Existing Levels of Service – Identify sustainable funding to maintain basic levels of service, both for fixed route and specialized transportation services as well as vehicle replacement.
Performance measures Quality of Service Measures – Develop Quality of Service (QOS) methodology for evaluating human services transportation systems, with the goal of establishing common measures of performance evaluation.
Mobility management Mobility Management – Encourage mobility management activities at local and regional level to advance coordination projects.
Awareness Needs and Gaps
Awareness of transportation options
Targeted Outreach – Support targeted outreach and marketing campaign to raise awareness of mobility options to population groups that have historically been challenging to reach. Develop a comprehensive strategy that combines both traditional and new media methods.
Information sharing Information Clearinghouse – An information clearinghouse would act as a centralized resource for human services transportation information, data, best practices, etc. A clearinghouse concept would enhance coordination and sharing of information at all levels of planning and operations.

Washington Statewide Human Services Transportation Plan July 2013
Contact: Don Chartock, WSDOT Rural & Coordinated Transportation Administrator 7 [email protected], 360-705-7928
Section 2│ Guiding the Statewide HSTP This section describes the overarching goals and objectives for the Statewide HSTP and discusses the methodology that was used to complete it.
Project Goals and Objectives
The Statewide Human Services Transportation Plan is intended to summarize the needs, interests and visions of Washington's 14 regional transportation planning organizations and advance key themes and common strategies from local plans to a statewide level.
The focus of the Statewide HSTP is to build upon the findings from those regional plans by highlighting transportation service gaps and challenges, and to investigate best practices from around the state and beyond in order to provide guidance to local service providers. It is also intended to recommend strategies to improve access to transportation throughout the state.
The specific objectives of this planning effort include:
Identify statewide human services transportation deficiencies
Investigate best practices to improve human service planning implemented in Washington State and nationally
Develop strategies and recommendations to improve access and enhance mobility for target populations
Align the plan with Moving Washington, the state's initiative for an integrated, corridor-based, 21st century transportation system
Project Methodology The methodology used to support key findings generated and discussed in this report is described below, and consisted of four primary steps:
Public participation
Data collection and demographic analysis
Review of relevant documents
Research on best practices
Public Participation
A critical goal in developing human services transportation plans, or any other transportation plan, is to provide opportunities for input from stakeholders who rely on or provide transportation services. Understanding the diversity of the human service transportation client base and corresponding specific needs is crucial as groups pursue policy, program, and project initiatives.

Washington Statewide Human Services Transportation Plan July 2013
Contact: Don Chartock, WSDOT Rural & Coordinated Transportation Administrator 8 [email protected], 360-705-7928
As discussed in more detail below, the key components of the Statewide HSTP public participation effort consisted of convening public meetings, establishing a project website, and conducting surveys of all RTPOs.
Meetings
Meetings were convened for this project, and represent a key element of the public participation process. All meetings were open to the public. In addition to the formal meetings scheduled as part of the Statewide HSTP development process, WSDOT staff provided status reports on the Plan at other meetings and forums, as appropriate.
Project Advisory Committee
Approximately 20 members were on the SHSTP Project Advisory Committee. PAC members included statewide stakeholders in public, nonprofit, and private transportation. The committee provided project oversight and policy guidance throughout the process. The PAC met five times throughout the different phases of the plan development. In addition to the meetings, several PAC members also participated in four Listening Sessions discussed below. A list of the PAC members follows:
Jerry Ayres, WSDOT Public Transportation Division, Planning Liaison & SHSTP Project Manager
Madelyn Carlson, People for People Don Chartock, WSDOT Public Transportation Division, Access Development Manager Victor Harris, Stakeholder Tom Hingson, Everett Transit Charlene Kay, WSDOT Eastern Region planning engineer Danette Klemens, Senior Services of Snohomish County Colleen Kuhn, Human Services Council Patrick Lynch, consultant team project manager Lynn Moody, Hopelink Pat Morin, WSDOT Capital Program Development & Management Karen Parkhurst, Thurston Regional Planning Council Tim Renfro, Pierce Transit Rep. Cindy Ryu, 32nd District, Washington State House of Representatives Kelly Scalf, president CTANW Page Scott, Yakima Valley Conference of Governments Connie Soper, consultant team Kim Stube, Cowlitz Tribe Margaret Tully, Pierce County

Washington Statewide Human Services Transportation Plan July 2013
Contact: Don Chartock, WSDOT Rural & Coordinated Transportation Administrator 9 [email protected], 360-705-7928
Listening Sessions
Listening Sessions were conducted around the state to gather input from key stakeholders and the general public. The sessions were held in August 2012 at four locations – Longview, Sunnyside, Spokane, and Everett. To make the planning process accessible and meaningful to the general public, the sessions employed visual communication techniques that included tables, maps, and figures related to relevant information and key issues. The Listening Sessions provided opportunities for attendees to comment and discuss with the project team findings from the initial data summaries, best practices, potential strategies, and specific local issues.
Ride Alongs
In conjunction with the Listening Sessions, members of the project team participated in four “Ride Alongs” with local transit service providers. They offered opportunities to conduct informal interviews with drivers and passengers and gain on-the-ground perspective from their personal experiences. The information gained provided valuable insights into the unique challenges and needs across the state.
Project Website
WSDOT developed a SHSTP project website (www.wsdot.wa.gov/acct/HSTP), which was available through the ACCT website, for easy on-line access to project material for people who could not attend project meetings. The website hosted a variety of information including an overview of the project, information, comment options and notice of upcoming meetings. The Draft and Final Statewide HSTP documents were also available on the website. The project website also provided links and identified sources of further information and opportunities for comment, including opportunities to request materials in alternative languages or formats.
Stakeholder Surveys
As part of the overall public participation process, surveys were conducted to gather specific input from key stakeholders.
RTPO Interviews
All 14 RTPOs were contacted to better understand their needs related to human service transportation planning. They were asked to identify barriers or challenges in conducting the coordinated plans, barriers in implementing projects, and their thoughts of the most crucial gaps to be addressed. The findings from this exercise are discussed in more detail in Section 5.
Priority Strategies Exercise
A priority strategies exercise was conducted with several groups, including the PAC. It provided an opportunity for a wider audience to provide input on the Plan’s priority strategies. The exercise assisted in identifying key strategies to move forward as part of the recommended Statewide HSTP initiatives. Participants were asked to select both their highest and lowest

Washington Statewide Human Services Transportation Plan July 2013
Contact: Don Chartock, WSDOT Rural & Coordinated Transportation Administrator 10 [email protected], 360-705-7928
priorities. Through this process, themes were developed and cross-referenced with the general background of the participants. This exercise provided valuable input on the perspectives of different groups and facilitated discussion regarding the priority strategies.
Title VI Nondiscrimination Law
Title VI of the Civil Rights Act of 1964 is a Federal statute and provides that no person shall, on the grounds of race, color, or national origin, be excluded from participation in, be denied the benefits of, or be subjected to discrimination under any program or activity receiving Federal financial assistance. This includes matters related to language access or limited English proficient (LEP) persons. The Statewide HSTP public participation process included the following components to address minority, LEP, and low-income populations.
Listening Sessions
Local meeting sponsors provided targeted outreach to minority, LEP, and low-income populations to generate attendance at the Listening Session meetings discussed above.
Locations and facilities were selected, in part, to be more accessible to target populations. Meeting notices were translated to the Spanish language.
Ride Alongs
As described above, the project team participated in Ride Alongs to be more accessible and gain input from minority, LEP, and low-income populations.
Project Website
WSDOT’s website offers language assistance including translated materials for people with limited English proficiency is available upon request. No requests for translate materials were received.
Figure 2 – Public Outreach Information

Washington Statewide Human Services Transportation Plan July 2013
Contact: Don Chartock, WSDOT Rural & Coordinated Transportation Administrator 11 [email protected], 360-705-7928
Data Collection and Demographic Analyses
Section 5 present analyses conducted to support a better understanding of the special-needs populations of Washington State. It was primarily prepared using U.S. Census data but also includes data from the U.S. Bureau of Labor Statistics and the Washington State Office of Financial Management.
Demographic data included in this section were selected for their relationship to human service’s needs. Data are presented at a county level. Demographic data were presented in two ways, population per county and percent of total county population.
U.S. Census and Labor Statistics demographic data provided a look at current needs, while demographic data from the Office of Financial Management provide forecasts of future population age trends.
Review of Relevant Documents
As stated previously, a goal of this project is to highlight key findings emerging from the locally developed human service transportation plans and to identify potential best practices to share with other project sponsors. To accomplish this, coordinated transportation plans from each of the states 14 RTPO were reviewed and summarized. The findings are presented in Section 3.
Research on Best Practices
Section 6 discusses best practices. The best-practice examples were identified through a review of all 14 of Washington’s coordinated plans, as well as the consultant team’s knowledge of other programs throughout the United States. Additionally, team members consulted several other resources and documents, including several published through the Transportation Research Board (TRB), as specified in more detail in Section 6.

Washington Statewide Human Services Transportation Plan July 2013
Contact: Don Chartock, WSDOT Rural & Coordinated Transportation Administrator 12 [email protected], 360-705-7928
Section 3│ Relationships to Other Plans Federal and State Roles in Human Service Transportation Planning
In August 2005, the Safe Accountable Flexible Efficient Transportation Equity Act: A Legacy for Users (SAFETEA-LU), was signed into law, which authorized guaranteed funding for federal surface transportation programs through fiscal year 2009, including funds for federal transit programs.
Starting fiscal year 2007, projects funded through three programs in SAFETEA-LU, including the Job Access and Reverse Commute Program (JARC, Section 5316), New Freedom (Section 5317) and the Formula Program for Elderly Individuals and Individuals with Disabilities (Section 5310), were required to be derived from a locally developed, coordinated public transit-human services transportation plan. Furthermore, SAFETEA-LU endorsed the planning for the federal Formula Grants for Other Than Urbanized areas (Section 5311). SAFETEA-LU guidance issued by the Federal Transit Administration indicates that the plan should be a “unified, comprehensive strategy for public transportation service delivery that identifies the transportation needs of individuals with disabilities, older adults, and individuals with limited income, laying out strategies for meeting these needs, and prioritizing services.”1
SAFETEA-LU was replaced by new federal legislation, Moving Ahead for Progress in the 21st Century (MAP-21), which took effect in October 2012. As discussed further in Section 4, some significant changes will impact the provision of human service transportation services – namely, the JARC and New Freedom Programs have been repealed, though activities consistent with these programs may still be funded with other federal sources of funds (i.e. Section 5310, 5311, or 5307).
Washington State Department of Transportation
Currently, The Washington State Department of Transportation is the designated recipient for the state’s federal Section 5310 funding and for JARC and New Freedom funding for small urban and non-urban areas of the state. WSDOT also administers a Consolidated Grant Program using state funds to support transportation services throughout the state.
State funds are also subject to selection from regional coordinated transportation plans, and applicants for WSDOT's public transportation grant program are required to participate in the planning process with their local regional transportation planning organization or metropolitan planning organization. It is WSDOTs policy to require that all state and federally funded projects awarded through the Consolidated Grant Program come from the region’s coordinated plan. This policy continues under MAP-21.
1 Federal Register: March 15, 2006 (Volume 71, Number 50, page 13458)

Washington Statewide Human Services Transportation Plan July 2013
Contact: Don Chartock, WSDOT Rural & Coordinated Transportation Administrator 13 [email protected], 360-705-7928
Regional Transportation Planning Organizations
Regional transportation planning organizations are responsible for developing local human services transportation plans and facilitate prioritization of local projects. WSDOT has developed requirements for RTPOs wishing to receive federal funds. There are 14 RTPOs within the state:
Benton-Franklin-Walla Walla RTPO
North Central RTPO Northeast Washington RTPO Palouse RTPO Peninsula RTPO Puget Sound Regional Council Quad County RTPO
Skagit-Island RTPO Southwest Washington RTPO Southwest Washington Regional
Transportation Council Spokane Regional Transportation Council Thurston Regional Planning Council Whatcom Council of Governments Yakima Valley Conference of Governments
Coordinated Public Transit-Human Services Transportation Plans
A key task for this project was to review the most recent coordinated public transit-human services transportation plans as completed by local RTPOs and San Juan County. San Juan County is not formally affiliated with an RTPO; however county projects are prioritized within the San Juan County HSTP.
The purpose in reviewing these 15 documents was twofold: First, there is interest in identifying key themes or common issues (especially in respect to unmet transportation needs) expressed in the plans throughout the state; another goal for the reviewing the plans is to identify any interesting or unique elements to the planning process itself in order to include them as best-practice examples in the Statewide HSTP.
Most of the original coordinated plans were completed in 2006-2007, and subsequent updates were prepared in 2009-2010. The most recent plan updates were reviewed as part of this process. In some cases, there were significant revisions between the original plan document and its update, but for the most part, the updates were similar in style and content to the original plans.
The 15 plan documents were reviewed using a common review matrix in order to ensure the plans were reviewed as consistently as possible. Of the 15 plans, five represented a single county, while 10 represented two or more counties. One of the plans reviewed (San Juan County)2 did not originally prepare a plan in 2006, and one plan (Spokane County) did not complete an update. In the latter’s case, the original plan document was reviewed.
The following key findings were developed as a result of reviewing the plan documents:
2 San Juan County is the only county in Washington not affiliated with a RTPO.

Washington Statewide Human Services Transportation Plan July 2013
Contact: Don Chartock, WSDOT Rural & Coordinated Transportation Administrator 14 [email protected], 360-705-7928
While 10 plans covered two or more counties, most of these plans were organized in such a way as to present information that is county-specific, rather than regional in nature.
In support of the needs assessment, all plan documents included demographic analyses and maps. At a minimum, U.S. Census data were included to illustrate the presence of older adults, persons with disabilities, and those living at poverty level. Some plan documents included other data, such as major employers, households without cars, or travel and commute patterns.
Approaches to completing the needs assessments varied. Some plan documents relied heavily on data, while others were less formal, and developed from consultation with stakeholders or workshops convened with providers and other key players.
Strategies don’t always equate to projects. One of the required planning elements is to identify and prioritize strategies intended to mitigate the unmet needs. While each plan document did identify and include these strategies, plans did not always result in project applications to WSDOT.
Few plans included an update on status of previous projects or highlighted accomplishments since the original plan was completed.
The most common approaches described to solicit stakeholder involvement included convening workshops, holding forums, and establishing advisory committees to meet on a regular basis throughout the planning process. A few plans included surveys of riders or providers in order to document needs, or to identify potential opportunities for coordination. A few plans sought more informal input by attending community events such as fairs, markets, or senior center activities.
The needs identified by plans were relatively consistent throughout state. A wide range of potential strategies were identified though not all presented methodology for identifying strategies or described prioritization process.
Native Americans
Washington is home to 29 federally recognized Tribes. Nineteen of these Tribes provide, or partner with existing transit operators to provide transit services to tribal members and the general public. Additionally, the Confederated Tribes of the Umatilla Indian Reservation located in Oregon, provides transit services into south central Washington. Currently, five other tribes in Washington have expressed an interest in developing a program.
Tribes provide a diverse range of transit services including, fix routes, deviated fixed routes (flex routes), dial-a-ride, and carpool/rideshare programs. These programs often provide a critical link between rural areas and essential services such as medical appointments and employment in adjacent cities. Tribal governments and their enterprises are among the largest employers in their respective counties. A significant number of these employees are non-tribal members who live off-reservation. Tribal Transit Programs help to improve safety on rural roadways and encourage economic development in and around tribal lands.
These programs are most often funded through the Tribal Transit Program under MAP-21, federal and state transit grants, revenue from tribal fuel tax agreements and tribal hard dollars.

Washington Statewide Human Services Transportation Plan July 2013
Contact: Don Chartock, WSDOT Rural & Coordinated Transportation Administrator 15 [email protected], 360-705-7928
Planners should take the needs of the tribes into consideration. Information from the census is below, but should not be considered the only information about tribal populations. Concerns have been raised about undercounting of tribal members in the census.
The demographics data shown in Table 3 below come from the 2010 decennial census. The measure is self-reported ethnicity of those that are fully or partly Native American. The tribes have identified the need for additional transportation services for their members on many occasions throughout the planning process.
Table 3 – Native American Status
County Total Rate County Total Rate County Total Rate
Adams 500 2.5% Grays Harbor 4,900 6.8% Pierce 25,400 3.2%
Asotin 600 2.7% Island 1,700 2.2% San Juan 300 2.0%
Benton 3,200 1.8% Jefferson 1,300 4.2% Skagit 4,000 3.5%
Chelan 1,400 1.9% King 39,100 2.0% Skamania 400 3.4%
Clallam 5,300 7.4% Kitsap 8,600 3.4% Snohomish 19,100 2.7%
Clark 9,000 2.1% Kittitas 900 2.2% Spokane 14,300 3.0%
Columbia 100 2.6% Klickitat 800 4.1% Stevens 3,400 7.8%
Cowlitz 3,400 3.4% Lewis 2,300 3.1% Thurston 7,800 3.1%
Douglas 700 1.9% Lincoln 300 3.0% Wahkiakum 100 3.7%
Ferry 1,500 20.4% Mason 3,600 5.9% Walla Walla 1,200 2.0%
Franklin 1,000 1.3% Okanogan 5,600 13.5% Whatcom 8,500 4.2%
Garfield 0 0.0% Pacific 900 4.5% Whitman 800 1.8%
Grant 2,100 2.3% Pend Oreille 700 5.7% Yakima 13,900 5.7%
Note: Red indicates that county ranks within the top 25% statewide for that measure.

Washington Statewide Human Services Transportation Plan July 2013
Contact: Don Chartock, WSDOT Rural & Coordinated Transportation Administrator 16 [email protected], 360-705-7928
Figure 3 – Federally Recognized Tribes of Washington State
Washington Transportation Plan 2030
The Washington Transportation Plan 2030, adopted by the Washington State Transportation Commission in December 2010, is a comprehensive statewide transportation policy plan that establishes a long-range vision for meeting the needs of the state’s multimodal transportation system. The WTP sets forth the following six policy goals, in no particular order, for future investments in the transportation system:
Economic vitality Preservation Safety
Mobility Environment Stewardship
Within the “mobility” policy goal, the WTP identifies two strategies and recommended actions that directly address human services transportation.
Strategically prepare to meet the needs of an aging population Support transportation for special needs populations

Washington Statewide Human Services Transportation Plan July 2013
Contact: Don Chartock, WSDOT Rural & Coordinated Transportation Administrator 17 [email protected], 360-705-7928
The recommended actions identified in the WTP to address the two strategies provide a range of options for meeting the statewide needs and generally include education and outreach, regional coordination, considering unique needs of rural populations, and promote universal design principles for capital improvements that address all modes and users.
The WTP policy goals provide an umbrella for all the state’s other transportation related plans, as wells as the RTPO regional transportation plans. The Statewide HSTP priorities identified in Section 5 align with these WTP policy goals.
Moving Washington
Moving Washington is WSDOT’s three-pillar investment and prioritization strategy. The three pillars – operate efficiently, manage demand, and add capacity strategically – were adopted to meet the growing and changing transportation needs of Washington state, while recognizing the limited capacity of the state to fund transportation improvements. These pillars are underscored by reliable, responsible and sustainable business practices and were built around WSDOT’s primary mission to maintain the existing transportation system and keep the traveling public safe.
Operate Efficiently – Promoting projects that improve efficiency and safety of the existing transportation system, using technology to smooth traffic flows on freeways, and reducing congestion causing collisions are all ways that WSDOT is operating the transportation system more efficiently.
Manage Demand – Offering commuters more choices, such as convenient bus service, incentives to carpool or vanpool or safe walking and biking options are all ways of reducing demand. Providing commuter with better traffic information allows commuters to use alternate travel options or delay travel until congestion has decreased.
Add Capacity Strategically – Adding capacity strategically focuses investments on high-return projects like bottlenecks. By focusing on bottlenecks, the most congested points in the transportation system are alleviated, making the whole transportation system operate more efficiently with limited investment.
Corridor Approach
Part of Moving Washington is the broader focus around transportation corridors. This approach considers multiple facilities, transportation modes, investment strategies, jurisdictions, system users, and land use to better understand the complexities of moving people and goods through a corridor, rather than along a specific roadway. Moving Washington’s corridor approach is fundamentally about looking at the transportation system needs holistically to look beyond jurisdictional boundaries and capacity constraints to strategically fund projects and programs that address the overall mobility of people and freight.
Figure 4 - Moving Washington

Washington Statewide Human Services Transportation Plan July 2013
Contact: Don Chartock, WSDOT Rural & Coordinated Transportation Administrator 18 [email protected], 360-705-7928
While the strategies identified by the corridor approach in Moving Washington may not directly transfer to human services transportation, the underlying approach of holistic solutions does. Moving Washington addresses how users perceive and use the transportation system to improve travel efficiency and safety.
Moving Washington Approach in the Current Human Services Environment
In the current funding environment human service transportation systems are struggling to maintain existing service levels. Declining revenues and increasing operating costs have forced transit agencies and human services providers to reduce services; inconsistency in fuel prices and local policies have left most agencies unable to modify fares to adjust to these fluctuations; and overall cost for agencies continue to rise. The prospects for major expansion of geographic coverage or services has been trumped by the struggle to maintain the core of existing services and provide basic transportation services to those who need it most. The idea of a more integrated and strategic approach to identifying, prioritizing, and funding human service transportation improvements is fundamental to sustaining these key transportation needs through the corridor approach.

Washington Statewide Human Services Transportation Plan July 2013
Contact: Don Chartock, WSDOT Rural & Coordinated Transportation Administrator 19 [email protected], 360-705-7928
Section 4│ Funding Human Service Transportation This section describes the operating and funding environment for human service transportation service delivery within the state of Washington. It identifies the primary sponsors of human service transportation, and references funding sources as well as regulatory requirements that guide the use of those funds.
The most significant sponsors of special needs transportation programs include:
Public transportation agencies WSDOT Consolidated Grant Program comprised of a variety of federal and state
funds State and federally funded human service programs
For purposes of this plan, attention is primarily placed on those funds that WSDOT can directly influence – state and federal funding dedicated to public transportation. However, it is important, for the sake of the “big picture” to briefly describe the full range of funding sources used for human services transportation. These are described below.
Public Transportation Agencies
Within the State of Washington, there are 30 local governmental public transportation systems3. Of these, seven are systems serving urbanized areas, 11 serve small urban areas, and 12 are systems serving rural areas4. Throughout the state, public transportation provides access for people to get to work, school, medical appointments, and other everyday activities. Many older adults, persons with disabilities, youth and low-income individuals rely on public transit services to meet their mobility needs and do not use specialized services. The use of public transportation is encouraged by two federal requirements:
Discounted Fare Requirement Americans with Disabilities Act
Discounted Fare Requirement
Public transit operators are required to provide a discount of up to 50 percent of the regular fixed route fare, during off-peak hours, to seniors (defined as age 65 or older) and persons with disabilities (definition is locally determined). This discount provides a strong incentive for older adults and persons with disabilities to use the fixed-route transit service if they are able to do so.
32011 Washington State Summary of Public Transportation.http://www.wsdot.wa.gov/Publications/Manuals/PTSummary.htm 4Small urban areas are defined as populations of more than 50,000, but less than 200,000.Washington State Summary of Public Transportation, Page 49. http://www.wsdot.wa.gov/publications/manuals/fulltext/m0000/TransitSummary/SmallUrban.pdf

Washington Statewide Human Services Transportation Plan July 2013
Contact: Don Chartock, WSDOT Rural & Coordinated Transportation Administrator 20 [email protected], 360-705-7928
Americans with Disabilities Act
The Americans with Disabilities Act was enacted in 1990. The ADA is civil rights legislation guaranteeing access to services and programs for persons with disabilities. The law has had significant impact on the provision of public transit for persons with disabilities. The fundamental premise of the ADA is to ensure equal access to the same services and programs for persons with disabilities as enjoyed by other members of the public. As a result, public transit operators have taken numerous steps to ensure their systems are accessible for persons with disabilities, including:
Fixed-route buses must have lifts or ramps so that wheelchair users (or persons with other mobility devices) can use the bus.
Fixed-route buses must have priority seating designated for individuals with disabilities or the elderly.
Transit systems must have voice announcements of stops and stations to help blind or visually impaired people navigate the system.
Existing key rail stations and all new rail stations must be accessible and meet ADA requirements.
Design and construction of new facilities must comply with the ADA requirements.
Public transit providers must make written or other materials available in accessible formats upon request
Some persons with disabilities, however, cannot independently use the fixed-route service even with these accommodations. For these individuals, transit operators are required to provide complementary specialized paratransit services. Specialized paratransit service typically is pre-scheduled transportation provided by accessible van, bus, taxi, or car for people with disabilities who are determined functionally incapable of using fixed-route service. Transit providers must conduct a paratransit eligibility process that conforms to ADA requirements. Although each paratransit provider has unique service characteristics, ADA paratransit services are available for any purpose, and there is no limit to the number of trips an ADA-eligible person may take.
Other Demand Response Transportation
Other specialized paratransit — or demand response — service is another mode of transportation often made available for special needs populations groups. Such services may be operated by a city, community-based nonprofit agency, or a senior center. These services are not obligated to comply with the ADA service standards if comparable fixed-route services are not available. This means that services may be directed to a particular client group (i.e. seniors) or the services may restrict the types or numbers of trips a passenger is entitled to receive.
Some transit agencies in rural communities may provide “general public dial-a-ride,” which is prescheduled service that is available for the general public as well as seniors and persons with disabilities.

Washington Statewide Human Services Transportation Plan July 2013
Contact: Don Chartock, WSDOT Rural & Coordinated Transportation Administrator 21 [email protected], 360-705-7928
Funding Public Transportation and Paratransit Programs and Expenditures by Mode
While a variety of funding sources support the provision of public transit operations within the state of Washington, 94 percent of operating subsidies are generated locally, through local sales or use taxes, as well as fare box and vanpool revenues. Figure 5 illustrates the distribution of revenues that support all (including ADA paratransit) public transportation in Washington.
Figure 5 – Public Transportation Operating and Capital Investment (FY 2010-11)
Source: Washington State Summary of
Public Transportation, 2011, Summary of
Statewide Statistics, Page 11
Figure 6 shows a summary of public transportation expenditures for Fiscal Year 2010-2011 by mode. Specialized paratransit, or demand response services, account for 14 percent5 of the system total when considering all public transit operators, statewide.
Figure 6 – Public Transit Operating Expenditures by Mode (FY 2010-11)
Source: Washington State Summary of
Public Transportation, 2011, Summary of
Statewide Statistics, Page 16
5 Washington State Summary of Public Transportation, 2011, page 16, Operating Expenses by Mode.
Total Local Investment
94%
Total State Investment
1%
Total Federal
Investment 5%
Chart Title
Fixed Route 75%
Route Deviated
2%
Demand Response
14%
Vanpool 2%
Commuter Rail 3%
Light Rail 4% Chart Title

Washington Statewide Human Services Transportation Plan July 2013
Contact: Don Chartock, WSDOT Rural & Coordinated Transportation Administrator 22 [email protected], 360-705-7928
Community Transportation Providers
In addition to public transit agencies, other types of organizations also provide special needs transportation and are supported in part with state or federal transportation dollars allocated through the WSDOT Consolidated Grant Program. These organizations may include transit systems, nonprofit agencies, tribal governments, senior centers, state agencies, cities or counties, special districts, or private for-profit operators.
State Funding
For 2011-2013, WSDOT awarded approximately $41.4 million in state grants through the following programs:
Rural Mobility Grants – $16.7 million
Rural mobility grants improve transportation in rural areas where public transportation is limited or does not exist. The grants provide a lifeline for many rural citizens who rely on public transportation to hold jobs and maintain their independence. Through a competitive grant application process, $8.3 million was awarded to transportation providers in areas not served by transit agencies. Through formula based grants, $8.4 million was also provided to rural and small city transit agencies.
Specialized Paratransit/Special Needs Grants – $24.7 million
Specialized paratransit/special needs grants support public transportation for persons who, because of their age (youth or seniors), disabilities, or income status, are unable to provide or purchase their own transportation. Through a competitive grant application process, $5.4 million was awarded to nonprofit providers of transportation services for the elderly and persons with disabilities. Through formula based grants, another $19.3 million was awarded to assist transit agencies with providing additional public transportation services for people with special transportation needs.
Federal Funding
WSDOT administers funds from several Federal Transit Administration grant programs. For 2009-2011, WSDOT matched state and local funds with FTA funds and administered more than $21.5 million in federal public transportation grants. Those federal grant programs include:
FTA Section 5310 Elderly and Persons with Disabilities Transportation – $2.3 million
Elderly and persons with disabilities transportation grants were awarded to nonprofit agencies serving urban and rural areas. In 2007-2009, approximately $2.3 million was awarded through the competitive grant process to provide vehicles and other equipment.

Washington Statewide Human Services Transportation Plan July 2013
Contact: Don Chartock, WSDOT Rural & Coordinated Transportation Administrator 23 [email protected], 360-705-7928
FTA Section 5311 Rural Public Transportation – $13.3 million
Transportation providers competed for federal rural public transportation grants. Approximately $13.3 million was awarded for capital, operating, and planning activities for public transportation in rural areas.
FTA Section 5311(f) Intercity Bus Transportation – $1.7 million
Approximately $1.7 million in intercity bus transportation grants were awarded for the first fiscal year of the biennium to establish, preserve, and enhance rural and small urban intercity transportation.
FTA Job Access and Reverse Commute (JARC) – $2.9 million
WSDOT started administering job access grants in 2003 and is managing approximately $2.9 million in JARC grants. JARC grants are awarded through a competitive process for employment related transportation. The program recognizes that a lack of transportation prevents people with low income from getting to jobs, education, training, childcare, and other job-related activities.
FTA Section 5317 New Freedom – $2.5 million
Section 5317 funds, which are aimed at reducing barriers to transportation services and expanding mobility options beyond ADA requirements, is a new program started in 2006. It includes transportation to and from jobs and employment support services for persons with disabilities.
State Social Service Agency Programs
State social service agencies are another primary sponsor of human service transportation programs. There are substantial differences in the way state agencies approach transportation funding and planning. For example, WSDOT has a relatively formal process for allocating funds, developing, and approving transportation projects. Transit agencies tend to approach planning from a system design, route structure, and capacity limitation perspective. Human service agencies focus primarily on individual needs and access to services. Client transportation is usually viewed as an ancillary service; that is, transportation is a means to gain access to a primary service. Therefore, transportation is not always considered in an agency’s budget, or may not be delineated as a line-item; as a result, the true costs of providing transportation may not be known.
Medical Transportation Programs
While there are multiple state agencies that fund and/or sponsor transportation for their clients, by far the most significant program is one funded through the Washington State Health Care Authority (HCA) for the provision of medical non-emergency transportation, consistent with federal Medicaid program requirements.

Washington Statewide Human Services Transportation Plan July 2013
Contact: Don Chartock, WSDOT Rural & Coordinated Transportation Administrator 24 [email protected], 360-705-7928
Medicaid is a federal entitlement program that pays for basic health services for people with low-income and long-term care for seniors and persons with disabilities. States administer their own Medicaid programs. The federal government requires states to provide non-emergency medical transportation (NEMT) for those Medicaid eligible persons who could not otherwise access medical facilities and services.
In Washington State, this transportation is arranged through regional brokerages under contract to HCA. Brokers are responsible for screening client and trip eligibility, determining appropriate transportation mode (including fixed-route or public paratransit service), soliciting and managing service partners, and managing other administrative aspects of the program. Table 4 identifies which of the six brokers operate in each county.
Table 4 – Medicaid Transportation Broker by County
County Broker
County Broker Adams Special Mobility Services Klickitat Human Services Council Asotin Special Mobility Services Lewis Paratransit Services Benton People for People Lincoln Special Mobility Services Chelan People for People Mason Paratransit Services Clallam Paratransit Services Okanogan People for People Clark Human Services Council Pacific Paratransit Services Columbia People for People Pend Oreille Special Mobility Services Cowlitz Human Services Council Pierce Paratransit Services
Douglas People for People San Juan Northwest Regional Council/Area Agency on Aging
Ferry Special Mobility Services Skagit Northwest Regional Council/Area Agency on Aging
Franklin People for People Skamania Human Services Council Garfield Special Mobility Services Snohomish Hopelink Grant Special Mobility Services Spokane Special Mobility Services Grays Harbor Paratransit Services Stevens Special Mobility Services
Island Northwest Regional Council/Area Agency on Aging Thurston Paratransit Services
Jefferson Paratransit Services Wahkiakum Human Services Council King Hopelink Walla Walla People for People
Kitsap Paratransit Services Whatcom Northwest Regional Council/Area Agency on Aging
Kittitas People for People Whitman Special Mobility Services

Washington Statewide Human Services Transportation Plan July 2013
Contact: Don Chartock, WSDOT Rural & Coordinated Transportation Administrator 25 [email protected], 360-705-7928
In 2011, nearly 3 million NEMT trips were provided at a cost of $74.3 million6. The program is jointly funded with federal and state funds.
For the most part, Medicaid and public specialized paratransit services operate independently of each other and independently of public paratransit programs, though there are ongoing efforts to better coordinate them. In addition, some medical clinics or hospitals may offer client-specific transportation to their facilities. Again, it is unknown how much funding is dedicated through these programs.
Federal Transportation Funding Under Map-21
Pursuant to requirements of federal transportation rules established through the passage of SAFETEA-LU in 2005, the approval of three sources of federal funds (Sections 5310, 5316 and 5317) has been contingent upon specific projects included in a coordinated public transit-human services transportation plan. SAFETEA-LU was replaced by new federal legislation, Moving Ahead for Progress in the 21st Century (MAP-21), which was signed by President Obama on July 6, 2012 and took effect on October 1, 2012. MAP- 21 reauthorizes surface transportation programs through fiscal year 2014, and has resulted in some changes related or relevant to human service transportation and coordinated transportation planning7.
Figure 7 – Highlight of Program Changes
6 Source: WSDOT 2011 Summary of Public Transportation 7 Sources include: Map-21 Transit Programs Summary, and Map-21 Program Overview: PowerPoint on http://www.fta.dot.gov/map21/,

Washington Statewide Human Services Transportation Plan July 2013
Contact: Don Chartock, WSDOT Rural & Coordinated Transportation Administrator 26 [email protected], 360-705-7928
Highlights of program changes under Map-21 include:
Emphasizes safety, state of good repair, performance, and program efficiency Gives FTA new authority to strengthen safety of public transportation systems
(additional authority to set minimum safety standards, conduct investigations, audits and examinations; overhauls state safety oversight)
Focuses on restoring and replacing aging public transportation infrastructure by establishing a new needs-based formula program and new asset management requirements
New reporting requirements Establishes performance-based planning requirements that align federal funding with
key goals and tracks progress towards these goals and requires performance measures for state of good repair, planning and safety
Consolidates several programs
Urbanized Area Formula Grants (5307)
The largest of FTA’s grant programs, Urbanized Area Formula Grants are available to urbanized areas to support public transportation. Funding is distributed by formula based on the level of transit service provision, population, and other factors. Total funding is $4.9 billion in FY 2013 and $5 billion in FY 2014 (includes the Growing States and High Density States formula). The FY 2013 apportionments include $18.3 million for urbanized areas in Washington as detailed in Table 5
Table 5 – Urbanized Areas Formula Grants (FY 2013)
Washington State Urbanized Areas Grant Funding
Bellingham, WA $2,689,154 Bremerton, WA $3,183,305 Kennewick-Pasco, WA $8,636,438 Lewiston, ID/WA $269,299 Longview, WA/OR $902,934 Marysville, WA $1,922,696 Mount Vernon, WA $1,601,124 Olympia-Lacey, WA $3,024,032 Seattle, WA $95,509,197 Spokane, WA $7,664,827 Walla Walla, WA/OR $691,981 Wenatchee, WA $1,708,926 Yakima, WA $2,330,481 Statewide Total $130,134,394

Washington Statewide Human Services Transportation Plan July 2013
Contact: Don Chartock, WSDOT Rural & Coordinated Transportation Administrator 27 [email protected], 360-705-7928
The program remains largely unchanged with a few exceptions:
Job access and reverse commute activities now eligible: Activities eligible under the former Job Access and Reverse Commute (JARC) program, which focused on providing services to low-income individuals to access jobs, are now eligible under the Urbanized Area Formula program. Operating assistance can be provided with a 50 percent local match, and capital assistance with a 20 percent local match. In addition, the urbanized area formula for distributing funds now includes the number of low-income individuals as a factor. There is no floor or ceiling on the amount of funds that can be spent on job access and reverse commute activities, and federal law no longer requires projects to be derived from a coordinated transportation plan, however WSDOT policy does.
Expanded eligibility for operating expenses for systems with 100 or fewer buses: MAP-21 expands eligibility for using Urbanized Area Formula funds for operating expenses. Previously, only urbanized areas with populations below 200,000 were eligible to use Federal transit funding for operating expenses.
New discretionary passenger ferry grants: $30 million per year is set aside from the urban formula program totals to support passenger ferries. Funding will be awarded on a competitive selection basis.
New takedown for safety oversight: MAP-21 sets aside one half of one percent (approximately $22 million per year) of Urbanized Area Formula funds for State safety oversight grants.
Rural Area Formula Grants (5311)
This program provides capital, planning, and operating assistance to support public transportation in rural areas, defined as areas with fewer than 50,000 residents. Funding is based on a formula that uses land area, population, and transit service. Total funding is $600 million in FY 2013 and $608 million in FY 2014. The FY 2013 apportionments include $12.2 million for Washington. The program remains largely unchanged with a few exceptions:
Job access and reverse commute activities eligible: Activities eligible under the former Job Access and Reverse Commute (JARC) program, which provided services to low-income individuals to access jobs, are now eligible under the Rural Area Formula program. In addition, the formula now includes the number of low-income individuals as a factor. There is no floor or ceiling on the amount of funds that can be spent on job access and reverse commute activities.
Tribal Program: The Tribal program now consists of a $25 million formula program and a $5 million discretionary grant program. Formula factors include vehicle revenue miles and the number of low-income individuals residing on tribal lands.
Other changes: The set-aside for States for administration, planning, and technical assistance is reduced from 15 to 10 percent. The cost of the unsubsidized portion of privately provided intercity bus service that connects feeder service is now eligible as in-kind local match.

Washington Statewide Human Services Transportation Plan July 2013
Contact: Don Chartock, WSDOT Rural & Coordinated Transportation Administrator 28 [email protected], 360-705-7928
Enhanced Mobility of Seniors and Individuals with Disabilities (5310 and 5317)
This program provides formula funding to increase the mobility of seniors and persons with disabilities. Funds are apportioned based on each state’s share of the targeted populations and are now apportioned to both states (for all areas under 200,000) and large urbanized areas (over 200,000). The former New Freedom program (5317) is folded into this program.
The New Freedom program provided grants for services for individuals with disabilities that went above and beyond the requirements of the Americans with Disabilities Act. Activities eligible under New Freedom are now eligible under the Enhanced Mobility of Seniors and Individuals with Disabilities program. Project requirements are listed below.
Selected projects must be included in a locally developed, coordinated public transit-human services transportation plan; and the competitive selection process, which was required under the former New Freedom program, is now optional under federal law, however WSDOT still requires competitive selection through the regional Human Services Transportation Plan process.
At least 55 percent of program funds must be spent on the types of capital projects eligible under the former section 5310 -- public transportation projects planned, designed, and carried out to meet the special needs of seniors and individuals with disabilities when public transportation is insufficient, inappropriate, or unavailable. The remaining 45 percent may be used for: public transportation projects that exceed the requirements of the ADA; public transportation projects that improve access to fixed-route service and decrease reliance by individuals with disabilities on complementary paratransit; or, alternatives to public transportation that assist seniors and individuals with disabilities.
Using these funds for operating expenses requires a 50 percent local match while using these funds for capital expenses (including acquisition of public transportation services) requires a 20 percent local match.
Requires FTA to establish performance measures Funding: $255 million (FY 2013) authorized with the FY 2013 apportionments
including $2.8 million for Washington urbanized areas with 200,000 or more in population, $1.8 million for Washington urbanized areas with 50,000 to 199,999 in population, and $894,000 for Washington non-urbanized areas with less than 50,000 in population.
Additional information related to MAP-21 is available on the FTA website at http://www.fta.dot.gov/map21.
Significance of Map-21 Changes
The changes to the federal transportation legislation will have an impact on how WSDOT administers these grant program, and on potential program applicants. The full extent of the

Washington Statewide Human Services Transportation Plan July 2013
Contact: Don Chartock, WSDOT Rural & Coordinated Transportation Administrator 29 [email protected], 360-705-7928
program implications and details on grant administration are yet to be determined; however, some key findings are noted below.
One additional year of dedicated JARC and New Freedom funding remains to be allocated; as of FY 2013-14, these programs will have no new funding associated with them;
WSDOT will continue to consider job-related projects as eligible applicants for Section 5311 eligible applicants, but does not anticipate establishing them as priority projects — they will compete with other Section 5311 applications;
Although not required by federal legislation, WSDOT will continue to require that all 5311 projects, including job access related projects, be derived from a coordinated public transit-human services transportation plan;
Despite not having dedicated JARC funding beginning in FY 2013-14, WSDOT estimates the total amount of 5311 funds available for the state will actually increase slightly. This is because of a change in the way the formula determines program allocations, and because Washington State’s rural population has increased;
MAP-21 requires that 55 percent of the new Section 5310 program funds be dedicated to capital expenditures to assist elderly and disabled persons; the remaining 45 percent can be spent for operations. This represents a significant departure from previous rules, which allowed funds to be spent for operations only under a more restricted “purchase of service” arrangement, which was not implemented in Washington State;
Section 5310 funds will no longer be administered on a statewide basis by WSDOT. Instead, funding allocations will be per the following allocations:
o 60 percent to designated recipients in urbanized areas with a population over 200,000
o 20 percent to states for small urbanized areas o 20 percent to states for rural areas
It is estimated that 60 percent of the state’s Section 5310 funding will be available for urbanized areas; of this amount, 90 percent will be targeted to the Seattle area through the Puget Sound Regional Council;
Transit agencies may be eligible recipients of Section 5310 funding. Again, this represents a significant change since previously priority for use of these funds was to private nonprofit agencies;
MAP-21 continues to consider “mobility management” projects as capital investments, meaning a lower (20 percent) local match is required. However, it is not clear whether the use of mobility management projects will count towards the requirement that 55 percent of Section 5310 funds be dedicated for capital projects.
WSDOT is currently in the process of conducting a statewide application process for the Consolidated Grant Program, for funding beginning July 1, 2013, through June 30, 2015. Staff will be working with its Advisory Committee and other local stakeholders to further define how new requirements will impact the overall program.

Washington Statewide Human Services Transportation Plan July 2013
Contact: Don Chartock, WSDOT Rural & Coordinated Transportation Administrator 30 [email protected], 360-705-7928
Section 5│ Statewide Human Services Transportation Planning Framework
This section of the report establishes the planning framework which informs the development of recommended strategies to improve transportation services, programs and policies in Washington State.
Current demographic information is presented to illustrate the presence of special needs populations.
A needs assessment is presented as identified by local stakeholders through listening sessions and based on the demographic analysis.
Priority Strategies as identified by key project stakeholders are discussed.
Current Demographics Summaries The provision of human service transportation, perhaps more so than most other segments of the transportation system, is directly linked to the needs and circumstances of the user population. For example, persons with disabilities often experience limitations to their mobility, and may require improvements or adaptations to be able to access the public transportation system; or, they may require specialized services such as door-to-door service. Likewise, older adults are more likely to experience frailty or disabling conditions as they age; or, as they cease driving, may need to learn how to use the regular transit system.
People with low income may be dependent upon public transportation because they cannot afford an automobile. Low-income workers may face challenges if they need to get to and from work during nontraditional commute hours or if they live or work in areas poorly served by transit. Transportation for dependents such as transportation of children to childcare services can also increase transportation need.
Therefore, it is important to better understand the circumstances and challenges users of human services transportation face in order to develop a holistic picture of need, how it varies throughout the state, and what factors contribute to demand for service.
The most complete and accurate data source for demographic information specific to these population groups is available through the United State Census Bureau’s American Community Survey (ACS), the 2010 Decennial Census and the U.S. Bureau of Labor Statistics. Eight demographic indicators were compiled for all 39 counties in Washington State. The demographic measures include:
Disability status Population older than 65 No access to vehicles Low income
Unemployment status Veteran status Native American Linguistically isolated households

Washington Statewide Human Services Transportation Plan July 2013
Contact: Don Chartock, WSDOT Rural & Coordinated Transportation Administrator 31 [email protected], 360-705-7928
This data were presented in table and map format both in terms of total count per county as well as percent of total county population. These measures capture two different challenges. Absolute counts highlight areas with overall high need due to large populations in urbanized regions. Percent of total county population, the second measure, highlights areas with high rates relative to the county’s population, often an issue in the state’s smaller counties. If a county ranks high in both measures for a given demographic indicator, it means that the county has both a large over all need and a high rate relative to total county population. To highlight counties with the highest overall or relative needs each measure is shown in red when that measure ranks within the top 25 percent statewide.
While a direct link between the need for human services transportation and these demographic measures is not asserted or quantified, and overlap between measures likely occurs, the eight measures were selected to help paint a full picture of demographic differences across the state.
Statewide Summary Table 6 is a statewide and national summary of the eight demographic measures included in this section. The statewide population, or number of households, is shown as well as the statewide rate. Statewide rates are also compared to national rates. Not all measures use the same base measure, such as total population or total households. These details are explained in more detail later in this section.
Compared to national averages, Washington State has a higher rate of veterans, exceeding the national average by 2.4 percent. The state’s disability status, population aged 65 and older, and unemployment rate are all roughly within 1 percent of the national averages. The percent of Native Americans and linguistically isolated households are low on a state level and nationally, with the state having a lower average for both measures. Washington State’s rate of low-income individuals is 2.9 percent below the national average and access to vehicle 2.4 percent below the national average.
Table 6 – Washington State and National Demographics Data
Statewide Total (Unit depends on
measure)
Count (Unit depends on
measure)
Percent of Washington State Total
National Percentage
Disability Status 5,395,000 981,000 18.2% 19.3%
Population Older than 65 6,561,000 781,000 11.9% 12.7%
No Access to Vehicle 2,577,000 168,000 6.5% 8.9%
Low Income 6,430,000 1,286,000 20.0% 22.9%
Unemployed1 3,509,000 295,000 8.4% 8.0%
Veterans 4,949,000 608,000 12.5% 10.1%
Native American 6,561,000 84,000 1.3% 1.6%
Linguistically Isolated 2,512,000 105,000 4.2% 4.7%
1. Bureau of Labor Statistics, May 2012 non-seasonally adjusted.

Washington Statewide Human Services Transportation Plan July 2013
Contact: Don Chartock, WSDOT Rural & Coordinated Transportation Administrator 32 [email protected], 360-705-7928
Disability Status
The demographic data shown in Table 7, which follows, come from the 2000 decennial census. More recent data from the ACS was not available for all 39 counties due to a change in the ACS in 2005. The 2011 5-year ACS should contain data for all counties. Disability status is self-reported and includes all disabilities. Disability status, especially related to those with limited mobility or sight are a good indicator of those that likely have a higher demand for human services transportation. Figure 8 and Figure 9 show the geographic distribution of the data contained in Table 7.
Statewide, 18.2 percent of the population has a disability. Pacific County has the highest rate of disability at 27 percent, while Whatcom County has the lowest rate at 16 percent. No county ranks in the top quartile statewide for both population and percentage of county population with a disability. If a county did, it would indicate a high overall need as well as disproportionately high need relative to total population.
Figure 8 illustrates that the largest numbers of people with disability are in the most populace counties, including the Puget Sound region as well as Clark, Spokane, Whatcom, and Yakima counties; however, in general these counties have disability rates closer to the statewide average.
Figure 9 illustrates that the highest rates of disability are in coastal counties as well as counties in the northeast and southeast of the state.
Table 7 – Disability Status by County
County Total Rate County Total Rate
County Total Rate
Adams 3,000 20% Grays Harbor
15,100 24% Pierce 123,600 20%
Asotin 4,300 23% Island 10,500 17% San Juan 2,300 17%
Benton 23,700 18% Jefferson 4,700 19% Skagit 18,300 19%
Chelan 11,700 19% King 259,800 16% Skamania 1,600 18%
Clallam 13,800 23% Kitsap 36,900 18% Snohomish 93,100 17%
Clark 55,600 18% Kittitas 5,800 18% Spokane 72,700 19%
Columbia 900 25% Klickitat 3,800 21% Stevens 7,500 20%
Cowlitz 18,500 22% Lewis 15,100 24% Thurston 35,800 19%
Douglas 5,500 18% Lincoln 2,100 22% Wahkiakum 800 23%
Ferry 1,600 23% Mason 10,000 23% Walla Walla 10,300 21%
Franklin 9,100 21% Okanogan 7,600 21% Whatcom 24,100 16%
Garfield 500 20% Pacific 5,400 27% Whitman 4,800 12%
Grant 13,300 20% Pend Oreille 2,900 26% Yakima 44,700 22%
Note: Red indicates that county ranks within the top 25% statewide for that measure.

Washington Statewide Human Services Transportation Plan July 2013
Contact: Don Chartock, WSDOT Rural & Coordinated Transportation Administrator 33 [email protected], 360-705-7928
Figure 8 – Population with a Disability
Figure 9 – Percent of Population with a Disability

Washington Statewide Human Services Transportation Plan July 2013
Contact: Don Chartock, WSDOT Rural & Coordinated Transportation Administrator 34 [email protected], 360-705-7928
Population Older than 65
The demographic data shown in Table 8 below come from the 2005-2010 five-year ACS. As seniors age, their mobility becomes more challenging. As the rate of people older than 65 increases, so does demand for transit and specialized paratransit services. Figure 10 and Figure 11 show the geographic distribution of the data contained in Table 8.
Statewide 11.9 percent of the population is older than 65. Garfield and Wahkiakum counties have the highest percent of people older than 65 at 25 percent, while Franklin County has the lowest rate at just 7 percent. No county ranks in the highest quartile for both population and percentage of county older than 65.
Figure 10Figure shows that counties with the largest populations also have the largest number of people over 65. The largest counties all have a disability rate between 10 to 13 percent, which is similar to the statewide average.
Figure 11 that counties with the highest rates of people over 65 are in coastal counties, northeastern counties and southeastern counties.
County Total Rate County Total Rate County Total Rate
Adams 1,900 10% Grays Harbor 11,400 16% Pierce 83,600 11%
Asotin 4,000 19% Island 13,700 17% San Juan 3,300 21%
Benton 19,200 11% Jefferson 7,200 24% Skagit 17,900 16%
Chelan 10,800 15% King 198,400 11% Skamania 1,400 13%
Clallam 16,400 23% Kitsap 31,200 13% Snohomish 68,700 10%
Clark 44,900 11% Kittitas 4,900 12% Spokane 58,500 13%
Columbia 800 20% Klickitat 3,500 17% Stevens 7,000 16%
Cowlitz 15,000 15% Lewis 12,400 17% Thurston 30,500 13%
Douglas 4,900 13% Lincoln 2,200 21% Wahkiakum 1,000 25%
Ferry 1,400 18% Mason 10,400 18% Walla Walla 8,600 15%
Franklin 5,300 7% Okanogan 6,500 16% Whatcom 25,000 13%
Garfield 600 25% Pacific 5,000 24% Whitman 4,100 9%
Grant 10,000 12% Pend Oreille 2,300 18% Yakima 27,000 11%
Note: Red indicates that county ranks within the top 25% statewide for that measure.
Table 8 – Population Older than 65
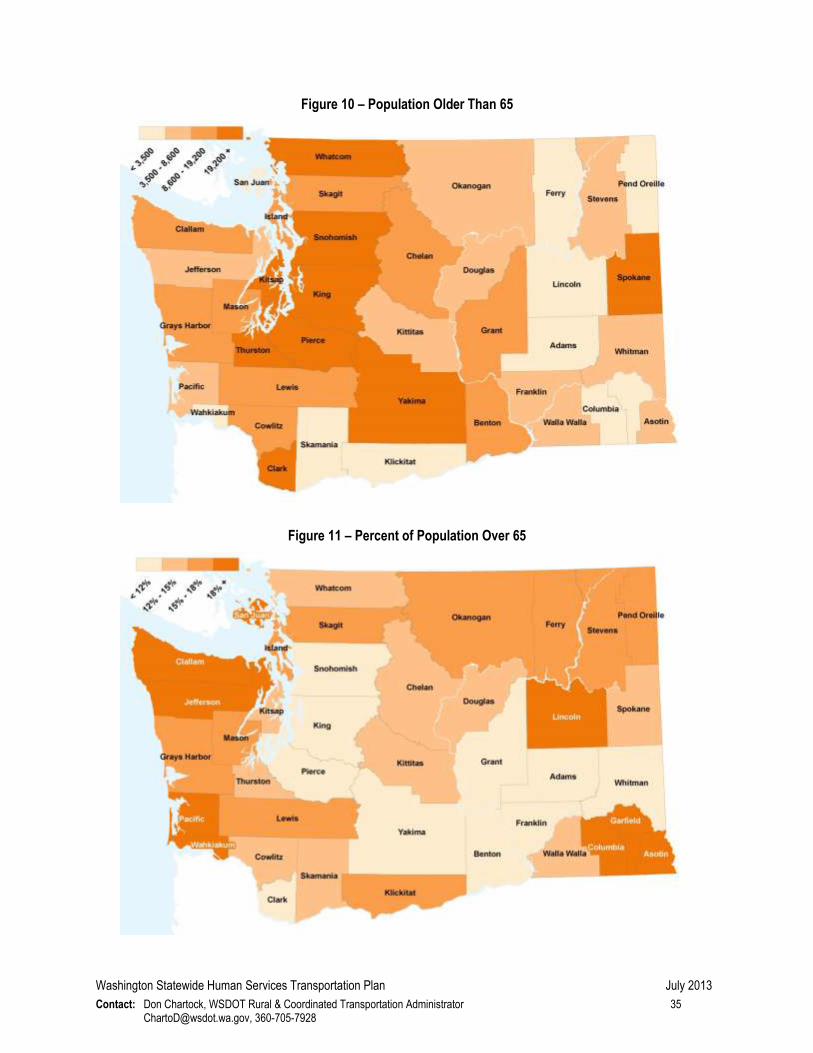
Washington Statewide Human Services Transportation Plan July 2013
Contact: Don Chartock, WSDOT Rural & Coordinated Transportation Administrator 35 [email protected], 360-705-7928
Figure 10 – Population Older Than 65
Figure 11 – Percent of Population Over 65

Washington Statewide Human Services Transportation Plan July 2013
Contact: Don Chartock, WSDOT Rural & Coordinated Transportation Administrator 36 [email protected], 360-705-7928
No Access to Vehicle
The demographic data illustrated in Table 9 below come from the 2005-2010 five-year ACS. “No access to vehicles” means no one within a household owns or has access to a vehicle. Households with no access to vehicles have a higher demand for alternative modes of transportation including but not limited to human services transportation. Other modes such as fixed-route transit service, walking, biking, carpooling, and vanpooling are also important to these households. Households may not have access to a vehicle either by choice or due to financial or physical limitations. Figure 12 and Figure 13 illustrate the geographic distribution of the data contained in Table 9.
Statewide 6.5 percent of households have no access to a vehicle. King County has the highest rate of households with no access to a vehicle at 9 percent, while Douglas, Ferry and Lincoln counties have the lowest rates at just 2 percent of households. King, Spokane, and Whatcom counties all score within the top quartile for both households and percentage of county households with no access to a vehicle.
Figure 12 illustrates that counties with the most urban populations also have the greatest number of households without access to vehicles. illustrates that a mixture of counties have the highest percentage of households without access to vehicles, including several coastal counties, King and Spokane counties as well as Whatcom, Kittitas and Whitman counties likely due to the presences of major universities.
Table 9 – No Access to Vehicle
County Total Rate
County Total Rate
County Total Rate
Adams 200 3.1% Grays Harbor 1,900 6.7% Pierce 16,500 5.6%
Asotin 500 5.4% Island 1,000 2.9% San Juan 400 4.7%
Benton 3,100 4.9% Jefferson 700 5.1% Skagit 2,100 4.6%
Chelan 1,700 6.3% King 70,200 9.0% Skamania 200 3.4%
Clallam 1,800 5.8% Kitsap 5,200 5.4% Snohomish 12,000 4.6%
Clark 7,000 4.5% Kittitas 1,100 6.7% Spokane 13,300 7.2%
Columbia 100 5.8% Klickitat 400 4.9% Stevens 900 5.1%
Cowlitz 2,800 7.1% Lewis 1,400 4.8% Thurston 4,800 4.8%
Douglas 300 2.0% Lincoln 100 2.1% Wahkiakum 100 3.5%
Ferry 100 2.3% Mason 900 4.1% Walla Walla 1,400 6.5%
Franklin 1,300 6.2% Okanogan 900 5.4% Whatcom 5,300 6.8%
Garfield 0 5.1% Pacific 600 6.6% Whitman 1,100 6.8%
Grant 1,900 6.4% Pend Oreille 400 6.4% Yakima 4,500 5.7%
Note: Red indicates that county ranks within the top 25% statewide for that measure.

Washington Statewide Human Services Transportation Plan July 2013
Contact: Don Chartock, WSDOT Rural & Coordinated Transportation Administrator 37 [email protected], 360-705-7928
Figure 12 – Households with No Access to Vehicle
Figure 13 – Percent of Households with No Access to Vehicles

Washington Statewide Human Services Transportation Plan July 2013
Contact: Don Chartock, WSDOT Rural & Coordinated Transportation Administrator 38 [email protected], 360-705-7928
Low Income
The demographic data shown in Table 10 below come from the 2005-2010 five-year ACS. Low income is defined as individuals at or below 150 percent of poverty level, as determined by the U.S. Census. Individuals with a low income have fewer financial resources to meet their needs and since transportation is a significant cost for most households’ low-income status indicates individuals who are more reliant on transit and other low-cost or free modes to meet their mobility needs. Figure 14 and Figure 15 show the geographic distribution of the data contained in Table 10.
Statewide 20 percent of the population is determined to be low income. The highest rate is in Adams County with 40 percent, while the lowest rate is in Snohomish County at 14 percent. Only Yakima County ranks within the top quartile for both population and percentage of county population that is low income.
Figure 14 shows that counties with the largest populations have the largest total low-income populations. King County, with 297,000 low-income residents, has close to a quarter low-income individuals statewide.
Figure 15 Figure 15 shows that, as a percentage of county population, Eastern Washington counties have the highest rates of low-income individuals, with the Puget Sound region having the lowest rates.
Table 10 – Low Income Individuals
County Total Rate County Total Rate
County Total Rate
Adams 7,000 40% Grays Harbor
19,400 28% Pierce 148,300 20%
Asotin 5,000 24% Island 11,100 15% San Juan 2,800 18%
Benton 35,200 21% Jefferson 6,300 22% Skagit 24,700 22%
Chelan 14,800 21% King 297,900 16% Skamania 2,300 21%
Clallam 16,000 23% Kitsap 38,700 16% Snohomish 98,800 14%
Clark 74,800 18% Kittitas 11,200 30% Spokane 103,900 23%
Columbia 1,000 26% Klickitat 6,300 32% Stevens 11,600 27%
Cowlitz 25,800 26% Lewis 17,700 24% Thurston 39,600 16%
Douglas 10,200 28% Lincoln 2,300 22% Wahkiakum 900 24%
Ferry 2,600 34% Mason 13,600 24% Walla Walla 14,700 28%
Franklin 24,100 34% Okanogan 13,400 34% Whatcom 47,000 25%
Garfield 600 27% Pacific 5,700 27% Whitman 13,900 37%
Grant 27,500 33% Pend Oreille 4,000 31% Yakima 85,200 37%
Note: Red indicates that county ranks within the top 25% statewide for that measure.

Washington Statewide Human Services Transportation Plan July 2013
Contact: Don Chartock, WSDOT Rural & Coordinated Transportation Administrator 39 [email protected], 360-705-7928
Figure 14 – Population in Poverty
Figure 15 – Percent of Population in Poverty

Washington Statewide Human Services Transportation Plan July 2013
Contact: Don Chartock, WSDOT Rural & Coordinated Transportation Administrator 40 [email protected], 360-705-7928
Unemployment Status
Table 11 contains demographic data showing the unemployment status of civilian, non-institutionalized citizens who are currently employable and seeking work but not employed. This data were developed by the U.S. Bureau of Labor Statistics as of May 2012 and are not seasonally adjusted. Figure 16 and Figure 17 show the geographic distribution of the data contained in Table 11.
Statewide the unemployment rate was 8.4 percent in May 2012. That year Grays Harbor County had the highest unemployment rate at 14 percent while San Juan County has the lowest unemployment rate at 6 percent. Clark County is the only county to rank in the top quartile for both population and percentage of county population unemployed.
Figure 16 shows that the total population currently unemployed is highest in the most populace counties; Clark, King, Pierce, Snohomish and Spokane counties each has more than 20,000 unemployed people. Of these five counties, King and Snohomish have unemployment rates below the statewide average.
Figure Figure 17 shows that the highest rates of unemployment are in the southwest and northeast of the state.
Table 11 – Unemployment Status
County Total Rate County Total Rate
County Total Rate
Adams 700 8.8% Grays Harbor
3,900 13.5% Pierce 36,300 9.2%
Asotin 900 8.8% Island 2,700 8.5% San Juan 500 6.4%
Benton 8,300 8.6% Jefferson 1,200 9.8% Skagit 5,500 9.6%
Chelan 3,700 9.3% King 76,800 6.9% Skamania 500 10.6%
Clallam 3,000 10.2% Kitsap 9,400 7.6% Snohomish 30,900 7.9%
Clark 24,000 11.2% Kittitas 1,800 8.6% Spokane 20,700 9.0%
Columbia 200 10.4% Klickitat 1,000 9.9% Stevens 2,000 11.4%
Cowlitz 4,900 11.2% Lewis 3,900 12.7% Thurston 10,400 7.9%
Douglas 1,700 8.2% Lincoln 400 7.9% Wahkiakum 200 12.1%
Ferry 400 13.2% Mason 2,600 10.7% Walla Walla 2,300 7.5%
Franklin 3,600 9.6% Okanogan 2,000 10.0% Whatcom 8,400 7.7%
Garfield 100 7.7% Pacific 1,100 12.0% Whitman 1,400 6.6%
Grant 4,000 9.7% Pend Oreille 600 11.7% Yakima 13,000 10.6%
Note: Red indicates that county ranks within the top 25% statewide for that measure.

Washington Statewide Human Services Transportation Plan July 2013
Contact: Don Chartock, WSDOT Rural & Coordinated Transportation Administrator 41 [email protected], 360-705-7928
Figure 16 – Unemployed Population
Figure 17 – Percent of Population Unemployed

Washington Statewide Human Services Transportation Plan July 2013
Contact: Don Chartock, WSDOT Rural & Coordinated Transportation Administrator 42 [email protected], 360-705-7928
Veteran Status
The demographic data illustrated in Table 12 below come from the Veteran Population Projection Model 2011 developed by the Department of Veteran’s Affairs and the 2010 ACS. This measure illustrates the civilian veteran population above the age of 17. Veterans are a diverse population. Many are able to meet their own transportation needs but some are not due to age, injury or financial status. Veterans are also eligible for special benefits through Veterans Affairs (VA), which includes funding for VA related special needs transportation services. Figure 18 and
Figure Figure 19 show the geographic distribution of the data contained in Table 12.
Statewide 12.5 percent of the population are veterans. Island County has the highest percent of veterans at 22 percent while Franklin and Whitman counties have the lowest rates at 8 percent. Kitsap County is the only county to rank in the top quartile for both population and percentage of county population who are veterans.
Figure 18Figure illustrates that the largest veteran populations are located in the most populace counties with high veteran populations.
Figure Figure 19 illustrates that as a percent of total population peninsula, northeast and to lesser degree southeast Washington counties have the highest percent of veterans.
Table 12 – Veteran Status
County Total Rate County Total Rate County Total Rate
Adams 900 8% Grays Harbor 8,100 14% Pierce 90,400 16%
Asotin 2,300 14% Island 12,500 22% San Juan 1,800 14%
Benton 15,400 13% Jefferson 3,800 15% Skagit 13,100 15%
Chelan 6,200 12% King 129,600 9% Skamania 1,200 14%
Clallam 9,800 17% Kitsap 37,500 21% Snohomish 59,900 12%
Clark 39,300 13% Kittitas 3,100 10% Spokane 49,700 14%
Columbia 400 13% Klickitat 2,300 15% Stevens 5,200 16%
Cowlitz 11,200 15% Lewis 8,800 15% Thurston 30,900 17%
Douglas 3,400 12% Lincoln 1,300 16% Wahkiakum 500 16%
Ferry 900 16% Mason 8,400 18% Walla Walla 4,500 10%
Franklin 3,900 8% Okanogan 4,100 13% Whatcom 17,000 11%
Garfield 300 14% Pacific 2,800 16% Whitman 2,900 8%
Grant 6,000 10% Pend Oreille 1,600 16% Yakima 16,100 10%
Note: Red indicates that county ranks within the top 25% statewide for that measure.

Washington Statewide Human Services Transportation Plan July 2013
Contact: Don Chartock, WSDOT Rural & Coordinated Transportation Administrator 43 [email protected], 360-705-7928
Figure 18 – Veterans Population
Figure 19 – Percent of Population who is a Veteran

Washington Statewide Human Services Transportation Plan July 2013
Contact: Don Chartock, WSDOT Rural & Coordinated Transportation Administrator 44 [email protected], 360-705-7928
Linguistically Isolated Households
The demographic data shown in Table 13 below come from the 2004-2009 five-year ACS. Linguistically isolated households are households in which no adult (someone over 14 years of age) speaks English “very well”. This indicates households in which communication in a language other than English is necessary if clear communication is to occur. This increases the difficulty of providing services such as human services transportation and makes it more difficult to engage and receive feedback from these types of households. Figure 20 and Figure 21 show the geographic distribution of the data contained in Table 13.
Statewide 4.2 percent of households are linguistically isolated. Adams, Asotin, Franklin, Grant and Yakima counties have a rate over twice that of the statewide average. Asotin County has the highest rate at 25 percent of households. However, nearly half of the linguistically isolated households reside in King County, with 46,000 such households. Asotin, Franklin, Grant, King, and Yakima counties all rank within the top quartile for both total and percentage of county households which are linguistically isolated.
Figure 20 shows that the highest numbers of linguistically isolated households are generally in the most populated counties; however Asotin and Benton counties have a large number of households that are linguistically isolated. Figure 21 shows that, as a percentage, central Washington counties generally have the highest rates of linguistically isolated households. King County also has a high rate.
Table 13 – Linguistically Isolated Households
County Total Rate County Total Rate County Total Rate
Adams 900 17% Grays Harbor 600 2% Pierce 8,900 3%
Asotin 2,200 25% Island 200 1% San Juan 100 1%
Benton 2,200 4% Jefferson 100 1% Skagit 1,300 3%
Chelan 1,400 5% King 46,400 6% Skamania 100 1%
Clallam 400 1% Kitsap 1,400 2% Snohomish 9,700 4%
Clark 4,500 3% Kittitas 300 2% Spokane 2,500 1%
Columbia 50 3% Klickitat 100 1% Stevens 200 1%
Cowlitz 700 2% Lewis 600 2% Thurston 1,700 2%
Douglas 800 6% Lincoln 10 0% Wahkiakum 20 1%
Ferry 30 1% Mason 300 2% Walla Walla 800 4%
Franklin 3,200 16% Okanogan 500 3% Whatcom 1,600 2%
Garfield 10 1% Pacific 300 3% Whitman 500 3%
Grant 3,200 11% Pend Oreille 40 1% Yakima 7,200 9%
Note: Red indicates that county ranks within the top 25% statewide for that measure.

Washington Statewide Human Services Transportation Plan July 2013
Contact: Don Chartock, WSDOT Rural & Coordinated Transportation Administrator 45 [email protected], 360-705-7928
Figure 20 – Linguistically Isolated Households
Figure 21 – Percent of Households Linguistically Isolated

Washington Statewide Human Services Transportation Plan July 2013
Contact: Don Chartock, WSDOT Rural & Coordinated Transportation Administrator 46 [email protected], 360-705-7928
Office of Financial Management Population Projections
Demographic changes over the next several decades will be dominated by a trend toward a significantly larger senior population that is on average older than current senior populations. This change will have important implications on special needs transportation. A larger and older population will increase demand for special needs transportation service beyond current demand and will significantly outpace overall population growth in Washington State in the decades to come.
The Washington State Office of Financial Management (OFM) develops projections to help conduct long rage growth management planning. The projections used here are the “medium series,” which assumes the state’s growth rate falls between the likely high and low rates.
Figure 22 shows the percent of the statewide population which the four major age groups makeup from 2010 to 2040. In 2010 those over 65 years of age represented 12 percent of the statewide population. By 2015 senior citizens will make up 14 percent of statewide population, growing to 16 percent by 2020 and 19 percent by 2025. From then on the percent of overall population over 65 is projected to stabilize at around 20-21 percent of statewide population.
Figure 22 – Age Distribution of Statewide Population
The cause of the trend shown in Figure 22 is clearly shown in Figure 23.
Figure Figure 23 shows the projected population growth of each age group using 2010 as the baseline. While the statewide population grows for all age groups, the growth in the age group above 65 exceeds or significantly exceeds the combined population growth of all other age groups.
0%
10%
20%
30%
40%
50%
60%
70%
80%
90%
100%
2010 2015 2020 2025 2030 2035 204065> 12% 14% 16% 19% 20% 21% 21%35-64 41% 40% 39% 37% 36% 36% 36%20-34 21% 21% 20% 19% 19% 19% 19%0-19 26% 25% 25% 25% 25% 25% 24%
Perc
ent o
f Pop
ulat
ion

Washington Statewide Human Services Transportation Plan July 2013
Contact: Don Chartock, WSDOT Rural & Coordinated Transportation Administrator 47 [email protected], 360-705-7928
This trend is particularly acute in 2025 and 2030 where the number of people over 65 will grow by 173,000 and 224,000 respectively, more than all other age groups compared to the state’s 2010 population. Between 2010 and 2040 the state is projected to grow by just over 2 million residents, with over 1 million of those residents over the age of 65.
Figure 23 – Statewide Population Growth by Age Group from 2010
These trends, an increasingly older and larger senior population, will increase the need for human services transportation over the decades to come.
Needs Assessment
The assessment of transportation needs was conducted through various efforts through this planning process, including reviews of RTPO plans and interviews with staff, participating in four Listening Sessions and Ride Alongs, and completing a comprehensive demographic analysis. Human service transportation needs vary across the state by regional geography, demographics, and land use context. A summary of the statewide needs are presented below and are organized in three categories:
Customer needs and gaps Operational needs and gaps Awareness needs and gaps
-
500,000
1,000,000
1,500,000
2,000,000
2,500,000
2010-2015 2010-2020 2010-2025 2010-2030 2010-2035 2010-204065> 161,000 383,000 621,000 827,000 947,000 1,030,00035-64 66,000 132,000 162,000 223,000 311,000 398,00020-34 55,000 83,000 112,000 133,000 184,000 260,0000-19 16,000 89,000 174,000 247,000 318,000 379,000
Cha
nge
in P
opul
atio
n

Washington Statewide Human Services Transportation Plan July 2013
Contact: Don Chartock, WSDOT Rural & Coordinated Transportation Administrator 48 [email protected], 360-705-7928
Customer Needs and Gaps
The following customer needs and gaps were identified and focus on needs specific to special needs transportation groups.
Unserved or underserved geographical areas: Many human service transportation system users live in rural areas or on the edges of urban areas due to the general lower cost of living. Transit agencies typically provide increased transit service in areas with higher density. This paradigm leaves a significant number of individuals without affordable mobility options. The locations of services that these system users seek are generally in the more urban areas. Typical destinations can be categorized into the following types:
Medical services Employment and education Social and recreation Places of worship Grocery and retail shopping Intermodal connection (airport, train, bus, etc,)
Those who live or work beyond an agency’s core service area cannot readily access public transit. The participants in Listening Sessions and Ride Alongs confirmed several issues that should be the focus in filling service gaps. These included:
Access to employment opportunities in urban areas Expand service to better meet off-peak period and weekend travel needs Decrease dwell times for passengers and create more seamless system for rural residents
Travel distances and cross-jurisdictional travel: Long distances between destinations can be a significant barrier for transportation system users. Information was reviewed from the RTPO coordinated transportation plan reviews regarding the top origins and destinations for human service transportation service and the need for people to travel outside their immediate jurisdiction. Many people need to travel from one county to another, especially from rural areas where services are more limited. Many of these trips travel across multiple county boundaries and significant distances to reach their respective destinations as wells as require long wait times and multiple transfers between service/modes.
Ease of system use: Confusing eligibility requirements may present obstacles for persons needing specialized services. Services are often limited to a particular customer base, such as seniors, veterans, people with disabilities, those eligible for Medicaid, etc. Using demand response service also often requires calling at least a day ahead to arrange for a trip.
Access to the system: Non-motorized access to fixed-route transit can be problematic for those users who most depend on the service. Some elderly persons or those with disabilities that do not fully restrict independent mobility would be able to use fixed-route transit services if certain aspects of the built environment along streets and within neighborhoods were improved to provide safer routes to and from a bus stop. The lack of accessible pedestrian walkways and

Washington Statewide Human Services Transportation Plan July 2013
Contact: Don Chartock, WSDOT Rural & Coordinated Transportation Administrator 49 [email protected], 360-705-7928
street crossings is a barrier for all users but is especially problematic for those with mobility impairments.
In many rural areas bus stops are not fully accessible for wheelchair users or other persons with disabilities in that they may not have a safe platform or the bus stop may not otherwise be in a location to be accessed. Many also lack amenities such as shelters or benches.
Service expansion: The most frequently mentioned need in the regional coordinated plans was that of maintaining existing services. The recent economic climate has resulted in service cuts and fare increases in many parts of the state, and for the most part, transit agencies are trying to avoid future cuts. At the same time, the need for expanded services, both for fixed route and demand response service was frequently called out. Service areas need to be expanded, and service hours also need to be expanded.
New services are also needed for rural tribal communities, veterans, and youth.
Safety and supervision: The perception of safety and security has an impact on the willingness of many potential riders to consider using fixed-route transit service and can be a significant barrier to those with mobility impairments. As discussed earlier, many of these trips require long wait times and multiple transfers between services and modes which can further expose these types of users to safety and security risks.
Service capacity: Many demand response systems require an advance reservation in order to ensure customers can be accommodated on the vehicle. In some parts of the state, these vehicles are at capacity, resulting in service constraints. This, in turn, makes transit agencies or those sponsoring special services reluctant to market them.
Operational Needs and Gaps
Needs related to system operations were identified and the key issues are summarized below.
Service Levels and Vehicle Fleets: Fixed route transit operators would consider a seated or standing load of passengers as a sign of success. For human services transportation providers, the same scenario indicates an issue in terms of available resources from rolling stock or service availability. Participants in the Listening Sessions and Ride Alongs expressed concerns over increased service demands and aging vehicle fleets. While fleet expansion is a logical way to expand service, many operators are struggling to simply maintain their existing service levels and vehicle fleets.
Performance Measures: Agencies have been using established performance measures in the form of levels of service (LOS) and quality of service (QOS) to assess the effectiveness of different components of the transportation system; however there are no such performance indicators for human services transportation. The lack of established performance measures makes it increasingly difficult for agencies and service providers to assess system needs and improvements or manage public and user expectations of the effectiveness of system in part or whole.

Washington Statewide Human Services Transportation Plan July 2013
Contact: Don Chartock, WSDOT Rural & Coordinated Transportation Administrator 50 [email protected], 360-705-7928
Mobility Management: Often, human service agencies have identified opportunities to better coordinate their services and programs, but lack the resources to actually carry them out. While there may be a willingness to test or try new approaches, a lead agency or “champion” is needed to advance them.
Awareness Needs and Gaps
Needs and gaps associated with awareness can be generalized into two broad categories: access to information and customer perception of the services. Potential customers are sometimes unaware of existing transportation services. Often caseworkers and customer service managers, who are primarily the first point of contact for individuals with special transportation needs, are not well informed concerning the range of services available.
Awareness of transportation options: Overall, there is a lack of adequate information about the appropriate transportation choices for people who have special transportation needs. Most marketing or outreach conducted by public agencies is targeted towards commuters. There is often minimal marketing directed towards community-based services, volunteer programs or other services directed towards the special needs clientele. Many coordinated plans also expressed the need for a “one-stop” shop, or a single point of contact for members of the public to get the information they need about transportation options.
Information sharing: Transportation service providers often use different software packages (scheduling, dispatching, and reporting) which impacts the ability to easily share information. In addition, confidentiality and privacy requirements, such as the Health Insurance Portability and Accountability Act of 1996 (HIPAA), create barriers to share and leverage existing information.
Statewide HSTP Priority Strategies
The statewide strategies outlined inTable 14 were developed to address the human service transportation needs identified from the needs assessment. Through discussions and exercises discussed in Section 2, general priorities were developed and used to help define and shape the recommendations that are presented in Section 7.

Washington Statewide Human Services Transportation Plan July 2013
Contact: Don Chartock, WSDOT Rural & Coordinated Transportation Administrator 51 [email protected], 360-705-7928
Table 14 – Statewide Human Services Transportation Plan Strategies
Statewide Human Services Transportation Planning Strategies
Coordination and Communication
Increase knowledge of available transportation options to target users
Improve coordination between regional and cross-regional transit service providers
Improve coordination between transit service providers, human service providers and users
System Efficiency
Improve cross-regional connections
Assist human service providers in guiding users to the most efficient mobility options
User Experience
Increase service levels
Promote driver training to encourage “compassionate professionalism”
Improve quality of timeliness of service
System Preservation
Maintain existing service levels and vehicle fleets
Improve utilization of existing transportation services Further leverage available funding
Environment
Promote environmentally sustainable practices into SHSTP planning and services
Integrated Planning
Integrate infrastructure, land us, and transportation planning to address human service needs
Integration of SHSTP planning with regional and local transportation planning
Innovative Planning
Promote innovative programs, processes and tools that improve efficiency and reduce cost
Utilize performance measures to assess need and effectiveness of service
Utilize technology to provide improved efficiency and user access to mobility options

Washington Statewide Human Services Transportation Plan July 2013
Contact: Don Chartock, WSDOT Rural & Coordinated Transportation Administrator 52 [email protected], 360-705-7928
Section 6│ Best Practices in Human Service Transportation Planning and Operations
This section reports on best practices and provides examples of excellence within the state of Washington, as well as relevant case studies from other states. Identifying best practices can assist WSDOT and local stakeholders in the following ways:
These examples help WSDOT frame new policy guidance for the next cycle of regional coordination plans.
They can assist plan sponsors by highlighting examples of excellence within the State and elsewhere.
They can serve as a “sounding board” in developing statewide strategies. They can assist WSDOT and other stakeholders get “ahead of the curve” in anticipation
of new federal requirements, particularly with respect to performance standards.
The best practice examples were identified through a review of all of Washington’s regional coordinated plans as well as the consultant team’s knowledge of other programs throughout the country. In addition, team members consulted several other resources and documents, including:
A Guidebook for Performance-Based Transportation Planning, NCHRP Report 446. Transportation Research Board: Washington, D.C., 2000 see www.trb.org/TRBNet/ProjectDisplay.asp?ProjectID=901
Transportation Research Board's Conference Proceedings #36, Performance Measures to Improve Transportation Systems, 2004 see http://onlinepubs.trb.org/onlinepubs/conf/CP36.pdf
Transportation Research Board's Transportation Research Circular E-C073 - Performance Measure to Improve Transportation Planning Practice, 2005 see http://onlinepubs.trb.org/onlinepubs/circulars/ec073.pdf
The Transportation Planning Process: Key Issues, A Briefing Book for Transportation Decision makers, Officials, and Staff, see http://www.planning.dot.gov/documents/briefingbook/bbook.htm#9BB
Transportation Research Board's Conference Proceedings #36, Performance Measures to Improve Transportation Systems, 2004 see http://onlinepubs.trb.org/onlinepubs/conf/CP36.pdf
WSDOT has an interest in highlighting best practice examples of the planning process. The intent is to provide stronger guidance for future planning cycles and to create plans that are more consistently based on quantifiable information. Best practices are presented and discussed for the following topics:
Public outreach and stakeholder consultation Quantitative-based needs assessments Identification and prioritization of strategies Use of performance indicators for human Service transportation

Washington Statewide Human Services Transportation Plan July 2013
Contact: Don Chartock, WSDOT Rural & Coordinated Transportation Administrator 53 [email protected], 360-705-7928
Exemplary roles of states in coordination
Public Outreach and Stakeholder Consultation
If public and stakeholder participation in planning is to be effective, the stakeholders whose lives are affected by the decisions must have an opportunity to influence key planning decisions. Directly engaging citizens and stakeholders in the planning process promotes successful problem solving, yields diverse voices and new ideas, and fosters a sense of ownership of the developed solutions. Federal guidance for completing coordinated public transit-human services transportation plans includes the requirement that the plan be conducted with the participation of affected stakeholders including, but not limited to, transportation providers, human service agencies, local businesses, and members of the public.
There is interest, on the part of WSDOT and of the RTPOs, which prepare and adopt the plans, to identify effective methods of public outreach and stakeholder consultation. The plans and their subsequent updates provided an overview of how stakeholders were consulted, and described those who participated throughout the project. Some, but not all, plans included specific documentation, such as meeting minutes, public notices, survey results, or summaries of workshops. It is important to document the outreach and consultation process, and to describe the methodology used to solicit stakeholder consultation, for several reasons:
Federal and state agencies are assured that outreach requirements have been met. A baseline of stakeholders is cited, and can be built upon for future plan updates. The process for identifying needs and subsequent strategies, leading to the prioritization
of projects subject to state funding, is transparent.
The following presents some innovative approaches for involving stakeholders and the public:
Comprehensive Media and Internet Strategy
It is essential to engage local media outlets early and encourage them to follow the project as it evolves. Relating project outcomes to issues that matter to broad segments of the population requires a careful and strategic approach. There is the opportunity to leverage the Internet and social media as new ways to engage the public, such as Twitter, Facebook, YouTube, etc., to bring traffic to a project Web site. This will be an effective way to reach out to new segments of the population, such as youth and younger adults. However, this does not suggest that more traditional
Figure 24 - Social Media Outreach on Twitter

Washington Statewide Human Services Transportation Plan July 2013
Contact: Don Chartock, WSDOT Rural & Coordinated Transportation Administrator 54 [email protected], 360-705-7928
forms of outreach should be abandoned—these strategies augment other approaches such as community meetings and mobile outreach.
Surveys
Surveys can be an effective way to learn about local transportation needs as well as spending priorities. For example, the Yakima Valley Region (YVCOG) Coordinated Plan8 utilized surveys to learn about customers’ transportation needs. Surveys were developed in English and Spanish and distributed through individual service providers. Approximately 270 surveys were returned and compiled to identify transportation needs, points of origin and destination, transportation resources used and unmet transportation needs. A second survey was distributed to agencies that serve people with special needs. This survey asked the agency to describe the transportation needs of those they serve, services used, and unmet needs.
Another example involves Malheur County, Ore., and Payette County, Idaho, which used a local Boy Scout troop to distribute surveys, inserted surveys into utility bills, and awarded a restaurant gift certificate to survey respondents. Their efforts resulted in the completion of over 600 surveys by members of the public.
Online survey instruments can streamline the survey distribution and tabulation process and can be an effective way of conducting a larger public survey. Seattle DOT regularly utilizes online surveys as part of its projects, such as the Seattle Transit Master Plan and the Bicycle Master Plan, to learn about public opinions and priorities. The Transit Master Plan gathered over 12,000 online survey responses. Given that some special needs transportation users may have some barriers to accessing an online survey, it may be necessary to supplement with traditional survey instruments or approaches to include them.
Virtual Town Hall Meetings and Forums
Recent technological developments allow a range of opportunities for involving the public. One potentially effective approach for engaging citizens is virtual town hall meetings which provide an online or telephone forum that complements actual outreach meetings. Examples of online forums include “idea voting” tools, questionnaires, location-based ideas, and open-idea submissions9. These tools allow people to contribute their opinion quickly and in a time-frame that is convenient for them. It also allows moderators to tabulate results more quickly and in some cases, in real time.
8 Yakima Valley Region Coordinated Public Transit-Human Services Transportation Plan 2010, prepared by People for People on behalf of the Yakima Valley Conference of Governments (YVCOG); approved November 15, 2010. 9“How to Get Results from Your Virtual Town Hall”: http://congressfoundation.org/news/blog/950-how-to-get-results-from-your-virtual-town-hall

Washington Statewide Human Services Transportation Plan July 2013
Contact: Don Chartock, WSDOT Rural & Coordinated Transportation Administrator 55 [email protected], 360-705-7928
Mobile Outreach
Holding interactive community workshops in public settings allows people to interact with planners as they explore service design concepts. In these busy times many people struggle to participate in public meetings, even when issues directly affect their lives. Experience shows that taking outreach to places people need and want to be can dramatically increase participation and reach a far broader segment of the population. Taking outreach to sporting events, shopping centers, farmer’s markets or other places helps engage a broad, more representative segment of the general public.
Examples include:
In Yakima County, forums for the development of the coordinated plan were held in many locations, such as senior centers, homeless shelters, community centers and community colleges.
Staff from the Cowlitz-Wahkiakum Council of Governments engaged in a broad-based effort to solicit comments from members of the public likely to be most affected by services discussed in the plan. Staff attended senior center meetings, rode the bus, attended neighborhood association meetings and AARP meetings. Staff also sat at a table at the Senior Fair which allowed them to talk to the public, and to walk around to other booths and ask providers questions about transit (senior centers, Goodwill, Elder Options, nursing homes). They also sought opportunities to participate in existing events and to discuss transit.
In some rural areas of Washington State, planning sponsors have held “listening posts,” where outreach is conducted in locations where members of the public are likely to congregate, such as the post office, grocery stores, or large retail stores such as Walmart.
Figure 25 3- YouTube Video Town Hall

Washington Statewide Human Services Transportation Plan July 2013
Contact: Don Chartock, WSDOT Rural & Coordinated Transportation Administrator 56 [email protected], 360-705-7928
This provides an opportunity to conduct an intercept survey and to efficiently engage members of the public to learn their transportation concerns.
As part of a long range transit plan conducted for the Bakersfield California Metropolitan area, one strategy for soliciting public input was to set up a booth at the Kern County fair. This approach was intended to reach people who would not typically attend a public meeting but would likely be going to the popular and well-attended annual County Fair. The idea was to “go to the people” where a cross-section of the population congregate. To attract people to the transit booth, a table was set up at the fair with large boards displaying the GET bus with brochures and service schedules. People who approached the booth were asked to offer their opinion about proposed new and revised bus services. They were asked to complete a short questionnaire to solicit their reaction to the draft service plan by choosing one of two options: 1) An online questionnaire that could be accessed on computers stationed at the table, or 2) A hard copy of the (same) questionnaire printed out for people uncomfortable with computers. The survey was available in both English and Spanish. A total of nearly 500 people completed the surveys over the three days.
Outreach to Hard-To-Reach Populations
Veterans
In the state of Washington, El Centro de la Razahas sponsors an innovative approach to involving and learning about the special needs of veterans. Funded by a King County Veterans Levy, Veteran Service Provider meetings gather a range of service providers (health care, social service, etc.) quarterly to discuss issues specific to veterans. Each provider has time to present their programs and services and to raise issues. These meetings have brought transportation needs that are specific to veterans to light.
Also in Washington, Washington State Department of Transportation formed a steering committee to assist recipients of FTA Veterans Grants. The committee is comprised of grantees, and representatives from the Veterans Administration, nonprofit agencies, transit agencies, etc. They meet monthly to discuss transportation issues specific to veterans and track the progress of FTA-funded programs. They are in the process of drafting a Statewide Needs Assessment, highlighting current and future transportation needs of veterans. In addition, WSDOT released a new publication about WSDOT’s role in veterans’ transportation in December 2012.
Figure 26 - City of Richmond, Calif., General Plan Outreach

Washington Statewide Human Services Transportation Plan July 2013
Contact: Don Chartock, WSDOT Rural & Coordinated Transportation Administrator 57 [email protected], 360-705-7928
Immigrant and Refugee Elders
The King County Mobility Coalition began the Immigrant and Refugee Elders Project to learn more about transportation challenges for immigrant and refugee elders. The project was funded in March 2011 with a $20,000 grant from the National Center on Senior Transportation. The purpose of the Immigrant and Refugee Elders Transportation Project was to increase the availability of culturally and ethnically appropriate transportation resource information for newly arrived immigrant and refugee elders in King County. The project had five parts: Community Conversations and Surveys, Summary Report, Transportation Summit, Action Plan and Ethnic Senior Advisory Council.
The project focused on Bhutanese, Burmese, Eritrean, Ethiopian, Russian, Somali and Ukrainian elders. They used community conversations and surveys to gather data and learn from immigrant and refugee elders. They collaborated with six community organizations to facilitate nine community conversations and administer surveys. Using a representative from the specific community was found to be particularly effective in involving refugee and immigrant populations. Two surveys were used, one for elders and the second for providers working with refugee and immigrant populations.
The project is summarized in a report, Immigrant and Refugee Elders Transportation Project Summary Report (July 2011, King County Mobility Coalition)10. Another outcome of the project is scripted videos about riding transit, paying for transit and community transportation options.
Quantitative-Based Needs Assessment
WSDOT has an interest in plan documents resulting in a more consistent approach to the identification of service gaps and other unmet transportation needs. In the past WSDOT has provided agencies with a coordinated plan outline that included guidance for completing each section. The resulting plans described transportation service gaps and needs in varying levels of detail. Ideally, updated plans will identify both unique and shared transportation needs for the target populations, and will document needs that exist beyond what is addressed by current transportation services.
Greater use of demographic data, maps, photos, and other visual materials is one method to strengthen the documentation of transportation needs. Another is to include a demographic data above and beyond the U.S. Census data, including data available from:
Bureau of Veterans Affairs Bureau of Indian Affairs County population projections and employment related data
10http://metro.kingcounty.gov/tops/kccsnt/pdf/immigrant-and-refugee-elders-transportation-project_summary.pdf

Washington Statewide Human Services Transportation Plan July 2013
Contact: Don Chartock, WSDOT Rural & Coordinated Transportation Administrator 58 [email protected], 360-705-7928
Local Area Agencies on Aging, United Way, or other human service agencies that may have conducted needs assessments specific to populations they serve
Best practices within Washington State include:
Yakima County used other sources for looking at transportation needs, including the Department of Health, Office of Financial Management, Office of Superintendent of Public Instruction and Department of Social and Health Services. The Yakima plan also identified common points of origin through community forums, transportation surveys, and service provider surveys.
The original NE Washington Coordinated Plan considered, on a quantitative basis, key points of origin and destination for populations of concerned, and mapped them. This provided a useful visual picture of where people need to go, and where they are coming from.
The NE Washington Coordinated Plan update used data above and beyond the typical census data categories. The categories used for the calculation were zero-vehicle households, elderly population, disabled population, and below-poverty population. Using these categories, a “transit need index” was developed to determine the greatest transit need. The density of the population for each U.S. Census block group within each category was calculated, placed in numerical order, and divided into six segments. Six segments were chosen in order to reflect a reasonable range. Each segment contained an approximately equal number of U.S. Census block groups in order to provide equal representation. The U.S. Census block groups in the segment with the lowest densities were given a score of 1. The block groups in the segment with the next lowest densities were given a score of 2. This process continued for the remainder of the block groups. The block groups in the segment with the highest densities were given a score of 6. This scoring was completed for each of the categories (zero-vehicle households, elderly population, disabled population, and below-poverty population). After each of the block groups was scored for the four categories, the four scores were totaled to achieve an overall score. The scores range from four (lowest need) to 24 (highest need).
Prioritization of Strategies/Potential Projects
Another required element of the human services plan is prioritization of strategies. It is important to note that “strategies” as identified in the Plans are not always the same as “projects” submitted to WSDOT for funding. Unfortunately there are no exemplary practices to highlight, within Washington or elsewhere. Even though prioritizing strategies is a required element that was addressed by all the Plans, few planning documents explained the methodology or approach in how strategies were prioritized.
Use of Performance Indicators for Human Services Transportation
Performance measures are widely used in the transportation planning field as a method for tracking a transportation system’s effectiveness and efficiency. They demonstrate how well a system is doing with respect to meeting public goals and expectations. This works well when the

Washington Statewide Human Services Transportation Plan July 2013
Contact: Don Chartock, WSDOT Rural & Coordinated Transportation Administrator 59 [email protected], 360-705-7928
performance measures are part of a framework that links them directly to community-established goals and objectives. New MAP-21 requirements specify that FTA establish performance measures for programs it oversees (including Elderly and Individuals with Disabilities Program); such guidance is forthcoming, and will be of interest to WSDOT and local program recipients.
Establishing consistent criteria is challenging for any program, but it is especially true for human service transportation programs with JARC and New Freedom funding. These programs tend to be specifically designed to support innovative and, in some cases, untested ideas. Some programs are designed to work in areas where traditional public transportation services are not financially feasible. In addition, the programs may involve projects that include capital purchases, individual training, service operation and marketing programs.
In fact, former guidelines for both JARC and New Freedom encourage a variety of mobility solutions to fill gaps identified through the coordinated plan; these solutions may be unique to a particular community or population group. While new or expanded fixed route services can—and do—meet the transportation needs of many low income communities, it does not make sense nor is it financially feasible to operate fixed route transit in all cases. Many of the gaps identified through the planning processes may be better served by projects that complement fixed route service.
Because many of these projects are usually not considered "traditional" transportation projects, they are not always appropriately compared to typical public transportation performance indicators, such as cost per rider, fare box recovery ratio, or trips per hour. Many projects by definition are not considered highly efficient because they are dictated by non-traditional needs and may be providing services during off-peak hours when ridership is lower, or otherwise operating under specialized circumstances. Ideally, each project’s outcomes should be compared to its own original expectations, and compared to the broader program goals and objectives rather than to pre-established productivity objectives. Ideally, as well, both quantitative and qualitative measures should be considered.
Examples of Performance Measures
Performance measures can vary from system to system depending on what goals have been established, and depending on the type of service provided, (i.e. fixed route transit, paratransit, or specialized programs) as well as funding source. Examples of performance measures include:
Accessibility measures: Percent population within "x" minutes of "y" percent of employment sites; whether special populations such as the elderly are able to use transportation; whether transportation services provide access for underserved populations to employment sites; also, whether services are accessible and usable by persons with disabilities.
Mobility measures: Average travel time from origin to destination; change in average travel time for specific origin-destination points; average trip length; percentage of trips per mode (known as mode split); time lost to congestion; transfer time between modes; percent on-time transit performance; number of people using public transportation in the

Washington Statewide Human Services Transportation Plan July 2013
Contact: Don Chartock, WSDOT Rural & Coordinated Transportation Administrator 60 [email protected], 360-705-7928
region, by mode; number of public transportation trips in the region, by mode; ratio of trips to population density, by mode and area (rural and urban).
Economic development measures: Jobs created and new housing starts in an area as a result of new transportation facilities; new businesses opening along major routes; percent of region's unemployed who cite lack of transportation as principal barrier to employment; economic cost of time lost to congestion.
Environmental measures: Environmental and resource consumption; tons of pollution generated; fuel consumption per vehicle mile traveled; decrease in wetlands; changes in air quality, land use, etc.
Safety measures: Number of crash incidents or economic costs of crashes; pedestrian injuries and fatalities on rural roads and highways.
Quality measures: Transportation service customer comments; dwell times; trip times; ability for disadvantaged people to access medical, employment, and social needs; ability for seniors and persons with disabilities to remain independent; rider satisfaction.
Efficiency measures: Average cost per trip, including administration and capital depreciation; average cost per mile, including administration and capital depreciation; average number of passengers per service hour; level of integration in other plans.
Qualitative measures: Opinions and experiences of project sponsors; ability of RTPOs to encourage participation by wide range of project sponsors; benefits to direct users of the programs; program outcomes for projects analyzed compared to original goals as stated in the project application.
Case Studies
The following examples illustrate how performance measures have been developed in various settings to monitor service effectiveness.
STAR 11
In Wyoming, Sweetwater County Transit Authority (STAR) serves a sparsely populated area in Southwest Wyoming. STAR was created in 1989 and replaced a number of health and human service agency-based transportation services to form a coordinated public transportation system providing transportation to the general public and to agencies on a contract basis. STAR was created to provide public transportation to agencies and individuals where little service existed. Under STAR’s coordinated system, the number of trips being provided increased dramatically over what was previously provided under agency-based transportation services.
To meet demand, STAR monitored the cost and performance of their system. By focusing on system cost and performance, they maximized the use of the scarce resources available by providing cost-effective services at a price below what agencies were formerly spending for
11The STAR and ACCESS case studies are summaries of what is featured in: “Innovative State and Local Planning for Coordinated Transportation, February 2002, Prepared by Volpe National Transportation Systems Center, Research and Special Programs Administration, and U.S. Department of Transportation. Some of the details may be a little out of date given the age of the publication.

Washington Statewide Human Services Transportation Plan July 2013
Contact: Don Chartock, WSDOT Rural & Coordinated Transportation Administrator 61 [email protected], 360-705-7928
transportation. They estimate an annual savings of $1.6 million to state and local governments from coordination.
From the onset, STAR staff kept detailed records of every trip provided by trip purpose, miles traveled, vehicle hours, and trip duration. Using operational data obtained from the individual agencies preceding the formation of transit authority, STAR staff established benchmark operating costs under the old agency operated system so they could compare these with STAR’s operations. STAR established an internal system to track three specific measures of system performance and three measures of system cost.
On a cost basis, staff used the trip data to establish measures of cost per passenger trip, cost per vehicle mile, and cost per vehicle hour. To monitor performance, staff used trip data to track ride statistics including average miles per passenger trip, passengers per vehicle hour, and the average trip time. Utilizing these performance measures has been central to the transit agency’s ability to track and contain costs.
Economic benefits were calculated in the six areas outlined below:
Access to Employment: This measure used the number of workers who are transit dependent and who would otherwise be subject to the loss of their jobs without transit, and calculated their annual wages as a benefit. The savings from welfare reductions were also calculated based on the number of persons recorded to have moved off public assistance through the use of access to jobs provided by transit.
Access to Medical Care and Other Social Services: This calculated benefit uses a conservative estimate of the higher per trip cost for taxi service incurred by people who take those medical trips that would still need to be taken if transit were not available.
Providing Rides to the School Age Children of Working Parents: This measure is based on the hours of wage earnings that would be lost by parents transporting their children to the child daycare center if transit were not available to provide that service.
Access to Shopping, Recreation, and Other Personal Services: This is calculated as the greater cost to make these trips than would be incurred using the transit service, assuming at least one-third of the trips would still be made.
Access to Educational and Counseling Services: This is derived based on the assumption that these trips will enable travelers to increase their long-term chances of employment. Using similar calculations to the Access to Employment above, the number of affected persons using transit is calculated, and their potential wages, in addition to potential savings through welfare reductions, are credited as benefits due to the transit system.
Enabling the Continuation of Independent Living: This is based on detailed records of its riders, calculated as the number of persons able to remain living independently and out of nursing homes because of transit services. A percentage of the cost for those people to live in a nursing home is then used as an avoidance cost attributable to maintenance of independent living.

Washington Statewide Human Services Transportation Plan July 2013
Contact: Don Chartock, WSDOT Rural & Coordinated Transportation Administrator 62 [email protected], 360-705-7928
ACCESS Transportation Systems
In the Pittsburgh, Pennsylvania metropolitan area, ACCESS Transportation Systems provides ADA paratransit services under a contract with the Port Authority of Allegheny County, the public transit operator for the area. ACCESS serves as the broker using annual service purchase contracts with seven for-profit companies and three nonprofit agencies, operating from 13 distinct facilities. Local riders have a choice of two to three providers in each area. One of the keys to the success of the brokered system and the strong relationship between ACCESS and the contracting agencies has been the establishment of annual service contracts based on detailed system performance and cost data.
ACCESS developed performance measures for their providers to evaluate their services. The organization established measures for on-time performance, complaints per 100,000 trips, vehicle condition, responsiveness, and targeted revenue passengers per billable hour by provider.
ACCESS collects, maintains, and reviews the performance data from each service provider, which is supplemented by road audit data provided by each of the providers on a monthly basis and ACCESS surveys of paratransit riders. ACCESS develops this information into system performance and cost measures for each provider and uses the information when making decisions about trip allocation. ACCESS will shift trips to carriers who can provide less expensive services, particularly trips provided for more cost-conscious agencies.
ACCESS utilizes the cost information when developing average unit cost estimates for each agency contracting with ACCESS for services. The organizations takes a large sample of the trip information including trip length, trip purpose, and the performance measures discussed earlier, and develops an average trip cost for the agency based on actual trips taken by the agency’s clients.
Metropolitan Washington Council of Governments Program Evaluation
One way to measure program outcomes is to regularly evaluate specific projects in comparison to original project goals. The MWCOG conducted such an assessment of the JARC and New Freedom projects it had funded in the metropolitan Washington, D.C., area. A combination of qualitative and quantitative methods was used to conduct the assessment. Some steps contributed to both research goals, while others advised on only one. The assessment methodology included:
Interviewing key project stakeholders, including most of the project sponsors. Consulting national reviews and reports about Human Service Transportation
Coordination, JARC and New Freedom. Analyzing available program data which includes original applications submitted by the
project sponsor, quarterly reports and other relevant program information. Observing a pre-proposal conference that was conducted as part of the process for the
upcoming fifth cycle of funding, and otherwise documented the planning and selection process.
Conducting focus groups with individuals who participated in programs funded with JARC or New Freedom resources. The purpose of the focus groups was to learn how

Washington Statewide Human Services Transportation Plan July 2013
Contact: Don Chartock, WSDOT Rural & Coordinated Transportation Administrator 63 [email protected], 360-705-7928
customers learned about the projects, whether—and how—mobility has been improved as a result of their participation in program activities, and their level of satisfaction with the services. Additionally, some telephone interviews were conducted with program participants.
Conducting a brief on-line survey of agencies that attended the pre-proposal conferences but did not submit applications and following up with selected agencies also in this category by telephone to learn more about their reasons for not applying.
Preparing a peer review to learn more about how other entities administer their JARC and New Freedom programs, and to highlight their experiences and challenges in program oversight.
The following two quantitative and four qualitative measures were applied to projects:
Quantitative measures:
Ability of projects to meet local established priorities Program outcomes for assessed projects compared to original primary service goal as
stated in the project application
Qualitative measures:
Opinions and experiences of project sponsors Ability of MWCOG to encourage participation by wide range of project sponsors Benefits to direct users of the programs Other program outcomes for projects analyzed compared to original goals as stated in the
project application
The final report was intended to summarize program outcomes, as well as informing future funding cycles.
TriMet 12
TriMet, in the Portland, OR metro area, utilizes performance measures from a variety of sources to monitor performance of its fixed route system throughout the agency, including:
Automatic vehicle location system and automatic passenger counters are used to collect ridership and on-time performance data.
The TriMet Human Resources Department tracks attendance and hours worked. Financial data includes the budget, fare revenue, and operating costs. Maintenance data includes mechanical failures, scheduled maintenance, and use of the
ticket vending machines.
12 Using Integrated Data to Measure Performance at TriMet, David Crout, TriMet, Conference on Performance Measures for Transportation and Livable Communities, September 2011.

Washington Statewide Human Services Transportation Plan July 2013
Contact: Don Chartock, WSDOT Rural & Coordinated Transportation Administrator 64 [email protected], 360-705-7928
Operations data includes the extra board for drivers and bus pullouts. Safety data includes incidents and collisions. Customer Service data includes complaints and other input received from riders.
TriMet uses a “performance dashboard”13 to provide information to stakeholders and the public via the agency Web site. It presents performance measures related to ridership, efficiency, the budget, and safety. In addition to the performance measures that are shared with the public, TriMet utilizes internal performance measures. A wide range of operations and maintenance measures are reported on a monthly basis. The monthly target and data for the current, the previous month, the same month the previous year, and year-to-date are presented in table format. Examples of data include on-time performance for all transit modes, accidents per 100,000 miles, and bus missed pullouts.
TriMet also has an internal performance dashboard. The operations dashboard includes daily and weekly key performance measures. Examples of measures include bus and MAX light rail on-time performance, bus and MAX mechanical incidents resulting in lost service, and fixed route bus and MAX accidents. Measures are presented in table and graphic formats. Weekday route level on-time performance is reported by garage. Other examples include the daily total vehicle miles reliability report, the daily fixed route bus accident report, the operator absentee report, daily MAX trips above achievable capacity, and the MAX headway performance report.
13http://www.trimet.org/about/dashboard.htm
Figure 27 - TriMet Performance Dashboard

Washington Statewide Human Services Transportation Plan July 2013
Contact: Don Chartock, WSDOT Rural & Coordinated Transportation Administrator 65 [email protected], 360-705-7928
TriMet is working to expand the external performance dashboard to include more measures. This expansion will also facilitate public access to data. Another activity is increasing the use of internal measures among departments and seeking to institutionalize them.
Exemplary Roles of States in Coordination
Departments of Transportation
Washington
WSDOT is often cited as a model program when it comes to administering funding and overseeing grant programs. In particular, Washington has streamlined its funding program by establishing a Consolidated Funding Program that greatly expedites the application process for potential project sponsors. In addition, WSDOT staff for years has assumed responsibility for promoting coordination by staffing the Agency Council on Coordinated Transportation. The following DOTs are also providing excellent guidance to subrecipients and project sponsors when conducting planning and applying for funding:
Wisconsin
In 2008 a toolkit was developed specifically for the local meeting coordinators in Wisconsin. The 2008 Toolkit was similar to a previous version in that it provided guidance, document templates, worksheets, and information sources. In addition, the revised Toolkit contained the following sections:
A section explaining the purpose and elements of the coordinated plan as required by SAFETEA-LU
Links to lists of Wisconsin DOT projects that were approved and funded for 2008 Links to grant applications, with explanations of federal funding programs; A list of information needed to identify gaps and needs A Wisconsin Coordination Model A Coordination Strategy Handbook Additional sample plans from other states Samples of consultant summaries of Supplemental Transportation Rural Assistance
Program (STRAP) Planning Grants.
Kansas
The Kansas Department of Transportation (KDOT) has designated the Coordinated Transit Districts (CTDs) as the lead agencies to develop coordinated plans for their areas. The KDOT Program Consultant assigned to the CTD and the Kansas University Transportation Center will provide facilitation and technical assistance, as needed.

Washington Statewide Human Services Transportation Plan July 2013
Contact: Don Chartock, WSDOT Rural & Coordinated Transportation Administrator 66 [email protected], 360-705-7928
States Roles in Veterans Coordination
States can play a vital role in facilitating veterans’ access to transportation. They can provide needed leadership and programs, which help fill the gaps in veterans’ transportation services. In particular, state legislatures play an important role. Since 2009, more than 40 legislative measures related to transportation for veterans have been introduced in at least 18 states and Puerto Rico. States can facilitate access to transportation mobility for veterans in the following ways14:
Interagency Cooperation
States help provide access to transportation for veterans through three types of coordination:
Including veterans’ interests in transportation coordination efforts: For example, Vermont’s Public Transit Advisory Council not only represents veterans’ interests among its formal membership, but has also formed a veterans’ transportation working group that includes members from organizations such as Disabled American Veterans (DAV) and MHISSION_VT, a jail diversion project for veterans.
14This entire section summarizes information found in A Mission to Serve: State Activities to Help Veterans Access Transportation, by Jaime Rall and Alice Wheet; December 2012.
Figure 28 - United We Ride from Kansas University Transportation Center

Washington Statewide Human Services Transportation Plan July 2013
Contact: Don Chartock, WSDOT Rural & Coordinated Transportation Administrator 67 [email protected], 360-705-7928
Including transportation stakeholders in coordination efforts related to veterans’ services: In California, membership of the California Interagency Council on Veterans includes the secretary of business, transportation and housing.
Creating interagency task forces to study veterans’ transportation: Stand-alone interagency task forces have formed in Colorado, Massachusetts and Oregon to specifically address veterans’ transportation concerns. The Colorado Veterans’ Transportation Task Force was developed to improve communication between veterans and non-veterans groups, increase transportation access and reduce service duplication. Also, the Oregon Legislative Task Force on Veterans Transportation, created by Senate Bill 98, appoints members from the departments of transportation, employment, human services, military and veterans’ affairs.
Funding for Veterans Transportation Leadership
A number of states have dedicated special funds or trust funds for veterans’ services that can be used for transportation purposes (13 states). Also, Idaho’s Veterans Transportation Fund exists solely to give vouchers to veterans in wheelchairs for transportation to medical appointments.
At least 18 states fund veterans’ transportation programs through other means such as legislative appropriations or departmental budgets. For example, in 2011, the North Dakota legislature provided funding of $50,000 to purchase vans to transport veterans or their dependents.
Some states have taken a direct role in providing transportation to veterans. In Oregon, the Department of Transportation is working with federal and state veterans’ agencies to help veterans access healthcare by rehabilitating federally-funded vehicles and transferring them to VA hospitals. Local transit agencies train the volunteer drivers and ODOT does preventative maintenance on vehicles for one year. In addition, the Maryland Commitment to Veterans Program, within the State Department of Health and Mental Hygiene, contracts with local transportation providers to provide curb-to-curb services for veterans who have no other way to get to behavioral health appointments.
Leadership
Some states have taken the lead in coordinating application for federal funding. The federal Veterans Transportation and Community Living Initiative have awarded grants to projects in 13 states that will coordinate transportation statewide to make projects more efficient and broaden their scope. Some of these projects will create a single phone number and website to allow any veteran in the state to find transportation choices with one call or one click. Others bring together several smaller projects to achieve statewide coverage. For example, in 2011 and 2012, the Colorado Department of Transportation and Veterans Transportation Task Force coordinated four sub-grantees’ applications. The resulting grant awards will help veterans schedule rides across multiple providers, support complementary one-call/one-click centers in different regions, and coordinate local and statewide resources to improve information about transportation options for veterans.

Washington Statewide Human Services Transportation Plan July 2013
Contact: Don Chartock, WSDOT Rural & Coordinated Transportation Administrator 68 [email protected], 360-705-7928
WSDOT coordinated and submitted VTCLI applications on behalf of area nonprofits in 2011 and 2012. This effort has been effective in making grantees aware of projects in other areas of the state. WSDOT also created a forum in which grantees are “expected to work together to minimize overlap of services among veterans in multiple areas throughout the state” (NCSL Survey, 2012).
At least 10 states encourage or require the inclusion of veterans’ interests in transportation planning activities. A few examples include:
WSDOT conducting the state’s first statewide human service transportation coordinated plan, which specifically looks at veterans’ transportation needs.
Ohio Department of Transportation invites the Department of Veterans Services to quarterly mobility manager roundtables and encourages mobility managers to include county-level veteran services coordinators in regional coordination planning activities.
The Illinois and Louisiana departments of transportation formally invite veterans’ transportation providers to participate in ongoing regional coordination activities.
Exemptions from Transportation-Related Fees, Fares or Taxes
Many states waive or reduce certain vehicle-related fees and taxes for eligible veterans. These include driver’s license fees; vehicle registration charges; vehicle taxes; fees for special veterans’ license plates; and fees for disability placards. Some states also ensure free or reduced transit fares or waive tolls.

Washington Statewide Human Services Transportation Plan July 2013
Contact: Don Chartock, WSDOT Rural & Coordinated Transportation Administrator 69 [email protected], 360-705-7928
Section 7│ Statewide Human Services Transportation Recommendations
This section summarizes the recommendations that form a strategic vision for WSDOT, RTPOs, and other Washington State stakeholders to address human services transportation. The recommendations were formulated though a variety of efforts during the planning process, including the needs assessment, the Statewide HSTP priority strategies exercises, best practices research, and the public participation effort described earlier.
The recommendations are organized consistent with the transportation needs and gaps category as defined in Section 5.
Customer Needs and Gaps Operational Needs and Gaps Awareness Needs and Gaps
The goal of this organization of recommendations is to align each recommendation with an identified need, as well as to recognize that multiple partners are needed to address and implement service enhancements and to improve the delivery of human services transportation. Implementing some of the recommendations will require additional resources; it is envisioned that most will be implemented over time, or in phases. Some recommendations are statewide in nature, while others are better addressed at the local level.
These recommendations were reviewed in their draft form with the PAC and with the ACCT. As a result, numerous revisions were made to better clarify the overall objective of each recommendation.
These broad recommendations are intended to provide a general framework for improving coordinated transportation in Washington State. They reflect the issues the project team and PAC identified, and address the most basic needs as identified during the course of this planning effort. It is acknowledged that these recommendations are ambitious and will require new funding resources and significant cooperative efforts to be implemented.
As a next step, WSDOT will move forward with the assistance of ACCT and the PAC in selectively implementing recommendations. The state RTPOs will lead the local planning efforts to prioritize the recommendations that may be implemented in the near term. The following action items have been identified as next steps.
Identify and engage partners who need to be involved. Develop technical specifications or more specific action steps needed for each
recommendation. Develop the appropriate measures for planning and services. Develop a budget and timelines for implementation.

Washington Statewide Human Services Transportation Plan July 2013
Contact: Don Chartock, WSDOT Rural & Coordinated Transportation Administrator 70 [email protected], 360-705-7928
During the 2013-2015 biennium the RTPOs will complete the next update to the regional coordinated Human Services Transportation.
Table 15 – Need and Recommendation Summary
Transportation Need Recommendation
Customer Needs and Gaps
Unserved or underserved geographical areas
Service Expansion – Expand fixed route and/or specialized transportation services in unserved or underserved areas. Evaluate a range of delivery methods, including: vanpool, volunteer services, shuttles, shared-vehicle programs, taxi vouchers, and other options not yet identified.
Travel distances and cross-jurisdictional travel
Improve Data – Collect travel data (i.e. travel surveys and logs) to identify where there is significant cross-jurisdictional travel. Identify important statewide major destinations and prioritize efforts to get people there.
Ease of system use Consolidated Trip Planning Portal – Building upon existing one-call systems to provide a one stop resource for users seeking information about transportation options.
Access to the system Integrated Planning – Better integrate land use and transportation planning to account for human services transportation needs. Incorporate human services transportation into state, regional, and local planning efforts to account for all users of the transportation system. Accessible Infrastructure – Improve the physical environment to improve access to the transportation system. Identify opportunities to improve accessibility for specialized transportation users with coordination on planned capital improvements.
Service expansion and capacity
Sustainable Funding – Plan and advocate for sustainable revenue sources to expand specialized transportation services to meet growing human services transportation demand. This includes additional funding for both capital and service.
Safety and security User Safety – Encourage design and operations of transit service and facilities that provides improved safety and security, perceived or real, for both riders and service providers. Travel Training – Encourage travel training programs to increase knowledge and comfort level of using both fixed route and specialized transportation services.
Operational Needs and Gaps
Service levels and vehicle fleets
Maintain Existing Levels of Service – Identify sustainable funding to maintain basic levels of service, both for fixed route and specialized transportation services as well as vehicle replacement.
Performance measures
Quality of Service Measures – Develop Quality of Service (QOS) methodology for evaluating human services transportation systems, with the goal of establishing common measures of performance evaluation.
Mobility management Mobility Management – Encourage mobility management activities at local and regional level to advance coordination projects.
Awareness Needs and Gaps
Awareness of transportation options
Targeted Outreach – Support targeted outreach and marketing campaign to raise awareness of mobility options to population groups that have historically been challenging to reach. Develop a comprehensive strategy that combines both traditional and new media methods.
Information sharing Information Clearinghouse – An information clearinghouse would act as a centralized resource for human services transportation information, data, best practices, etc. A clearinghouse concept would enhance coordination and sharing of information at all levels of planning and operations.

Washington Statewide Human Services Transportation Plan July 2013
Contact: Don Chartock, WSDOT Rural & Coordinated Transportation Administrator 71 [email protected], 360-705-7928