Washington State Resource Based Performance … is the Washington State process? Washington State...
27
What is the Washington State process? Washington State Resource Based Performance Planning Resource Based Planning Process
Transcript of Washington State Resource Based Performance … is the Washington State process? Washington State...

What is the Washington State process?
Washington State Resource Based
Performance Planning
Resource Based Planning Process
Resource Based Performance PlanningNine Steps of the Performance Planning Process
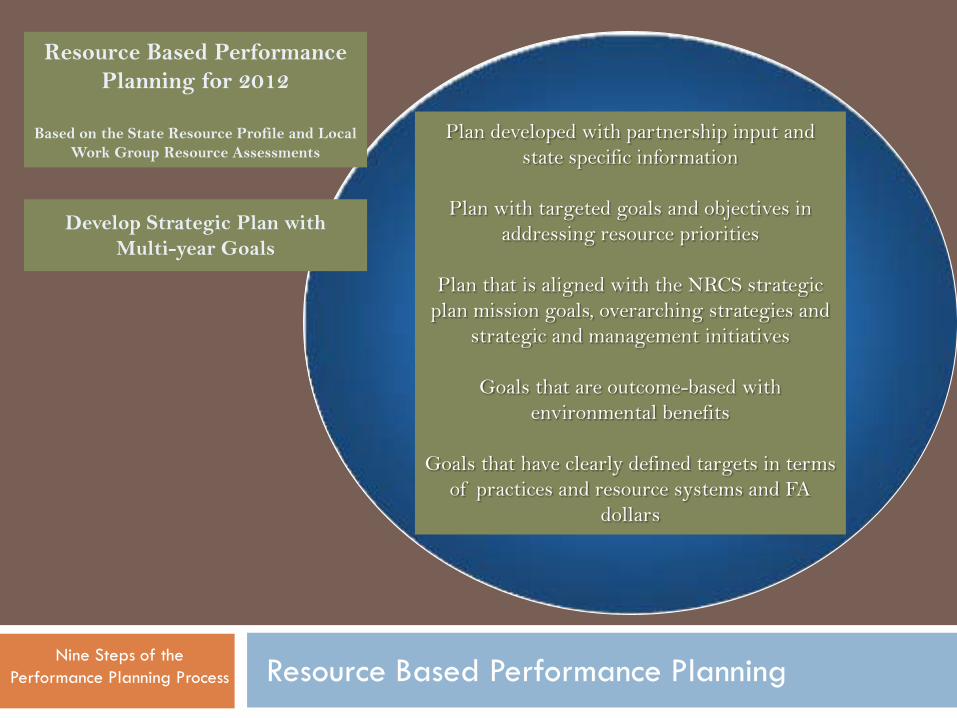
Develop Strategic Plan with Multi-year Goals
Resource Based Performance Planning for 2012
Based on the State Resource Profile and Local Work Group Resource Assessments
Plan developed with partnership input and state specific information
Plan with targeted goals and objectives in addressing resource priorities
Plan that is aligned with the NRCS strategic plan mission goals, overarching strategies and
strategic and management initiatives
Goals that are outcome-based with environmental benefits
Goals that have clearly defined targets in terms of practices and resource systems and FA
dollars

State Resource Assessment Process
NRCS State RBPP process: FY 2011
Washington RBPP process based on RWA methodology
RWA plan models will be based at Team/LWG scale
LWG (CD and partners) input on prioritizing resource concerns and proposed goals
Teams will produce Assessments utilizing the RWA process :Resource Profiles and Matrix Evaluation Tool
Areas Plans (RBPP) will be developed based on Team (RWA) Assessment
State RBPP Plan will be developed from Area Plans
Resource Based Planning Process

Sco
pe(G
eogr
aphy
and
Res
ourc
e Is
sues
)
NRCS Strategic Management Plan (National/Region/State)
Assessments Matrices
Conservation District Business Plan/ AREA Strategic RBPP Plan
Watershed Health Plans
Conservation Plans
NRCS Planning Continuum*
Dec
isio
n M
akin
g
BroadLarge expanses;
multiple states or basins
NarrowIndividual
ownerships within a community
LowSpecificity of
information is broad, not necessarily
place-based
HighSpecificity of
information is place-based, in-depth and
comprehensive
Detail of Information(Data, Alternatives, Decisions)
DirectionalSets basic bounds on topics, issues and problems to address
EnablingDefines staff, funds and other resources; identifies target clientele and may declare criteria to obtain resources
RepresentationalLeaders and stakeholders promulgate desired actions compatible with directional and enabling decision plans
DefinitiveOn-site land and water management decisions by landowners that can be acted upon in the near future
Hydrologic Resource Profiles
* Watershed/Area-wide Planning includes activities that gather resource data, analyze resource conditions, recommend alternatives and evaluate their effects.
Rapid Watershed Assessments
Integrated Watershed Planning
NRCS Planning Continuum
Rapid Watershed Assessment Process
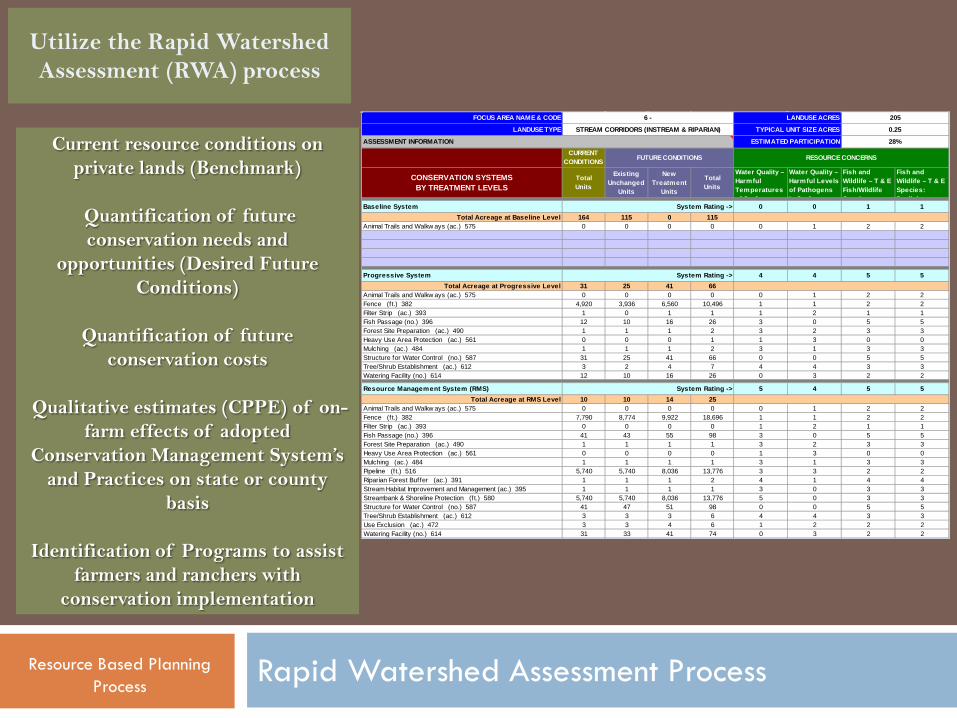
Utilize the Rapid Watershed Assessment (RWA) process
Current resource conditions on private lands (Benchmark)
Quantification of future conservation needs and
opportunities (Desired Future Conditions)
Quantification of future conservation costs
Qualitative estimates (CPPE) of on-farm effects of adopted
Conservation Management System’s and Practices on state or county
basis
Identification of Programs to assist farmers and ranchers with
conservation implementation
Resource Based Planning Process
FOCUS AREA NAME & CODE
LANDUSE TYPE
CONSERVATION SYSTEMSBY TREATMENT LEVELS
TotalUnits
ExistingUnchanged
Units
NewTreatment
Units
TotalUnits
Water Quality – Harmful Temperatures
f S f
Water Quality – Harmful Levels of Pathogens i S f
Fish and Wildlife – T & E Fish/Wildlife S i
Fish and Wildlife – T & E Species: D li i
Baseline System 0 0 1 1Total Acreage at Baseline Level 164 115 0 115
Animal Trails and Walkw ays (ac.) 575 0 0 0 0 0 1 2 2na na na na na na na na nana na na na na na na na nana na na na na na na na nana na na na na na na na na
Progressive System 4 4 5 5Total Acreage at Progressive Level 31 25 41 66
Animal Trails and Walkw ays (ac.) 575 0 0 0 0 0 1 2 2Fence (ft.) 382 4,920 3,936 6,560 10,496 1 1 2 2Filter Strip (ac.) 393 1 0 1 1 1 2 1 1Fish Passage (no.) 396 12 10 16 26 3 0 5 5Forest Site Preparation (ac.) 490 1 1 1 2 3 2 3 3Heavy Use Area Protection (ac.) 561 0 0 0 1 1 3 0 0Mulching (ac.) 484 1 1 1 2 3 1 3 3Structure for Water Control (no.) 587 31 25 41 66 0 0 5 5Tree/Shrub Establishment (ac.) 612 3 2 4 7 4 4 3 3Watering Facility (no.) 614 12 10 16 26 0 3 2 2
Resource Management System (RMS) 5 4 5 5Total Acreage at RMS Level 10 10 14 25
Animal Trails and Walkw ays (ac.) 575 0 0 0 0 0 1 2 2Fence (ft.) 382 7,790 8,774 9,922 18,696 1 1 2 2Filter Strip (ac.) 393 0 0 0 0 1 2 1 1Fish Passage (no.) 396 41 43 55 98 3 0 5 5Forest Site Preparation (ac.) 490 1 1 1 1 3 2 3 3Heavy Use Area Protection (ac.) 561 0 0 0 0 1 3 0 0Mulching (ac.) 484 1 1 1 1 3 1 3 3Pipeline (ft.) 516 5,740 5,740 8,036 13,776 3 3 2 2Riparian Forest Buffer (ac.) 391 1 1 1 2 4 1 4 4Stream Habitat Improvement and Management (ac.) 395 1 1 1 1 3 0 3 3Streambank & Shoreline Protection (ft.) 580 5,740 5,740 8,036 13,776 5 0 3 3Structure for Water Control (no.) 587 41 47 51 98 0 0 5 5Tree/Shrub Establishment (ac.) 612 3 3 3 6 4 4 3 3Use Exclusion (ac.) 472 3 3 4 6 1 2 2 2Watering Facility (no.) 614 31 33 41 74 0 3 2 2
ESTIMATED PARTICIPATION 28%
RESOURCE CONCERNS
System Rating ->
205
TYPICAL UNIT SIZE ACRES 0.25
6 -
STREAM CORRIDORS (INSTREAM & RIPARIAN)
LANDUSE ACRES
ASSESSMENT INFORMATION
System Rating ->
System Rating ->
FUTURE CONDITIONSCURRENT
CONDITIONS

Rapid Watershed Assessment Process
Utilizing the RWA process can also:
Provide information to develop business plans and strategies
Assist NRCS & others to obtain technical & financial assistance
Provide information to prioritize available funding and staff
Provide focus for forming effective partnerships
Resource Based Planning Process
FOCUS ARE NAME & CODE
LANDUSE TYPE
FUTUREInstallation
CostManagementCost - 3 yrs
TechnicalAssistance
InstallationCost
Annual O & M+ Mgt Costs
100% 100% 50% 0% 100%
Progressive System Acres Treated 41Animal Trails and Walkw ays (ac.) 575 0 $1 $0 $1 $2 $0 $0 $0Fence (ft.) 382 6,560 $22,960 $0 $11,480 $34,440 $0 $459 $1,934Filter Strip (ac.) 393 1 $156 $0 $78 $234 $0 $3 $13Fish Passage (no.) 396 16 $82,000 $0 $41,000 $123,000 $0 $1,640 $6,908Forest Site Preparation (ac.) 490 1 $0 $554 $277 $770 $0 $185 $284Heavy Use Area Protection (ac.) 561 0 $15 $0 $7 $22 $0 $1 $3Mulching (ac.) 484 1 $0 $16,074 $8,037 $22,358 $0 $5,358 $8,248Structure for Water Control (no.) 587 41 $492,000 $0 $246,000 $738,000 $0 $9,840 $41,450Tree/Shrub Establishment (ac.) 612 4 $5,658 $0 $2,829 $8,487 $0 $57 $238Watering Facility (no.) 614 16 $16,400 $0 $8,200 $24,600 $0 $492 $2,072
Subtotal $619,190 $16,627 $317,908 $951,913 $0 $18,034 $61,151
Resource Management System (RMS) Acres Treated 14Animal Trails and Walkw ays (ac.) 575 0 $1 $0 $0 $1 $0 $0 $0Fence (ft.) 382 9,922 $34,727 $0 $17,364 $52,091 $0 $695 $2,926Filter Strip (ac.) 393 0 $31 $0 $16 $47 $0 $1 $3Fish Passage (no.) 396 55 $274,700 $0 $137,350 $412,050 $0 $5,494 $23,143Forest Site Preparation (ac.) 490 1 $0 $240 $120 $334 $0 $80 $123Heavy Use Area Protection (ac.) 561 0 $3 $0 $1 $4 $0 $0 $1Mulching (ac.) 484 1 $0 $6,965 $3,483 $9,689 $0 $2,322 $3,574Pipeline (ft.) 516 8,036 $25,715 $0 $12,858 $38,573 $0 $514 $2,166Riparian Forest Buffer (ac.) 391 1 $1,808 $0 $904 $2,712 $0 $54 $228Stream Habitat Improvement and Management (ac.) 395 1 $3,659 $0 $1,830 $5,489 $0 $73 $308Streambank & Shoreline Protection (ft.) 580 8,036 $562,520 $0 $281,260 $843,780 $0 $11,250 $47,391Structure for Water Control (no.) 587 51 $615,000 $0 $307,500 $922,500 $0 $12,300 $51,812Tree/Shrub Establishment (ac.) 612 3 $4,102 $0 $2,051 $6,153 $0 $41 $173Use Exclusion (ac.) 472 4 $43 $0 $22 $65 $0 $1 $5Watering Facility (no.) 614 41 $40,590 $0 $20,295 $60,885 $0 $1,218 $5,129na 0 $0 $0 $0 $0 $0 $0 $0na 0 $0 $0 $0 $0 $0 $0 $0
Subtotal $1,562,899 $7,205 $785,052 $2,354,371 $0 $34,043 $136,982
TOTAL ACRES TREATED / ESTIMATED TREATMENT COSTS 0.1271 $2,182,089 $23,832 $1,102,961 $3,306,284 $0 $52,077 $198,133
Landuse Type28%
System Federal PrivateProg $23,217 $1,491RMS $164,068 $9,546
Estimated FTE per Year 2.2
LANDUSE ACRES 205
CONSERVATION SYSTEMSBY TREATMENT LEVELS
0.25
ESTIMATED PARTICIPATION 28%
New Treatment
Units
Total Present Value Cost
6 -
USDA INVESTMENT
Average PV Costs per Ac
Chart Refers To
Estimated Participation Rate
Total Present Value Cost
CONSERVATION INVESTMENT INFORMATION
STREAM CORRIDORS (INSTREAM & RIPARIAN) TYPICAL UNIT SIZE ACRES
PRIVATE INVESTMENT
EAM CORRIDORS (INSTREAM & RIPAR
56%
80%
32%
15%
12%
5%
0% 20% 40% 60% 80% 100%
Future
Current
Conservation Status Chart
Baseline Progressive RMS

What has been accomplished so far?
Phase ICollection
and
Analysis
Phase IIDecisionSupport
Phase IIIApplication
andEvaluation
Phase ICollection
and
Analysis
Phase IIDecisionSupport
Phase IIIApplication
andEvaluation
1. Identify problems2. Determine objectives3. Inventory resources4. Analyze resource data
5. Formulate alternatives6. Evaluate alternatives7. Make decisions
8. Implement the plan9. Evaluate the plan
Nine Steps of the Performance Planning Process

Local Work Groups
Developed a picture of existing local conditions, trends, problems
and opportunities
LWG Resource Profile -Inventory
Physical Descriptions of LWG Areas
Social and Economic Resource Issues and Observations
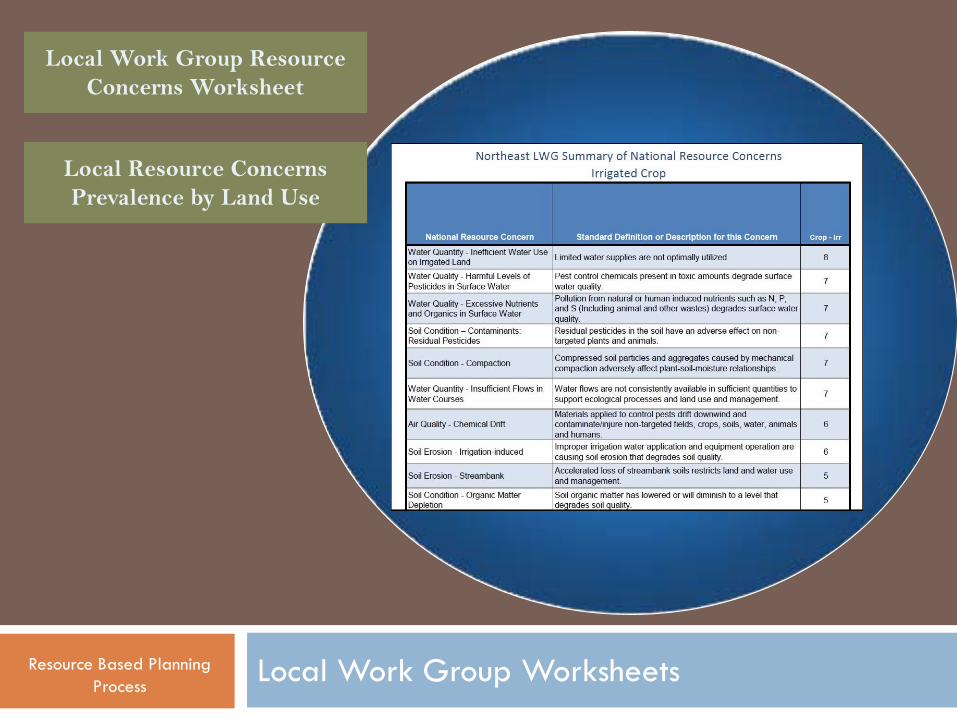
Local Resource Concerns Prevalence by Land Use
Resource Based Planning Process

Local Work Group Worksheets
Physical Descriptions of LWG Areas
Local Work Group Resource Concerns Worksheet
Resource Based Planning Process

Local Work Group Worksheets
Social and Economic Resource Issues and Observations
Local Work Group Resource Concerns Worksheet
Resource Based Planning Process
Local Work Group Worksheets
Local Resource Concerns Prevalence by Land Use
Local Work Group Resource Concerns Worksheet
Resource Based Planning Process

NRCS Statewide Resource Profile
Developed a Statewide Resource Inventory –FY 2010
NRCS Statewide Resource Assessment
Compiled Descriptions of State Resources and Issues
Researched, Obtained and Developed Geospatial Information
and Maps
Resource Based Planning Process
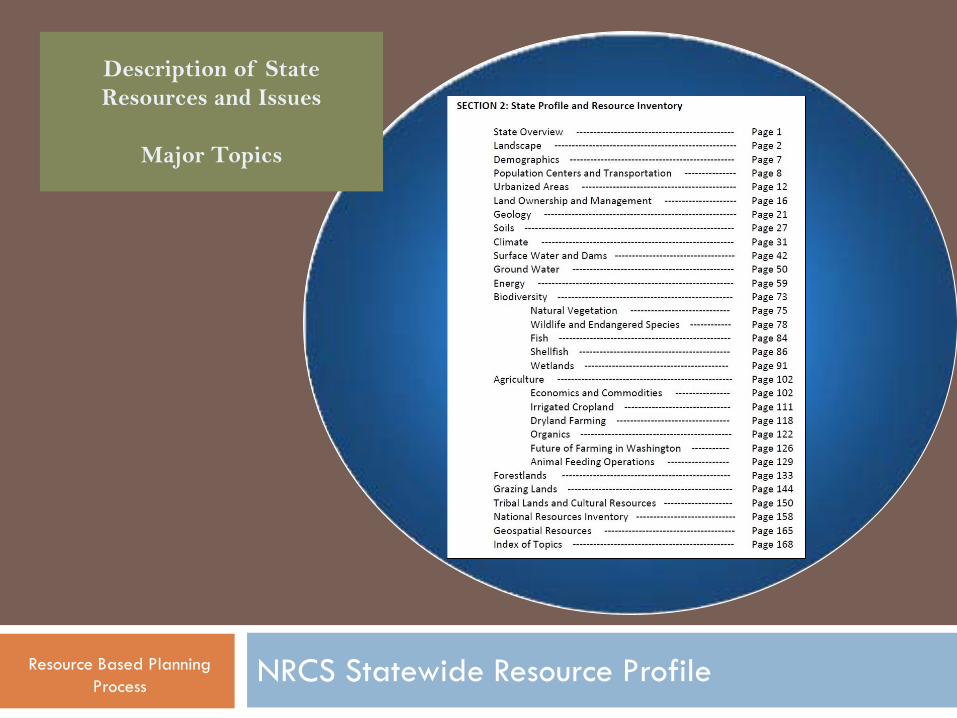
NRCS Statewide Resource Profile
Description of State Resources and Issues
Major Topics
Resource Based Planning Process

NRCS Statewide Resource Profile
Description of State Resources and Issues
Example - Particulates: PM10
Resource Based Planning Process

NRCS Statewide Resource Profile
Researched, Obtained and Developed Geospatial Information and Maps
Example - Major Land Resource Areas with
Croplands Susceptible to Wind Erosion (Source: USDA)
Resource Based Planning Process

NRCS Statewide Resource Profile
Researched, Obtained and Developed Geospatial Information and Maps
Example - Nitrate Vulnerability (Source: USGS)
Resource Based Planning Process

NRCS Statewide Resource Profile
Researched, Obtained and Developed Geospatial Information and Maps
Example: - Grazing Lands (Source: USDA and GAP
Analysis)
Resource Based Planning Process

NRCS Statewide Resource Profile
Researched, Obtained and Developed Geospatial Information and Maps
Example - Non-Industrial Private Forest (Source:
University of Washington)
Resource Based Planning Process

NRCS Statewide Resource Profile
Researched, Obtained and Developed Geospatial Information and Maps
Example - Farmland Classification (Source: USDA)
Resource Based Planning Process

NRCS Statewide Resource Profile
Researched, Obtained and Developed Geospatial Information and Maps
Example - Irrigated and Non-Irrigated Croplands (Source:
WSDA)
Resource Based Planning Process
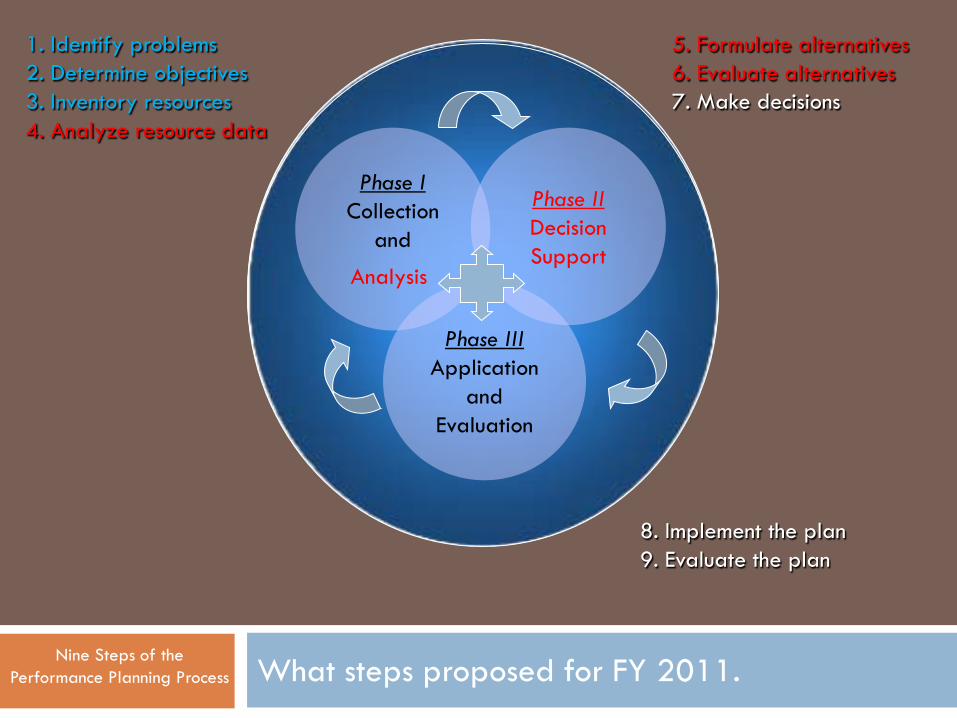
What steps proposed for FY 2011.
Phase ICollection
and
Analysis
Phase IIDecisionSupport
Phase IIIApplication
andEvaluation
Phase ICollection
and
Analysis
Phase IIDecisionSupport
Phase IIIApplication
andEvaluation
1. Identify problems2. Determine objectives3. Inventory resources4. Analyze resource data
5. Formulate alternatives6. Evaluate alternatives7. Make decisions
8. Implement the plan9. Evaluate the plan
Nine Steps of the Performance Planning Process
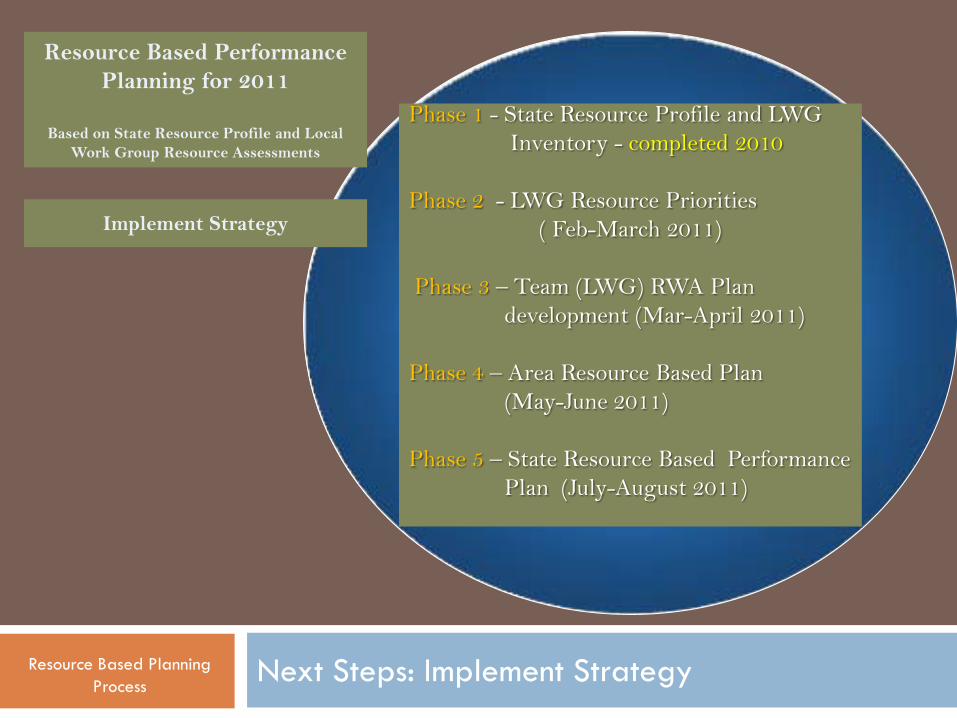
Next Steps: Implement Strategy
Implement Strategy
Resource Based Performance Planning for 2011
Based on State Resource Profile and Local Work Group Resource Assessments
Phase 1 - State Resource Profile and LWGInventory - completed 2010
Phase 2 - LWG Resource Priorities( Feb-March 2011)
Phase 3 – Team (LWG) RWA Plan development (Mar-April 2011)
Phase 4 – Area Resource Based Plan(May-June 2011)
Phase 5 – State Resource Based Performance Plan (July-August 2011)
Resource Based Planning Process

LWG FY 2011 Involvement in Resource Assessment Process
Next Steps for LWG in FY 2011
LWG Defining and Prioritizing of Defined Resource Concerns:
• Identify and Describe Resource Concerns:
• Goal Statement: Desired conditions related to resource concern
• Provide Measurable Objectives.
Resource Based Planning Process

LWG Defining and Prioritizing of Defined Resource Concerns
Resource Based Planning Process
Big Bend Team – Irrigated Cropland, Soil Erosion - Irrigation induced
#1 – Priority resource concern
Description of concern
Irrigation induced erosion in the SE portion of Grant County and the Adams County panhandle (Irrigation Blocks 43-47 of the CBIP) include approximately 100,000 acres of rill irrigated lands eroding at 10-20 tons per acre per year. Lands in excess of 3% slopes have shown erosion rates as high as 30 tons/acre/year. This has been occurring since the start of the irrigation project in 1950’s. Erosion has reduced crop yields, conveyance capacity, surface water quality & negatively impacted wildlife and recreation. If nothing is done to correct the erosion issues there will be continued soil degradation, further reductions of irrigation conveyance and impaired water quality.
Goal statement
Reduce or eliminate irrigation induced erosion through three primary methods:
• Convert from annual cropping to perennial cropping rotations.
• Increase continued conversions from rill irrigation to sprinkler or drip.
• Encourage the use of Polyacrylamide and straw mulch to reduce irrigation induced erosion on lands where rill irrigation is continued.

LWG Defining and Prioritizing of Defined Resource Concerns
Resource Based Planning Process
West Area - Identify and Describe the Resource Concern (draft) 2005 List Resource Concerns: Water Quality – Excessive Suspended Sediment and Turbidity in Surface Water Fish and Wildlife - Habitat Fragmentation Soil Erosion - Road, road sides and Construction Sites Western Washington’s major land use is forestry. In the Puget Sound region alone, 58 percent of the watershed is forestland. The high subalpine forests are in National Park Service, US Forest Service and state ownership. As elevation decreases in the watershed the industrial timberlands are the major land use. Just in the Puget Sound region, the combined private non-industrial and tribal forest lands make up 1.4 million acres. Resource concerns of: Water Quality – excessive suspended sediment and turbidity in surface water; Fish & Wildlife - fragmented habitat for wildlife; and Soil Erosion – road, road sides and construction sites occur on this landscape, mainly due to forest roads. The proposal is to treat those forest roads with accelerated erosion that are depositing increased sediment into waters of the state that affect anadromous and local fisheries. The practices include road shaping, management of road water and road decommissioning, as well as replacing fish passage barriers within the forest road systems. These practices mirror those that the US Forest Service implements on their upper Puget Sound watershed lands. In addition to treating forest roads this proposal will include traditional NRCS forestry practices such as pre-commercial thinning and stand release. Riparian forest buffers will be included, and will also include establishment of woody species diversity and large wood recruitment along the waterways. Outreach activities with local farm forestry groups, state Department of Natural Resources foresters, tribes and conservation districts are anticipated through this proposal. Soil erosion originating from forest access road systems is a contributor to increased sediment load and turbidity in surface waters of the watersheds. Many of the stream and river segments flowing through forestland contain populations of salmonid species, several of which are threatened or endangered. Surface water quality will be improved by treating eligible road segments in close proximity to streams, rivers, and wetlands. A variety of access road improvements such as water bars, culverts, road surface restoration, ditches, cross drains, out-sloping, and in-sloping will be installed. Correction of fish passage barriers will also be offered. Decommissioning critical sections of road and completing rehabilitation to prevent further soil erosion will also be employed. The following list of conservation practices includes the principal practices to be used to facilitate improvements in identified resource concerns.
Conservation Practice Practice Code
Units
Riparian Forest Buffer 391 acre Fish Passage 396 miles Access Control 472 acre Access Road 560 feet Open Channel 582 feet Channel Bed Stabilization 584 feet Forest Stand Improvement 666 acre

LWG Defining and Prioritizing of Defined Resource Concerns
Resource Based Planning Process
Identify and Describe the Resource Concern Answer the following questions. Select other questions you think are relevant. PALOUSE LWG in EAST AREA - EXAMPLE 1. What is the resource concern? Soil Erosion- Sheet and Rill on Cropland: Detachment and movement of soil on non-irrigated cropland by water. When soils are exposed to weather then rain and snowmelt events move soil in broad sheets and numerous rills. The non-irrigated cropland landscape is sloped and comprised of soil types prone to erosion. 2. How large in the problem? Estimated at over 650,000 acres in Spokane and Whitman counties, with the bulk in Whitman county. 3. How severe are the effects? Soil transport degrades water quality in streams and rivers through sedimentation, affecting aquatic habitat, and reducing lifespan of water control structures or requiring costly dredging. Sediment transport to roads and highway structures creates safety hazards increasing costs for road, culvert, and ditch cleaning for local government. It also harms or destroy crops when deposited on adjoining land. Considerable improvement has occurred over time with adoption of crop residue management practices, but the problem and effects are seen annually and after seasonal erosion events. 4. How long has it been a concern? Nearly 100 years, since farming practices in the Palouse began to move to steep lands. Intensive treatment began in the 1970’s, at first structural and then to management. 5. What people are affected? How are they affected? Farmers suffer loss of productivity. Neighbors are impacted by sediment deposits on their cropland, their roads, their ditches. Recreational and irrigation users of streams and rivers are impacted by degraded water quality from degraded fish habitat and silty water in irrigation facilities and equipment. 6. What geographical area is affected? Whitman and Spokane counties are affected, but also counties upstream in Idaho and downstream in Adams and Lincoln counties in WA. 7. What impacts does it have on other natural resources? Soil loss directly degrades water quality and then runoff increases from exposed subsoils which carry eroded soil and also nutrients and pesticides. 8. What will happen if nothing is done to correct the problem? Continued reduction in water quality from sediment, nutrients, and pesticides washed downstream. 9. Why should the general public be concerned about this problem? Considerable public funds are expended cleaning up roads, culverts, ditches, and shipping lanes. Land values decrease when land productivity decreases from loss of productivity from long-term soil loss. Land for food and fiber production is lost.

The End - Questions – Thank you
Washington State Resource Based
Performance Planning
Resource Based Planning Process