Washington State Highway System Plan 2003-2022
203
Washington State Department of Transportation Washington State Highway System Plan 2003-2022 February 2002
Transcript of Washington State Highway System Plan 2003-2022

Washington StateDepartment of Transportation
Washington StateHighway System Plan
2003-2022
February 2002

Washington StateHighway System Plan
2003-2022
February 2002
Transportation Planning OfficeP.O. Box 47340Olympia, WA 98504-7340
www.wsdot.wa.gov/ppsc/planning(360) 705-7962
Washington StateDepartment of Transportation

Americans with Disabilities Act (ADA) InformationPersons with disabilities may request this publication be prepared and supplied
in alternate formats by calling the Washington State Department of TransportationPlanning Office in Olympia at (360) 705-7962. Persons with hearing impairments
may access Washington State Telecommunications Relay Service atTTY 1-800-833-6388, Tele-Braille 1-800-833-6385, Voice 1-800-833-6384,
and ask to be connected to (360) 705-7097.

Preface
Washington State Highway System Plan: 2003-2022 iFebruary 2002
Transportation affects everyone. Whether we are going to work, delivering products, taking avacation, or going to the grocery store, our lives and livelihood depend on a safe, efficient andreliable transportation system. Our state’s population continues to grow, as does the need tomove more people and freight. We need to plan carefully for how we will improveWashington’s transportation system to meet this growing demand.
The document in your hands is the Washington State Highway System Plan (HSP). TheWashington State Department of Transportation (WSDOT) through working partnerships withlocal agencies and tribes throughout the state has developed the HSP to help local authoritiescoordinate their comprehensive planning process with future state highway needs. Thiscoordination helps to ensure that the long-range plans of WSDOT, Regional TransportationPlanning Organizations (RTPOs), and Metropolitan Planning Organizations (MPOs) arecompatible and mutually supportive. (For more about RTPOs, see Appendix C, and for moreabout WSDOT, see Appendix D or www.wsdot.wa.gov)
The HSP is updated every two years and guides WSDOT in prioritizing and budgeting forhighway projects. The HSP is also a primary element of Washington’s Transportation Plan(WTP).
The WTP addresses future needs for all transportation facilities that are owned and operatedby the state including the state highway system, Washington State ferries, and state-ownedemergency and general aviation airports. The WTP also addresses transportation facilities andservices that are owned and operated by others but are important to the overall transportationneeds of Washington’s citizens. These “state interest” facilities and services include those forbikes and pedestrians, public transportation, freight and intercity passenger rail, marine portsand navigation, and aviation.
Together the WTP and HSP assess future transportation needs through a collaborative planningprocess with local governments, regional planning agencies, and private transportationproviders to ensure that the transportation system provides convenient, reliable, safe, efficient,and seamless connections and services.
To view or download a copy of all or portions of the Washington State Highway System Planor Washington’s Transportation Plan, visit our Internet website at www.wsdot.wa.gov/ppsc/planning. To obtain a printed or electronic copy on CD, call or write to:
Washington State Department of TransportationTransportation Planning OfficeP.O. Box 47370Olympia, WA 98504-7370
The Washington State Transportation Commission, www.wsdot.wa.gov/commission, welcomesyour comments on this and future transportation plans. You can send comments to theWSDOT Planning Office by e-mail at [email protected], mail at the address shown above, orphone (360) 705-7962.

ii Washington State Highway System Plan: 2003-2022February 2002

Contents
Preface ............................................................................................................................... i
Introduction ................................................................................................................. 1
Highway System Plan History ..................................................................................... 2
Highway Program Overview ....................................................................................... 3Maintenance ............................................................................................................... 3Operations .................................................................................................................. 4Preservation ................................................................................................................ 4
Pavements ............................................................................................................ 4Structures .............................................................................................................. 5Other Facilities ..................................................................................................... 5
Improvements ............................................................................................................ 6Mobility ................................................................................................................ 6Highway Safety ..................................................................................................... 9Economic Initiatives ............................................................................................ 9Environmental Retrofit ........................................................................................ 9
Highway System Needs .............................................................................................. 11
Planning, Programming and Budget ........................................................................ 13
20-Year Plan Needs By Program ................................................................................ 16
AppendicesAppendix A: List of Acronyms ............................................................................... A-1Appendix B: Glossary ............................................................................................. B-1Appendix C: Regional Transportation Planning Organizations ...........................C-1Appendix D: Washington State Department of Transportation Regions..............D-1Appendix E: State and Federal Statutory Requirements ....................................... E-1Appendix F: Highways of Statewide Significance ................................................. F-1Appendix G: Development Impacts Assessment .................................................. G-1Appendix H: Maintenance Accountability Process .............................................. H-1Appendix I: Capital Improvement and Preservation Program ............................. I-1Appendix J: Highway Program Objectives and Action Strategies ........................ J-1Appendix K: 20-Year Improvement Strategies ....................................................... K-1
Mobility Strategies ..................................................... Lavendar SectionSafety Strategies .............................................................. Yellow SectionEconomic Initiative Strategies ........................................... Blue SectionEnvironmental Retrofit Strategies .................................. Green Section
Washington State Highway System Plan: 2003-2022 iiiFebruary 2002


Introduction
The Washington State Highway System Plan (HSP) is the element of Washington’sTransportation Plan (WTP) that addresses the state’s highway system. The HSPincludes a comprehensive assessment of existing and projected 20-year deficiencieson our state’s highway system. It also lists potential solutions that address thesedeficiencies. The Plan:
Forecasts future transportation needs based on the Washington StateDepartment of Transportation’s (WSDOT) maintenance, operation,preservation, mobility, safety, economic, and environmental programs.
Specifies objectives and the supporting action strategies for our statehighway system (see Appendix J).
Serves as the basis for the capital investment goals and strategies andassessment of needs for each program.
The Washington State highway system plan encompasses the following elements:
Maintenance, operation, and preservation of over 7,000 centerline miles ofstate and interstate highway system. These state and interstate highwaysform the backbone of Washington’s surface transportation system bynetworking with more than 73,000 centerline miles of city, county, state, andfederal roads. In addition, this network includes ten year-round mountainpasses, 43 rest areas, approximately 75,000 catch basins and culverts, over3,000 bridges, 34 tunnels, and many other highway elements.
Improvement of the state highway system’s capital and operationalinfrastructure to increase efficiency, reduce congestion, enhance safety,promote economic initiatives, and protect the environment.
Washington State Highway System Plan: 2003-2022 1February 2002

Highway System Plan History
The Highway System Plan was initially developed in response to three significant actionsthat occurred in the early 1990s. The first action was passage of the federal IntermodalSurface Transportation Efficiency Act (ISTEA) in 1991. This federal law changed the wayfederal transportation dollars were allocated to states. ISTEA also promoted integratedplanning for all modes of transportation (for example, highway, transit, and rail) andrequired that major metropolitan areas comprehensively plan for transportationimprovements in an integrated manner. This mandated joint planning required muchgreater agency coordination than ever before.
The second action was the passage of the Growth Management Act (GMA) by theWashington State Legislature in 1990. This state law mandated that the fastest growingand most populous counties and the cities within them must plan for future growth anddevelopment. Local agencies then developed comprehensive plans, with transportationas a key element.
Finally, in 1993, another new state law, RCW 47.06.050 (Revised Code of Washington,state-owned facilities component) mandated the development of a state highway systemplan (see Appendix E).
The development of the Highway System Plan:
1995Completed the first HSP. Published the 1995-2014 HSP
1996Published the 1997-2016 HSP.
1998Published the 1999-2018 HSP. (Technical update for all programs; no policychanges.)
1999Published the 2001-2020 of HSP. (Safety subprogram, urban bicycle, andpedestrian risk categories updated.)
2002Published the 2003-2022 HSP.
2 Washington State Highway System Plan: 2003-2022February 2002

Highway Program Overview
WSDOT maitenance crews performavalanche control and snow removalon 10 mountain passes.
A Maintenance crew paints the fog linestriping on U.S. 97 near the ColumbiaRiver.
The Deception Pass Bridges connect Fidalgo and Whidbey Islands.
The geography of Washington Stateprovides unique challenges fortransportation planning. Washington’sroadway system is made up of over73,000 centerline miles of state andlocal roads, which include over 3,000bridges and numerous tunnels, alllinked to an extensive freight andpassenger rail system, the largest ferrysystem in the nation and numerous marine ports and airports.
The condition of the state’s highway system is critical tothe movement of people and freight. Many roads andbridges, and their electrical systems, catch basins, andculverts have reached or are approaching the end of theirlife span. All of these highway system elements requirecontinual maintenance to preserve and protect ourtransportation investments. Furthermore, some of theseelements are no longer functionally adequate to providethe level of service required to maintain an efficientnetwork.
WSDOT manages this complex system through four majorprograms: maintenance, operations, preservation andimprovements. Some of these programs are divided into subprograms focusing on specificneeds. The programs and subprograms are:
Maintenance (Program M)
The maintenance program protects highway infrastructure and functional operation of thehighway system. Maintenance includes patching potholes and sealing roadway cracks;painting stripes and stop bars on the roadway; fixing damage to guardrails or fences;
cleaning ditches and culverts;controlling the spread ofnoxious weeds; andperforming bridge and tunnelmaintenance. Servicesinclude plowing, sanding oranti-icing roads duringwinter; cleaning rest areas;servicing lights and signals;and patrolling for roadwaydebris. WSDOT maintenancecrews are also the first line of
defense for the roadways when natural disasters such asmud slides or floods occur. This program is publiclyaccountable through the Maintenance AccountabilityProcess (MAPS) (see Appendix H) or visit their web site atwww.wsdot.wa.gov/fossc/maint/ then click "MaintenanceAccountability Process."
Changing signal lights is just onepart of Maintenance's program.
Washington State Highway System Plan: 2003-2022 3February 2002

Operations (Program Q)
The operations program is responsible for working towards squeezing the most capacity outof the existing highway transportation system. This work involves timing traffic signals,operating ramp meters, monitoring freeways, responding and clearing incidents, andproviding traveler information.
Traffic operations also works to operate the highway system as safe as possible for thetraveling public. This work involves investigating the public concerns about highwaysafety and using regulatory measures and traffic control devices as primary tools forimproving safety. The demands on this program have grown quickly with the increasedneed to maximize efficiency and safety on the highway transportation system asconstruction investment declines and the traffic continues to grow.
Preservation (Program P)
The preservation program addresses the long-term preservation of the existing highwayinfrastructure. This program is made up of three subprograms for specific elements of thehighway system:
Pavements (Subprogram P1)
Roadways require periodic resurfacing to keep the driving surface smooth and safeand to preventfailure of the underlying sub-structure. WSDOT’s policy is toresurface specific highway segments when it is most economical to do so. Ifresurfacing is done too early, pavement life is wasted. Resurfacing that is donetoo late requires additional costlyrepair work and increases the risk offailure of the underlying surfacestructure.
There is currently a backlog of pave-ment preservation needs that havegone beyond the point of economicalresurfacing (lowest lifecycle cost).This backlog will result in a highercost of rehabilitation. The HSPoutlines the level of funding that willachieve lowest lifecycle cost pavingwhile eliminating the backlog ofneeds. Doing so will result in lowerpreservation and maintenance costsin the later years of the plan.
Highway Program Overview
The most ecomonical timing of paving saves the mostmoney, as seen on this Eastern Washington highway.
4 Washington State Highway System Plan: 2003-2022February 2002

Structures (Subprogram P2)
This subprogram includes replacement of old bridges, seismic retrofit of bridges,bridge painting, bridge deck overlay,tunnel repair, and bridge inspection.
The investment made in recent yearsfor seismic retrofit to bridges appearsto have paid off, as many structuressurvived the February 28, 2001, 6.8magnatude Nisqually Earthquake withlittle or no damage. However, somestructures were heavily damaged andrequire considerable repair orreplacement.
There are currently over 3,000 bridgeson our state highway system. Nearlyone-third were constructed over40 years ago and will require majorrehabilitation or replacement in the near future. Approximately 700 of WSDOT’sbridges have been rated “functionally obsolete” and do not comply with today’sstandards for roadway width or load carrying capacity.
Replacing these functionally obsolete bridges over the next 20 years is critical topreserving many of the connections made within the state’s highway system. Thereplacement of these outdated structures will ensure the efficiency, capacity, andsafety of our highway system.
Other Facilities (Subprogram P3)
This subprogram provides for rehabilitation or replacement of unstable slopes,failing drainage systems, and failing or outdated electrical (lighting), electronic(information systems), and mechanical systems. This subprogram also supports the
refurbishment of safety rest areas. Keeping thesefacilities in good condition is an importantelement of highway safety and efficiency. Slopesor drainage systems are also attended to, sincefailures can result in major road closures causingmotorist delays, detours and high costs associatedwith replacing entire roadway sections. Alsoincluded in this subprogram is the construction ofweighing facilities, which help to prevent damagecaused by overweight trucks.
The Hood Canal Bridge on State Route 104 links theKitsap and Olympic Penninsulas.
Highway Program Overview
A large mud slide near Hood Canaldestroyed this section of U.S. 101 nearEldon. This caused traffic to be detouredfor several months while the hillside wasstabilized and a new roadway built.
Washington State Highway System Plan: 2003-2022 5February 2002

Improvements (Program I)
This program identifies the deficiencies in the size,design, and/or location of the highway system andidentifies potential solutions to solve the deficien-cies by building new capacity or modifying exist-ing facilities. These capital projects represent asignificant investment to improve the state’shighways. The I Program is divided into foursubprograms:
Mobility subprogram – builds projectsthat create new roads and/or modifies theexisting highways to reduce congestionand improve operational efficiencies;
Safety subprogram – modifies existing highways to increase safety;
Economic initiative subprogram – modifies existing highways to supportthe economic health of the state; and
Environmental retrofit subprogram – corrects outdated features that areprimarily drainage related on existing highways that otherwise could lead todamage to the environment.
Mobility (Subprogram I1)
This subprogram’s projects create new roads and/or modify existing highways torelieve congestion and improve operational efficiencies. These projects typicallyfocus on moving people, connecting differentmodes of travel, and supporting alternative modesof transportation. Many people in the state agreethat congestion in the urban centers of the stateseverely damages the economic competitiveness ofthe state.
Highway Program Overview
HOV lanes, like these on Interstate 405,increase the movement of people.
Congestion in Seattle and other urbancenters can damage the economics ofthe entire state.
6 Washington State Highway System Plan: 2003-2022February 2002

Highway Program Overview
Included in the HSP is a broad mix of strategies to address congestion. Theseinclude adding new highways and lanes, optimizing highway operationalefficiencies, and managing demand on the highways to reduce travel delay withinheavily congested highways.1 The mobility subprogram includes some of the mostcostly and important capital investments including:
Roadway Expansion to increase system capacity through capitalinvestments in highway widening, improving connections andpassing/climbing lanes.
Managing Access to state highways by limiting driveways and cross trafficpreserves highway capacity where growth is expected and maximizesexisting highway capacity and safety where development has occurred.
In addition, the HSP includes strategies that focus on moving more people ratherthan more cars. These strategies support regional transit and bus systems, as well astransportation demand management strategies.
The HSP includes the following:
Emphasis on High Occupancy Vehicle (HOV) Lanes to provide morereliable and faster travel times during congested conditions for transit,vanpool, and car pool users.
Park & Ride Lots which make car and vanpooling and riding the bus more conve-nient.
Bicycle and Pedestrian Strategies integraterelatively low-cost strategies, local andurban bicycle, and pedestrian networks.
1 Congestion is typically defined by when, how often, and for how long a driver is delayed or even stopped. Withthe varying geographic conditions of the state, defining congestion on a statewide basis is a difficult task, as is theproblem of identifying highway segments for the purpose of qualifying for congestion relief investment. In thepast, WSDOT compared each highway’s peak hour volume to capacity (V/C) ratio. This method demonstratedcongestion levels only during the peak hour but many segments of highways experience congestion outside of the“peak hour,” something the V/C method does not measure.
A more refined deficiency analysis was developed and used in this HSP. The new analysis uses an array of data totake account of the severity of congestion over a 24-hour period. Index values under the new system range from1 (little to no congestion) to 24 (theoretically congestion over the entire 24 hours in a day). This congestionindicator enables the comparison of each highway’s daily volume of traffic to a one-hour capacity.
The Washington State Transportation Commission adopted thresholds to establish “congested” highways at theindex values of 10 for urban highways and 6 for rural highways, (for Island County, index values of 12 for urbanhighways and 10 for rural highways are applied). When compared to traditional technical measures, thesethresholds are approximately equivalent to Level of Service (LOS) “D” operation in urban areas and LOS “C”operation in rural areas. Highways above these threshold index values are identified as deficient. (For more abouttraffic LOS, see the Glossary in Appendix B and for details about Development Impacts, see Appendix H).
Park&Ride lots, like this one in KingCounty, are adding to congestion relief.
Washington State Highway System Plan: 2003-2022 7February 2002

Expanding roadway capacity and moving more people with fewer vehicles are congestion reliefstrategies that are coordinated with operational strategies both to squeeze the most capacity out ofthe existing infrastructure and also to ensure the effective use of additional infrastructure that isadded. Examples of these operational strategies include:
Ramp Metering addresses recurring congestion, which is the result of too many vehicles onthe freeway during rush hours and not enough space. Ramp metering regulates vehiclesentering the freeway to maintain optimal flow. Thebenefits of ramp metering include increase in freewayspeeds and reduction of accidents (I1 for Constructionof ramp meters/Q for operation of the ramp meters).
Driver and Traveler Information Systemsconsists of roadway condition and congestioninformation, construction, maintenance and ferrydelay information, and emergency and roadclosure information. Providing motorists withthis information allows them to make route ortiming decisions before or during their trip (I1,I2, I3, and Q for construction/Q for operation ofthe driver and traveler information systems).
Incident Response Teams respond immediately to accidents or other incidents such ashazardous material spills. Rapid response to freewayincidents reduces delay caused by these incidents.WSDOT tow truck operations on the Lake Washingtonfloating bridges and the roving service patrols are alsopart of this activity (Q for purchase and operation ofincident response vehicles).
Synchronizing Traffic Signals helps to keep arterialtraffic flowing. Regular retiming of traffic signalsensures the most effective movement of vehiclesalong arterials with efficient coordination andminimal delay. WSDOT continues to evaluatenew technological advances and will use proventechnology where it is shown to increase theefficiency of the transportation system (I1, I2, andQ for construction of signals/Q for operation of thetraffic signals).
Highway Program Overview
Ramp metering on Interstate 5 near theUniversity of Washington in Seattle.
WSDOT Incident Response Teams help toclear incidents throughtout the state, like thisone near Tumwater.
8 Washington State Highway System Plan: 2003-2022February 2002

Highway Program Overview
Safety (Subprogram I2)
In 1999, over 600 lives were lost on Washington State highways. The objective of thissubprogram is to reduce and prevent; deaths, the frequency and severity of disablinginjuries, and the societal costs of accidents. Therefore, safety projects on Washington Statehighways have two primary focuses.
The Accident Reduction Category of the safety program has two elements. The HighAccident Location (HAL) program address spot locations. The High Accident Corridor(HAC) program addresses sections of highway greater than a mile in length for accidentand severity reduction.
The Accident Prevention Category address locations that exhibit near misses or high risk ofcollision occurrence. It allows WSDOT to address potentially hazardous situations beforethey become a problem. This sub-category has four separate strategies for prevention ofaccidents. Risk identifies corridors with geometric and roadside elements that contributeto accident probability and increased accident severity respectively. The Signal andChannelization sub-category allows WSDOT to install signals and channelization atlocations that would benefit from new traffic control devices. The At-Grade intersectionsub-category is used to target high-speed multi-lane divided highway intersections thatexhibit high accident potential. The interstate safety matrix targets improvement on thestate’s interstate system.
Economic Initiatives (Subprogram I3)
The economic initiative subprogram targets highway improvements to support state,regional, and local economies. The improvements also support the tourism sector of theeconomy through Heritage Corridors, safety rest areas, bicycle touring routes, and travelersupport services. Economic development is also addressed in this program through highwayimprovements that have direct benefits to local economies, especially in rural communities,supporting the creation and retention of jobs and increasing economic vitality.
Environmental Retrofit (Subprogram I4)
This subprogram seeks to retrofit elements of the existing highway system to meet environ-mental requirements that have emerged since the highways were built. The environmentalretrofit subprogram is in addition to WSDOT’s ongoing commitment to avoid and minimizeenvironmental impacts as a part of all highway system improvement, preservation, andoperations projects.
Stormwater Runoff RetrofitThis strategy is used for implementing stormwater treatment and outfallimprovements on prioritized segments of state highways that will not seecorrective action through other WSDOT preservation and improvementprograms. The purpose of retrofitting for stormwater is to lessen the adverseaffects on nearby water bodies from the quantity or quality of roadway runoff.This strategy also includes maintaining an inventory and priority list of allWSDOT outfalls within designated areas.
Washington State Highway System Plan: 2003-2022 9February 2002

Highway Program Overview
Fish Barrier Removal
State law (RCW 77.55.060) requires that anowner remove stream obstructions that preventthe free passage of fish. For the state highwaysystem, these obstructions are typically culvertsthat convey a stream under a roadway.Removing obstructions allows fish to migrateupstream and access habitat areas for spawningand other life cycle needs. The WashingtonState Department of Fish and Wildlife hassurveyed or is surveying all WSDOT-ownedculverts on the state’s highway system todetermine those that impede fish passage. These surveys characterize the habitatupstream from each obstruction; specific projects are then prioritized and scheduledbased upon this information.
Noise Reduction
This strategy strives to reduce unacceptably high traffic noise levels on nearbyresidential neighborhoods that were built before mid-1976. Noise reduction istypically achieved by the construction of anoise barrier located between the highwayand the neighborhood. This strategy doesnot address noise impacts created by newimprovement projects. WSDOT evaluatesnoise impacts, conducts on-site inspections,and determines priorities. Project locationsare prioritized based on a benefit/cost ratio.The ratio is calculated by dividing the noisemitigation benefits by the cost of the mitiga-tion. This program is administered underFederal Highway Administration (FHWA) andWSDOT policies.
Air Quality
This strategy provides for the implementation of transportation control measuresspecifically identified in the Statewide Implementation Plan (SIP) for Air Quality orthe Highway System Plan. Only projects located in areas where National AmbientAir Quality Standards are exceeded are eligible.
Chronic Environmental Deficiency
This strategy provides for highway improvements to specific locations whererepeated maintenance and preservation activities create unacceptableenvironmental impacts. Projects identified as chronic environmentaldeficiency problems are prioritized using an environmental retrofit index,which gives special weight to protection of fish habitat.
Textured noise walls provide barriers toneighborhoods that have been impacted byhighway traffic noise.
Salmon sometimes appear within weeksof opening up a new culvert.
10 Washington State Highway System Plan: 2003-2022February 2002

Highway System Needs
WSDOT has identified the financial need of the state highway system through acollaborative process with its transportation planning partners. We have developedtransportation solutions based on the goals, objectives, and action strategies, in the WTP,adopted by the Washington State Transportation Commission. A comprehensive listing ofthe 20-year state highway system improvement strategies including planning level costestimates have been compiled in Appendix K. (The entire database can be viewed atwww.wsdot.wa.gov/ppsc/planning)
The chart below illustrates the 20-year need in each of the WSDOT program areas duringthe 20-year period of this plan (Figure1).
Washington State Highway System Plan Needs for 2003-2022Total Need: $57.0 billion
(Dollars shown below in billions – 2001 dollars)
Figure 1. The 20-year Highway System Plan is structured by objectives and action strategies forhighway system facilities and maintenance and operations services. Since funding is not available tomeet all the identified needs, priorities must be set. The plan is focused on taking care of the existingsystem first by establishing targets to fully fund Maintenance (M), Traffic Operations (Q), andPreservation (P) programs. Tradeoff decisions must be made to distribute any remaining fundingamong capital improvement areas: Mobility (I1), Highway Safety (I2), Economic Initiatives (I3), andEnvironmental Retrofit (I4). These improvement areas are subject to the discretion of futureprogramming decisions to balance long- and short-term strategies to meet 20-year HSP targets.
WSDOT forecasts $12.8 billion in revenue from current transportation revenue sourcesto address state highway system needs through the year 2022. The total financialneed identified in the HSP through 2022 for the state highway system is estimated at$57 billion. The gap between highway needs and existing transportation revenueswidens as investments fail to keep pace with growth. In order to meet growing needs,additional funding is necessary.
Washington State Highway System Plan: 2003-2022 11February 2002
Safety (I2) – $2.2
Economic Initiatives (I3) – $2.6
Environmental Retrofit (I4) – $1.3
Maintenance (Program M) – $3.3
Operations (Program Q) – $0.6
Preservation (Program P) – $8.8
Improvements (Program I) – $44.3
Mobility (I1) – $38.2

12 Washington State Highway System Plan: 2003-2022February 2002

The Washington State Transportation Commission (WSTC) establishes transportationpolicy as required by the Washington State Legislature. The WSTC consists of sevenmembers appointed by the Governor. The WSTC provides oversight to ensure that thedepartment delivers a quality, multimodal transportation system that moves people andgoods safely and efficiently. The WSTC also proposes transportation planning and fundingrecommendations for submission to the Legislature.
WSDOT in turn, is required to plan for the maintenance, preservation, operation andimprovement of the state owned transportation network in accordance with WSTC Policy,state laws, and federal requirements (see Appendix E).
The HSP is the result of a statewide planning process. This plan is developed to beconsistent with local, regional, and state policies. Public comment and participation isalso actively solicited. Through this planning process and projected available resources,transportation projects are selected for programming, design, and construction.
Planning to Programming
The HSP identifies approximately 9,700 highway system solutions with anestimated cost of $57 billion. Current law revenue projected over the 20 yearsof this plan is approximately $12.8 billion. Given this shortfall of revenues versusneeds, priorities must be set. In accordance with state law (RCW 47.05) WSDOTuses a priority programming process to determine which capital investments(construction projects) will be built within the current biennium, the forthcomingsix years and the forthcoming 10 years.
WSDOT prioritizes the projects that are selected from the HSP and incorporatesthose prioritized projects into the 10-year Capital Improvement and PreservationProgram (CIPP) (see Appendix I).
Figure 2: The outer ring reflects all highwaysystem needs identified in the 20-year HighwaySystem Plan. The list is the basis for the 10-yearCapital Improvement and Preservation Program.The list is reduced to create the six-year planbased on anticipated and projected revenues.Then, based on available funding, a two-year(biennial) budget is approved by the Legislature.
Planning, Programming and Budget
20-YearObjective Needs
10-YearImplementation
Plan
Six-YearPlan
Two-Year Budget
Washington State Highway System Plan: 2003-2022 13February 2002

Project Building
Once identified for possible funding, every project proposal is reviewed to ensurethat the maximum benefit can be achieved for the public. Conceptual solutions areorganized by state route and milepost to identify all potential project elementswithin a highway segment, (e.g., P1 paving, I2 safety improvements, and P3 majordrainage rehabilitation – see map in Figure 3 below). The next step is to coordinatethe implementation of these solutions into efficient projects that maximize avail-able resources and minimize impacts to traffic flow.
Planning, Programming and Budget
14 Washington State Highway System Plan: 2003-2022February 2002
Monroe
Duvall
Snohomish County
King County
Redmond
522203
203
2
SnoqualmieRiver
To Carnation
To Everett
To Stevens Pass
To Bothell
Skykomish River
P1 - PavingAsphalt
I2 - Highway SafetyHigh Accident Location
P3 - Major DrainageCulvert Replacement
Figure 3.For example, on State Route 203 (near Duvall in King County), thepavement is at its life cycle limit, meaning that WSDOT should repave theroadway now in order to prevent the need for more costly repair at a laterdate. Since repaving is needed now, other deficiencies within the area areexamined to see if it would be more efficient to solve those deficiencies aspart of the same project. Combining a drainage rehabilitation and asafety improvement on or near the same roadway segment into the sameproject would allow all the work to be done at a lower cost with lessinconvenience to the public than if the projects were performed separately.

Improving WSDOT Planning Efforts
Coordination of planning efforts between city, county, MPO, RTPO, publicand private transportation provider, and state transportation plans is requiredby federal and state law. It also makes good business sense. Coordination oftransportation planning is a cyclical process and begins as a bottom-upapproach (see Figure 4 below).
Cities and counties develop comprehensive plans to manage growth withintheir respective boundaries. Among other components, each comprehensiveplan contains a land use element and a transportation element, which must beconsistent with each other. The transportation element supports the land useelement. For the majority of Washington cities and counties, the requirementsin the Growth Management Act guide the development of local comprehensiveplans. MPOs and RTPOs coordinate and develop metropolitan and regionaltransportation plans that are based on the local comprehensive plans.
Washington StateTransportation
Policy(Established by theWashington State
TransportationCommission)
Highway SystemPlan
Component ofWashington
Transportation Plan20 Year Needs for
State-OwnedHighway System
RCW 47.06.050CFR 450.214Statewide
TransportationImprovement Plan
Adopted by FHWA
CFR 450.216
Regional andMetropolitan
Planning
20 YearRegional
Transportation Planand Metropolitan
Transportation Plan
RCW 47.80.030CFR 450.322
City and CountyPlanning
Individual LocalComprehensive
Six YearInvestment Plans
RCW 36.70A.070
Goal
CompatibleStatewidePlanning
IntegratingTransportationand Land Use
Figure 4. Illustrates the general relationshipsbetween the various transportation planningprocesses and organizations.
Statewide Planning Cycle
Planning, Programming and Budget
Washington State Highway System Plan: 2003-2022 15February 2002

20-Year Plan Needs By Program
Millions
(2001 dollars)
Maintenance (Program M)Snow and Ice Control .........................................................................................................$710Traffic Services ....................................................................................................................$611Roadway Maintenance and Operation ...............................................................................$553Drainage Maintenance .......................................................................................................$405Roadside and Landscape Maintenance ...............................................................................$387Bridge and Urban Tunnel Maintenance ..............................................................................$368Repair and Disaster Maintenance .......................................................................................$206Safety Rest Areas-Maintenance and Operation ..................................................................... $98Maintenace Total .......................................................................................... $3,337
Operations (Program Q)Traffic Flow Control ............................................................................................................$207Low Cost Safety Enhancements ..........................................................................................$104Traffic Flow and Safety Investigations ...................................................................................$84Low Cost Enhancements ......................................................................................................$68Traveler Information Systems ...............................................................................................$43Advanced Technology for Commercial Vehicles ...................................................................$40Local Partnership Traveller Information ................................................................................ $21Dispatch and Traffic Control .................................................................................................$20Low Cost Traveler Information ............................................................................................... $5Expand CVISN Statewide ....................................................................................................... $3Tourist Attraction Signing ....................................................................................................... $1Operations Total .............................................................................................. $596
Preservation (Program P)
Pavements - P1Pavement (PCCP) ........................................................................................................... $1,696Pavement (ACP) ............................................................................................................. $2,173Pavement (BST) ..................................................................................................................$206Other P1 .............................................................................................................................$456Pavements Total ........................................................................................... $4,530
Structures - P2Bridge Replacement ....................................................................................................... $1,051Seismic Retrofit ...................................................................................................................$275Bridge Painting ...................................................................................................................$177Bridge Decks ........................................................................................................................$85Miscellaneous Structures ......................................................................................................$61Movable Bridges ...................................................................................................................$43Scour Mitigiation ..................................................................................................................$12Structures Total ............................................................................................ $1,704
Other Facilities - P3Unstable Slopes .............................................................................................................. $2,045Traffic Control Systems .......................................................................................................$155Weight Facilities .................................................................................................................$129Electronic/Mechanical Systems ..........................................................................................$120Major Drainage ....................................................................................................................$51Safety Rest Area Refurbishment ............................................................................................$18Other Structures Total .................................................................................. $2,518
Preservation Total ........................................................................................ $8,752
These costs are based on the reported conditions of the state highway system and the specificaction strategies identified by program/subprogram. (2001 Dollar values in millions)
16 Washington State Highway System Plan: 2003-2022February 2002

20-Year Plan Needs By Program
Millions
(2001 dollars)
Improvements (Program I)
Mobility - I1Congested” HSS ........................................................................................................... $32,192Congested” non-HSS ..................................................................................................... $4,064Puget Sound Core HOV Lanes ........................................................................................ $1,264Access Management for Non-Developed Corridors ...........................................................$320Access Management for Developed Corridors ....................................................................$167Urban Bicycle .....................................................................................................................$103Multi-Modal Facilities ...........................................................................................................$58Mobility Total ............................................................................................. $38,168
Highway Safety - I2High Accident Corridors (HAC) ..........................................................................................$677At Grade Intersections ........................................................................................................$583Risk Reduction ....................................................................................................................$430High Accident Locations (HAL) ...........................................................................................$269Signals and Channelization ................................................................................................$141Interstate Safety .................................................................................................................$129Safety Initiatives ...................................................................................................................$21Pedestrian Risk ......................................................................................................................$11Pedestrian Accident Locations (PAL) ....................................................................................... $0Highway Safety Total ................................................................................... $2,260
Economic Initiatives - I3 International Trade & Port Access .....................................................................................$516 Avalanche and Flood Closures .............................................................................................$34 Freight Trunk System .........................................................................................................$266 All Weather Roadways (Freeze/Thaw) ..................................................................................$80 Height Restricted Bridges ....................................................................................................$41 Columbia/Snake River Accommodations .............................................................................$38 Bridge Overloads .................................................................................................................$27 Border Crossings .................................................................................................................$12 Economic Vitality ...............................................................................................................$475 Bicycle Touring Routes ......................................................................................................$585 Heritage Corridor Plans .....................................................................................................$124 Safety Rest Area ...................................................................................................................$54 Heritage Corridors Parks and Viewpoints .............................................................................. $1 Economic Initiatives Total ........................................................................... $2,563
Environmental Retrofit - I4Stormwater .................................................................................................................... $1,134Fish Barriers ........................................................................................................................$131Noise Reduction ...................................................................................................................$52Chronic Environmental Deficiencies .....................................................................................$40Air Quality .............................................................................................................................. $0Wetland Mitigation ................................................................................................................ $0Environmental Retrofit Total ....................................................................... $1,357
Improvement Total ..................................................................................... $44,349
Grand Total All Programs ................................................................. $57,034
These costs are based on the reported conditions of the state highway system and the specificaction strategies identified by program/subprogram. (2001 Dollar values in millions)
Washington State Highway System Plan: 2003-2022 17February 2002

18 Washington State Highway System Plan: 2003-2022 February 2002

Washington State Highway System Plan: 2003-2022 Appendix A – 1February 2002
Appendix A: List of Acronyms
AADT Annual Average Daily TrafficACP Asphalt Concrete PavementACR AADT to Capacity Ratio
AEMRA Advance Environmental Mitigation Revolving AccountBARM Beginning Accumulated Route Mile
BMP Beginning Mile PostACP Asphalt Concrete PavementBST Bituminous Surface TreatmentCFR Code of Federal Regulations
CIPP Capital Improvement and Preservation ProgramCTR Commuter Trip Reduction
CVISN Commercial Vehicle Information System and NetworkEARM End Accumulated Route Mile
ESA Endangered Species ActFHWA Federal Highway AdministrationFGTS Freight and Goods Transportation SystemGMA Growth Management ActHAL High Accident LocationHAC High Accident CorridorHOV High Occupancy VehicleHSP Washington State Highway System PlanHSS Highways of Statewide Significance
ISTEA Inter-modal Surface Transportation Efficiency ActLOS Level of Service
MAP Maintenance Accountability ProcessMPH Miles Per HourMPO Metropolitan Planning OrganizationNHS National Highway SystemPAL Pedestrian Accident Location
PCCP Portland Cement Concrete PavementRCW Revised Code of WashingtonRTPO Regional Transportation Planning Organizations
SIP Statewide Implementation PlanSTIP Statewide Transportation Improvement Program
SR State RouteTFSSS Transportation Facilities and Services of Statewide Significance
TRI Travel Rate IndexWSDOT Washington State Department of Transportation
WSTC Washington State Transportation CommissionWTP Washington’s Transportation PlanUSC United States Code
See the glossary in Appendix B for defintions of these acronyms.

Appendix A – 22 Washington State Highway System Plan: 2003-2022 February 2002

Appendix B: Glossary
Annual Average Daily Traffic (AADT): The total traffic volume both directions that traveled overa highway segment during a one-year period, divided by the number of days in the year.
Annual Average Daily Traffic (AADT) to Capacity Ratio (ACR): The Washington StateTransportation Commission adopted a threshold ACR of 10 for urban highways and an ACRof 6 for rural highways.
Action Strategy: A set of conceptual solutions representing a specific step to be taken to achievethe objectives identified in Washington’s Transportation Plan.
Arterials: A major street carrying the traffic of local and collector streets to and from freeways andother major streets. Arterials generally have traffic signals at intersections and may have limits ondriveway spacing and street intersection spacing.
Asphalt Concrete Pavement (ACP): A pavement surface consisting of plant-mixed asphalt oilsand aggregate.
At-Grade Intersection: An intersection of two or more roads and/or highways where trafficmovement is controlled by traffic signs or signals.
BARM: Beginning Accumulated Route Mile.
BMP: Beginning Mile Post on a state highway that signifies the beginning of a project or solution.
BST: Bituminous Surface Treatment is a pavement surface constructed by applying liquid asphaltdirectly on roadway followed immediately by a layer of crushed aggregate.
Benefit/Cost (B/C): A value used as a tool to prioritize highway improvement projects.Measurable benefits are divided by measurable costs for a specific time period, typically 20 years.
Bituminous Surface Treatment (BST): A pavement surface constructed by applying liquid asphaltdirectly on roadway followed immediately by a layer of crushed aggregate (rock).
Capital Improvement and Preservation Program (CIPP): This program communicates WSDOT’splan to deliver projects funded during the 2001 Legislative session. This replaces the “OperatingBook.” The CIPP is also the reference point for measuring 2001-2003 project delivery.
Conceptual Solution: A solution can be a program, project, or sets of projects or programs andcan be multimodal in nature, phased, or require further study. Solutions are based on need andopportunity. How the solution is described will vary. The solutions must be measurable under thePerformance Measurements of the Action Strategy or Objective. A single solution can represent aset of projects or program that address a need or each of those projects or programs can be listed asseparate solutions to the need. Solutions can be linked and/or multimodal.
Congestion: A condition that occurs when the capacity of a roadway is exceeded by the volume oftraffic (recurrent congestion). Nonrecurring congestion is caused by excessive traffic volumesassociated with special events, weather conditions, and/or traffic incidents.
Commute Trip Reduction (CTR): Legislation requiring major employers in the eight mostpopulous counties in the state to take measures to reduce the number of single occupant vehicle(SOV) trips and the number of vehicle miles traveled (VMT) by their employees.
Washington State Highway System Plan: 2003-2022 Appendix B – 1February 2002

Appendix B: Glossary
Delay Methodology: A program developed by WSDOT as a performance measure tool todetermine current and future 24-hour congestion conditions on all state highways. It is used toidentify capacity deficient sections of highways for inclusion in the State Highway System Plan listof needs.
EARM: End Accumulated Route Mile.
Federal Highway Administration (FHWA): The agency of the United States Department ofTransportation with jurisdiction over the use of federal funds for state highway, local streets,and road improvements.
Freight & Goods Transportation System (FGTS): A statewide network and classification system ofstate highways, county roads, and city streets that carry freight. Routes are classified by totaltonnage of freight carried per year:
T-1: Over 10 million tonsT-2: 4 million to 10 millionT-3: 300,000 to 4 millionT-4: 100,000 to 300,000T-5: Over 20,000 in 60 days
Geometrics: Combination of lane and shoulder width, vertical and horizontal alignment.
Goal: In policy-making and planning, broad statements of directions in which planning or actionis aimed; general value statements representing an ideal end that the community wishes to attain.
Grade Separation: A vertical separation of intersecting facilities (road, rail, etc.) by the provisionof crossing structures.
Growth Management Act (GMA): Passed by the Washington State Legislature in 1990, andamended in 1991 and 1998, GMA addresses the negative consequences of population growth andsuburban sprawl in Washington. The GMA requires all cities and counties in the state to plan forand manage growth in population and employment and has more extensive requirements for thelargest and fastest growing counties and cities in the state. Its requirements include guaranteeingthe consistency of transportation and capital facilities plans with land use plans.
High Accident Corridor (HAC): A highway corridor 1 mile or greater in length where a five-yearanalysis of collision history indicates that the section has higher than average collision andseverity factors.
High Accident Location (HAL): A highway section typically less than 0.25 of a mile where atwo-year analysis of collision history indicates that the section has a significantly higher thanaverage collision and severity rate.
HOV (High Occupancy Vehicle) Lane: A lane dedicated for use by motorcycles and vehiclescarrying two or more people (driver and one or more passengers). The HOV lanes on State Route520 require that there must be three or more people in each vehicle.
Intermodal: Sometimes refers to transfer facilities where freight or passengers change modes(types) of transport. For example, freight and passengers make intermodal transfers betweenmotorized vehicles and airplanes.
Appendix B – 2 Washington State Highway System Plan: 2003-2022February 2002

Appendix B: Glossary
Level of Service (LOS): A qualitative measure that incorporates the collective factors of speed,travel time, traffic interruptions, freedom to maneuver, safety, driving comfort and convenience,and operating costs provided by a highway facility under a particular volume condition. Trafficoperational characteristics:
LOS A: A condition of free flow in which there is little or no restriction on speedor maneuverability caused by the presence of other vehicles.
LOS B: A condition of stable flow in which operating speed is beginning to berestricted by other traffic.
LOS C: A condition of stable flow in which the volume and density levels arebeginning to restrict drivers in their freedom to select speed, change lanes, or pass.
LOS D: A condition approaching unstable flow in which tolerable average operatingspeeds are maintained but are subject to sudden variations.
LOS E: A condition of unstable flow in which operating speeds are lower with somemomentary stoppages. The upper limit of this LOS is the capacity of the facility.
LOS F: A condition of forced flow in which speed and rate of flow are low withfrequent stoppages occurring for short or long periods of time; with density continuingto increase causing the highway to act as a storage area.
Lowest Lifecycle Cost: In terms of highway pavement preservation, this is the point in apavement’s lifecycle where optimum pavement life has been achieved and the least cost toresurface is obtained. Pavements that have gone beyond this optimum point typically incurmore costs to rehabilitate.
Metropolitan Planning Organization (MPO): The agency designated by the Governor (orgovernors in multi-state areas) to administer the federally required transportation planningprocess for a metropolitan area. An MPO must be in place in every urbanized area with apopulation over 50,000.
Metropolitan Transportation Plan (MTP): A detailed long-range transportation plan that guidesfuture regional investments and responds to legal mandates contained in ISTEA, the 1990 CleanAir Act Amendments, and the state of Washington’s Growth Management Act.
Milepost (MP): A state highway mile marker.
Mode: A form of transport. For example, airplanes and trains are both transportation modes.
Multimodal: Refers to a plan or program that accounts for the needs and/or trends of multiplemodes. Washington’s Transportation Plan is an example of a multimodal plan.
National Highway System (NHS): A congressional designation for all interstate routes, a largepercentage of urban and rural principal arterials, and strategic highways and connectors. There areover 3,000 miles of Washington state highways that are NHS routes.
Outfall: A structured drainage of stormwater runoff from highways or intersecting streams.
Objective: A specific, desired outcome for the transportation system in Washington’sTransportation Plan.
Park & Ride Lot: A parking facility for individuals to participate in carpools, vanpools, or publictransportation.
Washington State Highway System Plan: 2003-2022 Appendix B – 3February 2002

Appendix B: Glossary
Regional Transportation Planning Organization (RTPO): Voluntary organizations withrepresentatives from local governments and regional transportation providers to coordinatetransportation planning activities within a region. Authorized by the Growth ManagementAct of 1990.
Revised Code of Washington (RCW): Code compiled by the State of Washington and intendedto embrace in a revised, consolidated, and codified form and arrangement all the laws of the stateof a general and permanent nature.
State Interest: The portion of the state transportation system that is owned and/or operated by localjurisdictions, agencies, and private corporations and is of importance to the entire transportationsystem. The State Interest systems needs were identified through Regional Transportation PlanningOrganizations (RTPOs) in collaboration with local jurisdictions and agencies, and private corporations.These modes include Public Transportation, Freight and Intercity Passenger Rail, Marine Ports andNavigation, Bicycle and Pedestrian Transportation, and Aviation.
State-Owned: The portion of the state transportation system that is owned and/or operated by thestate. The State-Owned systems include state highways, Washington State Ferries, Amtrak Cascadespassenger rail service, and state airports. The needs for state-owned systems were identified by thesystems in coordination with the RTPOs.
Stormwater: That portion of precipitation that does not naturally percolate into the ground orevaporate, but flows via overland flow, interflow, channels, or pipes into a defined surface waterbody or infiltration facility.
Transit Queue Bypass: An HOV lane or traffic control device, which gives preferential treatmentto buses, vanpools and carpools at traffic signals and intersections.
Transportation Demand Management (TDM): Measures designed to reduce the number of singleoccupant vehicle trips during the peak traffic period. Measures include person trip reductionstrategies, which eliminate trips completely, vehicle trip reduction strategies that accommodateperson trips in fewer vehicles, and peak period modification strategies that move trips out of themost congested periods.
Transportation Facilities and Services of Statewide Significance (TFSSS): Major component of1998 legislation, RCW 47.06.140, relating to transportation and growth management planning.It declares that certain transportation facilities and services are of statewide significance becausethey provide and support transportation functions that promote and maintain significant state-wide travel and economic linkages. The draft list of TFSSS has not yet been officially adopted.(For specific information about the adopted list of HSS, see Appendix F.)
Travel Rate Index (TRI): Is a comparison of the time needed to get from one point to anotherwith and without congestion. Congestion occurs when a vehicle is traveling at less than theposted speed. If the TRI equals 1.0, then the vehicle is traveling at the posted speed limit and notexperiencing delay. If the TRI equals 2.0, then congestion is making the trip take twice as long.
Vehicle Miles Traveled (VMT): A measure of highway system use reflecting the number of milestraveled over a highway section, route, or system. VMT is calculated by multiplying the totalhighway section length by the total number of vehicles that have traveled over that section withina given time.
Washington State Transportation Commission (WSTC): The seven-member board appointed bythe Governor that oversees WSDOT’s budget and operation.
Appendix B – 4 Washington State Highway System Plan: 2003-2022February 2002

Appendix C: Regional Transportation Planning Organizations
The Regional Transportation Planning Organizations (RTPOs) are agencies responsible forregional transportation planning and growth management compliance within theirjurisdictions. Jurisdictions range in size from one to four counties. The 14 RTPOs preparetransportation strategies and develop regional transportation programs in cooperation withWSDOT, local governments, and public transportation service providers.
(BFCG) Benton-Franklin Council of GovernmentsMPO/RTPO (Benton, Franklin & Walla Walla Counties)
(CWCOG/SWRTPO) Cowlitz-Wahkiakum Council ofGovernmentsMPO/RTPO (Cowlitz, Wahkiakum, Lewis, Pacific & GraysHarbor Counties)
(NCRTPO) North Central RTPORTPO (Chelan, Douglas & Okanogan Counties)
(N.E.W. RTPO) North East Washington RTPORTPO (Ferry, Stevens & Pend Oreille Counties)
(Pal RTPO) Palouse RTPORTPO (Columbia, Garfield & Asotin Counties)
(PRTPO) Peninsula RTPORTPO (Mason, Jefferson, Clallam & Kitsap Counties)
(PSRC) Puget Sound Regional CouncilTMA/MPO/RTPO (King, Pierce, Snohomish & KitsapCounties)
(QUADCO) Quad County RTPORTPO (Kittitas, Grant, Lincoln & Adams Counties)
(S/I RTPO) Skagit/Island RTPORTPO (Skagit & Island Counties)
(SRTC) Spokane Regional Transportation CouncilTMA/MPO/RTPO (Spokane & Whitman Counties)
(RTC) Southwest Washington Regional TransportationCouncilTMA/MPO/RTPO (Clark, Skamania & Klickitat Counties)
(TRPC) Thurston Regional Planning CouncilMPO/RTPO (Thurston County)
(WCCOG) Whatcom Council of GovernmentsMPO/RTPO (Whatcom County)
(YVCOG) Yakima Valley Conference of GovernmentsMPO/RTPO (Yakima County)
Douglas
Okanogan
Chelan
Yakima
Grant
Adams
Lincoln
Whitman
Snohomish
Pierce
Lewis
Clallam
Klickitat
Jefferson
Benton
Franklin
WallaWalla
Spokane
Ferry
Stevens
PendOreille
GraysHarbor
Pacific
Clark
ColumbiaAsotin
Wahkiakum
Thurston
SanJuan
Garfield
SkamaniaCowlitz
King
Kittitas
Whatcom
Island
Skagit
Kitsap
Mason
Yakima ValleyConference ofGovernments
Quad-County RTPO
NorthCentralRTPO
NortheastWashington
RTPO
SpokaneRegionalTransportationCouncil
PalouseRTPOBenton-Franklin-
Walla WallaRTPO
SouthwestWashington
RTPO
PugetSound
RegionalCouncil
Whatcom Councilof Governments
Peninsula RTPO
Southwest WashingtonRegional Transportation
Council
Skagit/Island RTPO
ThurstonRegionalPlanning
Council
Notes:Kitsap County is a member
of both thePuget Sond Reginal Council
and Peninsula RTPO.San Juan County is not a
member of any MPO/RTPO.
Washington State Highway System Plan: 2003-2022 Appendix C – 1February 2002
Appendix C – 2 Washington State Highway System Plan: 2003-2022February 2002
Appendix D: Washington State Department of Transportation Regions
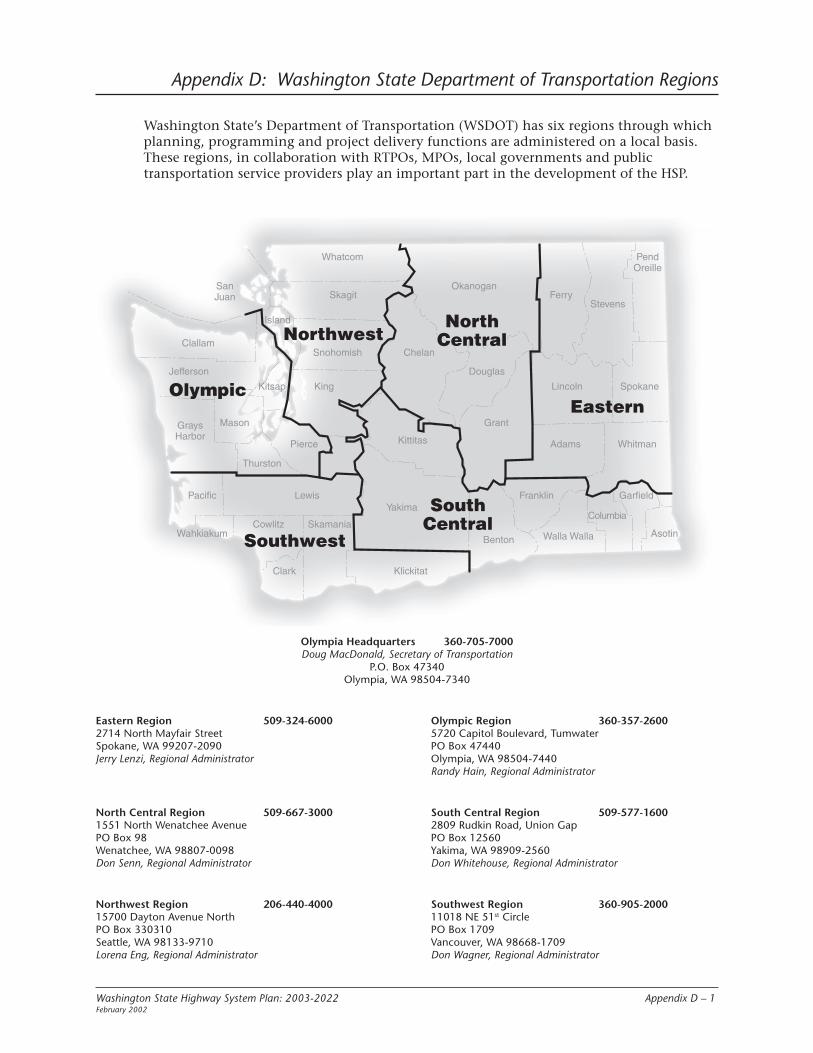
Olympia Headquarters 360-705-7000Doug MacDonald, Secretary of Transportation
P.O. Box 47340Olympia, WA 98504-7340
Eastern Region 509-324-6000 Olympic Region 360-357-26002714 North Mayfair Street 5720 Capitol Boulevard, TumwaterSpokane, WA 99207-2090 PO Box 47440Jerry Lenzi, Regional Administrator Olympia, WA 98504-7440
Randy Hain, Regional Administrator
North Central Region 509-667-3000 South Central Region 509-577-16001551 North Wenatchee Avenue 2809 Rudkin Road, Union GapPO Box 98 PO Box 12560Wenatchee, WA 98807-0098 Yakima, WA 98909-2560Don Senn, Regional Administrator Don Whitehouse, Regional Administrator
Northwest Region 206-440-4000 Southwest Region 360-905-200015700 Dayton Avenue North 11018 NE 51st CirclePO Box 330310 PO Box 1709Seattle, WA 98133-9710 Vancouver, WA 98668-1709Lorena Eng, Regional Administrator Don Wagner, Regional Administrator
Washington State’s Department of Transportation (WSDOT) has six regions through whichplanning, programming and project delivery functions are administered on a local basis.These regions, in collaboration with RTPOs, MPOs, local governments and publictransportation service providers play an important part in the development of the HSP.
Douglas
Okanogan
Chelan
Yakima
Grant
Adams
Lincoln
Whitman
Snohomish
Pierce
Lewis
Clallam
Klickitat
Jefferson
Benton
Franklin
Walla Walla
Spokane
FerryStevens
PendOreille
GraysHarbor
Pacific
Clark
Columbia
AsotinWahkiakum
Thurston
SanJuan
Garfield
SkamaniaCowlitz
King
Kittitas
Whatcom
Island
Skagit
Kitsap
Mason
NorthCentral
Eastern
SouthCentral
Northwest
Southwest
Olympic
Washington State Highway System Plan: 2003-2022 Appendix D – 1February 2002

Appendix D – 2 Washington State Highway System Plan: 2003-2022February 2002

Appendix E: State and Federal Statutory Requirements
Revised Code of Washington – RCW 47.06.050 (1)State-owned facilities component.The state-owned facilities component of the statewide transportation plan shall consist of:
(1) The state highway system plan, which identifies program and financing needs and recommendsspecific and financially realistic improvements to preserve the structural integrity of the statehighway system, ensure acceptable operating conditions, and provide for enhanced access toscenic, recreational, and cultural resources. The state highway system plan shall contain thefollowing elements:(a) A system preservation element, which shall establish structural preservation objectives
for the state highway system including bridges, identify current and future structuraldeficiencies based upon analysis of current conditions and projected future deterioration,and recommend program funding levels and specific actions necessary to preserve thestructural integrity of the state highway system consistent with adopted objectives. Thiselement shall serve as the basis for the preservation component of the six-year highwayprogram and the two-year biennial budget request to the legislature;
(b) A capacity and operational improvement element, which shall establish operational objectives,including safety considerations, for moving people and goods on the state highway system,identify current and future capacity, operational, and safety deficiencies, and recommendprogram funding levels and specific improvements and strategies necessary to achieve theoperational objectives. In developing capacity and operational improvement plans thedepartment shall first assess strategies to enhance the operational efficiency of the existingsystem before recommending system expansion. Strategies to enhance the operationalefficiencies include but are not limited to access management, transportation systemmanagement, demand management, and high-occupancy vehicle facilities. The capacity andoperational improvement element must conform to the state implementation plan for airquality and be consistent with regional transportation plans adopted under chapter 47.80RCW, and shall serve as the basis for the capacity and operational improvement portions ofthe six-year highway program and the two-year biennial budget request to the legislature;
(c) A scenic and recreational highways element, which shall identify and recommend designationof scenic and recreational highways, provide for enhanced access to scenic, recreational,and cultural resources associated with designated routes, and recommend a variety ofmanagement strategies to protect, preserve, and enhance these resources. The department,affected counties, cities, and towns, regional transportation planning organizations, andother state or federal agencies shall jointly develop this element;
(d) A paths and trails element, which shall identify the needs of non-motorized transportationmodes on the state transportation systems and provide the basis for the investment ofstate transportation funds in paths and trails, including funding provided under chapter47.30 RCW.
[1993 c 446 § 5.]
Code of Federal Regulations – CFR 450.214Statewide Transportation Plan(a) The State shall develop a statewide transportation plan for all areas of the State.
(b) The plan shall:(1) Be intermodal (including consideration and provision, as applicable, of elements and
connections of and between rail, commercial motor vehicle, waterway, and aviationfacilities, particularly with respect to intercity travel) and statewide in scope in order tofacilitate the efficient movement of people and goods;
(2) Be reasonably consistent in time horizon among its elements, but cover a period of atleast 20 years;
Washington State Highway System Plan: 2003-2022 Appendix E – 1February 2002
Appendix E: State and Federal Statutory Requirements
(3) Contain, as an element, a plan for bicycle transportation, pedestrian walkways and trailswhich is appropriately interconnected with other modes;
(4) Be coordinated with the metropolitan transportation plans required under 23 U.S.C. 134;(5) Reference, summarize or contain any applicable short range planning studies, strategic
planning and/or policy studies, transportation need studies, management system reportsand any statements of policies, goals and objectives regarding issues such as transportation,economic development, housing, social and environmental effects, energy, etc., that weresignificant to development of the plan; and reassessed to ensure that level of servicestandards will be met;
(6) Reference, summarize or contain information on the availability of financial and otherresources needed to carry out the plan.
(c) In developing the plan, the State shall:(1) Cooperate with the MPOs on the portions of the plan affecting metropolitan
planning areas;(2) Cooperate with the Indian tribal government and the Secretary of the Interior on the
portions of the plan affecting areas of the State under the jurisdiction of an Indian tribalgovernment;
(3) Provide for public involvement as required under Sec. 450.212;(4) Provide for substantive consideration and analysis as appropriate of specified factors as
required under Sec. 450.208; and(5) Provide for coordination as required under Sec. 450.210.
(d) The State shall provide and carryout a mechanism to establish the document, or documents,comprising the plan as the official statewide transportation plan.
(e) The plan shall be continually evaluated and periodically updated as appropriate using theprocedures in this section for development and establishment of the plan.
Revised Code of Washington – RCW 36.70A.070 (6)Comprehensive Plans(6) A transportation element that implements, and is consistent with, the land use element.
(a) The transportation element shall include the following subelements:(i) Land use assumptions used in estimating travel;(ii) Estimated traffic impacts to state-owned transportation facilities resulting from land use
assumptions to assist the department of transportation in monitoring the performanceof state facilities, to plan improvements for the facilities, and to assess the impact ofland-use decisions on state-owned transportation facilities;
(iii) Facilities and services needs, including:(A) An inventory of air, water, and ground transportation facilities and services,
including transit alignments and general aviation airport facilities, to defineexisting capital facilities and travel levels as a basis for future planning. Thisinventory must include state-owned transportation facilities within the city orcounty’s jurisdiction boundaries;
(B) Level of service standards for all locally owned arterials and transit routes to serveas a gauge to judge performance of the system. These standards should beregionally coordinated;
(C) For state-owned transportation facilities, level of service standards for highways, asprescribed in chapters 47.06 and 47.80 RCW, to gauge the performance of thesystem. The purposes of reflecting level of service standards for state highways inthe local comprehensive plan are to monitor the performance of the system, to
Appendix E – 2 Washington State Highway System Plan: 2003-2022February 2002

Appendix E: State and Federal Statutory Requirements
evaluate improvement strategies, and to facilitate coordination between thecounty’s or city’s six-year street, road, or transit program and the department oftransportation’s six-year investment program. The concurrency requirements of (b)of this subsection do not apply to transportation facilities and services of state-widesignificance except for counties consisting of islands whose only connection to themainland are state highways or ferry routes. In these island counties, statehighways and ferry route capacity must be a factor in meeting the concurrencyrequirements in (b) of this subsection;
(D) Specific actions and requirements for bringing into compliance locally ownedtransportation facilities or services that are below an established level of servicestandard;
(E) Forecasts of traffic for at least ten years based on the adopted land use plan toprovide information on the location, timing, and capacity needs of future growth;
(F) Identification of state and local system needs to meet current and future demands.Identified needs on state-owned transportation facilities must be consistent withthe state-wide multimodal transportation plan required under chapter 47.06 RCW;
(iv) Finance, including:(A) An analysis of funding capability to judge needs against probable funding resources;(B) A multiyear financing plan based on the needs identified in the comprehensive
plan, the appropriate parts of which shall serve as the basis for the six-year street,road, or transit program required by RCW 35.77.010 for cities, RCW 36.81.121 forcounties, and RCW 35.58.2795 for public transportation systems. The multiyearfinancing plan should be coordinated with the six-year improvement programdeveloped by the department of transportation as required by RCW 47.05.030;
(C) If probable funding falls short of meeting identified needs, a discussion of howadditional funding will be raised, or how land use assumptions will be reassessed toensure that level of service standards will be met;
(v) Intergovernmental coordination efforts, including an assessment of the impacts ofthe transportation plan and land use assumptions on the transportation systems ofadjacent jurisdictions;
(vi) Demand-management strategies.
(b) After adoption of the comprehensive plan by jurisdictions required to plan or who chooseto plan under RCW 36.70A.040, local jurisdictions must adopt and enforce ordinanceswhich prohibit development approval if the development causes the level of service on alocally owned transportation facility to decline below the standards adopted in thetransportation element of the comprehensive plan, unless transportation improvements orstrategies to accommodate the impacts of development are made concurrent with thedevelopment. These strategies may include increased public transportation service, ridesharing programs, demand management, and other transportation systems managementstrategies. For the purposes of this subsection (6) “concurrent with the development” shallmean that improvements or strategies are in place at the time of development, or that afinancial commitment is in place to complete the improvements or strategies withinsix years.
(c) The transportation element described in this subsection (6), and the six-year plans requiredby RCW 35.77.010 for cities, RCW 36.81.121 for counties, RCW 35.58.2795 for publictransportation systems, and RCW 47.05.030 for the state, must be consistent.
[1998 c 171 § 2; 1997 c 429 § 7; 1996 c 239 § 1. Prior: 1995 c 400 § 3; 1995 c 377 § 1;1990 1st ex.s. c 17 § 7.]
Washington State Highway System Plan: 2003-2022 Appendix E – 3February 2002

Appendix E: State and Federal Statutory Requirements
Revised Code of Washington – RCW 47.80.030Regional Transportation Plan
Regional transportation plan – Contents, review, use.
(1) Each regional transportation planning organization shall develop in cooperation with thedepartment of transportation, providers of public transportation and high capacity trans-portation, ports, and local governments within the region, adopt, and periodically update aregional transportation plan that:
(a) Is based on a least cost planning methodology that identifies the most cost-effectivefacilities, services, and programs;
(b) Identifies existing or planned transportation facilities, services, and programs, includingbut not limited to major roadways including state highways and regional arterials, transitand nonmotorized services and facilities, multimodal and intermodal facilities, marineports and airports, railroads, and noncapital programs including transportation demandmanagement that should function as an integrated regional transportation system, givingemphasis to those facilities, services, and programs that exhibit one or more of thefollowing characteristics:
(i) Crosses member county lines;(ii) Is or will be used by a significant number of people who live or work outside the
county in which the facility, service, or project is located;(iii) Significant impacts are expected to be felt in more than one county;(iv) Potentially adverse impacts of the facility, service, program, or project can be better
avoided or mitigated through adherence to regional policies;(v) Transportation needs addressed by a project have been identified by the regional
transportation planning process and the remedy is deemed to have regionalsignificance; and
(vi) Provides for system continuity;
(c) Establishes level of service standards for state highways and state ferry routes, with theexception of transportation facilities of state-wide significance as defined in RCW47.06.140. These regionally established level of service standards for state highways andstate ferries shall be developed jointly with the department of transportation, to encourageconsistency across jurisdictions. In establishing level of service standards for state highwaysand state ferries, consideration shall be given for the necessary balance between providingfor the free interjurisdictional movement of people and goods and the needs of localcommuters using state facilities;
(d) Includes a financial plan demonstrating how the regional transportation plan can beimplemented, indicating resources from public and private sources that are reasonablyexpected to be made available to carry out the plan, and recommending any innovativefinancing techniques to finance needed facilities, services, and programs;
(e) Assesses regional development patterns, capital investment and other measuresnecessary to:(i) Ensure the preservation of the existing regional transportation system, including
requirements for operational improvements, resurfacing, restoration, and rehabilitationof existing and future major roadways, as well as operations, maintenance, moderniza-tion, and rehabilitation of existing and future transit, railroad systems and corridors,and nonmotorized facilities; and
(ii) Make the most efficient use of existing transportation facilities to relieve vehicularcongestion and maximize the mobility of people and goods;
Appendix E – 4 Washington State Highway System Plan: 2003-2022February 2002

Appendix E: State and Federal Statutory Requirements
(f) Sets forth a proposed regional transportation approach, including capital investments,service improvements, programs, and transportation demand management measures toguide the development of the integrated, multimodal regional transportation system; and
(g) Where appropriate, sets forth the relationship of high capacity transportation providersand other public transit providers with regard to responsibility for, and the coordinationbetween, services and facilities.
(2) The organization shall review the regional transportation plan biennially for currency andforward the adopted plan along with documentation of the biennial review to the statedepartment of transportation.
(3) All transportation projects, programs, and transportation demand management measureswithin the region that have an impact upon regional facilities or services must be consistentwith the plan and with the adopted regional growth and transportation strategies.
[1998 c 171 § 9; 1994 c 158 § 4; 1990 1st ex.s. c 17 § 55.]
Code of Federal Regulations – CFR 450.322Metropolitan transportation planning process: Transportation Plan
(a) The metropolitan transportation planning process shall include the development of atransportation plan addressing at least a twenty year planning horizon. The plan shall includeboth ong-range and short-range strategies/actions that lead to the development of anintegrated intermodal transportation system that facilitates the efficient movement of peopleand goods. The transportation plan shall be reviewed and updated at least triennially innonattainment and maintenance areas and at least every five years in attainment areas toconfirm its validity and its consistency with current and forecasted transportation and land useconditions and trends and to extend the forecast period. The transportation plan must beapproved by the MPO.
(b) In addition, the plan shall:(1) Identify the projected transportation demand of persons and goods in the metropolitan
planning area over the period of the plan;(2) Identify adopted congestion management strategies including, as appropriate, traffic
operations, ridesharing, pedestrian and bicycle facilities, alternative work schedules, freightmovement options, high occupancy vehicle treatments, telecommuting, and publictransportation improvements (including regulatory, pricing, management, and operationaloptions), that demonstrate a systematic approach in addressing current and futuretransportation demand;
(3) Identify pedestrian walkway and bicycle transportation facilities in accordance with 23U.S.C. 217(g);
(4) Reflect the consideration given to the results of the management systems, including inTMAs that are nonattainment areas for carbon monoxide and ozone, identification of SOVprojects that result from a congestion management system that meets the requirements of23 CFR part 500;
(5) Assess capital investment and other measures necessary to preserve the existingtransportation system (including requirements for operational improvements, resurfacing,restoration, and rehabilitation of existing and future major roadways, as well as operations,maintenance, modernization, and rehabilitation of existing and future transit facilities)and make the most efficient use of existing transportation facilities to relieve vehicularcongestion and enhance the mobility of people and goods;
Washington State Highway System Plan: 2003-2022 Appendix E – 5February 2002

Appendix E: State and Federal Statutory Requirements
(6) Include design concept and scope descriptions of all existing and proposed transportationfacilities in sufficient detail, regardless of the source of funding, in nonattainment andmaintenance areas to permit conformity determinations under the U.S. EPA conformityregulations at 40 CFR part 51. In all areas, all proposed improvements shall be described insufficient detail to develop cost estimates;
(7) Reflect a multimodal evaluation of the transportation, socioeconomic, environmental, andfinancial impact of the overall plan, including all major transportation investments inaccordance with Sec. 450.318;
(8) For major transportation investments for which analyses are not complete, indicate thatthe design concept and scope (mode and alignment) have not been fully determined andwill require further analysis. The plan shall identify such study corridors and subareas andmay stipulate either a set of assumptions (assumed alternatives) concerning the proposedimprovements or a no-build condition pending the completion of a corridor or subarealevel analysis under Sec. 450.318. In nonattainment and maintenance areas, the set ofassumed alternatives shall be in sufficient detail to permit plan conformity determinationsunder the U.S. EPA conformity regulations (40 CFR part 51);
(9) Reflect, to the extent that they exist, consideration of: the area’s comprehensive long-rangeland use plan and metropolitan development objectives; national, State, and local housinggoals and strategies, community development and employment plans and strategies, andenvironmental resource plans; local, State, and national goals and objectives such aslinking low income households with employment opportunities; and the area’s overallsocial, economic, environmental, and energy conservation goals and objectives;
(10) Indicate, as appropriate, proposed transportation enhancement activities as defined in 23U.S.C. 101(a); and
(11) Include a financial plan that demonstrates the consistency of proposed transportationinvestments with already available and projected sources of revenue. The financial planshall compare the estimated revenue from existing and proposed funding sources that canreasonably be expected to be available for transportation uses, and the estimated costs ofconstructing, maintaining and operating the total (existing plus planned) transportationsystem over the period of the plan. The estimated revenue by existing revenue source(local, State, and Federal and private) available for transportation projects shall bedetermined and any shortfalls identified. Proposed new revenues and/or revenue sourcesto cover shortfalls shall be identified, including strategies for ensuring their availability forproposed investments. Existing and proposed revenues shall cover all forecasted capital,operating, and maintenance costs. All cost and revenue projections shall be based on thedata reflecting the existing situation and historical trends. For nonattainment andmaintenance areas, the financial plan shall address the specific financial strategies requiredto ensure the implementation of projects and programs to reach air quality compliance.
(c) There must be adequate opportunity for public official (including elected officials) and citizeninvolvement in the development of the transportation plan before it is approved by the MPO,in accordance with the requirements of Sec. 450.316(b)(1). Such procedures shall includeopportunities for interested parties (including citizens, affected public agencies, representativesof transportation agency employees, and private providers of transportation) to be involved inthe early stages of the plan development/update process. The procedures shall includepublication of the proposed plan or other methods to make it readily available for publicreview and comment and, in nonattainment TMAs, an opportunity for at least one formalpublic meeting annually to review planning assumptions and the plan development processwith interested parties and the general public. The procedures also shall include publication ofthe approved plan or other methods to make it readily available for information purposes.
Appendix E – 6 Washington State Highway System Plan: 2003-2022February 2002

Appendix E: State and Federal Statutory Requirements
(d) In nonattainment and maintenance areas for transportation related pollutants, the FHWA andthe FTA, as well as the MPO, must make a conformity determination on any new/revised planin accordance with the Clean Air Act and the EPA conformity regulations (40 CFR part 51).
(e) Although transportation plans do not need to be approved by the FHWA or the FTA, copies ofany new/revised plans must be provided to each agency.
[58 FR 58064, Oct. 28, 1993, as amended at 61 FR 67175, Dec. 19, 1996]
Code of Federal Regulations – CFR 450.216Statewide transportation improvement program (STIP).
(a) Each State shall develop a statewide transportation improvement program for all areas ofthe State. In case of difficulties in developing the STIP portion for a particular area, e.g.,metropolitan area, Indian tribal lands, etc., a partial STIP covering the rest of the State may bedeveloped. The portion of the STIP in a metropolitan planning area (the metropolitan TIPdeveloped pursuant to subpart C of this part) shall be developed in cooperation with the MPO.To assist this process, the State will need to provide MPOs with estimates of available Federaland State funds which the MPO can utilize in developing the metropolitan TIP. Metropolitanplanning area TIPs shall be included without modification in the STIP, directly or by reference,once approved by the MPO and the Governor and after needed conformity findings are made.Metropolitan TIPs in nonattainment and maintenance areas are subject to the FHWA and theFTA conformity findings before their inclusion in the STIP. In nonattainment and maintenanceareas outside metropolitan planning areas, Federal findings of conformity must be made priorto placing projects in the STIP. The State shall notify the appropriate MPO, local jurisdictions,Federal land agency, Indian tribal government, etc. when a TIP including projects under thejurisdiction of the agency has been included in the STIP. All title 23 and Federal Transit Actfund recipients will share information as projects in the STIP are implemented. The Governorshall provide for public involvement in development of the STIP as required by Sec. 450.212.In addition, the STIP shall:
(1) Include a list of priority transportation projects proposed to be carried out in the first 3years of the STIP. Since each TIP is approved by the Governor, the TIP priorities will dictateSTIP priorities for each individual metropolitan area. As a minimum, the lists shall groupthe projects that are to be undertaken in each of the years, e.g., year 1, year 2, year 3;
(2) Cover a period of not less than 3 years, but may at State discretion cover a longer period. Ifthe STIP covers more than 3 years, the projects in the additional years will be considered bythe FHWA and the FTA only as informational;
(3) Contain only projects consistent with the statewide plan developed under Sec. 450.214;(4) In nonattainment and maintenance areas, contain only
transportation projects found to conform, or from programs that conform, to therequirements contained in 40 CFR part 51;
(5) Be financially constrained by year and include sufficient financial information todemonstrate which projects are to be implemented using current revenues and whichprojects are to be implemented using proposed revenue sources while the system as a wholeis being adequately operated and maintained. In nonattainment and maintenance areas,projects included in the first two years of the current STIP/TIP shall be limited to those forwhich funds are available or committed. In the case of proposed funding sources, strategiesfor ensuring their availability shall be identified;
(6) Contain all capital and non-capital transportation projects (including transportationenhancements, Federal lands highways projects, trails projects, pedestrian walkways, andbicycle transportation facilities), or identified phases of transportation projects, proposedfor funding under the Federal Transit Act (49 U.S.C. app. 1602, 1607a, 1612 and 1614) and/
Washington State Highway System Plan: 2003-2022 Appendix E – 7February 2002

or title 23, U.S.C. excluding:(i) Safety projects funded under section 402 of the Surface Transportation Assistance Act of
1982, as amended (49 U.S.C. app. 2302);(ii) IVHS planning grants funded under section 6055(b) of the Intermodal Surface
Transportation Efficiency Act of 1991 (Pub. L. 102-240, 105 Stat. 1914);(iii) Transit planning grants funded under section 8 or 26 of the Federal Transit Act (49
U.S.C. app. 1607 and 1622);(iv) Metropolitan planning projects funded under 23 U.S.C. 104(f);(v) State planning and research projects funded under 23 U.S.C. 307(c)(1) (except those
funded with NHS, STP and minimum allocation (MA) funds that the State and MPOfor a metropolitan area agree should be in the TIP and consequently must be in theSTIP); and
(vi) Emergency relief projects (except those involving substantial functional, locational orcapacity changes);
(7) Contain all regionally significant transportation projects requiring an action by the FHWAor the FTA whether or not the projects are to be funded with title 23, U.S.C. or FederalTransit Act funds, e.g., addition of an interchange to the Interstate System with State, localand/or private funds, demonstration projects not funded under title 23, U.S.C., or theFederal Transit Act. (The STIP should, for information purposes, include all regionallysignificant transportation projects proposed to be funded with Federal funds other thanthose administered by the FHWA or the FTA. It should also include, for informationpurposes, if appropriate and cited in any TIPs, all regionally significant projects, to befunded with non-Federal funds);
(8) Include for each project the following:(i) Sufficient descriptive material (i.e., type of work, termini, length, etc.) to identify the
project or phase;(ii) Estimated total cost;(iii) The amount of Federal funds proposed to be obligated during each program year;(iv) For the first year, the proposed category of Federal funds and source(s) of non-Federal
funds;(v) For the second and third years, the likely category or possible categories of Federal
funds and sources of non-Federal funds;(vi) Identification of the agencies responsible for carrying out the project; and
(9) For non-metropolitan areas, include in the first year only those projects which have beenselected in accordance with the project selection requirements in Sec. 450.222(c).
(b) Projects that are not considered to be of appropriate scale for individual identification in agiven program year may be grouped by function, work type, and/or geographic area using theapplicable classifications under 23 CFR 771.117 (c) and (d) and/or 40 CFR part 51.
(c) Projects in any of the first three years of the STIP may be moved to any other of the first threeyears of the STIP subject to the project selection requirements of Sec. 450.222.
(d) The STIP may be amended at any time under procedures agreed to by the cooperating partiesconsistent with the procedures established in this section (for STIP development), in Sec.450.212 (for public involvement) and in Sec. 450.220 (for the FHWA and the FTA approval).
Appendix E: State and Federal Statutory Requirements
Appendix E – 8 Washington State Highway System Plan: 2003-2022February 2002

Appendix F: Highways of Statewide Significance
A major component of the 1998 legislation relating to transportation and growthmanagement planning established certain transportation facilities and services to be ofstatewide significance. These facilities provide and support transportation functionsthat promote and maintain significant statewide travel and economic linkages. Thelegislation emphasizes that these significant transportation facilities should be plannedfrom a statewide perspective.
Transportation facilities and services of statewide significance (TFSSS) are identified underRCW 47.06.140 and include the following:
• The interstate highway system• Interregional state principal arterials including ferry connections that serve statewide travel• Intercity passenger rail services• Intercity high-speed ground transportation• Major passenger intermodal terminals excluding all airport facilities and services• The freight railroad system• The Columbia/Snake navigable river system• Marine port facilities and services that are related solely to marine activities affecting international and interstate trade, and• High-capacity transportation systems serving regions as defined in RCW81.104.015
A list of the state’s Highways of Statewide Significance (HSS) follows this page.
Mountain Passes
Highways of StatewideSignificance
Other Highways
Douglas
Okanogan
Chelan
Yakima
Grant
Adams
Lincoln
Whitman
Snohomish
Pierce
Lewis
Clallam
Klickitat
Jefferson
BentonFranklin
Walla Walla
Spokane
Ferry Stevens
PendOreille
GraysHarbor
Pacific
Clark
Columbia
AsotinWahkiakum
Thurston
SanJuan
Garfield
SkamaniaCowlitz
King
Kittitas
Whatcom
Island
Skagit
KitsapMason
Seattle
Olympia
Yakima
Vancouver
Kennewick
Spokane
Moses Lake
Colville
Bellingham
PortAngeles
Aberdeen Ellensburg
Wenatchee
Pullman
Longview
Everett
Omak
Centralia
Washington State Highway System Plan: 2003-2022 Appendix F – 1February 2002

Appendix F: Highways of Statewide Significance
Definitions of Column Headings:Highway: Highway of Statewide Significance – US, Interstate or State Route.Begin MP: Beginning Milepost – Milepost at beginning point.BARM: Beginning Accumulated Route Mile – Actual milepost measure at beginning point.End MP: Ending Milepost – Milepost at ending point.EARM: Ending Accumulated Route Mile – Actual milepost measure at ending point.Length: Actual distance of the highway segment utilizing BARM and EARM. Difference between posted measurement(Begin MP & End MP) and actual measurements (BARM & EARM) are due to construction modifications to original highwayafter time of original milepost installation.Description: Description of the segment of highway designated a highway of statewide significance.
Highway Begin MP BARM End MP EARM Length Description
U.S. 2 0.00 0.00 334.51 326.23 322.63 I-5/Everett to Idaho (entire route)
Browne Street CoupletU.S. 2 287.45 0.00 288.08 0.63 0.63 U.S. 2 to I-90 under-crossing
Division Street CoupletU.S. 2 289.19 0.00 290.72 1.53 1.53 U.S. 2/Euclid Ave to U.S. 2
Everett CoupletU.S. 2 0.77 0.00 1.64 0.87 0.87 Home Acres Rd to U.S. 2 under-crossing
SR 3 0.00 0.00 60.02 59.81 59.81 U.S. 101/Shelton to SR 104 (entire route)SR 4 0.00 0.00 55.23 55.22 55.22 U.S. 101 to SR 432 Wye Conn (Longview
Vicinity)I-5 0.00 0.00 276.56 276.62 276.62 Oregon to Canada (entire route)SR 8 0.00 0.00 20.67 20.67 20.67 U.S. 12/Elma to U.S. 101/Olympia (entire route)SR 9 93.61 93.52 98.17 98.08 4.56 SR 546 to CanadaU.S. 12 0.00 0.00 434.19 430.81 324.51 U.S. 101/Aberdeen to Idaho (entire route)
Aberdeen CoupletU.S. 12 0.33 0.00 0.68 0.35 0.35 S Newell St to S G St
SR 14 0.00 0.00 101.02 100.93 100.93 I-5/Vancouver to U.S. 97SR 16 0.00 0.00 29.19 27.01 27.01 I-5/Tacoma to SR 3/Gorst (entire route)SR 17 7.43 0.00 50.77 43.28 43.28 U.S. 395/Mesa to I-90SR 17 50.77 43.28 56.56 49.05 5.77 I-90/Moses Lake to Patton Blvd (Moses Lake
Airport)SR 18 2.20 B 0.00 27.91 28.41 28.41 I-5 to I-90 (entire route)SR 20 0.00 0.00 436.91 436.53 395.32 U.S. 101 to U.S. 2/Newport (entire route)
Spur AnacortesSR 20 47.89 0.00 55.67 7.78 7.78 SR 20 to Ferry Terminal (entire route)
SR 22 0.70 0.00 4.00 3.31 3.31 I-82 to U.S. 97SR 26 0.00 0.00 133.53 133.61 133.61 I-90/Vantage to U.S. 195 (entire route)SR 28 0.00 B 0.00 29.77 33.91 33.91 U.S. 2/Wenatchee to SR 281/Quincy
East WenatcheeSR 28 4.25 0.00 4.58 0.33 0.33 SR 28 MP 4.25B to SR 28 MP 3.84B
I-82 0.00 0.00 132.60 132.57 132.57 I-90/Ellensburg to Oregon (entire route)I-90 1.94 0.00 299.82 297.52 297.52 I-5/Seattle to Idaho (entire route)U.S. 97 0.00 B 0.00 336.48 321.62 250.89 Oregon to Canada (entire route)
Maryhill CoupletU.S. 97 2.59 0.00 2.68 0.09 0.09 Maryhill Southbound Couplet
SR 99 26.04 22.40 43.60 39.87 17.47 SR 509 to SR 104
Alaska Way ViaductSR 99 31.72 0.00 33.56 1.84 1.84 SR 99 MP 31.72 to SR 99 29.88
U.S. 101 0.00 0.00 0.46 0.46 0.46 Astoria Megler Bridge/SR 401U.S. 101 28.89 28.89 367.41 365.78 336.89 SR 4 to I-5/Olympia
Aberdeen CoupletU.S. 101 87.49 0.00 91.66 4.17 4.17 Levee St to State St Ramp Heron St Couplet
U.S. 101 83.75 0.00 83.88 0.13 0.13 U.S. 101 to U.S. 101
Appendix F – 2 Washington State Highway System Plan: 2003-2022February 2002

Appendix F: Highways of Statewide Significance
Highway Begin MP BARM End MP EARM Length Description
Port Angeles CoupletU.S. 101 249.65 0.00 251.32 1.67 1.67 U.S. 101 MP 249.65 to E First St
SR 104 0.20 0.00 29.81 29.28 29.28 U.S. 101 to I-5
Kingston CoupletSR 104 24.53 0.00 24.86 0.33 0.33 Ferry Landing to Illinois Ave
SR 125 0.00 0.00 6.15 6.14 6.14 Oregon State Line to U.S. 12/Walla WallaSR 127 0.03 0.00 27.05 27.05 27.05 U.S. 12/Dodge to SR 26 (entire route)SR 167 0.00 0.00 26.40 27.72 27.72 I-5/Tacoma to I-405/Renton
Puyallup CoupletSR 167 5.72 0.00 6.26 0.54 0.54 Milwaukee Ave to SR 167
I-182 0.00 0.00 15.19 15.19 15.19 I-82 to U.S. 395/Pasco (entire route)U.S. 195 0.00 B 0.00 95.99 93.37 93.37 Idaho to I-90/Spokane (entire route)I-205 26.59 0.00 37.16 10.57 10.57 Oregon to I-5 (entire route)SR 240 30.63 28.86 34.87 33.10 4.24 Stevens Drive to I-182SR 240 36.05 34.22 43.17 41.34 7.12 I-182 to US 395SR 270 0.00 0.00 9.89 9.89 9.89 US 195/Pullman to Idaho (entire route)
Pullman CoupletSR 270 2.67 0.00 2.90 0.23 0.23 Main St to Grand
SR 281 0.00 0.00 10.55 10.55 10.55 SR 28/Quincy to I-90 (entire route)SR 304 0.00 0.00 3.51 3.24 3.24 SR 3 to Bremerton Ferry Terminal (entire route)SR 305 0.02 0.00 13.52 13.50 13.50 Bainbridge Island Ferry Terminal to SR 3
(entire route)SR 307 0.00 0.00 5.25 5.25 5.25 SR 305 to SR 104 (entire route)SR 310 0.00 0.00 1.84 1.84 1.84 SR 3 to SR 304/Bremerton (entire route)U.S. 395 13.05 19.81 270.26 275.03 186.51 I-82 to CanadaSR 401 0.00 0.00 12.13 12.13 12.13 U.S. 101/Astoria Megler Bridge to SR 4
(entire route)I-405 0.00 0.00 30.32 30.30 30.30 I-5/Tukwila to I-5 (entire route)SR 432 0.00 0.00 10.33 10.32 10.31 SR 4/Longview to I-5 (entire route)SR 433 0.00 0.00 0.94 0.94 0.94 Oregon to SR 432/Longview (entire route)SR 501 0.00 0.00 2.24 1.83 1.83 I-5 to Port of Vancouver Entrance/SW 26th St Ext.SR 509 0.00 0.00 3.20 6.39 6.39 I-705/Tacoma to Old SR 509
(there has been realignment)SR 509 25.60 30.40 29.92 35.17 4.77 SR 518/SeaTac to SR 99SR 512 0.00 0.00 12.06 12.06 12.06 I-5/Lakewood to SR 167/Puyallup (entire route)SR 518 0.00 0.00 3.81 3.42 3.42 SR 509/SeaTac to I-5/Tukwila (entire route)SR 519 0.00 0.00 1.14 1.14 1.14 I-90 to Seattle Ferry Terminal (entire route)SR 520 0.00 0.00 7.09 7.08 7.08 I-5 to I-405SR 522 0.00 0.00 24.68 24.68 24.68 I-5/Seattle to US 2/Monroe (entire route)SR 525 0.00 0.00 30.52 30.75 30.45 I-5 to SR 20 (entire route)SR 526 0.00 0.00 4.52 4.52 4.52 SR 525/Mukilteo to I-5 (entire route)SR 529 0.00 0.00 2.20 2.20 2.20 I-5/Everett to Port/19th StSR 539 0.00 0.00 15.16 15.16 15.16 I-5/Bellingham to Canada (entire route)SR 543 0.00 0.00 1.09 1.09 1.09 I-5 to Canada (entire route)SR 546 0.00 0.00 8.02 8.02 8.02 SR 539 to SR 9 (entire route)I-705 0.00 0.00 1.50 1.50 1.50 I-5/Tacoma to Schuster Parkway (entire route)SR 970 0.00 0.00 10.31 10.31 10.31 I-90/Cle Elum to U.S. 97 (entire route)
HSS Ferry RoutesSR 304 Seattle/Bremerton FerrySR 305 Seattle/Bainbridge Island FerrySR 104 Edmonds/Kingston FerrySR 525 Mukilteo/Clinton FerrySR 20 Port Townsend/Keystone Ferry
Anacortes/Sidney B.C. Ferry
Total HSS Highway Miles 3532Total State Highway System 7063HSS Percentage of Total System 50.0%
Washington State Highway System Plan: 2003-2022 Appendix F – 3February 2002

Appendix F – 4 Washington State Highway System Plan: 2003-2022February 2002

Appendix G: Development Impacts Assessment
The State Environmental Policy Act (SEPA) requires local jurisdictions to assess and mitigate theimpacts of new development projects, including impacts to traffic. Together, local jurisdictionsand WSDOT agree on an acceptable level of service. For highways of statewide significance, thelevel of service is set by law. A particular development could cause impacts to traffic on a highwaysegment or an intersection to fall below the LOS* thresholds following:
For Highways of Statewide Significance:
Urban Areas: LOS “D”Rural Areas: LOS “C”; or
For Regionally Significant State Highways (non-HSS), the LOS thresholds adopted by thelocal MPO/RTPO shall apply. In the absence of an adopted LOS threshold, the LOS for HSSshall apply. Where there is a specific inter-local agreement with WSDOT, the applicableLOS threshold levels are established by the agreement; and
When a development affects a segment or intersection where the LOS is already below theapplicable threshold, the pre-development LOS will be used instead of the otherwiseapplicable deficiency level.
When a development would degrade the facility’s LOS below the applicable threshold, the facilitywould be considered deficient to support the development, and WSDOT and its partners wouldseek mitigation of traffic impacts. Mitigation can take the form of development constraints (forexample, the appropriate placement of highway access points), developer constructed transportationimprovements, or developer financial contribution to transportation improvements constructed byothers. Details on these and other mitigation strategies are contained in the WSDOT Design Manual.
* For specific information about LOS, see the Glossary in Appendix B.
Washington State Highway System Plan: 2003-2022 Appendix G – 1February 2002

Appendix G – 2 Washington State Highway System Plan: 2003-2022February 2002

Appendix H: Maintenance Accountability Process
The Maintenance Accountability Process (MAP) is a management program that employsoutcome-based performance measures for planning and evaluating the implementation ofthe Highway Maintenance program. MAP also provides tools for communicating to keycustomers the impacts of policy and budget decisions on program service delivery.Performance is measured by assessing the outcomes of 34 different highway maintenanceactivities (i.e., guardrail maintenance, snow and ice removal, etc.). Outcomes are translatedinto terms of Level of Service (LOS) ranging from “A” (highest level of service provided) to“F” (lowest level of service provided). The conditions of highway system features that leadto different LOS ratings can be generally characterized as follows:
• Service Level A (Best)This is a very high service level in which the roadway and associated features are inexcellent condition. All systems are operational and users experience no delays.
• Service Level BThis is a high maintenance service level in which the roadway and associated features are in good condition. All systems are operational. Users may experienceoccasional delays.
• Service Level CThis is a medium maintenance service level in which the roadway and associatedfeatures are in fair condition. Systems may occasionally be inoperable and notavailable to users. Short-term delays may be experienced when repairs are beingmade, but would not be excessive.
• Service Level DThis is a low maintenance service level in which the roadway and associatedfeatures are kept in generally poor condition. Systems failures occur regularlybecause it is impossible react in a timely manner to all problems. Occasionallydelays may be significant.
• Service Level F (Worst)This is a very low service level in which the roadway and associated features are keptin poor and failing condition. A backlog of systems failures would occur because it isimpossible react in a timely manner to all problems. Significant delays occur on aregular basis.
Washington State Highway System Plan: 2003-2022 Appendix H – 1February 2002

Appendix H – 2 Washington State Highway System Plan: 2003-2022February 2002

The Capital Improvement and Preservation Program (CIPP) communicates WSDOT’splan to deliver projects funded during the 2001 Legislative session. Replacing what wasformerly called the “Operating Book”, the CIPP is the reference point for measuring 2001-2003 project delivery. In addition to that, the CIPP does several other things for the firsttime, namely:
• Includes all WSDOT Capital Projects in one publication.
• Groups projects into programmatic arrays so that citizens and legislators cansee all that needs to be accomplished in each of WSDOT’s Capital Programs.
• Includes detailed summaries of 35 key projects.
• Has improved titles for all projects that include state, U.S., or Interstate routenumber, a locator familiar to citizens, and an indication of the type of workto be performed.
• Includes an enhanced thumbnail description of all projects, in lieu of thesomewhat cryptic descriptions found in past publications.
• Shows WSDOT’s best current estimates of costs for ten years from the currentdate (previous versions were six-year plans).
• Shows funds needed for completion of all stages of all projects begun orunderway in 2001.
• Shows WSDOT’s confidence range for estimates of project cost. (This is asensitive, difficult and complicated issue where much more work lies ahead.)
• Is presented in CD format, as well as on the World Wide Web atwww.wsdot.wa.gov/projects/
Since project expenditures and cost estimates must often be revised, this CIPP will beupdated annually. However, WSDOT expects its performance for the 2001-2003 bienniumto be measured from this September 2001 version.
The CIPP is organized so that interested readers can turn (or jump, in the CD and webversion) quickly to their particular interest. Under the highlighted projects tab, summaryinformation on key WSDOT projects can be found (“key” because of cost, prominence, orother special importance to the traveling public). These web pages also appear on theWSDOT web page at www.wsdot.wa.gov/projects/. There are also tabs for each individualcapital program in WSDOT – Facilities, Ferries, Highways, Local Programs, and Rail. Undereach tab, you will find specific project information for the indicated program area.
How is the CIPP different from the project list that the 2001 Legislature passed? WSDOTbuilds this CIPP based on the intent of the Legislative appropriations. However, our 1,600-plus projects do not remain static. Expenditures differ from what was predicted,project conditions change, and in certain cases project circumstances require that we delaya particular project and put another one in its place (e.g. environmental permittingconcerns, discovery of historic sites, discovery of unanticipated subsurface conditions).For these reasons, this CIPP differs in some respects from the project list that accompaniedthe 2001 Transportation Budget.
Appendix I: Capital Improvement and Preservation Program
Washington State Highway System Plan: 2003-2022 Appendix I – 1February 2002

Appendix I – 2 Washington State Highway System Plan: 2003-2022February 2002

Appendix I: Capital Improvement and Preservation Program
WSDOT Highway System Capital Programs Summary Information
Capital FacilitiesThe Capital Facilities component of WSDOT’s Capital Program includes the planning,management and funding of capital improvements to the department’s buildings and otherfacilities. Construction of new facilities and major capital improvements to existingfacilities are administered though this program.
HighwaysThe Highways component of WSDOT’s Capital Program includes improvements to,and preservation of, the state highway system. Highways improvements include projectsto reduce user delay and to improve safety on the highway system. Projects in thepreservation program are intended to preserve roadway pavements at lowest lifecycle cost,replace and rehabilitate bridges and other structures, preserve other facilities such as weighstations and rest areas and replace electrical and drainage systems that have reached theend of their serviceable life.
Local ProgramsThe local Programs component of WSDOT’s Capital Program includes several grantprograms intended to provide a source of funding for local agency projects that addressstate priorities. Federal funds for highways are dispersed to cities and counties throughthis program.
OperationsThe Operations component of WSDOT’s Capital Program consists of Design andConstruction / Implementation of projects that fit into three general areas; IntelligentTransportation Systems (ITS), Commercial Vehicle Information Systems and Networks(CVISN) and Target Zero (safety).
Washington State Highway System Plan: 2003-2022 Appendix I – 3February 2002

Appendix I – 4 Washington State Highway System Plan: 2003-2022February 2002

Appendix J: Highway Program Objectives and Action Strategies
This section lists the objectives and the supporting action strategies to maintain, operate, preserveand improve our state’s highway system assets. Each action strategy has a specific performancemeasure to track trends and report on the progress of meeting established transportation goals.
Maintain the effective and predictable operations of the transportation system tomeet customer’s expectations.
1. Bridge and Urban Tunnel MaintenanceMaintain and operate bridges and tunnels to achieve a statewide annualaverage level of service C+.
2. Drainage MaintenancePerform drainage activities to achieve a statewide annual average level ofservice C+.
3. Repair and Disaster MaintenanceRepair damage to the highway system and appurtenances to maintain safetravel by users.
4. Roadside and Landscape MaintenancePerform roadside activities by picking litter, reducing noxious weeds, andcontrolling vegetation obstructions to achieve a statewide annual averagelevel of service C+.
5. Roadway Maintenance and OperationPerform roadway maintenance activities to achieve a statewide annualaverage level of service C+.
6. Safety Rest Areas-Maintenance and OperationMaintain and operate safety rest areas to achieve a statewide annual averagelevel of service C+.
7. Snow and Ice ControlPerform winter operations activities on the highway system to achieve astatewide annual average level of service C+.
8. Traffic ServicesMaintain and operate traffic control markings, devices, and systems toachieve a statewide annual average level of service C+.
Maintenance (Program M)
Washington State Highway System Plan: 2003-2022 Appendix J – 1February 2002

Appendix J: Highway Program Objectives and Action Strategies
Increase the efficiency of operating the existing systems and facilities.
1. Dispatch and Traffic ControlProvide statewide coverage and 24 hour per day operation of TransportationManagement Centers for dispatch and traffic control by 2005.
2. Low Cost EnhancementsImprove the efficiency of the highway system by implementing low costenhancements.
3. Low Cost Traveler InformationImplement low-cost traveler information enhancements to provide basiclevel of info. (i.e., weather, incidents, construction and maintenance,and traffic conditions) on the interstate by 2003, corridors of statewidesignificance by 2005 and statewide by 2010. (For more about Highways ofStatewide Significance, see Appendix F).
4. Traffic Flow and Safety InvestigationsPerform timely and efficient investigations in response to customerconcerns regarding traffic flow and safety.
5. Traffic Flow ControlOptimize the efficiency of the highway system through traffic flow management techniques (e.g., ramp metering in peak hours, servicepatrols and incident response, signal timing and coordination).
6. Traveler Information SystemsIn partnership with public and private entities, invest in new travelerinformation systems to improve system efficiency, safety, and reducetraveler stress.
Increase traveler information to tourist destinations.
1. Local Partnership Traveler InformationPartner with local interest to provide appropriate traveler information totourists by 2005 including partnerships on designated byways.
2. Tourist Attraction SigningProvide appropriate signing to tourist attractions and destinations by 2005.
Operations (Program Q)
Appendix J – 2 Washington State Highway System Plan: 2003-2022February 2002

Appendix J: Highway Program Objectives and Action Strategies
Operations (Program Q) continued
Reduce and prevent deaths and the frequency and severity of disabling injuries,and societal costs of accidents.
Low Cost Safety EnhancementsImprove the safety of the highway system by implementing low cost trafficoperation enhancements that are not addressed through the highway construction program.
Reduce barriers that delay the effective and reliable movement of freight.
1. Advanced Technology for Commercial VehiclesExpand and enhance advanced technology applications for commercialvehicle operations on the I-5 corridor by 2005, I-90 corridor by 2010, andstatewide by 2015.
2. Expand CVISN StatewideExpand and enhance CVISN into statewide application by coveringinterstate highways by 2005 and highways statewide by 2010.
Preservation (Programs P1, P2 & P3)
Preserve transportation infrastructure to achieve the lowest life cycle cost andprevent failure.
Pavements (P1)
PavementPavements will be programmed targeting the lowest life cycle cost per theWashington State Pavement Management System “due” date. Existing safetyfeatures shall be restored to provide basic design level standards.
Structures (P2)
1. Bridge DecksPerform bridge deck rehabilitation through deck replacement and/or deck overlay.
2. Bridge PaintingIncrease the life expectancy of steel bridges by painting.
3. Bridge ReplacementReduce the number of Functionally Obsolete (FO) and Structurally Deficient (SD)bridges with Federal Bridge Replacement Sufficiency Ratings <80 by replacementor rehabilitation in compliance with FHWA National Bridge Management System(BMS) Guidelines.
Washington State Highway System Plan: 2003-2022 Appendix J – 3February 2002

Appendix J: Highway Program Objectives and Action Strategies
Preservation (Programs P1, P2 & P3) continued
Structures (P2) continued
4. Miscellaneous StructuresReplace or rehabilitate miscellaneous structures (secondary highway structures) thatare in poor structural condition as determined by the state’s inspection program.Publish an inventory of these structures.
5. Movable BridgesPreserve existing movable bridge systems by installing reliable modern systemsprior to the end of the moveable system’s service life.
6. Scour MitigationPerform scour mitigation to prevent failures/closures due to scour-inducedfoundation failure.
7. Seismic RetrofitCost-effectively retrofit seismically deficient bridges with Seismic Fittings
Other Facilities (P3)
1. Electronic/Mechanical SystemsReplace or rehabilitate electrical, electronic, and mechanical systems(with the exception of movable bridges) when they reach the end of theirservice life.
2. Major DrainageReplace or rehabilitate drainage features that have structurally failed or failsto protect the roadway prism with a storm event of 10 yrs or less.
3. Safety Rest Area RefurbishmentRefurbish deficient safety rest area buildings, utilities and sites.
4. Traffic Control SystemsUpgrade existing traffic control and monitoring systems as technologychanges to avoid obsolescence and capture the benefits of new technology.
5. Unstable SlopesStabilize 100% of unstable slopes.
6. Weight FacilitiesConstruct 10 new portable, 4 fixed, and 15 in-motion weight facilities andrehabilitate existing facilities.
Appendix J – 4 Washington State Highway System Plan: 2003-2022February 2002

Improvements (Programs I1, I2, I3 & I4)
Appendix J: Highway Program Objectives and Action Strategies
Reduce person and freight delay on WTP Corridors.
1. Puget Sound Core HOV Lanes Reduce delay for HOV users by completing the remaining 106 miles of the Puget Sound Core HOV system (as defined by the Transportation Commission) by the year 2012. Future HOV system expansion in urban areas will be considered based on delay reduction.
2. Access Management Developed Corridors Along corridors, which are fully developed, reduce travel delay by utilizing access management techniques where appropriate.
3. Access Management for Non Developed Corridors Where cost effective along corridors not fully developed, reduce the number of existing or potential access points by purchasing access rights where future congestion problems are expected.
4. “Congested” non-HSS Where adopted congestion thresholds are surpassed on non-HSS facilities, partner with regional and local governments to make targeted transportation investments.
5. “Congested” HSS Where adopted congestion thresholds are surpassed on Highways of Statewide Significance (HSS), make targeted transportation investments considering all available transportation strategies.
Improve existing travel options
Bicycle/Pedestrian Corridors Develop bike/pedestrian corridors where they support public transportation facilities and are viable commute corridors.
Create links and remove barriers between transportation facilities and services.
1. Multi-Modal Facilities Improve connections at multi-modal transportation facilities.
2. Urban Bicycle By 2020 increase the number of completed local bicycle and pedestrian networks by completing missing links along or across state highways.
Support statewide economic development through targeted transportation investments.
Passing/Climbing Lanes Construct periodic passing or climbing lanes where slow moving vehicles degrade the general mobility within State and Regional Corridors.
Mobility (I1)
Washington State Highway System Plan: 2003-2022 Appendix J – 5February 2002

Appendix J: Highway Program Objectives and Action Strategies
Reduce and prevent deaths and the frequency and severity of disabling injuries, andreduce the societal costs of accidents. (Focus on the rate of severity and frequency)
1. High Accident Locations (HAL) Eliminate high accident locations on state highways through hazard mitigation.
2. Pedestrian Accident Locations (PAL) Eliminate Pedestrian Accident Locations on state highway through hazard mitigation.
3. High Accident Corridors (HAC) Eliminate high accident corridors using standards based highway safety solutions.
4. Signals and Channelization Construct intersection channelization and/or signals in compliance with federal guidelines to improve safety.
5. Interstate Safety Improve the geometrics of the Interstate system per Federal Highways Administration (FHWA)/WSDOT stewardship agreement.
6. At-Grade Intersections Eliminate major at-grade intersections on multi-lane, divided highways with speeds of 45 MPH or greater.
7. Risk Reduction Improve roadways where geometrics, traffic volumes, and speed limits indicate a high accident potential by instituting standards based highway safety solutions.
8. Pedestrian Risk Proactively address pedestrian safety along state highway segments that exhibit high pedestrian use and the potential for future accidents.
9. Safety Initiatives Address highway safety through statewide low-cost, high benefit and short-term projects.
Improvements (Programs I1, I2, I3 & I4) continued
Safety (I2)
Appendix J – 6 Washington State Highway System Plan: 2003-2022February 2002

Appendix J: Highway Program Objectives and Action Strategies
Reduce barriers that delay the effective and reliable movement of freight.
1. All Weather Roadways (freeze/thaw) Upgrade sections of highways to reduce annualized costs of repaving due to freeze/thaw deficiencies.
2. Avalanche and Flood Closures Upgrade T1 highways to reduce road closures caused by avalanches, snow and ice accumulation, and flooding on I-5 in Chehalis (See Freight & Goods Transportation System (FGTS), Appendix B- Glossary).
3. Freight Trunk System Complete construction of four lane roadways on T1 routes.
4. Height Restricted Bridges Replace or reconstruct height restricted bridges and tunnels on the Interstate highway system with a vertical clearance of less than 15’6".
5. Bridge Overloads Rebuild bridges that cannot carry legal overloads.
6. Border Crossings Reduce delay to people and products at the U.S./Canadian border crossing through capital improvements and operational enhancements.
7. International Trade/Port Access In partnership with public and private entities, make targeted improvements to the state highway system in support of international trade, port access and emergent economic development.
Economic Initiatives (I3)
Improvements (Programs I1, I2, I3 & I4) continued
Washington State Highway System Plan: 2003-2022 Appendix J – 7February 2002

Appendix J: Highway Program Objectives and Action Strategies
Maintain the ability to move freight and goods in the event of alterations to theColumbia/Snake River system as a transportation right of way.
Columbia/Snake River Accommodations Increase capacity on the Freight & Goods Transportation System (FGTS) highways, to accommodate increases in truck traffic in the event of alterations to the Columbia/ Snake River system
Support statewide economic development through targeted transportation investments.
Economic Vitality Construct State Highway transportation improvements that: solve transportation traffic flow or access deficiency on a State Highway; and supports targeted economic development of new or existing basic industries and/or regional economic development, including regional tourism, within the corridor.
Increase traveler information to tourist destinations.
Heritage Corridors Parks and Viewpoints Provide appropriately sized roadside parks and/or viewpoints, which inform the traveling public about heritage resources and travelers services.
Improve the quality of tourists’ related travel experiences in Washington.
1. Heritage Corridor Plans In partnership, provide support to develop and implement Corridor Management Plans and projects on designated scenic byways to interpret, enhance and access heritage resources.
2. Bicycle Touring Routes Decrease the number of miles of roadway segments with two feet of shoulder or less along designated rural bicycle touring routes (structures not included).
3. Safety Rest Area Utilizing partnerships at new locations, provide public access to appropriately sized, restroom-equipped facilities, including RV dump stations at designated sites, every 60 miles on the NHS and State and Rural highways.
Economic Initiatives (I3) continued
Improvements (Programs I1, I2, I3 & I4) continued
Appendix J – 8 Washington State Highway System Plan: 2003-2022February 2002

Appendix J: Highway Program Objectives and Action Strategies
Reduce impact on communities and their resources with the development andimplementation of transportation projects.
Noise Reduction Strategically prioritize and retrofit existing state transportation facilities for noise reduction. Work with community partners and planning organizations to prevent highway noise impacts.
Reduce the impact of transportation facilities and services on air quality in conformancewith the State Implementation Plan for Air Quality.
Air Quality Implement all transportation control measures as identified by the Washington State Implementation Plan for Air Quality.
Reduce water quality impacts caused by transportation facilities and services to complywith federal and state water quality requirements.
Stormwater Strategically prioritize, repair, replace and retrofit existing state transportation facilities for stormwater runoff quality and quantity to reduce environmental impacts.
Reduce the impacts of past projects and avoid or minimize impacts to watershed and habitat from current and future transportation activities.
Wetland Mitigation Strategically prioritize and re-mediate wetland mitigation sites during the later stages of the monitoring phase to ensure they function as conditioned by the issuance of permits.
Reduce the impacts of past projects and avoid or minimize impacts to watershed andhabitat from current and future transportation activities.
1. Chronic Environmental Deficiencies Develop criteria, strategically prioritize and repair existing chronic environmental deficiencies of transportation facilities.
2. Fish Barriers Strategically prioritize, repair, replace and retrofit existing barriers to fish passage on the state highway system with in 20 years as appropriate to reduce existing barriers to fish passage statewide.
Environmental Retrofit (I4)
Improvements (Programs I1, I2, I3 & I4) continued
Washington State Highway System Plan: 2003-2022 Appendix J – 9February 2002

Appendix J – 10 Washington State Highway System Plan: 2003-2022February 2002

Appendix K: 20-Year Improvement Strategies
To better coordinate improvement strategies, a database of transportation systemsolutions was developed in a collaborative effort between the state, regionaltransportation planning organizations, tribal governments, local jurisdictions, transitagencies, and private trans-portation providers. The database is not inclusive of alltransportation system needs in the state and is most inclusive of state owned and stateinterest transportation systems. The database is limited to the data that was providedby the participating organizations.
The database is used for statewide systems analysis. Each solution is included in atransportation system plan. If you have questions or comments on the inclusion,exclusion, or nature of a specific transportation system solution, please contact thesponsor of the solutions. More specific details of many projects can be found in WSDOT’sCapital Improvement and Preservation Program (CIPP), or in Metropolitan TransportationPlan (MTPs) and Regional Transportation Plan (RTPs), and in local city and countycomprehensive plans.
The following sections are divided by subprogram and further sorted by regionand state route.
Congestion Relief Strategies
Highway Safety Strategies
Economic Initiative Strategies
Environmental Retrofit Strategies
To view the database of project solutions, visit the Washington State Highway SystemPlan at www.wsdot.wa.gov/ppsc/planning
Washington State Highway System Plan: 2003-2022 Appendix K – 1February 2002

Appendix K – 2 Washington State Highway System Plan: 2003-2022 February 2002

Appendix K: 20-Year Improvement Strategies
Mobility Strategies
The strategies listed in this section describe the improvements that are needed to meet themobility objectives for the next 20 years, from 2003-2022. It is important to note thatthese are planning strategies and that the project scope will be refined during the program-ming and design phases. Major congestion relief efforts will require extensive public andlocal agency input, as well as environmental impact analysis prior to selection of a pre-ferred alternative.
0
50
100
150
200
250
300
350
0
$5,000
$10,000
$15,000
$20,000
$25,000
Northwest North Olympic Southwest South EasternRegion Central Region Region Central Region
Region Region
Northwest North Olympic Southwest South EasternRegion Central Region Region Central Region
Region Region
Mobility Improvement SubprogramNumber of Strategies by Region
Mobility Improvement SubprogramEstimated $ Cost in Millions by Region (2001 Dollars)
Washington State Highway System Plan: 2003-2022 Appendix K – 3: Mobility StrategiesFebruary 2002

High Cost Mobility ImprovementsTwenty-one of the mobility strategies are high cost projects, estimated at the planning levelof over $200 million, representing approximately 60% ($23 billion) of the cost of themobility subprogram. Brief descriptions of the location/project names are as follows (thenumbered order does not reflect priority or dollar value):
Number Highway/Location and Improvement WSDOT Region(s)1. I-405 Corridor – Tukwila to Lynnwood Multimodal Improvements Northwest2. SR 520 Trans-Lake Solution – Multimodal Improvements Northwest3. I-5 Core HOV (See Appendix J-5) Northwest, Olympic4. U.S. 395 – North Spokane Corridor Eastern5. New SR 509 Northwest6. SR 167 Extension Olympic7. SR 16 – Tacoma Narrows Bridge Olympic8. SR 99 – Alaskan Way Viaduct, Replacement Northwest9. Spokane I-90 / Central Business District Eastern
10. SR 28 – Wenatchee to I-90 North Central11. I-90 – Snoqualmie Pass East South Central12. U.S. 101 / I-5 – HOV Olympic13. I-5 – Columbia River Interstate Crossing Southwest14. I-5 – Oregon State Line to I-205 Junction Southwest15. I-5 – SR 501 to Toutle River Rest Area Vicinity Southwest16. I-5 – Toutle River rest area Vicinity to Rush Road – Increase Capacity Southwest17. U.S. 395 / I-82 to I-182 – Widen to Six Lanes South Central18. SR 104 Kingston – Widen from Two to Four lanes Olympic19. I-5 – 72nd to Pacific Avenue – Add Core HOV Lanes Olympic20. I-5 – Pacific Avenue to Port of Tacoma – Add Core HOV Lanes Olympic21. I-5 – Rush Road to Thurston County Line – Increase Capacity Southwest
Many of these improvements are on critical strategic routes. Investing in theseimprovements, however, is difficult due to limited funds and the intense competition forfunds among these projects and other important smaller scale mobliity projects.
Appendix K: 20-Year Improvement Strategies
Douglas
Okanogan
Chelan
Yakima
Grant
Adams
Lincoln
Whitman
Snohomish
Pierce
Lewis
Clallam
Klickitat
Jefferson
Benton
Franklin
Walla Walla
Spokane
FerryStevens
PendOreille
GraysHarbor
Pacific
Clark
Columbia
AsotinWahkiakum
Thurston
SanJuan
Garfield
SkamaniaCowlitz
King
Kittitas
Whatcom
Island
Skagit
Kitsap
Mason
NorthCentral
Eastern
SouthCentral
Northwest
Southwest
Olympic12
3
4
5
67
89
1011
12
1314
15
16
17
18
19 20
21
High Cost Mobility Project Locations
Appendix K – 4: Mobility Strategies Washington State Highway System Plan: 2003-2022February 2002

Washington State Highway System Plan: 2003-2022 Appendix K – 5February 2002
Appendix K: 20-Year I1 Mobility Strategies
Northwest Region
Highway Estimate Cost RangeNumber Milepost Vicinity Description ($ in Millions)
"Congested" HSS2 0 to 2.71 I-5 to SR 204 98.30 to 133.00Solution: Add Eastbound & Westbound HOV lanes to SR 204, modify interchange at I-5/US 2.
2 0 to 56.76 Everett to Deception Creek 3.99 to 5.39Solution: :Capacity and safety study of US 2 including potential bypass of Sultan, Gold Bar, and Startup.
2 2.71 to 5.02 SR 204 to Milepost 5.02 24.60 to 33.28Solution: : Widen to 4 lanes, limited access, Interchange @ Bickford Ave. (Old US 2). Include Westbound HOV lane @ SR 204 Interchange.
2 5.02 to 8.8 Milepost 5.02 to Campbell Road (92nd St. Southeast) 30.27 to 40.95Solution: Widen to 4 lanes
2 8.8 to 16 Campbell Road (92nd St. Southeast) to Monroe 102.77 to 139.05Solution: : Phase 2 - Construct new 4 lane, limited access bypass with new interchanges @ Westwick Road, SR 522, and east Monroe. 4 lanes to SR 522 with additional 2 lanes added around Monroe
(this is in addition to the two lanes found in the constrained plan).
2 14.25 to 16.12 SR 522 Interchange to Monroe East of City Limits 27.08 to 36.64Solution: :Phase 1 - Construct two-lane bypass of Monroe on new alignment.
2 16 to 18.67 City of Monroe East of City Limits to Fern Bluff Road 11.25 to 15.23Solution: : Widen to 4 lane, median divided highway including access purchase.
2 18.67 to 24.22 Fern Bluff Road to City Sultan West of City Limits 34.06 to 46.08Solution: :Widen to 4 lane, median divided highway to Sultan (Milepost 21.42) including access purchase. Widen to 4 lanes without median through Sultan eastward.
2 24.22 to 31.27 City of Sultan West of City Limits to Fir Road 40.83 to 55.23Solution: :Widen to 4 lanes, median divided, limited access highway (Milepost 24.44 - Milepost 25.56, Milepost 26.33 - 27.48, and Milepost 28.72 - Milepost 31.27). Within cities, provide 4 lane undivided
2 31.27 to 35.62 Fir Road to Index-Galena Road 25.49 to 34.49Solution: :Widen to 4 lane, median divided, limited access highway.
2 35.62 to 42.77 Index-Galena Road to Beaver Road 42.50 to 57.50Solution: : Widen to 4 lane, median divided, limited access highway.
2 42.77 to 48.99 Beaver Creek to City of Skykomish East of City Limits 47.60 to 64.40Solution: :Widen to 4 lane, median divided, limited access highway.
2 48.99 to 56.76 City of Skykomish East of City Limits to Deception Creek 39.64 to 53.64Solution: :Widen to 4 lane, median divided, limited access highway.
5 139.5 to 164.49 Tacoma vicinity to I-90 2.64 to 3.58Solution: Study lane balance and interchange needs to determine mobility solution to growing congestion problems.
5 140.38 to 143.45 Vicinity of the I-5/SR 18 Interchange 42.01 to 56.83Solution: Needs Further Study - New Interchange at SR 161 with collector-distributor lanes between SR 18 lanes SR 161.
5 146.48 to 147.28 South 272nd Street Interchange 5.94 to 8.04Solution: Interchange improvements to accommodate increased capacity on South 272nd Street.
5 153.92 to 154.46 I-5/I-405/SR 518 Interchange vicinity 42.89 to 58.03Solution: Freeway-Freeway HOV lane connection at I-5/I-405/SR 518 - Southeast Quadrant
5 162.57 to 163.02 South Industrial Way vicinity 44.77 to 60.57Solution: HOV direct access connection to South Industrial Way/E3 busway.
5 164.49 to 213.08 I-90 to SR 532 6.65 to 8.99Solution: Corridor Study to determine capacity and interchange needs on I-5.
5 166.4 to 167.8 E Denny Way to SR 520 133.40 to 180.48Solution: Needs Further Study - Modify the Mercer St. interchange and reversible lane for weave from SR 520 to Mercer St.
5 169.86 to 169.86 Northeast 50th St. Interchange 24.96 to 33.78Solution: HOV Direct Access Ramps at Northeast 50th St.
5 174.11 to 174.11 SR 523 (Northeast 145th St.) Interchange vicinity 8.78 to 11.88Solution: HOV Direct Access Ramps at SR 523/145th. St.
5 176.39 to 177.42 Northeast 175th St. to Northeast 205th St. 3.90 to 5.28Solution: Construct Northbound Auxiliary Lane.
5 177.78 to 179.93 Mountlake Terrace/Edmonds vicinity 20.41 to 27.61Solution: Construct 1000 Stall Park and ride lot structure
5 179.8 to 180.3 220th St. Southwest to 44th Ave. W. 3.74 to 5.06Solution: Construct northbound auxiliary lane.
5 179.93 to 182.21 Lynnwood vicinity 15.30 to 20.70Solution: Construct 750 stall park and ride lot structure.
5 181.07 to 182.45 SR 524 Interchange 13.98 to 18.92Solution: Interchange improvements at the SR 524 (196th St.) interchange.
5 182.05 to 183.12 I-5 / I-405 / SR 525 Interchange vicinity toSolution: Freeway-Freeway HOV lane connection @ the Swamp Creek Interchange - Northeast Quadrant (Costs included in the I-405 corridor estimate).

Appendix K – 6 Washington State Highway System Plan: 2003-2022 February 2002
Appendix K: 20-Year I1 Mobility Strategies
Northwest Region (continued)
Highway Estimate Cost RangeNumber Milepost Vicinity Description ($ in Millions)
"Congested" HSS (continued)5 183.12 to 188.68 I-5/SR 526 Interchange vicinity 9.41 to 12.73Solution: freeway-to-Freeway connection at I-5/SR 526 - Southeast Quadrant.
5 186.42 to 186.42 SR 96/128th St. Southwest Interchange 10.38 to 14.04Solution: Construct a Westbound to Southbound loop ramp with HOV bypass and ramp metering.
5 193.65 to 199.58 US 2 to SR 528 104.30 to 141.12Solution: Construct HOV lanes in each direction.
5 198.5 to 198.56 Marysville vicinity 11.31 to 15.30Solution: Construct a 450-stall park and ride lot and a 300-stall park and ride lot.
5 199.58 to 205.63 SR 528 to SR 531 38.13 to 51.59Solution: Widen from 3 to 4 lanes in each direction. Reconstruct interchange ramps
5 205.63 to 208.99 SR 531 to SR 530 31.33 to 42.39Solution: Widen from 3 to 4 lanes in each direction. Reconstruct interchange ramps. Park and ride lot by others.
5 206.1 to 206.1 I-5/SR 531 Interchange 8.02 to 10.84Solution: 172nd St. interchange modifications; widen structure to 5/6 lanes.
5 208.99 to 212.41 SR 530 to SR 532 33.32 to 45.08Solution: Widen from 3 to 4 lanes in each direction. Reconstruct interchange ramps. Expand Stanwood/I-5 Park & ride lot.
5 212.41 to 217.66 SR 532 to Skagit County line 30.09 to 40.71Solution: Widen from 3 to 4 lanes in each direction. Reconstruct interchange ramps
5 217.66 to 219.8 Skagit County Line to Hill Ditch 21.48 to 29.06Solution: Widen to 8 lanes
5 219.8 to 221.07 Hill Ditch to SR 534 15.10 to 20.42Solution: Widen to 8 Lanes
5 221.07 to 225.64 SR 534 to Mt. Vernon South of City Limits, Stage 2 50.86 to 68.82Solution: Widen to 8 Lanes
5 221.07 to 225.64 SR 534 to Mt. Vernon South of City Limits, Stage 1 27.32 to 36.96Solution: Widen to 6 Lanes
5 225.64 to 226.7 Mt. Vernon South of City Limits to SR 536 Interchange 20.57 to 27.83Solution: Widen to 6 Lanes
5 227.73 to 227.73 College Way & Train Station (Mt. Vernon) 1.44 to 1.94Solution: Construct Park & Ride lot (100 Stalls)
5 232.83 to 232.83 Cook Road Interchange (North Burlington) 1.44 to 1.94Solution: Construct Park & Ride lot (100 Stalls)
5 237.71 to 242.63 Bow Hill Rest Area to Nulle Road 56.83 to 76.89Solution: Widen to 6 Lanes
5 242.63 to 245.58 Nulle Road to Samish Highway 19.66 to 26.60Solution: Widen to 6 Lanes
5 245.58 to 248.91 Lake Samish Way Highway to Bellingham 24.69 to 33.41Solution: Widen to 6 Lanes, modify Samish Highway Interchange
5 248.91 to 251.55 Enter Bellingham to 36th Off-ramp 20.53 to 27.77Solution: Widen to 6 Lanes:
5 251.55 to 253.52 36th St. to Meador Ave. (Bellingham) 32.39 to 43.82Solution: Widen to 6 Lanes
5 253.52 to 254.82 Meador Ave. to SR 542 21.60 to 29.22Solution: Widen to 6 lanes
5 254.82 to 254.82 I-5 and SR 542 (Sunset Drive; Bellingham 1.61 to 2.17Solution: Construct Park & Ride lot (100 Stalls)
5 254.82 to 256.67 SR 542 to SR 539 Interchange 26.04 to 35.22Solution: Widen to 6 Lanes
5 256.67 to 259.85 SR 539 Interchange to Slater Road Interchange 32.90 to 44.51Solution: Widen to 6 lanes
5 259.85 to 261.53 Slater Road to Ferndale 14.93 to 20.19Solution: Widen to 6 Lanes
5 261.53 to 265.22 Smith Road to Portal Way (Ferndale) 47.83 to 64.71Solution: Widen to 6 Lanes, modify Axton Road and Portal Way Interchanges
5 265.22 to 269.91 Portal Way to Birch Bay-Lynden Road 41.66 to 56.36Solution: Widen to 6 Lanes, modify Grandview Road & Custer School Road Interchanges

Washington State Highway System Plan: 2003-2022 Appendix K – 7February 2002
Appendix K: 20-Year I1 Mobility Strategies
Northwest Region (continued)
Highway Estimate Cost RangeNumber Milepost Vicinity Description ($ in Millions)
"Congested" HSS (continued)5 269.91 to 273.86 Birch Bay-Lynden Road to Blaine 39.94 to 54.04Solution: Widen to 6 Lanes, signalize Northbound Ramp at Birch Bay-Lynden Road
5 273.86 to 275.54 Dakota Creek to Mitchell Ave. (Blaine) 31.62 to 42.78Solution: Widen to 6 lanes, modify south. Blaine & SR 543 Interchanges and Hughes Ave. crossing
5 275.54 to 276.42 Mitchell Ave. to D Street On-ramp 21.94 to 29.68Solution: Widen to 6 lanes, modify D Street Interchange, & Mitchell St. and H St. crossings
5 275.97 to 275.97 I-5 and 3rd Street (Blaine) 0.43 to 0.59Solution: Construct new Park & Ride lot (30 - 40 Stalls)
11 0 to 4.05 I- 5 to Field Road 13.51 to 18.27Solution: Turn lanes at selected locations
18 0 to 6.14 I-5 Interchange to SR 164 Interchange 38.85 to 52.57Solution: Needs Further Study - Construct missing ramp connection at the SR 18/SR 167 Interchange. SC&DI.
20 16.32 to 20.53 Race Road to Jacobs Road 5.21 to 7.05Solution: Widen to 12' Lanes and 8' Shoulders, left turn lanes
20 22.15 to 23.15 Kettle's Trail Access 0.22 to 0.30Solution: Construct Parking Lot for Trail Users
20 23.99 to 25.31 Jodhpurs Drive to Libbey Road 3.26 to 4.42Solution: Southbound/Westbound Passing Lane
20 26.13 to 26.73 Power Road to Arnold Road 0.61 to 0.83Solution: Two-way left turn lane
20 30 to 31.3 Waterloo Road to Beeksma Drive 6.49 to 8.77Solution: Widen to 4/5 Lanes
20 31.39 to 31.39 SR 20/Beekesma Drive/Pioneer Way 2.20 to 2.98Solution: Realign Intersection to Provide Two Eastbound & Two Westbound "Through" Lanes through Intersection
20 32.95 to 34.74 Goldie Road to Ault Field Road 8.68 to 11.74Solution: Widen to 4/5 Lanes
20 34.46 to 34.74 Ault Field Road to Fakkema Road 1.99 to 2.69Solution: Realign Side Roads to Meet at One Intersection on SR 20
20 34.99 to 36.31 Hoffman Road to Frostad Road 4.03 to 5.45Solution: Southbound/Westbound Passing Lane
20 37 to 38.14 Dugualla Curve to Monkey Hill Road 1.33 to 1.81Solution: Northbound/Eastbound Passing Lane
20 41.58 to 41.9 Deception Pass Bridge 67.77 to 91.69Solution: Capacity and Safety Improvements
20 41.81 to 41.9 Cornet Bay Road to Deception Pass Bridge 67.82 to 91.76Solution: Needs Further Study - Widen to 4 lanes includes, 1/2 of the Deception Pass Bridge & new alignment
20 41.9 to 47.89 Deception Pass Bridge Vicinity to SR 20 Spur 1.78 to 2.40Solution: North Island Access Study
20 41.9 to 42 Deception Pass Bridge (Skagit County’s half) 48.77 to 65.99Solution: Needs Further Study - Widen to 4 lanes, construct new Deception Pass Bridge (Cost is half of Bridge)
20 42 to 47.89 Deception Pass Bridge to SR 20 Wye Connection 141.66 to 191.66Solution: Widen to 4 lanes
20 47.89 to 54.89 Sharpe's Corner to SR 536 49.27 to 66.65Solution: Needs Further Study - Widen to 6 lanes. (See Safety Program for further description and estimate)
20 47.89 to 50.38 SR 20 Spur to R Avenue (Anacortes Spur) 10.70 to 14.48Solution: Needs Further Study - Widen to 6 lanes
20 50.62 to 55.67 Anacortes Spur - Commercial Ave. to Ferry Landing 16.75 to 22.66Solution: Spur: Develop parallel route, or widen to 3 lanes & signalize
20 63.72 to 66.29 Sedro-Woolley City Limits 16.79 to 22.71Solution: Needs Further Study - Widen to 4 lanes
20 66.29 to 71.33 Sedro-Woolley to Minkler Road 16.07 to 21.75Solution: Needs Further Study - Widen to 4 lanes
20 71.33 to 79.37 Minkler Road to Alder Creek 26.10 to 35.31Solution: Needs Further Study - Widen to 4 Lanes
20 79.37 to 88.8 Alder Creek to Concrete 28.23 to 38.19Solution: Needs Further Study - Widen to 4 Lanes

Appendix K – 8 Washington State Highway System Plan: 2003-2022 February 2002
Appendix K: 20-Year I1 Mobility Strategies
Northwest Region (continued)
Highway Estimate Cost RangeNumber Milepost Vicinity Description ($ in Millions)
"Congested" HSS (continued)90 1.99 to 9.44 I-5 to Mercer Island 71.04 to 96.12Solution: Convert center roadway to two-way transit operation. Add HOV lanes to the mainline.
90 9.06 to 14 Enter Bellevue to North Bend vicinity 2.64 to 3.58Solution: Corridor study to examine lane balance and interchange needs within this segment of the I-90 corridor.
90 11.14 to 16.85 I-90 between Eastgate and Issaquah 43.25 to 58.51Solution: Needs Further Study - Extend HOV lanes to Front Street and add auxiliary lanes from Eastgate to Front Street.
90 11.45 to 17.13 I-90 between Eastgate and Issaquah 44.43 to 60.11Solution: Construct 1800 Stall Park and ride lot structure(s).
90 13.15 to 13.3 West Lake Sammamish Parkway Interchange 3.70 to 5.00Solution: Realign off ramp and construct roundabout type intersection.
90 18.38 to 20.75 E. Sunset Way Interchange to High Point Road Interchange 17.23 to 23.31Solution: Widen to 4 lanes in each direction. Maintain truck lanes. Reconstruct interchange ramps.
90 18.38 to 18.38 E. Sunset Way Interchange (Issaquah) 17.75 to 24.01Solution: Improve/Modify Sunset interchange to enhance access and circulation.
90 20.75 to 22.86 High Point Road Interchange to Jones Road Interchange 13.52 to 18.30Solution: Widen to 4 lanes in each direction. Maintain truck lanes. Reconstruct interchange ramps.
90 22.86 to 25.65 Jones Road Interchange (Southeast 82nd St.) to SR 18 18.09 to 24.47Solution: Widen to 4 thru lanes in each direction. Maintain truck lanes where they exist currently. Reconstruct interchange ramps.
90 25.65 to 30.23 SR 18 to SR 202 Interchange (North Bend Blvd.) 28.08 to 38.00Solution: Widen to 4 thru lanes in each direction. Maintain truck lanes where they exist currently. Reconstruct interchange ramps.
90 29 to 33.29 In the North Bend/I-90 vicinity 2.38 to 3.22Solution: Construct a 150-stall park and ride lot.
90 30.23 to 33.29 SR 202 Interchange to Northwest Region boundary 23.57 to 31.89Solution: Widen to 4 thru lanes in each direction. Maintain truck lanes where they exist currently. Reconstruct interchange ramps.
99 26.04 to 32.44 SR 509 to Battery Street Tunnel 0.87 to 1.17Solution: Corridor segment study analyzing the future operation of SR 99 including potential new connections to route.
99 26.04 to 29.2 SR 509 Interchange to Spokane St. 1.41 to 1.91Solution: [Rehab existing bridge] Signal coordination.
99 30.72 to 32.65 1st Ave. South to Denny Way 850.00 to 1,150.00Solution: Needs Further Study - Seismic retrofit of existing facility or removal of existing facility and construction of new roadway.
99 38.53 to 40.47 North 105th St. to North. 145th St. 16.01 to 21.67Solution: Needs Further Study - Study with City of Seattle - Widen to 6/7 lanes for HOV with transit and pedestrian improvements. Access management. Signal coordination.
99 40.47 to 43.5 North 145th St. to SR 104/North. 205th St. 50.29 to 68.05Solution: Widen from 4 to 6 lanes for HOV with landscaped median, transit, and pedestrian improvements. Access management. Signal coordination.
99 40.47 to 47.05 Shoreline/Edmonds vicinity 9.31 to 12.59Solution: Construct 500 stall park and ride lot.
99 43.5 to 43.67 SR 104 Interchange 5.84 to 7.90Solution: Provide HOV lanes through the SR 104 Interchange (strategy closes a gap between two locally lead projects on SR 99 between Shoreline and Lynnwood).
104 32.02 to 32.28 SR 104/SR 522 Intersection toSolution: Transit & queue bypass at SR 522 intersection (Costs included in SR 522 estimate).
167 24.15 to 25.92 Southwest 43rd St. to I-405 12.25 to 16.57Solution: Interchange improvements at South 180th St.
167 24.7 to 26 SR 167 and I-405 24.39 to 32.99Solution: HOV Direct Access Ramps at Southwest 27th St.
405 0 to 30.32 I-5 in Tukwila to I-5 in Lynnwood 5,988.68 to 8,102.33Solution: Needs Further Study - Corridor Study underway. Preferred alternative unknown. Cost based on Alternative 3. Includes HOV express lanes and park and rides, 2 additional GP lanes each direction, interchange & non-motorized improvements, TDM, Intelligent Transportation System, & freight enhancements.
405 7.2 to 8.4 Northeast 44th Street Interchange toSolution: Interchange improvements for Port Quendal development (Costs included in I-405 corridor estimate).
405 12.77 to 14.12 Downtown Bellevue 133.22 to 180.24Solution: New HOV interchange and downtown Bellevue access improvements.
405 15.84 to 20.91 Kirkland/Kingsgate vicinity toSolution: Construct 600 stall park and ride lot structure (Costs included in I-405 corridor estimate).
405 26 to 28 Canyon Park vicinity toSolution: Construct 600 stall park and ride lot (Costs included in I-405 corridor estimate).
509 21.84 to 24.34 New SR 509 from Southwest 210th to South 177th Pl. 578.85 to 783.15Solution: New Freeway - SR 509 Extension with HOV. New interchange with I-5 at South 210th St. I-5 widening for auxiliary lanes in each direction between South 272nd St. and South 204th St. South Access Road to airport not included in cost but integral to project.

Washington State Highway System Plan: 2003-2022 Appendix K – 9February 2002
Appendix K: 20-Year I1 Mobility Strategies
Northwest Region (continued)
Highway Estimate Cost RangeNumber Milepost Vicinity Description ($ in Millions)
"Congested" HSS (continued)
509 24.35 to 26.36 Des Moines Memorial Drive to South 136th St 36.35 to 49.19Solution: Needs Further Study - Widen to 6 lanes with HOV.
509 26.38 to 29.79 South 136th St. to 1st Ave. South 44.25 to 59.87Solution: Needs Further Study - Widen to 6 lanes with HOV.
518 0 to 3.81 SR 518/SR 509 Interchange to I-5 85.11 to 115.15Solution: Route Study underway - Estimate based adding on HOV lanes and an urban Interchange at SR 99.
518 0.05 to 0.05 SR 518/SR 509 intersection 15.27 to 20.67Solution: Construct fly-over ramp from Southbound SR 509 to Eastbound SR 518.
520 0 to 12.83 Seattle to Redmond 5,100.00 to 6,900.00Solution: Needs Further Study - EIS (Trans-Lake) underway. Preferred alternative unknown. Estimate based on Commission's New Law Budget request.
522 0 to 11.1 I-5 to I-405 2.64 to 3.58Solution: SR 522 Transportation Demand Management (TDM) project
522 0 to 10.46 I-5 to east of Kaysner Way 77.87 to 105.35Solution: Construct transit lanes, pedestrian and bicycle amenities, access management including landscaped median, transit priority at intersections.
522 10.46 to 13.45 Kaysner Way to Woodinville 6.06 to 8.20Solution: Needs Further Study - HOV lanes to I-405 (Milepost 11.10). No action beyond Milepost 11.10, limited access highway. Complete full diamond interchange at Northeast 195th St.
522 13.45 to 17.46 King County line to SR MP 17.46 13.52 to 18.29Solution: New interchange at Paradise Lake Road.
522 17.46 to 20.5 SR MP 17.46 to Snohomish River 18.50 to 25.02Solution: Widen to 4 lane limited access freeway with new interchange at False Lake Road.
522 20.5 to 24.68 Snohomish River to US 2 (Monroe) 34.60 to 46.81Solution: Widen to 4 lane limited access freeway.
525 1.4 to 3.24 164th Street Southwest to SR 99 1.69 to 2.29Solution: Widen to 4 lane, limited access freeway
525 3.41 to 6.04 SR 99 to SR 526 7.65 to 10.35Solution: Widen to 4/5 lanes
525 11.18 to 11.38 Vicinity SR 525/Cultus Bay Road 0.20 to 0.26Solution: Extend existing Two-way left turn lane 1000' north
525 13.2 to 14.27 Crawford Drive to Vicinity Kramer Road 1.87 to 2.53Solution: Build Northbound Passing lane
525 17.26 to 18.08 Scott Road to Fish Road 1.51 to 2.05Solution: Southbound passing lane
525 18.92 to 19.97 Honeymoon Bay Road to crest of hill 1.81 to 2.45Solution: Northbound passing lane
525 24 to 24.68 Vicinity of crest of hill to Leaf lane 1.26 to 1.70Solution: Southbound passing lane
534 0 to 0.49 I-5 to Carpenter Creek 3.90 to 5.28Solution: Widen to 4 Lanes
536 0 to 5.23 SR 20 to Kincaid Street (Mount Vernon) 21.45 to 29.03Solution: Needs Further Study - Widen to 4 lanes and replace Skagit River Bridge
539 0.48 to 1.73 W. Bakerview Road to Horton Road 10.23 to 13.83Solution: Widen to 7 Lanes
539 1.73 to 6.13 Horton Road to Ten Mile Road (Stage 1) - Widening 25.02 to 33.84Solution: Widen to 4/5 lanes
539 5.5 to 10.53 Hemmi Road to Birch Bay-Lynden Road 2.13 to 2.88Solution: Purchase of access rights
539 6.13 to 15.16 Ten Mile to Intl. Boundary 24.27 to 32.83Solution: Widen to 5 lanes, access management, & Park n Ride lot at Main St.
546 0 to 8.02 Beginning of Route Nooksack Road 3.38 to 4.58Solution: Purchase of access rights
546 0 to 1.5 SR 539 to Depot Road 4.49 to 6.07Solution: Widen to 4 Lanes
546 1.5 to 7 Depot Road to Van Buren Road 20.88 to 28.26Solution: Widen to 4 Lanes
546 7 to 8.02 Van Buren Road to SR 9 4.89 to 6.61Solution: Widen to 4 Lanes, access management
548 0 to 12.98 I-5 to 4th Street 39.98 to 54.08Solution: Widen to 4 Lanes

Appendix K – 10 Washington State Highway System Plan: 2003-2022 February 2002
Appendix K: 20-Year I1 Mobility Strategies
Northwest Region (continued)
Highway Estimate Cost RangeNumber Milepost Vicinity Description ($ in Millions)
"Congested" non-HSS9 0 to 1.82 SR 522 to 212 St. Southeast (SR 524) 2.64 to 3.57Solution: [Rebuild SR 522 interchange.] Widen to 5 lanes.
9 1.82 to 4.03 212th St. Southeast (SR 524) to 176th St. Southeast 14.31 to 19.35Solution: Widen from 2 lanes to 4/5 lanes.
9 4.03 to 8.42 176th St. Southeast to Marsh St. 27.73 to 37.51Solution: Widen to 4 lanes. Access management.
9 7 to 17.49 SR 96 to SR 92 1.77 to 2.39Solution: Lake Stevens Sub-area Study
9 8.42 to 12.14 Marsh Road to US 2 38.96 to 52.72Solution: Widen to 4 lanes. Access management.
9 12 to 18 Lake Stevens vicinity 3.71 to 5.01Solution: Construct 350 stall park and ride lot.
9 12.14 to 17.49 US 2 to SR 92 31.79 to 43.01Solution: Widen to 4/5 lanes and improve US 2/SR 9 interchange.
9 15.42 to 15.99 SR 9/SR 204 Intersection 21.32 to 28.84Solution: Construct new interchange between SR 9 and SR 204 at Frontier Village.
9 17.49 to 19.26 SR 92 to SR 528 10.52 to 14.24Solution: Widen to 4 lanes w/ restricted median.
9 19.26 to 26.05 SR 528 to SR 531 34.84 to 47.14Solution: Widen to 4 lanes with restricted median to Arlington. Study with city the proper treatment of SR 9 w/i Arlington's city limits.
9 26.05 to 29.46 SR 531 to SR 530 25.89 to 35.03Solution: Study with city the proper treatment of SR 9 w/i Arlington’s city limits. Estimate based on 5-lane roadway section.
9 29.46 to 29.79 SR 530 to City of Arlington North of City Limits 4.69 to 6.35Solution: Widen to 4 lanes with Two-way left turn lane (Arlington).
9 29.79 to 32.88 City of Arlington North of City Limits to SR 532 14.52 to 19.64Solution: Widen to 4 lanes with restricted median. Access management.
9 47.47 to 49.8 W Big Lake Blvd. to SR 538 11.99 to 16.23Solution: Widen to 4 Lanes
9 49.8 to 54.02 SR 538 to South Skagit Highway 21.97 to 29.73Solution: Widen to 4 Lanes
9 54.02 to 55.45 South Skagit Highway to Sedro-Woolley 27.74 to 37.54Solution: Widen to 4 Lanes
9 58.4 to 66.88 Sedro-Woolley to Whatcom County Line 32.17 to 43.53Solution: Widen to 4 Lanes
9 66.88 to 90.27 Skagit County Line to Nooksack 115.66 to 156.48Solution: Widen to 4 Lanes
9 90.3 to 91.35 City of Nooksack 5.60 to 7.58Solution: Needs Further Study - Widen to 4 lanes
9 91.35 to 93.61 Nooksack to SR 546 7.64 to 10.34Solution: Widen to 4 lanes
9 93.61 to 96.6 SR 546 to Barbo Road 14.43 to 19.53Solution: Widen to 4 Lanes by adding 2 lanes to the proposed "all-weather" alignment
9 96.6 to 98.17 Widen existing SR 9 through Sumas 13.99 to 18.93Solution: Widen to 4 lanes (City of Sumas)
92 0 to 4.25 SR 9 to 147th Ave. Northeast 15.69 to 21.23Solution: Widen to 4 lanes. Access management.
92 4.25 to 8.26 147th Ave. Northeast to Cascade Ave. 17.36 to 23.48Solution: Widen to 4 lanes. Access management.
92 6.73 to 8.26 City of Granite Falls vicinity 0.43 to 0.58Solution: In partnership with the City of Granite Falls, study possible SR 92 bypass of the city,
96 0 to 3.28 I-5 to Seattle Hill Road 2.98 to 4.03Solution: Transit enhancements from Milepost 0.00 - 3.28 (132nd Ave. Southeast)
96 3.28 to 6.75 Seattle Hill Road to SR 9 21.96 to 29.72Solution: New extension for 132nd Ave. Southeast to SR 9 (Milepost 3.28 - 6.75). Estimate represents projected cost to the State only.
99 8.65 to 12.15 South 340th St. to 284th St. 0.00 to 0.00Solution: City of Federal Way lead. Widen to 6/7 lanes with HOV. Access management.

Washington State Highway System Plan: 2003-2022 Appendix K – 11February 2002
Appendix K: 20-Year I1 Mobility Strategies
Northwest Region (continued)
Highway Estimate Cost RangeNumber Milepost Vicinity Description ($ in Millions)
"Congested" non-HSS (continued)99 12.15 to 12.92 South 284th St. to 272nd St. 7.16 to 9.68Solution: Widen to 6/7 lanes with HOV. Accommodations for bicycles and pedestrians. Access management.
99 12.92 to 15.49 South 272nd St. to SR 516 0.00 to 0.00Solution: City of Kent lead. Widen to 6/7 lanes with HOV. Accommodations for bicycles and pedestrians. Access management.
99 15.49 to 16.51 SR 516 to South 216th St. 0.00 to 0.00Solution: City of Des Moines lead. Widen to 6/7 lanes with HOV. Accommodations for bicycles. Access management.
99 16.51 to 20.3 South 216th Street to SR 518 0.00 to 0.00Solution: City of SeaTac lead. Provide Southbound HOV Lane. Landscaped median w/ Two-way left turn lane in places. Accommodations for bicycles and pedestrian.
99 46.65 to 47.05 SR 104/North. 205th St. to SR 525 18.28 to 24.74Solution: Needs Further Study - Grade separation at SR 524. Estimate based on construction of an urban interchange.
99 50.85 to 53.27 SR 525 to Evergreen Way (Everett - South of City Limits) 19.52 to 26.42Solution: Widen to 6/7 lanes for HOV. Access management. Signal coordination. Regional Bus Service.
164 2.33 to 6.06 Dogwood Street Southeast to 380th Place 22.13 to 29.93Solution: Widen to 4 lanes. Access management.
164 6.06 to 14.52 Southeast 380th Street to SR 169 38.85 to 52.57Solution: Widen to 4 lanes. Access management.
169 0 to 25.26 SR 410 to I-405 0.87 to 1.17Solution: Corridor Study
169 0.85 to 2.67 Enumclaw North of City Limits to Southeast 400th Street 7.51 to 10.17Solution: Widen to 4/5 lanes. Access management.
169 2.67 to 6.75 Southeast 400th Street to Black Diamond South of City Limits 21.17 to 28.64Solution: Widen to 4 lanes w/ restricted median. Realignment of SR 169 between Milepost 4.1 and Milepost 5.5 due to Kummer Drift slide area. Study cost included in estimate.
169 6.75 to 9.02 City of Black Diamond 7.96 to 10.76Solution: Widen to 4/5 lanes within city of Black Diamond
169 9.02 to 11.44 Black Diamond North of City Limits to SR 516 11.19 to 15.13Solution: Widen to 4/5 lanes - Black Diamond to SR 516
169 11.44 to 19.22 SR 516 to Southeast Jones Road 36.35 to 49.17Solution: Widen to 4 lanes. Utilize restricted median from Milepost 15.22 ahead. Access management
169 22.96 to 25.26 140th Way Southeast to I-405 17.75 to 24.01Solution: Needs Further Study - Widen to 6 for HOV lanes from 140th PL Southeast to I-405. Transit queue jump at Northbound I-405 ramp, Access management.
181 5.32 to 8.71 SR 516 to South 196th St. 23.38 to 31.64Solution: Needs Further Study - Study with Kent, 6 lane arterial with HOV lanes. Commuter rail per Regional Transit Plan.
181 8.71 to 11.37 South 196th St. to I-405 18.37 to 24.85Solution: Needs Further Study - Study with Kent and Tukwila, 6 lane arterial with HOV lanes? Commuter rail per Regional Transit Plan.
202 0 to 6.65 SR 522 to Northeast 85th Street 2.64 to 3.58Solution: Corridor Study with Woodinville, Redmond, and King County including SR 522/SR 202 connection.
202 0 to 0.55 Woodinville-Redmond to 148th Ave. Northeast 70.15 to 94.91Solution: Needs Further Study - Study with the city of Woodinville - Construct two new ramp connections with Northbound I-405 at the I-405/SR 522 Interchange. Construct a new alignment to SR 202 at Woodinville-Redmond Road. Construct a new connection over SR 522 to Northeast 180th Pl.
202 0.55 to 2.67 Woodinville-Redmond to Northeast 145th/148th St 13.23 to 17.89Solution: Needs Further Study - Study with Woodinville - Widen to 4/5 lanes with bike/pedestrian path or possible state route re-designation.
202 2.67 to 4.77 Northeast 145th St/148th Ave. Northeast to Northeast 116th St 15.31 to 20.71Solution: Needs Further Study - Develop parallel arterial for state route re-designation or widen existing to 4 lanes with restricted median. Estimate based on widening existing highway.
202 4.77 to 6.97 Northeast 116th St. to Redmond Way 19.32 to 26.14Solution: Needs Further Study - Develop parallel arterial for state route re-designation or widen existing to 5 lanes with two way left turn lane. Estimate based on widening existing highway.
202 6.97 to 10.53 Redmond Way to Sahalee Way 22.29 to 30.15Solution: Roadway section is 5 lanes between Milepost 6.97 and Milepost 8.31. Widen remaining portion to 5 lanes.
202 10.53 to 15.6 Evans Creek to Tolt Hill Road 28.70 to 38.84Solution: Widen to 4/5 lanes. Aggressive access management.
202 15.6 to 20.64 Tolt Hill Road to 324th Ave. Southeast 25.20 to 34.10Solution: Widen to 4/5 lanes. Access management.
202 20.64 to 25.42 324th Ave. Southeast to Snoqualmie Parkway 31.07 to 42.03Solution: Widen to 4 lanes w/ restricted median to intersection of new connection from I 90/SR 18 Interchange (Snoqualmie Ridge Parkway).
202 25.42 to 28.93 Snoqualmie North of City Limits to North Bend North of City Limits 12.91 to 17.47Solution: Provide Two-way left turn lane within the city of Snoqualmie per the city's Comp. Plan.
203 0 to 5.23 SR 202 to Carnation South of City Limits 24.66 to 33.36Solution: Needs Further Study - Study w/ King County - Widen to 4 lanes w/ Intersection nouth improvements. Access management.

Appendix K – 12 Washington State Highway System Plan: 2003-2022 February 2002
Appendix K: 20-Year I1 Mobility Strategies
Northwest Region (continued)
Highway Estimate Cost RangeNumber Milepost Vicinity Description ($ in Millions)
"Congested" non-HSS (continued)203 5.23 to 6.25 Carnation South of City Limits to Carnation North of City Limits 11.65 to 15.77Solution: Needs Further Study - Study w/ King County - Widen to 5 lanes w/ Intersection nouth improvements. Access management.
203 6.25 to 9.85 City of Carnation North of City Limits to 296th Ave. Northeast 20.98 to 28.38Solution: Needs Further Study - Study w/ King County - Widen to 4 lanes w/ restricted median. Access management.
203 9.85 to 14.27 296th Ave. Northeast to City of Duvall South of City Limits 21.92 to 29.66Solution: Needs Further Study - Study w/ King County - Widen to 4 lanes w/ restricted median and Intersection nouth improvements. Access management.
203 14.27 to 15.11 Within City of Duvall 7.24 to 9.80Solution: Needs Further Study - Two-way left turn lane and Intersection South improvements. Aggressive access management.
203 15.11 to 17.99 City of Duvall North of City Limits to King/Snohomish County Line 21.17 to 28.65Solution: Needs Further Study - widen to 4 lanes w/ restricted median. Access management.
203 17.99 to 23.32 King/Snohomish County Line to Monroe South of City Limits 34.09 to 46.13Solution: Needs Further Study - widen to 4 lanes w/ restricted median. Access management.
203 23.32 to 24.17 Monroe South of City Limits to US 2 5.23 to 7.07Solution: Needs Further Study - Study w/ city of Monroe. Widen to 4 lanes with sidewalks, planter strips, and bike lanes. Maintain existing landscaped median.
204 0 to 2.35 US 2 to SR 9 6.84 to 9.26Solution: Westbound peak period HOV lane. Transit enhancements.
410 21.99 to 24.14 Pierce/King County Line to Cole St. 18.86 to 25.52Solution: Needs Further Study - Widen to 4 lanes. Access management. Signal Coordination and route continuity strategy.
509 11.24 to 14.29 21st. Ave. Southwest Wye to SR 99 7.76 to 10.50Solution: Add a center turn lane from 1st Ave. South to SR 99. Parallel arterial needed by County or City.
515 5.29 to 7.82 Southeast 180th St. to Southeast Carr Road (Petrovisky) 0.00 to 0.00Solution: No action. Currently SR 515 is a 5-lane roadway. Propose that the City of Renton develop parallel arterial.
516 1.72 to 2.25 SR 509 to I-5 25.66 to 34.72Solution: Modify the I-5/SR 516 Interchange.
516 12.12 to 16.22 Southeast Wax Road to SR 169 20.66 to 27.96Solution: Widen to 4/5 lanes. Access management.
520 11.4 to 12.83 W. Lake Sammamish Pkwy. to Avondale Road 51.00 to 69.00Solution: HOV lanes, Traffic Systems Management. Complete SR 202 interchange with Westbound SR 202 to Westbound SR 520 fly-over ramp and 4-lane freeway to Avondale Road.
523 0 to 2.45 Northeast 145th St. from SR 99 to 32nd Ave. Northeast 2.88 to 3.90Solution: Transit enhancements (Queue bypass), widen 145th St. under-crossing to provide additional left turn lane to Southbound I-5.
524 4.64 to 5.37 SR 524 (44th Ave. W - Cedar Way) to I-5 0.00 to 0.00Solution: Interchange Improvements at I-5 and 196th St. Southwest (Costs included in I-5 estimate).
524 5.29 to 9.5 I-5 to SR 527 45.41 to 61.43Solution: Widen to 4/5 lanes - TIB Project in partnership with Lynwood.
524 9.5 to 14.56 SR 527 to SR 522 26.31 to 35.59Solution: Needs Further Study - widen to 4/5 lanes?
527 0 to 1.3 SR 522 to King/Snohomish County Line 8.58 to 11.60Solution: Needs Further Study - widen to 4/5 lanes (or develop parallel arterial by Bothell/King County - 80th Ave. Northeast and 228th Southwest Intersection South).
527 1.3 to 2.27 King/Snohomish County Line to 228th St. Southeast 5.55 to 7.51Solution: Widen the remaining portion to 4/5 lanes.
527 6.72 to 8.85 164th Street Southeast to 132nd Street Southeast 16.75 to 22.66Solution: Widen to 5 lanes
527 8.85 to 10.32 132nd Street Southeast to 112th Street Southeast 12.56 to 17.00Solution: Widen to 5 lanes
527 10.32 to 11.92 112th Street Southeast. to I-5 1.21 to 1.63Solution: Dual left turn lanes at I-5 Northbound ramp.
528 3.07 to 3.46 83rd Ave. Northeast to SR 9 2.75 to 3.71Solution: Widen to 4 lanes. Access management.
529 5.59 to 5.83 Between Steamboat Slough and Ebby Slough 21.24 to 28.74Solution: Construct ramp connection to access Tulalip Indian Reservation per agreement with Tribe
529 5.79 to 6.69 I-5 to SR 528 22.57 to 30.53Solution: Widen two-lane section to four lanes with shoulder deviations under I-5 bridges. Signal coordination at State St.
530 17 to 20.79 I-5 to SR 9 (Arlington West of City Limits) 12.06 to 16.32Solution: Widen to 4 lanes w/ restricted median. Access management.
530 20.79 to 22.24 SR 9 (Arlington West of City Limits) to Jordon Road 8.14 to 11.02Solution: Widen to 4 lanes. Access management.

Washington State Highway System Plan: 2003-2022 Appendix K – 13February 2002
Appendix K: 20-Year I1 Mobility Strategies
Northwest Region (continued)
Highway Estimate Cost RangeNumber Milepost Vicinity Description ($ in Millions)
"Congested" non-HSS (continued)530 22.24 to 31.71 Jordan Road to Ramstad 42.73 to 57.81Solution: Widen to 4 lanes. Restricted median from Milepost 25.86 ahead. Access management
530 31.71 to 43.74 Ramstad Road to Swede Heaven Road 58.86 to 79.64Solution: Widen to 4 lanes w/ restricted median. Access management.
530 43.74 to 52.75 Swede Heaven Road to Skagit. /Skagit County Line 40.37 to 54.61Solution: Widen to 4 lanes w/ restricted median to Darrington, 5 lane widening beyond. Access management.
531 1.44 to 4.07 Lake Goodwin Road to Forty Five Road 13.27 to 17.95Solution: Widen to 4 lanes. Access management
531 4.07 to 6.16 Forty Five Road to 27th Ave. Northeast 11.78 to 15.94Solution: Widen to 5 lanes from Forty Five Road to I-5. Realign intersection with Forty Five Road.
531 6.5 to 9.88 I-5 to SR 9 8.71 to 11.79Solution: Widen to 5 lanes Milepost 7.00 to 8.59 (I-5 Interchange area covered under I-5 estimate).
532 2.91 to 6.45 Island/Snohomish County line to 64th Ave. Northwest 31.20 to 42.22Solution: Widen to 4 lanes.
532 6.45 to 10.09 64th Ave. Northwest to SR 5 11.20 to 15.16Solution: Widen to 4 lanes. Access management.
542 2.96 to 6.42 Britton Road to Squalicum Lake Road 19.64 to 26.58Solution: Widen to 4 lanes
542 6.42 to 9.96 Squalicum lake Road to SR 9 Wye 19.24 to 26.02Solution: Widen to 4 Lanes
542 9.96 to 14.08 SR 9 to Marshall Hill Road 14.21 to 19.23Solution: Widen to 4 Lanes
542 14.08 to 17.26 Marshall Hill Road to James Hill Road 14.22 to 19.24Solution: Widen to 4 Lanes
542 17.26 to 21.93 James Road to Kendall Creek 17.74 to 24.00Solution: Widen to 4 Lanes
544 0 to 4.65 SR 539 to Mecklem Road 17.16 to 23.22Solution: Widen to 4 Lanes
544 4.65 to 7.24 Mecklem Road to Kale Street 9.92 to 13.42Solution: Widen to 4 Lanes
544 7.24 to 9.01 Kale Street to SR 9 (Everson & Nooksack) 12.51 to 16.93Solution: Widen to 4 Lanes
900 7.71 to 9.9 South 129th St. Wye to South 135th St. 1.07 to 1.45Solution: Transit signal priority (Queue bypass).
900 12.5 to 14.31 I-405 to Duval Ave. 1.93 to 2.61Solution: Transit signal priority (Queue bypass) at I-405 ramps, Sunset Blvd., Edmonds St., Harrington St., Northeast 10th St., Northeast 12th St., Union Ave., and Duval Ave.
900 14.31 to 14.31 Duvall Ave. intersection 1.02 to 1.38Solution: Eastbound HOV left turn lane and southbound right turn lanes.
900 14.47 to 20.83 Field Ave. Northwest to Issaquah West of City Limits 37.09 to 50.19Solution: Widen to 4 lanes w/ restricted median in rural segment (Milepost 14.73 - Milepost 20.80). Access management.
900 19.64 to 21.54 Issaquah West of City Limits to I-90 13.35 to 18.07Solution: Widen to 4 lanes with two way left turn lane. Improvements to the I-90/SR 900 Interchange.
908 3.52 to 6.66 I-405 to SR 202 33.06 to 44.72Solution: Needs Further Study - Transit/HOV enhancements (Queue bypass), Eastbound & Westbound HOV lanes, bicycle access (to Milepost 5.86).
Access Management for Developed Corridors99 32.65 to 35.7 Denny Way to North 50th St. 0.43 to 0.58Solution: Needs Further Study - Study with City of Seattle for outside lane conversion to HOV and additional transit improvements. Access management.
99 35.7 to 38.53 North 50th St. to North 105th St. 0.43 to 0.58Solution: Needs Further Study - Study with City of Seattle for outside lane conversion to HOV and additional transit improvements. Access management. Signal coordination.
99 53.21 to 55.41 Evergreen Way (Everett - South of City Limits) to I-5 Interchange 4.76 to 6.44Solution: Currently 7-lane section. Access management. Signal coordination.
164 0.31 to 0.91 SR 18 to 12th Street Southeast 1.98 to 2.68Solution: Currently a 5-lane section. Access management.
169 19.69 to 22.96 Southeast Jones Road to 140th Way Southeast 8.05 to 10.89Solution: Currently a 5-lane section. Access management.

Appendix K – 14 Washington State Highway System Plan: 2003-2022 February 2002
Appendix K: 20-Year I1 Mobility Strategies
Northwest Region (continued)
Highway Estimate Cost RangeNumber Milepost Vicinity Description ($ in Millions)
Access Management for Developed Corridors (continued515 0 to 5.29 Southeast 235th Street to Southeast 196th Street 10.05 to 13.59Solution: Currently SR 515 is a 5-lane roadway, access management.
516 2 to 10.61 I-5 to Southeast Wax Road 3.28 to 4.44Solution: Access management and traffic signal coordination.
524 3.36 to 5.29 64th Ave. W to I-5 0.50 to 0.68Solution: Access management.
525 11.1 to 11.1 Langley/Cultus Bay Road 0.03 to 0.03Solution: Access revisions in Northeast Quadrant
Access Management for Non-Developed Corridors2 16.12 to 21.42 East Monroe to Sultan 2.51 to 3.39Solution: Purchase of access rights
2 21.42 to 24.44 Through Sultan 2.62 to 3.54Solution: Purchase of access rights
2 24.44 to 26.33 East Sultan to Startup 0.81 to 1.09Solution: Purchase of access rights
2 26.33 to 28.72 Startup to Goldbar 2.07 to 2.79Solution: Purchase of access rights
2 28.72 to 56.76 Goldbar to Northwest Region boundary 12.23 to 16.55Solution: Purchase of access rights
9 0 to 4 SR 522 to 176th St. Southeast 1.73 to 2.33Solution: Purchase of access rights
9 4 to 6 176th Street Southeast to 148th Street Southeast 1.73 to 2.33Solution: Purchase of access rights
9 6 to 7.4 148th Street Southeast to north of SR 96 0.60 to 0.81Solution: Purchase of access rights
20 27.42 to 27.61 Bridle Trail Lane to Sidney Street 0.08 to 0.10Solution: Purchase Access Rights
539 11.6 to 15.16 Lynden City Limit to International Border 1.50 to 2.04Solution: Purchase of access rights
Bicycle/Pedestrian Corridors538 1.77 to 1.77 North. 30th St. to east city limit 0.76 to 1.02Solution: Needs Further Study - Bicycle route on SR 538 from North. 30th St. to east city limit.
539 0 to 0 Stewart St. to Kellogg Road SR 539 0.97 to 1.31Solution: Needs Further Study - Bicycle and pedestrian improvements.
Multi-Modal Facilities104 24.5 to 25.13 Proposed ferry terminal to Pine St. 6.41 to 8.67Solution: Needs Further Study - New connection from existing SR 104 alignment to proposed multimodal terminal location.
525 6.56 to 8.47 SR 526 to Proposed Mukilteo Multimodal Terminal 42.66 to 57.72Solution: Needs Further Study - Connect to proposed ferry terminal location with three lanes, ferry traffic holding lane, and Class I Pedestrian. /Bicycle facility. Add interchange at SR 526. Estimate based on Japanese Gulch alignment.
Puget Sound Core HOV Lanes5 139.5 to 154.53 Pierce/King County Line to I-405 111.18 to 150.42Solution: Core HOV - Construct Core HOV lanes, truck climbing lane and SC&DI from Pierce County line to Tukwila.
5 154.42 to 154.42 I-5/I-405/SR 518 Interchange 31.27 to 42.31Solution: Core HOV - Construct Freeway to Freeway Core HOV lane connection at SR5/SR405/SR518 interchange - Northwest quadrant (Southbound to Westbound).
5 167.12 to 168.06 Mercer St. Interchange to SR 520 Interchange 0.00 to 0.00Solution: Core HOV - Construct Freeway to Freeway Core HOV lane connection at SR5/SR520 - Reversible ramp (Cost included in SR 520 Trans-Lake estimate.)
5 178.05 to 183.9 236th St. Southwest to 164th St. Southwest 18.21 to 24.63Solution: Core HOV - Construct Core HOV Lanes from 236th St. Southwest to 164th St. Southwest interchange.
5 183.9 to 189.3 164th St. to SR 526 0.17 to 0.23Solution: Core HOV - Construct Core HOV lanes, Interchange modifications.
5 189.3 to 193.65 SR 526 to US 2 69.98 to 94.68Solution: Core HOV - Construct Core HOV lanes from SR526 to SR2, interchange improvements, auxiliary lanes between 41st St. & US 2, and Traffic Systems Management. Park & Ride lots by other agencies.

Washington State Highway System Plan: 2003-2022 Appendix K – 15February 2002
Appendix K: 20-Year I1 Mobility Strategies
Northwest Region (continued)
Highway Estimate Cost RangeNumber Milepost Vicinity Description ($ in Millions)
Puget Sound Core HOV Lanes (continued)90 9.93 to 9.93 I-90/I-405 Interchange area toSolution: Core HOV - Construct Freeway to Freeway Core HOV lane connection at SR90/SR405 interchange - Southwest Quadrant (Costs included in the I-405 Project estimate.)
90 9.93 to 9.93 I-90/I-405 Interchange area toSolution: Core HOV - Construct Freeway to Freeway Core HOV lane connection at SR90/SR405 interchange - Northwest quadrant (Costs included in the I-405 Project estimate.).
90 9.93 to 9.93 I-90/I-405 Interchange area toSolution: Core HOV - Construct Freeway to Freeway Core HOV lane connection at SR90/SR405 interchange - Northeast quadrant (Costs included in the I-405 Project estimate).
167 13.73 to 26.48 15th St. Northwest to South Grady Way - HOV 3.40 to 4.60Solution: CORE HOV - Roadside restoration for HOV lanes
167 13.73 to 16.2 SR 18 to 15th St. Northwest 26.42 to 35.74Solution: Core HOV - Widen roadway for HOV lanes and SC&DI from 15th southwest to 15th northwest stage 3
405 0 to 11.09 Tukwila to Factoria 18.75 to 25.37Solution: Core HOV - Part of Tukwila to Factoria Stage II ("Smart Project"). Construct HOV bypasses and ramp metering.
405 23.53 to 30.32 Bothell to Swamp Creek Interchange 0.45 to 0.61Solution: Core HOV - Construct Core HOV lanes from Bothell to Swamp Creek (between SR 522/I-5)
520 4 to 6.3 Evergreen Point Bridge to 108th Ave. Northeast 0.00 to 0.00Solution: Core HOV - Upgrade existing westbound lanes, and construct new eastbound lanes from Evergreen Point Bridge to 108th Ave. Northeast (Costs included in SR 520 Trans-Lake estimate).
520 6.3 to 11.4 108th Ave Northeast to W. Lake Sammamish Pkwy. 0.26 to 0.35Solution: Core HOV - Construct Core HOV Lanes from 108th Ave. Northeast to West Lake Sammamish Parkway.
525 0 to 1.4 I-5 to 164th St. Southwest 0.69 to 0.93Solution: Core HOV - Complete 4-lane freeway with HOV flyer stop at 164th St.
Urban Bicycle5 144 to 144 South 320th St. vicinity 1.46 to 1.9Solution: Needs Further Study - I-5 under-crossing improvement at Park and Ride lot to connect Federal Way trail that has not been built in this area yet.
5 150.33 to 150.33 South 216th St. under-crossing 1.32 to 1.78Solution: Widen I-5 under-crossing to provide a Class II (Bike Lanes) bicycle facility improvements at South 216th and I-5. Future bridge Replacement?
5 151.04 to 151.04 Military Road under-crossing 3.15 to 4.27Solution: Widen I-5 under-crossing to provide Class II (Bike Lanes) bicycle accommodation at I-5 and Military Road. Provide bike lane or shoulder on structure.
5 173.2 to 173.2 Northeast 117th St. vicinity 0.23 to 0.31Solution: Connector path to I-5 overpass at Northeast 116th St.
5 181 to 181 SR 524 Spur (44th Avenue West) 2.44 to 3.30Solution: Bicycle and pedestrian over-crossing of SR 524 spur at I-5 to connect sections of the Interurban Trail.
20 12.19 to 12.51 Water Street in Port Townsend 0.35 to 0.47Solution: Widen shoulder to 5' minimum (bicycle touring route and nearby schools)
90 11.03 to 11.03 142nd Ave. Southeast under-crossing 0.01 to 0.01Solution: Bike lanes and route signs on the I-90 under-crossing (142nd Ave. Southeast).
99 33.4 to 33.4 Galer St. - Seattle Center 1.45 to 1.97Solution: Construct bike/pedestrian over-crossing of SR 99
99 40.47 to 40.96 North. 155th St. vicinity 1.50 to 2.02Solution: Needs Further Study - Provide bicycle access across SR 99 in the vicinity North 155th St. as part of Interurban Trail.
99 54.89 to 54.89 West Mall Drive 0.02 to 0.02Solution: Adjust signal timing for West Mall Dr. to provide sufficient intervals for safe bicycle and pedestrian crossing of SR 99. Replace 4' traffic island with traffic curb on south leg and re-stripe for a Class II Bikeway (Bike Lanes).
167 20.2 to 20.2 James St. Over-crossing 0.02 to 0.02Solution: Widen lanes 2' for a Class III (Bike Route) at the James St. over-crossing.
167 22.4 to 22.4 South 212th St. Over-crossing 1.07 to 1.45Solution: Widen lanes 2' for a Class III Bikeway (Bike Route) at the South 212th St. over-crossing with SR 167.
169 11.44 to 11.44 SR 516 (Kent-Kangley Road) intersection 0.01 to 0.01Solution: Intersection improvements for Class III Bikeway on SR 169, move curb radius point (Northeast quad.), add sidewalk. (Northeast quad.), narrow lanes and re- stripe for bicycle lane (Northeast, Northwest, Southeast, Southwest quads.).
169 11.44 to 15.28 SR 516 (Kent-Kangley Road) to Southeast 214th St 0.27 to 0.37Solution: Add bike lane/shoulders.
169 15.28 to 19.22 Southeast 214th St. vicinity to Southeast Jones Road 0.20 to 0.28Solution: Develop access points with parking between SR 169 and Cedar River Trail that runs parallel to SR 169.
405 14.12 to 14.12 12th St. Northeast Under-crossing 1.26 to 1.70Solution: Class II bicycle improvements on the 12th St. Northeast under-crossing. Widen the bridge 4' each side and replace the sidewalks.
405 14.95 to 14.95 Northup Way 0.13 to 0.17Solution: Class II bicycle improvements on Northup Way at the I 405 over-crossing. Moving guardrail on the north side and widening the roadway 4' each direction.

Appendix K – 16 Washington State Highway System Plan: 2003-2022 February 2002
Appendix K: 20-Year I1 Mobility Strategies
Northwest Region (continued)
Highway Estimate Cost RangeNumber Milepost Vicinity Description ($ in Millions)
Urban Bicycle (continued)509 23.07 to 24.45 South Normandy Road to Des Moines Way 0.31 to 0.43Solution: Needs Further Study - Add bike lanes or shoulder space for bicyclist vicinity of South Normandy Road to Des Moines Way.
516 2.25 to 2.25 Military Road intersection 0.01 to 0.01Solution: Add signing and stripe for a bicycle-holding lane on Military Road Remove a portion of existing traffic islands and replace traffic curb.
516 4.52 to 4.52 SR 181 Intersection 0.01 to 0.01Solution: Provide adequate shoulder for bicycle safety on SR 516 crossing SR 18 consistent with a Class IV Bike Route.
516 4.53 to 5.3 SR 181 to Central Ave. South 0.01 to 0.01Solution: Improve shoulders, add signing, and striping to accommodate bicyclists along SR 516 consistent with a Class IV Bikeway.
516 4.77 to 4.77 74th Ave. South Intersection 0.29 to 0.39Solution: Provide signal (warrant met, 1997) and crosswalk at 74th Ave. South for bicyclists and pedestrians on the Interurban Trail.
516 5.68 to 7.4 Smith St. to Southeast 256th St. 1.30 to 1.76Solution: Widen Eastbound roadway. Near 94th Ave. South (Approx. 1000') and between South 252nd St. and 97th Pl. South (approx. 1000'). Narrow lanes Eastbound and Westbound from 100th Pl. South to
516 7.4 to 7.4 Southeast 256th St. Intersection 0.01 to 0.01Solution: Re-stripe lanes to provide wider outside lanes for a Class III Bikeway (Bike Route).
524 3.11 to 3.11 68th Ave. W. Intersection 0.01 to 0.01Solution: Bicycle crossing improvements at the 68th Ave. W. intersection.
524 4.13 to 4.13 52nd Ave. Southeast Intersection 0.05 to 0.07Solution: Bicycle crossing improvements at the 52nd Ave. Southeast intersection for Scribner Creek Trail.
530 20.89 to 20.89 Just east of SR 9/SR 530 Intersection 0.01 to 0.01Solution: Centennial Trail crossing of SR 530 on abandon R/R tracks. Provide crosswalk and signing.
538 1.77 to 1.77 North. 30th St. to East city Limit 1.16 to 1.56Solution: Needs Further Study - Signalization to facilitate trail crossing.

Washington State Highway System Plan: 2003-2022 Appendix K - 17February 2002
Appendix K: 20-Year I1 Mobility Strategies
North Central Region
Highway Estimate Cost RangeNumber Milepost Vicinity Description ($ in Millions)
"Congested" HSS2 70.89 to 72.68 East of Upper Mill Creek Road to Nason Road 17.75 to 24.01Solution: Truck climbing lanes
2 85.39 to 99.05 Begin truck climbing lane to Icicle River 4.43 to 5.99Solution: Phased Minor Improvements -- Widening, Realignment Etc.
2 99.05 to 100.53 Icicle River Road to East Leavenworth Road to Solution: Needs Further Study-TDM's: Parking, etc
2 100.53 to 104.52 East Leavenworth Road to US 2/US 97 Interchange 1.77 to 2.39Solution: Phased Improvements -- Channelization ETC
2 104.37 to 105.07 US 2/US 97 interchange 8.87 to 11.99Solution: Construct Interchange
2 111.09 to 111.99 Applets Way to Cotlets Way 26.63 to 36.03Solution: Interchanges at each end of section
2 119.12 to 119.61 Easy Street to US 2 on Ramp 4.44 to 6.00Solution: Easy Street over-crossing
2 127.83 to 132.52 US 2/SR 28 Junction to Lincoln Rock State Park 35.51 to 48.05Solution: Interchange at Empire & By-pass/parallel/4-lane solution
2 132.52 to 139.85 Lincoln Rock State Park to US 2/US 97 Junction 17.77 to 24.04Solution: Phased Solutions: Phase 1: Passing Lanes
2 132.52 to 139.85 Lincoln Rock State Park to US 2/US 97 Junction 26.63 to 36.03Solution: Phased Solution: : Phase 2: Widen to 4 lanes.
17 48.64 to 50.97 County Road M Southeast to Kittleson 5.33 to 7.21Solution: 4 lanes
17 50.97 to 51.93 Kittelson to Pioneer 5.33 to 7.21Solution: 6 Lanes
17 51.73 to 55.03 Pioneer to Stratford 12.44 to 16.82Solution: 4 Lanes
17 55.08 to 55.86 Stratford Vicinity to North. of Grape Drive 13.31 to 18.01Solution: Interchange at Grape Drive
26 0 to 1.02 I-90 to Junction 243 3.54 to 4.80Solution: Phased Solution: : Climbing/Passing Lane-4 Lanes
26 39.58 to 40.69 Taylor to on/off ramp SR 24 3.55 to 4.81Solution: Needs Further Study-Median barrier at Junction SR 24 and Intersection South Channelization
28 0 to 3.28 Junction US 2 to Main Street 57.72 to 78.09Solution: 5 Lane or Columbia arterial (To Consultant Now)
28 0.31 to 12.38 Grant Road to Rock Island Vicinity 114.57 to 155.01Solution: 4 lane
28 3.8 to 0.46 9th Street to Grant Road Vicinity 26.63 to 36.03Solution: 4 Lane or Columbia Avenue Arterial & Interchange
28 12.38 to 22.94 Rock Island vicinity To Crescent Bar 77.69 to 105.11Solution: 4 Lane
28 22.94 to 27 Crescent Bar Vicinity to West of Quincy 24.40 to 33.02Solution: 4 Lane
28 27 to 32 SR 28 to SR 281 80.81 to 109.33Solution: 4 Lane
97 159.45 to 161.71 Hurley Creek Vicinity to Northbound Climbing Lane 3.54 to 4.80Solution: Construct Climbing/Passing Lane
97 171.92 to 175.63 Bonanza Campground to End truck climbing 5.32 to 7.20Solution: Construct Climbing/Passing Lane
97 176.62 to 178 End truck climbing lane to Ingalls Creek 2.21 to 2.99Solution: Construct Climbing/Passing Lane
97 215.42 to 219.19 Orondo River Park to Daroga State Park 13.32 to 18.02Solution: Passing Lane(s)
97 240.15 to 246.97 US 97 A to Chelan County Line 14.20 to 19.21Solution: Climbing/Passing lanes
97 253.38 to 253.67 South of Methow River Bridge to Pateros 4.43 to 5.99Solution: Widen/Replace Bridge

Appendix K – 18 Washington State Highway System Plan: 2003-2022 February 2002
Appendix K: 20-Year I1 Mobility Strategies
North Central Region (continued)
Highway Estimate Cost RangeNumber Milepost Vicinity Description ($ in Millions)
"Congested" HSS (continued)97 260.1 to 260.45 7th Street to SR 173 to Solution: No solution, possibly purchase access control, Needs Further Study
97 260.45 to 260.85 SR 173 to Old Hwy 97 3.54 to 4.80Solution: Replace Railroad Bridge to provide wider shoulders
97 330.38 to 331.19 East Oroville Road to 5th Avenue 2.22 to 3.00Solution: Widen roadway to 12-foot lanes and 8-foot shoulders
97 331.19 to 331.72 5th Avenue to 23rd Avenue 3.54 to 4.80Solution: Add additional lanes
281 0 to 8 SR 28 to I-90 85.68 to 115.92Solution: 4 Lane
"Congested" non-HSS24 78.45 to 79.64 Bench Road to SR 26 Under-crossing 6.66 to 9.00Solution: 4 Lanes/Remove & Replace SR 26 Under-crossing
97 200.59 to 201.06 Ohme Garden Road to End Two-way left turn lane 4.00 to 5.41Solution: Phased Solution: -- Signal -- 5 Lanes
97 214.28 to 215.41 Entiat River Br to Shearon 2.22 to 3.00Solution: Channelization
97 215.89 to 216.3 Risk Avenue to Wisdom 0.88 to 1.20Solution: Passing Lane
97 223.7 to 225.23 Stayman Flats Road to truck climbing lane 17.77 to 24.04Solution: Truck climbing lane
97 233.14 to 233.49 Waterslide Drive to Park Street 2.66 to 3.60Solution: Urban?
97 234.98 to 236.17 SR 150 Wye to Chelan Falls Cutoff 4.44 to 6.00Solution: Climbing/Passing lanes
155 80.15 to 80.52 Omak Avenue to SR 215 8.88 to 12.02Solution: Needs Further Study - 5 Lane and New Okanogan River Bridge
171 1.02 to 2.82 Barbara to Division toSolution: No Recommended Solution: -- Potential Couplet
171 2.89 to 3.02 Stratford to Pioneer toSolution: No Recommended Solution: -- Potential Couplet
215 3.96 to 6.24 Emery Street to US 97 toSolution: Urban? Possible Couplet
285 0.16 to 1.14 Geore Sellar Bridge to Chehalis Street 53.30 to 72.11Solution: 8 lanes with Interchange
285 1.14 to 2.78 Chehalis Street to Ninth Street 13.32 to 18.02Solution: 8 lanes
285 2.86 to 4.57 End Couplet to Penny Road 30.20 to 40.86Solution: Extend couplet to Penny Road
Urban Bicycle97 291.9 to 291.98 US 97 Bridge # 097/534 0.56 to 0.76Solution: Pedestrian Bridge
171 0 to 0.2 SR 171 Milepost 0 - 0.2 0.06 to 0.08Solution: Provide connection from pedestrian bridge to existing street system

Washington State Highway System Plan: 2003-2022 Appendix K – 19February 2002
Appendix K: 20-Year I1 Mobility Strategies
Olympic RegionHighway Estimate Cost RangeNumber Milepost Vicinity Description ($ in Millions)
"Congested" HSS3 0.08 to 2.71 US 101 to Railroad Avenue in Shelton 17.97 to 24.31Solution: Needs Further Study - Widen from 2/3 lanes to 4/5 lanes
3 1.58 to 3.58 City of Shelton Vicinity 0.39 to 0.53Solution: Replace existing 20-stall park and ride lot in Shelton
3 1.82 to 2.71 Fairmont Avenue to Railroad Avenue 0.43 to 0.58Solution: Needs Further Study - Study Alternative Route(s) in City of Shelton
3 3.58 to 7.24 Shelton North of City Limits to Mason Lake Road 11.86 to 16.04Solution: Continuous passing lane(s)
3 7.24 to 10.76 Mason Lake Road to Pickering Road 9.79 to 13.25Solution: Widen from 2 lanes to 4 lanes
3 10.76 to 20.32 Pickering Road to Grapeview Loop Road 6.29 to 8.51Solution: Passing lanes
3 20.2 to 20.2 Grapeview Loop Road Vicinity 0.60 to 0.82Solution: New 44 stall park and ride lot south of Allyn
3 20.32 to 23.26 Grapeview Loop Road to SR 302-Victor Cutoff 2.20 to 2.98Solution: Northbound passing lane
3 23.26 to 28.23 SR 302 - Victor Cutoff to Mason/Kitsap County Line 13.18 to 17.84Solution: Two-way left turn lane SR 106 to SR 300 and widen 2/3 to 4 lanes North of SR 300
3 23.3 to 28 SR 302 - Victor Cutoff Road to Mason/Kitsap County Line 15.59 to 21.09Solution: New 2 lane Belfair Bypass
3 23.3 to 28 SR 302 - Victor Cutoff Road to Mason/Kitsap County Line 9.27 to 12.54Solution: Widen Belfair Bypass from 2 lanes to 4 lanes
3 24.45 to 27.08 Belfair Vicinity 0.69 to 0.93Solution: New 50 stall park and ride lot in Belfair
3 28.23 to 34.26 Mason/Kitsap County Line to SR 16 spur 20.40 to 27.60Solution: Widen from 2 lanes to 4 lanes per SR 106 to Gorst design study.
3 34.17 to 36 SR 3/SR 16 vicinity 3.31 to 4.47Solution: Construct 500 stall park and ride lot
3 34.17 to 34.81 SR 16 spur to Gorst U.S. Government Railroad Bridge 21.39 to 28.95Solution: Needs Further Study: Widen from 2 lanes to 4 lanes with new 2 lane Northbound bridge at SR 3/SR 16
3 34.81 to 36.37 Gorst U.S. Government Railroad Bridge to SR 3/SR304 Interchange 60.04 to 81.24Solution: Widen from 4 lanes to 6 lanes creating HOV lanes per final environmental impact statement, Intelligent Transportation System.
3 36.37 to 40.43 SR 3/SR 304 Interchange to Bremerton North of City Limits 38.32 to 51.84Solution: Widen from 4 lanes to 6 lanes creating HOV lanes, Intelligent Transportation System, and interchange improvements.
3 40.43 to 43.76 Bremerton North of City Limits to Newberry Hill Road 26.99 to 36.51Solution: Widen from 4 lanes to 6 lanes creating HOV lanes, Intelligent Transportation System.
3 44 to 46.02 SR 3/SR 303 vicinity 2.64 to 3.58Solution: Construct 400 stall park and ride lot.
3 45.15 to 46.42 SR3/SR 303 (Waaga Way) Interchange 4.51 to 6.10Solution: Interchange improvements at the Waaga Way Interchange
3 53.88 to 56.8 Needs Further Study - Northwest Thompson Road vicinity to Lofall Road 9.38 to 12.68Solution: Widen from 2 lanes to 4 lanes
3 56.8 to 60.02 Needs Further Study - Lofall Road vicinity to SR 104 Jct. 10.17 to 13.75Solution: Widen from 2 lanes to 4 lanes and intersection improvements
5 85.51 to 88.05 Lewis/Thurston County line to US 12 West Interchange 22.32 to 30.20Solution: Widen from 4 lanes to 6 lanes
5 85.51 to 88.05 Lewis/Thurston County line to US 12 West Interchange 22.55 to 30.51Solution: Needs Further Study-HOV lanes, dedicated freight lane, HSGT, or commuter rail, TDM, Intelligent Transportation System
5 88.05 to 95.26 Grand Mound Interchange to Maytown Interchange 30.61 to 41.41Solution: Widen from 4 lanes to 6 lanes
5 88.05 to 95.26 Grand Mound Interchange to Maytown Interchange 59.33 to 80.27Solution: Needs Further Study-HOV lanes, dedicated freight lane, HSGT, or commuter rail, TDM, Intelligent Transportation System
5 88.05 to 95.26 Lewis County line to Tumwater South of City Limits (93rd) 0.11 to 0.15Solution: Phase 1 Intelligent Transportation System Implementation. CCTV
5 88.05 to 95.26 Grand Mound Interchange to Maytown Interchange 0.20 to 0.28Solution: Phase 1 Intelligent Transportation System Implementation CCTV
5 88.33 to 88.33 Interstate 5 to SR 507 (Old Highway 99) 28.02 to 37.90Solution: Widen Old Hwy 99 from 2 lanes to 4 lanes (I-5/SR 12 West to SR 507)

Appendix K – 20 Washington State Highway System Plan: 2003-2022 February 2002
Appendix K: 20-Year I1 Mobility Strategies
Olympic Region (continued)
Highway Estimate Cost RangeNumber Milepost Vicinity Description ($ in Millions)
"Congested" HSS (continued)5 88.33 to 116.7 Grand Mound Interchange to Mounts Road Interchange 3.54 to 4.80Solution: Interstate 5 HOV Feasibility Study (US 12 West Interchange to Mounts Road Interchange)
5 88.33 to 88.33 US 12 West Interchange (Grand Mound) 0.50 to 0.68Solution: Expand existing 44 stall park and ride lot by 36 stalls at Grand Mound
5 95.26 to 99.28 SR 121/Maytown to SR 121/93rd Ave Interchange 8.70 to 11.76Solution: Widen from 4 lanes to 6 lanes
5 95.26 to 99.28 SR 121/Maytown to SR 121/93rd Ave Interchange 28.71 to 38.85Solution: Needs Further Study-HOV lanes, dedicated freight lane, HSGT, or commuter rail, TDM, Intelligent Transportation System
5 99.28 to 101.52 SR 121 Under-crossing/93rd Ave to Tumwater South of City Limits 7.60 to 10.28Solution: Needs Further Study-HOV lanes, dedicated freight lane, HSGT, or commuter rail, TDM, Intelligent Transportation System
5 100.52 to 101.3 Tumwater South of City Limits to Airdustrial Way Interchange 8.98 to 12.16Solution: Needs Further Study-HOV lanes, dedicated freight lane, HSGT/Commuter rail, TDM, Intelligent Transportation System
5 100.52 to 105.63 Tumwater South of City Limits to 14th Ave 0.11 to 0.15Solution: Phase 1 Intelligent Transportation System Implementation CCTV
5 101.3 to 104.05 Airdustrial Interchange to US 101 (Deschutes Pkwy Vicinity) 31.63 to 42.79Solution: Needs Further Study-HOV lanes, dedicated freight lane, HSGT, or commuter rail, TDM, Intelligent Transportation System
5 101.3 to 101.3 Airdustrial Interchange Vicinity 1.93 to 2.61Solution: New 100 stall park and ride lot near Labor and Industries building
5 104.05 to 105.63 US 101 (Deschutes Pkwy Vicinity) to 14th Ave 222.05 to 300.41Solution: Needs Further Study-HOV to HOV lanes at I-5/US 101, dedicated freight lane, HSGT or commuter rail, TDM, Intelligent Transportation System
5 105.63 to 108.39 14th Avenue to Sleater-Kinney Road Interchange 116.98 to 158.26Solution: Needs Further Study-HOV lanes, freight lane, HSGT, or commuter rail, HCT, TDM, Intelligent Transportation System
5 105.63 to 114.93 14th Ave. to Thurston/Pierce County line 0.43 to 0.58Solution: Phase 1 Intelligent Transportation System Implementation CCTV. VMS
5 107.87 to 107.87 Lilly Road Under-crossing Vicinity 1.54 to 2.08Solution: New 80 stall park and ride lot near Johnson-Lilly
5 108.39 to 113.23 Sleater-Kinney Interchange to Nisqually Interchange 139.57 to 188.83Solution: Needs Further Study-HOV lanes, freight lane, HSGT /commuter rail, HCT, TDM, Intelligent Transportation System, C-D lanes
5 108.89 to 108.89 Yelm Highway and College Road Intersection 0.26 to 0.36Solution: New 20 stall park and ride lot in vicinity of Little Prairie transfer point
5 109.19 to 109.19 Martin Way Interchange Vicinity 1.15 to 1.55Solution: Expand existing park and ride lot by 60 stalls new Martin Way Interchange
5 111.94 to 111.94 Marvin Road Interchange Vicinity (I-5/SR 510) 5.49 to 7.43Solution: Replace lot with a new 400-stall park and ride lot near SR 510/Marvin Interchange
5 113.23 to 114.93 Nisqually Interchange to Thurston/Pierce County Line 47.80 to 64.66Solution: Needs Further Study-HOV lanes, dedicated freight lane, HSGT, or commuter rail, TDM, Intelligent Transportation System
5 114.93 to 117 Thurston/Pierce County Line to Mounts Road 25.76 to 34.85Solution: Widen from 6 lanes to 8 lanes creating HOV lanes, Intelligent Transportation System, and study alternate routes
5 117 to 118 Mounts Road to South DuPont Interchange 11.73 to 15.87Solution: Widen from 6 lanes to 9 lanes creating HOV lanes, a Southbound auxiliary lane, and ultimate South DuPont Interchange (Center Drive) per access report, Intelligent Transportation System, and study Alternate routes
5 118 to 119.01 South DuPont Interchange Vicinity to DuPont Road 17.53 to 23.71Solution: Widen from 6 lanes to 11 lanes creating HOV lanes, a Southbound auxiliary lane, a Northbound 2 lane collector-distributor, Intelligent Transportation System.
5 119.01 to 120.9 DuPont Road Under-crossing to Fort Lewis Road 22.89 to 30.97Solution: Widen from 6 lanes to 9 lanes creating HOV lanes and a Northbound 1 lane collector-distributor, Intelligent Transportation System.
5 120.9 to 123.58 Fort Lewis Road Vicinity to Thorne Lane 30.28 to 40.96Solution: Widen from 6 lanes to 8 lanes creating HOV lanes, interchange improvements, Intelligent Transportation System.
5 122.67 to 128.67 Lakewood vicinity 28.86 to 39.04Solution: Construct 1150 Stall Park and ride lot structure.
5 123.58 to 123.58 East Tillicum Interchange (Thorne Lane Under-crossing) 7.79 to 10.55Solution: Interchange improvements for future Cross Base Corridor Connection
5 123.58 to 124.64 Thorne Lane Under-crossing to Gravelly Lake Dr. 6.35 to 8.59Solution: Widen from 6 lanes to 8 lanes creating HOV lanes per study, interchange improvements, Intelligent Transportation System.
5 124.64 to 125.86 Gravelly Lake Under-crossing to Bridgeport Way 10.03 to 13.57Solution: Widen from 8 lanes to 9 lanes creating HOV lanes per study (convert a lane Northbound to HOV and add a HOV lane Southbound), interchange improvements, Intelligent Transportation System, TSM

Washington State Highway System Plan: 2003-2022 Appendix K – 21February 2002
Appendix K: 20-Year I1 Mobility Strategies
Olympic Region (continued)
Highway Estimate Cost RangeNumber Milepost Vicinity Description ($ in Millions)
"Congested" HSS (continued)5 125.86 to 126.41 Bridgeport Way Under-crossing to Burlington Northern Railroad Under-crossing 6.24 to 8.44Solution: Widen from 8 lanes to 9 lanes creating HOV lanes per study (convert a lane Northbound to HOV and add a HOV lane Southbound), Intelligent Transportation System.
5 126.41 to 128.15 SR 512 Interchange vicinity 23.97 to 32.43Solution: Direct access ramp to SR 512
5 129.17 to 131.19 South Tacoma vicinity 8.38 to 11.34Solution: Construct 300 stall park and ride lot.
5 130.3 to 133 72nd St. to Yakima Avenue 12.44 to 16.84Solution: Direct access ramp to 48th Street (Tacoma Mall)
5 133 to 136.6 Yakima Avenue to Port of Tacoma 32.70 to 44.24Solution: Direct access ramp to Tacoma Dome
5 135.54 to 135.6 Fife vicinity 27.29 to 36.92Solution: Construct 1000 Stall Park and ride lot structure.
8 13.41 to 13.41 Summit Lake Road Vicinity 0.45 to 0.61Solution: Expand existing 20 stall park and ride lot by 33 stalls near Summit Lake Road
12 21.34 to 25.49 SR 8 to Malone (Mox Chehalis Road) 4.28 to 5.80Solution: Intermittent passing lanes
12 37.82 to 38.84 Pearson Road to Grays Harbor/Thurston County 5.40 to 7.30Solution: Widen from 2 lanes to 4 lanes or intermittent passing lanes
12 38.84 to 41.88 Grays Harbor/Thurston County line to Albany 12.77 to 17.27Solution: Widen from 2 lanes to 4 lanes
12 41.88 to 44.57 Albany St. (Old SR 121) to Old Hwy 99 South 9.01 to 12.19Solution: Couplet MP41.65-42.65 (Rochester) and widen 2 to 4 lanes after 42.65
12 44.57 to 46.62 Old Hwy 99 Southwest Vicinity to Interstate 5 12.71 to 17.19Solution: Widen from 2 lanes to 4 lanes
16 5.05 to 8.41 Tacoma Narrows Bridge 459.00 to 621.00Solution: Tacoma Narrows Bridge (Public/Private Partnership Project), TSM/TDM, Intelligent Transportation System.
16 10.15 to 12.92 Gig Harbor/Purdy vicinity 20.46 to 27.68Solution: Construct 750 stall park and ride lot structure.
16 15.77 to 18.1 SR 302 to Pierce/Kitsap County Line 37.32 to 50.49Solution: Widen from 4 lanes to 6 lanes creating HOV lanes, interchange improvements, TSM/TDM, Intelligent Transportation System.
16 18.1 to 25.41 Pierce/Kitsap County Line to SR 160 51.57 to 69.77Solution: Widen from 4 lanes to 6 lanes creating HOV lanes, Interchange improvements, TDM, Intelligent Transportation System.
16 25.41 to 28.16 SR 160 (Sedgwick Road) Vicinity to SR 166 44.87 to 60.71Solution: Widen from 4 lanes to 6 lanes creating HOV lanes, Interchange improvements, TDM, Intelligent Transportation System.
16 28.16 to 29.19 SR 166 to SR 3 35.33 to 47.79Solution: Widen from 6 lanes to 8 lanes creating HOV lanes and Access Management
19 0.09 to 0.09 SR 19-Beaver Valley/SR 104 Vicinity 0.54 to 0.74Solution: Improve existing 40-stall park and ride lot at SR 19/SR 104 intersection
20 0 to 8.25 US 101 to Old Fort Townsend Road 10.96 to 14.82Solution: Intermittent passing lanes/shoulder widening/widen to 4 lanes
20 8.25 to 10.82 Old Fort Townsend Road to Hendricks St. 21.98 to 29.74Solution: Parallel road extensions and access management
20 10.82 to 12.51 Hendricks Street to Ferry Landing 11.25 to 15.23Solution: Westbound Truck climbing and eastbound ferry holding lane
101 67.18 to 74.01 Pacific County Line to Lund Road 2.84 to 3.84Solution: Needs Further Study-Intermittent climbing/passing lanes
101 74.37 to 78.37 North River Road to SR 107 Vicinity 2.07 to 2.79Solution: Intermittent climbing/passing lane (Southbound)
101 78.37 to 80.4 South of Cosmopolis 0.00 to 0.00Solution: No Action
101 83.17 to 83.25 SR 105 to Chehalis River Bridge Vicinity 0.71 to 0.97Solution: Needs Further Study - Intersection improvements
101 83.54 to 88.75 Aberdeen-Hoquiam 40.21 to 54.40Solution: Aberdeen-Hoquiam Corridor Phase 1 - Hoquiam River Crossing
101 83.54 to 88.75 Aberdeen-Hoquiam 32.73 to 44.29Solution: Aberdeen-Hoquiam Corridor Phase 2 (excludes US 12 portion)

Appendix K – 22 Washington State Highway System Plan: 2003-2022 February 2002
Appendix K: 20-Year I1 Mobility Strategies
Olympic Region (continued)
Highway Estimate Cost RangeNumber Milepost Vicinity Description ($ in Millions)
"Congested" HSS (continued)101 83.74 to 83.74 Between South "G" and "H" Streets 0.76 to 1.02Solution: Acquire site west of center for direct access to "H" street in Aberdeen
101 89.06 to 91.92 SR 109 Spur (Longmire) to Ocean Beach Road 2.69 to 3.65Solution: Intermittent passing lanes
101 94.11 to 100.76 West Fork Hoquiam River to Larson Brothers 5.22 to 7.06Solution: Truck Climbing Lanes
101 109.18 to 109.18 Humptulips River Bridge/Kirkpatrick Road Vicinity 0.16 to 0.22Solution: Improve existing dirt park and ride lot near Humptulips River
101 109.2 to 110.2 Kirkpatrick Road to McNutt Road Vicinity 2.43 to 3.29Solution: Passing Lanes
101 116.6 to 117.6 Newbury Creek Road Vicinity 1.33 to 1.81Solution: Northbound Passing Lane
101 133.8 to 134.8 Boulder Creek Vicinity 1.13 to 1.53Solution: Northbound Climbing Lane
101 138.7 to 139.28 Raft River Vicinity 1.54 to 2.08Solution: Southbound Passing Lane
101 163.9 to 165.9 Ruby Beach Road Vicinity 2.86 to 3.86Solution: Climbing Lanes
101 183.3 to 184.3 Dowans Creek Road Vicinity 1.60 to 2.16Solution: Southbound Climbing Lane
101 186.1 to 189.4 Bogachiel River to Mill Creek Vicinity 7.31 to 9.89Solution: Northbound Climbing Lane and Southbound Passing Lane
101 189.4 to 191.85 East E Street to Tillicum Lane (Forks) 0.43 to 0.58Solution: Needs Further Study-Study improvements within the City of Forks
101 191.83 to 194.8 Tillicum Lane to Klahn Road 1.94 to 2.62Solution: Intermittent Passing Lanes
101 194.8 to 200.4 Klahn Road to West Lake Pleasant Road 2.15 to 2.91Solution: Intermittent Passing Lanes
101 200.4 to 203.86 West Lake Pleasant Road to SR 113 (Burnt Mt. Road) 1.62 to 2.20Solution: Westbound Passing Lane
101 231.35 to 232.35 Fisher Cove/East Beach Road Vicinity 1.28 to 1.74Solution: Westbound Climbing Lane
101 238.3 to 239.3 Indian Creek to Lake Aldwell Road Vicinity 1.13 to 1.53Solution: Westbound Climbing Lane
101 242.83 to 244.09 Laird Road to Reddick Road Vicinity 6.63 to 8.97Solution: Widen from 2/3 lanes to 4 lanes
101 244.09 to 245.6 Reddick Road to SR 117 Tumwater Truck Route 12.03 to 16.27Solution: Needs Further Study - 4 lanes or bypass pending study
101 246.25 to 251.53 SR 117 to Masters Road and Couplet 2.64 to 3.58Solution: Traffic operational improvements in Port Angeles (striping, signal, etc.)
101 252.16 to 255.13 Morse Creek to O'Brien Road Vicinity 0.00 to 0.00Solution: No action pending study outcome
101 253.1 to 255.11 Deer Park Road or Old Olympic/O'Brien Road 0.69 to 0.93Solution: New 50 stall park and ride at either Deer Park or O'Brien Road intersection
101 257.03 to 260.05 Shore Road to Kitchen-Dick Road 15.08 to 20.40Solution: Widen from 2 lanes to 4 lanes, interchange
101 262.35 to 264.56 Dungeness River Vicinity to Sequim Ave. 10.90 to 14.74Solution: Widen from 2 lanes to 4 lanes along portion of Sequim Bypass
101 263.05 to 263.05 River Road Under-crossing Vicinity 0.69 to 0.93Solution: New 50 stall park and ride lot near River Road west of Sequim
101 263.75 to 264.82 City of Sequim Vicinity 1.58 to 2.14Solution: New Sequim Transit Center (with parking)
101 264.56 to 264.56 Sequim Avenue Under-crossing Vicinity 0.69 to 0.93Solution: New 50 stall park and ride lot near Sequim Avenue
101 269.21 to 274.65 Dawley Road Vicinity to Clallam/Jefferson County Line 5.32 to 7.20Solution: Intermittent passing lanes (Blyne Vicinity Eastbound & Westbound passing lanes and Dawley truck climbing lane)
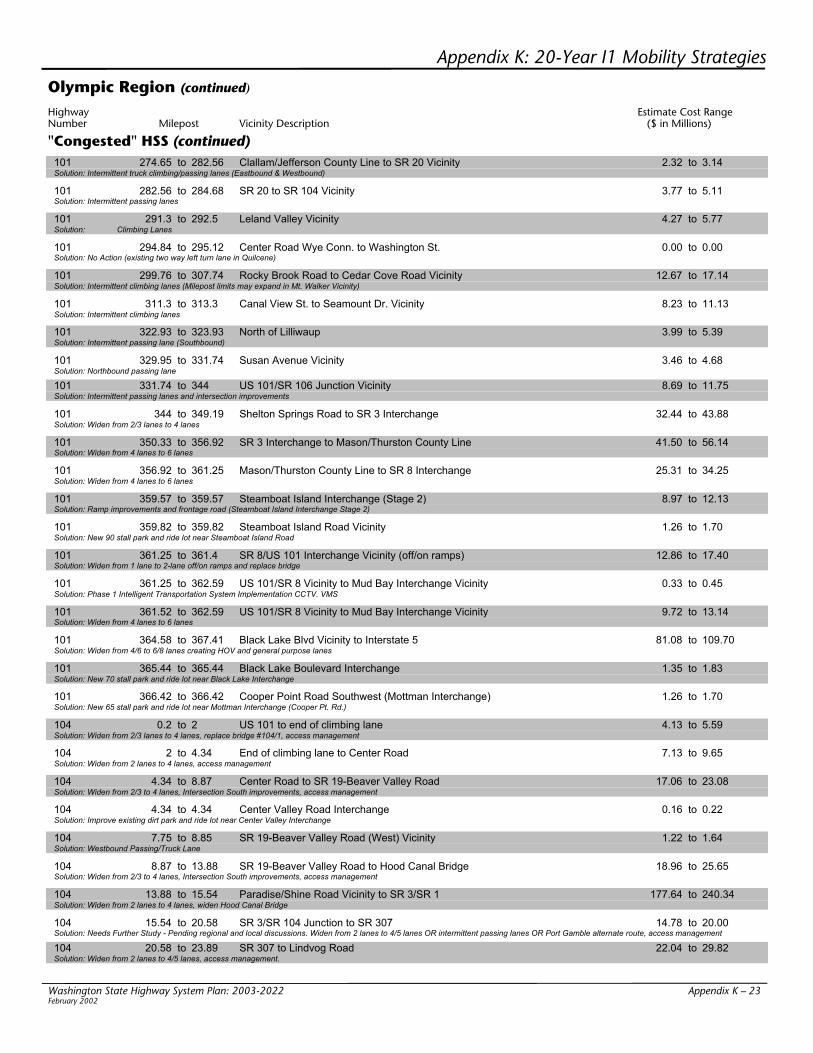
Washington State Highway System Plan: 2003-2022 Appendix K – 23February 2002
Appendix K: 20-Year I1 Mobility Strategies
Olympic Region (continued)
Highway Estimate Cost RangeNumber Milepost Vicinity Description ($ in Millions)
"Congested" HSS (continued)101 274.65 to 282.56 Clallam/Jefferson County Line to SR 20 Vicinity 2.32 to 3.14Solution: Intermittent truck climbing/passing lanes (Eastbound & Westbound)
101 282.56 to 284.68 SR 20 to SR 104 Vicinity 3.77 to 5.11Solution: Intermittent passing lanes
101 291.3 to 292.5 Leland Valley Vicinity 4.27 to 5.77Solution: Climbing Lanes
101 294.84 to 295.12 Center Road Wye Conn. to Washington St. 0.00 to 0.00Solution: No Action (existing two way left turn lane in Quilcene)
101 299.76 to 307.74 Rocky Brook Road to Cedar Cove Road Vicinity 12.67 to 17.14Solution: Intermittent climbing lanes (Milepost limits may expand in Mt. Walker Vicinity)
101 311.3 to 313.3 Canal View St. to Seamount Dr. Vicinity 8.23 to 11.13Solution: Intermittent climbing lanes
101 322.93 to 323.93 North of Lilliwaup 3.99 to 5.39Solution: Intermittent passing lane (Southbound)
101 329.95 to 331.74 Susan Avenue Vicinity 3.46 to 4.68Solution: Northbound passing lane
101 331.74 to 344 US 101/SR 106 Junction Vicinity 8.69 to 11.75Solution: Intermittent passing lanes and intersection improvements
101 344 to 349.19 Shelton Springs Road to SR 3 Interchange 32.44 to 43.88Solution: Widen from 2/3 lanes to 4 lanes
101 350.33 to 356.92 SR 3 Interchange to Mason/Thurston County Line 41.50 to 56.14Solution: Widen from 4 lanes to 6 lanes
101 356.92 to 361.25 Mason/Thurston County Line to SR 8 Interchange 25.31 to 34.25Solution: Widen from 4 lanes to 6 lanes
101 359.57 to 359.57 Steamboat Island Interchange (Stage 2) 8.97 to 12.13Solution: Ramp improvements and frontage road (Steamboat Island Interchange Stage 2)
101 359.82 to 359.82 Steamboat Island Road Vicinity 1.26 to 1.70Solution: New 90 stall park and ride lot near Steamboat Island Road
101 361.25 to 361.4 SR 8/US 101 Interchange Vicinity (off/on ramps) 12.86 to 17.40Solution: Widen from 1 lane to 2-lane off/on ramps and replace bridge
101 361.25 to 362.59 US 101/SR 8 Vicinity to Mud Bay Interchange Vicinity 0.33 to 0.45Solution: Phase 1 Intelligent Transportation System Implementation CCTV. VMS
101 361.52 to 362.59 US 101/SR 8 Vicinity to Mud Bay Interchange Vicinity 9.72 to 13.14Solution: Widen from 4 lanes to 6 lanes
101 364.58 to 367.41 Black Lake Blvd Vicinity to Interstate 5 81.08 to 109.70Solution: Widen from 4/6 to 6/8 lanes creating HOV and general purpose lanes
101 365.44 to 365.44 Black Lake Boulevard Interchange 1.35 to 1.83Solution: New 70 stall park and ride lot near Black Lake Interchange
101 366.42 to 366.42 Cooper Point Road Southwest (Mottman Interchange) 1.26 to 1.70Solution: New 65 stall park and ride lot near Mottman Interchange (Cooper Pt. Rd.)
104 0.2 to 2 US 101 to end of climbing lane 4.13 to 5.59Solution: Widen from 2/3 lanes to 4 lanes, replace bridge #104/1, access management
104 2 to 4.34 End of climbing lane to Center Road 7.13 to 9.65Solution: Widen from 2 lanes to 4 lanes, access management
104 4.34 to 8.87 Center Road to SR 19-Beaver Valley Road 17.06 to 23.08Solution: Widen from 2/3 to 4 lanes, Intersection South improvements, access management
104 4.34 to 4.34 Center Valley Road Interchange 0.16 to 0.22Solution: Improve existing dirt park and ride lot near Center Valley Interchange
104 7.75 to 8.85 SR 19-Beaver Valley Road (West) Vicinity 1.22 to 1.64Solution: Westbound Passing/Truck Lane
104 8.87 to 13.88 SR 19-Beaver Valley Road to Hood Canal Bridge 18.96 to 25.65Solution: Widen from 2/3 to 4 lanes, Intersection South improvements, access management
104 13.88 to 15.54 Paradise/Shine Road Vicinity to SR 3/SR 1 177.64 to 240.34Solution: Widen from 2 lanes to 4 lanes, widen Hood Canal Bridge
104 15.54 to 20.58 SR 3/SR 104 Junction to SR 307 14.78 to 20.00Solution: Needs Further Study - Pending regional and local discussions. Widen from 2 lanes to 4/5 lanes OR intermittent passing lanes OR Port Gamble alternate route, access management
104 20.58 to 23.89 SR 307 to Lindvog Road 22.04 to 29.82Solution: Widen from 2 lanes to 4/5 lanes, access management.

Appendix K – 24 Washington State Highway System Plan: 2003-2022 February 2002
Appendix K: 20-Year I1 Mobility Strategies
Olympic Region (continued)
Highway Estimate Cost RangeNumber Milepost Vicinity Description ($ in Millions)
"Congested" HSS (continued)104 23.89 to 24.86 Lindvog Road to Kingston Ferry 11.14 to 15.08Solution: Widen from 3 lanes to 5 lanes per SR 104 Corridor Traffic Circulation Study
167 1.5 to 5.26 Interstate 5 to SR 161/Existing SR 167 484.49 to 655.49Solution: SR 167 Extension, Stage 2 and 3 from Interstate 5 to SR 161/Existing SR 167. Initial construction of four-lane freeway.
167 1.5 to 5.26 Interstate 5 to SR 161/Existing SR 167 81.04 to 109.64Solution: SR 167 Extension, Stage 4 from Interstate 5 to SR 161/Existing SR 167. Addition of HOV lanes and direct access HOV ramps.
167 5.5 to 7 Puyallup vicinity 13.97 to 18.89Solution: Construct a 500-stall park and ride lot
167 6.19 to 26.28 SR 161 vicinity to I-405 1.77 to 2.39Solution: Corridor study to determine capacity and interchange needs on this segment of SR 167.
167 9 to 10 Sumner vicinity 13.97 to 18.89Solution: Construct a 500-stall park and ride lot
167 9.05 to 10.13 Vicinity of 24th Ave. E. 14.31 to 19.37Solution: Construct new North Sumner Interchange
304 0 to 3.51 SR 3 to Bremerton Ferry Landing 8.95 to 12.11Solution: Implement preferred B1 and modified C2 alternative roadway improvements per the record of decision and FEIS (Westbound HOV lane from Farragut St. Vicinity to SR 3).
304 0 to 3 Bremerton vicinity 2.64 to 3.58Solution: Construct 400 stall park and ride lot.
305 10.72 to 12.82 Poulsbo South of City Limits to Bond Road 3.85 to 5.21Solution: Widen from 2/3 lanes to 4/5 lanes creating peak hour High Occupancy Vehicle (HOV) lanes.
307 0 to 1.58 SR 305 to Foss Road 8.72 to 11.80Solution: Widen from 2 lanes to 4 lanes. Private developer contribution expected.
307 0 to 5.25 SR 305 to SR 104 2.55 to 3.45Solution: Needs Further Study- Environmental Impact Statement (EIS) for SR 307 Corridor
307 1.58 to 5.25 Foss Road to SR 104 19.44 to 26.30Solution: Widen from 2 lanes to 4 lanes.
509 1.66 to 5.72 Port of Tacoma Road to Marine View Drive 37.58 to 50.84Solution: SR 509 East - West Corridor Project, Phase 2 ultimate cross-section
510 9.99 to 10.93 Nisqually Tribal Center Vicinity 1.33 to 1.79Solution: New 95 stall park and ride lot within Nisqually Reservation
512 0 to 5.86 Interstate 5 to Canyon Road Intersection 56.96 to 77.06Solution: Widen from 4/6 lanes to 6/8 lanes creating HOV lanes, Intelligent Transportation System, enhanced transit
512 2 to 3 Parkland/Spanaway vicinity 15.37 to 20.79Solution: Construct 550 stall park and ride lot.
512 5.86 to 8.78 Canyon Road Intersection to SR 161 24.10 to 32.60Solution: Widen from 4 lanes to 6 lanes creating HOV lanes, Intelligent Transportation System, interchange improvements.
512 8.78 to 10.06 SR 161 Vicinity to Meridian Street 11.64 to 15.74Solution: Widen from 4 lanes to 6 lanes creating HOV lanes, Intelligent Transportation System.
512 9.79 to 10.36 SR 512/SR 167 extension Interchange 0.65 to 0.87Solution: Study potential connections between the proposed SR 512/SR 167 Interchange and SR 161/Valley Ave. Possible SR 512 Spur recommendation.
512 10.06 to 12.06 Meridian St. to SR 167 (Benston Dr.) 26.72 to 36.14Solution: Widen from 4 lanes to 6 lanes creating HOV lanes, Intelligent Transportation System.
"Congested" non-HSS7 36.08 to 40.1 SR 702 to 288th St E 18.28 to 24.73Solution: Widen from 2 to 4 lanes with restricted median (barrier).
7 40.1 to 42 288th St E to 260th St E 21.37 to 28.91Solution: Widen from 2 to 4 lanes with restricted median (barrier).
12 0 to 0.54 US 101 to Wishkah Mall (Tyler Street) 69.14 to 93.54Solution: High level bridge over the Wishkah River, US 101/US 12 Interchange (Phase 2)
19 0 to 2.33 SR 104 to Old Beaver Valley Road 14.65 to 19.83Solution: Widen from 2 lanes to 4 lanes
19 2.33 to 9.09 Old Beaver Valley to Chimacum/Center Roads 33.86 to 45.80Solution: Widen from 2 lanes to 4 lanes
19 9.09 to 14.16 Center Road to SR 20 20.61 to 27.89Solution: Widen from 2/3 lanes to 4 lanes

Washington State Highway System Plan: 2003-2022 Appendix K – 25February 2002
Appendix K: 20-Year I1 Mobility Strategies
Olympic Region (continued)
Highway Estimate Cost RangeNumber Milepost Vicinity Description ($ in Millions)
"Congested" non-HSS (continued)19 9.09 to 9.09 Chimacum/Center Road Vicinity 0.26 to 0.36Solution: New 20 stall park and ride lot near Chimacum/Center Road
99 0 to 0.18 I-5 to Pacific Highway East/54th Avenue 3.43 to 4.65Solution: Widen to 6 lanes, widen Bridge 099/400
99 0.18 to 5.7 Pacific Highway/East 54th Avenue to Milton North of City Limits 9.74 to 13.18Solution: Urban access management and signal coordination.
105 31 to 39 Oyster Pl. to South Arbor Road Vicinity 8.98 to 12.14Solution: Intermittent passing lanes
105 48.66 to 48.76 Boone Spur to US 101 0.99 to 1.33Solution: Needs Further Study - Realign Intersection
106 12.22 to 20.09 Entrance Twanoh State Park to end route 5.40 to 7.30Solution: Intermittent passing lanes
107 1.5 to 3.2 Lempie Road Vicinity to Minkler Road Vicinity 3.20 to 4.34Solution: Westbound passing lane
107 3.2 to 6.5 Mudgett Mt. Road to Melbourne Road 3.19 to 4.31Solution: Passing Lanes
107 7.83 to 7.97 Bridge 107/6 to US 12 0.67 to 0.91Solution: Intersection/channelization improvements
108 11.13 to 11.96 Little Creek Casino to US 101 Southbound 2.07 to 2.79Solution: Needs Further Study-Ramp terminal and intersection improvements
109 12.1 to 12.7 Between Jessie Slough and Burrows Road 1.80 to 2.44Solution: Intermittent passing lanes
115 0 to 0 Ocean Shores Vicinity 0.26 to 0.36Solution: New Ocean Shores Station (with parking)
116 0 to 2.84 SR 19 to Naval Undersea Engineering Station 6.08 to 8.22Solution: Passing lanes
121 0 to 7.67 I-5 (Maytown Interchange) to I-5 (93rd Avenue Interchange) 29.97 to 40.55Solution: Widen from 2 lanes to 4 lanes
121 0 to 0 SR 121/Interstate 5 Vicinity (Littlerock) 1.19 to 1.61Solution: New 85 stall park and ride lot near Littlerock
160 0 to 0.85 SR 160/SR 16 Interchange to Bethel Road 7.46 to 10.10Solution: Widen from 2 lanes to 4 lanes, widen bridge 160/5 at interchange to 5 lanes.
160 0.85 to 1.85 Bethel Road vicinity to Jackson Ave vicinity 5.94 to 8.04Solution: Widen from 2 lanes to 4 lanes
160 1.85 to 2.55 Jackson Ave vicinity to Long Lake Road vicinity 3.80 to 5.14Solution: Widen from 2 lanes to 4 lanes--Route Development Plan in progress
161 3.63 to 6.21 Eatonville North of City Limits to Eatonville Cutoff Road 2.45 to 3.31Solution: Intermittent passing lanes
161 13.17 to 15.94 Kapowsin Hwy to Graham truck lanes 2.14 to 2.90Solution: Intermittent passing lanes
161 17.48 to 19.47 234th St. E to 204th St. E 3.08 to 4.16Solution: Widen from 2 lanes to 5 lanes per design project and transit improvements.
161 19.47 to 21.36 204th Street East to 176th Street East 8.28 to 11.20Solution: Widen from 2 lanes to 5 lanes per design project and transit improvements
161 21.36 to 25.66 176th St. E to Meridian St 0.22 to 0.30Solution: Needs Further Study - Feasibility analysis of utilizing 94th Ave. E from SR 512 Vicinity to 152nd St. E Vicinity as a parallel local arterial and/or other alternative route(s) to relieve
161 25.66 to 25.85 Meridian St. to SR 512 Interchange 2.97 to 4.01Solution: Provide one additional lane each direction, widen structure over SR 512 to accommodate lanes per RDP
161 28.8 to 30.35 Valley Ave. E to 36th St. E 10.55 to 14.27Solution: Provide two general purpose through lanes each direction incl. the existing truck climbing lane/as per RDP. Replace bridge # 161/22
161 30.35 to 32.12 36th St. E to Jovita Blvd. 14.59 to 19.75Solution: Provide one additional general-purpose lane each direction creating a 5-lane roadway per design project
161 32.05 to 34.14 Jovita Blvd. to SR 18 12.38 to 16.76Solution: Widen to 5 lanes
162 0 to 3.21 SR 410 Interchange to Pioneer Way 8.70 to 11.78Solution: Widen from 2/3 lanes to 5 lanes-- per Route Development Plan.
162 3.21 to 7.1 Pioneer way to 144th Street East 22.94 to 31.04Solution: Widen from 2 lanes to 4 lanes--per Route Development Plan.
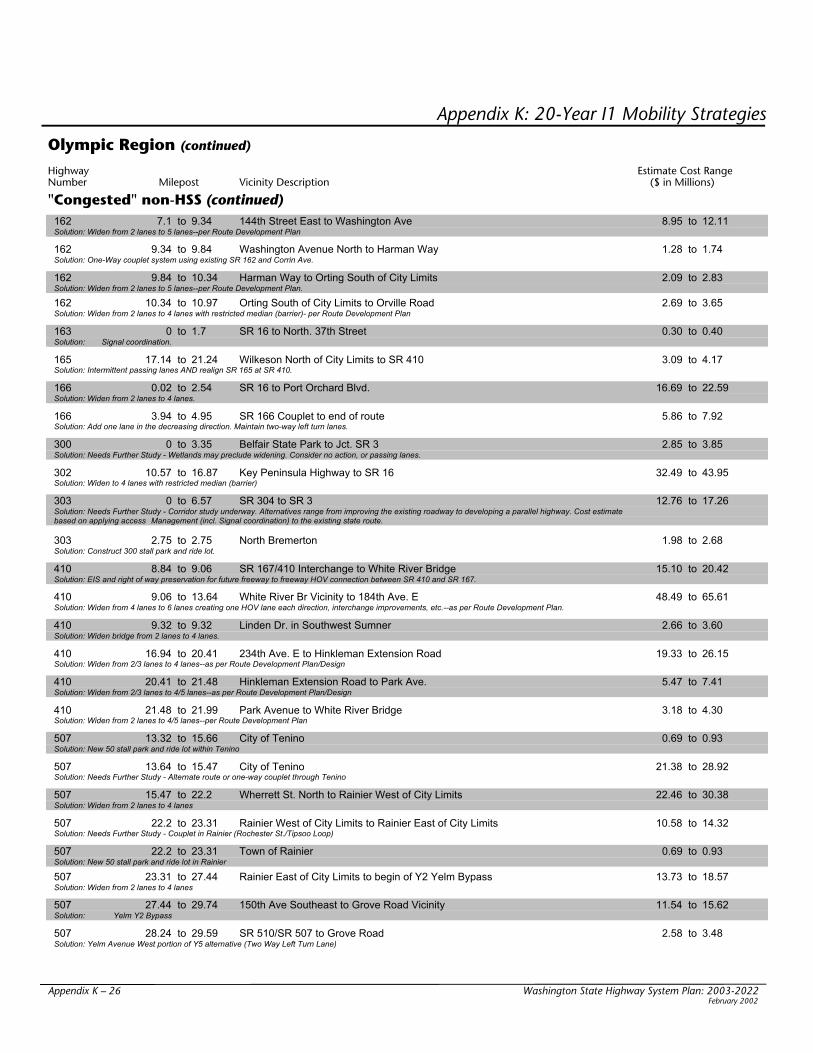
Appendix K – 26 Washington State Highway System Plan: 2003-2022 February 2002
Appendix K: 20-Year I1 Mobility Strategies
Olympic Region (continued)
Highway Estimate Cost RangeNumber Milepost Vicinity Description ($ in Millions)
"Congested" non-HSS (continued)162 7.1 to 9.34 144th Street East to Washington Ave 8.95 to 12.11Solution: Widen from 2 lanes to 5 lanes--per Route Development Plan
162 9.34 to 9.84 Washington Avenue North to Harman Way 1.28 to 1.74Solution: One-Way couplet system using existing SR 162 and Corrin Ave.
162 9.84 to 10.34 Harman Way to Orting South of City Limits 2.09 to 2.83Solution: Widen from 2 lanes to 5 lanes--per Route Development Plan.
162 10.34 to 10.97 Orting South of City Limits to Orville Road 2.69 to 3.65Solution: Widen from 2 lanes to 4 lanes with restricted median (barrier)- per Route Development Plan
163 0 to 1.7 SR 16 to North. 37th Street 0.30 to 0.40Solution: Signal coordination.
165 17.14 to 21.24 Wilkeson North of City Limits to SR 410 3.09 to 4.17Solution: Intermittent passing lanes AND realign SR 165 at SR 410.
166 0.02 to 2.54 SR 16 to Port Orchard Blvd. 16.69 to 22.59Solution: Widen from 2 lanes to 4 lanes.
166 3.94 to 4.95 SR 166 Couplet to end of route 5.86 to 7.92Solution: Add one lane in the decreasing direction. Maintain two-way left turn lanes.
300 0 to 3.35 Belfair State Park to Jct. SR 3 2.85 to 3.85Solution: Needs Further Study - Wetlands may preclude widening. Consider no action, or passing lanes.
302 10.57 to 16.87 Key Peninsula Highway to SR 16 32.49 to 43.95Solution: Widen to 4 lanes with restricted median (barrier)
303 0 to 6.57 SR 304 to SR 3 12.76 to 17.26Solution: Needs Further Study - Corridor study underway. Alternatives range from improving the existing roadway to developing a parallel highway. Cost estimate based on applying access Management (incl. Signal coordination) to the existing state route.
303 2.75 to 2.75 North Bremerton 1.98 to 2.68Solution: Construct 300 stall park and ride lot.
410 8.84 to 9.06 SR 167/410 Interchange to White River Bridge 15.10 to 20.42Solution: EIS and right of way preservation for future freeway to freeway HOV connection between SR 410 and SR 167.
410 9.06 to 13.64 White River Br Vicinity to 184th Ave. E 48.49 to 65.61Solution: Widen from 4 lanes to 6 lanes creating one HOV lane each direction, interchange improvements, etc.--as per Route Development Plan.
410 9.32 to 9.32 Linden Dr. in Southwest Sumner 2.66 to 3.60Solution: Widen bridge from 2 lanes to 4 lanes.
410 16.94 to 20.41 234th Ave. E to Hinkleman Extension Road 19.33 to 26.15Solution: Widen from 2/3 lanes to 4 lanes--as per Route Development Plan/Design
410 20.41 to 21.48 Hinkleman Extension Road to Park Ave. 5.47 to 7.41Solution: Widen from 2/3 lanes to 4/5 lanes--as per Route Development Plan/Design
410 21.48 to 21.99 Park Avenue to White River Bridge 3.18 to 4.30Solution: Widen from 2 lanes to 4/5 lanes--per Route Development Plan
507 13.32 to 15.66 City of Tenino 0.69 to 0.93Solution: New 50 stall park and ride lot within Tenino
507 13.64 to 15.47 City of Tenino 21.38 to 28.92Solution: Needs Further Study - Alternate route or one-way couplet through Tenino
507 15.47 to 22.2 Wherrett St. North to Rainier West of City Limits 22.46 to 30.38Solution: Widen from 2 lanes to 4 lanes
507 22.2 to 23.31 Rainier West of City Limits to Rainier East of City Limits 10.58 to 14.32Solution: Needs Further Study - Couplet in Rainier (Rochester St./Tipsoo Loop)
507 22.2 to 23.31 Town of Rainier 0.69 to 0.93Solution: New 50 stall park and ride lot in Rainier
507 23.31 to 27.44 Rainier East of City Limits to begin of Y2 Yelm Bypass 13.73 to 18.57Solution: Widen from 2 lanes to 4 lanes
507 27.44 to 29.74 150th Ave Southeast to Grove Road Vicinity 11.54 to 15.62Solution: Yelm Y2 Bypass
507 28.24 to 29.59 SR 510/SR 507 to Grove Road 2.58 to 3.48Solution: Yelm Avenue West portion of Y5 alternative (Two Way Left Turn Lane)

Washington State Highway System Plan: 2003-2022 Appendix K – 27February 2002
Appendix K: 20-Year I1 Mobility Strategies
Olympic Region (continued)
Highway Estimate Cost RangeNumber Milepost Vicinity Description ($ in Millions)
"Congested" non-HSS (continued)507 29.74 to 30.67 Grove Road Vicinity to Thurston/Pierce County 5.47 to 7.39Solution: Widen From 2 lanes to 4 Lanes
507 30.67 to 31.26 Thurston/Pierce County Line to Depot Road 5.43 to 7.35Solution: Widen from 2 to 4 lanes with center turn lane, access management--per Route Development Plan.
507 31.26 to 35.19 Depot Road Vicinity to Roy South of City Limits 13.47 to 18.23Solution: Widen from 2 to 4 Lanes with restricted median (barrier), access management per Route Development Plan.
507 35.19 to 35.97 Roy South of City Limits to Water St. Vicinity 3.51 to 4.75Solution: Widen from 2 to 4 lanes with center turn lane, access management
507 35.97 to 43.57 Water St. Vicinity to SR 7 19.57 to 26.47Solution: Widen from 2 to 4 lanes--as per Route Development Plan.
510 0 to 0.18 SR 510/I-5 Interchange to Quinault Way 9.77 to 13.21Solution: Interchange improvements (Phase 2)
510 0.18 to 2.62 Quinault Way Northeast to Martin Way 5.74 to 7.76Solution: Widen from 2/3 lanes to 5 lanes
510 2.62 to 4.28 Martin Way to Pacific Avenue 6.05 to 8.19Solution: Widen from 2 lanes to 5 lanes
510 4.28 to 6.3 Marvin Road/Pacific Ave to Old Pacific Hwy 9.99 to 13.51Solution: Widen from 2/3 Lanes to 4/5 lanes
510 4.28 to 4.28 Amtrak station off Yelm Highway 0.00 to 0.00Solution: Expand Centennial Station park and ride lot by approximately 100 stalls. Recent work under WSDOT grant ($450,000).
510 6.3 to 9.44 Old Pacific Hwy to Yelm Hwy Southeast Vicinity 9.49 to 12.85Solution: Widen from 2 lanes to 4 Lanes
510 6.95 to 6.95 Meridian Road Southeast intersection 0.69 to 0.93Solution: New 50 stall park and ride lot in Tri-Lakes Vicinity
510 9.44 to 13.5 Yelm Hwy Southeast Vicinity to Mud Run Road 10.68 to 14.44Solution: Widen from 2 lanes to 4 lanes
510 13.5 to 15.67 Mud Run Road Vicinity to SR 507 (Grove Road) 28.85 to 39.03Solution: Yelm Y3 Bypass
510 14.49 to 15.67 93rd Avenue Southeast to SR 507 2.40 to 3.24Solution: Yelm Avenue East portion of Y5 alternative (Two Way Left Turn Lane)
702 0 to 9.32 SR 507 to SR 7 5.34 to 7.22Solution: Intermittent passing lanes
Access Management for Developed Corridors7 52.63 to 57.03 108th St. South. to South. 38th St. 9.89 to 13.37Solution: Access management, signal coordination.
161 21.36 to 25.66 176th St. E to Meridian St 9.97 to 13.49Solution: Access management and signal coordination.
305 0.02 to 7.05 Bainbridge Island Ferry to Agate Pass Bridge 7.06 to 9.56Solution: Access management, TSM/TDM treatments, intersection improvements (HOV queue jump lanes, bicycle route improvements, etc.).
305 7.05 to 10.72 Agate Pass Bridge to Poulsbo South of City Limits 2.21 to 2.99Solution: Needs Further Study - Access management through 2010. Reevaluate beyond the year 2010.
310 0 to 1.84 SR 3 to SR 304 17.52 to 23.70Solution: Needs Further Study-Widen to 6/7 lanes. Estimate based on 6-lane section with landscaped median.
410 13.64 to 15.7 184th Ave. E to 214th Ave. E 0.85 to 1.15Solution: Urban access control, local arterial (City of Bonney Lake)--as per Route Development Plan
Access Management for Non-Developed Corridors3 34.09 to 35 Gorst 1.96 to 2.65Solution: Purchase of access rights. Proposed partial limited access limited access
3 35 to 36.22 Gorst to SR 304 2.64 to 3.58Solution: Purchase of access rights. Proposed full limited access.
3 53.77 to 59.82 Northwest Thomson Road to SR 104 2.62 to 3.54Solution: Purchase of access rights. Proposed full & partial limited access.
7 26.99 to 28.6 SR 161 to Eatonville Hwy. 0.69 to 0.93Solution: Purchase of access rights. Proposed partial limited access limited access (Eatonville UAB)
7 40.38 to 42.01 52nd Ave. E to 260th St. E 0.69 to 0.93Solution: Purchase of access rights. Proposed partial limited access limited access.

Appendix K – 28 Washington State Highway System Plan: 2003-2022 February 2002
Appendix K: 20-Year I1 Mobility Strategies
Olympic Region (continued)
Highway Estimate Cost RangeNumber Milepost Vicinity Description ($ in Millions)
Access Management for Non-Developed Corridors (continued)7 42.01 to 45 260th St. E to Fir Road E 2.60 to 3.52Solution: Purchase of access rights. Proposed partial limited access limited access.
8 0 to 20.67 US 12/Elma to US 101/Olympia 0.43 to 0.58Solution: Needs Further Study - Study grade separation feasibility (continuation of SR 12 at-grade study).
12 0.65 to 1.76 South Fleet St. to Aberdeen East of City Limits 0.92 to 1.24Solution: Purchase of access rights. Proposed Full
12 1.76 to 7.02 Aberdeen East of City Limits to Alderbrook Drive 4.42 to 5.98Solution: Purchase of access rights. Proposed Full, Multi-lane divided
12 1.76 to 19.93 Aberdeen East of City Limits to Elma West of City Limits 0.43 to 0.58Solution: Needs Further Study-East Grays Harbor At-Grade Separation Analysis
12 7.02 to 9.04 Alderbrook Dr. to Devonshire Interchange 0.87 to 1.17Solution: Purchase of access rights. Proposed Full for route continuity, Multi-lane divided
12 42.65 to 44.57 183rd Ave Southwest to Old Hwy 99 Southwest 0.79 to 1.07Solution: Purchase of access rights. Proposed Partial
16 26.88 to 28.32 Cliffton/Tremont Road to SR 166 3.12 to 4.22Solution: Purchase of access rights. Proposed full limited access.
16 28.32 to 29.19 SR 166 to SR 3 1.88 to 2.54Solution: Purchase of access rights. Proposed full limited access.
20 0 to 8.25 US 101 to Old Fort Townsend Road 3.47 to 4.69Solution: Purchase of access rights. Proposed Partial, (Ferry Route, Pt. Townsend to Keystone)
20 8.25 to 9.78 Old Ft Townsend Road to Port Townsend West of City Limits 1.27 to 1.71Solution: Purchase of access rights. Proposed Partial, (Ferry Route, Pt. Townsend to Keystone), (UAB & Access Management)
101 89.08 to 91.92 SR 109 Spur to Ocean Beach Road 1.19 to 1.61Solution: Purchase of access rights. Proposed Partial (Widening to 4 lanes)
101 192.85 to 193.3 SR 110 - LaPush Road Vicinity 0.17 to 0.23Solution: Purchase of access rights. Proposed Partial (Vicinity Jct. SR 110)
101 203.75 to 204.06 Rixon Road to Sappho Park & Ride Lot Vicinity 0.11 to 0.15Solution: Purchase of access rights. Proposed Partial (Vicinity Jct. SR 113)
101 242.44 to 243 Hansen Road Vicinity 0.22 to 0.30Solution: Purchase of access rights. Proposed Partial (Vicinity Jct. SR 112)
101 243 to 243.8 Laird Road to Dry Creek Road Vicinity 0.31 to 0.43Solution: Purchase of access rights. Proposed Partial for continuity
101 243.8 to 246.09 Dry Creek Road to Doyle Road 1.92 to 2.60Solution: Purchase of access rights. Proposed Partial (UAB)
101 255.13 to 262.23 O'Brien Road to Dungeness River Vicinity 5.98 to 8.08Solution: Purchase of access rights. Proposed Partial or Full
101 282.36 to 282.76 West Uncas Road to East Uncas Road 0.31 to 0.43Solution: Purchase of access rights. Proposed Partial (Vicinity Jct. SR 20)
101 282.76 to 284.68 East Uncas Road North to SR 104 Vicinity 0.79 to 1.07Solution: Purchase of access rights. Proposed Partial for continuity
101 349.58 to 362.09 SR 3 to Perry Creek Vicinity 0.13 to 0.17Solution: Needs Further Study-Study grade separation/frontage road feasibility
104 15.92 to 16.45 Wheeler Road to Gamble Way 1.13 to 1.53Solution: Purchase of access rights. Proposed partial limited access limited access. (Ferry Route)
104 17 to 22 Port Gamble West of City Limits to Hansville-Miller Bay 10.90 to 14.74Solution: Purchase of access rights. Proposed partial limited access limited access. (Ferry Route)
104 22 to 23.89 Hansville-Miller Bay Road to Lindvog Road 4.11 to 5.55Solution: Purchase of access rights. Proposed partial limited access limited access. (Ferry Route)
105 41.09 to 44.5 Gray Lane /O'Leary Creek to Chapin Creek Vicinity 1.41 to 1.91Solution: Purchase of access rights. Proposed Partial for route continuity.
105 44.5 to 46.62 Chapin Creek to Charlie Creek Vicinity 1.77 to 2.39Solution: Purchase of access rights. Proposed Partial (UAB)
105 46.87 to 47.83 Charlie Creek to Edward P. Smith Dr Vicinity 0.79 to 1.07Solution: Purchase of access rights. Proposed Partial
160 0 to 2.55 SR 16 to Long Lake Road Southeast 2.12 to 2.86Solution: Purchase of access rights. Proposed partial limited access (UAB, Ferry Route)
160 2.55 to 7.47 Long Lake Road Southeast to Southworth Ferry 2.13 to 2.88Solution: Purchase of access rights. Proposed partial limited access (Ferry Route)

Washington State Highway System Plan: 2003-2022 Appendix K – 29February 2002
Appendix K: 20-Year I1 Mobility Strategies
Olympic Region (continued)
Highway Estimate Cost RangeNumber Milepost Vicinity Description ($ in Millions)
Access Management for Non-Developed Corridors (continued)161 0 to 2.27 SR 7 to Eatonville South of City Limits 0.97 to 1.31Solution: Purchase of access rights. Proposed partial limited access (Eatonville UAB)
161 3.63 to 5.47 Eatonville North of City Limits to Ohop Valley Road 0.79 to 1.07Solution: Purchase of access rights. Proposed partial limited access (Eatonville UAB and Expansion Area)
161 5.47 to 17.56 Ohop Valley Road to 234th St. E 5.26 to 7.12Solution: Purchase of access rights. Proposed partial limited access
161 28.81 to 29.24 Valley Ave. E to Puyallup North of City Limits 0.94 to 1.27Solution: Purchase of access rights. Proposed partial limited access, (Widening to 4 lanes, Puyallup City Limits)
161 29.24 to 30.34 Puyallup North of City Limits to 36th St. E 0.94 to 1.27Solution: Purchase of access rights. Proposed partial limited access, (Widening to 4-5 lanes, UAB)
162 0.1 to 0.53 SR 410 to Sumner South of City Limits 0.35 to 0.47Solution: Purchase of access rights. Proposed partial limited access.
162 0.53 to 6.11 Sumner South of City Limits to 128th St. E 2.78 to 3.76Solution: Purchase of access rights. Proposed partial limited access.
162 6.11 to 6.83 128th St. E to Puyallup River 0.60 to 0.82Solution: Purchase of access rights. Proposed partial limited access.
162 6.83 to 8.06 Puyallup River to Orting North of City Limits 0.52 to 0.70Solution: Purchase of access rights. Proposed partial limited access.
162 8.06 to 9.23 Orting North of City Limits to North Washington Ave. 0.50 to 0.68Solution: Purchase of access rights. Proposed partial limited access.
162 10.34 to 10.97 Orting South of City Limits to Orville Road E 0.26 to 0.35Solution: Purchase of access rights. Proposed partial limited access.
305 6.21 to 7.11 Agatewood Road Northeast to Park & Ride Lot 0.38 to 0.52Solution: Purchase of access rights. Proposed partial limited access (City of Bainbridge Island C/L, Ferry Route)
305 9 to 9.7 Lemolo Shore Dr. to Noll Road 0.29 to 0.39Solution: Purchase of access rights. Proposed partial limited access (Ferry Route)
305 9.7 to 10.69 Noll Road to Poulsbo South of City Limits 2.13 to 2.89Solution: Purchase of access rights. Proposed partial limited access (UAB, Ferry Route)
305 10.69 to 12.36 Poulsbo West of City Limits to Little Valley Road 3.63 to 4.91Solution: Purchase of access rights. Proposed partial limited access (Poulsbo C/L, Ferry Route)
305 12.36 to 13.16 Little Valley Road to Poulsbo South of City Limits 1.73 to 2.33Solution: Purchase of access rights. Proposed partial limited access (UAB, Ferry Route)
307 0 to 1.59 SR 305 to Pugh Road Northeast 0.68 to 0.92Solution: Purchase of access rights. Proposed partial limited access (UAB)
307 1.59 to 5.25 Pugh Road Northeast to SR 104 1.58 to 2.14Solution: Purchase of access rights. Proposed partial limited access (Connection to two ferry routes; SR 104 and SR 305)
308 1.3 to 3.42 Silverdale Way to US Navel Reservation 4.61 to 6.23Solution: Purchase of access rights. Proposed partial limited access (UAB)
410 11.87 to 12.72 166th Ave. E to Bonney Lake West of City Limits 1.84 to 2.48Solution: Purchase of access rights. Proposed full limited access.
410 12.72 to 13.37 Bonney Lake West of City Limits to 181st Ave E 1.41 to 1.91Solution: Purchase of access rights. Proposed full limited access.
507 25.5 to 27.95 Koeppen/Manke Roads to Mill Road Vicinity 1.02 to 1.38Solution: Purchase of access rights. Proposed Partial (Yelm GMA UAB)
507 29.23 to 30.65 Yelm North of City Limits (Bald Hills Road) to Nisqually River 0.59 to 0.79Solution: Purchase of access rights. Proposed Partial (Mobility Objective identifies 4 laning between Yelm & McKenna) Yelm GMA UAB Vicinity
507 31.31 to 35.19 350th St. South to Roy South of City Limits 1.67 to 2.27Solution: Purchase of access rights. Proposed partial limited access
507 35.97 to 36.9 Water St. to ARMP 36.85 0.39 to 0.53Solution: Purchase of access rights. Proposed partial limited access (Roy to Ft. Lewis Bndy.)
510 2.75 to 6.94 Marvin Road to Meridian Road Southeast 3.13 to 4.23Solution: Purchase of access rights. Proposed Partial (Lacey's GMA UAB ends at Milepost 6.5 Vicinity)
510 6.94 to 9.3 Meridian Road Southeast to Yelm Hwy Southeast 0.97 to 1.31Solution: Purchase of access rights. Proposed Partial (Mobility Objective identifies widening to 4 lanes)
510 12.8 to 14.41 Southworth Elementary School to Yelm West of City Limits 1.33 to 1.81Solution: Purchase of access rights. Proposed Partial (Yelm GMA UAB, Ft. Lewis Res. to Yelm C/L)

Appendix K – 30 Washington State Highway System Plan: 2003-2022 February 2002
Appendix K: 20-Year I1 Mobility Strategies
Olympic Region (continued)
Highway Estimate Cost RangeNumber Milepost Vicinity Description ($ in Millions)
Puget Sound Core HOV Lanes5 126.41 to 130.3 Burlington Northern Railroad Under-crossing to 72nd Street Vicinity 121.13 to 163.89Solution: Core HOV lanes - Construct Core HOV lanes including interchange improvements and Intelligent Transportation System.
5 130.3 to 133.75 72nd Street vicinity to Pacific Ave. 275.07 to 372.15Solution: Core HOV lanes - Construct Core HOV lanes including interchange improvements and Intelligent Transportation System.
5 133.75 to 136.6 Pacific Ave. vicinity to Port of Tacoma 260.95 to 353.05Solution: Core HOV lanes - Construct Core HOV lanes including interchange improvements and Intelligent Transportation System.
5 136.6 to 139.5 Port of Tacoma to Pierce/King County Line 27.34 to 37.00Solution: Core HOV lanes - Construct Core HOV lanes including interchange improvements and Intelligent Transportation System.
16 0.81 to 2.13 I-5/SR 16 Interchange and Nalley Valley 23.24 to 31.44Solution: Core HOV lanes, interchange improvements, Intelligent Transportation System.
16 2.13 to 3.8 Union Ave. to SR 163-Pearl St. Vicinity 17.84 to 24.14Solution: Core HOV lanes, interchange improvements, Intelligent Transportation System.
16 3.8 to 5.05 SR 163 - Pearl St. to Jackson Ave. 4.78 to 6.46Solution: Core HOV lanes, interchange improvements, TSM/TDM, Intelligent Transportation System.
16 8.41 to 12.69 36th Street Interchange to Olympic Interchange 4.43 to 5.99Solution: Core HOV lanes, new interchange, Intelligent Transportation System.
16 12.69 to 15.77 Olympic Interchange to Purdy (SR 302) 31.61 to 42.77Solution: Core HOV lanes, interchange improvements, frontage road, Intelligent Transportation System.
167 5.26 to 13.73 SR 161/Existing SR 167 to SR 18 vicinity 45.97 to 62.19Solution: Core HOV lanes, interchange improvements, Intelligent Transportation System.
Urban Bicycle3 1.82 to 2.18 Fairmont Avenue to Delaware Street 0.40 to 0.54Solution: Widen shoulder to 5' minimum or improve existing trail
3 2.18 to 2.31 Delaware Street to Mill Street 0.29 to 0.39Solution: Widen shoulder to 5' minimum (bicycle touring route and nearby school)
3 2.31 to 2.45 Mill Street to Goldsborough Creek Bridge 0.11 to 0.15Solution: Widen shoulder to 5' minimum (bicycle touring route and nearby school)
3 2.77 to 2.93 Railroad Avenue to Pine Street 0.06 to 0.08Solution: Widen shoulder to 5' minimum (bicycle touring route and nearby school)
3 45.91 to 46.89 Waaga Way to Trigger Ave. 0.00 to 0.00Solution: Allow utilization of excess state right of way for the Clear Creek Trail. Trail along WSDOT right-of-way from Waaga Way vicinity to Trigger Avenue.
5 104.75 to 105.24 Tumwater Historical Park to Henderson Blvd 6.12 to 8.28Solution: Extend Class I Trail (Olympia Woodland Trail Phase IV)
5 108.13 to 108.13 Between Lilly Road Interchange and Sleater-Kinney Road Interchange 8.87 to 11.99Solution: Chehalis Western Trail connection over Interstate 5 (Class I trail)
5 109.15 to 109.15 Martin Way Over-crossing Vicinity 1.22 to 1.64Solution: Martin Way Over-crossing. Relocate existing sidewalk under the over-crossing behind the existing bridge columns.
5 109.15 to 114.56 Martin Way Interchange to Nisqually Vicinity 2.03 to 2.75Solution: Class I bicycle trail (Lacey Urban Trails plan: Martin Way to Meridian)
5 119.01 to 119.01 Steilacoom/DuPont Road 0.26 to 0.35Solution: Widen structure at Dupont.
16 12.01 to 12.01 Wollochet Dr. Northwest 0.62 to 0.84Solution: Widen bridge #016/125 10' for a 4' Class III bikeway & 6' sidewalks. Move sidewalks & widen approaches.
20 9.2 to 10.77 Old CMSTP&P Railroad Bridge to Sherman Street 0.26 to 0.35Solution: Widen shoulder to 5' minimum (bicycle touring route and nearby schools)
20 10.77 to 10.98 Sherman Street to Cleveland Street 0.00 to 0.00Solution: No Action (shoulders widened in recent project)
101 247.98 to 248.94 Port Angeles, 2nd St. to Chambers St. 0.08 to 0.10Solution: Proposed bike lane on E 1st St. No action or striping/signing
101 267 to 267.21 Keeler Road to White Feather Way Vicinity 0.00 to 0.00Solution: Consider Bike Trail within Sequim Bypass Right-of-Way. Provide opportunities to incorporate a class I bike trail.
101 363.3 to 363.6 Delphi Road Under-crossing (McLane Elementary) 0.00 to 0.00Solution: Consider Bike Trail within US 101 Right-of-Way and Evergreen Parkway Limited Access. Provide opportunities to extend existing trail

Washington State Highway System Plan: 2003-2022 Appendix K – 31February 2002
Appendix K: 20-Year I1 Mobility Strategies
Southwest RegionHighway Estimate Cost RangeNumber Milepost Vicinity Description ($ in Millions)
"Congested" HSS4 34.87 to 35.53 Mill Road to SR 409 0.07 to 0.09Solution: Needs Further Study - Channelization
4 35.53 to 37.6 SR 409 to end of existing Westbound climbing lane 2.33 to 3.15Solution: Widen to 4 lanes
5 0 to 0.39 Interstate Bridge 425.00 to 575.00Solution: New Interstate River Crossing (HOV/HCT) * HCP
5 0 to 1.99 Interstate Bridge to SR 500 5.44 to 7.36Solution: Intelligent Transportation System (Intelligent Transportation System) Improvements
5 0 to 7.24 Interstate Bridge to 134th St. 1.05 to 1.41Solution: Intelligent Transportation System (Intelligent Transportation System) Communications
5 0 to 0.39 Interstate Bridge 3.09 to 4.17Solution: Pre-design engineering for New Interstate River Crossing (HOV/HCT)
5 0 to 7.41 Oregon State Line to I-5/I-205 Jct. Vicinity 227.38 to 307.63Solution: Multimodal solutions to increase capacity
5 0.27 to 2.87 Interstate Bridge to Main St. Interchange Vicinity 71.69 to 96.99Solution: Needs Further Study - I-5 collector distributor
5 1.99 to 3.75 SR 500 to 78th St. 1.39 to 1.87Solution: Intelligent Transportation System (Intelligent Transportation System) Improvements
5 2.35 to 2.5 SR 500 Westbound to I-5 Northbound 6.32 to 8.54Solution: On ramp from SR 500 Westbound to I-5 Northbound
5 3.75 to 4.91 78th St. to 99th St. Vicinity 1.19 to 1.61Solution: Intelligent Transportation System (Intelligent Transportation System) Improvements
5 4.91 to 5.85 99th St. Vicinity to Salmon Creek 1.12 to 1.52Solution: Intelligent Transportation System (Intelligent Transportation System) Improvements
5 5.85 to 7.24 Salmon Creek to 134th St. 1.14 to 1.54Solution: Intelligent Transportation System (Intelligent Transportation System) Improvements
5 7.24 to 7.44 Northeast 134th St. Interchange 43.91 to 59.41Solution: Reconstruct Northeast 134th Street interchange
5 7.24 to 7.44 Northeast 134th St. Interchange 4.02 to 5.44Solution: Construct Park & Ride
5 7.41 to 9.25 I-5/I-205 Jct. Vicinity to 179th St Vicinity 32.08 to 43.40Solution: Multimodal capacity improvements
5 9.25 to 11.5 Northeast 179th St. Vicinity to Northeast 219th St. 20.48 to 27.70Solution: Multimodal capacity improvements, reconstruct Northeast 179th interchange
5 11.5 to 12.07 Northeast 219th St. Vicinity 35.51 to 48.05Solution: New Northeast 219th St. interchange with corridor to SR 502
5 11.5 to 14 Northeast 219th St. Vicinity to SR 501/Northeast 269th St. 12.76 to 17.26Solution: Multimodal capacity improvements
5 13.87 to 14.55 SR 501/Northeast 269th St. Interchange 7.09 to 9.59Solution: Reconstruct Northeast 269th St. interchange
5 14 to 55 SR 501 to Toutle river rest area Vicinity 354.22 to 479.24Solution: Increase capacity
5 16 to 17.5 Northeast 319th St. Interchange 11.75 to 15.89Solution: Reconstruct Northeast 319th St. interchange
5 20.78 to 23.18 Woodland area 0.16 to 0.22Solution: Woodland / I-5 access study
5 21.08 to 21.11 SR 503 interchange 17.56 to 23.76Solution: Reconstruct SR 503 interchange
5 36.98 to 37.01 SR 432 Interchange 19.07 to 25.81Solution: Interchange improvements with I-5
5 39.88 to 39.9 SR 4 Interchange 9.01 to 12.19Solution: Reconstruct SR 4 interchange
5 55 to 72.4 Toutle river rest area to Rush Road 227.21 to 307.41Solution: Increase capacity
5 60.91 to 60.91 SR 506 Interchange 6.24 to 8.44Solution: Reconstruct SR 506 Interchange

Appendix K – 32 Washington State Highway System Plan: 2003-2022 February 2002
Appendix K: 20-Year I1 Mobility Strategies
Southwest Region (continued)
Highway Estimate Cost RangeNumber Milepost Vicinity Description ($ in Millions)
"Congested" HSS (continued)5 68.5 to 68.5 US 12 Interchange Vicinity 0.96 to 1.30Solution: Park & Ride lot
5 72.4 to 78.4 Rush Road to West St. Under-crossing 1.77 to 2.39Solution: PS&E for widening to 6 lanes with auxiliary lanes
5 72.4 to 85.51 Rush Road to Thurston County Line 225.22 to 304.72Solution: Increase capacity
5 74.2 to 75.2 La Bree Road Vicinity 1.41 to 1.91Solution: PS&E for improved connections to industrial areas
5 74.2 to 75.2 La Bree Road Vicinity 24.59 to 33.27Solution: Improve La Bree Road access
5 85.51 to 85.51 North Lewis County Interchange 15.24 to 20.62Solution: Improved connections to industrial areas
12 66.58 to 66.63 I-5 Interchange 0.00 to 0.00Solution: Interchange improvements (see I-5 Milepost 68.00 to Milepost 72.40)
12 66.63 to 67.33 I-55 Over-crossing to Vicinity Avery Road East 1.83 to 2.47Solution: Two-way left-turn channelization
12 70.5 to 71.3 Larmon Road Vicinity 0.69 to 0.93Solution: Westbound truck climbing lane or intermittent passing lanes
12 75.15 to 80.35 Kennedy Road to SR 122 12.29 to 16.63Solution: Intermittent passing lanes or widen to 4 lanes
12 80.5 to 81 Gershick Road Vicinity to Filbert Road Vicinity 0.56 to 0.76Solution: Westbound truck climbing lane or intermittent passing lanes
12 83.72 to 85.87 Baker Road to old alignment of Aldrich Road 3.00 to 4.06Solution: Intermittent passing lanes or widen to 4 lanes
12 90 to 91.2 Grade break, Twin Canyon bridge Vicinity 1.41 to 1.91Solution: Eastbound truck climbing lane or intermittent passing lanes
12 91.6 to 93.57 Grade break, Highland Valley Vicinity 2.32 to 3.14Solution: Eastbound truck climbing lane
12 95.08 to 95.78 Beginning Grade, Highland Valley 0.81 to 1.09Solution: Westbound truck climbing lane
12 97.31 to 97.51 7th St. Intersection 0.20 to 0.28Solution: Intersection improvements
12 97.69 to 100.8 SR 7 to Vicinity Priest Road 8.55 to 11.57Solution: Intermittent passing lanes or widen to 4 lanes
12 100.8 to 101.7 Vicinity Priest Road to Vicinity Davis Lake Road 1.03 to 1.39Solution: Eastbound truck climbing lanes or intermittent passing lanes
12 101.5 to 102.6 Priest Road to logging Road 1.25 to 1.69Solution: Westbound truck climbing lanes or intermittent passing lanes
12 102.97 to 105.5 Kosmos Road to Vicinity Wills Road 5.87 to 7.95Solution: Intermittent passing lanes or widen to 4 lanes
12 105.34 to 110.75 Vicinity Wills Road to Kiona Creek Road 6.19 to 8.37Solution: Two-way left-turn channelization
12 110.75 to 114.71 Kiona Creek to Peters Road Vicinity 12.95 to 17.51Solution: Intermittent passing lanes and partial two-way left-turn lane or widen to 4 lanes
12 131.14 to 131.35 Willame St. to Skate Creek Road 0.91 to 1.23Solution: Turn channelization, intersection improvements
12 140.3 to 141.23 Cortwright Creek to U.S. Forest Service Road # 1276 1.73 to 2.33Solution: Extend Eastbound truck climbing lane or intermittent passing lanes
12 146.4 to 147.2 Vicinity Milepost 147 1.86 to 2.52Solution: Eastbound truck climbing lane or intermittent passing lanes
12 149.4 to 151.15 Rest Area Vicinity to Lewis/Yakima County Line 9.24 to 12.50Solution: Needs Further Study - Realignment, widening and 2-way left turn channelization
14 0 to 2.1 I-5 to Marine Park Way Vicinity 23.01 to 31.13Solution: Widen to 6 lanes (GP/HOV)
14 0 to 8.56 I-5 to Southeast 192nd Ave. 1.66 to 2.24Solution: Intelligent Transportation System (Intelligent Transportation System) Communications

Washington State Highway System Plan: 2003-2022 Appendix K – 33February 2002
Appendix K: 20-Year I1 Mobility Strategies
Southwest Region (continued)
Highway Estimate Cost RangeNumber Milepost Vicinity Description ($ in Millions)
"Congested" HSS (continued)14 0 to 8.56 I-5 to Southeast 192nd Ave. 1.86 to 2.52Solution: Intelligent Transportation System (Intelligent Transportation System) Improvements
14 2.1 to 3.76 Marine Park to Evergreen Blvd Westbound off-ramp 18.64 to 25.22Solution: Widen to 6 lanes (GP/HOV)
14 2.63 to 3.69 Evergreen Boulevard Interchange 23.03 to 31.15Solution: Reconstruct Evergreen Blvd. interchange
14 3.76 to 6.23 Evergreen Blvd Westbound Off-Ramp Vicinity to I-205 28.68 to 38.80Solution: Widen to 6 lanes (GP/HOV)
14 4.3 to 4.4 Lieser Road Interchange 6.97 to 9.43Solution: Reconstruct Lieser Road interchange
14 5.52 to 5.62 Ellsworth Road Interchange 5.61 to 7.59Solution: Reconstruct Ellsworth Road interchange
14 6.23 to 8.54 I-205 to 164th Ave. 25.57 to 34.59Solution: Widen to 6 lanes (GP/HOV)
14 8.54 to 12.16 164th Ave. to Northwest 6th Ave. Vicinity 18.47 to 24.99Solution: Widen to 6 lanes, purchase of access rights, frontage roads
14 12.16 to 17.05 Northwest 6th Avenue Vicinity to 32nd Street 16.15 to 21.85Solution: Widen to 4 lanes
14 14.6 to 15.4 SR 500 Vicinity 10.82 to 14.64Solution: SR 14 @ SR 500 - new interchange
14 14.6 to 15.4 SR 500 Vicinity 0.87 to 1.17Solution: Pre-design for new interchange SR 14 @ SR 500
14 15.3 to 16.1 15th Street Vicinity 8.84 to 11.96Solution: SR 14 @ 15th St. - new interchange (partial)
14 16.25 to 17.05 32nd Street Vicinity 11.59 to 15.69Solution: SR 14 @ 32nd St. - new interchange
14 16.25 to 17.05 32nd St. Vicinity 0.87 to 1.17Solution: Pre-design engineering for new interchange
14 17.05 to 18.12 45th St. to Washougal city limits 4.24 to 5.74Solution: Widen to 4 lanes
14 18.12 to 19.90 Washougal city limits to Milepost 19.90 12.09 to 16.35Solution: Intermittent passing lanes or widen to 4 lanes
14 19.9 to 20.84 Vicinity Lawton Creek 2.33 to 3.15Solution: Westbound truck climbing lane
14 20.72 to 26.47 Cape Horn By-pass 0.87 to 1.17Solution: Pre-design for new corridor on new alignment (4 lanes)
14 21.72 to 27.47 Cape Horn By-pass 34.23 to 46.31Solution: New corridor on new alignment (4 lanes)
14 22.7 to 24.2 Marble Road Vicinity to Half Bridge 4.02 to 5.44Solution: Eastbound truck climbing lane
14 24 to 24.8 Vicinity Half Bridge 2.04 to 2.76Solution: Westbound truck climbing lane
14 25.95 to 27.4 Cape Horn Slide Bridge to Prindle Road Vicinity 3.76 to 5.08Solution: Extend Westbound truck climbing lane
14 63.32 to 63.34 Cook-Underwood Road Intersection 0.16 to 0.22Solution: Intersection improvements at Cook-Underwood Road
14 63.52 to 63.54 SR 141 Spur Intersection 0.16 to 0.22Solution: Intersection improvements at SR 141 SPUR
35 0 to 0 Hood River/White Salmon area / I-84 76.98 to 104.16Solution: Needs Further Study - New Columbia River Crossing
97 0 to 1.89 Biggs Rapid Bridge to SR 14 9.86 to 13.34Solution: Widen to 4 lanes
97 0 to 0.49 Biggs Rapid Bridge 39.11 to 52.91Solution: Needs Further Study - Construct a new 4-lane Biggs Rapid bridge
97 0 to 0.49 Biggs Rapid Bridge 0.37 to 0.49Solution: Pre-design engineering for a new 4-lane Biggs Rapid Bridge

Appendix K – 34 Washington State Highway System Plan: 2003-2022 February 2002
Appendix K: 20-Year I1 Mobility Strategies
Southwest Region (continued)
Highway Estimate Cost RangeNumber Milepost Vicinity Description ($ in Millions)
"Congested" HSS (continued)97 1.89 to 2.59 Jct. US 97 and SR 14 0.79 to 1.07Solution: Widen SR 14 to 3 lanes by adding a Westbound-climbing lane
97 1.89 to 1.89 Jct. US 97 and SR 14 13.04 to 17.64Solution: Jct. US 97 and SR 14 - new interchange
97 12.67 to 13.36 SR 142 to state frontage road 1.39 to 1.89Solution: Intermittent passing lanes or widen to 4 lanes
97 14.49 to 21.3 Little Klickitat River to Allen Creek Road 10.90 to 14.74Solution: Intermittent passing lanes or widen to 4 lanes
97 25.4 to 27.2 Brooks Park to Ski Lodge Road Vicinity 4.08 to 5.52Solution: Northbound climbing lane
101 43.07 to 48.16 Weyerhaeuser Road Vicinity Milepost 48 Vicinity 27.40 to 37.08Solution: Intermittent climbing/passing lanes or widen to 4 lanes
101 57.12 to 57.12 Intersection at Port of Willapa 0.16 to 0.22Solution: Intersection improvements
101 59.66 to 60.21 SR 105 to beginning of climbing lane 1.01 to 1.37Solution: Extend Northbound climbing lane, phase 1
101 59.66 to 60.21 SR 105 to beginning of climbing lane 2.01 to 2.71Solution: Intermittent passing lanes or widen to 4 lanes, intersection improvements at SR 105, phase 2
101 60.21 to 60.83 Butte Creek Road Vicinity 0.71 to 0.95Solution: Intermittent passing lanes or widen to 4 lanes
101 60.83 to 62 Butte Creek Road Vicinity to Milepost 62 1.36 to 1.84Solution: Extend Northbound climbing lane, phase 1
101 60.83 to 63.12 Butte Creek Road Vicinity to Smith Creek Road 5.26 to 7.12Solution: Intermittent passing lanes or widen to 4 lanes, phase 2
101 62 to 63.4 Milepost 62 to Smith Creek Road Vicinity 1.55 to 2.09Solution: Southbound climbing lane, phase 1
101 63.12 to 66.35 Smith Creek Road to beg. of climbing lane 13.17 to 17.81Solution: Intermittent passing lanes or widen to 4 lanes, phase 2
101 66 to 67.18 Elk Horn Road Vicinity to Pacific County Line 1.39 to 1.87Solution: Added Northbound climbing lane, phase 1
101 66.35 to 67.18 Elk Horn Road Vicinity to Pacific County Line 2.01 to 2.71Solution: Intermittent passing lanes or widen to 4 lanes, phase 2
205 26.59 to 32.65 Oregon State Line to Northeast 83rd St. 111.01 to 150.19Solution: Multimodal capacity improvements, 83rd St Interchange improvements
205 26.59 to 28.33 Oregon State Line to Mill Plain Blvd. 0.67 to 0.91Solution: Intelligent Transportation System (Intelligent Transportation System) Improvements
205 26.59 to 36.75 Oregon State Line to 134th St. 1.77 to 2.39Solution: Intelligent Transportation System (Intelligent Transportation System) Communication
205 26.59 to 36.75 Oregon State Line to 134th St. 2.64 to 3.58Solution: Intelligent Transportation System (Intelligent Transportation System) Traffic Management Center
205 28 to 28.35 SR 14 to Mill Plain Blvd. Interchange 42.62 to 57.66Solution: I-205/Mill Plain, SR 14/I-205, and SR 14/Mill Plain on- and off-connection improvements
205 28.33 to 28.33 Mill Plain Blvd. Vicinity 14.20 to 19.21Solution: Mill Plain to Northbound I-205 on-connection & Northbound I-205 to 112th off-connection
205 28.33 to 30.9 Mill Plain Blvd. to SR 500 0.51 to 0.69Solution: Intelligent Transportation System (Intelligent Transportation System) Improvements
205 28.83 to 30.37 Southeast 18th St. Vicinity to Burton Road Vicinity 74.59 to 100.91Solution: South portion of 18th/Burton split diamond interchange
205 28.83 to 30.37 Southeast 18th St. Vicinity to Burton Road Vicinity 17.75 to 24.01Solution: North portion of 18th/Burton split diamond interchange
205 30.37 to 32.65 SR 500 to Northeast 83rd St. 19.52 to 26.42Solution: Add lanes from SR 500 to Northeast 83rd, Realign Northbound I-205 (Burton to SR 500)
205 30.85 to 30.95 SR 500 Interchange 23.97 to 32.43Solution: Westbound SR 500 to Southbound I-205 flyover
205 30.85 to 30.95 SR 500 Interchange 18.77 to 25.39Solution: Construct East-West collector distributor

Washington State Highway System Plan: 2003-2022 Appendix K – 35February 2002
Appendix K: 20-Year I1 Mobility Strategies
Southwest Region (continued)
Highway Estimate Cost RangeNumber Milepost Vicinity Description ($ in Millions)
"Congested" HSS (continued)205 30.9 to 36.75 SR 500 to 134th St. 1.27 to 1.71Solution: Intelligent Transportation System (Intelligent Transportation System) Improvements
205 30.95 to 31.11 I-205/Northbound off-ramp to Fourth Plain Blvd. 6.21 to 8.41Solution: I-205 @ Fourth Plain Bvld - new Northbound off-ramp
205 32.65 to 36.44 Northeast 83rd St. to 134th St. 40.17 to 54.35Solution: Widen to 6 lanes (GP/HOV)
432 3.33 to 6 38th Ave. Vicinity to Milepost 6 0.59 to 0.79Solution: Intersection improvements at Prudential Blvd., Washington Way, and Weyerhauser/Norpac entrance
432 6.1 to 7.62 SR 433/Oregon Way to 3rd Ave. 42.23 to 57.13Solution: By-pass route (Phase II)
432 6.1 to 7.62 SR 433/Oregon Way to 3rd Ave. 0.99 to 1.35Solution: Improvements to signal progression, intersection improvements Tennant Way/3rd Ave., Two-way left turn lane, and restriping for left-turn storage at various locations (Phase I)
432 9.58 to 10.26 Cowlitz River Bridge to I-5 Interchange Vicinity 0.00 to 0.00Solution: Intersection improvements - modify Talley Way access (see I-5 MP36.98 to Milepost 37.01)
433 0 to 1.74 Lewis & Clark Bridge 173.79 to 235.13Solution: Bridge replacement
433 0 to 0.54 Lewis & Clark Bridge 1.71 to 2.31Solution: Pre-design engineering for bridge replacement
501 0 to 1.91 I-5 to Fruit Valley Road 19.88 to 26.90Solution: Widen to 6 lanes
"Congested" non-HSS4 11.7 to 12.6 Miller Point Road Vicinity (Svensons Curve) 3.80 to 5.14Solution: Realignment of existing roadway (Svensons Curve)
4 57.75 to 59.26 38th Ave. to Northwest Nicholas Blvd 7.95 to 10.75Solution: Intersection improvements, improvement to parallel route (SR 432)
4 60.88 to 61.19 Washington Way/W Main St to Cowlitz River 4.17 to 5.65Solution: W Main St/Caitlin St. direct connection, intersection improvements, improvement to parallel route (SR 432)
4 60.99 to 61.44 SR 411 spur to Pacific Ave. 15.22 to 20.60Solution: Improvement to parallel route - new Cowlitz River Bridge (Ostrander Road Vicinity)
4 61.44 to 61.44 Pacific Ave./Cowlitz Way Intersection 0.43 to 0.58Solution: Restripe intersection, improvement to parallel route (SR 432)
4 62.1 to 62.88 Three Rivers Dr. to I-5 off/on-ramps 5.19 to 7.03Solution: Kelso Drive intersection and I-5 on/off-ramp improvements, improvement to parallel route (SR 432)
6 0 to 0.19 Jct. US 101 0.34 to 0.46Solution: Widen to 4 lanes with turn channelization
6 20.68 to 21.79 Milepost 21.00 Vicinity 1.15 to 1.55Solution: Eastbound truck climbing lane
6 21.5 to 25.2 Railroad Bridge #006/21 to Rock Creek Bridge 3.56 to 4.82Solution: Realignment & replace bridges w/plate arches for trail
6 44.5 to 45.25 Spooner Road Vicinity 0.94 to 1.27Solution: Eastbound truck climbing lane or intermittent passing lane
6 46.72 to 49.46 Bunker Creek Road to Scheuber Road 6.04 to 8.18Solution: Intermittent passing lanes or widen to 4 lanes
6 50.99 to 51.37 Intersection with I-5 0.00 to 0.00Solution: Reconstruct Interchange (see I-5 Milepost 72.40 to Milepost 78.40)
7 0 to 0.42 US 12 to SR 508 Vicinity 1.33 to 1.81Solution: Two-Way left-turn channelization
7 0.44 to 0.46 SR 508/Main St. 0.56 to 0.76Solution: Intersection improvements
7 0.55 to 3.93 Fairhart Way Vicinity to Nineteen Creek Vicinity 16.88 to 22.84Solution: Intermittent passing lanes and two-way left-turn lane or widen to 4 lanes
101 9.41 to 10.04 US 101 Spur 0.23 to 0.31Solution: Intersection improvement
101 12.88 to 13.38 30th St. to SR 103 2.10 to 2.84Solution: Two-way left-turn channelization
103 0 to 0 Jct. US 101 0.38 to 0.52Solution: Needs Further Study - Install signal

Appendix K – 36 Washington State Highway System Plan: 2003-2022 February 2002
Appendix K: 20-Year I1 Mobility Strategies
Southwest Region (continued)
Highway Estimate Cost RangeNumber Milepost Vicinity Description ($ in Millions)
"Congested" non-HSS (continued)103 1.02 to 1.02 10th St. 0.65 to 0.89Solution: Install roundabout
103 1.39 to 1.39 Bolstad St. 0.08 to 0.10Solution: Intersection improvements
103 2.73 to 10.53 98th Pl. to 256th Pl. 3.77 to 5.11Solution: Widen shoulders
103 4.41 to 4.41 Cranberry Road 0.17 to 0.23Solution: Install Northbound and Southbound left-turn lanes and northbound right-turn lane on SR 103
103 9.35 to 9.35 227th Pl. (Klipsan Road) 0.04 to 0.06Solution: Install Northbound left-turn lane on SR 103
103 11.09 to 11.09 SR 103/Bay Ave. 0.09 to 0.12Solution: Install Northbound right-turn lane on SR 103, and install Westbound left-turn lane on Bay Ave
103 11.21 to 11.86 R St. to Sandridge Road 0.32 to 0.44Solution: Widen shoulders
103 11.86 to 11.86 Bay Ave./ Sandridge Road 0.17 to 0.23Solution: Intersection improvements
141 0.98 to 1.61 Southeast 7th Ave to Jewett Blvd./Garfield Ave. 2.44 to 3.30Solution: Intersection improvements
411 1.67 to 5.8 Allen St. Bridge Vicinity to Lexington 1.55 to 2.09Solution: Install signals and turn lanes at Nevada Drive and Alpha Drive
411 5.77 to 8.12 King Road to Sandy Bend Road 5.37 to 7.27Solution: Intermittent passing lanes or widen to 4 lanes
411 8.12 to 12.01 Sandy Bend Road to PH No. 10 Road 21.00 to 28.41Solution: Intermittent passing lanes or widen to 4 lanes
500 0 to 0.15 SR 500 Westbound to I-5 Northbound 0.00 to 0.00Solution: On-ramp from SR 500 westbound to I-5 Northbound (see SR 5 Milepost 2.35 to Milepost 2.50)
500 0 to 1.12 I-5 to St. John's Road 50.46 to 68.28Solution: Widen to 6 lanes (GP/HOV), I-5/SR500 interchange improvements, enhanced transit
500 0 to 5.97 I-5 to SR 503 1.33 to 1.79Solution: Intelligent Transportation System (Intelligent Transportation System) Communications
500 0 to 5.97 I-5 to SR 503 1.35 to 1.83Solution: Intelligent Transportation System (Intelligent Transportation System) Improvements
500 1.12 to 5.42 St. John's Blvd. to 112th Ave./Gher Road 88.83 to 120.18Solution: Multimodal capacity improvements.
500 4.4 to 4.9 Northeast Fourth Plain Blvd Vicinity to I-205 Vicinity 0.00 to 0.00Solution: Construct East-West collector distributor (GP/HOV) (see SR 205 Milepost 30.85 to Milepost 30.95)
500 5.94 to 6.17 SR 503/Northeast 4th Plain Road Vicinity 8.88 to 12.02Solution: Improvement to parallel route (Padden Parkway), SR 500/SR 503 - reconstruct intersection, left-turn flyover ramp for SR 500 Westbound
500 5.96 to 7.22 SR 503 to Northeast 140th Ave. 5.26 to 7.12Solution: Improvement to parallel route (Padden Parkway), intersection improvements from 121st Ave. to 140th Ave.
500 8.3 to 13.39 Northeast 162nd Ave. to Northeast 39th Street Vicinity 13.29 to 17.99Solution: Widen to 4 lanes
501 16.91 to 17.32 Main St. to Northwest Pioneer Road 1.13 to 1.53Solution: Turn channelization at intersections
501 17.32 to 18.63 Northwest Pioneer Road to Northwest Smythe Road 5.36 to 7.25Solution: Intermittent passing lanes or widen to 4 lanes
501 18.63 to 19.88 Northwest Smythe Road Vicinity to I-5 5.12 to 6.92Solution: Intermittent passing lanes or widen to 4 lanes
502 0.06 to 6.5 179th St to Battle Ground west city limits 20.52 to 27.76Solution: Widen to 4 lanes with two-way left-turn channelization
502 6.5 to 7.56 Battle Ground west city limits to SR 503 0.57 to 0.77Solution: Widen to 4 lanes with turn channelization/access control
503 to Woodland area 0.00 to 0.00Solution: Woodland / I-5 access study (see I-5 Milepost 20.78)
503 0 to 8.09 SR 500 to SR 502/Main St. 45.03 to 60.93Solution: Widen to 6 lanes

Washington State Highway System Plan: 2003-2022 Appendix K – 37February 2002
Appendix K: 20-Year I1 Mobility Strategies
Southwest Region (continued)
Highway Estimate Cost RangeNumber Milepost Vicinity Description ($ in Millions)
"Congested" non-HSS (continued)503 8.09 to 11.61 SR 502/Main St to Northeast 132nd Ave. 9.02 to 12.20Solution: Intermittent passing lanes or widen to 4 lanes
503 8.8 to 11.2 Lewisville Park Vicinity 2.16 to 2.92Solution: Climbing lanes
503 11.61 to 15.98 Northeast 132nd Ave. to County Road #42 6.74 to 9.12Solution: Intermittent passing lanes or widen to 4 lanes
503 52.72 to 54.33 Evergreen Lane to I-5 on-ramp 3.37 to 4.57Solution: Turn channelization
504 0.11 to 0.4 I-5 to Dougherty Road Vicinity 1.67 to 2.27Solution: Widen to 5 lanes
504 2 to 2 Tower Road 0.20 to 0.28Solution: Intersection channelization
504 9.09 to 9.09 Hall Road 0.20 to 0.28Solution: Intersection channelization
504 9.99 to 10.57 Hansen Road Vicinity South Toutle Road 1.21 to 1.63Solution: Two-way left-turn channelization
505 6.32 to 6.38 Ash St. to Hemlock St. 0.92 to 1.24Solution: Intersection improvements and two-way left-turn channelization
505 6.38 to 8.07 Hemlock St. to Hopp Road North 5.36 to 7.25Solution: Intersection improvements
505 8.07 to 17.27 Hopp Road North to Lewis County Line 21.90 to 29.64Solution: Intermittent climbing/passing lanes or widen to 4 lanes
507 0 to 0.95 I-5 to SR 507 Couplet 0.09 to 0.12Solution: Eliminate some parking and add left-turn pockets at Yew St., South. Washington Ave. and South Pearl St.
507 0.95 to 1.87 South. Tower Road to E. Maple St. 1.71 to 2.31Solution: Intersection improvements
507 2.26 to 3.99 6th St. to Downing Road 2.29 to 3.09Solution: Central Blvd truck route
508 0 to 7.57 I-5 to Gheer Creek 16.04 to 21.70Solution: Intermittent passing lanes or widen to 4 lanes, improve intersection
Access Management for Non-Developed Corridors4 6.29 to 15 Upper Nasselle Road to Rosburg Vicinity 3.81 to 5.15Solution: Purchase of access rights
4 16 to 34.97 Hilltop Road Vicinity to Cathlamet 8.31 to 11.25Solution: Purchase of access rights
5 9.52 to 9.52 SR 502 Bridge Vicinity 0.00 to 0.00Solution: Purchase of access rights (Interchange Area)
5 14.21 to 14.21 SR 501 Under-crossing 0.00 to 0.00Solution: Purchase of access rights (Interchange Area)
5 16.8 to 16.8 Northwest La Center Road Under-crossing 0.00 to 0.00Solution: Purchase of access rights (Interchange Area)
5 21.1 to 21.1 SR 503 Bridge Vicinity 0.00 to 0.00Solution: Purchase of access rights (interchange area)
5 22.75 to 22.75 Dike Road Bridge Vicinity 0.00 to 0.00Solution: Purchase of access rights (interchange area)
5 27.71 to 27.71 Todd Road Bridge Vicinity 0.00 to 0.00Solution: Purchase of access rights (interchange area)
5 29.85 to 29.85 Elm St. Bridge Vicinity 0.00 to 0.00Solution: Purchase of access rights (interchange area)
5 35.54 to 54.75 Cathlamet to Coal Creek Slough Bridge Vicinity 8.42 to 11.40Solution: Purchase of access rights
5 36.97 to 36.97 SR 432 Under-crossing Vicinity 0.00 to 0.00Solution: Purchase of access rights (interchange area)

Appendix K – 38 Washington State Highway System Plan: 2003-2022 February 2002
Appendix K: 20-Year I1 Mobility Strategies
Southwest Region (continued)
Highway Estimate Cost RangeNumber Milepost Vicinity Description ($ in Millions)
Access Management for Non-Developed Corridors (continued)5 39.89 to 39.89 SR 4 Bridge Vicinity 0.00 to 0.00Solution: Purchase of access rights (interchange area)
5 40.7 to 40.7 North Kelso Ave Bridge (Old SR431) 0.00 to 0.00Solution: Purchase of access rights (interchange area)
5 42.66 to 42.66 Ostrander Road Under-crossing 0.00 to 0.00Solution: Purchase of access rights (interchange area)
5 46.13 to 46.13 Headquarters Road Under-crossing 0.00 to 0.00Solution: Purchase of access rights (interchange area)
5 47.98 to 47.98 Huntington Ave. Bridge Vicinity 0.00 to 0.00Solution: Purchase of access rights (interchange area)
5 49.84 to 49.84 SR 504 Under-crossing 0.00 to 0.00Solution: Purchase of access rights (interchange area)
5 52.65 to 52.65 Toutle Park Road Under-crossing 0.00 to 0.00Solution: Purchase of access rights (interchange area)
5 57.34 to 57.34 Rogers Road Under-crossing 0.00 to 0.00Solution: Purchase of access rights (interchange area)
5 60.91 to 60.91 SR 506 Under-crossing 0.00 to 0.00Solution: Purchase of access rights (interchange area)
5 63.42 to 63.42 SR 505 Under-crossing 0.00 to 0.00Solution: Purchase of access rights (interchange area)
5 68.41 to 68.41 US 12 Under-crossing 0.00 to 0.00Solution: Purchase of access rights (interchange area)
5 71.05 to 71.05 SR 508 Under-crossing 0.00 to 0.00Solution: Purchase of access rights (interchange area)
5 72.8 to 72.8 Rush Road Bridge Vicinity 0.00 to 0.00Solution: Purchase of access rights (interchange area)
5 76.55 to 76.55 13th Ave. Under-crossing 0.00 to 0.00Solution: Purchase of access rights (interchange area)
5 77.97 to 77.97 SR 6 Vicinity 0.02 to 0.02Solution: Purchase of access rights (interchange area)
5 79.08 to 79.08 Chamber Way Under-crossing 0.00 to 0.00Solution: Purchase of access rights (interchange area)
5 81.68 to 81.68 SR 507 Bridge Vicinity 0.00 to 0.00Solution: Purchase of access rights (interchange area)
5 82.75 to 82.75 Harrison Ave. Bridge Vicinity 0.00 to 0.00Solution: Purchase of access rights (interchange area)
12 66.54 to 83.73 I-5 Bridge Vicinity to Beach Road Vicinity 9.03 to 12.21Solution: Needs Further Study - Purchase of access rights, frontage road
12 105.53 to 134 Wills Road Vicinity to Lake Creek Road Vicinity 12.50 to 16.91Solution: Needs Further Study - Purchase of access rights
14 10.27 to 11.94 Southeast Brady Road WYE Conn. to Northwest 6th Ave. 1.04 to 1.40Solution: Purchase of access rights (frontage road)
14 19.37 to 39.24 Southeast Evergreen Blvd. Vicinity to North. Bonneville 8.50 to 11.50Solution: Purchase of access rights
14 40.67 to 43 Wauna Lake Road Vicinity to Rock Creek Road Vicinity 1.09 to 1.47Solution: Purchase of access rights
14 46 to 49.4 Nelson Creek Road Vicinity to Wind River Vicinity 1.48 to 2.00Solution: Purchase of access rights
14 50.79 to 65 Wind Mtn Road Vicinity to Hood River Bridge Road Vicinity 6.21 to 8.41Solution: Purchase of access rights
14 76.75 to 101.38 Rowena Gap #2 Vicinity to US 97 Vicinity 10.80 to 14.61Solution: Purchase of access rights
97 1.95 to 8.32 SR 14 Intersection South Vicinity to Swallow Creek Vicinity 2.78 to 3.76Solution: Purchase of access rights
97 13.56 to 33.52 State Frontage Road Vicinity to Yakima County Line 8.51 to 11.51Solution: Purchase of access rights

Washington State Highway System Plan: 2003-2022 Appendix K – 39February 2002
Appendix K: 20-Year I1 Mobility Strategies
Southwest Region (continued)
Highway Estimate Cost RangeNumber Milepost Vicinity Description ($ in Millions)
Access Management for Non-Developed Corridors (continued)100 2.95 to 3.56 SR 100 Spur 0.47 to 0.63Solution: Purchase of access rights
101 53.02 to 55.55 South Bend Vicinity to Harrison St. Vicinity 2.22 to 3.00Solution: Purchase of access rights
101 55.76 to 57.01 City of Raymond 1.05 to 1.43Solution: Purchase of access rights
105 5 to 21 Airport Road Vicinity to Smith Anderson Road Vicinity 7.02 to 9.50Solution: Purchase of access rights
197 0 to 3.18 Main Route Vicinity to SR 14 Vicinity 2.77 to 3.75Solution: Purchase of access rights
401 0 to 10.13 US 101 Vicinity to South Valley Road Vicinity 4.44 to 6.00Solution: Purchase of access rights
503 9.35 to 13.72 Northeast 172nd Ave. to Northeast Rock Creek Road 1.90 to 2.56Solution: Purchase of access rights
504 11 to 22.1 Toutle River Bridge Vicinity to private road vicinity 4.85 to 6.57Solution: Purchase of access rights
Urban Bicycle4 45.69 to 57.7 Cowlitz/Wahkiakum County Limits to City 0.00 to 0.00Solution: Needs Further Study-Improve shoulders. (Milepost 45.69 - 57.7)
4 55 to 57.7 Coal Creek Slough Bridge to City 4.02 to 5.44Solution: Improve shoulders for Bike Lane
5 7.24 to 7.24 Northeast 134th St. 2.63 to 3.55Solution: Widening shoulder for bike
5 9.2 to 9.2 179th St. 2.52 to 3.42Solution: Widening shoulder for bike
5 10.7 to 10.7 219th St. 2.13 to 2.89Solution: Widening shoulder for bike
14 0.1 to 0.1 SR 14/I-5 vicinity 1.31 to 1.77Solution: SR 14 Under-crossing at Apple Tree Park
142 12.56 to 13.26 Klickitat School 0.56 to 0.76Solution: Widen shoulders to 4' both sides
205 26.59 to 37.14 Columbia River to Northeast 134th St. 10.80 to 14.62Solution: Bike & Pedestrian path
432 0 to 10.33 SR 4 to I-5 8.51 to 11.51Solution: Bike & Pedestrian path
500 0 to 3.6 I-5 to Andersen Interchange 4.43 to 5.99Solution: Bike & Pedestrian path
500 1.13 to 2.38 St Johns Blvd. to Northeast 54th Ave. 2.26 to 3.06Solution: Widening shoulder for bike
500 1.14 to 1.14 St. Johns Blvd. vicinity 0.01 to 0.01Solution: Improve signing at SR 500 and St. John's Interchange.
500 5.42 to 5.42 Northeast 112th Ave. 1.05 to 1.41Solution: Widening shoulder for bike
500 8.3 to 8.3 Northeast 162nd Ave. 0.06 to 0.08Solution: Widening shoulder for link
503 10.3 to 10.65 Lewisville Park to possible development 0.22 to 0.30Solution: Provide sidewalk on the east side
507 2.26 to 2.35 Pearl St. Bridge vicinity SR 507 0.00 to 0.00Solution: Needs Further Study - Improve bicycle access to the Pearl St. Bridge.

Appendix K – 40 Washington State Highway System Plan: 2003-2022 February 2002

Washington State Highway System Plan: 2003-2022 Appendix K – 41February 2002
Appendix K: 20-Year I1 Mobility Strategies
South Central Region
Highway Estimate Cost RangeNumber Milepost Vicinity Description ($ in Millions)
"Congested" HSS12 185.49 to 190.77 US 12 / SR 410 Intersection south thru Naches 17.71 to 23.95Solution: Widen to 4 lanes, extend existing two-way left turn lane
12 202.54 to 202.63 I-82/US12 Interchange 1.96 to 2.66Solution: Lengthen Eastbound US 12 ramp taper onto Eastbound I-82, provide second lane on Eastbound US 12 ramp
12 295.3 to 299 SR 124 to McNary Pool 6.20 to 8.38Solution: Widen to 4 lanes, channelize Intersection South
12 295.3 to 295.3 SR 124/US 12 Intersection 11.55 to 15.63Solution: Construct SR 12/SR 124 interchange
12 295.3 to 307.66 SR 124 to US 730 44.96 to 60.82Solution: Construct four Interchange's
12 299 to 302.59 McNary Pool to Attalia Vicinity 8.59 to 11.62Solution: Widen to 4 lanes, channelize Intersection South
12 302.59 to 305 Attalia Vicinity 7.13 to 9.65Solution: Widen to 4 lanes, channelize Intersection South
12 305 to 307.66 Attalia Vicinity to US 730 5.92 to 8.02Solution: Widen to four lanes, channelize Intersection
12 307.66 to 335.56 US 730 to Walla Walla 54.81 to 74.15Solution: Widen to 4 lanes, channelize major intersections
12 307.66 to 335.56 US 730 to Walla Walla 55.96 to 75.72Solution: Construct five interchanges
12 355.92 to 358.53 Waitsburg Vicinity 8.35 to 11.29Solution: Construct 2 lane bypass of Waitsburg
12 432.61 to 434.05 SR 128 Intersection South to Bridge St (Clarkston) 0.36 to 0.48Solution: Corridor Study - Needs Further Study
12 432.61 to 434.05 SR 128 Intersection South to Bridge St (Clarkston) 14.21 to 19.23Solution: Widen to four lanes with two-way left turn lane
22 0.7 to 4 I-82 to US 97 22.10 to 29.90Solution: Widen to 4 lanes
82 3.63 to 8.19 Thrall Road to Manastash Ridge 7.68 to 10.40Solution: Construct eastbound truck climbing lane
82 8.19 to 17.34 Manastash Ridge to North Umptanum Ridge 50.62 to 68.48Solution: Widen to 6 lanes
82 17.34 to 26.23 North Umptanum Ridge to Firing Center Interchange 64.07 to 86.69Solution: Widen to 6 lanes
82 29.04 to 31.4 East Selah Interchange to US 12 Interchange 40.15 to 54.31Solution: Widen to 6 lanes
82 31.4 to 33.24 US 12 Interchange to Terrace Heights Way 9.38 to 12.70Solution: Widen to 6 lanes
82 32.72 to 33.24 Fair Avenue Ramps 10.63 to 14.38Solution: Construct two flyover ramps (I-82 to Fair Avenue)
82 33.24 to 34.77 Terrace Heights Way to SR 24 Interchange 2.93 to 3.97Solution: Widen to 6 lanes
82 34.77 to 36.73 SR 24 Interchange to Valley Mall Blvd 6.52 to 8.82Solution: Widen to 6 lanes
82 36.03 to 36.64 Valley Mall Blvd Interchange 9.78 to 13.23Solution: Construct capacity improvements for interchange ramps and crossroad
82 36.73 to 44.32 Valley Mall Blvd to Wapato 45.42 to 61.44Solution: Widen to 6 lanes
82 37.24 to 38.48 South Union Gap Interchange 25.50 to 34.50Solution: Complete interchange - add two ramps: Union Gap to westbound I-82 and eastbound I-82 to Union Gap
90 33.29 to 54.72 Edgewick Road to Hyak 0.43 to 0.58Solution: Capacity improvement - needs further study
90 71.56 to 84.2 Easton to Cle Elum 106.68 to 144.33Solution: Widen to 6 lanes
90 84.2 to 110.87 Cle Elum to Ellensburg 235.18 to 318.18Solution: Widen to 6 lanes

Appendix K – 42 Washington State Highway System Plan: 2003-2022 February 2002
Appendix K: 20-Year I1 Mobility Strategies
South Central Region (continued)
Highway Estimate Cost RangeNumber Milepost Vicinity Description ($ in Millions)
"Congested" HSS (continued)90 90.57 to 92.76 Highline Canal to Elk Heights 3.73 to 5.05Solution: Construct eastbound truck climbing lane
90 125.85 to 136.64 Ryegrass Summit to Vantage 8.59 to 11.62Solution: Construct westbound truck climbing lane
097 133.9 to 134.25 I-90 / US 97 Interchange to SR 10 / US 97 Intersection South 5.09 to 6.89Solution: Add 2 lanes to structure crossing I-90, construct intersection improvements
125 2.48 to 6.09 Walla Walla and College Place - Phase 2 49.08 to 66.40Solution: Widen bypass of Walla Walla and College Place to four lanes, include interchanges
125 2.48 to 6.09 Walla Walla and College Place - Phase 1 6.13 to 8.29Solution: Construct 2 lane bypass of Walla Walla and College Place
125 4.99 to 5.21 Chestnut to Poplar 0.66 to 0.90Solution: Upgrade and coordinate signal system
125 5.41 to 5.77 Rose to Pine St 1.56 to 2.10Solution: Widen to four lanes
182 0 to 1 I-82 / I-182 Interchange 0.85 to 1.15Solution: Needs Further Study - Capacity Study
182 2.58 to 3.44 Queensgate Interchange 0.98 to 1.32Solution: Add loop ramps to interchange, widen under crossing to five lanes
182 2.93 to 6.04 Queensgate Interchange to Columbia River Bridge 40.23 to 54.43Solution: Widen to 6 lanes
182 4.3 to 4.3 Wellsian Way/Aaron Dr/Thayer Ramp 1.56 to 2.10Solution: Improve Westbound ramp and Thayer Intersection South configuration
240 36.05 to 38.71 I-182 to Columbia Center Blvd 41.09 to 55.59Solution: Construct additional lane each direction to provide 6 general-purpose lanes
240 38.71 to 43.17 Columbia Center Blvd to US 395 24.08 to 32.58Solution: Construct additional lane each direction to provide 6 general-purpose lanes
395 13.1 to 20.54 I-82 to I-182 252.26 to 341.30Solution: Needs further study - Widen to six lanes
395 13.1 to 20.54 I-82 to I-182 0.89 to 1.21Solution: Corridor Study
395 18 to 18.32 US 395/SR 240 Interchange 10.66 to 14.42Solution: Re-configure interchange; add additional capacity
395 20.19 to 20.59 I-182 Interchange 7.11 to 9.61Solution: Re-configure interchange; add additional capacity
"Congested" non-HSS14 179.95 to 180.17 Plymouth Road/McNary Court Intersection South 1.57 to 2.13Solution: Construct intersection improvements
24 0 to 0.84 I-82 to Moxee - Phase 1 22.65 to 30.65Solution: Widen to 4 lanes from I-82 to Keys Road, improve I-82/SR 24 Interchange, improve intersections, replace Yakima River Br w/4 lane structure
24 0.84 to 5.73 I-82 to Moxee - Phase 2 15.30 to 20.70Solution: Widen to 4 lanes from Keys Road to Moxee, improve intersections
24 30.76 to 43.79 Benton County Line to Columbia River 16.70 to 22.60Solution: Construct truck-climbing lanes, improve SR 24/240 intersection
124 0 to 0.31 SR 12 Intersection vicinity 2.22 to 3.00Solution: Construct two-way left turn lane from SR 12 to Sunset Drive
223 2.62 to 3.81 Yakima River Bridge to I-82 5.46 to 7.38Solution: Widen to 4 lanes
225 0 to 5 I-82 to River Road vicinity 13.00 to 17.58Solution: Widen roadway and shoulders from Benton City to River Road, includes replacing Yakima River Br
240 20.48 to 21.93 SR 225 Intersection South to Snively Road vicinity 3.64 to 4.92Solution: Widen to four lanes from SR 225 intersection to Snively Road
240 21.93 to 28.83 Snively Road to Stevens Drive 15.30 to 20.70Solution: Widen to four lanes from Snively Road to Stevens Drive
240 32.04 to 32.04 SR 240/SR 224 intersection 8.00 to 10.82Solution: Construct interchange
241 7.52 to 8.49 I-82 to Yakima Valley Highway 1.74 to 2.36Solution: Widen to 4 lanes with two-way left turn lane

Washington State Highway System Plan: 2003-2022 Appendix K – 43February 2002
Appendix K: 20-Year I1 Mobility Strategies
South Central Region (continued)
Highway Estimate Cost RangeNumber Milepost Vicinity Description ($ in Millions)
"Congested" non-HSS (continued)821 0 to 0.7 SR 821 / SR 823 Intersection South to
Solution: Realign intersection - Northbound SR 823 will become the through movement (cost shown on SR 823)
823 1.06 to 1.54 Naches Avenue to North Wenas Road 0.26 to 0.36Solution: Construct two lane alternate route from Fifth Avenue east and north to North Wenas Road (City of Selah)
823 4.24 to 4.74 SR 821 / SR 823 Intersection South 3.73 to 5.05Solution: Realign intersection - Northbound SR 823 will become the through movement
903 0 to 0.19 SR 903 / SR 970 intersection 0.44 to 0.60Solution: Improve I-90/903/970 intersection
903 0 to 5.44 Cle Elum to Roslyn 0.18 to 0.24Solution: Construct new Park & Ride facility near Bullfrog Road/I-90 Interchange
903 0.96 to 2.68 Cle Elum to Roslyn 1.51 to 2.05Solution: Extend existing two-way left turn lane easterly to Floral Avenue, widen roadway from Oakes Avenue to Ranger Station Road, including replacing under width structure
Urban Bicycle12 201.55 to 201.56 16th Ave. Interchange 1.73 to 2.35Solution: Widen structure (BR# 12/344) for bike/bike
12 338.46 to 339.47 Wellington Ave. to Airport Road 0.09 to 0.12Solution: Extend existing pathway
24 0 to 0.84 I-82 to Keys Road 2.15 to 2.91Solution: Widen shoulders for bike/bike
129 40.78 to 40.82 Fleshman Way Structure 1.15 to 1.55Solution: Widen shoulders for bike/bike
224 4.75 to 7.44 West Richland Vicinity 1.16 to 1.58Solution: Widen and pave shoulders. Connect to Keene Road extension
225 0 to 3.71 I-82 to Benton City 0.72 to 0.98Solution: Widen shoulders for bike/bike
240 36.05 to 38.9 George Washington Way to Columbia Center Blvd. 0.00 to 0.00Solution: Widen structure (BR# 240/12) for bike/bike travel and construct separated bike/bike pathway (cost included in capacity improvement project)
240 42.7 to 43.17 SR 240 / US 395 Interchange Vicinity 0.00 to 0.00Solution: Revise Interchange for better bike/bike access (cost and solution included in capacity improvement project)
395 18.59 to 20.54 Columbia River to Court St. Vicinity 0.00 to 0.00Solution: Widen structure crossing Columbia River (BR# 395/40) to provide bike/bike access (Cost and solution included in the US 395 capacity improvement project)

Appendix K – 44 Washington State Highway System Plan: 2003-2022 February 2002

Washington State Highway System Plan: 2003-2022 Appendix K – 45February 2002
Appendix K: 20-Year I1 Mobility Strategies
Eastern Region
Highway Estimate Cost RangeNumber Milepost Vicinity Description ($ in Millions)
"Congested" HSS2 263.44 to 266.86 Reardan to Spokane County line 3.99 to 5.39Solution: Additional lanes
2 266.86 to 272.56 Spokane County Line to Deep Creek 3.99 to 5.39Solution: Additional lanes
2 272.56 to 275.35 Deep Creek to Fairchild Air Force Base 14.82 to 20.04Solution: Additional lanes
2 275.35 to 277.22 Fairchild Air Force Base to Craig Road 2.64 to 3.58Solution: Additional lanes.
2 278.21 to 281.22 Russell St. to Spotted Road 2.21 to 2.99Solution: Additional lanes.
2 286.67 to 295.65 I-90 to Wandermere Vicinity 1,062.50 to 1,437.50Solution: New limited access facility (US 395 North Spokane Corridor)
2 286.93 to 289.7 3rd Avenue to Garland 0.14 to 0.20Solution: Intelligent Transportation System
2 290.18 to 292.95 Wellesley Ave. to Division (US 395) Wye 0.88 to 1.20Solution: Intelligent Transportation System
2 297 to 298.48 Deer Road to Day-Mt. Spokane Road 9.35 to 12.65Solution: Intersection improvements
2 306.09 to 312.02 Bear Lake vicinity to Eloika Road 22.19 to 30.02Solution: Additional lanes
2 312.02 to 314.93 Eloika Road to 2 lane divided 4.43 to 5.99Solution: Additional lanes
20 302.1 to 305.5 SR 21 (Republic) to SR 21 5.94 to 8.04Solution: Additional lanes; SR 21(Republic) to SR 21.
90 270.29 to 270.29 Four Lakes Interchange 7.11 to 9.61Solution: Interchange improvements
90 273.19 to 275.93 SR 902 Interchange to Geiger Interchange 14.36 to 19.42Solution: Additional lanes; Intelligent Transportation System.
90 276.76 to 277.26 Geiger Interchange to US 2 interchange 4.11 to 5.55Solution: Additional lanes; Intelligent Transportation System.
90 277.26 to 281.33 US 2 Interchange to Liberty Park interchange 425.00 to 575.00Solution: Additional lanes; CBD ramp/arterial improvements.
90 279.34 to 279.55 US 195 Interchange 24.85 to 33.63Solution: Interchange revision.
90 281.71 to 282.48 Liberty Park Interchange 20.41 to 27.61Solution: Revise interchange.
90 282.48 to 283.45 Liberty Park Interchange to Thor/Freya Interchange 127.50 to 172.50Solution: US 395 North Spokane Corridor Collector-Distributor
90 283.45 to 284.17 Thor/Freya Interchanges 15.98 to 21.62Solution: US 395 North Spokane Corridor Collector-Distributor; interchange improvements.
90 284.17 to 287.88 Thor/Freya to Argonne Road interchange 7.98 to 10.80Solution: Additional Lanes
90 287.88 to 289.86 Argonne Road Interchange to Pines Road Interchange 13.31 to 18.01Solution: Additional Lanes
90 289.86 to 291.92 Pines Road Interchange to Sullivan Road Interchange 16.86 to 22.80Solution: Additional lanes and Intelligent Transportation System.
90 291.92 to 296.19 Sullivan Road Interchange to Harvard Road Interchange 33.74 to 45.64Solution: Additional lanes; Intelligent Transportation System.
90 296.19 to 299.82 Harvard Road Interchange to Idaho State Line 7.09 to 9.59Solution: Additional lanes; Intelligent Transportation System.
195 22.61 to 35.01 SR 270 to Parvin Road 10.65 to 14.41Solution: Additional lanes
195 37.63 to 47.99 Colfax (Golgotha St.) to SR 23 11.08 to 15.00Solution: Additional lanes
195 37.63 to 47.99 SR 23 to SR 271 15.08 to 20.40Solution: Additional lanes

Appendix K – 46 Washington State Highway System Plan: 2003-2022 February 2002
Appendix K: 20-Year I1 Mobility Strategies
Eastern Region (continued)
Highway Estimate Cost RangeNumber Milepost Vicinity Description ($ in Millions)
"Congested" HSS (continued)195 62.33 to 78.94 SR 271 to Cheney-Spangle Road 17.75 to 24.01Solution: Additional lanes
195 91.17 to 95.55 Hatch Road to 16th Ave. 38.17 to 51.65Solution: Interchange construction, grade separation and construct city arterial.
195 95.55 to 95.81 16th Ave. to I-90 interchange ramp merge 6.21 to 8.40Solution: Construct city arterial
270 2.27 to 3.43 SR 27 to Bishop Blvd.; Pullman 79.04 to 106.94Solution: Additional lanes on SR 27; proposed Pullman Bypass (SR 276)
270 4.5 to 9.89 Airport Road to Idaho State Line 17.75 to 24.01Solution: Additional lanes
395 164.5 to 169.14 Division Wye to Hatch Road toSolution: US 395 North Spokane Corridor; Intelligent Transportation System.
395 172.09 to 176.92 Milepost 172.09 to Hamilton Road 12.86 to 17.40Solution: Additional lanes
395 176.32 to 176.32 Dennison-Chattaroy Road 8.87 to 11.99Solution: Interchange construction.
395 176.92 to 184 Hamilton Road to Montgomery Road (Milepost 184) 26.63 to 36.03Solution: Additional lanes
395 178.7 to 180.46 Deer Park vicinity. 17.75 to 24.01Solution: Construction of 2 interchanges.
395 184 to 188.86 Montgomery Road to Loon Lake 21.93 to 29.67Solution: Additional lanes
395 188.86 to 229.71 Loon Lake to 4th Ave. (Colville) 107.47 to 145.39Solution: Additional lanes; couplet in Chewelah.
395 232.95 to 241.61 Spanish Prairie Road to Ferry County line 39.95 to 54.05Solution: Additional lanes
"Congested" non-HSS25 75.44 to 81.07 Nichols Road to US 395 (Kettle Falls) 5.95 to 8.05Solution: Add passing lane
027 0.13 to 0.74 Whitman St. to Stadium Way 0.00 to 0.00Solution: New facility, proposed Pullman bypass (SR 276); funding shown under SR 270
027 0.74 to 1.59 Stadium Way to Pullman city limits 0.00 to 0.00Solution: New facility, proposed Pullman bypass (SR 276); funding shown under SR 270
027 1.26 to 0.13 Bishop Blvd. To Whitman St. 0.00 to 0.00Solution: New facility, proposed Pullman bypass (SR 276); funding shown under SR 270
027 79.3 to 83.15 Dishman-Mica Road to 32nd 4.44 to 6.00Solution: Additional lanes
027 85.45 to 86.72 Mission Ave. to Montgomery Ave. 1.33 to 1.79Solution: Pines Road Mitigation Project (Intersection capacity improvements)
027 86.72 to 87.7 Montgomery to SR 290 0.44 to 0.60Solution: Pines Road Mitigation Project (Intersection capacity improvements)
290 0 to 2.06 US 2 to Regal Ave. 17.77 to 24.04Solution: Add center left turn lane.
290 0.74 to 1.41 SR 290 Spur Hamilton 34.00 to 46.00Solution: Add lanes
290 2.06 to 3.34 Regal Ave. to Mission Ave. 15.99 to 21.63Solution: Add center left turn lane.
290 3.34 to 4.29 Mission Ave. to Fancher Ave. 15.10 to 20.42Solution: Add center turn lane.
290 10.71 to 12.5 Sullivan Road to Barker Road 15.30 to 20.70Solution: Additional Lanes
290 12.5 to 14.63 Barker Road to Harvard Road 3.78 to 5.12Solution: Additional lanes.
291 0 to 2.3 US 2 (Division St.) to G Street 4.68 to 6.34Solution: Intersection improvements; Intelligent Transportation System.
291 7.53 to 11.07 Ridgecrest Road to Stevens County Line 23.98 to 32.44Solution: New facility; 9 Mile Bypass Route

Washington State Highway System Plan: 2003-2022 Appendix K – 47February 2002
Appendix K: 20-Year I1 Mobility Strategies
Eastern Region (continued)
Highway Estimate Cost RangeNumber Milepost Vicinity Description ($ in Millions)
"Congested" non-HSS (continued)291 11.07 to 14.31 Stevens County line to Suncrest Vicinity 9.77 to 13.21Solution: New facility; 9 Mile Bypass Route
902 3.86 to 12.32 Lakeland Village to SR 902 Interchange 8.43 to 11.41Solution: Additional lanes
904 12.56 to 16.81 Betz Road to Four Lakes Interchange 15.54 to 21.02Solution: Additional lanes
Access Management for Developed Corridors2 277.22 to 278.21 City of Airway Heights 0.85 to 1.15Solution: Purchase access rights.
2 278.21 to 279.23 City of Airway Heights 0.87 to 1.17Solution: Purchase access rights.
2 286.93 to 291.18 3rd Ave. to Francis Ave. 9.21 to 12.47Solution: Purchase access rights.
2 291.18 to 291.86 Francis Ave. to Cozza Dr. 1.45 to 1.97Solution: Purchase access rights.
2 291.86 to 294.1 Cozza Dr. to Nevada St. 4.85 to 6.56Solution: Purchase access rights.
2 297 to 298.48 Deer Road to Day -Mt. Spokane Road 7.65 to 10.35Solution: Purchase Access Rights
20 354.33 to 355.12 US 395 to Colville East of City Limits 0.67 to 0.91Solution: Purchase access rights.
25 113.06 to 113.95 City of Northport 0.75 to 1.01Solution: Purchase access rights.
26 133.25 to 133.53 City of Colfax 0.23 to 0.31Solution: Purchase access rights.
27 0 to 0.74 SR 270 to Stadium Way 0.14 to 0.20Solution: Purchase access rights.
27 0.09 to 1.19 City of Pullman 0.94 to 1.27Solution: Purchase access rights.
27 0.74 to 1.61 Stadium Way to Pullman North of City Limits 0.73 to 0.99Solution: Purchase access rights.
27 1.19 to 1.35 Pullman-Cemetery Road to City St. 0.12 to 0.16Solution: Purchase access rights.
27 1.35 to 2.27 Pullman-City St. to SR 270 0.79 to 1.07Solution: Purchase access rights.
27 83.15 to 84.43 32nd Ave. to 16th Ave. (Spokane) 2.77 to 3.75Solution: Purchase access rights.
27 84.43 to 86.49 16th Ave. to Mission Ave. 4.45 to 6.03Solution: Purchase access rights.
27 86.63 to 87.7 I-90 Over-crossing to SR 290 2.30 to 3.12Solution: Purchase access rights.
195 36.91 to 38.6 City of Colfax 1.45 to 1.96Solution: Purchase access rights.
270 0.7 to 5.63 City of Pullman 4.27 to 5.77Solution: Purchase access rights.
272 0 to 0.15 City of Colfax 0.11 to 0.15Solution: Purchase access rights.
272 0.15 to 0.52 Colfax East of City Limits 0.30 to 0.40Solution: Purchase access rights.
272 0.52 to 1.17 Colfax East of City Limits 0.54 to 0.74Solution: Purchase access rights.
272 16.12 to 17.63 City of Palouse 1.30 to 1.76Solution: Purchase access rights.
274 0 to 0.45 City of Tekoa 0.37 to 0.49Solution: Purchase access rights.
278 0 to 1.09 City of Rockford 0.92 to 1.24Solution: Purchase access rights.

Appendix K – 48 Washington State Highway System Plan: 2003-2022 February 2002
Appendix K: 20-Year I1 Mobility Strategies
Eastern Region (continued)
Highway Estimate Cost RangeNumber Milepost Vicinity Description ($ in Millions)
Access Management for Developed Corridors (continued)290 0 to 0.8 Division Street to SR 290 Spur 1.47 to 1.99Solution: Purchase access rights.
290 0.8 to 1.58 Hamilton St. to Lee St. 1.67 to 2.27Solution: Purchase access rights.
290 1.58 to 4.31 Lee St. to Spokane East of City Limits 5.92 to 8.00Solution: Purchase access rights.
290 4.31 to 6.35 Spokane East of City Limits to Argonne Road 4.43 to 5.99Solution: Purchase access rights.
291 0 to 3.64 Division St. to Woodside St. 7.90 to 10.68Solution: Purchase access rights.
291 3.64 to 4.6 Woodside St. to Spokane City Limits 2.07 to 2.79Solution: Purchase access rights.
395 164.51 to 164.96 North. Division Wye to Westview Ave. 0.96 to 1.30Solution: Purchase access rights.
395 164.96 to 166.6 City of Spokane to Hastings Road 3.54 to 4.80Solution: Purchase access rights.
395 206.7 to 207.72 City of Chewelah 0.87 to 1.17Solution: Purchase access rights.
395 228.43 to 230.91 City of Colville 2.13 to 2.89Solution: Purchase access rights.
395 237.85 to 238.96 City of Kettle Falls 0.94 to 1.28Solution: Purchase access rights.
904 9.12 to 12.22 City of Cheney 2.67 to 3.61Solution: Purchase access rights.
Access Management for Non-Developed Corridors2 to Deer Road to Day -Mt. Spokane Road 7.65 to 10.35Solution:Purchase additional access rights.
2 266.86 to 277.22 Lincoln County Line to Airway Heights 2.24 to 3.02Solution: Purchase access rights.
2 279.23 to 281.62 Airway Heights to Russell Road 0.50 to 0.68Solution: Purchase access rights.
20 355.12 to 355.95 Colville East of City Limits to Degrief Road Vicinity 0.16 to 0.22Solution: Purchase access rights.
25 0 to 0.17 US 2 to Davenport North of City Limits 0.07 to 0.09Solution: Purchase access rights.
25 85.87 to 86.46 Marcus 0.50 to 0.68Solution: Purchase access rights.
195 40.51 to 44.4 Colfax north to Dry Creek 0.82 to 1.12Solution: Purchase access rights.
206 0.03 to 0.61 Market St. to Lowe Road 0.11 to 0.15Solution: Purchase access rights.
231 31.08 to 31.41 City of Reardon 0.26 to 0.36Solution: Purchase access rights.
270 0.12 to 0.7 US 195 to Pullman 0.11 to 0.15Solution: Purchase access rights.
270 5.75 to 9.89 Pullman to Idaho State Line 0.87 to 1.17Solution: Purchase access rights.
290 6.35 to 10.29 Argonne Road to Sullivan Road 8.55 to 11.57Solution: Purchase access rights.
290 10.29 to 18.38 Sullivan Road to Idaho State Line 1.73 to 2.35Solution: Purchase access rights.
291 4.6 to 8 Spokane City Limits to Nine Mile Falls 0.71 to 0.97Solution: Purchase access rights.
291 8 to 9.64 Nine Mile Falls Vicinity 1.41 to 1.91Solution: Purchase access rights.
291 9.64 to 11.17 Nine Mile Falls to Stevens County Line 0.31 to 0.41Solution: Purchase access rights.

Washington State Highway System Plan: 2003-2022 Appendix K – 49February 2002
Appendix K: 20-Year I1 Mobility Strategies
Eastern Region (continued)
Highway Estimate Cost RangeNumber Milepost Vicinity Description ($ in Millions)
Access Management for Non-Developed Corridors (continued)291 19.82 to 22.3 Tum Tum Vicinity 2.13 to 2.89Solution: Purchase access rights.
292 5.04 to 5.91 Loon Lake 0.73 to 0.99Solution: Purchase access rights.
395 172 to 176.92 Milepost 172 to Hamilton Road 1.05 to 1.43Solution: Purchase access rights.
395 230.91 to 237.85 Colville to Kettle Falls 1.49 to 2.01Solution: Purchase access rights.
395 238.96 to 239.4 Kettle Falls to SR 25 0.08 to 0.10Solution: Purchase access rights.
902 0 to 4.05 I-90 to Medical Lake South of City Limits 0.87 to 1.17Solution: Purchase access rights.
902 4.05 to 7.21 City of Medical Lake 2.73 to 3.69Solution: Purchase access rights.
902 7.21 to 12.13 Medical Lake to I-90 1.05 to 1.43Solution: Purchase access rights.
904 0.09 to 9.12 I-90 to Cheney West of City Limits 1.94 to 2.62Solution: Purchase access rights.
904 12.22 to 16.38 Cheney to Four Lakes 0.88 to 1.20Solution: Purchase access rights.
904 16.38 to 16.96 Four Lakes 0.26 to 0.36Solution: Purchase access rights.
Urban Bicycle027 86.61 to 86.63 SR 27 Over-crossing of I-90 0.47 to 0.63Solution: Widen Pines Road (SR 27) structure to accommodate bikes
90 275.93 to 299.82 I-90 in Spokane 0.43 to 0.58Solution: Bike Route Signing, I-90 to Centennial Trail
90 283.73 to 283.85 Thor/Freya Under-crossing 0.96 to 1.30Solution: Widen under crossing structures
195 94.3 to 94.3 Inland Empire Highway 0.00 to 0.00Solution: Needs Further Study - S3 Crossing Improvement.
395 157.23 to 167.63 North Spokane Corridor 2.56 to 3.46Solution: Construct bike/pedestrian path adjacent to North Spokane Corridor.

Appendix K – 50 Washington State Highway System Plan: 2003-2022 February 2002

Appendix K: 20-Year Improvement Strategies
Safety Strategies
The strategies listed in this section describe the improvements that are needed to meet thesafety objectives for the next 20 years, from 2003-2022. It is important to note that theseare planning strategies and that the project scope will be refined during the programmingand design phases.
Safety strategies were previously categorized into collision reduction and collisionprevention improvements. This update of the HSP has changed this categorization byincorporating Collision Reduction strategies into a statewide program category.
0
20
40
60
80
100
120
140
160
180
200
$0
$50
$100
$150
$200
$250
Northwest North Olympic Southwest South EasternRegion Central Region Region Central Region
Region Region
Northwest North Olympic Southwest South EasternRegion Central Region Region Central Region
Region Region
Safety Improvement SubprogramNumber of Strategies by Region
Safety Improvement SubprogramEstimated $ Cost in Millions by Region (2001 Dollars)
Washington State Highway System Plan: 2003-2022 Appendix K – 51: Safety StrategiesFebruary 2002

Appendix K – 522 Washington State Highway System Plan: 2003-2022 February 2002

Washington State Highway System Plan: 2003-2022 Appendix K - 53February 2002
Appendix K: 20-Year I2 Safety Strategies
Northwest Region
Highway Estimate Cost RangeNumber Milepost Vicinity Description ($ in Millions)
At Grade Intersections20 47.89 to 50.84 Sharpe's Corner to Swinomish Slough Bridges 36.34 to 49.16Solution: Construct new interchanges, two grade separations. Improvements to local roads.
20 51.51 to 54.89 Swinomish Slough Bridges to SR 536 18.74 to 25.36Solution: One new interchange, one grade separation, and improvements to local roads.
516 3.56 to 3.59 Reith Road and Meeker Street 5.86 to 7.92Solution: Grade separation.
900 7.71 to 8.37 South 129th Street to just west of South 135th Street 1.44 to 1.94Solution: Grade separated intersection
Risk Reduction2 18.24 to 18.37 Between 245th Avenue Southeast and Fern Bluff Road 0.02 to 0.02Solution: Install guardrail, add 2 signs, and relocate utility poles.
2 31.73 to 32.99 Milepost 31.73 to Milepost 32.99 (east of Gold Bar) 3.94 to 5.34Solution: Realign horizontal and vertical curves.
2 33.45 to 34.08 U.S. Forest Service Road #62 (West of Anderson Creek) 1.15 to 1.55Solution: Widen shoulders and install guardrail.
2 34.19 to 34.65 Anderson Creek vicinity 1.05 to 1.43Solution: Widen shoulders, replace bridge 2/39 and clear zone (remove rocks and trees).
2 34.85 to 35 East of Anderson Creek 0.26 to 0.36Solution: Realign horizontal and vertical curves.
2 35.12 to 35.21 Mt. Index Road to South Fork Skykomish River 0.08 to 0.10Solution: Left turn pocket at Milepost 35.16.
2 35.36 to 36.16 Index-Galena Road vicinity 1.56 to 2.12Solution: Realign horizontal and vertical curves.
2 36.34 to 37.54 Between Railroad Bridges 1.05 to 1.43Solution: Widen Westbound shoulders and add concrete barrier for 2000'.
2 37.76 to 38.61 Just west of Railroad Bridge 0.06 to 0.08Solution: Concrete barrier to protect rock wall (0.4 mile).
2 39.12 to 39.38 Eagle Falls Creek and Barclay Creek) 0.00 to 0.00Solution: Advisory signs.
2 43.72 to 44.42 Milepost 43.72 to Milepost 44.42 (east of Baring) 0.94 to 1.27Solution: Realign horizontal curve (0.4 mile), replace bridge 2/106, and install 1000' of guardrail.
2 54.84 to 55.16 Milepost 54.84 to Milepost 55.16 (east of Skykomish) 0.02 to 0.02Solution: Install 700' of guardrail.
2 56.02 to 56.43 West of Deception Creek 0.02 to 0.02Solution: Install 500' of guardrail Eastbound and Westbound.
9 16.06 to 19.7 Vernon Road to just north of SR 528 0.03 to 0.03Solution: Install guardrail for 0.4 mile, Eastbound.
9 20.25 to 20.56 84th Street Northeast vicinity 0.01 to 0.01Solution: Install guardrail (0.25 mile), Eastbound.
9 29.94 to 29.98 Just north of Stillaguamish River Bridge 0.05 to 0.07Solution: Widen shoulders.
9 30.39 to 30.59 Schloman Road and Lake Armstrong Road 0.33 to 0.45Solution: Widen shoulders and relocate utility poles.
9 30.7 to 31.65 South of Lake Armstrong Road to 252nd St Northeast 0.17 to 0.23Solution: Realign horizontal curve (0.1 mile), relocate utility poles.
9 49.75 to 49.81 Milepost 49.75 to Milepost 49.91 0.11 to 0.15Solution: Widen shoulders.
9 49.89 to 49.99 Milepost 49.89 to Milepost 49.99 0.43 to 0.58Solution: Widen Bridge 9/210, realign horizontal curve (0.1 mile) and relocate utility poles.
9 50.07 to 50.16 Milepost 50.07 to Milepost 50.16 0.20 to 0.26Solution: Realign horizontal curve (0.1 mile) and add 200' of guardrail.
9 50.22 to 50.47 Milepost 50.22 to Milepost 50.47 0.46 to 0.62Solution: Widen shoulders, add guardrail.
9 50.93 to 51.11 Milepost 50.03 to Milepost 51.11 0.13 to 0.17Solution: Realign vertical curve (900') and widen shoulders for (0.18 mile).
9 51.25 to 51.36 Milepost 51.25 to Milepost 51.36 0.10 to 0.14Solution: Widen Westbound shoulders.

Appendix K – 54 Washington State Highway System Plan: 2003-2022 February 2002
Appendix K: 20-Year I2 Safety Strategies
Northwest Region (continued)
Highway Estimate Cost RangeNumber Milepost Vicinity Description ($ in Millions)
Risk Reduction (continued)9 51.42 to 51.74 Milepost 51.42 to Milepost 51.74 0.61 to 0.83Solution: Realign horizontal curves and install guardrail.
9 51.81 to 51.97 Milepost 51.81 to Milepost 51.97 0.28 to 0.38Solution: Widen shoulders.
9 52.02 to 52.14 Milepost 52.02 to Milepost 52.14 0.21 to 0.29Solution: Widen shoulders.
9 52.4 to 52.43 Milepost 52.40 to Milepost 52.43 0.05 to 0.07Solution: Widen shoulders.
9 52.52 to 52.58 Milepost 52.52 to Milepost 52.58 0.11 to 0.15Solution: Widen shoulders.
9 52.95 to 52.99 Milepost 52.95 to Milepost 52.99 0.08 to 0.10Solution: Realign horizontal curve (0.04 mile).
9 53.16 to 53.24 Milepost 53.16 to Milepost 53.24 0.15 to 0.21Solution: Realign horizontal curve (0.08 mile).
9 53.47 to 53.5 Milepost 53.47 to Milepost 53.50 0.05 to 0.07Solution: Widen shoulders.
9 58.4 to 59.07 Milepost 58.40 to Milepost 59.07 1.25 to 1.69Solution: Widen shoulders and add guardrail.
9 59.53 to 59.65 Milepost 59.53 to Milepost 59.65 0.29 to 0.39Solution: Realign vertical curve, widen shoulders, and relocate utility poles.
9 60.33 to 60.63 Milepost 60.33 to Milepost 60.63 0.01 to 0.01Solution: Install 500' of guardrail and relocate utility poles.
9 60.63 to 60.66 Milepost 60.63 to Milepost 60.66 0.06 to 0.08Solution: Realign horizontal curve.
9 61.33 to 61.49 Milepost 61.33 to Milepost 61.49 0.48 to 0.64Solution: Fill ditch, widen shoulders and install guardrail.
9 63.12 to 63.39 Milepost 63.12 to Milepost 63.39 0.50 to 0.68Solution: Widen shoulders.
9 64.87 to 65.32 Milepost 64.87 to Milepost 65.32 0.83 to 1.13Solution: Widen shoulders and relocate utility poles.
9 66.05 to 66.37 Milepost 66.05 to Milepost 66.37 0.78 to 1.06Solution: Widen shoulders and realign horizontal curve (0.1 mile).
9 66.6 to 66.69 Milepost 66.60 to Milepost 66.69 0.16 to 0.22Solution: Widen shoulders, install guardrail and relocate utility poles.
9 66.95 to 67.85 Milepost 66.95 to Milepost 67.85 1.67 to 2.25Solution: Widen shoulders and install guardrail.
9 84.71 to 84.77 Milepost 84.71 to Milepost 84.77 0.04 to 0.06Solution: Widen shoulders and relocate utility poles.
9 91.87 to 91.91 Milepost 91.87 to Milepost 91.91 0.41 to 0.55Solution: Widen shoulders, realign horizontal curve (0.2 mile) and relocate utility poles.
9 93.04 to 93.17 Milepost 93.04 to Milepost 93.17 0.27 to 0.37Solution: Widen shoulders, realign horizontal curve (0.1 mile) and relocate utility poles.
9 93.61 to 93.63 Milepost 93.61 to Milepost 93.63 0.02 to 0.02Solution: Widen shoulders.
9 94.57 to 94.88 Milepost 94.57 to Milepost 94.88 0.59 to 0.79Solution: Widen shoulders and realign horizontal curve (0.2 mile).
9 96.54 to 96.68 Milepost 96.54 to Milepost 96.68 0.28 to 0.38Solution: Widen shoulders, realign horizontal curve (0.1 mile) and relocate utility poles.
18 20.24 to 21.38 Issaquah-Hobart Road interchange vicinity 1.05 to 1.41Solution: Widen Eastbound shoulders and install guardrail.
18 21.57 to 21.86 East of Issaquah-Hobart Road 0.29 to 0.39Solution: Widen Eastbound shoulders.
18 22.01 to 22.84 East of Issaquah-Hobart Road 1.22 to 1.64Solution: Widen shoulders and install guardrail.
18 23.82 to 26.81 East of Issaquah-Hobart Road 3.95 to 5.35Solution: Widen Eastbound and median shoulders, flatten vertical curve.

Washington State Highway System Plan: 2003-2022 Appendix K - 55February 2002
Appendix K: 20-Year I2 Safety Strategies
Northwest Region (continued)
Highway Estimate Cost RangeNumber Milepost Vicinity Description ($ in Millions)
Risk Reduction (continued)20 25.21 to 25.4 Milepost 25.21 to Milepost 25.40 0.38 to 0.52Solution: Realign horizontal curve (0.2 mile).
20 25.58 to 26.53 Milepost 5.58 to Milepost 26.53 1.96 to 2.65Solution: Realign horizontal curves.
20 26.65 to 26.91 Milepost 26.65 to Milepost 26.91 0.49 to 0.67Solution: Realign horizontal curve.
20 27.24 to 27.56 Milepost 27.24 to Milepost 27.56 0.00 to 0.00Solution: Culvert end treatments.
20 29.62 to 30.21 Milepost 29.62 to Milepost 30.21 0.48 to 0.66Solution: Realign vertical curve.
20 30.31 to 30.39 Milepost 30.31 to Milepost 30.39 0.00 to 0.00Solution: Warning signs (4).
20 35.25 to 35.57 Milepost 35.25 to Milepost 35.57 0.01 to 0.01Solution: Extend guardrail (0.1 mile).
20 35.8 to 36.42 Milepost 35.80 to Milepost 36.42 0.01 to 0.01Solution: Add guardrail (0.1 mile).
20 36.42 to 40.97 Milepost 36.42 to Milepost 40.97 0.00 to 0.00Solution: Programmed project to improve safety features and realign Troxel Td. I/South Ad date of 3/96
20 42.14 to 47.84 Milepost 42.00 to Milepost 42.04 0.00 to 0.00Solution: Realignment. Solution: contained in Systems Plan mobility estimates.
20 64.92 to 65.01 Milepost 64.92 to Milepost 65.01 0.02 to 0.02Solution: Concrete barrier (0.1 mile).
20 69.91 to 69.93 Milepost 69.91 to Milepost 69.93 0.03 to 0.03Solution: Realign horizontal curve and install guardrail.
20 90.47 to 90.52 Milepost 90 .47 to Milepost 90.52 0.04 to 0.06Solution: Realign vertical curve and install guardrail for 300 feet.
20 91.43 to 91.61 Milepost 91.43 to 91.61 0.03 to 0.05Solution: Install guardrail and address clear zone.
20 92.51 to 93.06 Milepost 92.51 to Milepost 93.06 0.97 to 1.31Solution: Realign horizontal curve (0.5 mile), add concrete barrier (300') and install guardrail (500').
99 26.29 to 26.32 Duwamish River bridge vicinity 0.01 to 0.01Solution: Install two warning signs.
104 29.79 to 29.84 I- 5 Northbound ramps to Ballinger Way 0.01 to 0.01Solution: 50' of barrier/guardrail to protect sign structure, Milepost 29.80-29.81.
104 31.24 to 31.86 35th Avenue Northeast to 40th Place Northeast 1.16 to 1.56Solution: Realign horizontal curves.
164 2.91 to 3.05 Poplar Street vicinity 0.00 to 0.00Solution: Relocate utility poles.
164 5.98 to 6.09 Southeast 380th Place vicinity 0.01 to 0.01Solution: Two Advisory speed signs.
164 6.35 to 6.65 West of 158th Avenue Southeast 0.00 to 0.00Solution: Relocate utility poles.
164 6.99 to 7.19 Southeast 392nd Street vicinity 0.01 to 0.01Solution: Add 200' of guardrail.
164 8.8 to 9.25 180th Avenue Southeast vicinity 0.39 to 0.53Solution: Restore shoulders (0.23 mile).
164 12.88 to 13.11 Southeast 436th Street to 241st Place. Southeast 0.01 to 0.01Solution: Add 300' of guardrail.
169 4.22 to 4.87 Milepost 4.22 to Milepost 4.87 (west of Green River) 0.02 to 0.02Solution: Add 800' of guardrail.
169 7.01 to 7.57 Plass Road to Lawson Street 0.01 to 0.01Solution: Guardrail end treatments.
169 8.04 to 8.31 Railroad Avenue to Ravensdale Road 0.48 to 0.64Solution: Widen shoulders and install guardrail.
181 9.43 to 9.67 Milepost 9.43 to Milepost 9.67 (north of Todd Blvd.) 0.14 to 0.20Solution: Widen shoulders.
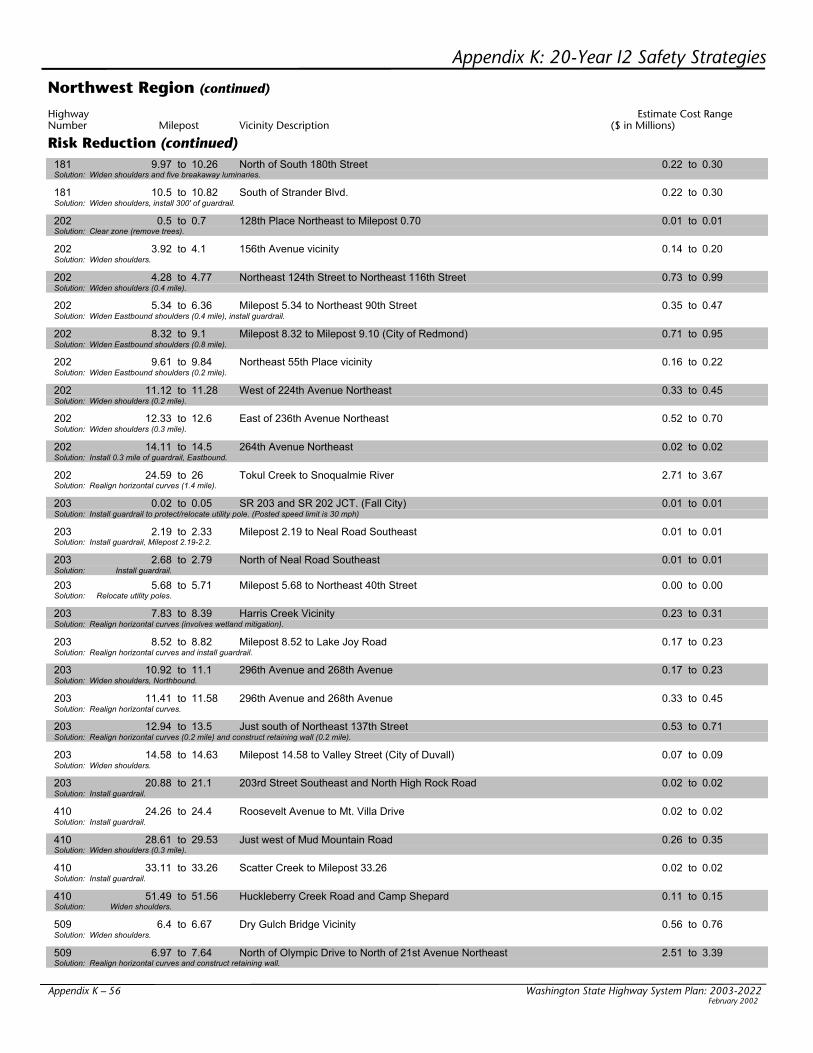
Appendix K – 56 Washington State Highway System Plan: 2003-2022 February 2002
Appendix K: 20-Year I2 Safety Strategies
Northwest Region (continued)
Highway Estimate Cost RangeNumber Milepost Vicinity Description ($ in Millions)
Risk Reduction (continued)181 9.97 to 10.26 North of South 180th Street 0.22 to 0.30Solution: Widen shoulders and five breakaway luminaries.
181 10.5 to 10.82 South of Strander Blvd. 0.22 to 0.30Solution: Widen shoulders, install 300' of guardrail.
202 0.5 to 0.7 128th Place Northeast to Milepost 0.70 0.01 to 0.01Solution: Clear zone (remove trees).
202 3.92 to 4.1 156th Avenue vicinity 0.14 to 0.20Solution: Widen shoulders.
202 4.28 to 4.77 Northeast 124th Street to Northeast 116th Street 0.73 to 0.99Solution: Widen shoulders (0.4 mile).
202 5.34 to 6.36 Milepost 5.34 to Northeast 90th Street 0.35 to 0.47Solution: Widen Eastbound shoulders (0.4 mile), install guardrail.
202 8.32 to 9.1 Milepost 8.32 to Milepost 9.10 (City of Redmond) 0.71 to 0.95Solution: Widen Eastbound shoulders (0.8 mile).
202 9.61 to 9.84 Northeast 55th Place vicinity 0.16 to 0.22Solution: Widen Eastbound shoulders (0.2 mile).
202 11.12 to 11.28 West of 224th Avenue Northeast 0.33 to 0.45Solution: Widen shoulders (0.2 mile).
202 12.33 to 12.6 East of 236th Avenue Northeast 0.52 to 0.70Solution: Widen shoulders (0.3 mile).
202 14.11 to 14.5 264th Avenue Northeast 0.02 to 0.02Solution: Install 0.3 mile of guardrail, Eastbound.
202 24.59 to 26 Tokul Creek to Snoqualmie River 2.71 to 3.67Solution: Realign horizontal curves (1.4 mile).
203 0.02 to 0.05 SR 203 and SR 202 JCT. (Fall City) 0.01 to 0.01Solution: Install guardrail to protect/relocate utility pole. (Posted speed limit is 30 mph)
203 2.19 to 2.33 Milepost 2.19 to Neal Road Southeast 0.01 to 0.01Solution: Install guardrail, Milepost 2.19-2.2.
203 2.68 to 2.79 North of Neal Road Southeast 0.01 to 0.01Solution: Install guardrail.
203 5.68 to 5.71 Milepost 5.68 to Northeast 40th Street 0.00 to 0.00Solution: Relocate utility poles.
203 7.83 to 8.39 Harris Creek Vicinity 0.23 to 0.31Solution: Realign horizontal curves (involves wetland mitigation).
203 8.52 to 8.82 Milepost 8.52 to Lake Joy Road 0.17 to 0.23Solution: Realign horizontal curves and install guardrail.
203 10.92 to 11.1 296th Avenue and 268th Avenue 0.17 to 0.23Solution: Widen shoulders, Northbound.
203 11.41 to 11.58 296th Avenue and 268th Avenue 0.33 to 0.45Solution: Realign horizontal curves.
203 12.94 to 13.5 Just south of Northeast 137th Street 0.53 to 0.71Solution: Realign horizontal curves (0.2 mile) and construct retaining wall (0.2 mile).
203 14.58 to 14.63 Milepost 14.58 to Valley Street (City of Duvall) 0.07 to 0.09Solution: Widen shoulders.
203 20.88 to 21.1 203rd Street Southeast and North High Rock Road 0.02 to 0.02Solution: Install guardrail.
410 24.26 to 24.4 Roosevelt Avenue to Mt. Villa Drive 0.02 to 0.02Solution: Install guardrail.
410 28.61 to 29.53 Just west of Mud Mountain Road 0.26 to 0.35Solution: Widen shoulders (0.3 mile).
410 33.11 to 33.26 Scatter Creek to Milepost 33.26 0.02 to 0.02Solution: Install guardrail.
410 51.49 to 51.56 Huckleberry Creek Road and Camp Shepard 0.11 to 0.15Solution: Widen shoulders.
509 6.4 to 6.67 Dry Gulch Bridge Vicinity 0.56 to 0.76Solution: Widen shoulders.
509 6.97 to 7.64 North of Olympic Drive to North of 21st Avenue Northeast 2.51 to 3.39Solution: Realign horizontal curves and construct retaining wall.

Washington State Highway System Plan: 2003-2022 Appendix K - 57February 2002
Appendix K: 20-Year I2 Safety Strategies
Northwest Region (continued)
Highway Estimate Cost RangeNumber Milepost Vicinity Description ($ in Millions)
Risk Reduction (continued)509 7.81 to 7.84 Spring Street Northeast to Pierce/King County Line 0.05 to 0.07Solution: Widen shoulders.
509 8.5 to 8.79 North of 55th Avenue Southwest to 51st Avenue Southwest 0.16 to 0.22Solution: Widen shoulders.
509 10.26 to 11.46 30th Avenue Southwest to Southwest 312th Street 1.98 to 2.68Solution: Realign horizontal curves (1.0 mile).
509 12.6 to 13.03 3rd Place Southwest to 2nd Place South 0.45 to 0.61Solution: Realign horizontal curves (0.2 mile) and relocate utility poles.
509 13.27 to 13.84 Just north of 4th Avenue South to 9th Place South 0.37 to 0.51Solution: Realign horizontal curves (0.2 mile) and relocate utility poles.
509 14.11 to 14.29 Milepost 14.11 to SR 99 0.28 to 0.38Solution: Realign horizontal curve (0.15 mile).
509 20.32 to 21.15 South 218th Street to just north of South 210th Street 0.47 to 0.63Solution: Realign horizontal curves (0.2 mile).
513 2.32 to 2.79 South 45th Avenue Northeast to South of Northeast Windermere Road 0.00 to 0.00Solution: Relocate utility poles.
513 3.3 to 3.35 Northeast 64th Street to Northeast 65th Street 0.00 to 0.00Solution: Relocate utility poles.
516 0.27 to 0.67 Milepost 0.27 to just west of 16th Place South 0.00 to 0.00Solution: Relocate utility poles.
516 0.77 to 1.91 East of 16th Place South to 30th Avenue South 0.02 to 0.02Solution: four Breakaway luminaries.
516 13.69 to 14.31 East of 201st Avenue Southeast to 211th Avenue Southeast 0.01 to 0.01Solution: Install guardrail (200'), 6 culvert ends and relocate utility poles.
516 14.93 to 16.1 Between 218th Avenue Southeast and SR 169 0.52 to 0.70Solution: Widen shoulders (0.29 mile) and relocate utility poles.
518 2.67 to 2.87 SR 99 interchange vicinity 0.01 to 0.01Solution: Install guardrail (100'), Westbound.
522 9.54 to 9.6 Just east of Hall Road to Northeast 180th Street 0.09 to 0.12Solution: Widen Eastbound shoulders.
522 9.81 to 10.06 SR 527 to just east of 102nd Avenue 0.45 to 0.61Solution: Widen shoulders.
524 1.36 to 1.87 West of 11th Place North to East of 88th Avenue West 0.74 to 1.00Solution: Realign curves (0.4 mile) and relocate utility poles.
524 3.87 to 4.04 56th Avenue West to Milepost 4.04 0.00 to 0.00Solution: Relocate utility poles.
524 6.07 to 6.71 West Cypress Way to Locust Way 0.92 to 1.24Solution: Realign curves (0.5 mile).
525 5.56 to 5.72 Harbour Point Blvd. Southwest & 92nd Street Southwest 0.12 to 0.16Solution: Widen Southbound shoulders.
525 6.89 to 8.1 Milepost 6.89 to 6th Street (City of Mukilteo) 0.45 to 0.61Solution: Widen Southbound shoulders (0.5 mile), install 300' of guardrail.
525 8.95 to 9.99 Harding Avenue to Cedar Vista Drive 0.03 to 0.03Solution: Install 1200' of guardrail.
525 10.08 to 10.32 Cedar Vista Drive to Campbell Road 0.01 to 0.01Solution: Install 400' of guardrail.
527 0.64 to 0.9 Northeast 190th Street and Snohomish County line 0.01 to 0.01Solution: Install guardrail.
527 1 to 1.8 Northeast 195th Circle and 234th Street Southeast 0.01 to 0.01Solution: Install guardrail.
527 7.94 to 8.11 North of 144th Street Southeast to South of Trillium Blvd. 0.01 to 0.01Solution: Two culvert ends.
527 8.8 to 8.88 SR 96 intersection vicinity 0.00 to 0.00Solution: Relocate utility poles.
527 9.85 to 10.34 South of 116th Street Southeast to North of Silver Lake Road 0.00 to 0.00Solution: Relocate utility poles.

Appendix K – 58 Washington State Highway System Plan: 2003-2022 February 2002
Appendix K: 20-Year I2 Safety Strategies
Northwest Region (continued)Highway Estimate Cost RangeNumber Milepost Vicinity Description ($ in Millions)
Risk Reduction (continued)529 5.69 to 6.5 South of I-5 interchange to 1st Street 4.90 to 6.62Solution: Replace bridge #529/25, relocate utility poles, install guardrail (0.12 mile) and four advisory curve signs.
530 22.17 to 22.28 Arlington Heights Road & 249th St Northeast 0.01 to 0.01Solution: Install guardrail (0.1 mile).
530 22.47 to 22.54 Arlington Heights Road & 249th St Northeast 0.01 to 0.01Solution: Install guardrail.
530 22.66 to 22.71 Arlington Heights Road & 249th St Northeast 0.01 to 0.01Solution: Install guardrail (300').
530 25.86 to 26.13 127th Avenue Northeast vicinity 0.22 to 0.30Solution: Install guardrail, enclose drainage, and address clear zone
530 34.05 to 34.45 Milepost 34.05 to Oso Loop Road 0.44 to 0.60Solution: Realign horizontal curves (0.2 mile).
530 34.83 to 34.95 Oso Loop Road & Whitman Road 0.44 to 0.60Solution: Realign horizontal curves (0.2 mile).
536 4.69 to 4.72 Milepost 4.69 to Milepost 4.72 4.67 to 6.31Solution: Widen BR 536/15, rail ends and widen shoulders.
538 2.59 to 2.73 Milepost 2.59 to Milepost 2.73 0.25 to 0.33Solution: Widen shoulders.
538 2.95 to 3.06 Milepost 2.95 to Milepost 3.06 0.00 to 0.00Solution: Clear zone (trees).
538 3.27 to 3.67 Milepost 3.27 to Milepost 3.67 0.19 to 0.25Solution: Realign horizontal curves.
542 0.65 to 0.75 Milepost 0.65 to Milepost 0.75 0.03 to 0.05Solution: Widen Westbound shoulders.
542 1.67 to 1.73 Milepost 1.67 to Milepost 1.73 0.05 to 0.07Solution: Widen Westbound shoulders.
542 5.99 to 6.15 Milepost 5.00 to Milepost 6.15 0.01 to 0.01Solution: Install 300' of guardrail.
542 29.33 to 29.48 Milepost 29.33 to Milepost 29.48 0.02 to 0.02Solution: Install guardrail.
542 35.53 to 35.8 Milepost 35.53 to Milepost 35.80 0.48 to 0.66Solution: Widen shoulders.
542 36.77 to 36.82 Milepost 36.77 to Milepost 36.82 0.09 to 0.12Solution: Widen shoulders.
542 37.43 to 37.53 Milepost 37.43 to Milepost 37.53 0.18 to 0.24Solution: Widen shoulders.
542 37.99 to 38.13 Milepost 37.99 to Milepost 38.13 0.57 to 0.77Solution: Widen shoulders.
542 39.12 to 39.16 Milepost 39.12 to Milepost 39.16 0.16 to 0.22Solution: Widen shoulders.
542 39.93 to 40.93 Milepost 39.93 to Milepost 40.93 2.04 to 2.76Solution: Widen shoulders.
542 43.12 to 43.29 Milepost 43.12 to Milepost 43.29 0.35 to 0.47Solution: Widen Westbound shoulders.
542 47.15 to 47.22 Milepost 47.15 to Milepost 47.22 0.17 to 0.23Solution: Widen Westbound shoulders.
542 47.44 to 47.94 Milepost 47.44 to Milepost 47.94 3.77 to 5.11Solution: Widen shoulders.
542 48.43 to 48.5 Milepost 48.43 to Milepost 48.50 0.70 to 0.94Solution: Widen shoulders and concrete barrier to protect rock wall.
542 48.61 to 48.71 Milepost 48.61 to Milepost 48.71 0.71 to 0.95Solution: Widen shoulders and concrete barrier to protect rock wall.
542 48.86 to 49 Milepost 48.86 to Milepost 49.00 0.99 to 1.35Solution: Widen shoulders.
542 49.11 to 49.16 Milepost 49.11 to Milepost 49.16 0.20 to 0.28Solution: Widen shoulders.
542 49.28 to 49.43 Milepost 49.28 to Milepost 49.43 0.61 to 0.83Solution: Widen shoulders.

Washington State Highway System Plan: 2003-2022 Appendix K - 59February 2002
Appendix K: 20-Year I2 Safety Strategies
Northwest Region (continued)
Highway Estimate Cost RangeNumber Milepost Vicinity Description ($ in Millions)
Risk Reduction (continued)542 49.53 to 49.83 Milepost 49.53 to Milepost 49.83 1.05 to 1.43Solution: Widen shoulders and barrier to protect rock wall.
542 50 to 50.05 Milepost 50.00 to Milepost 50.05 0.10 to 0.14Solution: Widen shoulders.
542 50.17 to 50.22 Milepost 50.17 to Milepost 50.22 0.20 to 0.28Solution: Widen shoulders.
542 50.51 to 50.57 Milepost 50.51 to Milepost 50.57 0.12 to 0.16Solution: Widen shoulders.
542 50.85 to 51.08 Milepost 50.85 to Milepost 51.08 0.98 to 1.32Solution: Widen shoulders and concrete barrier.
542 51.15 to 51.23 Milepost 51.15 to Milepost 51.23 0.32 to 0.44Solution: Widen shoulders.
542 51.5 to 51.83 Milepost 51.50 to Milepost 51.83 1.39 to 1.87Solution: Widen shoulders.
542 51.99 to 52.22 Milepost 51.99 to Milepost 52.22 0.95 to 1.29Solution: Widen shoulders.
542 52.71 to 52.76 Milepost 52.71 to Milepost 52.76 0.01 to 0.01Solution: Install guardrail, Eastbound.
542 53.31 to 53.52 Milepost 53.31 to Milepost 53.52 0.03 to 0.03Solution: Install guardrail, Eastbound.
542 53.7 to 53.79 Milepost 53.70 to Milepost 53.79 0.45 to 0.61Solution: Install guardrail and retaining wall, Eastbound.
542 53.88 to 53.91 Milepost 53.88 to Milepost 53.91 0.15 to 0.21Solution: Install guardrail and retaining wall, Eastbound.
543 0.57 to 0.97 Milepost 0.57 to Milepost 0.97 0.15 to 0.21Solution: Flatten vertical crest.
544 7.42 to 7.9 Milepost 7.42 to Milepost 7.90 3.26 to 4.40Solution: Realign curve (0.05 mile), replace BR 544/10, and widen shoulders (0.34 mile).
900 6.21 to 6.31 I-5 vicinity 0.07 to 0.09Solution: Widen Westbound shoulders.
900 6.53 to 6.77 I-5 vicinity 0.16 to 0.22Solution: Widen bridge.
900 8.57 to 8.76 Just east of South 135th Street to Milepost 8.76 0.14 to 0.20Solution: Realign vertical curve.
900 14.49 to 14.96 East of Field Avenue Northeast to West of 148th Avenue Southeast 0.36 to 0.48Solution: Realign horizontal curve (0.2 mile).
900 15.07 to 15.25 East of 148th Avenue Southeast to 151st Avenue Southeast 0.14 to 0.20Solution: Widen shoulders.
900 16.05 to 16.3 162nd Avenue Southeast to Milepost 16.30 0.01 to 0.01Solution: Install guardrail (0.1 mile).
900 16.65 to 17.04 171st Place Southeast to Milepost 17.04 0.33 to 0.45Solution: Widen shoulders.
900 17.17 to 17.24 171st Place Southeast and Southeast May Valley Road 0.05 to 0.07Solution: Widen shoulders.
900 17.43 to 17.89 Southeast May Valley Road vicinity 0.39 to 0.53Solution: Widen shoulders.
900 18.54 to 19.08 Southeast May Valley Road and City of Issaquah 0.25 to 0.33Solution: Widen shoulders (0.3 mile).
900 19.16 to 20.01 Southeast May Valley Road and City of Issaquah 0.90 to 1.22Solution: Realign horizontal curve (0.2 mile) and widen shoulders (0.6 mile).
900 21.43 to 21.51 Gilman Blvd. to just west of I-90 0.01 to 0.01Solution: Install three breakaway luminaries.

Appendix K – 60 Washington State Highway System Plan: 2003-2022 February 2002

Washington State Highway System Plan: 2003-2022 Appendix K - 61February 2002
Appendix K: 20-Year I2 Safety Strategies
North Central Region
Highway Estimate Cost RangeNumber Milepost Vicinity Description ($ in Millions)
At Grade Intersections2 104.52 to 105.07 Junction US 2 / US 97 "Big Y" 19.13 to 25.88Solution: Construct interchange
2 106.14 to 106.84 Dryden Avenue/Johnson Road 11.53 to 15.59Solution: Construct interchange
2 109.78 to 110.48 Goodwin Road -- Cashmere 19.13 to 25.88Solution: Construct interchange
2 110.72 to 111.42 Division Street -- Cashmere 21.04 to 28.46Solution: Construct interchange
2 111.63 to 112.33 Cottage Avenue -- Cashmere 23.80 to 32.20Solution: Construct interchange
2 114.5 to 119 Monitor/Easy Street 19.13 to 25.88Solution: Construct interchange
17 51.4 to 52.1 Junction SR 17 / Pioneer Way -- Moses Lake 8.50 to 11.50Solution: Construct interchange
17 56.21 to 56.91 Woolard Road 15.05 to 20.36Solution: Construct grade-separated interchange
17 56.21 to 56.91 Patton Blvd. -- Moses Lake 8.50 to 11.50Solution: Construct interchange
Risk Reduction2 59.76 to 61.08 Tunnel Creek Curve 0.29 to 0.39Solution: Improve Roadside
2 74.04 to 74.53 West of Stevens Pass 2.54 to 3.44Solution: Realignment
2 75.47 to 75.79 West of Stevens Pass 0.22 to 0.30Solution: Improve Roadside
2 76.29 to 77.21 West of Stevens Pass 0.65 to 0.87Solution: Improve Roadside
2 90.63 to 90.8 Tumwater Canyon Vicinity 0.03 to 0.03Solution: Improve Roadside
2 91.31 to 94.54 Tumwater Canyon Vicinity 0.48 to 0.64Solution: Improve Roadside
2 95.98 to 96.34 Tumwater Canyon Vicinity 0.12 to 0.16Solution: Improve Roadside
2 102.3 to 103.44 Prey's Flat to Simpson Road 0.14 to 0.20Solution: Improve Roadside
2 110.21 to 110.75 Cashmere Rock Cut 0.08 to 0.10Solution: Improve Roadside
2 142.21 to 142.63 Pine Canyon Vicinity 2.96 to 4.00Solution: Realignment
2 143.23 to 144.7 Pine Canyon Vicinity 0.48 to 0.64Solution: Improve Roadside
90 137.74 to 139.61 I-90/SR 26 Interchange 3.81 to 5.15Solution: Re-Alignment
97 163.19 to 164.39 Swauk Summit Vicinity 0.22 to 0.30Solution: Improve Roadside
97 165.27 to 165.89 Upper Tronson Creek to Meadow Inn Road 2.67 to 3.61Solution: Re-Alignment
97 166.49 to 167.63 Blewett Pass Vicinity 0.03 to 0.03Solution: Improve Roadside
97 230.23 to 230.49 Junction SR 971 Vicinity 0.00 to 0.00Solution: Improve Roadside
150 9.09 to 9.87 Junction US 97A Vicinity to Blue Chelan 0.05 to 0.07Solution: Improve Roadside
150 10.65 to 11.58 Chelan Falls Hill 1.90 to 2.56Solution: Improve Roadside
153 2.19 to 2.3 Manson Orchard Curve 0.01 to 0.01Solution: Improve Roadside

Appendix K – 62 Washington State Highway System Plan: 2003-2022 February 2002
Appendix K: 20-Year I2 Safety Strategies
North Central Region (continued)
Highway Estimate Cost RangeNumber Milepost Vicinity Description ($ in Millions)
Risk Reduction (continued)155 25.37 to 25.52 Windmill Park to Vicinity Junction SR 155 / SR 174 0.01 to 0.01Solution: Improve Roadside
155 33 to 33.2 North of Elmer City 0.03 to 0.03Solution: Improve Roadside
155 48.74 to 48.87 Disautel Pass Area 0.02 to 0.02Solution: Improve Roadside
285 0 to 0.15 SR 28 / SR 285 Interchange 0.02 to 0.02Solution: Improve Roadside

Washington State Highway System Plan: 2003-2022 Appendix K - 63February 2002
Appendix K: 20-Year I2 Safety Strategies
Olympic Region
Highway Estimate Cost RangeNumber Milepost Vicinity Description ($ in Millions)
At Grade Intersections8 6.03 to 7.42 Junction SR 108, Mox-Chehalis Road Wye 15.63 to 21.15Solution: Construct interchanges
8 9 to 10.8 Mox-Chehalis Road, Cooper Road 15.63 to 21.15Solution: Construct Under-crossing and Interchange
8 13.41 to 14 Summit Lake Road 11.55 to 15.63Solution: Construct Interchange and frontage road
8 16 to 16.12 Summit Lake Road 5.09 to 6.89Solution: Construct Under-crossing and frontage road
12 12.46 to 12.57 Monte Brady Road Wye Connection 10.80 to 14.62Solution: Construct Interchange and frontage road
12 14.76 to 14.76 Monte Brady Road 10.73 to 14.51Solution: Construct Interchange
12 16.38 to 16.38 4th Street, Keys Road 10.73 to 14.51Solution: Construct Interchange
16 20.11 to 20.11 Burley-Olalla Road 10.73 to 14.51Solution: Construct Interchange
101 255.11 to 255.11 Old Olympic Highway, O'Brien Road 10.73 to 14.51Solution: Construct Interchange
101 352.1 to 352.1 Lynch Road Vicinity 4.87 to 6.59Solution: Construct Under-crossing and Frontage Road between Ryan/Fredson and Lynch Road
Risk Reduction3 3.15 to 3.58 U.S. Government Railroad Under-crossing Vicinity 0.05 to 0.07Solution: Radii improvements and guardrail
3 3.7 to 3.84 Milepost 3.70 to Milepost 3.84 0.60 to 0.82Solution: Realignment
3 4.49 to 6 Milepost 4.49 to Milepost 6.00 4.02 to 5.44Solution: Realignment
3 10.26 to 10.53 Milepost 10.26 to Milepost 10.53 0.06 to 0.08Solution: Cross-section/ Geometric Improvements
3 11.77 to 11.92 Anthony Road to Krabbenhoff Road 0.25 to 0.33Solution: Realignment
3 16.27 to 16.48 Dawn Drive Vicinity 0.36 to 0.48Solution: Realignment
3 20.59 to 20.73 Sherwood Creek Road to Lakeland Drive 0.23 to 0.31Solution: Realignment
3 21.44 to 21.95 Allyn Vicinity to Old SR 3 0.47 to 0.63Solution: Cross-section/Geometric improvements
3 25.14 to 25.32 Belfair Vicinity 0.14 to 0.20Solution: Cross-section/Geometric Improvements
3 26.38 to 27.52 SR 300 to U.S. Government Railroad Vicinity 1.01 to 1.37Solution: Cross-section/Geometric Improvements
3 32.31 to 32.43 Between Imperial Way and Sunnyslope Road 0.09 to 0.12Solution: Cross-section/Geometric Improvements
3 32.93 to 33.57 Sunnyslope Road to Division Avenue 0.56 to 0.76Solution: Cross-section/Geometric Improvements
3 35.13 to 35.45 Gorst Vicinity 0.26 to 0.36Solution: Cross-section/Geometric Improvements
3 35.77 to 36.77 SR 304 to Auto Center Way 0.88 to 1.20Solution: Cross-section/Geometric Improvements
3 55.07 to 55.28 Denton Road NW Vicinity 0.17 to 0.23Solution: Cross-Section/Geometric Improvements
3 58.64 to 60.02 Scenic Drive Vicinity to SR 104 2.44 to 3.30Solution: Realignment
7 21.56 to 21.69 Alder Cutoff Road Vicinity 0.41 to 0.55Solution: Realignment or guardrail improvements
7 27.87 to 27.89 Mashel River Bridge Vicinity 13.18 to 17.83Solution: Cross-Section/Geometric Improvements or new bridge realignment

Appendix K – 64 Washington State Highway System Plan: 2003-2022 February 2002
Appendix K: 20-Year I2 Safety Strategies
Olympic Region (continued)
Highway Estimate Cost RangeNumber Milepost Vicinity Description ($ in Millions)
Risk Reduction (continued)7 30.72 to 31.7 Kjelstad Road East to 416th Street East Vicinity 4.36 to 5.90Solution: Realignment and partial Accident Reduction Overlap
12 34.34 to 34.46 Burlington Northern Railroad Bridge 012/73 Vicinity 3.02 to 4.08Solution: Realignment & New Bridge
016 28.83 to 29.19 SR 16 Gorst Spur to SR 3 0.30 to 0.40Solution: Cross-section/Geometric Improvements
20 0.16 to 0.21 Fairmont Road Vicinity to Fairmont Wye 0.32 to 0.44Solution: Cross-section/Geometric Improvements
20 0.66 to 3.86 Fairmont Hill Road to Woodman Road 5.70 to 7.71Solution: Realignment and Cross-section/Geometric improvements
20 10.88 to 11.4 Grant Street Vicinity to 10th Street 0.45 to 0.61Solution: Cross-section/Geometric Improvements
101 67.19 to 67.55 Pacific/Grays Harbor County Line to Salmon Creek 0.30 to 0.40Solution: Cross-section/Geometric Improvements
101 69.81 to 70.61 Milepost 69.81 to 70.61 0.70 to 0.94Solution: Cross-section/Geometric Improvements
101 72.69 to 72.86 Milepost 72.69 to Milepost 72.86 0.13 to 0.17Solution: Cross-section/Geometric Improvements
101 73.45 to 73.48 Milepost 73.45 to Milepost 73.18 0.01 to 0.01Solution: Cross-section/Geometric Improvements
101 73.68 to 73.74 Milepost 73.68 to Milepost 73.74 0.03 to 0.05Solution: Cross-section/Geometric Improvements
101 73.94 to 73.96 Lund Road Vicinity 0.00 to 0.00Solution: Cross-section/Geometric Improvements
101 77.5 to 77.65 Milepost 77.50 to Milepost 77.65 0.12 to 0.16Solution: Cross-Section/Geometric Improvements
101 77.89 to 78.03 Milepost 77.89 to Milepost 78.03 0.11 to 0.15Solution: Cross-Section/Geometric Improvements
101 78.51 to 79.61 Milepost 78.51 to Milepost 79.61 2.69 to 3.65Solution: Guardrail and Super Elevation Work or Realignment
101 87.21 to 87.49 16th Street to Aberdeen Couplet 0.23 to 0.31Solution: Cross-section/Geometric Improvements
101 118.51 to 118.59 Quinault Ridge Road Vicinity 0.00 to 0.00Solution: No Action or Cross-Section Improvements
101 177.07 to 177.47 Oil City Road Vicinity 0.33 to 0.45Solution: Cross-Section/Geometric Improvements
101 187.34 to 187.41 Fuhrman Road Vicinity 0.14 to 0.20Solution: Cross-Section/Geometric Improvements
101 189.36 to 189.6 Mansfield Road to Forks South City Limits 0.48 to 0.64Solution: Cross-Section/Geometric Improvements
101 224.83 to 225 Milepost 224.83 to Milepost 225.00 0.34 to 0.46Solution: Cross-section/Geometric improvements
101 227.26 to 227.4 Barnes Creek Vicinity 0.18 to 0.24Solution: Cross-section/Geometric improvements
101 230.7 to 231.35 Milepost 230.70 to Milepost 231.35 1.51 to 2.05Solution: Cross-section/Geometric improvements or Realignment
101 239.74 to 239.97 Olympic Hot Springs Road Vicinity 0.18 to 0.24Solution: Cross-Section/Geometric Improvements
101 245.98 to 246.07 Euclid Avenue to SR 117 - Tumwater Truck Road 0.03 to 0.03Solution: Cross-section/Geometric Improvements
101 256.88 to 257.01 Shore Road Vicinity 0.11 to 0.15Solution: Cross-Section/Geometric Improvements
101 267.32 to 267.79 Palo Alto Road Vicinity 0.40 to 0.54Solution: Cross-section/Geometric Improvements
101 270.85 to 270.97 Seven Cedars Casino to Sophus Road 0.09 to 0.12Solution: Cross-section/Geometric Improvements

Washington State Highway System Plan: 2003-2022 Appendix K - 65February 2002
Appendix K: 20-Year I2 Safety Strategies
Olympic Region (continued)
Highway Estimate Cost RangeNumber Milepost Vicinity Description ($ in Millions)
Risk Reduction (continued)101 270.97 to 271.58 Sophus Road to Chicken Coop Road 0.53 to 0.71Solution: Cross-section/Geometric Improvements
101 271.67 to 271.84 Blyne Vicinity 0.13 to 0.17Solution: Cross-section/Geometric Improvements
101 272.89 to 274.08 Blyne Road Vicinity to Knap Road 1.05 to 1.41Solution: Cross-section/Geometric Improvements
101 284.24 to 284.34 Between West Uncas Road and SR 104 0.09 to 0.12Solution: No Action or Realignment
101 297.55 to 297.6 Hiddendale Drive Vicinity 0.03 to 0.03Solution: Cross-section/Geometric Improvements
101 299.1 to 299.66 Mount Walker Vicinity 0.48 to 0.64Solution: Cross-section/Geometric Improvements
101 301.68 to 301.84 Spencer Creek Road Vicinity 0.12 to 0.16Solution: Cross-section/Geometric Improvements
101 302.29 to 302.68 Milepost 302.29 to Milepost 302.68 0.33 to 0.45Solution: Cross-section/Geometric Improvements
101 312.11 to 314.13 McDonald Creek to Williams Court 1.48 to 2.00Solution: Realignment and/or shoulder widening
101 328.57 to 329.82 Terrace Road to Virginia Avenue 0.73 to 0.99Solution: Cross-section/Geometric improvements
101 332.75 to 333.31 Between Hoodsport and Potlatch 2.49 to 3.37Solution: Cross-section/Geometric improvements
101 334.34 to 334.48 Cushman Project Bridge Vicinity 0.11 to 0.15Solution: Cross-section/Geometric improvements
104 19.57 to 19.88 Old Port Gamble Road Vicinity 0.53 to 0.71Solution: Realignment
104 20.78 to 21.84 Ritter Road to Hansville-Miller Bay Road 0.92 to 1.24Solution: Cross-Section/Geometric Improvements
105 33.31 to 33.58 Airport Road Vicinity on Westport Spur 0.26 to 0.35Solution: No Action (Westport) or Realignment
105 47.16 to 47.29 Calhoun Road Vicinity to Coolidge Road 0.12 to 0.16Solution: Guardrail (Entering Aberdeen) or Realignment
106 16.05 to 16.3 East. Trails Road Vicinity 0.65 to 0.89Solution: Realignment
106 16.67 to 16.82 Between East Trails Road Vicinity and SR 3 0.38 to 0.52Solution: Realignment
106 17.24 to 18.17 Between East. Trails Road Vicinity and SR 3 2.47 to 3.35Solution: Realignment
106 19.3 to 19.41 Between East Trails Road Vicinity and SR 3 0.29 to 0.39Solution: Realignment
106 19.68 to 19.85 Between East Trails Road Vicinity and SR 3 0.44 to 0.60Solution: Realignment
108 5.23 to 5.41 Milepost 5.23 to Milepost 5.41 3.20 to 4.34Solution: Realignment
108 9.94 to 9.98 Hurley Waldrip Wye Vicinity 0.03 to 0.03Solution: Cross-Section/Geometric Improvements or Realignment
109 3.63 to 5 Broadway Hill Road to Valley Road Vicinity 3.40 to 4.60Solution: Cross-Section / Geometric Improvements and Realignment
112 14.98 to 15.05 Fall Creek Bridge Vicinity 0.34 to 0.46Solution: Cross-Section / Geometric Improvements
112 15.98 to 16.42 Clallam Bay Vicinity 0.26 to 0.36Solution: Cross-Section / Geometric Improvements and/or realignment
112 20.5 to 22.86 Green Creek Bridge Vicinity 4.25 to 5.75Solution: Cross-section/Geometric Improvements
115 0.33 to 0.43 Damon Road Vicinity 3.32 to 4.49Solution: Included in Accident Reduction Solution: or realignment with new bridge

Appendix K – 66 Washington State Highway System Plan: 2003-2022 February 2002
Appendix K: 20-Year I2 Safety Strategies
Olympic Region (continued)
Highway Estimate Cost RangeNumber Milepost Vicinity Description ($ in Millions)
Risk Reduction (continued)161 3.39 to 5 Mashell Avenue South to Ohop Valley Road 1.66 to 2.24Solution: Realignment
161 5 to 5.77 Ohop Valley Road to Campbell Lane East. 2.04 to 2.76Solution: Realignment
161 8.97 to 9 Between Trek Drive East and Clear Lake South Rd 0.13 to 0.17Solution: Cross-Section/Geometric improvements or Realignment
161 9 to 10.21 Clear Lake South Road to Tanwax Drive East 1.07 to 1.45Solution: Cross-Section/Geometric Improvements
161 32.45 to 32.53 Military Road Vicinity 0.05 to 0.07Solution: Cross-section/Geometric Improvements
162 10.95 to 11.01 Railroad crossing (vacated) to Orville Road East 0.14 to 0.20Solution: Realignment
162 11.44 to 11.64 Voights Creek Bridge Vicinity 2.44 to 3.30Solution: Realignment and new structure
162 13.02 to 13.07 Burlington Northern Railroad Vicinity 0.69 to 0.93Solution: Realignment and new structure
162 14.5 to 14.96 South Prairie Creek Bridge Vicinity 0.17 to 0.23Solution: Cross-section/Geometric improvements
165 15.83 to 16.36 Gale Creek Bridge Vicinity 2.35 to 3.17Solution: Cross-section/Geometric improvements
165 17.91 to 18.5 South Prairie Road East to 141st Street Court East. 0.45 to 0.61Solution: Cross-Section/Geometric improvements and Realignment
165 19.28 to 19.36 Fettig Road Vicinity 0.05 to 0.07Solution: Cross-Section/Geometric improvements
166 0.79 to 1.5 Port Orchard west of city limits Vicinity 0.62 to 0.84Solution: Cross-Section/Geometric improvements
167 0.29 to 0.64 I-5 Under-crossing to Pioneer Way Vicinity 0.30 to 0.40Solution: Cross-section/Geometric Improvements
300 0.53 to 0.75 Between Gladwin Road and Larson Lake Road 0.14 to 0.20Solution: Cross-section/Geometric improvements
302 11.12 to 12.72 118th Avenue NW to 144th Street NW 0.33 to 0.45Solution: Cross-section/Geometric improvements
302 15.79 to 15.81 Purdy Creek to SR 302 Wye Connection 0.00 to 0.00Solution: Cross-Section/Geometric Improvements
305 13.24 to 13.31 Old SR 3 - Viking Way Vicinity 0.05 to 0.07Solution: Cross-section/Geometric Improvements
410 8.9 to 8.93 SR 167 on Ramp to White River Bridge 0.01 to 0.01Solution: Cross-section/Geometric Improvements
410 20.66 to 20.84 Shopping Center to Jefferson Avenue 0.14 to 0.20Solution: Cross-section/Geometric Improvements
507 7.94 to 7.96 Milepost 7.94 to Milepost 7.96 0.03 to 0.05Solution: Cross-section/Geometric Improvements
507 8.4 to 8.64 Milepost 8.40 to Milepost 8.64 0.31 to 0.41Solution: Cross-section/Geometric Improvements
507 29.16 to 29.23 Yelm north of city limits vicinity 0.05 to 0.07Solution: Cross-section/Geometric Improvements
507 32.4 to 32.71 336th Street South Vicinity 0.26 to 0.35Solution: Cross-Section/Geometric Improvements
507 33.21 to 34 320th Street South Vicinity 0.69 to 0.93Solution: Cross-Section/Geometric Improvements
507 35.38 to 36.05 Fourth Street Vicinity to Roy Vicinity 0.45 to 0.61Solution: Cross-Section / Geometric Improvements
507 36.55 to 36.64 Railroad crossing to Auxiliary Lane 0.00 to 0.00Solution: No Action or Cross-Section / Geometric Improvements
509 5.74 to 6 South of Slayden Road Northeast to North of Le Lou Wa Place 2.12 to 2.86Solution: Realign horizontal curve and construct retaining wall.

Washington State Highway System Plan: 2003-2022 Appendix K - 67February 2002
Appendix K: 20-Year I2 Safety Strategies
Olympic Region (continued)
Highway Estimate Cost RangeNumber Milepost Vicinity Description ($ in Millions)
Risk Reduction (continued)510 6.3 to 6.82 Old Pacific Highway to Meridian Road 0.45 to 0.61Solution: Cross-section/Geometric Improvements
510 7.67 to 7.71 Mullen Road Southeast Vicinity 0.02 to 0.02Solution: Cross-Section/Geometric Improvements
510 8.25 to 8.33 Thornton Road & Reservation Road 0.05 to 0.07Solution: Cross-Section/Geometric Improvements
510 9.41 to 9.5 Yelm Highway Southeast & Fort Lewis Military Road 0.07 to 0.09Solution: Cross-Section/Geometric Improvements
510 11.4 to 11.47 Church Kalama Road & Ft Lewis Military Road 0.17 to 0.23Solution: Cross-section/Geometric improvements
510 12.84 to 13 Southworth Elementary School Vicinity 0.12 to 0.16Solution: Cross-Section/Geometric improvements
510 13.99 to 14.4 89th Avenue Southeast to Yelm west of city limits 0.35 to 0.47Solution: Cross-Section/Geometric improvements

Appendix K – 68 Washington State Highway System Plan: 2003-2022 February 2002

Washington State Highway System Plan: 2003-2022 Appendix K - 69February 2002
Appendix K: 20-Year I2 Safety Strategies
Southwest Region
Highway Estimate Cost RangeNumber Milepost Vicinity Description ($ in Millions)
At Grade Intersections500 1.13 to 1.13 St. John's Blvd. 15.29 to 20.69Solution: New Interchange
500 1.8 to 1.8 Northeast 42nd Avenue 7.03 to 9.51Solution: New Interchange
500 2.38 to 2.38 Northeast 54th Avenue 8.15 to 11.03Solution: New Interchange
500 3.89 to 3.89 North Thurston Way 10.70 to 14.48Solution: New interchange
500 5.42 to 5.42 Northeast 112th Way 9.59 to 12.97Solution: New interchange
Risk Reduction4 37.66 to 38 End of climbing lane to Milepost 38 1.94 to 2.62Solution: Realignment
4 41.31 to 41.6 Milepost 41.31 to Milepost 41.60 0.87 to 1.17Solution: Realignment
4 47.75 to 48.48 Mill Creek Bridge to Aberathy Creek Road 3.41 to 4.61Solution: Realignment, bridge replacement
4 49.8 to 49.95 Half Bridge to German Creek Bridge 0.48 to 0.64Solution: Realignment
4 50.6 to 51.11 Tall Creek Road to Milepost 51 vicinity 1.45 to 1.97Solution: Realignment
4 52.02 to 52.1 Milepost 52 vicinity 1.01 to 1.37Solution: Realignment
4 54.63 to 54.75 West of Coal Creek Slough Bridge 0.92 to 1.24Solution: Realignment
6 0.19 to 0.2 Raymond 0.09 to 0.12Solution: Realignment
6 0.58 to 0.92 Bloomhardt Road to Gerber St 0.96 to 1.30Solution: Realignment
6 12.71 to 12.77 Bilow Road vicinity 0.18 to 0.24Solution: Realignment
6 44.45 to 45.07 Spooner Road vicinity 1.84 to 2.50Solution: Realignment
6 47.15 to 48.09 Goff Road to Stearns Road vicinity 2.92 to 3.94Solution: Realignment
7 1.45 to 2.59 Milepost 1.45 to CW Railroad Bridge 4.28 to 5.80Solution: Realignment, bridge replacement
7 5.46 to 6.74 North of Tilton River Bridge 2.73 to 3.69Solution: Realignment
12 100.85 to 101.4 Priest Road to Davis Lake Road 1.65 to 2.23Solution: Realignment
14 21.72 to 27.47 Clark/Skamania County Line to Riverside Drive Vicinity 28.35 to 38.35Solution: Realignment
14 30.15 to 30.67 East of Smith-Cripe Road 1.55 to 2.09Solution: Realignment
14 41.55 to 42.15 Bridge of the Gods Road to Milepost 42.15 0.29 to 0.39Solution: Shoulder widening
14 44.89 to 48.09 East of Stevenson to Carson Depot Road 0.96 to 1.30Solution: Shoulder widening
14 61.44 to 62.01 Fish Hatchery to Milepost 62 2.63 to 3.55Solution: Realignment bridge replacement
14 63.61 to 64.85 SR 141 Spur vicinity to City Street 0.77 to 1.04Solution: Shoulder widening
101 2.06 to 2.46 South of Fort Columbia Tunnel 0.29 to 0.39Solution: Relocate utilities, shoulder widening, and minor realignment
101 4.12 to 4.21 Houtchen Street vicinity 0.25 to 0.33Solution: Realignment

Appendix K – 70 Washington State Highway System Plan: 2003-2022 February 2002
Appendix K: 20-Year I2 Safety Strategies
Southwest Region (continued)
Highway Estimate Cost RangeNumber Milepost Vicinity Description ($ in Millions)
Risk Reduction (continued)101 28.2 to 28.47 South of SR 4 intersection 0.77 to 1.04Solution: Realignment
101 45.53 to 47.08 Weyerhaeuser Road vicinity to Milepost 46.90 3.30 to 4.46Solution: Realignment Milepost 45.53 to 45.70, Milepost 45.95 to Milepost 46.90
101 48.25 to 48.65 Bruceport County Park vicinity 1.16 to 1.56Solution: Realignment
101 58.44 to 58.48 South Fork Willipa River Bridge 0.00 to 0.00Solution: Upgrade guardrail establish clear zone
101 60.21 to 60.5 Private Road vicinity 0.84 to 1.14Solution: Realignment
101 61.97 to 63.3 Milepost 62 to Smith Creek Road vicinity 3.90 to 5.28Solution: Realignment
101 66.8 to 67.18 Pacific/Grays Harbor County Line 0.85 to 1.15Solution: Realignment
141 2 to 5.2 Entering White Salmon to Powerhouse Road 9.37 to 12.67Solution: Realignment
141 4.8 to 6.85 SR 141 Spur to Northwestern Lake Road 9.76 to 13.20Solution: Realignment
500 9.8 to 10 West of Northeast 199th Avenue 0.48 to 0.64Solution: Realignment
500 10.4 to 12.3 Northeast 199th Ave to Northeast 53rd St 1.94 to 2.62Solution: Realignment
500 12.3 to 14.2 Northeast 53rd St to Northeast 249th Avenue 1.94 to 2.62Solution: Realignment
500 16 to 18.3 Northeast Hathaway Road to Northeast 23rd Avenue 2.92 to 3.94Solution: Realignment Milepost 16.00 to Milepost 16.50, Milepost 17.35 to Milepost 17.50, Milepost 18.0 to Milepost 18.30
501 17.3 to 18.2 Northeast Pioneer Road to Northeast Smythe Road 1.75 to 2.37Solution: Realignment Milepost 17.30 to Milepost 17.50, Milepost 17.90 to Milepost 18.20
502 0.31 to 1.54 Northeast 184th Street to Northeast 209th Street 1.94 to 2.62Solution: Establish clear zone, slope flattening
503 13.9 to 15.6 Northeast Gabriel Road to Northeast 365th St 3.80 to 5.14Solution: Realignment
503 16.55 to 17.95 Northeast 165th St to Hooper Wollam Road 1.84 to 2.50Solution: Realignment
503 17.7 to 18.35 Hooper Wollam Road to Northeast Kelly Road 1.89 to 2.55Solution: Realignment
503 21.4 to 21.5 North Branch Chelatchie Creek vicinity 0.07 to 0.09Solution: Add guardrail, establish clear zone, relocate utilities, slope flattening, and shoulder widening
503 21.9 to 22.1 South of Northeast Gerber McKee Road 0.11 to 0.15Solution: Establish clear zone, relocate utilities, slope flattening, shoulder widening
503 22.2 to 22.4 Northeast Gerber McKee Road vicinity 0.09 to 0.12Solution: Turn present section over to county and improve Northeast Cedar Creek Road to state standards
503 22.5 to 22.6 Eaton Road vicinity 0.09 to 0.12Solution: Turn present section over to county and improve Eaton Road to state standards
503 32.9 to 35.1 Baker Road vicinity to Milepost 35.10 0.46 to 0.62Solution: Upgrade guardrail, establish clear zone, slope flattening, shoulder widening
503 36.6 to 36.9 Rock Creek Bridge vicinity 0.26 to 0.36Solution: Add guardrail, establish clear zone, and shoulder widening
504 0.43 to 1.58 Salmon Creek Lane to Studebaker Road 0.14 to 0.20Solution: Upgrade guardrail, slope flattening
504 6.9 to 8.51 El Costa-Lotta Place to George Taylor Road 0.01 to 0.01Solution: Relocate utilities
504 8.95 to 9.1 Hall Road vicinity 0.43 to 0.58Solution: Realignment
504 9.5 to 9.7 Martin Road Vicinity 0.42 to 0.56Solution: Realignment

Washington State Highway System Plan: 2003-2022 Appendix K - 71February 2002
Appendix K: 20-Year I2 Safety Strategies
Southwest Region (continued)
Highway Estimate Cost RangeNumber Milepost Vicinity Description ($ in Millions)
Risk Reduction (continued)504 17.87 to 19.6 Kid Valley Road to Milepost 19.60 3.68 to 4.98Solution: Realignment
505 7.3 to 7.61 Toledo Salmon Creek Road to Boone Road 0.71 to 0.95Solution: Realignment
505 12.85 to 14.83 Dowling Road vicinity to Milepost 14.83 2.28 to 3.08Solution: Realignment Milepost 13.0 to Milepost 13.2 rebuild bridge # 505/104, add and upgrade guardrail, establish clear zone, relocate utilities, slope
Flattening, shoulder widening
507 3.95 to 4.6 Lowery Lane to Big Hanaford Road 0.13 to 0.17Solution: Upgrade guardrail, relocate utilities
508 3.12 to 3.18 Guerrier Road 1.39 to 1.89Solution: Relocate utilities, shoulder widening, slope flattening
508 3.64 to 3.74 Tauscher Road vicinity 0.05 to 0.07Solution: Establish clear zone, shoulder widening, slope flattening
508 6.25 to 6.72 West of Hyak Road vicinity 0.29 to 0.39Solution: Slope flattening, widen shoulders, establish clear zone

Appendix K – 72 Washington State Highway System Plan: 2003-2022 February 2002

Washington State Highway System Plan: 2003-2022 Appendix K - 73February 2002
Appendix K: 20-Year I2 Safety Strategies
South Central Region
Highway Estimate Cost RangeNumber Milepost Vicinity Description ($ in Millions)
At Grade Intersections12 191.11 to 191.11 Allan Road 8.50 to 11.50Solution: Construct Interchange
12 196.14 to 196.67 McLaughlin/Mapleway and McCormick Road 13.18 to 17.83Solution: Construct new interchange - provide connections to interchange and/or grade separations (three At Grade locations)
12 197.5 to 199.1 Old Naches Highway 22.10 to 29.90Solution: Construct Interchange and frontage roads
12 336.85 to 336.86 East. Rees/Rees Avenue 2.13 to 2.88Solution: Construct grade separation
12 337.69 to 337.69 Lower Waitsburg Road/Clinton Street 1.06 to 1.44Solution: Construct grade separation
12 338.72 to 338.73 Wilbur Avenue 8.50 to 11.50Solution: Interim solution, install traffic signal. Ultimate, construct Interchange
12 340.53 to 340.53 G Street 9.35 to 12.65Solution: Construct interchange
240 30.63 to 30.63 Stevens Drive 9.78 to 13.23Solution: Construct Interchange
395 23 to 24.5 Hillsboro Street Intersection 9.78 to 13.23Solution: Construct Interchange
395 25.11 to 25.11 Foster Wells Road 11.19 to 15.15Solution: Construct Interchange and frontage roads
395 27.64 to 27.67 Vineyard Drive 7.65 to 10.35Solution: Construct interchange and frontage roads
395 30.18 to 30.18 Crest Loch/Selph Landing Road 7.65 to 10.35Solution: Construct interchange and frontage roads
395 32.31 to 32.31 Sagemoor Road 6.80 to 9.20Solution: Construct interchange and frontage roads
395 37.37 to 37.37 Eltopia/Blanton Road 6.80 to 9.20Solution: Construct interchange and frontage roads
Risk Reduction12 314.45 to 314.58 Nine Mile Creek vicinity. 0.51 to 0.69Solution: Flatten slopes through rock cut
12 335.04 to 335.17 Vicinity SR 125 Spur 0.34 to 0.46Solution: Realign roadway to standards.
022 3.9 to 3.99 Junction US 97 vicinity. 0.24 to 0.32Solution: Improve I/South Geometrics
024 41.52 to 41.7 Priest Rapids Dam Road vicinity. 0.85 to 1.15Solution: Flatten slopes; update guardrail; realign roadway
090 79 to 79.29 Cle Elum Weigh Station vicinity. 5.38 to 7.28Solution: Realign Eastbound/Westbound roadway, reconstruct bridges
090 133.69 to 136.64 Wanapum Road vicinity. 1.39 to 1.87Solution: Realign roadway.
124 6.62 to 6.74 Milepost 6.65 0.26 to 0.35Solution: Flatten horizontal curve.
129 37.18 to 37.44 Pearcy Street vicinity. 0.32 to 0.44Solution: Realign curve; widen shoulders.
129 41.27 to 41.28 Highland Avenue 0.34 to 0.46Solution: Evaluate alternatives
821 2.36 to 25.01 I-82 to Thrall Road 4.24 to 5.74Solution: Corridor improvements: widen roadway, realign curves, safety improvements (3 RISK locations)
903 0.24 to 0.3 Junction SR 970 vicinity. 0.11 to 0.15Solution: Realign roadway

Appendix K – 74 Washington State Highway System Plan: 2003-2022 February 2002

Washington State Highway System Plan: 2003-2022 Appendix K - 75February 2002
Appendix K: 20-Year I2 Safety Strategies
Eastern Region
Highway Estimate Cost RangeNumber Milepost Vicinity Description ($ in Millions)
At Grade Intersections2 299.86 to 299.86 Colbert Road Vicinity 12.75 to 17.25Solution: Construct grade-separated interchange
195 to Thorpe Road 10.20 to 13.80Solution: Construct grade-separated interchange
195 91.17 to 91.17 Hatch Road 11.89 to 16.09Solution: Construct grade-separated interchange
195 93.83 to 93.83 Cheney-Spokane Road 11.89 to 16.09Solution: Construct grade-separated interchange
395 to Muse Road 8.87 to 11.99Solution: Construct grade-separated interchange
395 70.59 to 70.59 Cunningham Road 5.26 to 7.12Solution: Construct grade separated interchange.
395 164.51 to North Division Wye (US 395 / US 2) 4.24 to 5.74Solution: Construct grade separated interchange. Includes US 2 M.P. 292.61 to 292.86
Risk Reduction195 39.18 to 39.7 Colfax Scenic Viewpoint Vicinity 3.81 to 5.15Solution: Install barrier and set back rock cut.
291 7.08 to 14.31 Milepost 7.08 to Vicinity Suncrest 6.80 to 9.20Solution: Nine Mile Bypass Phase 1 $6.9 million, Phase 2 $20.1 million

Appendix K – 76 Washington State Highway System Plan: 2003-2022 February 2002

Economic Initiative Strategies
The strategies listed in this section describe the improve-ments that are needed to meet theeconomic initiatives objectives for the next 20 years, from 2003-2022. It is important tonote that these are planning strategies and that the project scope will be refined during theprogramming and design phases. Specific detail for each action strategy can be found inthe Objective and Action Strategies section.
Appendix K: 20-Year Improvement Strategies
0
20
40
60
80
100
120
140
160
180
200
$0
$100
$200
$300
$400
$500
$600
$700
$800
Northwest North Olympic Southwest South EasternRegion Central Region Region Central Region
Region Region
Northwest North Olympic Southwest South EasternRegion Central Region Region Central Region
Region Region
Economic Initiatives Improvement SubprogramNumber of Strategies by Region
Economic Initiatives Improvement SubprogramEstimated $ Cost in Millions by Region (2001 Dollars)
Washington State Highway System Plan: 2003-2022 Appendix K – 77: Economic Initiative StrategiesFebruary 2002

Appendix K – 788 Washington State Highway System Plan: 2003-2022 February 2002

Washington State Highway System Plan: 2003-2022 Appendix K – 79February 2002
Appendix K: 20-Year I3 Economic Initiative Strategies
Northwest Region
Highway Estimate Cost RangeNumber Milepost Vicinity Description ($ in Millions)
All Weather Roadways (Freeze/Thaw)530 32.73 to 42.56 Lake Cavanaugh Road to Fortson Mill Road 14.76 to 19.98Solution: Reconstruct roadway to eliminate roadway closures due to freeze-thaw conditions.
Bicycle Touring Routes2 31.3 to 35.9 Proctor Creek to Index-Galena Road 1.69 to 2.29Solution: Provide minimum four-foot shoulders for Rural Bicycle Touring Route.
2 38.4 to 39.8 Burlington Northern Rail Road crossing to Barclay Creek 1.39 to 1.87Solution: Provide minimum four-foot shoulders for Rural Bicycle Touring Route.
2 41.4 to 42 Northeast 194th Place to vicinity of County Road 0.09 to 0.12Solution: Provide minimum four-foot shoulders for Rural Bicycle Touring Route.
2 43.3 to 49.7 Forest Service Road #6028 to South Fork Skykomish River 1.41 to 1.91Solution: Provide minimum four-foot shoulders for Rural Bicycle Touring Route.
2 50.2 to 55.8 Ranger Station to Deception Creek 1.47 to 1.99Solution: Provide minimum four-foot shoulders for Rural Bicycle Touring Route.
20 44.66 to 46.97 North Dewey Beach Drive to Milepost 47 3.70 to 5.00Solution: Widen shoulder to 4' minimum for bicycle touring route
20 60.45 to 60.49 North Walnut Street to Rail Road crossing 0.49 to 0.67Solution: Widen shoulder to 4' minimum for bicycle touring route
20 97.83 to 100.01 Rockport to Conrad Road 2.80 to 3.78Solution: Widen shoulder to 4' minimum for bicycle touring route
20 100.17 to 102.81 Rest Area to Corkindale Creek Bridge 6.26 to 8.46Solution: Widen shoulder to 4' minimum for bicycle touring route
20 102.9 to 105.72 Corkindale Creek to Ranger Station Road 3.57 to 4.83Solution: Widen shoulder to 4' minimum for bicycle touring route
20 111.01 to 114.86 Milepost 11 to Damnation Creek Bridge 8.33 to 11.27Solution: Widen shoulder to 4' minimum for bicycle touring route
20 114.86 to 116.33 Damnation Creek to Control Section 2932 1.77 to 2.39Solution: Widen shoulder to 4' minimum for bicycle touring route
20 120.56 to 122.21 Pedestrian crossing to Half Bridge 5.25 to 7.11Solution: Widen shoulder to 4' minimum for bicycle touring route
20 122.32 to 122.95 Half Bridge to Milepost 123 2.20 to 2.98Solution: Widen shoulder to 4' minimum for bicycle touring route
20 123.38 to 124.94 Parking area to Milepost 125 4.94 to 6.68Solution: Widen shoulder to 4' minimum for bicycle touring route
20 125.07 to 126.04 Milepost 125 to Gorge Lake 3.36 to 4.54Solution: Widen shoulder to 4' minimum for bicycle touring route
20 126.13 to 130.22 Gorge Lake Bridge to U.S. Forest Service Campground 13.76 to 18.62Solution: Widen shoulder to 4' minimum for bicycle touring route
101 3 to 3.85 Fort Columbia State Park Street to Chinook 0.94 to 1.27Solution: Improve shoulder to 8' on west side
Border Crossings538 1.77 to 1.77 North 30th Street. 0.36 to 0.48Solution: Needs Further Study - Signalization to facilitate trail crossing.
539 12.54 to 15.16 SR 546 to International Boundary 6.75 to 9.13Solution: Widen to 3 lanes with a PACE lane at the border, access management
543 0.2 to 0.2 Boblett Street 0.22 to 0.30Solution: Needs Further Study - Safe crossing as SR 543 intersects with I-5 in Blaine.
548 12.98 to 13.85 Bell Road to Marine Drive 0.89 to 1.21Solution: Needs Further Study - Improvements to I-5 (parallel route) & intersection improvements

Appendix K – 80 Washington State Highway System Plan: 2003-2022 February 2002
Appendix K: 20-Year I3 Economic Initiative Strategies
Northwest Region (continued)
Highway Estimate Cost RangeNumber Milepost Vicinity Description ($ in Millions)
Economic Vitality5 225.64 to 225.64 SR 536 Interchange (Mt. Vernon) 14.03 to 18.99Solution: Modify SR 536 Interchange
5 226.7 to 228.25 2nd Street Under-crossing to Skagit River Bridge 37.57 to 50.83Solution: Widen to six Lanes. Modify 2nd Street Under-crossing and SR 538 Interchange
5 228.25 to 231.8 Skagit River to Joe Leary Slough 70.41 to 95.25Solution: Widen to six Lanes, modify Interchanges, widen bridges & add an additional Skagit River bridge
5 231.8 to 234.04 Enter City of Burlington to SR 11 34.68 to 46.92Solution: Widen to six Lanes & modify Cook Road Interchange
5 234.04 to 237.71 Samish River to Bow Hill Rest Area 33.50 to 45.32Solution: Widen to 6 Lanes, modify Bow Hill Interchange
5 246.24 to 246.24 Samish Highway Interchange 7.31 to 9.89Solution: Modify Samish Highway Interchange
5 254.82 to 254.82 SR 542/Sunset Drive Interchange (Bellingham) 3.87 to 5.23Solution: Modify SR 542 Ramps (Sunset Drive)
20 54.89 to 59.78 Fredonia to I-5 42.02 to 56.86Solution: Widen to four lanes, access management; Rebuild I-5 Interchange (WIN#12039A)
20 55.98 to 58.77 West of Sedro-Woolley 1.18 to 1.60Solution: Purchase of access rights
20 59.6 to 63.72 Interstate 5 to Sedro-Woolley 9.78 to 13.23Solution: Needs Further Study - Widen to 4 lane
525 26.96 to 27.98 Puget Drive to Ledgewood Beach Drive 0.43 to 0.58Solution: Purchase Access rights
539 0 to 0.48 Interstate 5 to Bakerview Road 6.93 to 9.37Solution: Modify I-5 Interchange, transit enhancements, new over-crossing at Orchard Road
Freight Trunk System18 11.08 to 16.31 180th Avenue southeast to Maple Valley 17.00 to 23.00Solution: Widen to 4-lane freeway
18 16.31 to 19.3 Maple Valley to Issaquah/Hobart Road 55.64 to 75.28Solution: Widen to 4-lane freeway
18 19.3 to 23.9 Issaquah/Hobart Road to Tigergate 39.98 to 54.08Solution: Widen to 4-lane freeway
18 23.9 to 27.91 Tigergate to I-90 51.45 to 69.61Solution: Widen to 4-lane freeway
519 0 to 2.26 Seattle Waterfront to I-5 62.16 to 84.10Solution: Construct a couplet between the Seattle waterfront and I-5 along South Royal Brougham Way (WB) and Atlantic Street (EB). Provide southbound ramp connection to SR 99.
Heritage Corridor Plans2 15 to 104.7 Vicinity Monroe to vicinity Peshastin 4.43 to 5.99Solution: Interpretive panels, viewpoints, Safety Rest Areas, traveler information
9 29.5 to 98.2 Vicinity Arlington to Vicinity Sumas 0.26 to 0.36Solution: Develop Corridor Management Plan (CMP)
11 0 to 21.2 Vicinity Burlington to Vicinity Bellingham 4.45 to 6.01Solution: interpretive panels, viewpoints, traveler information, guardrail replacement
20 12.9 to 204.1 Keystone Ferry to SR 153 vicinity Twisp 4.68 to 6.34Solution: Implement Corridor Management Plan (CMP) Priority Projects Example: Interpretive Safety Rest Area, Viewpoint, and other Enhancements.
202 0 to 30.5 Vicinity Bothell to Vicinity North Bend 4.43 to 5.99Solution: Implement Corridor Management Plan (CMP) Priority Projects Example: Interpretive Safety Rest Area, Viewpoint, and other Enhancements.
525 8.5 to 30.5 Clinton to Keystone (Whidbey Island) 0.20 to 0.28Solution: Develop Corridor Management Plan (CMP)
542 0 to 57.3 vicinity Bellingham to vicinity Austin Pass 4.45 to 6.01Solution: Implement Corridor Management Plan (CMP) Priority Projects Example: Interpretive Safety Rest Area, Viewpoint, and other Enhancements.
547 0 to 10.8 vicinity Kendall to vicinity Sumas 0.14 to 0.18Solution: Develop Corridor Management Plan (CMP)

Washington State Highway System Plan: 2003-2022 Appendix K – 81February 2002
Appendix K: 20-Year I3 Economic Initiative Strategies
Northwest Region (continued)
Highway Estimate Cost RangeNumber Milepost Vicinity Description ($ in Millions)
International Trade/Port Access5 251.55 to 259.85 36th Street to Slater Road 14.75 to 19.95Solution: EIS and Advanced Right of Way Procurement
5 256.98 to 256.98 Northwest Avenue Interchange (Over-crossing) 6.75 to 9.13Solution: Modify Northwest Avenue Interchange
5 257.2 to 257.2 Bakerview Road Interchange 6.60 to 8.92Solution: Modify Bakerview Road Interchange (Under crossing)
5 259.71 to 259.71 Slater Road Interchange 7.89 to 10.67Solution: Modify Slater Road Interchange
5 261.52 to 261.52 Smith Road Interchange 4.92 to 6.66Solution: Smith Road Interchange
532 0 to 2.91 East Camano Drive to Island/Snohomish County Line 10.52 to 14.24Solution: Needs Further Study - Widen to 4 Lanes
Safety Rest Area2 21 to 60 Vicinity Skykomish (Milepost 38) 1.77 to 2.39Solution:
20 97 to 108 Vicinity of Rockport (Milepost 102) 1.78 to 2.40Solution: Safety Rest Area
410 56 to 69 Vicinity Mount Rainier National Park (Milepost 63) 1.77 to 2.39Solution: Safety Rest Area

Appendix K – 82 Washington State Highway System Plan: 2003-2022 February 2002

Washington State Highway System Plan: 2003-2022 Appendix K – 83February 2002
Appendix K: 20-Year I3 Economic Initiative Strategies
North Central Region
Highway Estimate Cost RangeNumber Milepost Vicinity Description ($ in Millions)
All Weather Roadways (Freeze/Thaw)243 0 to 28.26 23 southwest to Milepost 26.7 10.61 to 14.35Solution: Overlay with 75mm of ACP or cushion with 200mm and OGEAP. Additional repair in areas of existing frost damage
262 0 to 24.22 State Route 26 to O'Sullivan Dam 7.21 to 9.75Solution: Reconstruct roadway to eliminate roadway closures due to freeze-thaw conditions.
Heritage Corridor Plans2 187.4 to 193.3 Vicinity SR 17 Coulee City to Junction SR 155 0.20 to 0.28Solution: Interpretive panels, viewpoints, Safety Rest Areas, traveler information, guardrail replacement
17 7.43 to 144.29 Vicinity Mesa to vicinity Brewster 4.43 to 5.99Solution: planning, resource identification, interpretation, and enhancement projects
20 297.23 to 436.9 Okanogan County line to vicinity Newport (Idaho Border) 0.43 to 0.58Solution: Implement Corridor Management Plan (CMP) Priority Projects Example: Interp. Safety Rest Area, Viewpoint, and other Enhancements.
97 136.6 to 185 Vicinity Ellensburg to US 2 Junction 0.43 to 0.58Solution: Implement Corridor Management Plan (CMP) Priority Projects Example: Interp. Safety Rest Area, Viewpoint, and other Enhancements.
97 199.8 to 239.6 Vicinity Monitor to US 97 vicinity Chelan 0.20 to 0.28Solution: Develop Corridor Management Plan (CMP)
153 0 to 30.1 Vicinity Pateros to Vicinity Twisp 0.20 to 0.28Solution: Develop Corridor Management Plan (CMP)
155 0 to 80.5 Vicinity Coulee City to Vicinity Omak 0.33 to 0.45Solution: Implement Corridor Management Plan (CMP) Priority Projects Example: Interpretive Safety Rest Area, Viewpoint, and other Enhancements.
262 0 to 24.2 Junction US 26 to Junction SR 17 0.20 to 0.28Solution: Develop Corridor Management Plan (CMP)
971 0 to 15 Junction Alt US 97 to vicinity Chelan 0.20 to 0.28Solution: Develop Corridor Management Plan (CMP)
Safety Rest Area2 141 to 178 Vicinity Waterville (MP160) 1.77 to 2.39Solution:
28 68 to 95 Vicinity Odessa (Milepost 85) 1.77 to 2.39Solution:
97 260 to 300 Vicinity Okanogan (MP280) 1.77 to 2.39Solution:
97 300 to 337 Vicinity Tonasket (MP318) 1.77 to 2.39Solution:

Appendix K – 84 Washington State Highway System Plan: 2003-2022 February 2002

Washington State Highway System Plan: 2003-2022 Appendix K – 85February 2002
Appendix K: 20-Year I3 Economic Initiative Strategies
Olympic Region
Highway Estimate Cost RangeNumber Milepost Vicinity Description ($ in Millions)
Bicycle Touring Routes3 2.93 to 6.59 Pine Street to Johns Creek Bridge 7.59 to 10.27Solution: Widen shoulder to 4' minimum for bicycle touring route
3 6.61 to 7.54 Johns Creek Bridge to Mason Lake Road vicinity 2.13 to 2.89Solution: Widen shoulder to 4' minimum for bicycle touring route
3 8.07 to 8.56 Ecler Road to Cranberry Creek Bridge 1.11 to 1.51Solution: Widen shoulder to 4' minimum for bicycle touring route
3 8.58 to 8.92 Cranberry Creek to Deer Creek Bridge 0.77 to 1.05Solution: Widen shoulder to 4' minimum for bicycle touring route
20 0 to 0.05 US 101 to Snow Creek Bridge 0.09 to 0.12Solution: Widen shoulder to 4' minimum for bicycle touring route
20 0.07 to 4.63 Snow Creek Bridge to Woodman Road Vicinity 10.55 to 14.27Solution: Widen shoulder to 4' minimum for bicycle touring route
20 6.25 to 7.85 4 Corners Road to SR 19-Airport Cutoff Road 3.69 to 4.99Solution: Widen shoulder to 4' minimum for bicycle touring route
101 74.74 to 76.91 North River Bridge to SR 107 5.01 to 6.77Solution: Widen shoulder to 4' minimum for bicycle touring route
101 77.07 to 77.86 SR 107 Vicinity (North of intersection) 1.81 to 2.45Solution: Widen shoulder to 4' minimum for bicycle touring route
101 111.64 to 113.09 Stevens Creek vicinity to Donkey Creek Road 3.34 to 4.52Solution: Widen shoulder to 4' minimum for bicycle touring route
101 113.09 to 119.91 Donkey Creek Road vicinity to Moclips Highway vicinity 15.80 to 21.38Solution: Widen shoulder to 4' minimum for bicycle touring route
101 119.91 to 126.69 Moclips Highway vicinity to Quinault River Bridge 15.72 to 21.26Solution: Widen shoulder to 4' minimum for bicycle touring route
101 126.69 to 130.84 Quinault River Bridge to Dry Creek Bridge 0.00 to 0.00Solution: Widen shoulder to 4' minimum for bicycle touring route
101 130.84 to 132.95 Dry Creek vicinity to Ten O Clock Creek vicinity 4.87 to 6.59Solution: Widen shoulder to 4' minimum for bicycle touring route
101 132.95 to 137.53 Dry Creek Bridge Vicinity to West Boundary Road 10.59 to 14.33Solution: Widen shoulder to 4' minimum for bicycle touring route
101 137.53 to 139.71 West Boundary Road to Raft River Bridge 5.04 to 6.82Solution: Widen shoulder to 4' minimum for bicycle touring route
101 139.73 to 143.23 Raft River Bridge to Grays Harbor/Jefferson 8.10 to 10.96Solution: Widen shoulder to 4' minimum for bicycle touring route
101 143.23 to 144.35 Grays Harbor/Jefferson County Line vicinity 2.58 to 3.48Solution: Widen shoulder to 4' minimum for bicycle touring route
101 227.66 to 231.43 Barnes Creek Bridge to Fisher Cove Road Vicinity 8.39 to 11.35Solution: Lake Crescent Alternatives (Class I trail or widen shoulders)
101 285.15 to 292.02 SR 104 vicinity to Leland Valley Road vicinity 15.90 to 21.52Solution: Widen shoulder to 4' minimum for bicycle touring route
101 292.02 to 293.5 Leland Valley to Little Quilcene River 3.41 to 4.61Solution: Widen shoulder to 4' minimum for bicycle touring route
101 293.52 to 294.63 Little Quilcene River to Bowen Street 2.56 to 3.46Solution: Widen shoulder to 4' minimum for bicycle touring route
101 294.74 to 302.26 East Rose Street to Spencer Creek Road 17.51 to 23.69Solution: Widen shoulder to 4' minimum for bicycle touring route
101 302.48 to 303.16 Bee Mill Road Vicinity 1.55 to 2.09Solution: Widen shoulder to 4' minimum for bicycle touring route
101 306.51 to 307.57 Dosewallips River vicinity to Brinnon vicinity 2.44 to 3.30Solution: Widen shoulder to 4' minimum for bicycle touring route
101 307.57 to 310.05 Old Brinnon Highway to Duckabush Slough 5.73 to 7.75Solution: Widen shoulder to 4' minimum for bicycle touring route
101 310.08 to 310.19 Duckabush Slough to Duckabush River 0.23 to 0.31Solution: Widen shoulder to 4' minimum for bicycle touring route
101 310.23 to 312.32 Duckabush River to McDonald Creek 4.81 to 6.51Solution: Widen shoulder to 4' minimum for bicycle touring route
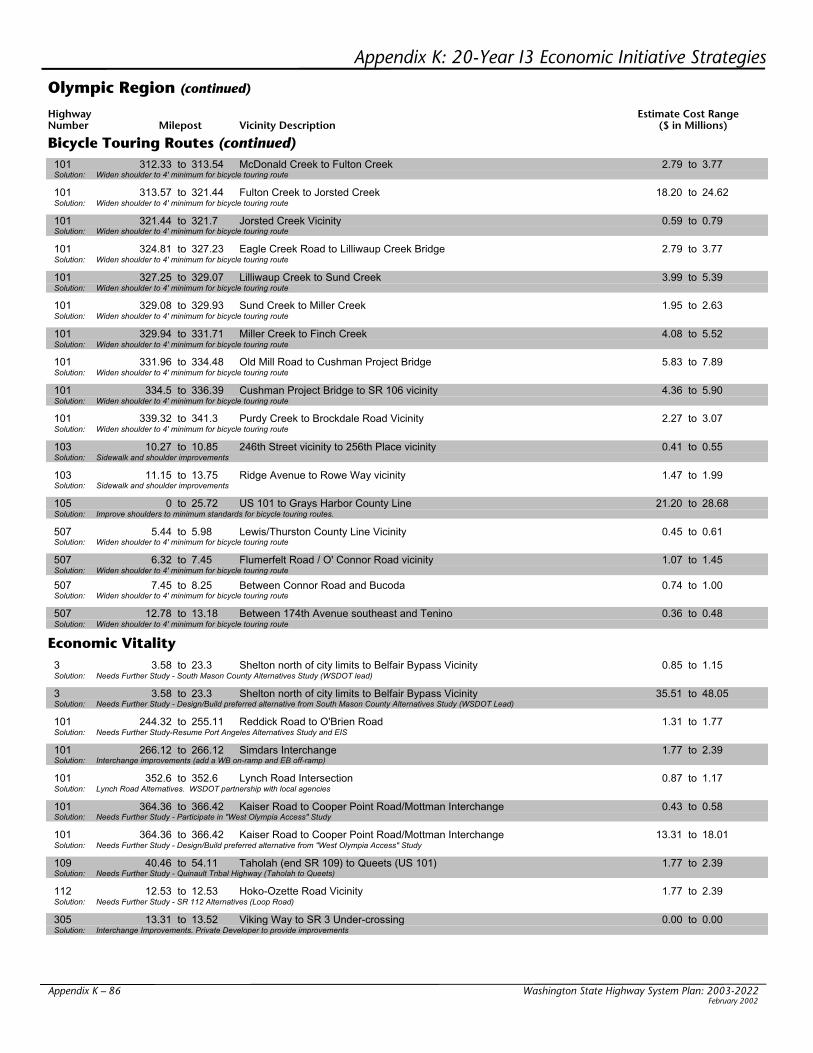
Appendix K – 86 Washington State Highway System Plan: 2003-2022 February 2002
Appendix K: 20-Year I3 Economic Initiative Strategies
Olympic Region (continued)
Highway Estimate Cost RangeNumber Milepost Vicinity Description ($ in Millions)
Bicycle Touring Routes (continued)101 312.33 to 313.54 McDonald Creek to Fulton Creek 2.79 to 3.77Solution: Widen shoulder to 4' minimum for bicycle touring route
101 313.57 to 321.44 Fulton Creek to Jorsted Creek 18.20 to 24.62Solution: Widen shoulder to 4' minimum for bicycle touring route
101 321.44 to 321.7 Jorsted Creek Vicinity 0.59 to 0.79Solution: Widen shoulder to 4' minimum for bicycle touring route
101 324.81 to 327.23 Eagle Creek Road to Lilliwaup Creek Bridge 2.79 to 3.77Solution: Widen shoulder to 4' minimum for bicycle touring route
101 327.25 to 329.07 Lilliwaup Creek to Sund Creek 3.99 to 5.39Solution: Widen shoulder to 4' minimum for bicycle touring route
101 329.08 to 329.93 Sund Creek to Miller Creek 1.95 to 2.63Solution: Widen shoulder to 4' minimum for bicycle touring route
101 329.94 to 331.71 Miller Creek to Finch Creek 4.08 to 5.52Solution: Widen shoulder to 4' minimum for bicycle touring route
101 331.96 to 334.48 Old Mill Road to Cushman Project Bridge 5.83 to 7.89Solution: Widen shoulder to 4' minimum for bicycle touring route
101 334.5 to 336.39 Cushman Project Bridge to SR 106 vicinity 4.36 to 5.90Solution: Widen shoulder to 4' minimum for bicycle touring route
101 339.32 to 341.3 Purdy Creek to Brockdale Road Vicinity 2.27 to 3.07Solution: Widen shoulder to 4' minimum for bicycle touring route
103 10.27 to 10.85 246th Street vicinity to 256th Place vicinity 0.41 to 0.55Solution: Sidewalk and shoulder improvements
103 11.15 to 13.75 Ridge Avenue to Rowe Way vicinity 1.47 to 1.99Solution: Sidewalk and shoulder improvements
105 0 to 25.72 US 101 to Grays Harbor County Line 21.20 to 28.68Solution: Improve shoulders to minimum standards for bicycle touring routes.
507 5.44 to 5.98 Lewis/Thurston County Line Vicinity 0.45 to 0.61Solution: Widen shoulder to 4' minimum for bicycle touring route
507 6.32 to 7.45 Flumerfelt Road / O' Connor Road vicinity 1.07 to 1.45Solution: Widen shoulder to 4' minimum for bicycle touring route
507 7.45 to 8.25 Between Connor Road and Bucoda 0.74 to 1.00Solution: Widen shoulder to 4' minimum for bicycle touring route
507 12.78 to 13.18 Between 174th Avenue southeast and Tenino 0.36 to 0.48Solution: Widen shoulder to 4' minimum for bicycle touring route
Economic Vitality3 3.58 to 23.3 Shelton north of city limits to Belfair Bypass Vicinity 0.85 to 1.15Solution: Needs Further Study - South Mason County Alternatives Study (WSDOT lead)
3 3.58 to 23.3 Shelton north of city limits to Belfair Bypass Vicinity 35.51 to 48.05Solution: Needs Further Study - Design/Build preferred alternative from South Mason County Alternatives Study (WSDOT Lead)
101 244.32 to 255.11 Reddick Road to O'Brien Road 1.31 to 1.77Solution: Needs Further Study-Resume Port Angeles Alternatives Study and EIS
101 266.12 to 266.12 Simdars Interchange 1.77 to 2.39Solution: Interchange improvements (add a WB on-ramp and EB off-ramp)
101 352.6 to 352.6 Lynch Road Intersection 0.87 to 1.17Solution: Lynch Road Alternatives. WSDOT partnership with local agencies
101 364.36 to 366.42 Kaiser Road to Cooper Point Road/Mottman Interchange 0.43 to 0.58Solution: Needs Further Study - Participate in "West Olympia Access" Study
101 364.36 to 366.42 Kaiser Road to Cooper Point Road/Mottman Interchange 13.31 to 18.01Solution: Needs Further Study - Design/Build preferred alternative from "West Olympia Access" Study
109 40.46 to 54.11 Taholah (end SR 109) to Queets (US 101) 1.77 to 2.39Solution: Needs Further Study - Quinault Tribal Highway (Taholah to Queets)
112 12.53 to 12.53 Hoko-Ozette Road Vicinity 1.77 to 2.39Solution: Needs Further Study - SR 112 Alternatives (Loop Road)
305 13.31 to 13.52 Viking Way to SR 3 Under-crossing 0.00 to 0.00Solution: Interchange Improvements. Private Developer to provide improvements

Washington State Highway System Plan: 2003-2022 Appendix K – 87February 2002
Appendix K: 20-Year I3 Economic Initiative Strategies
Olympic Region (continued)
Highway Estimate Cost RangeNumber Milepost Vicinity Description ($ in Millions)
Heritage Corridor Plans3 0 to 60 Vicinity Shelton to vicinity Port Gamble 0.25 to 0.33Solution: Interpretive panels, viewpoints, Safety Rest Areas, traveler information, guardrail replacement
8 0 to 20.6 Vicinity Elma to Junction US 101 0.20 to 0.28Solution: Develop Corridor Management Plan (CMP)
8 0 to 20.6 Vicinity Elma to Junction US 101 1.77 to 2.39Solution: Develop Corridor Management Plan (CMP)
12 5.5 to 21.3 Vicinity Montesano to Vicinity Elma 0.20 to 0.28Solution: Resource Inventory, traveler Information
19 0 to 14.2 Junction SR 104 to Junction SR 20 0.20 to 0.28Solution: Develop Corridor Management Plan (CMP)
20 0 to 12.6 Junction US 101 to vicinity Port Townsend 0.20 to 0.28Solution: Develop Corridor Management Plan (CMP)
101 152.1 to 367.2 Vicinity Queets to vicinity Olympia 4.43 to 5.99Solution: Implement Corridor Management Plan (CMP) Priority Projects Example: Interp. Safety Rest Area, Viewpoint, and other Enhancements.
104 0.2 to 24.5 Vicinity Discovery Bay to Kingston Ferry crossing 0.20 to 0.28Solution: Develop Corridor Management Plan (CMP)
105 0 to 30.3 Vicinity Raymond to vicinity Bay City 2.21 to 2.99Solution: Implement Corridor Management Plan (CMP) Priority Projects Example: Interp. Safety Rest Area, Viewpoint, and other Enhancements.
105 30.4 to 48.8 Vicinity Westport to vicinity Aberdeen 2.21 to 2.99Solution: Implement Corridor Management Plan (CMP) Priority Projects Example: Interp. Safety Rest Area, Viewpoint, and other Enhancements.
109 0 to 40 Vicinity Hoquiam to vicinity Queets 0.20 to 0.28Solution: Develop Corridor Management Plan (CMP)
112 0 to 61.2 Vicinity Neah Bay to Vicinity Elwha Dam 4.43 to 5.99Solution: Implement Corridor Management Plan (CMP) Priority Projects Example: Interp. Safety Rest Area, Viewpoint, and other Enhancements.
116 0 to 9.8 Vicinity Chimacum to Vicinity Fort Flagler State Park 0.11 to 0.15Solution: Develop Corridor Management Plan (CMP)
119 0 to 10.9 Vicinity Hoodsport to Vicinity Lake Cushman 0.11 to 0.15Solution: Develop Corridor Management Plan (CMP)
305 0.2 to 13.3 Vicinity Bainbridge Island to vicinity Poulsbo 0.20 to 0.28Solution: Develop Corridor Management Plan (CMP)
706 0 to 13.6 Vicinity Elbe to Mount Rainier National Park 0.20 to 0.28Solution: Develop Corridor Management Plan (CMP)
International Trade/Port Access5 108.94 to 114.65 Martin Way Interchange to Nisqually Interchange 0.25 to 0.33Solution: Needs Further Study-Participate in "Northeast Lacey Access" study
167 0 to 1.5 SR 509 to Interstate 5 275.66 to 372.96Solution: SR 167 Extension, Stage 1 from SR 509 to Interstate 5. Construct new four-lane freeway.
Safety Rest Area7 16 to 36 Vicinity Elbe (Milepost 26) 1.77 to 2.39Solution:
8 0 to 14 Vicinity Elma Westbound (Milepost 7) 1.77 to 2.39Solution:
101 102 to 163 Vicinity Olympic National Forest (Milepost 120) 1.77 to 2.39Solution:
101 209 to 270 Vicinity Sequim (Milepost 266.58) 2.55 to 3.45Solution:
101 310 to 330 Vicinity Potlatch (Milepost 310) 1.77 to 2.39Solution: Develop Safety Rest Area

Appendix K – 88 Washington State Highway System Plan: 2003-2022 February 2002

Washington State Highway System Plan: 2003-2022 Appendix K – 89February 2002
Appendix K: 20-Year I3 Economic Initiative Strategies
Southwest Region
Highway Estimate Cost RangeNumber Milepost Vicinity Description ($ in Millions)
Avalanche and Flood Closures5 76 to 82 13th Street to SR 507 44.40 to 60.06Solution: Raise grade above flood plain
Bicycle Touring Routes4 4.7 to 4.85 Naselle School vicinity 0.00 to 0.00Solution: Provide Pedestrian refuge on radii
4 4.96 to 8.26 County Road to Salmon Creek Road vicinity 2.05 to 2.77Solution: Widen shoulder to 4' minimum for bicycle touring route
4 11.38 to 15.06 Rangila Slough vicinity to County Road 2.20 to 2.98Solution: Widen shoulder to 4' minimum for bicycle touring route
4 15.06 to 19.56 Altoona-Pillar Rock Road to Slough Bridge 3.36 to 4.54Solution: Widen shoulder to 4' minimum for bicycle touring route
4 22.92 to 23.04 Milepost 22 vicinity To Milepost 23 vicinity 0.05 to 0.07Solution: Widen shoulder to 4' minimum for bicycle touring route
4 23.04 to 25.32 Milepost 23 vicinity to Bjornsgard Road vicinity 1.41 to 1.91Solution: Widen shoulder to 4' minimum for bicycle touring route
4 25.32 to 28.98 Bjornsgard Road vicinity to Skamokawa Valley Road 2.28 to 3.08Solution: Widen shoulder to 4' minimum for bicycle touring route
4 28.82 to 29.13 School Road to Steamboat Slough Road vicinity 0.11 to 0.15Solution: Provide sidewalk on South side of SR 4
4 28.98 to 29.4 Skamokawa Valley Road to Milepost 29.40 0.25 to 0.33Solution: Widen shoulder to 4' minimum for bicycle touring route
4 38.03 to 41.99 Riverview East vicinity 2.91 to 3.93Solution: Widen shoulder to 4' minimum for bicycle touring route
4 41.99 to 42.6 Riverview East vicinity 2.03 to 2.75Solution: Widen shoulder to 4' minimum for bicycle touring route
4 44.67 to 46.08 Wahkiakum/Cowlitz County Line vicinity 1.05 to 1.41Solution: Widen shoulder to 4' minimum for bicycle touring route
4 46.36 to 46.47 Mill Creek Road vicinity 0.06 to 0.08Solution: Widen shoulder to 4' minimum for bicycle touring route
4 47.72 to 48.13 Mill Creek Bridge to Abernathy Creek Bridge 0.29 to 0.39Solution: Widen shoulder to 4' minimum for bicycle touring route
4 48.16 to 48.32 Abernathy Creek Bridge to Abernathy Creek Road 0.11 to 0.15Solution: Widen shoulder to 4' minimum for bicycle touring route
4 48.32 to 48.84 Abernathy Creek Road vicinity 0.36 to 0.48Solution: Widen shoulder to 4' minimum for bicycle touring route
4 49.68 to 55.24 Half Bridge vicinity to SR 432 4.07 to 5.51Solution: Widen shoulder to 4' minimum for bicycle touring route
5 0.27 to 9.53 Interstate Bridge to I-205/179th Street Interchange 0.00 to 0.00Solution: Pedestrian Walkway
5 7.75 to 8 I-5/I-205 0.00 to 0.00Solution: Needs Further Study - Pedestrian. Trail/I-205/I-5 Connection
6 5.87 to 6.28 Maple Leaf Street vicinity to Bullard Avenue vicinity 0.29 to 0.39Solution: Provide sidewalk on South side of SR 6
6 27.99 to 28.81 Chehalis River Bridge to First Street vicinity 0.71 to 0.95Solution: Improve Bridge ends and provides sidewalks
12 135.86 to 137.02 U.S. Forest Service Road #1270 vicinity to Purcell Creek vicinity 0.26 to 0.35Solution: Widen shoulder to 4' minimum for bicycle touring route
12 139.66 to 140.38 U.S. Forest Service Road #45 vicinity to Cortwright Creek Bridge 0.16 to 0.22Solution: Widen shoulder to 4' minimum for bicycle touring route
12 140.49 to 140.91 Cortwright Creek Bridge vicinity to Milepost 141 vicinity 0.25 to 0.33Solution: Widen shoulder to 4' minimum for bicycle touring route
12 141.22 to 143.63 U.S. Forest Service Road #1276 to Slide Bridge 0.56 to 0.76Solution: Widen shoulder to 4' minimum for bicycle touring route
12 144.93 to 144.98 Gulch Bridge to Milepost 145 vicinity 0.01 to 0.01Solution: Widen shoulder to 4' minimum for bicycle touring route
12 151.64 to 159.04 South Fork Clear Creek Bridge to Indian Creek Bridge 1.77 to 2.39Solution: Widen shoulder to 4' minimum for bicycle touring route

Appendix K – 90 Washington State Highway System Plan: 2003-2022 February 2002
Appendix K: 20-Year I3 Economic Initiative Strategies
Southwest Region (continued)
Highway Estimate Cost RangeNumber Milepost Vicinity Description ($ in Millions)
Bicycle Touring Routes (continued)12 159.51 to 159.69 Indian Creek Campground vicinity 0.09 to 0.12Solution: Widen shoulder to 4' minimum for bicycle touring route
14 0.06 to 0.15 I-5 / SR 14 Junction vicinity 0.07 to 0.09Solution: Widen shoulder to 4' minimum for bicycle touring route
14 9.46 to 9.47 Quarry Road Bridge 0.00 to 0.00Solution: Widen shoulder to 4' minimum for bicycle touring route
14 12.32 to 12.33 East-6th Avenue Ramp Bridge 0.00 to 0.00Solution: Widen shoulder to 4' minimum for bicycle touring route
14 18.77 to 18.84 Burlington Northern Railroad Bridge 0.05 to 0.07Solution: Widen shoulder to 4' minimum for bicycle touring route
14 24.22 to 24.92 Milepost 24 vicinity to Half Bridge 0.42 to 0.56Solution: Widen shoulder to 4' minimum for bicycle touring route
14 24.93 to 25.04 Half Bridge to Cape Horn Slide Bridge 0.05 to 0.07Solution: Widen shoulder to 4' minimum for bicycle touring route
14 25.13 to 25.35 Cape Horn Slide Bridge vicinity 0.12 to 0.16Solution: Widen shoulder to 4' minimum for bicycle touring route
14 43.94 to 44.04 Rock Creek Bridge to First Street 0.09 to 0.12Solution: Widen shoulder to 4' minimum for bicycle touring route
14 52.36 to 53.36 Bergen Road vicinity 0.71 to 0.97Solution: Widen shoulder to 4' minimum for bicycle touring route
14 53.36 to 55.98 Cook-Underwood Road vicinity 3.18 to 4.30Solution: Widen shoulder to 4' minimum for bicycle touring route
14 55.98 to 56.28 Cook-Underwood Road vicinity 0.34 to 0.46Solution: Widen shoulder to 4' minimum for bicycle touring route
14 56.28 to 56.85 County Road vicinity 0.68 to 0.92Solution: Widen shoulder to 4' minimum for bicycle touring route
14 56.85 to 56.87 White Salmon River Bridge vicinity 0.01 to 0.01Solution: Widen shoulder to 4' minimum for bicycle touring route
14 58.1 to 58.45 Tunnel #1 to Tunnel #2 0.41 to 0.55Solution: Widen shoulder to 4' minimum for bicycle touring route
14 58.53 to 58.78 Tunnel #2 vicinity 0.30 to 0.40Solution: Widen shoulder to 4' minimum for bicycle touring route
14 58.78 to 58.92 Tunnel #3 vicinity 0.14 to 0.20Solution: Widen shoulder to 4' minimum for bicycle touring route
14 59.07 to 59.44 Gulch Bridge to Burlington Northern Railroad Bridge 0.43 to 0.58Solution: Widen shoulder to 4' minimum for bicycle touring route
14 59.44 to 59.46 Burlington Northern Railroad Bridge vicinity 0.22 to 0.30Solution: Widen shoulder to 4' minimum for bicycle touring route
14 59.46 to 59.61 Burlington Northern Railroad Bridge to Tunnel #4 0.17 to 0.23Solution: Widen shoulder to 4' minimum for bicycle touring route
14 59.66 to 60.23 Tunnel #4 to Tunnel # 5 0.68 to 0.92Solution: Widen shoulder to 4' minimum for bicycle touring route
14 60.27 to 61.62 Tunnel # 5 to SPS Railroad Bridge 1.62 to 2.20Solution: Widen shoulder to 4' minimum for bicycle touring route
14 61.65 to 63.05 SPS Railroad Bridge vicinity 1.69 to 2.29Solution: Widen shoulder to 4' minimum for bicycle touring route
14 63.05 to 63.45 White Salmon River Bridge vicinity 0.47 to 0.63Solution: Widen shoulder to 4' minimum for bicycle touring route
14 63.51 to 64.71 White Salmon River Bridge to White Salmon 1.49 to 2.01Solution: Widen shoulder to 4' minimum for bicycle touring route
14 64.71 to 64.94 Dock Grade Road vicinity 0.26 to 0.36Solution: Widen shoulder to 4' minimum for bicycle touring route
14 64.94 to 65.5 Hood River Bridge Road vicinity 0.65 to 0.89Solution: Widen shoulder to 4' minimum for bicycle touring route
14 65.5 to 65.81 White Salmon/Bingen City Limits vicinity 0.36 to 0.48Solution: Widen shoulder to 4' minimum for bicycle touring route

Washington State Highway System Plan: 2003-2022 Appendix K – 91February 2002
Appendix K: 20-Year I3 Economic Initiative Strategies
Southwest Region (continued)
Highway Estimate Cost RangeNumber Milepost Vicinity Description ($ in Millions)
Bicycle Touring Routes (continued)14 65.81 to 65.95 Bingen West City Limits to City Street 0.14 to 0.20Solution: Widen shoulder to 4' minimum for bicycle touring route
14 65.95 to 66.15 City Street to Willow Street 0.22 to 0.30Solution: Widen shoulder to 4' minimum for bicycle touring route
14 66.15 to 66.28 Willow Street to Alder Street 0.14 to 0.20Solution: Widen shoulder to 4' minimum for bicycle touring route
14 66.28 to 66.43 Alder Street to Maple Street vicinity 0.17 to 0.23Solution: Widen shoulder to 4' minimum for bicycle touring route
14 66.43 to 66.47 Maple Street vicinity 0.03 to 0.03Solution: Widen shoulder to 4' minimum for bicycle touring route
14 66.47 to 66.58 Maple Street to Cedar Street vicinity 0.11 to 0.15Solution: Widen shoulder to 4' minimum for bicycle touring route
14 66.58 to 66.71 Cedar Street vicinity to Pine Street 0.14 to 0.20Solution: Widen shoulder to 4' minimum for bicycle touring route
14 66.71 to 66.77 Pine Street to Vine Street 0.05 to 0.07Solution: Widen shoulder to 4' minimum for bicycle touring route
14 66.77 to 67.92 Vine Street to City of Bingen East City limits 1.38 to 1.86Solution: Widen shoulder to 4' minimum for bicycle touring route
14 67.92 to 68.89 City of Bingen East City limits vicinity 1.16 to 1.56Solution: Widen shoulder to 4' minimum for bicycle touring route
14 68.89 to 69.22 City of Bingen East City limits vicinity 0.38 to 0.52Solution: Widen shoulder to 4' minimum for bicycle touring route
14 76.34 to 76.54 Eighth Street to East City Limit of Lyle 0.18 to 0.24Solution: Widen shoulder to 4' minimum for bicycle touring route
14 76.88 to 76.91 Rowena Gap # 2 Tunnel 0.01 to 0.01Solution: Widen shoulder to 4' minimum for bicycle touring route
14 82 to 83.43 Murdock Road vicinity To US 197 Wye vicinity 1.05 to 1.41Solution: Widen shoulder to 4' minimum for bicycle touring route
14 84.93 to 86.03 Dalles Mt. Road vicinity To Half Bridge 1.31 to 1.77Solution: Widen shoulder to 4' minimum for bicycle touring route
14 86.04 to 86.12 Half Bridge to Horsethief Canyon 0.08 to 0.10Solution: Widen shoulder to 4' minimum for bicycle touring route
14 92.09 to 92.54 Wishram Heights to County Road 0.53 to 0.71Solution: Widen shoulder to 4' minimum for bicycle touring route
14 92.54 to 92.65 County Road to Wishram Road vicinity 0.11 to 0.15Solution: Widen shoulder to 4' minimum for bicycle touring route
14 94.45 to 95.42 Wishram Road vicinity To Milepost 95.42 1.16 to 1.56Solution: Widen shoulder to 4' minimum for bicycle touring route
14 96 to 97.01 Maryhill Museum vicinity 1.22 to 1.64Solution: Widen shoulder to 4' minimum for bicycle touring route
14 97.01 to 97.5 Maryhill Museum vicinity 0.59 to 0.79Solution: Widen shoulder to 4' minimum for bicycle touring route
14 97.5 to 98.63 Maryhill Museum vicinity 1.35 to 1.83Solution: Widen shoulder to 4' minimum for bicycle touring route
14 100.73 to 101.02 SR 14 Maryhill Spur vicinity to US 97 0.33 to 0.45Solution: Widen shoulder to 4' minimum for bicycle touring route
14 101.02 to 101.44 US 97 vicinity 0.50 to 0.68Solution: Widen shoulder to 4' minimum for bicycle touring route
14 101.64 to 102.4 US 97 vicinity To Maryhill Road 0.90 to 1.22Solution: Widen shoulder to 4' minimum for bicycle touring route
97 0 to 0.14 Oregon Street Lane to Chain Up vicinity 0.45 to 0.61Solution: Widen shoulder to 4' minimum for bicycle touring route
97 0.28 to 0.57 Maryhill State Park to Burlington Northern Railroad Bridge vicinity 0.08 to 0.10Solution: Widen shoulder to 4' minimum for bicycle touring route
97 0.61 to 1.51 Burlington Northern Railroad Bridge to SR 14 vicinity 0.29 to 0.39Solution: Widen shoulder to 4' minimum for bicycle touring route

Appendix K – 92 Washington State Highway System Plan: 2003-2022 February 2002
Appendix K: 20-Year I3 Economic Initiative Strategies
Southwest Region (continued)
Highway Estimate Cost RangeNumber Milepost Vicinity Description ($ in Millions)
Bicycle Touring Routes (continued)97 1.51 to 1.81 SR 14 vicinity 0.08 to 0.10Solution: Widen shoulder to 4' minimum for bicycle touring route
97 4.15 to 4.46 Chain Up vicinity to Milepost 5.00 vicinity 0.22 to 0.30Solution: Widen shoulder to 4' minimum for bicycle touring route
97 17.6 to 20.16 Horse Ranch Road vicinity to Chain Up area 0.73 to 0.99Solution: Widen shoulder to 4' minimum for bicycle touring route
97 20.16 to 20.17 Chain Up area 0.00 to 0.00Solution: Widen shoulder to 4' minimum for bicycle touring route
97 20.17 to 20.3 Chain Up area 0.02 to 0.02Solution: Widen shoulder to 4' minimum for bicycle touring route
97 27.16 to 28.33 Ski Lodge Road vicinity 0.71 to 0.97Solution: Widen shoulder to 4' minimum for bicycle touring route
101 0.44 to 0.46 Astoria Megler Bridge to SR 401 vicinity 0.00 to 0.00Solution: Widen shoulder to 4' minimum for bicycle touring route
101 0.61 to 0.87 SR 401 vicinity to Milepost 1.00 vicinity 0.09 to 0.12Solution: Widen shoulder to 4' minimum for bicycle touring route
101 0.87 to 1.19 SR 401 vicinity to Milepost 2.00 vicinity 0.12 to 0.16Solution: Widen shoulder to 4' minimum for bicycle touring route
101 1.19 to 2.75 Milepost 1.00 vicinity to Fort Columbia Tunnel 0.65 to 0.89Solution: Widen shoulder to 4' minimum for bicycle touring route
101 1.85 to 2.3 Milepost 1.85 to Milepost 2.30 0.00 to 0.00Solution: US 101 Realignment
101 2.91 to 3.92 Fort Columbia Tunnel to Chinook County Park vicinity 0.42 to 0.56Solution: Widen shoulder to 4' minimum for bicycle touring route
101 3.92 to 5.14 Chinook County Park Road vicinity to Pine Street 0.51 to 0.69Solution: Widen shoulder to 4' minimum for bicycle touring route
101 7.14 to 8.01 Stringtown Road to Wallicut River Bridge vicinity 0.36 to 0.48Solution: Widen shoulder to 4' minimum for bicycle touring route
101 8.01 to 9.15 Chinook Dike Road vicinity to Wallicut River Bridge 0.47 to 0.63Solution: Widen shoulder to 4' minimum for bicycle touring route
101 9.18 to 9.41 Wallicut River Bridge to US 101 Spur 0.08 to 0.10Solution: Widen shoulder to 4' minimum for bicycle touring route
101 9.41 to 10.24 US 101 Spur to Ilwaco Cemetery Road 0.34 to 0.46Solution: Widen shoulder to 4' minimum for bicycle touring route
101 10.24 to 11.13 Ilwaco Cemetery Road to Cooks Road vicinity 0.36 to 0.48Solution: Widen shoulder to 4' minimum for bicycle touring route
101 11.13 to 11.6 Cooks Road vicinity To First Street southeast vicinity 0.18 to 0.24Solution: Widen shoulder to 4' minimum for bicycle touring route
101 14.13 to 15.32 40th Street vicinity to Wallicut River Bridge 0.50 to 0.68Solution: Widen shoulder to 4' minimum for bicycle touring route
101 15.33 to 16.02 Wallicut River Bridge vicinity 0.29 to 0.39Solution: Widen shoulder to 4' minimum for bicycle touring route
101 16.02 to 16.75 Wallicut River Bridge to Creek Bridge vicinity 0.30 to 0.40Solution: Widen shoulder to 4' minimum for bicycle touring route
101 20.42 to 21.2 Greenhead Slough Bridge vicinity 0.26 to 0.36Solution: Widen shoulder to 4' minimum for bicycle touring route
101 21.2 to 25.56 Greenhead Slough Bridge to Teal Slough Bridge 1.59 to 2.15Solution: Widen shoulder to 4' minimum for bicycle touring route
101 25.61 to 25.96 Teal Slough Bridge 0.20 to 0.26Solution: Widen shoulder to 4' minimum for bicycle touring route
101 26.82 to 28.6 Government Road vicinity to SR 4 vicinity 0.64 to 0.86Solution: Widen shoulder to 4' minimum for bicycle touring route
101 30.54 to 30.62 South Nemah River Bridge vicinity 0.03 to 0.05Solution: Widen shoulder to 4' minimum for bicycle touring route
101 30.63 to 32.52 South Nemah River Bridge vicinity 0.79 to 1.07Solution: Widen shoulder to 4' minimum for bicycle touring route

Washington State Highway System Plan: 2003-2022 Appendix K – 93February 2002
Appendix K: 20-Year I3 Economic Initiative Strategies
Southwest Region (continued)
Highway Estimate Cost RangeNumber Milepost Vicinity Description ($ in Millions)
Bicycle Touring Routes (continued)101 32.53 to 33.48 South Nemah River Bridge to Lagergren Road vicinity 0.54 to 0.74Solution: Widen shoulder to 4' minimum for bicycle touring route
101 33.86 to 34.34 Middle Nemah River Bridge to Jorgenson Slough Bridge 0.18 to 0.24Solution: Widen shoulder to 4' minimum for bicycle touring route
101 34.35 to 35.14 Jorgensen Slough Bridge to North Nemah River Bridge 0.31 to 0.43Solution: Widen shoulder to 4' minimum for bicycle touring route
101 44.27 to 45.2 Weyerhaeuser Road vicinity to Bone River Bridge 0.33 to 0.45Solution: Widen shoulder to 4' minimum for bicycle touring route
101 45.26 to 48.21 Bone River Bridge vicinity to Bruceport Park 1.07 to 1.45Solution: Widen shoulder to 4' minimum for bicycle touring route
101 49.73 to 49.84 Stuart Slough Bridge vicinity 0.02 to 0.02Solution: Widen shoulder to 4' minimum for bicycle touring route
101 49.85 to 50.38 Stuart Slough Bridge vicinity to Carruthers Road 0.17 to 0.23Solution: Widen shoulder to 4' minimum for bicycle touring route
101 50.39 to 52.56 Carruthers Road vicinity to Potter Slough 0.79 to 1.07Solution: Widen shoulder to 4' minimum for bicycle touring route
101 61.29 to 62 Walch Road vicinity 0.42 to 0.56Solution: Widen shoulder to 4' minimum for bicycle touring route
101 160.44 to 185.34 Olympic National Park Road to Kallman Road vicinity 57.50 to 77.80Solution: Widen shoulder to 4' minimum for bicycle touring route
101 185.34 to 189.91 Kallman Road vicinity to Forks South of city limits vicinity 10.59 to 14.33Solution: Widen shoulder to 4' minimum for bicycle touring route
101 220.71 to 227.64 Camp David Jr Road vicinity to Barnes Creek Bridge 16.05 to 21.71Solution: Lake Crescent Alternatives (Class I trail or widen shoulders)
105 21.95 to 24.1 Whipple Avenue vicinity to Lindgren Road vicinity 0.50 to 0.68Solution: Widen shoulders to 4' both sides
131 1.82 to 1.9 Cowlitz River Bridge 0.00 to 0.00Solution: Add rail between center rail and sidewalk
141 0 to 0.52 I-5 to Columbia Shores Blvd vicinity 1.45 to 1.96Solution: Pedestrian Walkway
141 0 to 1.24 SR 14 to northeast Grandview Avenue 1.27 to 1.71Solution: Connect existing sidewalks for continuous path
141 12.14 to 13 B Z Corner vicinity 0.71 to 0.97Solution: Widen shoulders to 4' both sides
141 23.7 to 24 Glenwood Road to Park Road vicinity 0.16 to 0.22Solution: Widen shoulders to 4' both sides
411 0 to 1.5 SR 432 to Washington Street 1.30 to 1.76Solution: Connect existing sidewalks for continuous path
411 11.99 to 12.36 PH North 10 Road to Cowlitz River Bridge 0.26 to 0.35Solution: Sidewalk on both sides of roadway
411 12.75 to 13.19 A Street to North Castle Rock City Limits 0.29 to 0.39Solution: Sidewalk on both sides of roadway
432 6.21 to 7.1 SR 433 vicinity to Industrial Way 0.60 to 0.81Solution: Sidewalk on both sides of roadway
433 0.35 to 0.94 Columbia River Bridge to SR 432 0.28 to 0.38Solution: Extend sidewalk on eastside to SR 432
500 5.96 to 5.96 SR 500 Junction SR 503 0.05 to 0.07Solution: Intersection Improvements
500 8.3 to 8.65 Northeast 162nd Avenue to Pioneer Elementary School 0.43 to 0.58Solution: Sidewalk on both sides of roadway
500 17.33 to 18.78 Southeast Gardner Road to northeast 15th Avenue 1.27 to 1.71Solution: Provide sidewalks on both sides
502 2.05 to 7.04 Northeast 10th Avenue to Northeast 20th Avenue 0.14 to 0.18Solution: Widening shoulder for bike
502 2.05 to 2.05 10th Avenue (Duluth) 0.01 to 0.01Solution: Pedestrian refuge
502 7 to 7.31 Northwest 20th Avenue vicinity to Northwest 15th Avenue vicinity 0.37 to 0.49Solution: Sidewalk on both sides of roadway

Appendix K – 94 Washington State Highway System Plan: 2003-2022 February 2002
Appendix K: 20-Year I3 Economic Initiative Strategies
Southwest Region (continued)
Highway Estimate Cost RangeNumber Milepost Vicinity Description ($ in Millions)
Bicycle Touring Routes (continued)503 13.82 to 20.29 Northeast Rock Creek Road vicinity To Amboy vicinity 3.60 to 4.86Solution: Widen shoulder to 4' minimum for bicycle touring route
503 15.88 to 16.35 Northeast 365th Street vicinity to Northeast 165th Avenue 0.53 to 0.71Solution: Provide a minimum of 4' shoulders
503 20.24 to 21.1 City of Amboy 0.82 to 1.12Solution: Improve shoulders & provide sidewalks
503 20.29 to 20.39 Amboy vicinity 0.03 to 0.05Solution: Widen shoulder to 4' minimum for bicycle touring route
503 20.77 to 21.58 Chelatchie Creek Bridge to Bridge #503/019 0.44 to 0.60Solution: Widen shoulder to 4' minimum for bicycle touring route
503 21.59 to 23.48 North Branch Chelatchie Creek St to 266th vicinity 1.04 to 1.40Solution: Widen shoulder to 4' minimum for bicycle touring route
503 24.46 to 24.65 Chelatchie Creek Bridge 0.09 to 0.12Solution: Widen shoulder to 4' minimum for bicycle touring route
503 24.66 to 24.81 Chelatchie Creek to Northeast Healy Road 0.06 to 0.08Solution: Widen shoulder to 4' minimum for bicycle touring route
503 24.81 to 26.17 northeast Healy Road to Milepost 27 vicinity 0.74 to 1.00Solution: Widen shoulder to 4' minimum for bicycle touring route
503 26.56 to 27.83 Milepost 26 vicinity to Lewis River Bridge 0.69 to 0.93Solution: Widen shoulder to 4' minimum for bicycle touring route
503 27.92 to 30.73 Lewis River Bridge to Speelyia Creek Bridge 1.55 to 2.09Solution: Widen shoulder to 4' minimum for bicycle touring route
503 30.75 to 31.31 Speelyia Creek Bridge SR 503 Spur 0.30 to 0.40Solution: Widen shoulder to 4' minimum for bicycle touring route
503 31.31 to 32.49 SR 503 to Speelyia Creek Bridge 0.64 to 0.86Solution: Widen shoulder to 4' minimum for bicycle touring route
503 32.51 to 36.29 Speelyia Creek Bridge to Cougar Crest Road 2.09 to 2.83Solution: Widen shoulder to 4' minimum for bicycle touring route
503 36.12 to 36.74 Rock Creek Bridge vicinity 0.33 to 0.45Solution: Widen shoulder to 4' minimum for bicycle touring route
503 36.29 to 36.48 Cougar Crest Road to Old Lake Merrill Road vicinity 0.09 to 0.12Solution: Widen shoulder to 4' minimum for bicycle touring route
503 38.19 to 39.55 Woodland Park Road to Jim Creek Bridge 0.74 to 1.00Solution: Widen shoulder to 4' minimum for bicycle touring route
503 39.61 to 40.1 Jim Creek Bridge to North Dubois Road Wye 0.25 to 0.33Solution: Widen shoulder to 4' minimum for bicycle touring route
503 40.23 to 43.33 North Dubois Road vicinity to Merwin Village Road vicinity 1.71 to 2.31Solution: Widen shoulder to 4' minimum for bicycle touring route
503 52.12 to 54.38 McCracken Road vicinity to I-5 2.40 to 3.24Solution: Sidewalk on both sides of roadway
503 52.19 to 52.49 McCracken Road vicinity To Spruce Avenue 0.14 to 0.20Solution: Widen shoulder to 4' minimum for bicycle touring route
503 52.78 to 53.01 City of Woodland to Gun Club Road vicinity 0.11 to 0.15Solution: Widen shoulder to 4' minimum for bicycle touring route
504 0 to 0.34 I-5 to Boyd Avenue northeast vicinity 0.26 to 0.35Solution: Sidewalk improvements
504 2.19 to 5.21 Tower Road vicinity to Seaquest State Park vicinity 1.88 to 2.54Solution: Widen shoulder to 4' minimum for bicycle touring route
504 17.83 to 19.54 Kid Valley vicinity 1.13 to 1.53Solution: Widen shoulder to 4' minimum for bicycle touring route.
505 0 to 1.4 Winlock to Harkins Road 1.50 to 2.02Solution: Sidewalk & shoulder improvements
506 0 to 0.44 Ryderwood vicinity 0.45 to 0.61Solution: Sidewalks/crosswalk & caution signal
506 5.6 to 6.6 Winlock Vader Road vicinity to E St vicinity 0.50 to 0.68Solution: Improve shoulders to minimum of 4'
507 2.2 to 4.25 North Tower Street to Howard Avenue vicinity 2.73 to 3.69Solution: Sidewalk on both sides of roadway

Washington State Highway System Plan: 2003-2022 Appendix K – 95February 2002
Appendix K: 20-Year I3 Economic Initiative Strategies
Southwest Region (continued)
Highway Estimate Cost RangeNumber Milepost Vicinity Description ($ in Millions)
Bicycle Touring Routes (continued)508 8.11 to 8.6 Alexander Road vicinity to 4th Avenue 0.53 to 0.71Solution: Improve shoulders to minimum of 4'
Economic Vitality101 54.18 to 54.7 City Street to Washington Street Vicinity (Raymond) 0.00 to 0.00Solution: Traffic calming techniques
Heritage Corridor Plans4 0.1 to 54.8 Junction US 101 to vicinity Longview 4.43 to 5.99Solution: Interpretive panels, viewpoints, Safety Rest Areas, traveler information, guardrail replacement
6 0 to 51.3 Vicinity Raymond to vicinity Chehalis 0.20 to 0.28Solution: Interpretive panels, viewpoints, traveler information, pullouts
7 0 to 47.4 Vicinity Morton to Junction SR 507 0.20 to 0.28Solution: Interpretive panels, viewpoints, traveler information
12 66.6 to 185.5 Vicinity Morton to Junction SR 410 4.43 to 5.99Solution: Provide interpretive panels, viewpoints, traveler information, Safety Rest Areas, pullouts
14 18.1 to 178.9 Vicinity Washougal to Vicinity Plymouth 4.43 to 5.99Solution: Interpretive panels, viewpoints, traveler information, Safety Rest Areas, pullouts
97 0 to 76.3 Vicinity Maryhill Museum to vicinity Union Gap 0.25 to 0.33Solution: Develop Corridor Management Plan (CMP)
101 0 to 55.8 Astoria Megler Bridge to vicinity Raymond 4.43 to 5.99Solution: Implement Corridor Management Plan (CMP) Priority Projects Example: Interp. Safety Rest Area, Viewpoint, and other Enhancements.
122 0 to 7.9 Vicinity Mayfield Dam to Vicinity Mossyrock 0.11 to 0.15Solution: Develop Corridor Management Plan (CMP)
123 0 to 16.3 Vicinity Ohanapecosh to Vicinity Cayuse Pass 0.11 to 0.15Solution: Develop Corridor Management Plan (CMP)
141 0 to 29.3 Vicinity Bingen to Skamania County Line 0.20 to 0.28Solution: Develop Corridor Management Plan (CMP)
142 0 to 35.3 Vicinity Lyle to Vicinity Goldendale 4.43 to 5.99Solution: Develop Corridor Management Plan (CMP)
401 0 to 12.1 Vicinity Naselle 4.43 to 5.99Solution: Implement Corridor Management Plan (CMP) Priority Projects Example: Interp. Safety Rest Area, Viewpoint, and other Enhancements.
501 0 to 5.2 Vicinity Ridgefield 0.11 to 0.15Solution: Develop Corridor Management Plan (CMP)
503 0 to 54.3 Vicinity Woodland to vicinity Camas 0.25 to 0.33Solution: Develop Corridor Management Plan (CMP)
504 0 to 52.4 Spirit Lake Memorial Highway 2.21 to 2.99Solution: Implement Corridor Management Plan (CMP) Priority Projects Example: Interp. Safety Rest Area, Viewpoint, and other Enhancements.
505 0 to 19.29 Junction I-5 to Junction SR 504 0.20 to 0.28Solution: Develop Corridor Management Plan (CMP)
508 0 to 32.8 Vicinity Napavine to vicinity Morton 0.20 to 0.28Solution: Develop Corridor Management Plan (CMP)
Safety Rest Area12 140 to 190 Vicinity Rimrock (Milepost 165) 1.77 to 2.39Solution: Develop Safety Rest Area
14 99 to 155 Vicinity Maryhill Museum (Milepost 101) 1.77 to 2.39Solution: Develop Safety Rest Area
97 16 to 62 Vicinity Satus Pass (MP46) 1.78 to 2.40Solution: Develop Safety Rest Area
101 0 to 4 Vicinity Station Camp (Milepost 1) 1.77 to 2.39Solution:

Appendix K – 96 Washington State Highway System Plan: 2003-2022 February 2002

Washington State Highway System Plan: 2003-2022 Appendix K – 97February 2002
Appendix K: 20-Year I3 Economic Initiative Strategies
South Central Region
Highway Estimate Cost RangeNumber Milepost Vicinity Description ($ in Millions)
All Weather Roadways (Freeze/Thaw)241 8.19 to 25.14 Factory Road Vicinity to Junction State Route 24 11.71 to 15.85Solution: Reconstruct roadway to eliminate roadway closures due to freeze-thaw conditions.
Avalanche and Flood Closures90 58.04 to 58.25 Snoqualmie Pass East - Snowshed Vicinity 404.65 to 547.47Solution: Construct six-lane avalanche protection, investigate tunnel options
Bicycle Touring Routes12 315.79 to 317.98 Milepost 316 to Milepost 318 0.20 to 0.28Solution: Widen shoulder to 4' minimum for bicycle touring route
12 357.05 to 357.71 Waitsburg Vicinity 0.13 to 0.17Solution: Widen shoulder to 4' minimum for bicycle touring route
12 366.6 to 367.02 Dayton Vicinity 0.11 to 0.15Solution: Widen shoulder to 4' minimum for bicycle touring route
12 391.01 to 403.13 Junction SR 127 to Pomeroy 1.29 to 1.75Solution: Widen shoulder to 4' minimum for bicycle touring route
12 432.71 to 434.1 US 128 junction to Bridge Street 0.78 to 1.06Solution: Widen shoulder to 4' minimum for bicycle touring route
22 0.98 to 2.57 I-82 to Toppenish City Limits to Solution: Widen shoulders for pedestrian/bike (cost included in I-1 project, I-82 to Toppenish)
395 16.17 to 17.72 West 10th St to Yelm St Wye 0.85 to 1.15Solution: Widen shoulder to 4' minimum for bicycle touring route
395 18.25 to 18.25 US 395/SR 240 Interchange 0.22 to 0.30Solution: Construct separate path @ US 395/US 240 Interchange vicinity for better pedestrian/bike access.
Columbia/Snake River Accommodations730 0 to 6.08 Oregon State Line to US 12 15.99 to 21.63Solution: Widen to four lanes (in the event of the Snake River Drawdown)
Economic Vitality12 293.62 to 293.62 A Street Intersection 11.46 to 15.50Solution: Construct diamond interchange
12 434.1 to 434.19 Snake River Bridge 44.40 to 60.06Solution: Widen to six lanes
82 32.72 to 33.24 Fair Avenue Ramps 10.63 to 14.38Solution: Construct two flyover ramps (I-82 to Fair Avenue)
82 36.03 to 36.64 Valley Mall Blvd Interchange 9.78 to 13.23Solution: Construct capacity improvements for interchange ramps and crossroad
82 37.24 to 38.48 South Union Gap interchange 25.50 to 34.50Solution: Complete interchange - add two ramps: Union Gap to westbound I-82 and eastbound I-82 to Union Gap
82 99.8 to 99.8 I-82 to Red Mountain Road 10.57 to 14.31Solution: Construct Red Mountain Interchange on I-82 and four lane roadway connecting to existing US 224; widen US 224 to four lanes to Red Mountain Vicinity
90 55 to 70 Snoqualmie Pass East 321.81 to 435.39Solution: Reconstruct to six travel lanes
90 108.31 to 108.31 Damman Road Vicinity 10.20 to 13.80Solution: Construct interchange
125 5.77 to 6.76 Pine St to North City Limits 1.78 to 2.40Solution: Widen to four lanes
129 36.62 to 41.4 Cleveland St to 6th Street 15.45 to 20.91Solution: Widen to four lanes
129 41.4 to 42.17 6th St to SR 129 Spur, Clarkston 5.77 to 7.81Solution: Widen to four lanes
182 10.8 to 10.84 Argent Road 10.44 to 14.12Solution: Construct Interchange
224 0 to 4.24 I-82 to Red Mountain Road to Solution: Construct Red Mountain Interchange on I-82 and four lane roadway connecting to existing US 224; widen US 224 to 4 lanes to Red Mountain Vicinity (cost shown on I-82
Economic Vitality project)
224 4.24 to 7.55 Red Mountain Road vicinity to South 38th Avenue 8.17 to 11.05Solution: Widen to four lane roadway, signalize major intersections

Appendix K – 98 Washington State Highway System Plan: 2003-2022 February 2002
Appendix K: 20-Year I3 Economic Initiative Strategies
South Central Region (continued)
Highway Estimate Cost RangeNumber Milepost Vicinity Description ($ in Millions)
Economic Vitality (continued)395 56.66 to 56.66 Lind Road intersection 8.88 to 12.02Solution: Construct interchange
397 0 to 11 I-82 to SR 397 intertie 12.88 to 17.42Solution: Construct new roadway connecting I-82 in vicinity of Union Loop Road to SR 397
397 8.18 to 8.18 Railroad grade crossing (Ainsworth) 7.91 to 10.70Solution: Construct Rail Road grade separation
397 8.43 to 9.18 Grey Avenue to North Property Line BPIC 0.89 to 1.21Solution: Widen to four lanes with two-way left turn lane
Heritage Corridor Plans10 88.3 to 104.5 Vicinity Teanaway to Vicinity Ellensburg 0.87 to 1.17Solution: Provide interpretive panels, viewpoints, and traveler information
12 295.3 to 431.7 Tri-Cities to Vicinity Clarkston 4.43 to 5.99Solution: Complete Port of Wall Walla Viewpoint, and L&C Priority Projects with Transportation benefits
82 112.3 to 132.6 SR 395 vicinity Tri-Cities to Oregon Border 2.22 to 3.00Solution: Develop Corridor Management Plan (CMP)
90 18.4 to 100.7 Vicinity Seattle to vicinity Ellensburg 4.43 to 5.99Solution: Implement Corridor Management Plan (CMP) Priority Projects Example: Interp. Safety Rest Area, Viewpoint, and other Enhancements.
129 0 to 42.6 Oregon State Line to Vicinity Clarkston 0.22 to 0.30Solution: Develop Corridor Management Plan (CMP)
261 0.1 to 29.4 Junction US 12 to Junction SR 260 0.20 to 0.28Solution: Develop Corridor Management Plan (CMP)
410 29.7 to 116.5 Vicinity Enumclaw to vicinity Naches 4.45 to 6.01Solution: Implement Corridor Management Plan (CMP) Priority Projects Example: Interp. Safety Rest Area, Viewpoint, and other Enhancements.
821 0 to 25.2 Vicinity Yakima to vicinity Ellensburg 4.45 to 6.01Solution: Implement Corridor Management Plan (CMP) Priority Projects Example: Interp. Safety Rest Area, Viewpoint, and other Enhancements.
Safety Rest Area12 294 to 330 Vicinity Wallula (Milepost 304) 1.77 to 2.39Solution: Develop Safety Rest Area
12 335 to 370 Vicinity Dayton (Milepost 361) 1.77 to 2.39Solution: Develop Safety Rest Area
90 28 to 60 Vicinity Snoqualmie Pass (Milepost 54) 1.78 to 2.40Solution: Develop Safety Rest Area

Washington State Highway System Plan: 2003-2022 Appendix K – 99February 2002
Appendix K: 20-Year I3 Economic Initiative Strategies
Eastern Region (continued)
Highway Estimate Cost RangeNumber Milepost Vicinity Description ($ in Millions)
All Weather Roadways (Freeze/Thaw)20 412 to 421.07 Milepost 412 to Kings Lake Road 11.12 to 15.04Solution: Overlay
31 to Metaline Falls to International Border 10.20 to 13.80Solution: All weather reconstruction
211 27.24 to 37.4 Lind to Junction I-90 1.94 to 2.62Solution: Reconstruct roadway to eliminate roadway closures due to freeze-thaw conditions.
211 104.57 to 116.78 Wilbur to Keller 2.08 to 2.82Solution: Reconstruct roadway to eliminate roadway closures due to freeze-thaw conditions.
231 44.29 to 61.6 Junction 231 to Harrington 1.45 to 1.97Solution: Overlay
231 45.4 to 61.14 Junction State Route 291 to Springdale 12.75 to 17.25Solution: Overlay
231 62.14 to 75.61 Junction State Route 292 to Junction US 395 8.90 to 12.04Solution: Reconstruct roadway to eliminate roadway closures due to freeze/thaw conditions.
Bicycle Touring Routes2 334.24 to 334.51 City of Newport 0.29 to 0.39Solution: Widen shoulder to 4' minimum for bicycle touring route
20 to Okanogan County line to Vicinity Newport (Idaho border) 0.43 to 0.58Solution: Implement Corridor Management Plan, Priority Projects. Example: Interpretive Safety Rest Area, Viewpoint, and other Enhancements
20 302.56 to 302.6 City of Republic 0.79 to 1.07Solution: Widen shoulder to 4' minimum for bicycle touring route.
20 305.48 to 307.77 SR 21 to Yentner Road 1.47 to 1.99Solution: Widen shoulder to 4' minimum for bicycle touring route.
20 307.77 to 311.95 Yentner Road to Walker Hill Road 2.68 to 3.62Solution: Widen shoulder to 4' minimum for bicycle touring route.
20 311.95 to 331.31 Walker Hill Road to Growden Road 12.50 to 16.92Solution: Widen shoulder to 4' minimum for bicycle touring route.
20 331.31 to 331.65 Growden Road to South Fork Sherman Road 0.09 to 0.12Solution: Widen shoulder to 4' minimum for bicycle touring route.
20 331.65 to 336.85 Vicinity South Fork Sherman Road 3.34 to 4.52Solution: Widen shoulder to 4' minimum for bicycle touring route.
20 336.85 to 342.08 South Fork Sherman Road to US 395 1.43 to 1.93Solution: Widen shoulder to 4' minimum for bicycle touring route.
20 390.41 to 421.42 Tiger vicinity to Cusick 2.91 to 3.93Solution: Widen shoulder to 4' minimum for bicycle touring route.
Economic Vitality90 272.48 to 273.19 SR 902 (Medical Lake) Interchange 4.43 to 5.99Solution: Interchange improvements
90 275.93 to 276.76 Geiger Road Interchange 3.99 to 5.39Solution: Interchange capacity improvements
90 293.61 to 294.45 Barker Road interchange 7.09 to 9.59Solution: Revise interchange
90 294.93 to 295.29 Greenacres interchange 13.31 to 18.01Solution: Revise interchange
90 295.73 to 296.46 Harvard Road interchange 18.64 to 25.22Solution: Harvard Road interchange improvements
90 298.8 to 299.82 Idaho Road interchange 15.98 to 21.62Solution: Revise interchange
195 38.58 to 38.58 At SR 26 Intersection (Colfax) 4.43 to 5.99Solution: Intersection capacity improvement
206 0 to 0.04 Market Street 8.87 to 11.99Solution: Intersection improvements
395 61.12 to 61.12 Muse Road 8.87 to 11.99Solution: Interchange construction.
395 67.32 to 68.32 Sutton Road 8.87 to 11.99Solution: Construct interchange.

Appendix K – 100 Washington State Highway System Plan: 2003-2022 February 2002
Appendix K: 20-Year I3 Economic Initiative Strategies
Eastern Region (continued)
Highway Estimate Cost RangeNumber Milepost Vicinity Description ($ in Millions)
Economic Vitality (continued)395 70.59 to 70.59 Cunningham Road 8.87 to 11.99Solution: Interchange construction.
395 180.46 to 180.46 Monroe Road 8.87 to 11.99Solution: Interchange construction.
Heritage Corridor Plans25 23.4 to 121.2 Spokane River Bridge to Canadian Boarder 0.33 to 0.45Solution: Develop Corridor Management Plan (CMP)
31 0 to 26.8 SR 20 in Tiger to the Canadian Border 4.43 to 5.99Solution: Implement Corridor Management Plan (CMP) Priority Projects Example: Interpretive. Safety Rest Area, Viewpoint, and other Enhancements.
194 0 to 21 Almota to Pullman 0.20 to 0.28Solution: Develop Corridor Management Plan (CMP)
211 0 to 15.2 US 2 Junction to vicinity Usk 0.20 to 0.28Solution: Develop Corridor Management Plan (CMP)
231 0 to 28.1 Sprague to Junction US 2 0.20 to 0.28Solution: Develop Corridor Management Plan (CMP)
261 to Junction US 12 to Junction SR 260 0.20 to 0.28Solution: Develop Corridor Management Plan
272 0 to 19.2 Colfax to Idaho State Line 0.20 to 0.28Solution: Develop Corridor Management Plan (CMP)
395 232.3 to 241.6 Mill Creek to Columbia River 0.36 to 0.48Solution: Develop Corridor Management Plan
International Trade/Port Access395 to Lind Road Intersection 8.87 to 11.99Solution: Construct Interchange
Safety Rest Area2 310 to 406 Junction US 2/SR 211 (Milepost 318) 1.77 to 2.39Solution:
25 22 to 81 Vicinity Hunters (Milepost 44) 1.77 to 2.39Solution:
28 to Vicinity Odessa 1.77 to 2.39Solution: Safety Rest Area

Environmental Retrofit Strategies
The strategies listed in this section describe the improvements that are needed to meet theenvironmental retrofit objectives for the next 20 years, from 2003-2022. It is important tonote that these are planning strategies and that the project scope will be refined during theprogramming and design phases. Specific detail for each action strategy can be found in theObjective and Action Strategies section.
These graphs represent the total number and costs of solutions for the I4 Subprogram anddo not reflect the identified statewide list of stormwater retrofit strategies. A statewide list ofthe top 304 prioritized outfalls is located at the end of this section.
Appendix K: 20-Year Improvement Strategies
0
20
40
60
80
100
120
140
160
180
200
$0
$10
$20
$30
$40
$50
$60
Northwest North Olympic Southwest South EasternRegion Central Region Region Central Region
Region Region
Northwest North Olympic Southwest South EasternRegion Central Region Region Central Region
Region Region
Environmental Retrofit Improvement SubprogramNumber of Strategies by Region
Environmental Retrofit Improvement SubprogramEstimated $ Cost in Millions by Region (2001 Dollars)
Washington State Highway System Plan: 2003-2022 Appendix K – 101: Environment Retrofit StrategiesFebruary 2002

Appendix K – 1022 Washington State Highway System Plan: 2003-2022 February 2002

Washington State Highway System Plan: 2003-2022 Appendix K – 103February 2002
Appendix K: 20-Year I4 Environmental Retrofit Strategies
Northwest Region
Highway Estimate Cost RangeNumber Milepost Vicinity Description ($ in Millions)
Fish Barriers5 182.73 to 182.73 Swamp Creek tributary to Sammamish River 0.20 to 0.26Solution: Improve structure to eliminate restriction to fish passage at this location.
5 182.73 to 182.73 Swamp Creek tributary to Sammamish River 0.20 to 0.26Solution: Improve structure to eliminate restriction to fish passage at this location.
5 213.22 to 213.22 Unnamed tributary to Pilchuck Creek 0.20 to 0.26Solution: Improve structure to eliminate restriction to fish passage at this location.
5 213.25 to 213.25 Unnamed tributary to Pilchuck Creek 0.20 to 0.26Solution: Improve structure to eliminate restriction to fish passage at this location.
5 213.26 to 213.26 Unnamed tributary to Pilchuck Creek 0.20 to 0.26Solution: Improve structure to eliminate restriction to fish passage at this location.
5 213.66 to 213.66 Unnamed tributary to Pilchuck Creek 0.20 to 0.26Solution: Improve structure to eliminate restriction to fish passage at this location.
5 224.62 to 224.62 Maddox Creek tributary to Skagit Bay 0.79 to 1.07Solution: Improve structure to eliminate restriction to fish passage at this location.
5 244.2 to 244.2 Barnes Creek tributary to Samish Lake 2.91 to 3.93Solution: Improve structure to eliminate restriction to fish passage at this location.
5 244.2 to 244.2 Barnes Creek tributary to Samish Lake 0.20 to 0.26Solution: Improve structure to eliminate restriction to fish passage at this location.
9 38.6 to 38.6 Unnamed tributary to Stillaguamish River (05.0) 0.20 to 0.26Solution: Improve structure to eliminate restriction to fish passage at this location.
9 41.07 to 41.07 Norway Park Creek tributary to Lake Mc Murr 0.51 to 0.69Solution: Improve structure to eliminate restriction to fish passage at this location.
9 48 to 48 Gribble Creek tributary to Skagit River 0.52 to 0.70Solution: Improve structure to eliminate restriction to fish passage at this location.
9 76.91 to 76.91 Unnamed tributary to Black Slough (SF Nooksack River) 0.20 to 0.26Solution: Improve structure to eliminate restriction to fish passage at this location.
9 77.12 to 77.12 Black Slough tributary to SF Nooksack River 0.20 to 0.26Solution: Improve structure to eliminate restriction to fish passage at this location.
9 77.43 to 77.43 Unnamed tributary to Unnamed (SF Nooksack River) 0.20 to 0.26Solution: Improve structure to eliminate restriction to fish passage at this location.
11 18.62 to 18.62 Unnamed tributary to Chuckanut Creek 0.20 to 0.26Solution: Improve structure to eliminate restriction to fish passage at this location.
18 18.19 to 18.19 Unnamed tributary to Downs Creek (Cedar River) 0.20 to 0.26Solution: Improve structure to eliminate restriction to fish passage at this location.
18 18.43 to 18.43 Taylor Creek tributary to Downs Creek (Cedar River) 0.20 to 0.26Solution: Improve structure to eliminate restriction to fish passage at this location.
18 25.8 to 25.8 Deep Creek tributary to Raging River 0.20 to 0.26Solution: Improve structure to eliminate restriction to fish passage at this location.
18 27.6 to 27.6 Lake Creek tributary to Raging River 0.20 to 0.26Solution: Improve structure to eliminate restriction to fish passage at this location.
18 27.6 to 27.6 Lake Creek tributary to Raging River 0.20 to 0.26Solution: Improve structure to eliminate restriction to fish passage at this location.
20 99.9 to 99.9 Sutter Creek tributary to Skagit River 0.00 to 0.00Solution: Improve structure to eliminate restriction to fish passage at this location.
20 110.95 to 110.95 Cub Creek tributary to Bacon Creek 0.00 to 0.00Solution: Improve structure to eliminate restriction to fish passage at this location.
90 13.83 to 13.83 Lewis Creek tributary to Lake Sammamish 0.00 to 0.00Solution: Improve structure to eliminate restriction to fish passage at this location.
92 0.47 to 0.47 Stevens Creek tributary to Lake Stevens 0.00 to 0.00Solution: Improve structure to eliminate restriction to fish passage at this location.
92 1.93 to 1.93 Catherine Creek tributary to Little Pilchuck Creek 0.20 to 0.26Solution: Improve structure to eliminate restriction to fish passage at this location.
99 6.86 to 6.86 WF Hylebos Creek tributary to Hylebos Creek 0.20 to 0.26Solution: Improve structure to eliminate restriction to fish passage at this location.
104 25.7 to 25.7 Willow Creek tributary to Puget Sound 0.20 to 0.26Solution: Improve structure to eliminate restriction to fish passage at this location.

Appendix K – 104 Washington State Highway System Plan: 2003-2022 February 2002
Appendix K: 20-Year I4 Environmental Retrofit Strategies
Northwest Region (continued)
Highway Estimate Cost RangeNumber Milepost Vicinity Description ($ in Millions)
Fish Barriers (continued)104 30.6 to 30.6 Unnamed tributary to Lyon Creek (Lake Washington) 0.20 to 0.26Solution: Improve structure to eliminate restriction to fish passage at this location.
104 31.3 to 31.3 Lyon Creek tributary to Lake Washington 0.20 to 0.26Solution: Improve structure to eliminate restriction to fish passage at this location.
164 9.1 to 9.1 Unnamed tributary to White River 0.20 to 0.26Solution: Improve structure to eliminate restriction to fish passage at this location.
169 22.12 to 22.12 Holder Creek tributary to Issaquah Creek 0.20 to 0.26Solution: Improve structure to eliminate restriction to fish passage at this location.
203 4.37 to 4.37 Unnamed tributary to Snoqualmie River 0.00 to 0.00Solution: Improve structure to eliminate restriction to fish passage at this location.
203 13.6 to 13.6 Unnamed tributary to Snoqualmie River 0.00 to 0.00Solution: Improve structure to eliminate restriction to fish passage at this location.
405 15.09 to 15.09 Yarrow Creek tributary to Lake Washington 0.20 to 0.26Solution: Improve structure to eliminate restriction to fish passage at this location.
405 26.46 to 26.46 Perry Creek tributary to North Creek 0.20 to 0.26Solution: Improve structure to eliminate restriction to fish passage at this location.
405 26.87 to 26.87 Unnamed tributary to North Creek 0.20 to 0.26Solution: Improve structure to eliminate restriction to fish passage at this location.
410 27.44 to 27.44 Boise Creek tributary to White River 0.20 to 0.26Solution: Improve structure to eliminate restriction to fish passage at this location.
410 27.44 to 27.44 Boise Creek tributary to White River 0.20 to 0.26Solution: Improve structure to eliminate restriction to fish passage at this location.
410 27.77 to 27.77 Clay Creek tributary to Greenwater River 0.00 to 0.00Solution: Improve structure to eliminate restriction to fish passage at this location.
410 36.49 to 36.49 Cyclone Creek tributary to White River 0.20 to 0.26Solution: Improve structure to eliminate restriction to fish passage at this location.
410 55.51 to 55.51 Unnamed tributary to White River 0.20 to 0.26Solution: Improve structure to eliminate restriction to fish passage at this location.
509 20.35 to 20.35 Des Moines Creek tributary to Puget Sound 0.21 to 0.29Solution: Improve structure to eliminate restriction to fish passage at this location.
522 2 to 2 Maple Leaf Creek tributary to Thorton Creek 0.20 to 0.26Solution: Improve structure to eliminate restriction to fish passage at this location.
522 6.63 to 6.63 Unnamed tributary to Lake Washington 0.00 to 0.00Solution: Improve structure to eliminate restriction to fish passage at this location.
522 17.48 to 17.48 Unnamed tributary to Unnamed 0.20 to 0.26Solution: Improve structure to eliminate restriction to fish passage at this location.
522 18.44 to 18.44 Unnamed tributary to Evans Creek 0.20 to 0.26Solution: Improve structure to eliminate restriction to fish passage at this location.
522 18.77 to 18.77 Unnamed tributary to Anderson 0.20 to 0.26Solution: Improve structure to eliminate restriction to fish passage at this location.
522 19.26 to 19.26 Anderson Creek tributary to Snohomish River 0.20 to 0.26Solution: Improve structure to eliminate restriction to fish passage at this location.
522 20.21 to 20.21 Elliott Creek tributary to Snohomish River 0.20 to 0.26Solution: Improve structure to eliminate restriction to fish passage at this location.
524 4.01 to 4.01 Scriber Creek tributary to Scriber Lake 0.00 to 0.00Solution: Improve structure to eliminate restriction to fish passage at this location.
524 4.01 to 4.01 Scriber Creek tributary to Scriber Lake 0.20 to 0.26Solution: Improve structure to eliminate restriction to fish passage at this location.
524 5.54 to 5.54 Golde Creek tributary to Scriber Creek 0.20 to 0.26Solution: Improve structure to eliminate restriction to fish passage at this location.
524 6.95 to 6.95 Unnamed tributary to Swamp Creek 0.20 to 0.26Solution: Improve structure to eliminate restriction to fish passage at this location.
524 9.1 to 9.1 Unnamed tributary to North Creek 0.20 to 0.26Solution: Improve structure to eliminate restriction to fish passage at this location.
527 2.78 to 2.78 Unnamed tributary to North River 0.20 to 0.26Solution: Improve structure to eliminate restriction to fish passage at this location.

Washington State Highway System Plan: 2003-2022 Appendix K – 105February 2002
Appendix K: 20-Year I4 Environmental Retrofit Strategies
Northwest Region (continued)
Highway Estimate Cost RangeNumber Milepost Vicinity Description ($ in Millions)
Fish Barriers (continued)530 24.7 to 24.7 Unnamed tributary to Stillaguamish River 0.20 to 0.26Solution: Improve structure to eliminate restriction to fish passage at this location.
530 25.7 to 25.7 Unnamed tributary to North Fork Stillaguamish River 0.20 to 0.26Solution: Improve structure to eliminate restriction to fish passage at this location.
530 26.4 to 26.4 Unnamed tributary to Stillaguamish River 0.20 to 0.26Solution: Improve structure to eliminate restriction to fish passage at this location.
530 26.66 to 26.66 Unnamed tributary to North Fork Stillaguamish River 2.21 to 2.99Solution: Improve structure to eliminate restriction to fish passage at this location.
530 26.7 to 26.7 Unnamed tributary to North Fork Stillaguamish River 0.20 to 0.26Solution: Improve structure to eliminate restriction to fish passage at this location.
530 27.45 to 27.45 Unnamed tributary to North Fork Stillaguamish River 0.20 to 0.26Solution: Improve structure to eliminate restriction to fish passage at this location.
530 34.3 to 34.3 Unnamed tributary to Fry Creek (North Fork Stilly) 0.20 to 0.26Solution: Improve structure to eliminate restriction to fish passage at this location.
530 35.2 to 35.2 Unnamed tributary to Montague Creek 0.09 to 0.12Solution: Improve structure to eliminate restriction to fish passage at this location.
530 42.2 to 42.2 Little French Creek tributary to Stillaguamish 0.00 to 0.00Solution: Improve structure to eliminate restriction to fish passage at this location.
530 42.2 to 42.2 Little French Creek tributary to Stillaguamish 0.09 to 0.12Solution: Improve structure to eliminate restriction to fish passage at this location.
530 43 to 43 Fortson Creek tributary to North Fork Stillaguamish 0.00 to 0.00Solution: Improve structure to eliminate restriction to fish passage at this location.
530 44.2 to 44.2 Old Moose Creek tributary to North Fork Stillaguamish 0.20 to 0.26Solution: Improve structure to eliminate restriction to fish passage at this location.
530 44.2 to 44.2 Old Moose Creek tributary to North Fork Stillaguamish 0.20 to 0.26Solution: Improve structure to eliminate restriction to fish passage at this location.
532 9.75 to 9.75 Unnamed tributary to Pilchuck Creek 0.20 to 0.26Solution: Improve structure to eliminate restriction to fish passage at this location.
534 1.2 to 1.2 Unnamed tributary to Bulson Creek 0.00 to 0.00Solution: Improve structure to eliminate restriction to fish passage at this location.
539 4.3 to 4.3 Deer Creek tributary to Nooksack River 0.20 to 0.26Solution: Improve structure to eliminate restriction to fish passage at this location.
542 2.4 to 2.4 Toad Lake Creek tributary to Squalicum Creek 0.20 to 0.26Solution: Improve structure to eliminate restriction to fish passage at this location.
542 15.05 to 15.05 Unnamed tributary to North Fork Nooksack River 0.00 to 0.00Solution: Improve structure to eliminate restriction to fish passage at this location.
542 15.05 to 15.05 Unnamed tributary to North Fork Nooksack River 0.20 to 0.26Solution: Improve structure to eliminate restriction to fish passage at this location.
542 24.9 to 24.9 High Creek tributary to Kendall Creek 0.50 to 0.68Solution: Improve structure to eliminate restriction to fish passage at this location.
542 27.18 to 27.18 Unnamed tributary to Nooksack River 0.00 to 0.00Solution: Improve structure to eliminate restriction to fish passage at this location.
542 28.72 to 28.72 Baptist Camp Creek tributary to North Fork Nooksack 0.07 to 0.09Solution: Improve structure to eliminate restriction to fish passage at this location.
542 29 to 29 Unnamed tributary to North Fork Nooksack River 0.50 to 0.68Solution: Improve structure to eliminate restriction to fish passage at this location.
542 32 to 32 Hedrick Creek tributary to Nooksack River 0.25 to 0.33Solution: Improve structure to eliminate restriction to fish passage at this location.
542 32 to 32 Hedrick Creek tributary to Nooksack River 1.05 to 1.41Solution: Improve structure to eliminate restriction to fish passage at this location.
542 34.56 to 34.56 Unnamed tributary to North Fork Nooksack River 0.20 to 0.26Solution: Improve structure to eliminate restriction to fish passage at this location.
900 15.86 to 15.86 Unnamed tributary to May Creek 0.43 to 0.58Solution: Improve structure to eliminate restriction to fish passage at this location.
900 20.09 to 20.09 Unnamed tributary to Tibbetts Creek 0.07 to 0.09Solution: Improve structure to eliminate restriction to fish passage at this location.
900 20.34 to 20.34 Unnamed tributary to Tibbetts Creek 0.20 to 0.26Solution: Improve structure to eliminate restriction to fish passage at this location.

Appendix K – 106 Washington State Highway System Plan: 2003-2022 February 2002
Appendix K: 20-Year I4 Environmental Retrofit Strategies
Northwest Region (continued)
Highway Estimate Cost RangeNumber Milepost Vicinity Description ($ in Millions)
Noise Reduction2 to 2 South 228th Street 0.54 to 0.74
Solution: The proposed mitigation is a Concrete barrier, which is approximately 12 feet high and 1440 long.
3 to 3 Glenn Drive 0.26 to 0.35Solution: The proposed mitigation is a Concrete barrier, which is approximately 12.5 feet high and 700 long.
5 to 5 138th Ave Northeast 0.31 to 0.41Solution: The proposed mitigation is a Concrete barrier, which is approximately 14 feet high and 720 long.
6 to 6 Lake Forest Park 0.53 to 0.71Solution: The proposed mitigation is a Concrete barrier, which is approximately 12 feet high and 1476 long.
6 to 7 Uplake Terrace 0.48 to 0.64Solution: The proposed mitigation is a Concrete barrier, which is approximately 10.5 feet high and 1612 long.
25 to 26 Northeast Ramp SR518 Interchange 0.54 to 0.74Solution: The proposed mitigation is a Concrete barrier, which is approximately 11.4 feet high and 1545 long.
520 1 to 2 Foster Island 0.35 to 0.47Solution: The proposed mitigation is a Berm / Concrete barrier, which is approximately 5 feet high and 2710 long.
520 1 to 2 Arboretum 0.37 to 0.51Solution: The proposed mitigation is a Berm / Concrete barrier, which is approximately 5 feet high and 2830 long.
544 24 to 24 Fifth Ave SE 0.41 to 0.55Solution: The proposed mitigation is a Concrete barrier, which is approximately 12 feet high and 1145 long.

Washington State Highway System Plan: 2003-2022 Appendix K – 107February 2002
Appendix K: 20-Year I4 Environmental Retrofit Strategies
North Central Region
Highway Estimate Cost RangeNumber Milepost Vicinity Description ($ in Millions)
Fish Barriers2 70.21 to 70.21 Mill Creek tributary to Nason Creek 0.00 to 0.00Solution: Improve structure to eliminate restriction to fish passage at this location.
2 82.06 to 82.06 Unnamed tributary to Nason Creek 0.20 to 0.26Solution: Improve structure to eliminate restriction to fish passage at this location.
2 87.1 to 87.1 Skinney Creek tributary to Chiwaukum Creek 0.20 to 0.26Solution: Improve structure to eliminate restriction to fish passage at this location.
2 87.1 to 87.1 Skinney Creek tributary to Chiwaukum Creek 0.20 to 0.26Solution: Improve structure to eliminate restriction to fish passage at this location.
2 87.67 to 87.67 Skinney Creek tributary to Chiwaukum Creek 0.20 to 0.26Solution: Improve structure to eliminate restriction to fish passage at this location.
2 87.67 to 87.67 Skinney Creek tributary to Chiwaukum Creek 0.20 to 0.26Solution: Improve structure to eliminate restriction to fish passage at this location.
2 88.03 to 88.03 Skinney Creek tributary to Chiwaukum Creek 0.20 to 0.26Solution: Improve structure to eliminate restriction to fish passage at this location.
2 88.03 to 88.03 Skinney Creek tributary to Chiwaukum Creek 0.20 to 0.26Solution: Improve structure to eliminate restriction to fish passage at this location.
20 168.25 to 168.25 Pine Creek tributary to Early Winters Creek 0.20 to 0.26Solution: Improve structure to eliminate restriction to fish passage at this location.
20 173.16 to 173.16 Varden Creek tributary to Early Winters Creek 0.20 to 0.26Solution: Improve structure to eliminate restriction to fish passage at this location.
20 174.98 to 174.98 Pekin Creek tributary to Early Winters Creek 0.20 to 0.26Solution: Improve structure to eliminate restriction to fish passage at this location.
20 181.34 to 181.34 Little Boulder Creek tributary to Methow River 0.20 to 0.26Solution: Improve structure to eliminate restriction to fish passage at this location.
20 185.93 to 185.93 Boesel Canyon Creek tributary 0.20 to 0.26Solution: Improve structure to eliminate restriction to fish passage at this location.
20 188.17 to 188.17 Unnamed tributary to Methow River 0.31 to 0.43Solution: Improve structure to eliminate restriction to fish passage at this location.
20 205.84 to 205.84 Beaver Creek tributary to Methow River 0.20 to 0.26Solution: Improve structure to eliminate restriction to fish passage at this location.
20 205.84 to 205.84 Beaver Creek tributary to Methow River 0.20 to 0.26Solution: Improve structure to eliminate restriction to fish passage at this location.
20 206.85 to 206.85 Frazer Creek tributary to Beaver Creek 0.20 to 0.26Solution: Improve structure to eliminate restriction to fish passage at this location.
20 206.85 to 206.85 Frazer Creek tributary to Beaver Creek 0.18 to 0.24Solution: Improve structure to eliminate restriction to fish passage at this location.
20 208.44 to 208.44 Unnamed tributary to Frazer Creek 0.00 to 0.00Solution: Improve structure to eliminate restriction to fish passage at this location.
20 213.99 to 213.99 Frazer Creek tributary to Beaver Creek 0.20 to 0.26Solution: Improve structure to eliminate restriction to fish passage at this location.
20 215.96 to 215.96 Summit Creek tributary to Loup Loup Creek 0.20 to 0.26Solution: Improve structure to eliminate restriction to fish passage at this location.
20 218.48 to 218.48 Summit Creek tributary to Loup Loup Creek 0.00 to 0.00Solution: Improve structure to eliminate restriction to fish passage at this location.
20 219.38 to 219.38 Summit Creek tributary to Loup Loup Creek 0.20 to 0.26Solution: Improve structure to eliminate restriction to fish passage at this location.
20 220.1 to 220.1 Unnamed tributary to Summit Creek (Okanogan 0.20 to 0.26Solution: Improve structure to eliminate restriction to fish passage at this location.
20 224.49 to 224.49 Tallant Creek tributary to Okanogan River 0.20 to 0.26Solution: Improve structure to eliminate restriction to fish passage at this location.
20 225.6 to 225.6 Tallant Creek tributary to Okanogan River 0.20 to 0.26Solution: Improve structure to eliminate restriction to fish passage at this location.
20 226.27 to 226.27 Tallant Creek tributary to Okanogan River 0.20 to 0.26Solution: Improve structure to eliminate restriction to fish passage at this location.
20 226.96 to 226.96 Tallant Creek tributary to Okanogan River 0.20 to 0.26Solution: Improve structure to eliminate restriction to fish passage at this location.

Appendix K – 108 Washington State Highway System Plan: 2003-2022 February 2002
Appendix K: 20-Year I4 Environmental Retrofit Strategies
North Central Region (continued)
Highway Estimate Cost RangeNumber Milepost Vicinity Description ($ in Millions)
Fish Barriers (continued)20 227.22 to 227.22 Tallant Creek tributary to Okanogan River 0.20 to 0.26Solution: Improve structure to eliminate restriction to fish passage at this location.
20 227.22 to 227.22 Tallant Creek tributary to Okanogan River 0.84 to 1.14Solution: Improve structure to eliminate restriction to fish passage at this location.
20 227.22 to 227.22 Tallant Creek tributary to Okanogan River 0.20 to 0.26Solution: Improve structure to eliminate restriction to fish passage at this location.
20 263.4 to 263.4 Bonaparte Creek tributary to Okanogan River 0.00 to 0.00Solution: Improve structure to eliminate restriction to fish passage at this location.
20 263.62 to 263.62 Bonaparte Creek tributary to Okanogan River 0.20 to 0.26Solution: Improve structure to eliminate restriction to fish passage at this location.
20 264.08 to 264.08 Bonaparte Creek tributary to Okanogan River 0.20 to 0.26Solution: Improve structure to eliminate restriction to fish passage at this location.
20 266.22 to 266.22 Bonaparte Creek tributary to Okanogan River 0.20 to 0.26Solution: Improve structure to eliminate restriction to fish passage at this location.
20 278.6 to 278.6 Bonaparte Creek tributary to Okanogan River 0.20 to 0.26Solution: Improve structure to eliminate restriction to fish passage at this location.
20 279.3 to 279.3 Bonaparte Creek tributary to Okanogan River 0.20 to 0.26Solution: Improve structure to eliminate restriction to fish passage at this location.
20 283.52 to 283.52 Unnamed tributary to Bonaparte Creek 0.20 to 0.26Solution: Improve structure to eliminate restriction to fish passage at this location.
20 284.52 to 284.52 Unnamed tributary to Bonaparte Creek 0.20 to 0.26Solution: Improve structure to eliminate restriction to fish passage at this location.
21 175.2 to 175.2 St. Peter's Creek tributary to Curlew Creek 0.43 to 0.58Solution: Improve structure to eliminate restriction to fish passage at this location.
26 1.79 to 1.79 Sand Hollow Creek tributary to Columbia River 0.20 to 0.26Solution: Improve structure to eliminate restriction to fish passage at this location.
26 1.79 to 1.79 Sand Hollow Creek tributary to Columbia River 0.20 to 0.26Solution: Improve structure to eliminate restriction to fish passage at this location.
26 29.85 to 29.85 Unnamed tributary to Lower Crab Creek 0.20 to 0.26Solution: Improve structure to eliminate restriction to fish passage at this location.
26 29.92 to 29.92 Unnamed tributary to Lower Crab Creek 0.20 to 0.26Solution: Improve structure to eliminate restriction to fish passage at this location.
28 2.28 to 2.28 Sand Canyon Springs tributary to Columbia 0.20 to 0.26Solution: Improve structure to eliminate restriction to fish passage at this location.
28 22.27 to 22.27 Baird Springs tributary to Columbia River 0.20 to 0.26Solution: Improve structure to eliminate restriction to fish passage at this location.
97 152.92 to 152.92 Mill Creek tributary to Swauk Creek 0.20 to 0.26Solution: Improve structure to eliminate restriction to fish passage at this location.
97 159.72 to 159.72 Swauk Creek tributary to Yakima River 0.20 to 0.26Solution: Improve structure to eliminate restriction to fish passage at this location.
97 164.7 to 164.7 Tronsen Creek tributary to Peshastin Creek 0.20 to 0.26Solution: Improve structure to eliminate restriction to fish passage at this location.
97 164.7 to 164.7 Tronsen Creek tributary to Peshastin Creek 0.07 to 0.09Solution: Improve structure to eliminate restriction to fish passage at this location.
97 165.77 to 165.77 Tronsen Creek tributary to Peshastin Creek 0.07 to 0.09Solution: Improve structure to eliminate restriction to fish passage at this location.
97 166.23 to 166.23 Tronsen Creek tributary to Peshastin Creek 0.00 to 0.00Solution: Improve structure to eliminate restriction to fish passage at this location.
97 220.76 to 220.76 Byrd Canyon Creek tributary to Columbia River 0.33 to 0.45Solution: Improve structure to eliminate restriction to fish passage at this location.
97 222.02 to 222.02 Oklahoma Gulch tributary to Columbia River 0.20 to 0.26Solution: Improve structure to eliminate restriction to fish passage at this location.
97 222.02 to 222.02 Oklahoma Gulch tributary to Columbia River 0.33 to 0.45Solution: Improve structure to eliminate restriction to fish passage at this location.
97 261.24 to 261.24 Unnamed tributary to Columbia River 0.20 to 0.26Solution: Improve structure to eliminate restriction to fish passage at this location.

Washington State Highway System Plan: 2003-2022 Appendix K – 109February 2002
Appendix K: 20-Year I4 Environmental Retrofit Strategies
North Central Region (continued)
Highway Estimate Cost RangeNumber Milepost Vicinity Description ($ in Millions)
Fish Barriers (continued)97 299.03 to 299.03 Johnson Creek tributary to Okanogan River 0.20 to 0.26Solution: Improve structure to eliminate restriction to fish passage at this location.
97 324.67 to 324.67 Mosquito Creek tributary to Okanogan River 0.20 to 0.26Solution: Improve structure to eliminate restriction to fish passage at this location.
97 328.16 to 328.16 Whistler Canyon Creek tributary to Okanogan 0.20 to 0.26Solution: Improve structure to eliminate restriction to fish passage at this location.
153 7.62 to 7.62 Squaw Creek tributary to Methow River 0.20 to 0.26Solution: Improve structure to eliminate restriction to fish passage at this location.
153 24.3 to 24.3 Leecher Canyon Creek tributary to Methow River 0.87 to 1.17Solution: Improve structure to eliminate restriction to fish passage at this location.
155 60.76 to 60.76 Omak Creek tributary to Okanogan River 0.29 to 0.39Solution: Improve structure to eliminate restriction to fish passage at this location.
155 60.76 to 60.76 Omak Creek tributary to Okanogan River 0.20 to 0.26Solution: Improve structure to eliminate restriction to fish passage at this location.
155 60.92 to 60.92 Trail Creek tributary to Omak Creek 0.20 to 0.26Solution: Improve structure to eliminate restriction to fish passage at this location.
155 62.41 to 62.41 Unnamed tributary to Omak Creek 0.31 to 0.43Solution: Improve structure to eliminate restriction to fish passage at this location.
155 65.05 to 65.05 Clark Creek tributary to Omak Creek 0.20 to 0.26Solution: Improve structure to eliminate restriction to fish passage at this location.
155 65.59 to 65.59 Swimptkin Creek tributary to Omak Creek 0.20 to 0.26Solution: Improve structure to eliminate restriction to fish passage at this location.
155 66.94 to 66.94 Stapaloop Creek tributary to Omak Creek 0.20 to 0.26Solution: Improve structure to eliminate restriction to fish passage at this location.
155 75.81 to 75.81 Mission Creek tributary to Omak Creek 0.20 to 0.26Solution: Improve structure to eliminate restriction to fish passage at this location.
173 260.28 to 260.28 Swamp Creek tributary to Columbia River 0.20 to 0.26Solution: Improve structure to eliminate restriction to fish passage at this location.
Noise Reduction2 115.1 to 115.2 County Park @ Monitor 0.54 to 0.74Solution: The proposed mitigation is a Concrete barrier, which is approximately 8 feet high and 2400 long.
2 119.1 to 119.1 Wenatchee, Chelan County 0.30 to 0.40Solution: The proposed mitigation is a Concrete barrier, which is approximately 8 feet high and 1350 long.
2 120.6 to 120.6 East Wenatchee, Douglas County 0.08 to 0.10Solution: The proposed mitigation is a Concrete barrier, which is approximately 8 feet high and 400 long.
17 52.19 to 52.19 Chief Moses Jr. High School 0.26 to 0.36Solution: The proposed mitigation is a Concrete barrier, which is approximately 8 feet high and 1200 long.
17 52.8 to 52.8 School / Park - Moses Lake 0.23 to 0.31Solution: The proposed mitigation is a Concrete barrier, which is approximately 8 feet high and 1100 long.
17 53.2 to 53.2 Grand Drive, Moses Lake 1.14 to 1.54Solution: The proposed mitigation is a Concrete barrier, which is approximately 12 feet high and 3071 long.
17 55.7 to 55.7 Grape Drive, Moses Lake 0.53 to 0.71Solution: The proposed mitigation is a Concrete barrier, which is approximately 14 feet high and 1200 long.
17 56.9 to 56.9 Trailer Park 0.53 to 0.71Solution: The proposed mitigation is a Concrete barrier, which is approximately 14 feet high and 1200 long.
17 57.1 to 57.1 Offut Drive, Moses Lake 1.92 to 2.60Solution: The proposed mitigation is a Concrete barrier, which is approximately 14 feet high and 4330 long.
17 58.3 to 58.3 Castle Drive, Moses Lake 0.68 to 0.92Solution: The proposed mitigation is a Concrete barrier, which is approximately 14 feet high and 1500 long.
207 13 to 13 Northwest 41.5 0.84 to 1.14Solution: The proposed mitigation is a Concrete barrier, which is approximately 15 feet high and 1700 long.

Appendix K – 110 Washington State Highway System Plan: 2003-2022 February 2002

Washington State Highway System Plan: 2003-2022 Appendix K – 111February 2002
Appendix K: 20-Year I4 Environmental Retrofit Strategies
Olympic Region
Highway Estimate Cost RangeNumber Milepost Vicinity Description ($ in Millions)
Fish Barriers3 23.94 to 23.94 Unnamed tributary to Hood Canal 0.20 to 0.26Solution: Improve structure to eliminate restriction to fish passage at this location.
3 25.31 to 25.31 Unnamed tributary to Hood Canal 0.11 to 0.15Solution: Improve structure to eliminate restriction to fish passage at this location.
3 26.4 to 26.4 Unnamed tributary to Union River 0.00 to 0.00Solution: Improve structure to eliminate restriction to fish passage at this location.
3 29.63 to 29.63 Unnamed tributary to Union River (Hood Canal) 0.20 to 0.26Solution: Improve structure to eliminate restriction to fish passage at this location.
3 32.1 to 32.1 Gorst Creek tributary to Sinclair Inlet 0.20 to 0.26Solution: Improve structure to eliminate restriction to fish passage at this location.
3 32.1 to 32.1 Gorst Creek tributary to Puget Sound 0.20 to 0.26Solution: Improve structure to eliminate restriction to fish passage at this location.
3 44.6 to 44.6 Unnamed tributary to Strawberry Creek 0.00 to 0.00Solution: Improve structure to eliminate restriction to fish passage at this location.
3 46.09 to 46.09 Unnamed tributary to Clear Creek 0.20 to 0.26Solution: Improve structure to eliminate restriction to fish passage at this location.
3 50.87 to 50.87 SF Johnson Creek tributary to Liberty Bay 0.20 to 0.26Solution: Improve structure to eliminate restriction to fish passage at this location.
3 50.95 to 50.95 Johnson Creek (middle fork) tributary to Liberty Bay 0.20 to 0.26Solution: Improve structure to eliminate restriction to fish passage at this location.
3 52.21 to 52.21 Johnson Creek tributary to Liberty Bay 0.69 to 0.93Solution: Improve structure to eliminate restriction to fish passage at this location.
3 57.23 to 57.23 Unnamed tributary to Kinman Creek 0.00 to 0.00Solution: Improve structure to eliminate restriction to fish passage at this location.
3 58.21 to 58.21 Unnamed tributary to Hood Canal 0.00 to 0.00Solution: Improve structure to eliminate restriction to fish passage at this location.
3 58.48 to 58.48 Spring Creek tributary to Hood Canal 0.00 to 0.00Solution: Improve structure to eliminate restriction to fish passage at this location.
5 105.85 to 105.85 Indian Creek tributary to Moxlie Creek 0.20 to 0.26Solution: Improve structure to eliminate restriction to fish passage at this location.
7 21.3 to 21.3 Unnamed tributary to Alder Lake 0.20 to 0.26Solution: Improve structure to eliminate restriction to fish passage at this location.
7 21.3 to 21.3 Unnamed tributary to Alder Lake 0.20 to 0.26Solution: Improve structure to eliminate restriction to fish passage at this location.
7 22.8 to 22.8 Unnamed tributary to Alder Lake 0.20 to 0.26Solution: Improve structure to eliminate restriction to fish passage at this location.
8 12.15 to 12.15 Unnamed tributary to Kennedy Creek 0.20 to 0.26Solution: Improve structure to eliminate restriction to fish passage at this location.
8 12.16 to 12.16 Unnamed tributary to Kennedy Creek 0.37 to 0.49Solution: Improve structure to eliminate restriction to fish passage at this location.
8 13.5 to 13.5 Unnamed tributary to Kennedy Creek 0.00 to 0.00Solution: Improve structure to eliminate restriction to fish passage at this location.
8 13.5 to 13.5 Unnamed tributary to Kennedy Creek 0.16 to 0.22Solution: Improve structure to eliminate restriction to fish passage at this location.
8 14.1 to 14.1 Unnamed tributary to Kennedy Creek 0.20 to 0.26Solution: Improve structure to eliminate restriction to fish passage at this location.
8 14.8 to 14.8 Unnamed tributary to Kennedy Creek 0.20 to 0.26Solution: Improve structure to eliminate restriction to fish passage at this location.
8 14.8 to 14.8 Unnamed tributary to Kennedy Creek 0.14 to 0.20Solution: Improve structure to eliminate restriction to fish passage at this location.
8 15.2 to 15.2 Unnamed tributary to Kennedy Creek 0.16 to 0.22Solution: Improve structure to eliminate restriction to fish passage at this location.
8 17.2 to 17.2 Unnamed tributary to Perry Creek 0.20 to 0.26Solution: Improve structure to eliminate restriction to fish passage at this location.
12 5.2 to 5.2 Unnamed tributary to Chehalis River 0.20 to 0.26Solution: Improve structure to eliminate restriction to fish passage at this location.

Appendix K – 112 Washington State Highway System Plan: 2003-2022 February 2002
Appendix K: 20-Year I4 Environmental Retrofit Strategies
Olympic Region (continued)
Highway Estimate Cost RangeNumber Milepost Vicinity Description ($ in Millions)
Fish Barriers (continued)12 5.4 to 5.4 Unnamed tributary to Chehalis River 0.00 to 0.00Solution: Improve structure to eliminate restriction to fish passage at this location.
12 6.57 to 6.57 Unnamed tributary to Higgins Slough 0.20 to 0.26Solution: Improve structure to eliminate restriction to fish passage at this location.
12 6.64 to 6.64 Unnamed tributary to Higgins Slough Tributary 0.20 to 0.26Solution: Improve structure to eliminate restriction to fish passage at this location.
12 6.9 to 6.9 Unnamed tributary to Higgins Slough (Chehalis River) 0.33 to 0.45Solution: Improve structure to eliminate restriction to fish passage at this location.
12 7.26 to 7.26 Unnamed tributary to Higgins Slough 0.25 to 0.33Solution: Improve structure to eliminate restriction to fish passage at this location.
12 28.2 to 28.2 Unnamed tributary to Chehalis River 0.20 to 0.26Solution: Improve structure to eliminate restriction to fish passage at this location.
12 29.19 to 29.19 Unnamed tributary to Unnamed 0.20 to 0.26Solution: Improve structure to eliminate restriction to fish passage at this location.
12 29.45 to 29.45 Unnamed tributary to Chehalis River 0.20 to 0.26Solution: Improve structure to eliminate restriction to fish passage at this location.
16 to McCormick Creek tributary to Henderson Bay 0.20 to 0.26Solution: Improve structure to eliminate restriction to fish passage at this location.
16 14.63 to 14.63 Unnamed tributary to McCormick Creek 2.10 to 2.84Solution: Improve structure to eliminate restriction to fish passage at this location.
16 14.86 to 14.86 McCormick Creek tributary to Henderson Bay 0.18 to 0.24Solution: Improve structure to eliminate restriction to fish passage at this location.
16 15.01 to 15.01 Unnamed tributary to McCormick Creek 0.00 to 0.00Solution: Improve structure to eliminate restriction to fish passage at this location.
16 19.54 to 19.54 Unnamed tributary to Burley Creek 0.20 to 0.26Solution: Improve structure to eliminate restriction to fish passage at this location.
16 20.36 to 20.36 Unnamed tributary to Burley Creek 0.20 to 0.26Solution: Improve structure to eliminate restriction to fish passage at this location.
16 26.8 to 26.8 Ross Creek tributary to Sinclair Inlet 0.20 to 0.26Solution: Improve structure to eliminate restriction to fish passage at this location.
16 27.1 to 27.1 Unnamed tributary to Ross Creek 0.20 to 0.26Solution: Improve structure to eliminate restriction to fish passage at this location.
19 4.3 to 4.3 Unnamed tributary to EF Chimacum 0.20 to 0.26Solution: Improve structure to eliminate restriction to fish passage at this location.
101 68.99 to 68.99 Unnamed tributary to Lower Salmon Creek 0.00 to 0.00Solution: Improve structure to eliminate restriction to fish passage at this location.
101 68.99 to 68.99 Unnamed tributary to Lower Salmon Creek 0.20 to 0.26Solution: Improve structure to eliminate restriction to fish passage at this location.
101 71.02 to 71.02 Joe's Creek tributary to North River 0.20 to 0.26Solution: Improve structure to eliminate restriction to fish passage at this location.
101 71.02 to 71.02 Joe's Creek tributary to North River 0.20 to 0.26Solution: Improve structure to eliminate restriction to fish passage at this location.
101 73.35 to 73.35 Unnamed tributary to Unnamed (24.0133) 0.20 to 0.26Solution: Improve structure to eliminate restriction to fish passage at this location.
101 75.05 to 75.05 Unnamed tributary to Little North River 0.00 to 0.00Solution: Improve structure to eliminate restriction to fish passage at this location.
101 76.48 to 76.48 Mosquito Creek tributary to North River 0.20 to 0.26Solution: Improve structure to eliminate restriction to fish passage at this location.
101 100.7 to 100.7 Unnamed tributary to SF Big Creek tributary 0.00 to 0.00Solution: Improve structure to eliminate restriction to fish passage at this location.
101 100.9 to 100.9 Unnamed tributary to SF Big Creek tributary 0.20 to 0.26Solution: Improve structure to eliminate restriction to fish passage at this location.
101 111.3 to 111.3 Unnamed tributary to Stevens Creek 0.13 to 0.17Solution: Improve structure to eliminate restriction to fish passage at this location.
101 111.3 to 111.3 Unnamed tributary to Stevens Creek 0.20 to 0.26Solution: Improve structure to eliminate restriction to fish passage at this location.

Washington State Highway System Plan: 2003-2022 Appendix K – 113February 2002
Appendix K: 20-Year I4 Environmental Retrofit Strategies
Olympic Region (continued)
Highway Estimate Cost RangeNumber Milepost Vicinity Description ($ in Millions)
Fish Barriers (continued)101 123.05 to 123.05 McCalla Creek tributary to Quinault River 0.20 to 0.26Solution: Improve structure to eliminate restriction to fish passage at this location.
101 126.2 to 126.2 Unnamed tributary to Quinault River 0.20 to 0.26Solution: Improve structure to eliminate restriction to fish passage at this location.
101 137.35 to 137.35 Crane Creek tributary to Raft River 1.25 to 1.69Solution: Improve structure to eliminate restriction to fish passage at this location.
101 155.2 to 155.2 Unnamed tributary to Pacific Ocean 0.20 to 0.26Solution: Improve structure to eliminate restriction to fish passage at this location.
101 155.2 to 155.2 Unnamed tributary to Pacific Ocean 0.20 to 0.26Solution: Improve structure to eliminate restriction to fish passage at this location.
101 161.5 to 161.5 Unnamed tributary to Pacific Ocean 0.20 to 0.26Solution: Improve structure to eliminate restriction to fish passage at this location.
101 167.67 to 167.67 Fletcher Creek tributary to Hoh River 0.20 to 0.26Solution: Improve structure to eliminate restriction to fish passage at this location.
101 175.45 to 175.45 Unnamed tributary to Old Joe Slough 0.20 to 0.26Solution: Improve structure to eliminate restriction to fish passage at this location.
101 181.4 to 181.4 Unnamed tributary to Dowans Creek (Bogachiel River) 0.20 to 0.26Solution: Improve structure to eliminate restriction to fish passage at this location.
101 181.4 to 181.4 Unnamed tributary to Dowans Creek (Bogachiel River) 0.20 to 0.26Solution: Improve structure to eliminate restriction to fish passage at this location.
101 189.2 to 189.2 Unnamed tributary to Grader Creek 0.00 to 0.00Solution: Improve structure to eliminate restriction to fish passage at this location.
101 247.8 to 247.8 Peabody Creek tributary to Strait of Juan De Fuca 0.20 to 0.26Solution: Improve structure to eliminate restriction to fish passage at this location.
101 249.4 to 249.4 White Creek tributary to Strait of Juan De Fuca 0.00 to 0.00Solution: Improve structure to eliminate restriction to fish passage at this location.
101 250.5 to 250.5 Lees Creek tributary to Strait of Juan De Fuca 0.20 to 0.26Solution: Improve structure to eliminate restriction to fish passage at this location.
101 271.98 to 271.98 Chicken Coop Creek tributary to Strait of Juan De Fuca 0.20 to 0.26Solution: Improve structure to eliminate restriction to fish passage at this location.
101 277.9 to 277.9 Contractors Creek tributary to Discovery Bay 0.20 to 0.26Solution: Improve structure to eliminate restriction to fish passage at this location.
101 324.1 to 324.1 Unnamed tributary to Hood Canal 0.20 to 0.26Solution: Improve structure to eliminate restriction to fish passage at this location.
101 324.3 to 324.3 Unnamed tributary to Hood Canal 0.00 to 0.00Solution: Improve structure to eliminate restriction to fish passage at this location.
101 331.9 to 331.9 Unnamed tributary to Hood Canal 0.20 to 0.26Solution: Improve structure to eliminate restriction to fish passage at this location.
101 360.6 to 360.6 Unnamed tributary to Madrona Beach (Puget Sound) 0.00 to 0.00Solution: Improve structure to eliminate restriction to fish passage at this location.
104 4.25 to 4.25 Unnamed tributary to Barnhouse Creek 0.20 to 0.26Solution: Improve structure to eliminate restriction to fish passage at this location.
104 5.75 to 5.75 Unnamed tributary to Chimacum Creek 0.20 to 0.26Solution: Improve structure to eliminate restriction to fish passage at this location.
104 12.57 to 12.57 Unnamed tributary to Squamish Harbor 0.20 to 0.26Solution: Improve structure to eliminate restriction to fish passage at this location.
104 12.7 to 12.7 Unnamed tributary to Squamish Harbor 0.20 to 0.26Solution: Improve structure to eliminate restriction to fish passage at this location.
104 16.55 to 16.55 Unnamed tributary to Hood Canal 0.20 to 0.26Solution: Improve structure to eliminate restriction to fish passage at this location.
104 17.82 to 17.82 Unnamed tributary to Port Gamble 0.20 to 0.26Solution: Improve structure to eliminate restriction to fish passage at this location.
104 19.39 to 19.39 Unnamed tributary to Port Gamble 0.20 to 0.26Solution: Improve structure to eliminate restriction to fish passage at this location.
104 22.95 to 22.95 Unnamed tributary to Appletree Cove 0.20 to 0.26Solution: Improve structure to eliminate restriction to fish passage at this location.

Appendix K – 114 Washington State Highway System Plan: 2003-2022 February 2002
Appendix K: 20-Year I4 Environmental Retrofit Strategies
Olympic Region (continued)
Highway Estimate Cost RangeNumber Milepost Vicinity Description ($ in Millions)
Fish Barriers (continued)105 31.39 to 31.39 Unnamed tributary to South Bay (Grays Harbor) 0.20 to 0.26Solution: Improve structure to eliminate restriction to fish passage at this location.
105 38.1 to 38.1 Unnamed tributary to Johns River 0.20 to 0.26Solution: Improve structure to eliminate restriction to fish passage at this location.
106 0.85 to 0.85 Skobob Creek tributary to Hood Canal 0.20 to 0.26Solution: Improve structure to eliminate restriction to fish passage at this location.
106 2.95 to 2.95 Unnamed tributary to Skokomish River 0.20 to 0.26Solution: Improve structure to eliminate restriction to fish passage at this location.
106 6.95 to 6.95 Unnamed tributary to Hood Canal 0.20 to 0.26Solution: Improve structure to eliminate restriction to fish passage at this location.
106 6.95 to 6.95 Unnamed tributary to Hood Canal 0.20 to 0.26Solution: Improve structure to eliminate restriction to fish passage at this location.
107 0.76 to 0.76 Unnamed tributary to Little North River 0.20 to 0.26Solution: Improve structure to eliminate restriction to fish passage at this location.
108 7.6 to 7.6 Unnamed tributary to Skookum Creek 0.60 to 0.82Solution: Improve structure to eliminate restriction to fish passage at this location.
109 3.41 to 3.41 Unnamed tributary to Grays Harbor 0.00 to 0.00Solution: Improve structure to eliminate restriction to fish passage at this location.
109 26.1 to 26.1 Unnamed tributary to Pacific Ocean 0.20 to 0.26Solution: Improve structure to eliminate restriction to fish passage at this location.
109 26.11 to 26.11 Unnamed tributary to Pacific Ocean 0.25 to 0.33Solution: Improve structure to eliminate restriction to fish passage at this location.
109 33.1 to 33.1 Unnamed tributary to Pacific Ocean 0.20 to 0.26Solution: Improve structure to eliminate restriction to fish passage at this location.
109 33.4 to 33.4 Unnamed tributary to Pacific Ocean 0.20 to 0.26Solution: Improve structure to eliminate restriction to fish passage at this location.
109 33.4 to 33.4 Unnamed tributary to Pacific Ocean 0.00 to 0.00Solution: Improve structure to eliminate restriction to fish passage at this location.
109 35.6 to 35.6 Unnamed tributary to Pacific Ocean 0.20 to 0.26Solution: Improve structure to eliminate restriction to fish passage at this location.
109 36.3 to 36.3 Unnamed tributary to Pacific Ocean 0.20 to 0.26Solution: Improve structure to eliminate restriction to fish passage at this location.
112 12.3 to 12.3 Unnamed tributary to Hoko River 0.20 to 0.26Solution: Improve structure to eliminate restriction to fish passage at this location.
112 19.5 to 19.5 Unnamed tributary to Clallam River 0.20 to 0.26Solution: Improve structure to eliminate restriction to fish passage at this location.
112 19.5 to 19.5 Unnamed tributary to Clallam River 0.20 to 0.26Solution: Improve structure to eliminate restriction to fish passage at this location.
112 19.8 to 19.8 Unnamed tributary to Clallam River 0.20 to 0.26Solution: Improve structure to eliminate restriction to fish passage at this location.
112 19.8 to 19.8 Unnamed tributary to Clallam River 0.20 to 0.26Solution: Improve structure to eliminate restriction to fish passage at this location.
112 21.1 to 21.1 Unnamed tributary to Green Creek (Pysht River) 0.20 to 0.26Solution: Improve structure to eliminate restriction to fish passage at this location.
112 24.91 to 24.91 Unnamed tributary to Pysht River 0.20 to 0.26Solution: Improve structure to eliminate restriction to fish passage at this location.
112 29.1 to 29.1 Indian Creek tributary to Strait of Juan de Fuca 0.20 to 0.26Solution: Improve structure to eliminate restriction to fish passage at this location.
112 29.7 to 29.7 Unnamed tributary to Butler Creek (Strait of Juan de Fuca) 0.20 to 0.26Solution: Improve structure to eliminate restriction to fish passage at this location.
112 29.71 to 29.71 Butler Creek tributary to Butler Cove (Straits) 0.18 to 0.24Solution: Improve structure to eliminate restriction to fish passage at this location.
112 32 to 32 Jim Creek tributary to Strait of Juan de Fuca 0.43 to 0.58Solution: Improve structure to eliminate restriction to fish passage at this location.
112 32 to 32 Jim Creek tributary to Strait of Juan de Fuca 0.20 to 0.26Solution: Improve structure to eliminate restriction to fish passage at this location.

Washington State Highway System Plan: 2003-2022 Appendix K – 115February 2002
Appendix K: 20-Year I4 Environmental Retrofit Strategies
Olympic Region (continued)
Highway Estimate Cost RangeNumber Milepost Vicinity Description ($ in Millions)
Fish Barriers (continued)112 32.8 to 32.8 Joe Creek tributary to Strait of Juan de Fuca 0.20 to 0.26Solution: Improve structure to eliminate restriction to fish passage at this location.
112 32.8 to 32.8 Joe Creek tributary to Strait of Juan de Fuca 0.20 to 0.26Solution: Improve structure to eliminate restriction to fish passage at this location.
112 47.1 to 47.1 Nelson Creek tributary to Lyre River 0.07 to 0.09Solution: Improve structure to eliminate restriction to fish passage at this location.
112 48.49 to 48.49 Field Creek tributary to Strait of Juan de Fuca 0.00 to 0.00Solution: Improve structure to eliminate restriction to fish passage at this location.
112 49.5 to 49.5 Whiskey Creek tributary to Strait of Juan de Fuca 0.20 to 0.26Solution: Improve structure to eliminate restriction to fish passage at this location.
112 52.9 to 52.9 Unnamed tributary to Salt Creek (Strait of Juan de Fuca) 0.20 to 0.26Solution: Improve structure to eliminate restriction to fish passage at this location.
112 54.35 to 54.35 Bear Creek tributary to Salt Creek 0.20 to 0.26Solution: Improve structure to eliminate restriction to fish passage at this location.
112 56.5 to 56.5 Unnamed tributary to Coville Creek (Strait of Juan de Fuca) 0.20 to 0.26Solution: Improve structure to eliminate restriction to fish passage at this location.
112 57.6 to 57.6 Coville Creek tributary to Strait of Juan de Fuca 0.20 to 0.26Solution: Improve structure to eliminate restriction to fish passage at this location.
112 57.6 to 57.6 Coville Creek tributary to Strait of Juan de Fuca 0.20 to 0.26Solution: Improve structure to eliminate restriction to fish passage at this location.
113 0.9 to 0.9 Unnamed tributary to Beaver Creek (Soleduck 0.03 to 0.03Solution: Improve structure to eliminate restriction to fish passage at this location.
302 0.9 to 0.9 Unnamed tributary to Coulter Creek 0.20 to 0.26Solution: Improve structure to eliminate restriction to fish passage at this location.
305 7.28 to 7.28 Klebeal Creek tributary to Agate Pass 0.20 to 0.26Solution: Improve structure to eliminate restriction to fish passage at this location.
305 9.6 to 9.6 Unnamed tributary to Liberty Bay 0.20 to 0.26Solution: Improve structure to eliminate restriction to fish passage at this location.
305 9.6 to 9.6 Unnamed tributary to Liberty Bay 0.20 to 0.26Solution: Improve structure to eliminate restriction to fish passage at this location.
305 9.88 to 9.88 Bjorgen Creek tributary to Liberty Bay 0.20 to 0.26Solution: Improve structure to eliminate restriction to fish passage at this location.
305 11.62 to 11.62 Unnamed tributary to Puget Sound 0.20 to 0.26Solution: Improve structure to eliminate restriction to fish passage at this location.
305 12.29 to 12.29 Unnamed tributary to Dogfish Creek 0.20 to 0.26Solution: Improve structure to eliminate restriction to fish passage at this location.
307 0.07 to 0.07 Dogfish Creek tributary to Liberty Bay 0.20 to 0.26Solution: Improve structure to eliminate restriction to fish passage at this location.
307 0.49 to 0.49 Unnamed tributary to Dogfish Creek (15.0286) 0.20 to 0.26Solution: Improve structure to eliminate restriction to fish passage at this location.
307 0.98 to 0.98 Unnamed tributary to Unnamed to Dogfish Creek 0.96 to 1.30Solution: Improve structure to eliminate restriction to fish passage at this location.
307 0.98 to 0.98 Unnamed tributary to Unnamed to Dogfish Creek 0.96 to 1.30Solution: Improve structure to eliminate restriction to fish passage at this location.
307 1.32 to 1.32 Unnamed tributary to Dogfish Creek 0.20 to 0.26Solution: Improve structure to eliminate restriction to fish passage at this location.
307 1.45 to 1.45 Unnamed tributary to Dogfish Creek (Liberty Bay) 0.20 to 0.26Solution: Improve structure to eliminate restriction to fish passage at this location.
307 2.5 to 2.5 Unnamed tributary to Gamble Creek 0.20 to 0.26Solution: Improve structure to eliminate restriction to fish passage at this location.
308 1.33 to 1.33 Little Scandia Creek tributary to Liberty Bay 0.00 to 0.00Solution: Improve structure to eliminate restriction to fish passage at this location.
510 5.85 to 5.85 Unnamed tributary to McAllister Creek 0.20 to 0.26Solution: Improve structure to eliminate restriction to fish passage at this location.

Appendix K – 116 Washington State Highway System Plan: 2003-2022 February 2002
Appendix K: 20-Year I4 Environmental Retrofit Strategies
Olympic Region (continued)
Highway Estimate Cost RangeNumber Milepost Vicinity Description ($ in Millions)
Noise Reduction167 11 to 11 Southwest of SR 167 Interchange near milepost 11 0.60 to 0.82Solution: The proposed mitigation is a Concrete barrier, which is approximately 10 feet high and 2129 long.
512 1 to 2 South side of SR 512, Parkland 2.84 to 3.84Solution: The proposed mitigation is a Concrete barrier, which is approximately 9 feet high and 5680 long.
512 1 to 2 North side of SR 512, Parkland 1.18 to 1.60Solution: The proposed mitigation is a Concrete barrier, which is approximately 7 feet high and 5850 long.

Washington State Highway System Plan: 2003-2022 Appendix K – 117February 2002
Appendix K: 20-Year I4 Environmental Retrofit Strategies
Southwest Region
Highway Estimate Cost RangeNumber Milepost Vicinity Description ($ in Millions)
Fish Barriers4 3.8 to 3.8 Unnamed tributary to Naselle River 0.20 to 0.26Solution: Improve structure to eliminate restriction to fish passage at this location.
4 3.85 to 3.85 Birnie Creek tributary to Columbia River 0.00 to 0.00Solution: Improve structure to eliminate restriction to fish passage at this location.
4 4.5 to 4.5 Johnson Creek tributary to Naselle River 0.20 to 0.26Solution: Improve structure to eliminate restriction to fish passage at this location.
4 4.5 to 4.5 Johnson Creek tributary to Naselle River 0.20 to 0.26Solution: Improve structure to eliminate restriction to fish passage at this location.
4 6.97 to 6.97 Unnamed tributary to Salmon Creek 0.20 to 0.26Solution: Improve structure to eliminate restriction to fish passage at this location.
4 7.59 to 7.59 Unnamed tributary to Salmon Creek (Naselle River) 0.20 to 0.26Solution: Improve structure to eliminate restriction to fish passage at this location.
4 7.59 to 7.59 Unnamed tributary to Salmon Creek (Naselle River) 0.20 to 0.26Solution: Improve structure to eliminate restriction to fish passage at this location.
4 8.21 to 8.21 Unnamed tributary to Salmon Creek (Naselle River) 0.20 to 0.26Solution: Improve structure to eliminate restriction to fish passage at this location.
4 8.73 to 8.73 Unnamed tributary to Salmon Creek 0.20 to 0.26Solution: Improve structure to eliminate restriction to fish passage at this location.
5 3.31 to 3.31 Cold Creek tributary to Burnt Bridge Creek 0.20 to 0.26Solution: Improve structure to eliminate restriction to fish passage at this location.
5 5.55 to 5.55 Cougar Canyon Creek tributary to Salmon Creek 0.20 to 0.26Solution: Improve structure to eliminate restriction to fish passage at this location.
5 7.92 to 7.92 Unnamed tributary to Whipple Creek 0.20 to 0.26Solution: Improve structure to eliminate restriction to fish passage at this location.
5 8.07 to 8.07 Unnamed tributary to Whipple Creek 0.20 to 0.26Solution: Improve structure to eliminate restriction to fish passage at this location.
5 8.42 to 8.42 Whipple Creek tributary to Lake River 0.20 to 0.26Solution: Improve structure to eliminate restriction to fish passage at this location.
5 26.8 to 26.8 Bybee Creek tributary to Columbia River 0.20 to 0.26Solution: Improve structure to eliminate restriction to fish passage at this location.
5 27.8 to 27.8 Unnamed tributary to Schoolhouse Creek 0.20 to 0.26Solution: Improve structure to eliminate restriction to fish passage at this location.
5 27.8 to 27.8 Unnamed tributary to Schoolhouse Creek 0.20 to 0.26Solution: Improve structure to eliminate restriction to fish passage at this location.
5 41.62 to 41.62 King Creek tributary to Cowlitz River 0.20 to 0.26Solution: Improve structure to eliminate restriction to fish passage at this location.
5 42.29 to 42.29 Unnamed tributary to Cowlitz River 0.20 to 0.26Solution: Improve structure to eliminate restriction to fish passage at this location.
5 44.29 to 44.29 Unnamed tributary to Cowlitz River 0.20 to 0.26Solution: Improve structure to eliminate restriction to fish passage at this location.
5 46.77 to 46.77 Unnamed tributary to Cowlitz River 0.20 to 0.26Solution: Improve structure to eliminate restriction to fish passage at this location.
5 47.48 to 47.48 Unnamed tributary to Salmon Creek (26.0187) 0.20 to 0.26Solution: Improve structure to eliminate restriction to fish passage at this location.
5 53.07 to 53.07 Unnamed tributary to Cowlitz River 0.20 to 0.26Solution: Improve structure to eliminate restriction to fish passage at this location.
5 53.9 to 53.9 Unnamed tributary to Cowlitz River 0.29 to 0.39Solution: Improve structure to eliminate restriction to fish passage at this location.
5 54.4 to 54.4 Unnamed tributary to Cowlitz River 0.20 to 0.26Solution: Improve structure to eliminate restriction to fish passage at this location.
5 54.93 to 54.93 Unnamed tributary to Hill Creek (26.0423) 0.20 to 0.26Solution: Improve structure to eliminate restriction to fish passage at this location.
5 57.98 to 57.98 Unnamed tributary to Foster Creek (Cowlitz River) 0.20 to 0.26Solution: Improve structure to eliminate restriction to fish passage at this location.
5 58.63 to 58.63 Foster Creek tributary to Cowlitz River 0.20 to 0.26Solution: Improve structure to eliminate restriction to fish passage at this location.

Appendix K – 118 Washington State Highway System Plan: 2003-2022 February 2002
Appendix K: 20-Year I4 Environmental Retrofit Strategies
Southwest Region (continued)
Highway Estimate Cost RangeNumber Milepost Vicinity Description ($ in Millions)
Fish Barriers (continued)6 0.75 to 0.75 Case Pond tributary to Ellis Slough 0.20 to 0.26Solution: Improve structure to eliminate restriction to fish passage at this location.
6 2.96 to 2.96 Unnamed tributary to Willapa River 0.20 to 0.26Solution: Improve structure to eliminate restriction to fish passage at this location.
6 5.37 to 5.37 Unnamed tributary to Willapa River 0.31 to 0.41Solution: Improve structure to eliminate restriction to fish passage at this location.
6 8.32 to 8.32 Unnamed tributary to Willapa River 0.92 to 1.24Solution: Improve structure to eliminate restriction to fish passage at this location.
6 9.83 to 9.83 Unnamed tributary to Willapa River 0.00 to 0.00Solution: Improve structure to eliminate restriction to fish passage at this location.
6 9.92 to 9.92 Unnamed tributary to Willapa River 0.20 to 0.26Solution: Improve structure to eliminate restriction to fish passage at this location.
6 17.36 to 17.36 Unnamed tributary to Fern Creek (Willapa River) 0.20 to 0.26Solution: Improve structure to eliminate restriction to fish passage at this location.
6 21.27 to 21.27 Unnamed tributary to Fern Creek (Willapa River) 0.20 to 0.26Solution: Improve structure to eliminate restriction to fish passage at this location.
6 25.24 to 25.24 Unnamed tributary to Rock Creek 0.20 to 0.26Solution: Improve structure to eliminate restriction to fish passage at this location.
7 3.36 to 3.36 Unnamed tributary to Tilton River 0.20 to 0.26Solution: Improve structure to eliminate restriction to fish passage at this location.
7 5.5 to 5.5 Unnamed tributary to Tilton River 0.07 to 0.09Solution: Improve structure to eliminate restriction to fish passage at this location.
7 5.5 to 5.5 Unnamed tributary to Tilton River 0.11 to 0.15Solution: Improve structure to eliminate restriction to fish passage at this location.
7 6.91 to 6.91 Unnamed tributary to Tilton River 0.20 to 0.26Solution: Improve structure to eliminate restriction to fish passage at this location.
7 8.89 to 8.89 Tilton River tributary to Mayfield Lake 0.20 to 0.26Solution: Improve structure to eliminate restriction to fish passage at this location.
7 9.85 to 9.85 Unnamed tributary to Summit Creek 0.20 to 0.26Solution: Improve structure to eliminate restriction to fish passage at this location.
7 10.5 to 10.5 Unnamed tributary to Nisqually River 0.07 to 0.09Solution: Improve structure to eliminate restriction to fish passage at this location.
7 10.51 to 10.51 Unnamed tributary to Round Top Creek 0.00 to 0.00Solution: Improve structure to eliminate restriction to fish passage at this location.
7 10.8 to 10.8 Unnamed tributary to Round Top Creek 0.20 to 0.26Solution: Improve structure to eliminate restriction to fish passage at this location.
7 11.6 to 11.6 Coal Creek tributary to Nisqually River 0.01 to 0.01Solution: Improve structure to eliminate restriction to fish passage at this location.
7 12.8 to 12.8 Unnamed tributary to Mineral Lake 0.20 to 0.26Solution: Improve structure to eliminate restriction to fish passage at this location.
12 72.45 to 72.45 Unnamed tributary to Lacamas River 0.20 to 0.26Solution: Improve structure to eliminate restriction to fish passage at this location.
12 81.22 to 81.22 Silver Creek tributary to Mossyrock reservoir 0.20 to 0.26Solution: Improve structure to eliminate restriction to fish passage at this location.
12 91.25 to 91.25 Unnamed tributary to Riffe Lake 0.20 to 0.26Solution: Improve structure to eliminate restriction to fish passage at this location.
12 93.8 to 93.8 Unnamed tributary to Unnamed to Riffe La 0.20 to 0.26Solution: Improve structure to eliminate restriction to fish passage at this location.
12 94.15 to 94.15 Highland Creek tributary to Tilton River 0.14 to 0.20Solution: Improve structure to eliminate restriction to fish passage at this location.
12 95.75 to 95.75 Highland Creek tributary to Tilton River 0.20 to 0.26Solution: Improve structure to eliminate restriction to fish passage at this location.
12 95.75 to 95.75 Highland Creek tributary to Tilton River 0.20 to 0.26Solution: Improve structure to eliminate restriction to fish passage at this location.
12 95.98 to 95.98 Unnamed tributary to Highland Creek 0.20 to 0.26Solution: Improve structure to eliminate restriction to fish passage at this location.

Washington State Highway System Plan: 2003-2022 Appendix K – 119February 2002
Appendix K: 20-Year I4 Environmental Retrofit Strategies
Southwest Region (continued)
Highway Estimate Cost RangeNumber Milepost Vicinity Description ($ in Millions)
Fish Barriers (continued)12 103.43 to 103.43 Unnamed tributary to Riffe Lake 0.20 to 0.26Solution: Improve structure to eliminate restriction to fish passage at this location.
12 103.98 to 103.98 Steffen Creek tributary to Riffe Lake 0.20 to 0.26Solution: Improve structure to eliminate restriction to fish passage at this location.
12 106.71 to 106.71 Unnamed tributary to Lunch Creek 0.20 to 0.26Solution: Improve structure to eliminate restriction to fish passage at this location.
12 112.08 to 112.08 Unnamed tributary to Kiona Creek 0.20 to 0.26Solution: Improve structure to eliminate restriction to fish passage at this location.
12 112.95 to 112.95 Oliver Creek tributary to Kiona Creek (26.1022) 0.20 to 0.26Solution: Improve structure to eliminate restriction to fish passage at this location.
12 114.96 to 114.96 Miller Creek tributary to Cowlitz River 0.20 to 0.26Solution: Improve structure to eliminate restriction to fish passage at this location.
12 124.97 to 124.97 Burton Creek tributary to Cowlitz River 0.20 to 0.26Solution: Improve structure to eliminate restriction to fish passage at this location.
12 149.98 to 149.98 Unnamed tributary to Millridge Creek 0.20 to 0.26Solution: Improve structure to eliminate restriction to fish passage at this location.
14 117.1 to 117.1 Unnamed tributary to Columbia River 0.00 to 0.00Solution: Improve structure to eliminate restriction to fish passage at this location.
14 140.8 to 140.8 Pine Creek tributary to Columbia River 0.20 to 0.26Solution: Improve structure to eliminate restriction to fish passage at this location.
14 140.8 to 140.8 Pine Creek tributary to Columbia River 0.20 to 0.26Solution: Improve structure to eliminate restriction to fish passage at this location.
14 140.8 to 140.8 Pine Creek tributary to Columbia River 0.20 to 0.26Solution: Improve structure to eliminate restriction to fish passage at this location.
14 140.8 to 140.8 Pine Creek tributary to Columbia River 0.20 to 0.26Solution: Improve structure to eliminate restriction to fish passage at this location.
97 12.9 to 12.9 Unnamed tributary to Little Klickitat River 0.00 to 0.00Solution: Improve structure to eliminate restriction to fish passage at this location.
97 18.4 to 18.4 Jenkins Creek tributary to Little Klickitat River 0.20 to 0.26Solution: Improve structure to eliminate restriction to fish passage at this location.
97 21.16 to 21.16 W Prong L Klickitat River tributary 0.20 to 0.26Solution: Improve structure to eliminate restriction to fish passage at this location.
97 21.35 to 21.35 Butler Creek tributary to E Prong 0.20 to 0.26Solution: Improve structure to eliminate restriction to fish passage at this location.
97 23.99 to 23.99 Dry Creek tributary to Little Klickitat River 0.20 to 0.26Solution: Improve structure to eliminate restriction to fish passage at this location.
97 25.41 to 25.41 E Prong L Klickitat River tributary 0.20 to 0.26Solution: Improve structure to eliminate restriction to fish passage at this location.
97 25.59 to 25.59 Idlewild Canyon Creek tributary to E Prong 0.23 to 0.31Solution: Improve structure to eliminate restriction to fish passage at this location.
97 27.97 to 27.97 SF Shinando Creek tributary to Shinando Creek 0.20 to 0.26Solution: Improve structure to eliminate restriction to fish passage at this location.
97 30.1 to 30.1 Shinando Creek tributary to Satus Creek 0.20 to 0.26Solution: Improve structure to eliminate restriction to fish passage at this location.
101 1 to 1 Unnamed tributary to Columbia River 0.20 to 0.26Solution: Improve structure to eliminate restriction to fish passage at this location.
101 1.3 to 1.3 Unnamed tributary to Columbia River 0.20 to 0.26Solution: Improve structure to eliminate restriction to fish passage at this location.
101 2 to 2 Unnamed tributary to Columbia River 0.00 to 0.00Solution: Improve structure to eliminate restriction to fish passage at this location.
101 2.29 to 2.29 Unnamed tributary to Columbia River 0.00 to 0.00Solution: Improve structure to eliminate restriction to fish passage at this location.
101 2.58 to 2.58 Unnamed tributary to Columbia River 0.20 to 0.26Solution: Improve structure to eliminate restriction to fish passage at this location.
101 3.3 to 3.3 Unnamed tributary to Columbia River 0.20 to 0.26Solution: Improve structure to eliminate restriction to fish passage at this location.

Appendix K – 120 Washington State Highway System Plan: 2003-2022 February 2002
Appendix K: 20-Year I4 Environmental Retrofit Strategies
Southwest Region (continued)
Highway Estimate Cost RangeNumber Milepost Vicinity Description ($ in Millions)
Fish Barriers (continued)101 21.3 to 21.3 Unnamed tributary to Willapa Bay 0.20 to 0.26Solution: Improve structure to eliminate restriction to fish passage at this location.
101 21.4 to 21.4 Unnamed tributary to Willapa Bay 0.12 to 0.16Solution: Improve structure to eliminate restriction to fish passage at this location.
101 23.31 to 23.31 Unnamed tributary to Columbia River 0.11 to 0.15Solution: Improve structure to eliminate restriction to fish passage at this location.
101 46.12 to 46.12 Unnamed tributary to Willapa Bay 0.00 to 0.00Solution: Improve structure to eliminate restriction to fish passage at this location.
101 46.96 to 46.96 Hansen Creek tributary to Willapa 0.20 to 0.26Solution: Improve structure to eliminate restriction to fish passage at this location.
101 53.56 to 53.56 Old Mill Pond Creek tributary to Willapa River 0.20 to 0.26Solution: Improve structure to eliminate restriction to fish passage at this location.
101 61.15 to 61.15 Butte Creek tributary to Smith Creek (Willapa River) 0.20 to 0.26Solution: Improve structure to eliminate restriction to fish passage at this location.
101 61.17 to 61.17 Unnamed tributary to Butte Creek 0.20 to 0.26Solution: Improve structure to eliminate restriction to fish passage at this location.
101 61.26 to 61.26 Unnamed tributary to Butte Creek (Smith Creek) 0.20 to 0.26Solution: Improve structure to eliminate restriction to fish passage at this location.
101 64.36 to 64.36 Unnamed tributary to Smith Creek 0.20 to 0.26Solution: Improve structure to eliminate restriction to fish passage at this location.
101 65.71 to 65.71 Unnamed tributary to Elkhorn Creek 0.20 to 0.26Solution: Improve structure to eliminate restriction to fish passage at this location.
103 13.3 to 13.3 Espy Slough tributary to Willapa Bay 0.20 to 0.26Solution: Improve structure to eliminate restriction to fish passage at this location.
103 19.84 to 19.84 Stackpole Slough tributary to Willapa Bay 0.20 to 0.26Solution: Improve structure to eliminate restriction to fish passage at this location.
105 1.86 to 1.86 Unnamed tributary to Willapa River 0.00 to 0.00Solution: Improve structure to eliminate restriction to fish passage at this location.
105 6.23 to 6.23 Unnamed tributary to Willapa Bay 0.20 to 0.26Solution: Improve structure to eliminate restriction to fish passage at this location.
105 21.22 to 21.22 Pacific County Drain Ditch 1 tributary to Pacific Ocean 0.20 to 0.26Solution: Improve structure to eliminate restriction to fish passage at this location.
105 21.22 to 21.22 Pacific County Drain Ditch 1 tributary to Pacific Ocean 0.20 to 0.26Solution: Improve structure to eliminate restriction to fish passage at this location.
105 21.22 to 21.22 Pacific County Drain Ditch 1 tributary to Pacific Ocean 0.20 to 0.26Solution: Improve structure to eliminate restriction to fish passage at this location.
122 4.99 to 4.99 Unnamed tributary to Mayfield Lake 0.20 to 0.26Solution: Improve structure to eliminate restriction to fish passage at this location.
122 5.84 to 5.84 Unnamed tributary to Mayfield Lake 0.20 to 0.26Solution: Improve structure to eliminate restriction to fish passage at this location.
123 3.36 to 3.36 Unnamed tributary to Ohanapecosh River 0.00 to 0.00Solution: Improve structure to eliminate restriction to fish passage at this location.
123 3.36 to 3.36 Unnamed tributary to Ohanapecosh River 0.20 to 0.26Solution: Improve structure to eliminate restriction to fish passage at this location.
123 6.35 to 6.35 Unnamed tributary to Ohanapecosh River 0.20 to 0.26Solution: Improve structure to eliminate restriction to fish passage at this location.
123 6.35 to 6.35 Unnamed tributary to Ohanapecosh River 0.00 to 0.00Solution: Improve structure to eliminate restriction to fish passage at this location.
142 3.65 to 3.65 Unnamed tributary to Klickitat River 0.20 to 0.26Solution: Improve structure to eliminate restriction to fish passage at this location.
142 13.4 to 13.4 Snyder Canyon Creek tributary to Klickitat River 0.20 to 0.26Solution: Improve structure to eliminate restriction to fish passage at this location.
142 13.4 to 13.4 Snyder Canyon Creek tributary to Klickitat River 0.20 to 0.26Solution: Improve structure to eliminate restriction to fish passage at this location.
142 16.48 to 16.48 Unnamed tributary to Klickitat River 0.20 to 0.26Solution: Improve structure to eliminate restriction to fish passage at this location.

Washington State Highway System Plan: 2003-2022 Appendix K – 121February 2002
Appendix K: 20-Year I4 Environmental Retrofit Strategies
Southwest Region (continued)
Highway Estimate Cost RangeNumber Milepost Vicinity Description ($ in Millions)
Fish Barriers (continued)142 25.1 to 25.1 Smith-Mason Creek tributary to Mill Creek 0.20 to 0.26Solution: Improve structure to eliminate restriction to fish passage at this location.
142 25.1 to 25.1 Smith-Mason Creek tributary to Mill Creek 0.20 to 0.26Solution: Improve structure to eliminate restriction to fish passage at this location.
142 25.32 to 25.32 Mill Creek tributary to Little Klickitat River 0.20 to 0.26Solution: Improve structure to eliminate restriction to fish passage at this location.
401 0.76 to 0.76 Unnamed tributary to Columbia River 0.20 to 0.26Solution: Improve structure to eliminate restriction to fish passage at this location.
401 4.33 to 4.33 Unnamed tributary to Columbia River 0.20 to 0.26Solution: Improve structure to eliminate restriction to fish passage at this location.
401 5.56 to 5.56 Unnamed tributary to SF Naselle River 0.20 to 0.26Solution: Improve structure to eliminate restriction to fish passage at this location.
401 5.56 to 5.56 Unnamed tributary to SF Naselle River 0.20 to 0.26Solution: Improve structure to eliminate restriction to fish passage at this location.
401 5.85 to 5.85 Unnamed tributary to SF Naselle River 0.00 to 0.00Solution: Improve structure to eliminate restriction to fish passage at this location.
401 6.02 to 6.02 Unnamed tributary to SF Naselle River 0.20 to 0.26Solution: Improve structure to eliminate restriction to fish passage at this location.
401 6.13 to 6.13 Unnamed tributary to SF Naselle River 0.20 to 0.26Solution: Improve structure to eliminate restriction to fish passage at this location.
401 8.8 to 8.8 Cement Creek tributary to SF Naselle 0.20 to 0.26Solution: Improve structure to eliminate restriction to fish passage at this location.
401 9.18 to 9.18 Unnamed tributary to SF Naselle River 0.20 to 0.26Solution: Improve structure to eliminate restriction to fish passage at this location.
411 7.14 to 7.14 Unnamed tributary to Cowlitz River 0.20 to 0.26Solution: Improve structure to eliminate restriction to fish passage at this location.
411 9.56 to 9.56 Unnamed tributary to Cowlitz River 0.20 to 0.26Solution: Improve structure to eliminate restriction to fish passage at this location.
500 9.78 to 9.78 Unnamed tributary to Lacamas Creek 0.20 to 0.26Solution: Improve structure to eliminate restriction to fish passage at this location.
503 13.25 to 13.25 Unnamed tributary to Rock Creek (EF Lewis River) 0.20 to 0.26Solution: Improve structure to eliminate restriction to fish passage at this location.
503 34.09 to 34.09 Unnamed tributary to Yale Lake 0.20 to 0.26Solution: Improve structure to eliminate restriction to fish passage at this location.
503 35.2 to 35.2 Unnamed tributary to Yale Lake 0.20 to 0.26Solution: Improve structure to eliminate restriction to fish passage at this location.
503 35.32 to 35.32 Unnamed tributary to Yale Reservoir (Lewis River) 0.20 to 0.26Solution: Improve structure to eliminate restriction to fish passage at this location.
503 35.6 to 35.6 Unnamed tributary to Dog Creek (Lewis River) 0.20 to 0.26Solution: Improve structure to eliminate restriction to fish passage at this location.
503 35.8 to 35.8 Dog Creek tributary to Yale Reservoir 0.20 to 0.26Solution: Improve structure to eliminate restriction to fish passage at this location.
503 42.1 to 42.1 Cape Horn Creek tributary to Lewis River 0.20 to 0.26Solution: Improve structure to eliminate restriction to fish passage at this location.
503 46.2 to 46.2 Colvin Creek tributary to Lewis River 0.20 to 0.26Solution: Improve structure to eliminate restriction to fish passage at this location.
503 46.55 to 46.55 Unnamed tributary to Lewis River 0.20 to 0.26Solution: Improve structure to eliminate restriction to fish passage at this location.
503 49.03 to 49.03 Kenyon Creek tributary to North Fork Lewis River 0.20 to 0.26Solution: Improve structure to eliminate restriction to fish passage at this location.
504 2.49 to 2.49 Unnamed tributary to Salmon Creek (26.0187) 0.09 to 0.12Solution: Improve structure to eliminate restriction to fish passage at this location.
504 2.73 to 2.73 Unnamed tributary to Salmon Creek (26.0187) 0.00 to 0.00Solution: Improve structure to eliminate restriction to fish passage at this location.
504 2.76 to 2.76 Unnamed tributary to Salmon Creek (26.0187) 0.90 to 1.22Solution: Improve structure to eliminate restriction to fish passage at this location.
504 3.17 to 3.17 Unnamed tributary to Salmon Creek 0.20 to 0.26Solution: Improve structure to eliminate restriction to fish passage at this location.

Appendix K – 122 Washington State Highway System Plan: 2003-2022 February 2002
Appendix K: 20-Year I4 Environmental Retrofit Strategies
Southwest Region (continued)
Highway Estimate Cost RangeNumber Milepost Vicinity Description ($ in Millions)
Fish Barriers (continued)504 4.55 to 4.55 Unnamed tributary to Silver Lake 0.20 to 0.26Solution: Improve structure to eliminate restriction to fish passage at this location.
504 4.55 to 4.55 Unnamed tributary to Silver Lake 0.20 to 0.26Solution: Improve structure to eliminate restriction to fish passage at this location.
504 17 to 17 Unnamed tributary to North Fork Toutle River 0.20 to 0.26Solution: Improve structure to eliminate restriction to fish passage at this location.
504 17.6 to 17.6 Unnamed tributary to North Fork Toutle River 0.20 to 0.26Solution: Improve structure to eliminate restriction to fish passage at this location.
504 23.58 to 23.58 Unnamed tributary to North Fork Toutle River 0.20 to 0.26Solution: Improve structure to eliminate restriction to fish passage at this location.
505 19.2 to 19.2 Unnamed tributary to Spirit Lake Highway 0.20 to 0.26Solution: Improve structure to eliminate restriction to fish passage at this location.
506 2.3 to 2.3 Unnamed tributary to Stillwater Creek 0.20 to 0.26Solution: Improve structure to eliminate restriction to fish passage at this location.
506 2.77 to 2.77 Unnamed tributary to Stillwater Creek 0.20 to 0.26Solution: Improve structure to eliminate restriction to fish passage at this location.
506 2.77 to 2.77 Unnamed tributary to Stillwater Creek 0.20 to 0.26Solution: Improve structure to eliminate restriction to fish passage at this location.
506 2.98 to 2.98 Unnamed tributary to Stillwater Creek 0.20 to 0.26Solution: Improve structure to eliminate restriction to fish passage at this location.
506 5.41 to 5.41 Unnamed tributary to Stillwater Creek 1.18 to 1.60Solution: Improve structure to eliminate restriction to fish passage at this location.
506 7.68 to 7.68 Unnamed tributary to Cowlitz River 0.20 to 0.26Solution: Improve structure to eliminate restriction to fish passage at this location.
508 4.27 to 4.27 Unnamed tributary to SF Newaukum River 0.20 to 0.26Solution: Improve structure to eliminate restriction to fish passage at this location.
508 5.19 to 5.19 Unnamed tributary to SF Newaukum River 0.20 to 0.26Solution: Improve structure to eliminate restriction to fish passage at this location.
508 18.32 to 18.32 Unnamed tributary to Mill Creek 0.20 to 0.26Solution: Improve structure to eliminate restriction to fish passage at this location.
508 18.95 to 18.95 Unnamed tributary to Tilton River 0.00 to 0.00Solution: Improve structure to eliminate restriction to fish passage at this location.
508 20.37 to 20.37 Shermans Creek tributary to Tilton River 0.20 to 0.26Solution: Improve structure to eliminate restriction to fish passage at this location.
508 23.89 to 23.89 Unnamed tributary to Tilton River 0.20 to 0.26Solution: Improve structure to eliminate restriction to fish passage at this location.
508 31.8 to 31.8 Unnamed tributary to Tilton River 0.20 to 0.26Solution: Improve structure to eliminate restriction to fish passage at this location.
Noise Reduction6 to McLeod Rd. Bellingham 1.28 to 1.74Solution: The proposed mitigation is a Concrete barrier, which is approximately 15 feet high and 2600 long.
6 49 to 50 Castle Rock 0.45 to 0.61Solution: The proposed mitigation is a Concrete barrier, which is approximately 6 feet high and 2770 long.
6 111 to 111 Thompson Place 0.71 to 0.97Solution: The proposed mitigation is a Concrete barrier, which is approximately 12 feet high and 2904 long.
6 112 to 113 Queets Dr., Thurston County 0.48 to 0.64Solution: The proposed mitigation is a Concrete barrier, which is approximately 8 feet high and 2040 long.
6 122 to 122 Fort Lewis, Pierce County 0.68 to 0.92Solution: The proposed mitigation is a Concrete barrier, which is approximately 8.5 feet high and 3660 long.
6 145 to 146 South 292nd St. 1.25 to 1.69Solution: The proposed mitigation is a Concrete barrier, which is approximately 16 feet high and 2300 long.
6 168 to 168 Roanoke to Shelby 0.31 to 0.43Solution: The proposed mitigation is a Concrete barrier, which is approximately 10 feet high and 1150 long.
6 168 to 168 Boston to Roanoke 0.94 to 1.28Solution: The proposed mitigation is a Concrete barrier, which is approximately 16.5 feet high and 1650 long.
6 168 to 168 Boston to Roanoke 0.44 to 0.60Solution: The proposed mitigation is a Concrete barrier, which is approximately 14 feet high and 990 long.

Washington State Highway System Plan: 2003-2022 Appendix K – 123February 2002
Appendix K: 20-Year I4 Environmental Retrofit Strategies
Southwest Region (continued)
Highway Estimate Cost RangeNumber Milepost Vicinity Description ($ in Millions)
Noise Reduction (continued)6 168 to 168 Roanoke to Shelby 0.68 to 0.92Solution: The proposed mitigation is a Concrete barrier, which is approximately 15 feet high and 1400 long.
6 170 to 170 Ravenna 0.56 to 0.76Solution: The proposed mitigation is a Concrete barrier, which is approximately 11 feet high and 1700 long.
6 171 to 171 Northeast 80th St. on west side of highway 0.54 to 0.74Solution: The proposed mitigation is a Concrete barrier, which is approximately 10 feet high and 1920 long.
6 171 to 172 Northeast 85th St. east side 1.83 to 2.47Solution: The proposed mitigation is a Concrete barrier, which is approximately 20 feet high and 2450 long.
6 172 to 172 North 85th St. 0.56 to 0.76Solution: The proposed mitigation is a Concrete barrier, which is approximately 11 feet high and 1724 long.
6 175 to 175 Northeast 155th St. 0.84 to 1.14Solution: The proposed mitigation is a Berm / Concrete barrier, which is approximately 14 feet high and 2200 long.
6 175 to 175 North145th St. 0.68 to 0.92Solution: The proposed mitigation is a Concrete barrier, which is approximately 20 feet high and 918 long.
6 176 to 176 North 171st 0.70 to 0.94Solution: The proposed mitigation is a Concrete barrier, which is approximately 14 feet high and 1550 long.
6 177 to 177 Northeast 175th to 185th 0.69 to 0.93Solution: The proposed mitigation is a Concrete barrier, which is approximately 11.4 feet high and 2000 long.
6 192 to 193 47th St. 0.79 to 1.07Solution: The proposed mitigation is a Berm / Concrete barrier, which is approximately 10 feet high and 2950 long.
6 194 to 195 North of US 12 Interchange 0.71 to 0.97Solution: The proposed mitigation is a Concrete barrier, which is approximately 16 feet high and 1330 long.
6 194 to 195 25th St. 0.56 to 0.76Solution: The proposed mitigation is a Concrete barrier, which is approximately 14 feet high and 1240 long.
6 202 to 203 116th Street Northeast 0.26 to 0.35Solution: The proposed mitigation is a Concrete barrier, which is approximately 10 feet high and 838 long.
6 206 to 207 Smokey Point 0.59 to 0.79Solution: The proposed mitigation is a Concrete barrier, which is approximately 14 feet high and 1300 long.
6 226 to 226 South end of SR 536 Interchange 1.89 to 2.55Solution: The proposed mitigation is a Concrete barrier, which is approximately 20 feet high and 2650 long.
6 231 to 231 Westview School 0.35 to 0.47Solution: The proposed mitigation is a Berm / Concrete barrier, which is approximately 20 feet high and 610 long.
6 253 to 254 North of Lakeway interchange Bellingham 1.13 to 1.53Solution: The proposed mitigation is a Concrete barrier, which is approximately 14 feet high and 2500 long.
14 3 to 4 Evergreen Blvd., Vancouver, Clark County 0.90 to 1.22Solution: The proposed mitigation is a Concrete barrier, which is approximately 12 feet high and 2450 long.
Appendix K – 124 Washington State Highway System Plan: 2003-2022 February 2002

Washington State Highway System Plan: 2003-2022 Appendix K – 125February 2002
Appendix K: 20-Year I4 Environmental Retrofit Strategies
South Central Region
Highway Estimate Cost RangeNumber Milepost Vicinity Description ($ in Millions)
Fish Barriers12 168.3 to 168.3 Hause Creek tributary to Tieton River 0.00 to 0.00Solution: Improve structure to eliminate restriction to fish passage at this location.
12 168.56 to 168.56 Pine Creek tributary to Tieton River 0.21 to 0.29Solution: Improve structure to eliminate restriction to fish passage at this location.
12 178.89 to 178.89 Bear Canyon Creek tributary to Tieton River 0.21 to 0.29Solution: Improve structure to eliminate restriction to fish passage at this location.
12 178.89 to 178.89 Bear Canyon Creek tributary to Tieton River 0.21 to 0.29Solution: Improve structure to eliminate restriction to fish passage at this location.
12 348.5 to 348.5 Mud Creek tributary to Dry Creek (Walla Walla River) 0.20 to 0.26Solution: Improve structure to eliminate restriction to fish passage at this location.
82 0.1 to 0.1 Unnamed tributary to Yakima River 0.21 to 0.29Solution: Improve structure to eliminate restriction to fish passage at this location.
82 26.26 to 26.26 Unnamed tributary to Yakima River 0.21 to 0.29Solution: Improve structure to eliminate restriction to fish passage at this location.
90 38.8 to 38.8 Change Creek tributary to Southfork Snoqualmie River 0.09 to 0.12Solution: Improve structure to eliminate restriction to fish passage at this location.
90 60.58 to 60.58 Unnamed tributary to Keechelus Lake 0.21 to 0.29Solution: Improve structure to eliminate restriction to fish passage at this location.
90 61.34 to 61.34 Price Creek tributary to Yakima River 0.21 to 0.29Solution: Improve structure to eliminate restriction to fish passage at this location.
90 62.71 to 62.71 Swamp Creek tributary to Yakima River 1.86 to 2.52Solution: Improve structure to eliminate restriction to fish passage at this location.
90 62.71 to 62.71 Swamp Creek tributary to Yakima River 0.21 to 0.29Solution: Improve structure to eliminate restriction to fish passage at this location.
90 70.9 to 70.9 Silver Creek tributary to Yakima River 0.21 to 0.29Solution: Improve structure to eliminate restriction to fish passage at this location.
90 70.9 to 70.9 Silver Creek tributary to Yakima River 0.21 to 0.29Solution: Improve structure to eliminate restriction to fish passage at this location.
90 91.73 to 91.73 Horseshoe Canyon Creek tributary to Yakima River 0.21 to 0.29Solution: Improve structure to eliminate restriction to fish passage at this location.
90 92.69 to 92.69 Unnamed tributary to Morrison Canyon (Yakima River) 0.00 to 0.00Solution: Improve structure to eliminate restriction to fish passage at this location.
90 93.35 to 93.35 Morrison Canyon Creek tributary to Yakima River 0.21 to 0.29Solution: Improve structure to eliminate restriction to fish passage at this location.
97 37.15 to 37.15 Highbridge Springs tributary to Satus Creek 0.00 to 0.00Solution: Improve structure to eliminate restriction to fish passage at this location.
224 0.1 to 0.1 Unnamed tributary to Yakima River 0.21 to 0.29Solution: Improve structure to eliminate restriction to fish passage at this location.
410 80.2 to 80.2 Wash Creek tributary to American River 0.21 to 0.29Solution: Improve structure to eliminate restriction to fish passage at this location.
410 80.2 to 80.2 Wash Creek tributary to American River 0.21 to 0.29Solution: Improve structure to eliminate restriction to fish passage at this location.
410 82.8 to 82.8 Survey Creek tributary to American River 0.21 to 0.29Solution: Improve structure to eliminate restriction to fish passage at this location.
Noise Reduction12 338.5 to 338.5 Wellington Ave., Walla Walla south side 0.73 to 0.99Solution: The proposed mitigation is a Concrete barrier, which is approximately 13 feet high and 1275 long.
12 338.5 to 338.5 Walla Walla north side 0.60 to 0.81Solution: The proposed mitigation is a Concrete barrier, which is approximately 14 feet high and 1205 long.
90 71 to 72 Easton school, Kittitas County 0.33 to 0.45Solution: The proposed mitigation is a Concrete barrier, which is approximately 8 feet high and 1400 long.
90 72 to 72 Easton, Kittitas County 0.32 to 0.44Solution: The proposed mitigation is a Concrete barrier, which is approximately 10 feet high and 1100 long.
97 64 to 64 Mobile Home Park, Yakima County 0.43 to 0.59Solution: The proposed mitigation is a Concrete barrier, which is approximately 12 feet high and 1150 long.
97 68 to 69 Wapato, Yakima County 1.15 to 1.55Solution: The proposed mitigation is a Concrete barrier, which is approximately 12 feet high and 3050 long.

Appendix K – 126 Washington State Highway System Plan: 2003-2022 February 2002
Appendix K: 20-Year I4 Environmental Retrofit Strategies
South Central Region (continued)
Highway Estimate Cost RangeNumber Milepost Vicinity Description ($ in Millions)
Noise Reduction (continued)240 38 to 39 Richland, Benton County 0.57 to 0.77Solution: The proposed mitigation is a Concrete barrier, which is approximately 12 feet high and 1500 long.
395 16 to 16 W. 19th Avenue, Benton County 0.71 to 0.97Solution: The proposed mitigation is a Concrete barrier, which is approximately 12 feet high and 1900 long.
395 17 to 18 SW Columbia River Bridge, Kennewick 0.56 to 0.76Solution: The proposed mitigation is a Concrete barrier, which is approximately 12 feet high and 1485 long.
395 19 to 19 Flamingo Mobile Home Community, Pasco 0.44 to 0.60Solution: The proposed mitigation is a Concrete barrier, which is approximately 10 feet high and 1500 long.
395 20 to 20 Riviera Trailer Park Village, Pasco 0.39 to 0.53Solution: The proposed mitigation is a Concrete barrier, which is approximately 10 feet high and 1350 long.

Washington State Highway System Plan: 2003-2022 Appendix K – 127February 2002
Appendix K: 20-Year I4 Environmental Retrofit Strategies
Eastern Region
Highway Estimate Cost RangeNumber Milepost Vicinity Description ($ in Millions)
Fish Barriers20 309.31 to 309.31 O' Brien Creek tributary to Sanpoil River 0.20 to 0.26Solution: Improve structure to eliminate restriction to fish passage at this location.
20 309.96 to 309.96 North Fork O’Brien Creek tributary to O’Brien Creek 0.20 to 0.26Solution: Improve structure to eliminate restriction to fish passage at this location.
20 310.06 to 310.06 North Fork O’Brien Creek tributary to O’Brien Creek 0.20 to 0.26Solution: Improve structure to eliminate restriction to fish passage at this location.
20 361.47 to 361.47 Unnamed tributary to Keogh Lake 0.43 to 0.58Solution: Improve structure to eliminate restriction to fish passage at this location.
20 363.73 to 363.73 Narcisse Creek tributary to Lake Pend Oreille 0.43 to 0.58Solution: Improve structure to eliminate restriction to fish passage at this location.
20 363.73 to 363.73 Narcisse Creek tributary to Lake Pend Oreille 0.43 to 0.58Solution: Improve structure to eliminate restriction to fish passage at this location.
21 117.05 to 117.05 Jack Creek tributary to Sanpoil River 0.43 to 0.58Solution: Improve structure to eliminate restriction to fish passage at this location.
21 120.1 to 120.1 Empire Creek tributary to Sanpoil River 0.43 to 0.58Solution: Improve structure to eliminate restriction to fish passage at this location.
21 122.05 to 122.05 Lime Creek tributary to Sanpoil River 0.43 to 0.58Solution: Improve structure to eliminate restriction to fish passage at this location.
21 134.2 to 134.2 North Nanamkin Creek tributary to Sanpoil River 0.43 to 0.58Solution: Improve structure to eliminate restriction to fish passage at this location.
21 134.2 to 134.2 North Nanamkin Creek tributary to Sanpoil River 0.43 to 0.58Solution: Improve structure to eliminate restriction to fish passage at this location.
21 136.5 to 136.5 Bear Creek tributary to Sanpoil River 0.43 to 0.58Solution: Improve structure to eliminate restriction to fish passage at this location.
21 139.4 to 139.4 Anderson Creek tributary to Sanpoil River 0.43 to 0.58Solution: Improve structure to eliminate restriction to fish passage at this location.
21 146.7 to 146.7 Rattlesnake Gulch tributary to Sanpoil River 0.43 to 0.58Solution: Improve structure to eliminate restriction to fish passage at this location.
23 52.3 to 52.3 Sheep Creek tributary to Upper Crab Creek 0.43 to 0.58Solution: Improve structure to eliminate restriction to fish passage at this location.
25 37.6 to 37.6 Alder Creek tributary to Lake Roosevelt 0.43 to 0.58Solution: Improve structure to eliminate restriction to fish passage at this location.
25 42.37 to 42.37 Hunters Creek tributary to Lake Roosevelt 0.43 to 0.58Solution: Improve structure to eliminate restriction to fish passage at this location.
31 3.8 to 3.8 Ione Millpond tributary to Pend Oreille River 0.64 to 0.86Solution: Improve structure to eliminate restriction to fish passage at this location.
31 10.7 to 10.7 Sweet Creek tributary to Pend Oreille River 0.43 to 0.58Solution: Improve structure to eliminate restriction to fish passage at this location.
194 1.2 to 1.2 Little Almota Creek tributary to Snake River 0.21 to 0.29Solution: Improve structure to eliminate restriction to fish passage at this location.
395 212.8 to 212.8 Unnamed tributary to Colville River 0.43 to 0.58Solution: Improve structure to eliminate restriction to fish passage at this location.
395 249.9 to 249.9 Matsen Creek tributary to Kettle River 0.43 to 0.58Solution: Improve structure to eliminate restriction to fish passage at this location.
Noise Reduction23 32 to 33 60th Northwest St. 0.43 to 0.58Solution: The proposed mitigation is a Concrete barrier, which is approximately 8 feet high and 1900 long.
263 28 to 29 Wallingford Ave 0.29 to 0.39Solution: The proposed mitigation is a Concrete barrier, which is approximately 10 feet high and 1030 long.

Appendix K – 128 Washington State Highway System Plan: 2003-2022 February 2002

Washington State Highway System Plan: 2003-2022 Appendix K – 129February 2002
Appendix K: Statewide List 20-Year I4 Stormwater SolutionsHighway Estimate Cost Range
Rank Number Milepost Vicinity Description ($ in Millions)
Northwest Region46 5 243.28 to 243.28 Whatcom County 0.02 to 0.03
Solution: Implement appropriate Best Management Practices (BMP) to correct stormwater runoff quality and quantity. Typical BMPs used include wet ponds and bioswales.
54 90 9.3 to 9.3 King County 1.72 to 2.33Solution: Implement appropriate Best Management Practices (BMP) to correct stormwater runoff quality and quantity. Typical BMPs used include wet ponds and bioswales.
54 90 9.31 to 9.31 King County 1.34 to 1.82Solution: Implement appropriate Best Management Practices (BMP) to correct stormwater runoff quality and quantity. Typical BMPs used include wet ponds and bioswales.
54 90 9.7 to 9.7 King County 0.00 to 0.00Solution: Implement appropriate Best Management Practices (BMP) to correct stormwater runoff quality and quantity. Typical BMPs used include wet ponds and bioswales.
55 90 22.14 to 22.14 King County 0.09 to 0.13Solution: Implement appropriate Best Management Practices (BMP) to correct stormwater runoff quality and quantity. Typical BMPs used include wet ponds and bioswales.
55 5 186.94 to 186.94 Snohomish County 0.21 to 0.28Solution: Implement appropriate Best Management Practices (BMP) to correct stormwater runoff quality and quantity. Typical BMPs used include wet ponds and bioswales.
55 90 20.24 to 20.24 King County 0.12 to 0.16Solution: Implement appropriate Best Management Practices (BMP) to correct stormwater runoff quality and quantity. Typical BMPs used include wet ponds and bioswales.
55 90 20.38 to 20.38 King County 0.03 to 0.05Solution: Implement appropriate Best Management Practices (BMP) to correct stormwater runoff quality and quantity. Typical BMPs used include wet ponds and bioswales.
55 90 18.62 to 18.62 King County 0.05 to 0.07Solution: Implement appropriate Best Management Practices (BMP) to correct stormwater runoff quality and quantity. Typical BMPs used include wet ponds and bioswales.
55.5 90 15.45 to 15.45 King County 0.18 to 0.24Solution: Implement appropriate Best Management Practices (BMP) to correct stormwater runoff quality and quantity. Typical BMPs used include wet ponds and bioswales.
55.5 90 17.22 to 17.22 King County 0.00 to 0.00Solution: Implement appropriate Best Management Practices (BMP) to correct stormwater runoff quality and quantity. Typical BMPs used include wet ponds and bioswales.
56 90 15.43 to 15.43 King County 0.03 to 0.04Solution: Implement appropriate Best Management Practices (BMP) to correct stormwater runoff quality and quantity. Typical BMPs used include wet ponds and bioswales.
56 522 5.58 to 5.58 King County 0.01 to 0.02Solution: Implement appropriate Best Management Practices (BMP) to correct stormwater runoff quality and quantity. Typical BMPs used include wet ponds and bioswales.
56 90 10.5 to 10.5 King County 0.13 to 0.18Solution: Implement appropriate Best Management Practices (BMP) to correct stormwater runoff quality and quantity. Typical BMPs used include wet ponds and bioswales.
56 90 14.8 to 14.8 King County 0.00 to 0.00Solution: Implement appropriate Best Management Practices (BMP) to correct stormwater runoff quality and quantity. Typical BMPs used include wet ponds and bioswales.
56 90 14.78 to 14.78 King County 0.04 to 0.05Solution: Implement appropriate Best Management Practices (BMP) to correct stormwater runoff quality and quantity. Typical BMPs used include wet ponds and bioswales.
56 5 215.09 to 215.09 Snohomish County 0.25 to 0.34Solution: Implement appropriate Best Management Practices (BMP) to correct stormwater runoff quality and quantity. Typical BMPs used include wet ponds and bioswales.
56 90 10.51 to 10.51 King County 1.28 to 1.74Solution: Implement appropriate Best Management Practices (BMP) to correct stormwater runoff quality and quantity. Typical BMPs used include wet ponds and bioswales.
56.5 522 13.24 to 13.24 King County 0.04 to 0.06Solution: Implement appropriate Best Management Practices (BMP) to correct stormwater runoff quality and quantity. Typical BMPs used include wet ponds and bioswales.
57 520 6.07 to 6.07 King County 0.12 to 0.16Solution: Implement appropriate Best Management Practices (BMP) to correct stormwater runoff quality and quantity. Typical BMPs used include wet ponds and bioswales.
57 522 12.13 to 12.13 King County 0.04 to 0.06Solution: Implement appropriate Best Management Practices (BMP) to correct stormwater runoff quality and quantity. Typical BMPs used include wet ponds and bioswales.
57 520 8.87 to 8.87 King County 0.14 to 0.18Solution: Implement appropriate Best Management Practices (BMP) to correct stormwater runoff quality and quantity. Typical BMPs used include wet ponds and bioswales.
57 520 8.62 to 8.62 King County 0.12 to 0.16Solution: Implement appropriate Best Management Practices (BMP) to correct stormwater runoff quality and quantity. Typical BMPs used include wet ponds and bioswales.
57 520 6.25 to 6.25 King County 0.01 to 0.02Solution: Implement appropriate Best Management Practices (BMP) to correct stormwater runoff quality and quantity. Typical BMPs used include wet ponds and bioswales.
57 520 5.81 to 5.81 King County 0.07 to 0.10Solution: Implement appropriate Best Management Practices (BMP) to correct stormwater runoff quality and quantity. Typical BMPs used include wet ponds and bioswales.
57 520 5.62 to 5.62 King County 0.08 to 0.10Solution: Implement appropriate Best Management Practices (BMP) to correct stormwater runoff quality and quantity. Typical BMPs used include wet ponds and bioswales.
58 518 2.39 to 2.39 King County 0.21 to 0.28Solution: Implement appropriate Best Management Practices (BMP) to correct stormwater runoff quality and quantity. Typical BMPs used include wet ponds and bioswales.
58 5 177.61 to 177.61 King County 0.03 to 0.03Solution: Implement appropriate Best Management Practices (BMP) to correct stormwater runoff quality and quantity. Typical BMPs used include wet ponds and bioswales.
58 5 174.47 to 174.47 King County 0.03 to 0.03Solution: Implement appropriate Best Management Practices (BMP) to correct stormwater runoff quality and quantity. Typical BMPs used include wet ponds and bioswales.
58 5 177.6 to 177.6 King County 0.03 to 0.03Solution: Implement appropriate Best Management Practices (BMP) to correct stormwater runoff quality and quantity. Typical BMPs used include wet ponds and bioswales.
58 5 174.8 to 174.8 King County 0.01 to 0.02Solution: Implement appropriate Best Management Practices (BMP) to correct stormwater runoff quality and quantity. Typical BMPs used include wet ponds and bioswales.
58 518 2.6 to 2.6 King County 0.12 to 0.17Solution: Implement appropriate Best Management Practices (BMP) to correct stormwater runoff quality and quantity. Typical BMPs used include wet ponds and bioswales.
58 518 3.66 to 3.66 King County 0.05 to 0.06Solution: Implement appropriate Best Management Practices (BMP) to correct stormwater runoff quality and quantity. Typical BMPs used include wet ponds and bioswales.
58 5 203.61 to 203.61 Snohomish County 0.02 to 0.03Solution: Implement appropriate Best Management Practices (BMP) to correct stormwater runoff quality and quantity. Typical BMPs used include wet ponds and bioswales.
58 5 203.75 to 203.75 Snohomish County 0.03 to 0.03Solution: Implement appropriate Best Management Practices (BMP) to correct stormwater runoff quality and quantity. Typical BMPs used include wet ponds and bioswales.
58 5 204.05 to 204.05 Snohomish County 0.00 to 0.00Solution: Implement appropriate Best Management Practices (BMP) to correct stormwater runoff quality and quantity. Typical BMPs used include wet ponds and bioswales.
58 520 4.46 to 4.46 King County 0.01 to 0.02Solution: Implement appropriate Best Management Practices (BMP) to correct stormwater runoff quality and quantity. Typical BMPs used include wet ponds and bioswales.
59 5 172.32 to 172.32 King County 0.54 to 0.74Solution: Implement appropriate Best Management Practices (BMP) to correct stormwater runoff quality and quantity. Typical BMPs used include wet ponds and bioswales.
59 5 181.71 to 181.71 Snohomish County 0.03 to 0.03Solution: Implement appropriate Best Management Practices (BMP) to correct stormwater runoff quality and quantity. Typical BMPs used include wet ponds and bioswales.
59 405 29.66 to 29.66 Snohomish County 1.68 to 2.27Solution: Implement appropriate Best Management Practices (BMP) to correct stormwater runoff quality and quantity. Typical BMPs used include wet ponds and bioswales.
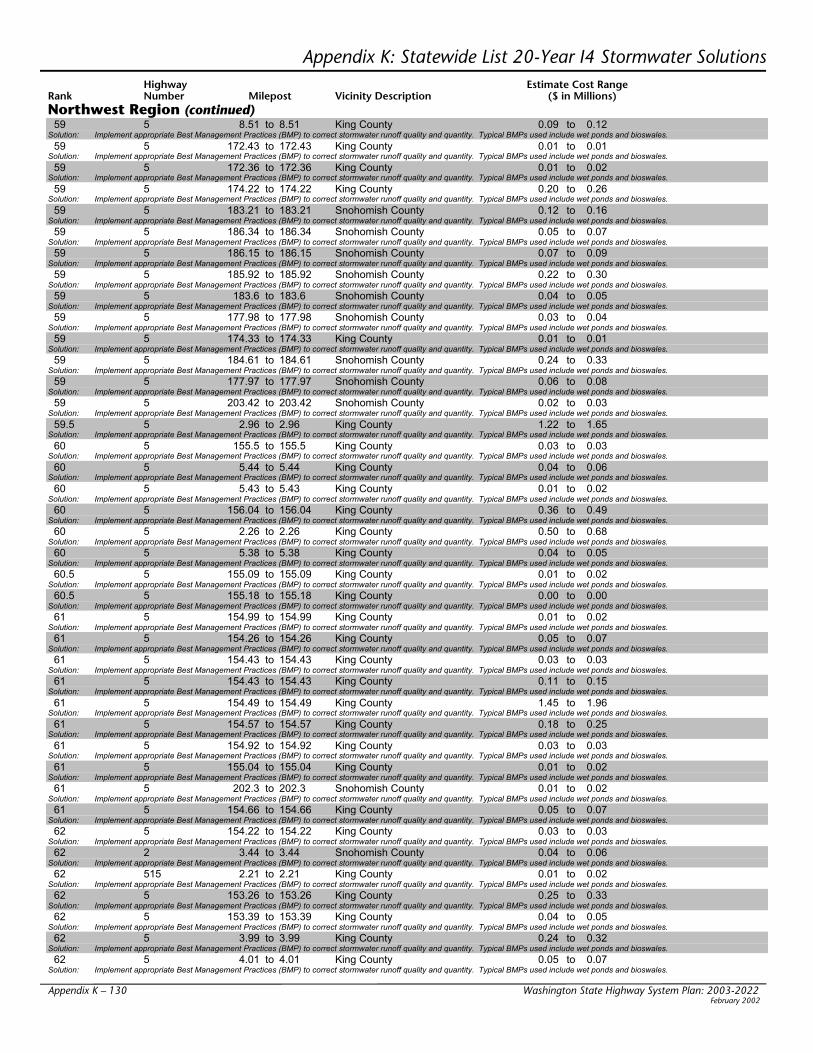
Appendix K – 130 Washington State Highway System Plan: 2003-2022 February 2002
Appendix K: Statewide List 20-Year I4 Stormwater SolutionsHighway Estimate Cost Range
Rank Number Milepost Vicinity Description ($ in Millions)Northwest Region (continued)
59 5 8.51 to 8.51 King County 0.09 to 0.12Solution: Implement appropriate Best Management Practices (BMP) to correct stormwater runoff quality and quantity. Typical BMPs used include wet ponds and bioswales.
59 5 172.43 to 172.43 King County 0.01 to 0.01Solution: Implement appropriate Best Management Practices (BMP) to correct stormwater runoff quality and quantity. Typical BMPs used include wet ponds and bioswales.
59 5 172.36 to 172.36 King County 0.01 to 0.02Solution: Implement appropriate Best Management Practices (BMP) to correct stormwater runoff quality and quantity. Typical BMPs used include wet ponds and bioswales.
59 5 174.22 to 174.22 King County 0.20 to 0.26Solution: Implement appropriate Best Management Practices (BMP) to correct stormwater runoff quality and quantity. Typical BMPs used include wet ponds and bioswales.
59 5 183.21 to 183.21 Snohomish County 0.12 to 0.16Solution: Implement appropriate Best Management Practices (BMP) to correct stormwater runoff quality and quantity. Typical BMPs used include wet ponds and bioswales.
59 5 186.34 to 186.34 Snohomish County 0.05 to 0.07Solution: Implement appropriate Best Management Practices (BMP) to correct stormwater runoff quality and quantity. Typical BMPs used include wet ponds and bioswales.
59 5 186.15 to 186.15 Snohomish County 0.07 to 0.09Solution: Implement appropriate Best Management Practices (BMP) to correct stormwater runoff quality and quantity. Typical BMPs used include wet ponds and bioswales.
59 5 185.92 to 185.92 Snohomish County 0.22 to 0.30Solution: Implement appropriate Best Management Practices (BMP) to correct stormwater runoff quality and quantity. Typical BMPs used include wet ponds and bioswales.
59 5 183.6 to 183.6 Snohomish County 0.04 to 0.05Solution: Implement appropriate Best Management Practices (BMP) to correct stormwater runoff quality and quantity. Typical BMPs used include wet ponds and bioswales.
59 5 177.98 to 177.98 Snohomish County 0.03 to 0.04Solution: Implement appropriate Best Management Practices (BMP) to correct stormwater runoff quality and quantity. Typical BMPs used include wet ponds and bioswales.
59 5 174.33 to 174.33 King County 0.01 to 0.01Solution: Implement appropriate Best Management Practices (BMP) to correct stormwater runoff quality and quantity. Typical BMPs used include wet ponds and bioswales.
59 5 184.61 to 184.61 Snohomish County 0.24 to 0.33Solution: Implement appropriate Best Management Practices (BMP) to correct stormwater runoff quality and quantity. Typical BMPs used include wet ponds and bioswales.
59 5 177.97 to 177.97 Snohomish County 0.06 to 0.08Solution: Implement appropriate Best Management Practices (BMP) to correct stormwater runoff quality and quantity. Typical BMPs used include wet ponds and bioswales.
59 5 203.42 to 203.42 Snohomish County 0.02 to 0.03Solution: Implement appropriate Best Management Practices (BMP) to correct stormwater runoff quality and quantity. Typical BMPs used include wet ponds and bioswales.
59.5 5 2.96 to 2.96 King County 1.22 to 1.65Solution: Implement appropriate Best Management Practices (BMP) to correct stormwater runoff quality and quantity. Typical BMPs used include wet ponds and bioswales.
60 5 155.5 to 155.5 King County 0.03 to 0.03Solution: Implement appropriate Best Management Practices (BMP) to correct stormwater runoff quality and quantity. Typical BMPs used include wet ponds and bioswales.
60 5 5.44 to 5.44 King County 0.04 to 0.06Solution: Implement appropriate Best Management Practices (BMP) to correct stormwater runoff quality and quantity. Typical BMPs used include wet ponds and bioswales.
60 5 5.43 to 5.43 King County 0.01 to 0.02Solution: Implement appropriate Best Management Practices (BMP) to correct stormwater runoff quality and quantity. Typical BMPs used include wet ponds and bioswales.
60 5 156.04 to 156.04 King County 0.36 to 0.49Solution: Implement appropriate Best Management Practices (BMP) to correct stormwater runoff quality and quantity. Typical BMPs used include wet ponds and bioswales.
60 5 2.26 to 2.26 King County 0.50 to 0.68Solution: Implement appropriate Best Management Practices (BMP) to correct stormwater runoff quality and quantity. Typical BMPs used include wet ponds and bioswales.
60 5 5.38 to 5.38 King County 0.04 to 0.05Solution: Implement appropriate Best Management Practices (BMP) to correct stormwater runoff quality and quantity. Typical BMPs used include wet ponds and bioswales.
60.5 5 155.09 to 155.09 King County 0.01 to 0.02Solution: Implement appropriate Best Management Practices (BMP) to correct stormwater runoff quality and quantity. Typical BMPs used include wet ponds and bioswales.
60.5 5 155.18 to 155.18 King County 0.00 to 0.00Solution: Implement appropriate Best Management Practices (BMP) to correct stormwater runoff quality and quantity. Typical BMPs used include wet ponds and bioswales.
61 5 154.99 to 154.99 King County 0.01 to 0.02Solution: Implement appropriate Best Management Practices (BMP) to correct stormwater runoff quality and quantity. Typical BMPs used include wet ponds and bioswales.
61 5 154.26 to 154.26 King County 0.05 to 0.07Solution: Implement appropriate Best Management Practices (BMP) to correct stormwater runoff quality and quantity. Typical BMPs used include wet ponds and bioswales.
61 5 154.43 to 154.43 King County 0.03 to 0.03Solution: Implement appropriate Best Management Practices (BMP) to correct stormwater runoff quality and quantity. Typical BMPs used include wet ponds and bioswales.
61 5 154.43 to 154.43 King County 0.11 to 0.15Solution: Implement appropriate Best Management Practices (BMP) to correct stormwater runoff quality and quantity. Typical BMPs used include wet ponds and bioswales.
61 5 154.49 to 154.49 King County 1.45 to 1.96Solution: Implement appropriate Best Management Practices (BMP) to correct stormwater runoff quality and quantity. Typical BMPs used include wet ponds and bioswales.
61 5 154.57 to 154.57 King County 0.18 to 0.25Solution: Implement appropriate Best Management Practices (BMP) to correct stormwater runoff quality and quantity. Typical BMPs used include wet ponds and bioswales.
61 5 154.92 to 154.92 King County 0.03 to 0.03Solution: Implement appropriate Best Management Practices (BMP) to correct stormwater runoff quality and quantity. Typical BMPs used include wet ponds and bioswales.
61 5 155.04 to 155.04 King County 0.01 to 0.02Solution: Implement appropriate Best Management Practices (BMP) to correct stormwater runoff quality and quantity. Typical BMPs used include wet ponds and bioswales.
61 5 202.3 to 202.3 Snohomish County 0.01 to 0.02Solution: Implement appropriate Best Management Practices (BMP) to correct stormwater runoff quality and quantity. Typical BMPs used include wet ponds and bioswales.
61 5 154.66 to 154.66 King County 0.05 to 0.07Solution: Implement appropriate Best Management Practices (BMP) to correct stormwater runoff quality and quantity. Typical BMPs used include wet ponds and bioswales.
62 5 154.22 to 154.22 King County 0.03 to 0.03Solution: Implement appropriate Best Management Practices (BMP) to correct stormwater runoff quality and quantity. Typical BMPs used include wet ponds and bioswales.
62 2 3.44 to 3.44 Snohomish County 0.04 to 0.06Solution: Implement appropriate Best Management Practices (BMP) to correct stormwater runoff quality and quantity. Typical BMPs used include wet ponds and bioswales.
62 515 2.21 to 2.21 King County 0.01 to 0.02Solution: Implement appropriate Best Management Practices (BMP) to correct stormwater runoff quality and quantity. Typical BMPs used include wet ponds and bioswales.
62 5 153.26 to 153.26 King County 0.25 to 0.33Solution: Implement appropriate Best Management Practices (BMP) to correct stormwater runoff quality and quantity. Typical BMPs used include wet ponds and bioswales.
62 5 153.39 to 153.39 King County 0.04 to 0.05Solution: Implement appropriate Best Management Practices (BMP) to correct stormwater runoff quality and quantity. Typical BMPs used include wet ponds and bioswales.
62 5 3.99 to 3.99 King County 0.24 to 0.32Solution: Implement appropriate Best Management Practices (BMP) to correct stormwater runoff quality and quantity. Typical BMPs used include wet ponds and bioswales.
62 5 4.01 to 4.01 King County 0.05 to 0.07Solution: Implement appropriate Best Management Practices (BMP) to correct stormwater runoff quality and quantity. Typical BMPs used include wet ponds and bioswales.

Washington State Highway System Plan: 2003-2022 Appendix K – 131February 2002
Appendix K: Statewide List 20-Year I4 Stormwater SolutionsHighway Estimate Cost Range
Rank Number Milepost Vicinity Description ($ in Millions)Northwest Region (continued)
62.5 5 145.6 to 145.6 King County 0.05 to 0.07Solution: Implement appropriate Best Management Practices (BMP) to correct stormwater runoff quality and quantity. Typical BMPs used include wet ponds and bioswales.
62.5 5 202.32 to 202.32 Snohomish County 0.07 to 0.10Solution: Implement appropriate Best Management Practices (BMP) to correct stormwater runoff quality and quantity. Typical BMPs used include wet ponds and bioswales.
63 509 26.28 to 26.28 King County 0.05 to 0.07Solution: Implement appropriate Best Management Practices (BMP) to correct stormwater runoff quality and quantity. Typical BMPs used include wet ponds and bioswales.
63 509 24.65 to 24.65 King County 2.52 to 3.41Solution: Implement appropriate Best Management Practices (BMP) to correct stormwater runoff quality and quantity. Typical BMPs used include wet ponds and bioswales.
63 509 23.85 to 23.85 King County 0.24 to 0.32Solution: Implement appropriate Best Management Practices (BMP) to correct stormwater runoff quality and quantity. Typical BMPs used include wet ponds and bioswales.
63 405 7.16 to 7.16 King County 0.97 to 1.31Solution: Implement appropriate Best Management Practices (BMP) to correct stormwater runoff quality and quantity. Typical BMPs used include wet ponds and bioswales.
63 405 23.62 to 23.62 King County 0.17 to 0.23Solution: Implement appropriate Best Management Practices (BMP) to correct stormwater runoff quality and quantity. Typical BMPs used include wet ponds and bioswales.
63.5 5 200.22 to 200.22 Snohomish County 0.00 to 0.00Solution: Implement appropriate Best Management Practices (BMP) to correct stormwater runoff quality and quantity. Typical BMPs used include wet ponds and bioswales.
64 405 13.53 to 13.53 King County 0.06 to 0.08Solution: Implement appropriate Best Management Practices (BMP) to correct stormwater runoff quality and quantity. Typical BMPs used include wet ponds and bioswales.
64 405 2.66 to 2.66 King County 0.01 to 0.02Solution: Implement appropriate Best Management Practices (BMP) to correct stormwater runoff quality and quantity. Typical BMPs used include wet ponds and bioswales.
64 405 2.39 to 2.39 King County 0.75 to 1.01Solution: Implement appropriate Best Management Practices (BMP) to correct stormwater runoff quality and quantity. Typical BMPs used include wet ponds and bioswales.
64 405 2.38 to 2.38 King County 6.22 to 8.41Solution: Implement appropriate Best Management Practices (BMP) to correct stormwater runoff quality and quantity. Typical BMPs used include wet ponds and bioswales.
64.5 5 200.05 to 200.05 Snohomish County 0.00 to 0.00Solution: Implement appropriate Best Management Practices (BMP) to correct stormwater runoff quality and quantity. Typical BMPs used include wet ponds and bioswales.
64.5 405 12.97 to 12.97 King County 0.01 to 0.02Solution: Implement appropriate Best Management Practices (BMP) to correct stormwater runoff quality and quantity. Typical BMPs used include wet ponds and bioswales.
64.5 405 12.79 to 12.79 King County 0.01 to 0.02Solution: Implement appropriate Best Management Practices (BMP) to correct stormwater runoff quality and quantity. Typical BMPs used include wet ponds and bioswales.
64.5 5 200.05 to 200.05 Snohomish County 0.00 to 0.00Solution: Implement appropriate Best Management Practices (BMP) to correct stormwater runoff quality and quantity. Typical BMPs used include wet ponds and bioswales.
65 405 10.18 to 10.18 King County 0.01 to 0.02Solution: Implement appropriate Best Management Practices (BMP) to correct stormwater runoff quality and quantity. Typical BMPs used include wet ponds and bioswales.
65 405 12.73 to 12.73 King County 0.05 to 0.07Solution: Implement appropriate Best Management Practices (BMP) to correct stormwater runoff quality and quantity. Typical BMPs used include wet ponds and bioswales.
65.5 5 195.37 to 195.37 Snohomish County 0.01 to 0.02Solution: Implement appropriate Best Management Practices (BMP) to correct stormwater runoff quality and quantity. Typical BMPs used include wet ponds and bioswales.
66 405 10.14 to 10.14 King County 0.08 to 0.11Solution: Implement appropriate Best Management Practices (BMP) to correct stormwater runoff quality and quantity. Typical BMPs used include wet ponds and bioswales.
66 18 8 to 8 King County 0.04 to 0.05Solution: Implement appropriate Best Management Practices (BMP) to correct stormwater runoff quality and quantity. Typical BMPs used include wet ponds and bioswales.
66 18 22.77 to 22.77 King County 0.04 to 0.06Solution: Implement appropriate Best Management Practices (BMP) to correct stormwater runoff quality and quantity. Typical BMPs used include wet ponds and bioswales.
66 405 1.58 to 1.58 King County 0.01 to 0.02Solution: Implement appropriate Best Management Practices (BMP) to correct stormwater runoff quality and quantity. Typical BMPs used include wet ponds and bioswales.
66.5 18 18.91 to 18.91 King County 0.00 to 0.00Solution: Implement appropriate Best Management Practices (BMP) to correct stormwater runoff quality and quantity. Typical BMPs used include wet ponds and bioswales.
66.5 18 1.9 to 1.9 King County 0.22 to 0.30Solution: Implement appropriate Best Management Practices (BMP) to correct stormwater runoff quality and quantity. Typical BMPs used include wet ponds and bioswales.
66.5 5 191.89 to 191.89 Snohomish County 0.07 to 0.09Solution: Implement appropriate Best Management Practices (BMP) to correct stormwater runoff quality and quantity. Typical BMPs used include wet ponds and bioswales.
67 18 0.3 to 0.3 King County 0.00 to 0.00Solution: Implement appropriate Best Management Practices (BMP) to correct stormwater runoff quality and quantity. Typical BMPs used include wet ponds and bioswales.
69 5 189.74 to 189.74 Snohomish County 0.84 to 1.14Solution: Implement appropriate Best Management Practices (BMP) to correct stormwater runoff quality and quantity. Typical BMPs used include wet ponds and bioswales.
70 5 187.86 to 187.86 Snohomish County 0.00 to 0.00Solution: Implement appropriate Best Management Practices (BMP) to correct stormwater runoff quality and quantity. Typical BMPs used include wet ponds and bioswales.
70.5 5 187.86 to 187.86 Snohomish County 0.10 to 0.14Solution: Implement appropriate Best Management Practices (BMP) to correct stormwater runoff quality and quantity. Typical BMPs used include wet ponds and bioswales.
74.5 5 187.75 to 187.75 Snohomish County 0.03 to 0.03Solution: Implement appropriate Best Management Practices (BMP) to correct stormwater runoff quality and quantity. Typical BMPs used include wet ponds and bioswales.
78 5 187.72 to 187.72 Snohomish County 0.03 to 0.05Solution: Implement appropriate Best Management Practices (BMP) to correct stormwater runoff quality and quantity. Typical BMPs used include wet ponds and bioswales.
79 5 187.64 to 187.64 Snohomish County 0.13 to 0.17Solution: Implement appropriate Best Management Practices (BMP) to correct stormwater runoff quality and quantity. Typical BMPs used include wet ponds and bioswales.
80 5 187.62 to 187.62 Snohomish County 0.01 to 0.02Solution: Implement appropriate Best Management Practices (BMP) to correct stormwater runoff quality and quantity. Typical BMPs used include wet ponds and bioswales.
82.5 5 187.11 to 187.11 Snohomish County 0.45 to 0.61Solution: Implement appropriate Best Management Practices (BMP) to correct stormwater runoff quality and quantity. Typical BMPs used include wet ponds and bioswales.
82.5 5 187.58 to 187.58 Snohomish County 0.04 to 0.05Solution: Implement appropriate Best Management Practices (BMP) to correct stormwater runoff quality and quantity. Typical BMPs used include wet ponds and bioswales.

Appendix K – 132 Washington State Highway System Plan: 2003-2022 February 2002
Appendix K: Statewide List 20-Year I4 Stormwater SolutionsHighway Estimate Cost Range
Rank Number Milepost Vicinity Description ($ in Millions)Olympic Region
47.5 5 120.98 to 120.98 Pierce County 0.09 to 0.13Solution: Implement appropriate Best Management Practices (BMP) to correct stormwater runoff quality and quantity. Typical BMPs used include wet ponds and bioswales.
48 5 120.93 to 120.93 Pierce County 0.09 to 0.13Solution: Implement appropriate Best Management Practices (BMP) to correct stormwater runoff quality and quantity. Typical BMPs used include wet ponds and bioswales.
48 5 120.91 to 120.91 Pierce County 0.09 to 0.13Solution: Implement appropriate Best Management Practices (BMP) to correct stormwater runoff quality and quantity. Typical BMPs used include wet ponds and bioswales.
49 5 120.88 to 120.88 Pierce County 0.09 to 0.13Solution: Implement appropriate Best Management Practices (BMP) to correct stormwater runoff quality and quantity. Typical BMPs used include wet ponds and bioswales.
49 5 120.89 to 120.89 Pierce County 0.09 to 0.13Solution: Implement appropriate Best Management Practices (BMP) to correct stormwater runoff quality and quantity. Typical BMPs used include wet ponds and bioswales.
49.5 5 120.86 to 120.86 Pierce County 0.09 to 0.13Solution: Implement appropriate Best Management Practices (BMP) to correct stormwater runoff quality and quantity. Typical BMPs used include wet ponds and bioswales.
50 5 120.78 to 120.78 Pierce County 0.09 to 0.13Solution: Implement appropriate Best Management Practices (BMP) to correct stormwater runoff quality and quantity. Typical BMPs used include wet ponds and bioswales.
50 5 120.85 to 120.85 Pierce County 0.09 to 0.13Solution: Implement appropriate Best Management Practices (BMP) to correct stormwater runoff quality and quantity. Typical BMPs used include wet ponds and bioswales.
51 5 119.15 to 119.15 Pierce County 0.09 to 0.13Solution: Implement appropriate Best Management Practices (BMP) to correct stormwater runoff quality and quantity. Typical BMPs used include wet ponds and bioswales.
51.5 5 118.9 to 118.9 Pierce County 0.09 to 0.13Solution: Implement appropriate Best Management Practices (BMP) to correct stormwater runoff quality and quantity. Typical BMPs used include wet ponds and bioswales.
51.5 5 114.97 to 114.97 Pierce County 0.16 to 0.22Solution: Implement appropriate Best Management Practices (BMP) to correct stormwater runoff quality and quantity. Typical BMPs used include wet ponds and bioswales.
53 5 114.11 to 114.11 Pierce County 0.18 to 0.24Solution: Implement appropriate Best Management Practices (BMP) to correct stormwater runoff quality and quantity. Typical BMPs used include wet ponds and bioswales.
54 161 20.06 to 20.06 Pierce County 0.09 to 0.13Solution: Implement appropriate Best Management Practices (BMP) to correct stormwater runoff quality and quantity. Typical BMPs used include wet ponds and bioswales.
62 7 50.61 to 50.61 Pierce County 0.09 to 0.13Solution: Implement appropriate Best Management Practices (BMP) to correct stormwater runoff quality and quantity. Typical BMPs used include wet ponds and bioswales.
62 7 50.61 to 50.61 Pierce County 0.09 to 0.13Solution: Implement appropriate Best Management Practices (BMP) to correct stormwater runoff quality and quantity. Typical BMPs used include wet ponds and bioswales.
62 7 51.08 to 51.08 Pierce County 0.11 to 0.14Solution: Implement appropriate Best Management Practices (BMP) to correct stormwater runoff quality and quantity. Typical BMPs used include wet ponds and bioswales.
62 7 51.24 to 51.24 Pierce County 0.11 to 0.14Solution: Implement appropriate Best Management Practices (BMP) to correct stormwater runoff quality and quantity. Typical BMPs used include wet ponds and bioswales.
64 7 50.59 to 50.59 Pierce County 0.09 to 0.13Solution: Implement appropriate Best Management Practices (BMP) to correct stormwater runoff quality and quantity. Typical BMPs used include wet ponds and bioswales.
64.5 7 50.55 to 50.55 Pierce County 0.09 to 0.13Solution: Implement appropriate Best Management Practices (BMP) to correct stormwater runoff quality and quantity. Typical BMPs used include wet ponds and bioswales.
64.5 7 50.49 to 50.49 Pierce County 0.09 to 0.13Solution: Implement appropriate Best Management Practices (BMP) to correct stormwater runoff quality and quantity. Typical BMPs used include wet ponds and bioswales.
66.5 7 48.54 to 48.54 Pierce County 0.09 to 0.13Solution: Implement appropriate Best Management Practices (BMP) to correct stormwater runoff quality and quantity. Typical BMPs used include wet ponds and bioswales.
67 5 138.44 to 138.44 Pierce County 0.03 to 0.03Solution: Implement appropriate Best Management Practices (BMP) to correct stormwater runoff quality and quantity. Typical BMPs used include wet ponds and bioswales.
68 5 138.43 to 138.43 Pierce County 0.03 to 0.05Solution: Implement appropriate Best Management Practices (BMP) to correct stormwater runoff quality and quantity. Typical BMPs used include wet ponds and bioswales.
69 5 136.09 to 136.09 Pierce County 0.21 to 0.29Solution: Implement appropriate Best Management Practices (BMP) to correct stormwater runoff quality and quantity. Typical BMPs used include wet ponds and bioswales.
69 5 138.43 to 138.43 Pierce County 0.04 to 0.06Solution: Implement appropriate Best Management Practices (BMP) to correct stormwater runoff quality and quantity. Typical BMPs used include wet ponds and bioswales.
70.5 5 135.94 to 135.94 Pierce County 0.36 to 0.49Solution: Implement appropriate Best Management Practices (BMP) to correct stormwater runoff quality and quantity. Typical BMPs used include wet ponds and bioswales.
71 512 9.69 to 9.69 Pierce County 0.34 to 0.46Solution: Implement appropriate Best Management Practices (BMP) to correct stormwater runoff quality and quantity. Typical BMPs used include wet ponds and bioswales.
71 512 9.6 to 9.6 Pierce County 0.03 to 0.03Solution: Implement appropriate Best Management Practices (BMP) to correct stormwater runoff quality and quantity. Typical BMPs used include wet ponds and bioswales.
72 512 9.34 to 9.34 Pierce County 0.08 to 0.11Solution: Implement appropriate Best Management Practices (BMP) to correct stormwater runoff quality and quantity. Typical BMPs used include wet ponds and bioswales.
73 512 9.27 to 9.27 Pierce County 0.22 to 0.30Solution: Implement appropriate Best Management Practices (BMP) to correct stormwater runoff quality and quantity. Typical BMPs used include wet ponds and bioswales.
73.5 512 3.31 to 3.31 Pierce County 0.19 to 0.26Solution: Implement appropriate Best Management Practices (BMP) to correct stormwater runoff quality and quantity. Typical BMPs used include wet ponds and bioswales.
74 5 121.3 to 121.3 Pierce County 0.09 to 0.13Solution: Implement appropriate Best Management Practices (BMP) to correct stormwater runoff quality and quantity. Typical BMPs used include wet ponds and bioswales.
74 5 122.67 to 122.67 Pierce County 0.42 to 0.56Solution: Implement appropriate Best Management Practices (BMP) to correct stormwater runoff quality and quantity. Typical BMPs used include wet ponds and bioswales.
100 5 120.9 to 120.9 Pierce County 0.09 to 0.13Solution: Implement appropriate Best Management Practices (BMP) to correct stormwater runoff quality and quantity. Typical BMPs used include wet ponds and bioswales.
100 5 121.05 to 121.05 Pierce County 0.09 to 0.13Solution: Implement appropriate Best Management Practices (BMP) to correct stormwater runoff quality and quantity. Typical BMPs used include wet ponds and bioswales.

Washington State Highway System Plan: 2003-2022 Appendix K – 133February 2002
Appendix K: Statewide List 20-Year I4 Stormwater SolutionsHighway Estimate Cost Range
Rank Number Milepost Vicinity Description ($ in Millions)Southwest Region 67 205 36.05 to 36.05 Clark County 0.04 to 0.05Solution: Implement appropriate Best Management Practices (BMP) to correct stormwater runoff quality and quantity. Typical BMPs used include wet ponds and bioswales.
67 205 37.67 to 37.67 Clark County 0.14 to 0.20Solution: Implement appropriate Best Management Practices (BMP) to correct stormwater runoff quality and quantity. Typical BMPs used include wet ponds and bioswales.
67 205 35.17 to 35.17 Clark County 0.08 to 0.10Solution: Implement appropriate Best Management Practices (BMP) to correct stormwater runoff quality and quantity. Typical BMPs used include wet ponds and bioswales.
67 500 5.49 to 5.49 Clark County 0.26 to 0.36Solution: Implement appropriate Best Management Practices (BMP) to correct stormwater runoff quality and quantity. Typical BMPs used include wet ponds and bioswales.
67 205 36.04 to 36.04 Clark County 0.18 to 0.24Solution: Implement appropriate Best Management Practices (BMP) to correct stormwater runoff quality and quantity. Typical BMPs used include wet ponds and bioswales.
67.5 205 32.79 to 32.79 Clark County 0.03 to 0.03Solution: Implement appropriate Best Management Practices (BMP) to correct stormwater runoff quality and quantity. Typical BMPs used include wet ponds and bioswales.
68 205 32.68 to 32.68 Clark County 0.19 to 0.26Solution: Implement appropriate Best Management Practices (BMP) to correct stormwater runoff quality and quantity. Typical BMPs used include wet ponds and bioswales.
68 205 32.67 to 32.67 Clark County 0.11 to 0.14Solution: Implement appropriate Best Management Practices (BMP) to correct stormwater runoff quality and quantity. Typical BMPs used include wet ponds and bioswales.
69 205 32.31 to 32.31 Clark County 0.21 to 0.28Solution: Implement appropriate Best Management Practices (BMP) to correct stormwater runoff quality and quantity. Typical BMPs used include wet ponds and bioswales.
69 205 32.25 to 32.25 Clark County 0.05 to 0.07Solution: Implement appropriate Best Management Practices (BMP) to correct stormwater runoff quality and quantity. Typical BMPs used include wet ponds and bioswales.
70 205 30.66 to 30.66 Clark County 0.04 to 0.05Solution: Implement appropriate Best Management Practices (BMP) to correct stormwater runoff quality and quantity. Typical BMPs used include wet ponds and bioswales.
70 205 30.65 to 30.65 Clark County 0.36 to 0.49Solution: Implement appropriate Best Management Practices (BMP) to correct stormwater runoff quality and quantity. Typical BMPs used include wet ponds and bioswales.
70 205 30.43 to 30.43 Clark County 0.42 to 0.56Solution: Implement appropriate Best Management Practices (BMP) to correct stormwater runoff quality and quantity. Typical BMPs used include wet ponds and bioswales.
71 205 29.68 to 29.68 Clark County 0.08 to 0.11Solution: Implement appropriate Best Management Practices (BMP) to correct stormwater runoff quality and quantity. Typical BMPs used include wet ponds and bioswales.
73 205 29.67 to 29.67 Clark County 0.87 to 1.18Solution: Implement appropriate Best Management Practices (BMP) to correct stormwater runoff quality and quantity. Typical BMPs used include wet ponds and bioswales.
74 14 7.6 to 7.6 Clark County 0.10 to 0.14Solution: Implement appropriate Best Management Practices (BMP) to correct stormwater runoff quality and quantity. Typical BMPs used include wet ponds and bioswales.
74 205 36.05 to 36.05 Clark County 0.51 to 0.70Solution: Implement appropriate Best Management Practices (BMP) to correct stormwater runoff quality and quantity. Typical BMPs used include wet ponds and bioswales.
75 14 7.27 to 7.27 Clark County 0.25 to 0.34Solution: Implement appropriate Best Management Practices (BMP) to correct stormwater runoff quality and quantity. Typical BMPs used include wet ponds and bioswales.
78 14 7.25 to 7.25 Clark County 0.26 to 0.36Solution: Implement appropriate Best Management Practices (BMP) to correct stormwater runoff quality and quantity. Typical BMPs used include wet ponds and bioswales.
80 14 5.41 to 5.41 Clark County 0.03 to 0.04Solution: Implement appropriate Best Management Practices (BMP) to correct stormwater runoff quality and quantity. Typical BMPs used include wet ponds and bioswales.
81 14 4.85 to 4.85 Clark County 0.10 to 0.14Solution: Implement appropriate Best Management Practices (BMP) to correct stormwater runoff quality and quantity. Typical BMPs used include wet ponds and bioswales.
81.5 14 4.01 to 4.01 Clark County 0.03 to 0.04Solution: Implement appropriate Best Management Practices (BMP) to correct stormwater runoff quality and quantity. Typical BMPs used include wet ponds and bioswales.
82 14 0.47 to 0.47 Clark County 0.01 to 0.02Solution: Implement appropriate Best Management Practices (BMP) to correct stormwater runoff quality and quantity. Typical BMPs used include wet ponds and bioswales.

Appendix K – 134 Washington State Highway System Plan: 2003-2022 February 2002
Appendix K: Statewide List 20-Year I4 Stormwater SolutionsHighway Estimate Cost Range
Rank Number Milepost Vicinity Description ($ in Millions)Eastern Region 46 90 299.09 to 299.09 Spokane County 0.01 to 0.02Solution: Implement appropriate Best Management Practices (BMP) to correct stormwater runoff quality and quantity. Typical BMPs used include wet ponds and bioswales.
46 90 299.36 to 299.36 Spokane County 0.09 to 0.13Solution: Implement appropriate Best Management Practices (BMP) to correct stormwater runoff quality and quantity. Typical BMPs used include wet ponds and bioswales.
46 90 298.45 to 298.45 Spokane County 0.01 to 0.02Solution: Implement appropriate Best Management Practices (BMP) to correct stormwater runoff quality and quantity. Typical BMPs used include wet ponds and bioswales.
48 90 295.9 to 295.9 Spokane County 0.09 to 0.13Solution: Implement appropriate Best Management Practices (BMP) to correct stormwater runoff quality and quantity. Typical BMPs used include wet ponds and bioswales.
48 90 297.85 to 297.85 Spokane County 0.09 to 0.13Solution: Implement appropriate Best Management Practices (BMP) to correct stormwater runoff quality and quantity. Typical BMPs used include wet ponds and bioswales.
48 90 297.75 to 297.75 Spokane County 0.09 to 0.13Solution: Implement appropriate Best Management Practices (BMP) to correct stormwater runoff quality and quantity. Typical BMPs used include wet ponds and bioswales.
48 90 297.4 to 297.4 Spokane County 0.09 to 0.13Solution: Implement appropriate Best Management Practices (BMP) to correct stormwater runoff quality and quantity. Typical BMPs used include wet ponds and bioswales.
48 90 296.6 to 296.6 Spokane County 0.09 to 0.13Solution: Implement appropriate Best Management Practices (BMP) to correct stormwater runoff quality and quantity. Typical BMPs used include wet ponds and bioswales.
48 90 298.07 to 298.07 Spokane County 0.09 to 0.13Solution: Implement appropriate Best Management Practices (BMP) to correct stormwater runoff quality and quantity. Typical BMPs used include wet ponds and bioswales.
48 90 295.8 to 295.8 Spokane County 0.09 to 0.13Solution: Implement appropriate Best Management Practices (BMP) to correct stormwater runoff quality and quantity. Typical BMPs used include wet ponds and bioswales.
48 90 295.6 to 295.6 Spokane County 0.09 to 0.13Solution: Implement appropriate Best Management Practices (BMP) to correct stormwater runoff quality and quantity. Typical BMPs used include wet ponds and bioswales.
48 90 295.4 to 295.4 Spokane County 0.09 to 0.13Solution: Implement appropriate Best Management Practices (BMP) to correct stormwater runoff quality and quantity. Typical BMPs used include wet ponds and bioswales.
48 90 295.25 to 295.25 Spokane County 0.09 to 0.13Solution: Implement appropriate Best Management Practices (BMP) to correct stormwater runoff quality and quantity. Typical BMPs used include wet ponds and bioswales.
48 90 295.05 to 295.05 Spokane County 0.09 to 0.13Solution: Implement appropriate Best Management Practices (BMP) to correct stormwater runoff quality and quantity. Typical BMPs used include wet ponds and bioswales.
48 90 294 to 294 Spokane County 0.09 to 0.13Solution: Implement appropriate Best Management Practices (BMP) to correct stormwater runoff quality and quantity. Typical BMPs used include wet ponds and bioswales.
48 90 297.2 to 297.2 Spokane County 0.09 to 0.13Solution: Implement appropriate Best Management Practices (BMP) to correct stormwater runoff quality and quantity. Typical BMPs used include wet ponds and bioswales.
49 90 293.3 to 293.3 Spokane County 0.09 to 0.13Solution: Implement appropriate Best Management Practices (BMP) to correct stormwater runoff quality and quantity. Typical BMPs used include wet ponds and bioswales.
49 90 290 to 290 Spokane County 0.09 to 0.13Solution: Implement appropriate Best Management Practices (BMP) to correct stormwater runoff quality and quantity. Typical BMPs used include wet ponds and bioswales.
49 90 291.9 to 291.9 Spokane County 0.09 to 0.13Solution: Implement appropriate Best Management Practices (BMP) to correct stormwater runoff quality and quantity. Typical BMPs used include wet ponds and bioswales.
49 90 292.1 to 292.1 Spokane County 0.09 to 0.13Solution: Implement appropriate Best Management Practices (BMP) to correct stormwater runoff quality and quantity. Typical BMPs used include wet ponds and bioswales.
49 90 292.5 to 292.5 Spokane County 0.09 to 0.13Solution: Implement appropriate Best Management Practices (BMP) to correct stormwater runoff quality and quantity. Typical BMPs used include wet ponds and bioswales.
49 90 292.68 to 292.68 Spokane County 0.09 to 0.13Solution: Implement appropriate Best Management Practices (BMP) to correct stormwater runoff quality and quantity. Typical BMPs used include wet ponds and bioswales.
49 90 292.87 to 292.87 Spokane County 0.09 to 0.13Solution: Implement appropriate Best Management Practices (BMP) to correct stormwater runoff quality and quantity. Typical BMPs used include wet ponds and bioswales.
49 90 292 to 292 Spokane County 0.09 to 0.13Solution: Implement appropriate Best Management Practices (BMP) to correct stormwater runoff quality and quantity. Typical BMPs used include wet ponds and bioswales.
49 90 293.1 to 293.1 Spokane County 0.09 to 0.13Solution: Implement appropriate Best Management Practices (BMP) to correct stormwater runoff quality and quantity. Typical BMPs used include wet ponds and bioswales.
49 90 293.45 to 293.45 Spokane County 0.09 to 0.13Solution: Implement appropriate Best Management Practices (BMP) to correct stormwater runoff quality and quantity. Typical BMPs used include wet ponds and bioswales.
49 90 293.75 to 293.75 Spokane County 0.09 to 0.13Solution: Implement appropriate Best Management Practices (BMP) to correct stormwater runoff quality and quantity. Typical BMPs used include wet ponds and bioswales.
49 90 293 to 293 Spokane County 0.09 to 0.13Solution: Implement appropriate Best Management Practices (BMP) to correct stormwater runoff quality and quantity. Typical BMPs used include wet ponds and bioswales.
49 90 294.05 to 294.05 Spokane County 0.09 to 0.13Solution: Implement appropriate Best Management Practices (BMP) to correct stormwater runoff quality and quantity. Typical BMPs used include wet ponds and bioswales.
49 90 294.25 to 294.25 Spokane County 0.09 to 0.13Solution: Implement appropriate Best Management Practices (BMP) to correct stormwater runoff quality and quantity. Typical BMPs used include wet ponds and bioswales.
49 90 294.4 to 294.4 Spokane County 0.09 to 0.13Solution: Implement appropriate Best Management Practices (BMP) to correct stormwater runoff quality and quantity. Typical BMPs used include wet ponds and bioswales.
49 90 290.5 to 290.5 Spokane County 0.09 to 0.13Solution: Implement appropriate Best Management Practices (BMP) to correct stormwater runoff quality and quantity. Typical BMPs used include wet ponds and bioswales.
49 90 294.6 to 294.6 Spokane County 0.09 to 0.13Solution: Implement appropriate Best Management Practices (BMP) to correct stormwater runoff quality and quantity. Typical BMPs used include wet ponds and bioswales.
49 90 289.89 to 289.89 Spokane County 0.09 to 0.13Solution: Implement appropriate Best Management Practices (BMP) to correct stormwater runoff quality and quantity. Typical BMPs used include wet ponds and bioswales.
49 90 294.9 to 294.9 Spokane County 0.09 to 0.13Solution: Implement appropriate Best Management Practices (BMP) to correct stormwater runoff quality and quantity. Typical BMPs used include wet ponds and bioswales.
49 90 294.52 to 294.52 Spokane County 0.09 to 0.13Solution: Implement appropriate Best Management Practices (BMP) to correct stormwater runoff quality and quantity. Typical BMPs used include wet ponds and bioswales.
49 90 288.1 to 288.1 Spokane County 0.09 to 0.13Solution: Implement appropriate Best Management Practices (BMP) to correct stormwater runoff quality and quantity. Typical BMPs used include wet ponds and bioswales.
49 90 290.01 to 290.01 Spokane County 0.09 to 0.13Solution: Implement appropriate Best Management Practices (BMP) to correct stormwater runoff quality and quantity. Typical BMPs used include wet ponds and bioswales.
49 90 287.8 to 287.8 Spokane County 0.09 to 0.13Solution: Implement appropriate Best Management Practices (BMP) to correct stormwater runoff quality and quantity. Typical BMPs used include wet ponds and bioswales.
49 90 288.05 to 288.05 Spokane County 0.09 to 0.13Solution: Implement appropriate Best Management Practices (BMP) to correct stormwater runoff quality and quantity. Typical BMPs used include wet ponds and bioswales.

Washington State Highway System Plan: 2003-2022 Appendix K – 135February 2002
Appendix K: Statewide List 20-Year I4 Stormwater SolutionsHighway Estimate Cost Range
Rank Number Milepost Vicinity Description ($ in Millions)Eastern Region (continued)
49 90 287.75 to 287.75 Spokane County 0.09 to 0.13Solution: Implement appropriate Best Management Practices (BMP) to correct stormwater runoff quality and quantity. Typical BMPs used include wet ponds and bioswales.
49 90 288.2 to 288.2 Spokane County 0.09 to 0.13Solution: Implement appropriate Best Management Practices (BMP) to correct stormwater runoff quality and quantity. Typical BMPs used include wet ponds and bioswales.
49 90 288.45 to 288.45 Spokane County 0.09 to 0.13Solution: Implement appropriate Best Management Practices (BMP) to correct stormwater runoff quality and quantity. Typical BMPs used include wet ponds and bioswales.
49 90 288.59 to 288.59 Spokane County 0.09 to 0.13Solution: Implement appropriate Best Management Practices (BMP) to correct stormwater runoff quality and quantity. Typical BMPs used include wet ponds and bioswales.
49 90 289.8 to 289.8 Spokane County 0.09 to 0.13Solution: Implement appropriate Best Management Practices (BMP) to correct stormwater runoff quality and quantity. Typical BMPs used include wet ponds and bioswales.
49 90 289.25 to 289.25 Spokane County 0.09 to 0.13Solution: Implement appropriate Best Management Practices (BMP) to correct stormwater runoff quality and quantity. Typical BMPs used include wet ponds and bioswales.
49 90 289.72 to 289.72 Spokane County 0.09 to 0.13Solution: Implement appropriate Best Management Practices (BMP) to correct stormwater runoff quality and quantity. Typical BMPs used include wet ponds and bioswales.
49 90 289.87 to 289.87 Spokane County 0.09 to 0.13Solution: Implement appropriate Best Management Practices (BMP) to correct stormwater runoff quality and quantity. Typical BMPs used include wet ponds and bioswales.
49 90 289.88 to 289.88 Spokane County 0.09 to 0.13Solution: Implement appropriate Best Management Practices (BMP) to correct stormwater runoff quality and quantity. Typical BMPs used include wet ponds and bioswales.
49 90 287.9 to 287.9 Spokane County 0.09 to 0.13Solution: Implement appropriate Best Management Practices (BMP) to correct stormwater runoff quality and quantity. Typical BMPs used include wet ponds and bioswales.
49 90 288.61 to 288.61 Spokane County 0.09 to 0.13Solution: Implement appropriate Best Management Practices (BMP) to correct stormwater runoff quality and quantity. Typical BMPs used include wet ponds and bioswales.
53 195 91.21 to 91.21 Spokane County 0.01 to 0.02Solution: Implement appropriate Best Management Practices (BMP) to correct stormwater runoff quality and quantity. Typical BMPs used include wet ponds and bioswales.
56 90 287.6 to 287.6 Spokane County 0.09 to 0.13Solution: Implement appropriate Best Management Practices (BMP) to correct stormwater runoff quality and quantity. Typical BMPs used include wet ponds and bioswales.
58 90 287.4 to 287.4 Spokane County 0.09 to 0.13Solution: Implement appropriate Best Management Practices (BMP) to correct stormwater runoff quality and quantity. Typical BMPs used include wet ponds and bioswales.
60 90 287.25 to 287.25 Spokane County 0.09 to 0.13Solution: Implement appropriate Best Management Practices (BMP) to correct stormwater runoff quality and quantity. Typical BMPs used include wet ponds and bioswales.
61 90 286.13 to 286.13 Spokane County 0.09 to 0.13Solution: Implement appropriate Best Management Practices (BMP) to correct stormwater runoff quality and quantity. Typical BMPs used include wet ponds and bioswales.
61 90 286 to 286 Spokane County 0.09 to 0.13Solution: Implement appropriate Best Management Practices (BMP) to correct stormwater runoff quality and quantity. Typical BMPs used include wet ponds and bioswales.
61 90 286.27 to 286.27 Spokane County 0.09 to 0.13Solution: Implement appropriate Best Management Practices (BMP) to correct stormwater runoff quality and quantity. Typical BMPs used include wet ponds and bioswales.
61 90 286.3 to 286.3 Spokane County 0.09 to 0.13Solution: Implement appropriate Best Management Practices (BMP) to correct stormwater runoff quality and quantity. Typical BMPs used include wet ponds and bioswales.
61 90 286.88 to 286.88 Spokane County 0.09 to 0.13Solution: Implement appropriate Best Management Practices (BMP) to correct stormwater runoff quality and quantity. Typical BMPs used include wet ponds and bioswales.
61 90 287.1 to 287.1 Spokane County 0.09 to 0.13Solution: Implement appropriate Best Management Practices (BMP) to correct stormwater runoff quality and quantity. Typical BMPs used include wet ponds and bioswales.
62 90 267.45 to 267.45 Spokane County 0.20 to 0.28Solution: Implement appropriate Best Management Practices (BMP) to correct stormwater runoff quality and quantity. Typical BMPs used include wet ponds and bioswales.
62 90 268.5 to 268.5 Spokane County 0.20 to 0.28Solution: Implement appropriate Best Management Practices (BMP) to correct stormwater runoff quality and quantity. Typical BMPs used include wet ponds and bioswales.
62 90 268.65 to 268.65 Spokane County 0.03 to 0.04Solution: Implement appropriate Best Management Practices (BMP) to correct stormwater runoff quality and quantity. Typical BMPs used include wet ponds and bioswales.
62 90 286.05 to 286.05 Spokane County 0.09 to 0.13Solution: Implement appropriate Best Management Practices (BMP) to correct stormwater runoff quality and quantity. Typical BMPs used include wet ponds and bioswales.
62 90 286.01 to 286.01 Spokane County 0.09 to 0.13Solution: Implement appropriate Best Management Practices (BMP) to correct stormwater runoff quality and quantity. Typical BMPs used include wet ponds and bioswales.
62 90 279.6 to 279.6 Spokane County 2.16 to 2.93Solution: Implement appropriate Best Management Practices (BMP) to correct stormwater runoff quality and quantity. Typical BMPs used include wet ponds and bioswales.
62 90 268.6 to 268.6 Spokane County 0.01 to 0.02Solution: Implement appropriate Best Management Practices (BMP) to correct stormwater runoff quality and quantity. Typical BMPs used include wet ponds and bioswales.
62 90 285.9 to 285.9 Spokane County 0.09 to 0.13Solution: Implement appropriate Best Management Practices (BMP) to correct stormwater runoff quality and quantity. Typical BMPs used include wet ponds and bioswales.
62 90 285.8 to 285.8 Spokane County 0.09 to 0.13Solution: Implement appropriate Best Management Practices (BMP) to correct stormwater runoff quality and quantity. Typical BMPs used include wet ponds and bioswales.
63 27 86.39 to 86.39 Spokane County 0.09 to 0.13Solution: Implement appropriate Best Management Practices (BMP) to correct stormwater runoff quality and quantity. Typical BMPs used include wet ponds and bioswales.
63 27 86.45 to 86.45 Spokane County 0.09 to 0.13Solution: Implement appropriate Best Management Practices (BMP) to correct stormwater runoff quality and quantity. Typical BMPs used include wet ponds and bioswales.
63 27 86.46 to 86.46 Spokane County 0.09 to 0.13Solution: Implement appropriate Best Management Practices (BMP) to correct stormwater runoff quality and quantity. Typical BMPs used include wet ponds and bioswales.
63 27 86.38 to 86.38 Spokane County 0.09 to 0.13Solution: Implement appropriate Best Management Practices (BMP) to correct stormwater runoff quality and quantity. Typical BMPs used include wet ponds and bioswales.
63.5 27 86.32 to 86.32 Spokane County 0.09 to 0.13Solution: Implement appropriate Best Management Practices (BMP) to correct stormwater runoff quality and quantity. Typical BMPs used include wet ponds and bioswales.
63.5 27 86.19 to 86.19 Spokane County 0.09 to 0.13Solution: Implement appropriate Best Management Practices (BMP) to correct stormwater runoff quality and quantity. Typical BMPs used include wet ponds and bioswales.
63.5 27 86.21 to 86.21 Spokane County 0.09 to 0.13Solution: Implement appropriate Best Management Practices (BMP) to correct stormwater runoff quality and quantity. Typical BMPs used include wet ponds and bioswales.
63.5 27 86.2 to 86.2 Spokane County 0.09 to 0.13Solution: Implement appropriate Best Management Practices (BMP) to correct stormwater runoff quality and quantity. Typical BMPs used include wet ponds and bioswales.
63.5 27 86.31 to 86.31 Spokane County 0.09 to 0.13Solution: Implement appropriate Best Management Practices (BMP) to correct stormwater runoff quality and quantity. Typical BMPs used include wet ponds and bioswales.
64 27 85.7 to 85.7 Spokane County 0.09 to 0.13Solution: Implement appropriate Best Management Practices (BMP) to correct stormwater runoff quality and quantity. Typical BMPs used include wet ponds and bioswales.

Appendix K – 136 Washington State Highway System Plan: 2003-2022 February 2002
Appendix K: Statewide List 20-Year I4 Stormwater SolutionsHighway Estimate Cost Range
Rank Number Milepost Vicinity Description ($ in Millions)Eastern Region (continued)
64 27 85.8 to 85.8 Spokane County 0.09 to 0.13Solution: Implement appropriate Best Management Practices (BMP) to correct stormwater runoff quality and quantity. Typical BMPs used include wet ponds and bioswales.
64 27 85.94 to 85.94 Spokane County 0.09 to 0.13Solution: Implement appropriate Best Management Practices (BMP) to correct stormwater runoff quality and quantity. Typical BMPs used include wet ponds and bioswales.
64 27 85.95 to 85.95 Spokane County 0.09 to 0.13Solution: Implement appropriate Best Management Practices (BMP) to correct stormwater runoff quality and quantity. Typical BMPs used include wet ponds and bioswales.
64 27 85.96 to 85.96 Spokane County 0.09 to 0.13Solution: Implement appropriate Best Management Practices (BMP) to correct stormwater runoff quality and quantity. Typical BMPs used include wet ponds and bioswales.
64 27 85 to 85 Spokane County 0.09 to 0.13Solution: Implement appropriate Best Management Practices (BMP) to correct stormwater runoff quality and quantity. Typical BMPs used include wet ponds and bioswales.
64 27 86.18 to 86.18 Spokane County 0.09 to 0.13Solution: Implement appropriate Best Management Practices (BMP) to correct stormwater runoff quality and quantity. Typical BMPs used include wet ponds and bioswales.
64 27 85.81 to 85.81 Spokane County 0.09 to 0.13Solution: Implement appropriate Best Management Practices (BMP) to correct stormwater runoff quality and quantity. Typical BMPs used include wet ponds and bioswales.
64 27 85.82 to 85.82 Spokane County 0.09 to 0.13Solution: Implement appropriate Best Management Practices (BMP) to correct stormwater runoff quality and quantity. Typical BMPs used include wet ponds and bioswales.
64.5 27 85.42 to 85.42 Spokane County 0.09 to 0.13Solution: Implement appropriate Best Management Practices (BMP) to correct stormwater runoff quality and quantity. Typical BMPs used include wet ponds and bioswales.
64.5 27 85.1 to 85.1 Spokane County 0.09 to 0.13Solution: Implement appropriate Best Management Practices (BMP) to correct stormwater runoff quality and quantity. Typical BMPs used include wet ponds and bioswales.
64.5 27 85.2 to 85.2 Spokane County 0.09 to 0.13Solution: Implement appropriate Best Management Practices (BMP) to correct stormwater runoff quality and quantity. Typical BMPs used include wet ponds and bioswales.
64.5 27 85.43 to 85.43 Spokane County 0.09 to 0.13Solution: Implement appropriate Best Management Practices (BMP) to correct stormwater runoff quality and quantity. Typical BMPs used include wet ponds and bioswales.
64.5 27 85.44 to 85.44 Spokane County 0.09 to 0.13Solution: Implement appropriate Best Management Practices (BMP) to correct stormwater runoff quality and quantity. Typical BMPs used include wet ponds and bioswales.
64.5 27 85.45 to 85.45 Spokane County 0.09 to 0.13Solution: Implement appropriate Best Management Practices (BMP) to correct stormwater runoff quality and quantity. Typical BMPs used include wet ponds and bioswales.
64.5 27 85.46 to 85.46 Spokane County 0.09 to 0.13Solution: Implement appropriate Best Management Practices (BMP) to correct stormwater runoff quality and quantity. Typical BMPs used include wet ponds and bioswales.
64.5 27 85.52 to 85.52 Spokane County 0.09 to 0.13Solution: Implement appropriate Best Management Practices (BMP) to correct stormwater runoff quality and quantity. Typical BMPs used include wet ponds and bioswales.
64.5 27 85.54 to 85.54 Spokane County 0.09 to 0.13Solution: Implement appropriate Best Management Practices (BMP) to correct stormwater runoff quality and quantity. Typical BMPs used include wet ponds and bioswales.
64.5 27 85.5 to 85.5 Spokane County 0.09 to 0.13Solution: Implement appropriate Best Management Practices (BMP) to correct stormwater runoff quality and quantity. Typical BMPs used include wet ponds and bioswales.
64.5 27 85.69 to 85.69 Spokane County 0.09 to 0.13Solution: Implement appropriate Best Management Practices (BMP) to correct stormwater runoff quality and quantity. Typical BMPs used include wet ponds and bioswales.
64.5 27 85.75 to 85.75 Spokane County 0.09 to 0.13Solution: Implement appropriate Best Management Practices (BMP) to correct stormwater runoff quality and quantity. Typical BMPs used include wet ponds and bioswales.
64.5 27 85.53 to 85.53 Spokane County 0.09 to 0.13Solution: Implement appropriate Best Management Practices (BMP) to correct stormwater runoff quality and quantity. Typical BMPs used include wet ponds and bioswales.
64.5 27 85.21 to 85.21 Spokane County 0.09 to 0.13Solution: Implement appropriate Best Management Practices (BMP) to correct stormwater runoff quality and quantity. Typical BMPs used include wet ponds and bioswales.
65 27 85.15 to 85.15 Spokane County 0.09 to 0.13Solution: Implement appropriate Best Management Practices (BMP) to correct stormwater runoff quality and quantity. Typical BMPs used include wet ponds and bioswales.
65 27 85.14 to 85.14 Spokane County 0.09 to 0.13Solution: Implement appropriate Best Management Practices (BMP) to correct stormwater runoff quality and quantity. Typical BMPs used include wet ponds and bioswales.
65 27 85.19 to 85.19 Spokane County 0.09 to 0.13Solution: Implement appropriate Best Management Practices (BMP) to correct stormwater runoff quality and quantity. Typical BMPs used include wet ponds and bioswales.
66 27 84.86 to 84.86 Spokane County 0.09 to 0.13Solution: Implement appropriate Best Management Practices (BMP) to correct stormwater runoff quality and quantity. Typical BMPs used include wet ponds and bioswales.
66 27 84.85 to 84.85 Spokane County 0.09 to 0.13Solution: Implement appropriate Best Management Practices (BMP) to correct stormwater runoff quality and quantity. Typical BMPs used include wet ponds and bioswales.
66 27 84.6 to 84.6 Spokane County 0.09 to 0.13Solution: Implement appropriate Best Management Practices (BMP) to correct stormwater runoff quality and quantity. Typical BMPs used include wet ponds and bioswales.
66 27 84.65 to 84.65 Spokane County 0.09 to 0.13Solution: Implement appropriate Best Management Practices (BMP) to correct stormwater runoff quality and quantity. Typical BMPs used include wet ponds and bioswales.
66 27 84.64 to 84.64 Spokane County 0.09 to 0.13Solution: Implement appropriate Best Management Practices (BMP) to correct stormwater runoff quality and quantity. Typical BMPs used include wet ponds and bioswales.
66 27 84.5 to 84.5 Spokane County 0.09 to 0.13Solution: Implement appropriate Best Management Practices (BMP) to correct stormwater runoff quality and quantity. Typical BMPs used include wet ponds and bioswales.
66 27 84.59 to 84.59 Spokane County 0.09 to 0.13Solution: Implement appropriate Best Management Practices (BMP) to correct stormwater runoff quality and quantity. Typical BMPs used include wet ponds and bioswales.
66 27 84.58 to 84.58 Spokane County 0.09 to 0.13Solution: Implement appropriate Best Management Practices (BMP) to correct stormwater runoff quality and quantity. Typical BMPs used include wet ponds and bioswales.
66 27 84.52 to 84.52 Spokane County 0.09 to 0.13Solution: Implement appropriate Best Management Practices (BMP) to correct stormwater runoff quality and quantity. Typical BMPs used include wet ponds and bioswales.
66 27 84.51 to 84.51 Spokane County 0.09 to 0.13Solution: Implement appropriate Best Management Practices (BMP) to correct stormwater runoff quality and quantity. Typical BMPs used include wet ponds and bioswales.
66 27 84.95 to 84.95 Spokane County 0.09 to 0.13Solution: Implement appropriate Best Management Practices (BMP) to correct stormwater runoff quality and quantity. Typical BMPs used include wet ponds and bioswales.
66 27 84.48 to 84.48 Spokane County 0.09 to 0.13Solution: Implement appropriate Best Management Practices (BMP) to correct stormwater runoff quality and quantity. Typical BMPs used include wet ponds and bioswales.
66 27 85.12 to 85.12 Spokane County 0.09 to 0.13Solution: Implement appropriate Best Management Practices (BMP) to correct stormwater runoff quality and quantity. Typical BMPs used include wet ponds and bioswales.
66 27 84.49 to 84.49 Spokane County 0.09 to 0.13Solution: Implement appropriate Best Management Practices (BMP) to correct stormwater runoff quality and quantity. Typical BMPs used include wet ponds and bioswales.
66 27 84.57 to 84.57 Spokane County 0.09 to 0.13Solution: Implement appropriate Best Management Practices (BMP) to correct stormwater runoff quality and quantity. Typical BMPs used include wet ponds and bioswales.

Washington State Highway System Plan: 2003-2022 Appendix K – 137February 2002
Appendix K: Statewide List 20-Year I4 Stormwater SolutionsHighway Estimate Cost Range
Rank Number Milepost Vicinity Description ($ in Millions)Eastern Region (continued)
66 27 84.87 to 84.87 Spokane County 0.09 to 0.13Solution: Implement appropriate Best Management Practices (BMP) to correct stormwater runoff quality and quantity. Typical BMPs used include wet ponds and bioswales.
67 195 93.3 to 93.3 Spokane County 1.01 to 1.37Solution: Implement appropriate Best Management Practices (BMP) to correct stormwater runoff quality and quantity. Typical BMPs used include wet ponds and bioswales.
67 27 84.47 to 84.47 Spokane County 0.09 to 0.13Solution: Implement appropriate Best Management Practices (BMP) to correct stormwater runoff quality and quantity. Typical BMPs used include wet ponds and bioswales.
68 195 91.6 to 91.6 Spokane County 0.05 to 0.07Solution: Implement appropriate Best Management Practices (BMP) to correct stormwater runoff quality and quantity. Typical BMPs used include wet ponds and bioswales.
68 195 92.2 to 92.2 Spokane County 1.01 to 1.37Solution: Implement appropriate Best Management Practices (BMP) to correct stormwater runoff quality and quantity. Typical BMPs used include wet ponds and bioswales.
68 195 91.8 to 91.8 Spokane County 0.06 to 0.08Solution: Implement appropriate Best Management Practices (BMP) to correct stormwater runoff quality and quantity. Typical BMPs used include wet ponds and bioswales.
68 195 92.45 to 92.45 Spokane County 1.01 to 1.37Solution: Implement appropriate Best Management Practices (BMP) to correct stormwater runoff quality and quantity. Typical BMPs used include wet ponds and bioswales.
68 195 92 to 92 Spokane County 0.01 to 0.02Solution: Implement appropriate Best Management Practices (BMP) to correct stormwater runoff quality and quantity. Typical BMPs used include wet ponds and bioswales.
69 195 91.2 to 91.2 Spokane County 0.01 to 0.02Solution: Implement appropriate Best Management Practices (BMP) to correct stormwater runoff quality and quantity. Typical BMPs used include wet ponds and bioswales.

Appendix K – 138 Washington State Highway System Plan: 2003-2022 February 2002