Washington, D.C. 20472 - San Diego...Page 1 of 5 Issue Date: March 13, 2017 Effective Date: July 24,...
17
Case No.: Page 1 of 5 Effective Date: July 24, 2017 Issue Date: March 13, 2017 LOMR-APP 15-09-2666P Washington, D.C. 20472 Federal Emergency Management Agency LETTER OF MAP REVISION DETERMINATION DOCUMENT COMMUNITY AND REVISION INFORMATION PROJECT DESCRIPTION COMMUNITY APPROXIMATE LATITUDE AND LONGITUDE: 32.895, -117.219 SOURCE: Precision Mapping Streets DATUM: NAD 83 City of San Diego San Diego County California COMMUNITY NO.: 060295 BASIS OF REQUEST IDENTIFIER FILL FLOODWAY HYDRAULIC ANALYSIS UPDATED TOPOGRAPHIC DATA Roselle Street ANNOTATED MAPPING ENCLOSURES ANNOTATED STUDY ENCLOSURES DATE: May 16, 2012 NO.: 06073C1338G TYPE: FIRM* DATE: May 16, 2012 NO.: 06073C1339G TYPE: FIRM* DATE OF EFFECTIVE FLOOD INSURANCE STUDY: April 05, 2016 PROFILE(S): 91P - 94P AND 444P - 445P FLOODWAY DATA TABLE: 13 Enclosures reflect changes to flooding sources affected by this revision. * FIRM - Flood Insurance Rate Map FLOODING SOURCES AND REVISED REACHES See Page 2 for Additional Flooding Sources Carroll Canyon Creek - From the confluence with Soledad Canyon to approximately 1,540 feet upstream of the confluence with Soledad Canyon. SUMMARY OF REVISIONS Revised Flooding Effective Flooding Flooding Source Increases Decreases Carroll Canyon Creek Zone AE Zone AE YES YES Zone X (shaded) Zone X (shaded) NONE YES BFEs * BFEs NONE YES Floodway Floodway YES YES * BFEs - Base Flood Elevations DETERMINATION This document provides the determination from the Department of Homeland Security's Federal Emergency Management Agency (FEMA) regarding a request for a Letter of Map Revision (LOMR) for the area described above. Using the information submitted, we have determined that a revision to the flood hazards depicted in the Flood Insurance Study (FIS) report and/or National Flood Insurance Program (NFIP) map is warranted. This document revises the effective NFIP map, as indicated in the attached documentation. Please use the enclosed annotated map panels revised by this LOMR for floodplain management purposes and for all flood insurance policies and renewals in your community. This determination is based on the flood data presently available. The enclosed documents provide additional information regarding this determination. If you have any questions about this document, please contact the FEMA Map Information eXchange toll free at 1-877-336-2627 (1-877-FEMA MAP) or by letter addressed to the LOMC Clearinghouse, 847 South Pickett Street, Alexandria, VA 22304-4605. Additional Information about the NFIP is available on our website at http://www.fema.gov/nfip. 15-09-2666P 102-I-A-C Patrick “Rick” F. Sacbibit, P.E., Branch Chief Engineering Services Branch Federal Insurance and Mitigation Administration
Transcript of Washington, D.C. 20472 - San Diego...Page 1 of 5 Issue Date: March 13, 2017 Effective Date: July 24,...

Case No.: Page 1 of 5 Effective Date: July 24, 2017 Issue Date: March 13, 2017 LOMR-APP15-09-2666P
Washington, D.C. 20472
Federal Emergency Management Agency
LETTER OF MAP REVISION DETERMINATION DOCUMENT
COMMUNITY AND REVISION INFORMATION PROJECT DESCRIPTION
COMMUNITY
APPROXIMATE LATITUDE AND LONGITUDE: 32.895, -117.219SOURCE: Precision Mapping Streets DATUM: NAD 83
City of San Diego San Diego County
California
COMMUNITY NO.: 060295
BASIS OF REQUEST
IDENTIFIER
FILL FLOODWAYHYDRAULIC ANALYSIS UPDATED TOPOGRAPHIC DATA
Roselle Street
ANNOTATED MAPPING ENCLOSURES ANNOTATED STUDY ENCLOSURES
DATE: May 16, 2012 NO.: 06073C1338G TYPE: FIRM*
DATE: May 16, 2012 NO.: 06073C1339G TYPE: FIRM*
DATE OF EFFECTIVE FLOOD INSURANCE STUDY: April 05, 2016
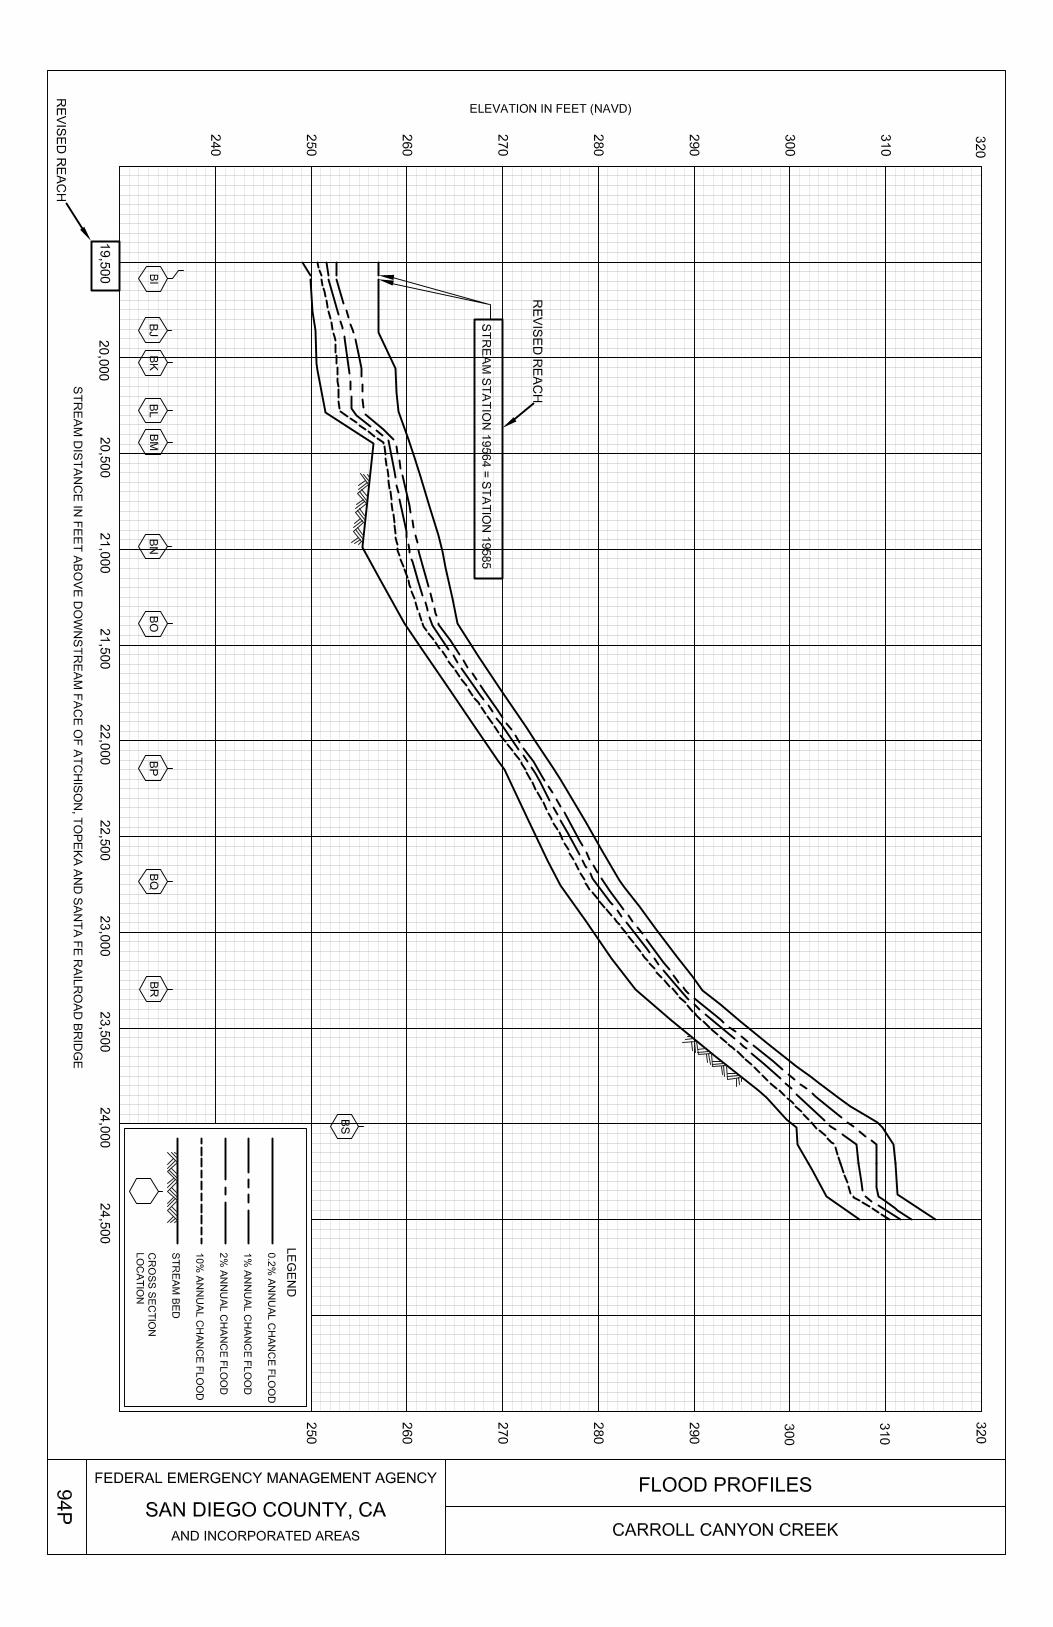
PROFILE(S): 91P - 94P AND 444P - 445P
FLOODWAY DATA TABLE: 13
Enclosures reflect changes to flooding sources affected by this revision. * FIRM - Flood Insurance Rate Map
FLOODING SOURCES AND REVISED REACHES See Page 2 for Additional Flooding Sources
Carroll Canyon Creek - From the confluence with Soledad Canyon to approximately 1,540 feet upstream of the confluence with Soledad Canyon.
SUMMARY OF REVISIONS
Revised Flooding Effective Flooding Flooding Source Increases Decreases
Carroll Canyon Creek Zone AE Zone AE YES YES
Zone X (shaded) Zone X (shaded) NONE YES
BFEs * BFEs NONE YES
Floodway Floodway YES YES
* BFEs - Base Flood Elevations
DETERMINATIONThis document provides the determination from the Department of Homeland Security's Federal Emergency Management Agency (FEMA) regarding a request for a Letter of Map Revision (LOMR) for the area described above. Using the information submitted, we have determined that a revision to the flood hazards depicted in the Flood Insurance Study (FIS) report and/or National Flood Insurance Program (NFIP) map is warranted. This document revises the effective NFIP map, as indicated in the attached documentation. Please use the enclosed annotated map panels revised by this LOMR for floodplain management purposes and for all flood insurance policies and renewals in your community.
This determination is based on the flood data presently available. The enclosed documents provide additional information regarding this determination. If you have any questions about this document, please contact the FEMA Map Information eXchange toll free at 1-877-336-2627 (1-877-FEMA MAP) or by letter addressed to the LOMC Clearinghouse, 847 South Pickett Street, Alexandria, VA 22304-4605. Additional Information about the NFIP is available on our website at http://www.fema.gov/nfip.
15-09-2666P 102-I-A-C
Patrick “Rick” F. Sacbibit, P.E., Branch Chief Engineering Services Branch Federal Insurance and Mitigation Administration

Case No.: Page 2 of 5 Effective Date: July 24, 2017 Issue Date: March 13, 2017 LOMR-APP15-09-2666P
Washington, D.C. 20472
Federal Emergency Management Agency
LETTER OF MAP REVISION DETERMINATION DOCUMENT (CONTINUED)
OTHER FLOODING SOURCES AFFECTED BY THIS REVISION
FLOODING SOURCES AND REVISED REACHES
Soledad Canyon - From approximately 640 feet upstream of Interstate Highway 5 / Sorrento Valley Boulevard to the divergence from Carroll Canyon Creek.
SUMMARY OF REVISIONS
Flooding Source Effective Flooding Revised Flooding Increases Decreases
Soledad Canyon Zone AE Zone AE YES YES Floodway Floodway YES YES BFEs * BFEs YES YES Zone X (shaded) Zone X (shaded) YES YES
* BFEs - Base Flood Elevations
This determination is based on the flood data presently available. The enclosed documents provide additional information regarding this determination. If you have any questions about this document, please contact the FEMA Map Information eXchange toll free at 1-877-336-2627 (1-877-FEMA MAP) or by letter addressed to the LOMC Clearinghouse, 847 South Pickett Street, Alexandria, VA 22304-4605. Additional Information about the NFIP is available on our website at http://www.fema.gov/nfip.
15-09-2666P 102-I-A-C
Patrick “Rick” F. Sacbibit, P.E., Branch Chief Engineering Services Branch Federal Insurance and Mitigation Administration

Case No.: Page 3 of 5 Effective Date: July 24, 2017 Issue Date: March 13, 2017 LOMR-APP15-09-2666P
Washington, D.C. 20472
Federal Emergency Management Agency
LETTER OF MAP REVISION DETERMINATION DOCUMENT (CONTINUED)
COMMUNITY INFORMATION
APPLICABLE NFIP REGULATIONS/COMMUNITY OBLIGATION
We have made this determination pursuant to Section 206 of the Flood Disaster Protection Act of 1973 (P.L. 93-234) and in accordance with the National Flood Insurance Act of 1968, as amended (Title XIII of the Housing and Urban Development Act of 1968, P.L. 90-448), 42 U.S.C. 4001-4128, and 44 CFR Part 65. Pursuant to Section 1361 of the National Flood Insurance Act of 1968, as amended, communities participating in the NFIP are required to adopt and enforce floodplain management regulations that meet or exceed NFIP criteria. These criteria, including adoption of the FIS report and FIRM, and the modifications made by this LOMR, are the minimum requirements for continued NFIP participation and do not supersede more stringent State/Commonwealth or local requirements to which the regulations apply.
We provide the floodway designation to your community as a tool to regulate floodplain development. Therefore, the floodway revision we have described in this letter, while acceptable to us, must also be acceptable to your community and adopted by appropriate community action, as specified in Paragraph 60.3(d) of the NFIP regulations.
COMMUNITY REMINDERS
We based this determination on the 1-percent-annual-chance flood discharges computed in the FIS for your community without considering subsequent changes in watershed characteristics that could increase flood discharges. Future development of projects upstream could cause increased flood discharges, which could cause increased flood hazards. A comprehensive restudy of your community’s flood hazards would consider the cumulative effects of development on flood discharges subsequent to the publication of the FIS report for your community and could, therefore, establish greater flood hazards in this area.
Your community must regulate all proposed floodplain development and ensure that permits required by Federal and/or State/Commonwealth law have been obtained. State/Commonwealth or community officials, based on knowledge of local conditions and in the interest of safety, may set higher standards for construction or may limit development in floodplain areas. If your State/Commonwealth or community has adopted more restrictive or comprehensive floodplain management criteria, those criteria take precedence over the minimum NFIP requirements.
We will not print and distribute this LOMR to primary users, such as local insurance agents or mortgage lenders; instead, the community will serve as a repository for the new data. We encourage you to disseminate the information in this LOMR by preparing a news release for publication in your community's newspaper that describes the revision and explains how your community will provide the data and help interpret the NFIP maps. In that way, interested persons, such as property owners, insurance agents, and mortgage lenders, can benefit from the information.
This revision has met our criteria for removing an area from the 1-percent-annual-chance floodplain to reflect the placement of fill. However, we encourage you to require that the lowest adjacent grade and lowest floor (including basement) of any structure placed within the subject area be elevated to or above the Base (1-percent-annual-chance) Flood Elevation.
This LOMR follows identification of a potential violation of NFIP regulations under Case No. 15-09-2666P that will be resolved by the FEMA Regional Office and community officials.
This determination is based on the flood data presently available. The enclosed documents provide additional information regarding this determination. If you have any questions about this document, please contact the FEMA Map Information eXchange toll free at 1-877-336-2627 (1-877-FEMA MAP) or by letter addressed to the LOMC Clearinghouse, 847 South Pickett Street, Alexandria, VA 22304-4605. Additional Information about the NFIP is available on our website at http://www.fema.gov/nfip.
15-09-2666P 102-I-A-C
Patrick “Rick” F. Sacbibit, P.E., Branch Chief Engineering Services Branch Federal Insurance and Mitigation Administration

Case No.: Page 4 of 5 Effective Date: July 24, 2017 Issue Date: March 13, 2017 LOMR-APP15-09-2666P
Washington, D.C. 20472
Federal Emergency Management Agency
LETTER OF MAP REVISION DETERMINATION DOCUMENT (CONTINUED)
We have designated a Consultation Coordination Officer (CCO) to assist your community. The CCO will be the primary liaison between your community and FEMA. For information regarding your CCO, please contact:
Mr. Jeffrey D. Lusk Director, Mitigation Division
Federal Emergency Management Agency, Region IX 1111 Broadway Street, Suite 1200
Oakland, CA 94607-4052 (510) 627-7175
STATUS OF THE COMMUNITY NFIP MAPS
We will not physically revise and republish the FIRM and FIS report for your community to reflect the modifications made by this LOMR at this time. When changes to the previously cited FIRM panel(s) and FIS report warrant physical revision and republication in the future, we will incorporate the modifications made by this LOMR at that time.
This determination is based on the flood data presently available. The enclosed documents provide additional information regarding this determination. If you have any questions about this document, please contact the FEMA Map Information eXchange toll free at 1-877-336-2627 (1-877-FEMA MAP) or by letter addressed to the LOMC Clearinghouse, 847 South Pickett Street, Alexandria, VA 22304-4605. Additional Information about the NFIP is available on our website at http://www.fema.gov/nfip.
15-09-2666P 102-I-A-C
Patrick “Rick” F. Sacbibit, P.E., Branch Chief Engineering Services Branch Federal Insurance and Mitigation Administration

Case No.: Page 5 of 5 Effective Date: July 24, 2017 Issue Date: March 13, 2017 LOMR-APP15-09-2666P
Washington, D.C. 20472
Federal Emergency Management Agency
LETTER OF MAP REVISION DETERMINATION DOCUMENT (CONTINUED)
PUBLIC NOTIFICATION OF REVISION
A notice of changes will be published in the Federal Register. This information also will be published in your local newspaper on or about the dates listed below, and through FEMA’s Flood Hazard Mapping website at https://www.floodmaps.fema.gov/fhm/bfe_status/bfe_main.asp
LOCAL NEWSPAPER Name: The San Diego Daily Transcript Dates: March 17, 2017 and March 24, 2017
Within 90 days of the second publication in the local newspaper, any interested party may request that we reconsider this determination. Any request for reconsideration must be based on scientific or technical data. Therefore, this letter will be effective only after the 90-day appeal period has elapsed and we have resolved any appeals that we receive during this appeal period. Until this LOMR is effective, the revised flood hazard determination presented in this LOMR may be changed.
This determination is based on the flood data presently available. The enclosed documents provide additional information regarding this determination. If you have any questions about this document, please contact the FEMA Map Information eXchange toll free at 1-877-336-2627 (1-877-FEMA MAP) or by letter addressed to the LOMC Clearinghouse, 847 South Pickett Street, Alexandria, VA 22304-4605. Additional Information about the NFIP is available on our website at http://www.fema.gov/nfip.
15-09-2666P 102-I-A-C
Patrick “Rick” F. Sacbibit, P.E., Branch Chief Engineering Services Branch Federal Insurance and Mitigation Administration

DISTANCE1 WIDTH (FEET)
SECTIONAREA
(SQUAREFEET)
MEANVELOCITY(FEET PER SECOND)
REGULATORYWITHOUT
FLOODWAYWITH
FLOODWAYINCREASE
0 136 979 6.8 63.2 63.2 63.3 0.121 136 994 6.74 63.3 63.3 63.4 0.1
348 180 655 10.2 65.4 65.4 65.5 0.11,012 275 1,286 5.2 72.0 72.0 72.0 0.01,303 170 1,085 6.2 73.0 73.0 73.0 0.01,517 98 560 13.0 74.5 74.5 74.5 0.01,787 270 874 7.7 80.1 80.1 80.3 0.21,927 263 1,533 4.4 81.6 81.6 81.6 0.02,067 259 1,674 4.0 81.8 81.8 81.8 0.02,122 220 1,370 4.9 81.8 81.8 81.8 0.02,242 195 1,091 6.1 81.9 81.9 82.0 0.12,292 210 1,092 6.1 82.0 82.0 82.2 0.22,462 370 1,654 4.1 82.7 82.7 83.0 0.32,602 121 595 11.3 84.7 84.7 85.1 0.42,630 126 702 9.5 86.8 86.8 87.3 0.52,657 175 1,111 6.0 88.1 88.1 88.6 0.52,912 147 887 7.6 88.3 88.3 88.9 0.63,062 106 644 10.4 88.3 88.3 88.9 0.63,089 137 965 6.9 88.3 88.3 88.9 0.63,356 112 850 7.9 89.6 89.6 90.2 0.63,543 140 566 11.8 92.2 92.2 92.2 0.03,587 150 917 7.3 93.0 93.0 93.8 0.83,772 95 503 13.3 97.3 97.3 97.3 0.04,015 124 963 7.0 99.0 99.0 100.0 1.04,258 112 814 8.2 99.9 99.9 100.7 0.84,489 118 943 5.9 101.4 101.4 101.8 0.4
1 Feet Above Downstream Face of Atchison, Topeka & Santa Fe Railway Bridge
TA
BL
E 1
3
FEDERAL EMERGENCY MANAGEMENT AGENCY
SAN DIEGO COUNTY, CAAND INCORPORATED AREAS
FLOODWAY DATA
CARROLL CANYON CREEK
STUVWXYZ
R
GHIJKLMNOPQ
F
FLOODING SOURCE FLOODWAY1-PERCENT-ANNUAL-CHANCE FLOOD
WATER SURFACE ELEVATION (FEET NAVD 88)
CROSS SECTION
Carroll CanyonCreek
ABCDE
REVISEDDATA
makh6790
Polygonal Line
makh6790
Line
DABD6542
LOMR Effective
DABD6542
Text Box
July 24, 2017

DISTANCE1 WIDTH (FEET)
SECTIONAREA
(SQUAREFEET)
MEANVELOCITY(FEET PER SECOND)
REGULATORYWITHOUT
FLOODWAYWITH
FLOODWAYINCREASE
4,720 74 422 13.3 102.0 102.0 103.0 1.05,204 235 919 6.1 107.8 107.8 108.8 1.05,908 125 518 10.8 113.0 113.0 113.0 0.06,579 266 795 7.0 119.4 119.4 120.0 0.67,138 235 607 9.2 126.3 126.3 126.3 0.08,018 251 850 6.6 133.2 133.2 134.1 0.98,872 119 485 11.5 142.4 142.4 142.4 0.09,162 107 599 9.4 144.8 144.8 145.1 0.39,191 139 578 9.7 145.6 145.6 146.1 0.59,622 213 624 8.6 148.3 148.3 149.3 1.09,857 239 629 8.9 151.7 151.7 152.0 0.39,932 239 652 8.6 152.3 152.3 152.3 0.0
10,602 101 451 10.0 158.9 158.9 159.9 1.011,055 120 465 9.7 165.3 165.3 165.9 0.611,635 72 356 12.6 171.3 171.3 171.3 0.011,994 189 690 6.5 175.0 175.0 175.8 0.812,654 104 423 10.6 179.8 179.8 180.8 1.013,050 160 684 6.6 183.8 183.8 184.8 1.013,723 104 409 11.0 189.2 189.2 189.5 0.314,416 265 792 5.6 194.7 194.7 195.7 1.014,696 200 533 9.5 199.9 199.9 199.9 0.015,368 33 232 15.0 205.4 205.4 206.4 1.015,947 100 578 6.9 211.4 211.4 212.3 0.915,997 61 289 12.6 211.5 211.5 212.5 1.016,377 52 283 14.0 215.3 215.3 215.5 0.217,035 68 307 13.2 222.2 222.2 222.8 0.6
1 Feet Above Downstream Face of Atchison, Topeka & Santa Fe Railway Bridge
TA
BL
E 1
3
FEDERAL EMERGENCY MANAGEMENT AGENCY
SAN DIEGO COUNTY, CAAND INCORPORATED AREAS
FLOODWAY DATA
CARROLL CANYON CREEK
AUAV
AYAZ
AWAX
ASAT
AR
AGAHAIAJAKALAMANAOAPAQ
AF
FLOODING SOURCE FLOODWAY1-PERCENT-ANNUAL-CHANCE FLOOD
WATER SURFACE ELEVATION (FEET NAVD 88)
CROSS SECTION
Carroll CanyonCreek (cont 'd)
AAABACADAE
REVISEDDATA
makh6790
Rectangle
makh6790
Line
DABD6542
Text Box
July 24, 2017
DABD6542
LOMR Effective

DISTANCE1 WIDTH (FEET)
SECTIONAREA
(SQUAREFEET)
MEANVELOCITY(FEET PER SECOND)
REGULATORYWITHOUT
FLOODWAYWITH
FLOODWAYINCREASE
17,450 46 269 15.4 228.1 228.1 228.1 0.017,700 39 245 14.3 230.9 230.9 231.2 0.317,878 38 245 14.6 233.1 233.1 233.4 0.318,117 46 300 12.4 235.5 235.5 236.2 0.718,267 29 222 15.7 238.2 238.2 238.8 0.618,359 100 891 6.2 251.1 251.1 251.1 0.018,790 72 558 6.3 251.4 251.4 251.4 0.019,182 160 759 4.8 252.4 252.4 252.5 0.119,541 162 552 6.3 252.6 252.6 253.2 0.619,849 144 564 6.2 254.3 254.3 254.5 0.220,029 229 1,064 3.3 255.2 255.2 255.3 0.120,275 142 510 6.9 255.4 255.4 255.5 0.120,440 248 453 7.7 258.7 258.7 258.7 0.020,986 169 831 4.2 261.1 261.1 261.5 0.421,389 125 359 9.7 263.2 263.2 263.6 0.422,144 121 512 6.8 273.7 273.7 274.7 1.022,734 89 348 10.1 280.4 280.4 281.2 0.823,295 121 443 7.9 289.0 289.0 290.0 1.024,012 62 305 11.5 306.3 306.3 306.3 0.024,552 100 444 7.9 313.5 313.5 314.2 0.725,002 69 490 7.1 323.3 323.3 324.3 1.025,707 72 511 6.9 327.9 327.9 328.9 1.026,142 42 272 12.9 332.9 332.9 332.9 0.026,308 38 324 10.8 335.9 335.9 336.1 0.226,628 35 521 6.8 345.5 345.5 345.5 0.026,936 236 1,123 3.1 345.7 345.7 346.4 0.7
1 Feet Above Downstream Face of Atchison, Topeka & Santa Fe Railway Bridge
BNBOBP
TA
BL
E 1
3
FEDERAL EMERGENCY MANAGEMENT AGENCY
SAN DIEGO COUNTY, CAAND INCORPORATED AREAS
FLOODWAY DATA
CARROLL CANYON CREEK
BSBTBUBVBW
BZ
BXBY
BRBQ
BF
FLOODING SOURCE FLOODWAY
BBBCBDBE
BGBHBIBJBKBLBM
1-PERCENT-ANNUAL-CHANCE FLOODWATER SURFACE ELEVATION (FEET NAVD 88)
CROSS SECTION
Carroll CanyonCreek (cont 'd)
BA
REVISEDDATA
makh6790
Rectangle
makh6790
Line
DABD6542
Text Box
July 24, 2017
DABD6542
LOMR Effective

DISTANCE1 WIDTH (FEET)
SECTIONAREA
(SQUAREFEET)
MEANVELOCITY(FEET PER SECOND)
REGULATORYWITHOUT
FLOODWAYWITH
FLOODWAYINCREASE
15,900 450 1,947 3.5 36.1 36.1 37.1 1.016,242 374 2,007 3.8 36.6 36.6 37.6 1.016,629 474 2,174 3.1 37.3 37.3 38.2 0.916,897 432 2,068 3.2 37.7 37.7 38.5 0.817,216 286 948 7.1 37.7 37.7 38.2 0.517,524 444 1,694 4.0 38.7 38.7 39.2 0.517,711 350 565 11.9 38.8 38.8 38.8 0.018,151 370 1,767 3.8 41.7 41.7 41.7 0.018,267 91 502 13.3 41.8 41.8 41.8 0.018,437 103 621 10.8 41.8 41.8 41.8 0.018,954 105 524 12.8 43.0 43.0 43.0 0.019,282 110 538 12.5 44.6 44.6 44.6 0.019,520 107 528 12.7 46.6 46.6 46.6 0.019,740 86 527 12.7 48.5 48.5 48.5 0.020,332 117 843 8.0 53.8 53.8 54.2 0.420,958 149 612 11.0 56.2 56.2 56.2 0.021,362 240 1,074 6.2 60.2 60.2 60.2 0.021,592 269 1,227 5.5 61.5 61.5 61.5 0.021,845 265 1,385 4.8 62.5 62.5 62.5 0.021,879 242 1,307 5.1 62.6 62.6 62.6 0.0
1 Feet Above North Torrey Pines Road
AF
FLOODING SOURCE FLOODWAY1-PERCENT-ANNUAL-CHANCE FLOOD
WATER SURFACE ELEVATION (FEET NAVD 88)
CROSS SECTION
Soledad Canyon (cont 'd)
AAABACADAE
AR
AGAHAIAJAKALAMANAOAPAQ
TA
BL
E 13
FEDERAL EMERGENCY MANAGEMENT AGENCY
SAN DIEGO COUNTY, CAAND INCORPORATED AREAS
FLOODWAY DATA
SOLEDAD CANYON
ASAT
REVISED DATA
REVISED BY LOMR EFFECTIVE DECEMBER 17, 2012
MAKH6790
Rectangle
MAKH6790
Line
makh6790
Rectangle
makh6790
Line
DABD6542
LOMR Effective
DABD6542
Text Box
July 24, 2017

DABD6542
LOMR Effective
DABD6542
Text Box
July 24, 2017

DABD6542
LOMR Effective
DABD6542
Text Box
July 24, 2017

DABD6542
LOMR Effective
DABD6542
Text Box
July 24, 2017
DABD6542
LOMR Effective
DABD6542
Text Box
July 24, 2017

DABD6542
LOMR Effective
DABD6542
Text Box
July 24, 2017

DABD6542
LOMR Effective
DABD6542
Text Box
July 24, 2017

1905000 FT.
,AP56.2
¦805
¦5
RAILROAD
Channel
CAMPUS POINT COURT
RAILROAD
RANCHO PUEBLO LANDSOF SAN DIEGO LAND GRANT
AREA REVISED BYLOMR EFFECTIVE
DECEMBER 17, 2012
REVISEDAREA
38
44
38
39
42
39 41
,AC,AE
,AF
,AO
,AN
,AJ
,AI
,AG
,AM,AL
,AK
,AH,B ,C
,D
,AD
Channel
SoledadCanyon
ProfileBaseline
City ofSan Diego
060295
ZONE AESORRENTO
VALLEYBOULEVARD
ARBUTUS
STREET
TANSY
STREET
CAMPUS
POINTCOURT
CAMP
USPO
INT DR
IVE
ROSELLE
STREET
ROSELLESTREET
VISTA
SORRENTO
PARKWAY
BEGONIA
STREETSORRENTO
VALLEY ROAD
SCIEN
CECENTER
DRIVE
53.8
48.5
41.8
43.0
46.6
44.6
SPECIAL FLOODHAZARD AREAS
OTHER AREAS OFFLOOD HAZARD
Without Base Flood Elevation (BFE)With BFE or DepthRegulatory Floodway
Zone A,V, A99Zone AE, AO, AH, VE, AR
0.2% Annual Chance Flood Hazard, Areas of 1% annual chance flood with average depth less than one foot or with drainage areas of less than one square mileFuture Conditions 1% Annual Chance Flood HazardArea with Reduced Flood Risk due to LeveeSee Notes.
Zone X
Zone X
Zone X
SCALE
0 500 1,000250Feet
1 inch = 500 feet 1:6,000
Map Projection:NAD 1983 UTM Zone 11N;Western Hemisphere; Vertical Datum: NAVD 88
0 150 30075Meters
NATIONAL FLOOD INSURANCE PROGRAMFLOOD INSURANCE RATE MAPSAN DIEGO COUNTY, CALIFORNIAand Incorporated Areas
PANEL 1338 OF 2375Panel Contains:COMMUNITY NUMBER PANEL SUFFIX
MAP NUMBER
EFFECTIVE DATEMAY 16, 2012
06073C1338G
VERSION NUMBER
SAN DIEGO, CITY OF 060295 1338 G
JOIN
S PAN
EL 13
39
NOTE: MAP AREA SHOWN ON THIS PANEL ISLOCATED WITHIN RANCHO PUEBLO LANDSOF SAN DIEGO LAND GRANT.
,EFLOODING EFFECTS FROMLOS PENASQUITOS CREEK
1.1.1.0
SORRENTOVALLEY ROAD
DABD6542
LOMR Effective
DABD6542
Text Box
July 24, 2017

3640000mN .
3639000mN .
E
,AO
,AP
,AQ
,AR
,AS
,B
,A
,C ,D
,F,E
ZONE AE
,G ,H
,I
,J
,K
,L
,M,N
,O
,P
,Q
,R,S
RAILROAD
,AN
,AM
¦805
¦805
NOTE: MAP AREA SHOWN ON THIS PANEL IS LOCATEDWITHIN TOWNSHIP 14 SOUTH, RANGE 3 WEST,TOWNSHIP 15 SOUTH, RANGE 3 WEST AND THERANCHO LOS PENASQUITOS LAND GRANT AND THERANCHO PUEBLO LANDS OF SAN DIEGO LAND GRANTAND THE MISSION RANCHO SAN DIEGO LAND GRANT.
LAND GRANT BOUNDARY
53.8
,AT
RAILROAD
,E
City ofSan Diego
060295
RANCHO PUEBLO LANDSOF SAN DIEGO LAND GRANT
AREA REVISED BYLOMR EFFECTIVE
DECEMBER 17, 2012
REVISEDAREA
8988
80
8885
81
8382
Channel
SoledadCanyon
Carroll Canyon Creek
VISTASORRENTOPARKWAY
SORRENTO
VALLEY ROADROSELLE
STREET SORRENTOVALLEYROAD
HEADQUARTERSPOINT
TELESIS COURT
WATERIDGE
CIRCLE
LUSK BOULEVARD
WATERIDGE CIRCLE
DIRECTORS PLACEVISTA SORRENTO PARKWAY
LUSK BOULEVARD
PRIVATEROAD
5
City ofSan Diego
060295
ZONE AE
ProfileBaseline
72.0
74.5
56.2
73.0
53.8
63.2
60.2
63.3
65.4
62.561.
5
62.6
JOIN
S PAN
EL 13
38SPECIAL FLOODHAZARD AREAS
OTHER AREAS OFFLOOD HAZARD
Without Base Flood Elevation (BFE)With BFE or DepthRegulatory Floodway
Zone A,V, A99Zone AE, AO, AH, VE, AR
0.2% Annual Chance Flood Hazard, Areas of 1% annual chance flood with average depth less than one foot or with drainage areas of less than one square mileFuture Conditions 1% Annual Chance Flood HazardArea with Reduced Flood Risk due to LeveeSee Notes.
Zone X
Zone X
Zone X
SCALE
0 500 1,000250Feet
1 inch = 500 feet 1:6,000
Map Projection:NAD 1983 UTM Zone 11N;Western Hemisphere; Vertical Datum: NAVD 88
0 150 30075Meters
NATIONAL FLOOD INSURANCE PROGRAMFLOOD INSURANCE RATE MAPSAN DIEGO COUNTY, CALIFORNIAand Incorporated Areas
PANEL 1339 OF 2375Panel Contains:COMMUNITY NUMBER PANEL SUFFIX
MAP NUMBER
EFFECTIVE DATEMAY 16, 2012
06073C1339G
VERSION NUMBER
SAN DIEGO, CITY OF 060295 1339 G
46.6
48.5
1.1.1.0
DABD6542
LOMR Effective
DABD6542
Text Box
July 24, 2017