Warwickshire County Council and
29
1
Transcript of Warwickshire County Council and
1

2
Disclaimer This report has been prepared by the Warwickshire Observatory, Warwickshire County Council, with all reasonable skill, care, and diligence. We accept no responsibility of whatsoever nature to any third parties to whom this report, or any part thereof, is made known. Any such party relies on the report at their own risk. Copyright Statement The copyright for this publication rests with Warwickshire County Council. This publication may be downloaded from the Warwickshire County Council and Observatory websites free of charge and may be used for research, private study or for internal circulation within an organisation. The report includes Crown copyright and OS copyright information, used with permission. Any material that is reproduced from this report must be quoted accurately and not used in a misleading context. The copyright must be acknowledged and the title of the publication specified. Publication date: July 2011
Author: Louise Boffey, Kate McGrory Telephone: 01926 418066 / 412775 Email: [email protected]

3
Contents Page
Introduction 4
Key Findings 5
Warwickshire Localities Map 6
Stratford District Super Output Area Map 7/8
Under 18 year old conceptions 20
Youth and Community Services
Population - 13 – 19 year olds 9 Population - Asian 10 – 19 year olds 10
Population - Black/Minority Ethnic 10 – 19 year olds 11
Education - Secondary Schools receiving Free School Meals 12 Education – Pupils not achieving Five or more GCSE’s at Grade A* to C 13 Education – Pupils not achieving Five or more GCSE’s at Grade A* to G 14 Education – Pupils recording at least one session of 15 unauthorised absence Mothers aged under 20 years 16
Youth Service Membership 17 - 18 Young Offenders 19 Integrated Youth Support Service
Alcohol and drug attributable admissions 21 First time entrants to Youth Justice System 22 Participation of Positive Activities 22 School leavers not in employment, education or training (NEET) 23 Composite Indicator 24- 28 District / Borough Performance across all indicators 29

4
Introduction The following report relating to Youth Service Needs comprises a series of maps, tables and commentary on a variety of topics relevant to young people in the South Area. This report can in the main, be compared with the 2010 report. However, some new sections have been added at the request of the Integrated Youth Support Service. The data is presented in a number of ways, i.e. numbers, percentage and rate. This enables more accurate comparison to be made between geographical areas. As well as locality maps, some of the topics included in this report are available at both ward and Super Output Area level. This detail is provided within the relevant section. Each map is accompanied by a table highlighting the top ten wards and/or top ten super output areas of greatest concern.

5
Warwickshire Key Findings • The total number of Asian 10 to 19 year olds living within
Warwickshire is 2,319. 41% live within Warwick District. • The total number of black/minority ethnic 10 to 19 year olds
living within Warwickshire is approximately 5,000. 37% live within Warwick District.
• 2,514 students attending secondary school are claiming free school meals representing almost 8.2% of the total number of pupils. Brunswick and Wembrook wards have the highest numbers of free school meal claimants.
• Eight of the ten wards with the highest number of pupils not achieving five GCSE’s at grades A*-C are in Nuneaton & Bedworth Borough. 31% of pupils not achieving five or more A*-C grades live in Nuneaton & Bedworth Borough.
• There were approximately 298 pupils who did not achieve five or more GCSE grades A*- G in the County. The highest percentage live within Kingswood ward.
• There were 8,086 pupils who recorded at least one session of unauthorised absence during 2009/10. Nuneaton & Bedworth pupils account for 36% of all pupils recording unauthorised absence; North Warwickshire Borough and Warwick District pupils account for 12% of the total each.
• In March 2009, there were 334 young mothers under the age of twenty recorded in Warwickshire. Just over 46% of the total are living in Nuneaton & Bedworth Borough; Wem Brook and Camp Hill wards are the wards with the highest numbers.
• There are over 14,280 young people living in the County who have accessed youth service provision. The highest proportion accessing youth services live in Camp Hill ward (Nuneaton and Bedworth Borough) which has nearly 50%
more young people accessing services than the second highest ward in the County (Crown ward, Warwick District).
• The number of young offenders living in Warwickshire in 2010 was 1,312. Of these, 34% live in the Nuneaton and Bedworth borough, 21% in the Rugby Borough, 18% in the Stratford District, 16% in the Warwick District and 11% in the North Warwickshire Borough.
• Nuneaton and Bedworth Borough features in five out of the ten highest wards for under 18 conceptions. There are a total of 1,103 under 18 conceptions in Warwickshire, a rate of 36.7 conceptions per 1,000 females aged between 15-17 year olds for the period 2006-08.
• A national indicator has been established to record the number of first time entrants to the Youth Justice System (NI 111) and the number of Warwickshire entrants reduced by 24.5% since 2009/10.
• A national indicator was established to record ‘young people’s participation in positive activities’ (NI 110) and between 2008/09 and 2009/10 there was a slight reduction in the number of school pupils that were participating in positive activities, 69.9% in 2008/9 to 68.5% in 2009/10.
• At 31st November 2010, there were 918 young people in Warwickshire recorded as NEET. Of this total, over 32% live in Nuneaton & Bedworth Borough. Atherstone Central Ward has the highest number recorded.
• North Warwickshire and Nuneaton & Bedworth have the highest rate of alcohol related admissions. Warwick District has the lowest rate. The rate for the County peaks at age 16.
• Rugby Borough has the highest rate of drug related hospital admissions.

6
Warwickshire Localities Map The following map showing the locality boundaries can be used when viewing the maps in the individual sections. Please use this as a point of reference for the report.
North Warwickshire Borough1 North2 East3 South4 West
1
24
Nuneaton & Bedworth Borough5 Weddington & St. Nicolas6 Camp Hill & Galley Common7 Abbey & Wembrook8 Arbury & Stockingford9 Whitestone & Bulkington10 Bede & Poplar11 Bedworth North & West
5678
3 91011Rugby Borough
12 Rural13 Brownsover, Benn & Newbold14 Eastlands & Hillmorton15 Town - West
12
131415
Stratford District Warwick District
16
16 Kenilworth17 Warwick Rural18 North Leamington19 South Leamington & Whitnash20 Warwick
1718
20
21 Southam, Wellesbourne & Kineton22 Stratford & Shipston23 Alcester, Studley & Henley
1923
21
22
© Crown Copyright and database right 2011. Ordnance Survey 100019520
7
ict. These should be used as a point of reference for the report.
an approximate population of between 1,000 – 2,000 people.
e Clearer versions are
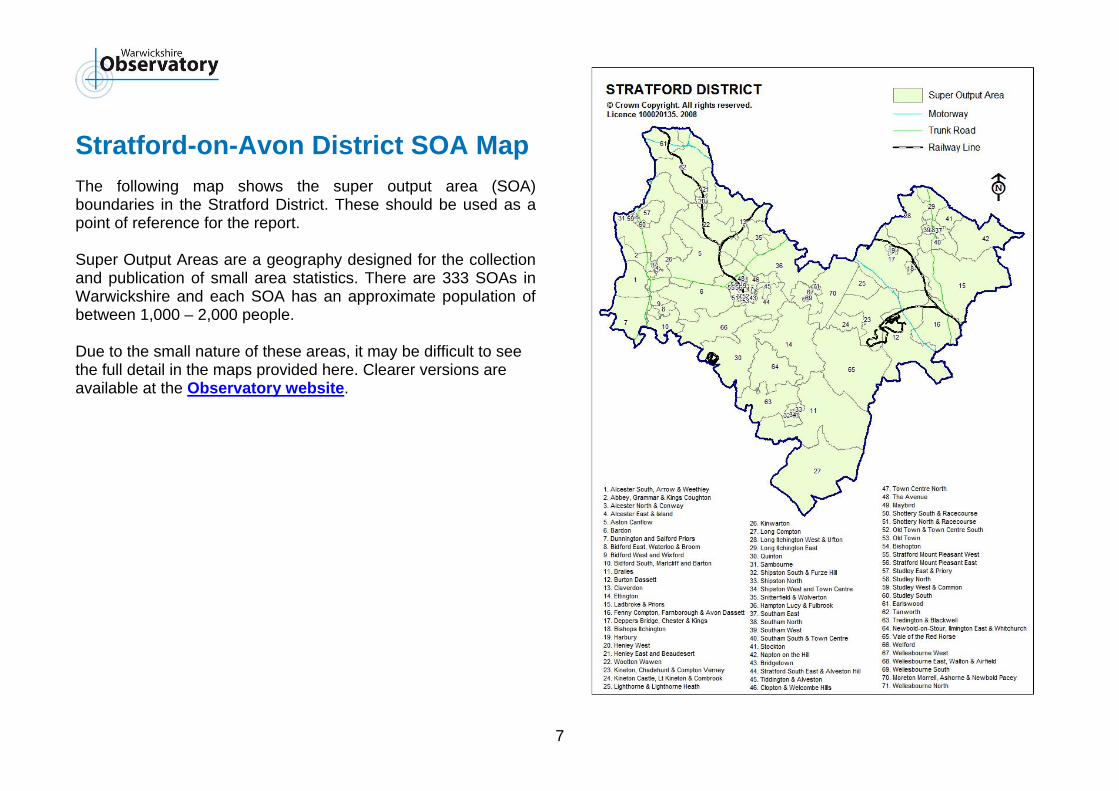
vailable at the Observatory website
Stratford-on-Avon District SOA Map The following map shows the super output area (SOA) boundaries in the Stratford Distr
Super Output Areas are a geography designed for the collection and publication of small area statistics. There are 333 SOAs in Warwickshire and each SOA has
Due to the small nature of these areas, it may be difficult to sethe full detail in the maps provided here.a .
Warwick District SOA Map

8
Warwick District SOA Map The following map shows the super output area (SOA) boundaries in the Warwick District. These should be used as a
oint of reference for the report. p Super Output Areas are a geography designed for the collection and publication of small area statistics. There are 333 SOAs in Warwickshire and each SOA has an approximate population of etween 1,000 – 2,000 people. b
Due to the small nature of these areas, it may be difficult to see the full detail in the maps provided here. Clearer versions are vailable at the Observatory websitea .

9
YOUTH & COMMUNITY SERVICES Population – Number of 13 to 19 Year Olds in the South Area By Super Output Area
SOA SOA Name District / Borough
No. of People Percentage
E01031265
Brunswick North West & Foundry
Warwick 194 11.9%
E01031308
Stoneleigh Warwick 370 11.8%
E01031287
Manor North Warwick 183 11.3%
E01031273
Lillington East
Warwick 153 11.1%
E01031252
Moreton Morrell, Ashorne & Newbold Pacey
Stratford-on-Avon
144 11.0%
E01031317
Bridge End, Castle & Stratford Rd East
Warwick 167 10.8%
E01031327
Whitnash North
Warwick 170 10.7%
E01031184
Abbey, Grammar & Kings Coughton
Stratford-on-Avon
157 10.7%
E01031185
Alcester North & Conway
Stratford-on-Avon
151 10.6%
E01031219
Southam East
Stratford-on-Avon
160 10.4%
Source: Mid-2009 SOA Population Estima fice for National Statistics tes, Of

10
Population – Number of Asian 10 to 19 Year Olds in the South Area By Ward
Top 10 Wards District / Borough
No. of Asian 10 – 19 yr olds
Percentage of Total Asian
10 – 19 yr olds in the
Area Willes Warwick 167 16.9% Whitnash Warwick 158 16.0% Brunswick Warwick 150 15.2% Warwick South Warwick 108 10.9% Warwick North Warwick 70 7.1%
Manor Warwick 59 6.0%
Stoneleigh Warwick 47 4.8%
Milverton Warwick 35 3.5%
Crown Warwick 26 2.6%
Cubbington Warwick 26 2.6% Source: Census 2001, ONS Crown Copyright • The total number of Asian 10 to 19 year olds living within the
Stratford District is 45. • 60% live within the top four wards shown on the table above.

11
Population – Number of Black/Minority Ethnic 10 to 19 Year Olds in the South Area By Ward
Top 10 Wards
District / Borough
No. of BME 10 – 19 yr
olds
Percentage of Total
BME 10 – 19 yr olds
in the South Area
Willes Warwick 256 11.0% Brunswick Warwick 244 10.5% Whitnash Warwick 183 7.9% Warwick South Warwick 179 7.7% Manor Warwick 125 5.4%
Warwick North Warwick 123 5.3%
Stoneleigh Warwick 114 4.9%
Crown Warwick 96 4.1%
Warwick West Warwick 75 3.2%
Milverton Warwick 74 3.2% Source: Census 2001, ONS Crown Copyright • The total number of Black/Minority Ethnic 10 to 19 year olds
living within the South Area is 2,328. • 37% live within the top four wards shown on the table above.

12
Education – Secondary School Pupils receiving Free School Meals in the South Area By Super Output Area (SOA)
Top 10 SOAs SOA Names District /
Borough
No. of Secondary
Pupils eligible for
FSM
Percentage of Total Pupils
E01031261 Brunswick South West & Kingsway Warwick 27 31%
E01031264 Brunswick South East Warwick 43 31%
E01031265 Brunswick North West & Foundry Warwick 27 27%
E01031273 Lillington East Warwick 18 23% E01031332 Lillington East Warwick 21 22%
E01031321 Packmores West & The Cape Warwick 18 22%
E01031322 The Cape & Wedgenock Warwick 19 22%
E01031231 Maybird Stratford-on-Avon 21 18%
E01031207 Lighthorne & Lighthorne Heath
Stratford-on-Avon 14 18%
E01031266 Old Town West & Railway Bridge Warwick 7 18%
Source: CSS, Chil g People and Families Directorate dren, Youn
• Families who have children up to 19 years in full time education are entitled to claim free school meals providing they are in receipt of a qualifying benefit e.g. Income Support, income based Job Seekers Allowance or receiving Child Tax Credits with an income not in
excess of £16,190. This is therefore a good indicator of the social backgrounds of students. • Two thousand five hundred and fifty two students attending secondary school are claiming free school meals, representing 3. 3% of the total number of pupils.

13
Education – Pupils not achieving 5 or more GCSEs at Grades A*- C in the South Area By Super Output Area (SOA)
Top 10 SOAs SOA Names District /
Borough
No. of Pupils
not achieving 5+ A*-C grades
Percentage of Pupils
E01031265 Brunswick North West & Foundry Warwick 11 68.8%
E01031276 Lillington South Warwick 15 68.2% E01031273 Lillington East Warwick 13 61.9%
E01031202 Henley West Stratford-on-Avon 3 60.0%
E01031257 Abbey East Warwick 14 53.8%
E01031261 Brunswick South West & Kingsway Warwick 8 53.3%
E01031291 Milverton South East Warwick 1 50.0%
E01031185 Alcester North & Conway
Stratford-on-Avon 9 47.4%
E01031249 Wellesbourne West Stratford-on-Avon 7 46.7%
E01031231 Maybird Stratford-on-Avon 12 44.4%
Source: CSS, Children, Young Pe d Families Directorate ople an • A total of 22.1% of pupils in the South Area did not achieve 5
or more A*-C passes at GCSE.

14
Education – Pupils not achieving 5 GCSEs at Grades A* - G in Warwickshire By Ward
Top 10 Wards District / Borough
No. of Pupils not achieving
5+ A*-G grades
Percentage of Pupils
Sambourne Stratford-on-Avon 2 15.4% Stratford Avenue & New Town Stratford-on-Avon 10 14.7%
Crown Warwick 10 13.0% Wellesbourne Stratford-on-Avon 8 12.7% Kineton Stratford-on-Avon 6 12.2%
Budbrooke Warwick 6 12.2%
Brunswick Warwick 11 11.3%
Quinton Stratford-on-Avon 2 11.1%
Abbey Warwick 8 10.8% Vale of the Red Horse Stratford-on-Avon 2 10.5%
Source: CSS, Children, Young People and Families Directorate The numbers of pupils not achieving GCSE’s at grades A*-G are relatively small and therefore the data can only be published at ward level. • There were approximately 136 pupils who did not achieve
five or more GCSE grades A*- G in the South Area. • The highest numbers live within Sambourne ward.

15
Education – Pupils recording at least one session of Unauthorised Absence in the South Area Pupils recording at least one session of unauthorised absence, academic year 2008-09, by SOA
Top 10 SOAs SOA Names District /
Borough
No. of Pupils recording at least 1 unauthorised absence*
Percentage of pupils
E01031230 The Avenue Stratford-on-Avon 78 63.9%
E01031236 Bishopton Stratford-on-Avon 67 62.05
E01031231 Maybird Stratford-on-Avon 62 62.0%
E01031238 Stratford Mount Pleasant East
Stratford-on-Avon 32 57.1%
E01031217 Snitterfield & Wolverton
Stratford-on-Avon 29 53.7%
E01031186 Alcester East & Island
Stratford-on-Avon 59 53.6%
E01031183 Alcester South, Arrow & Weethley
Stratford-on-Avon 41 53.2%
E01031227 Tiddington & Alveston
Stratford-on-Avon 46 51.1%
E01031237 Stratford Mount Pleasant West
Stratford-on-Avon 41 50.6%
E01031234 Old Town & Town Centre South
Stratford-on-Avon 27 49.1%
Source: CSS, Children, Young People and Families Directorate * one half day
• A total of 2,967 pupils recorded at least one session of
unauthorised absence during 2009/10.

16
Mothers aged under 20 Years Teenage mothers under 20 in the South Area, 2010 by Ward
Top 10 Wards District / Borough
U20 Teenage Mothers
Brunswick Warwick 9 Warwick West Warwick 8 Willes Warwick 8 Alcester Stratford-on-Avon 5 Quinton Wawick 4
Crown Warwick 4
Milveton Warwick 4
Whitnash Warwick 4
Bardon Stratford-on-Avon 3 Bidford and Salford Stratford-on-Avon 3
Source: Connexions, Coventry and Warwickshire • In 2010, there were 84 young mothers aged 16-19 recorded
in the South Area. • Brunswick and Warwick West are the wards with the highest
numbers. • Nine out of the top ten wards are in Nuneaton and Bedworth
Borough.

17
Youth Service Membership Number of Youth Service Members at 31st March 2010, by SOA Top 10 SOAs SOA Names District /
Borough No. of
MembersE01031273 Lillington East Warwick 140 E01031247 Vale of the Red Horse Stratford 110 E01031276 Lillington South Warwick 102
E01031203 Henley East and Beaudesert Stratford 100
E01031274 Lillington West Warwick 98
E01031205 Kineton, Chadshunt & Compton Verney Stratford 96
E01031206 Kineton Castle, Lt. Kineton & Combrook Stratford 96
E01031249 Wellesbourne West Stratford 93
E01031253 Wellesbourne North Stratford 93
E01031216 Shipston West and Town Centre Stratford 92
Source: Youth Services, Warwickshire County Council Note: Only includes members that gave a postcode at the time of registration • There are over 6,000 young people living in Warwick and
Stratford-on-Avon Districts who have accessed youth service provision.
• The highest proportion of members live in Crown ward in Warwick District.
Number of Youth Service Members at 31st March 2010, by Ward
Top 10 Wards District / Borough
No. of Members
Crown Warwick 369 Wellesbourne Stratford 326 Brunswick Warwick 271 Kineton Stratford 261 Warwick South Warwick 246
Warwick North Warwick 245
Shipston Stratford 243
Whitnash Warwick 240
Park Hill Warwick 238
Warwick West Warwick 229 Source: Youth Services, Warwickshire County Council

18

19
Young Offenders aged 0-17 years in 2010 By Ward
Top Wards District / Borough
No. of Young
Offenders (Jan to
Dec 2009)
Percentage of Total
Offenders
Stratford Guild & Hathaway Stratford 45 10.2%
Alcester Stratford 32 7.35 Stratford Avenue and New Town
Stratford 32 7.3%
Warwick West Wawick 31 7.0% Clarendon Wawick 29 6.6%
Brunswick Wawick 25 5.7%
Warwick South Wawick 19 4.3%
Willes Wawick 16 3.6%
Shipston Stratford 15 3.4%
Studley Stratford 15 3.4% Source: Warwickshire Police • The number of young offenders living in the South Area in
2010 was 440. • Of these, 32% live in the top four wards shown on the table
above.

20
INTEGRATED YOUTH SUPPORT SERVICE Under 18 Year Old Conceptions Number of Under 18 conceptions by ward (2006-08)
Top 10 Wards District / Borough
No. of U18 Conceptions
Rate per 1000 (15-17 year olds)
Brunswick Warwick 39 79 Cubbington Warwick 14 78 Warwick West Warwick 26 55 Warwick North Warwick 19 49 Willes Warwick 20 49 Stratford Avenue & New Town
Stratford-on-Avon 15 45
Whitnash Warwick 26 42
Milverton Warwick 17 37
Manor Warwick 16 32
Warwick South Warwick 16 31 Source: Teenage Pregnancy Unit/Office for National Statistics • The ward with the highest number of under 18 conceptions in
the South Area is Brunswick with 39 conceptions during the period 2006-08.
• The South Area had a total of 369 conceptions in the 2006-2008 period.

21
Alcohol and drug attributable admissions to hospital (13-19 year olds) Number and rate of alcohol admissions in Warwickshire by Area (2009-11) Area Number of
admissions Rate per thousand
13-19 year olds South 224 5.6
Number of drug related admissions in Warwickshire by Area (2009-11) District / Borough Number of
admissions Rate per thousand
13-19 year olds South 510 2.0

22
First Time Entrants to Youth Justice System A national indicator has been established to record the number of first time entrants to the Youth Justice System (NI 111). The data has been collected for the past two years and the table below shows that the number of Warwickshire entrants has reduced by 9.6% since 2008/9. The Nuneaton and Bedworth Borough has seen the largest decrease when comparing the two periods, a decrease of 28%. The North Warwickshire Borough has seen the largest increase when comparing the two periods, an increase of 69% in first time entrants to the Youth Justice System.
Year North Warks
Nun &
Bed Rugby Stratford Warwick WARKS
2008/9
36
238
107
71
120
572
2009/10
61
171
121
71
93
517
Source: Youth Justice Service
Participation in Positive Activities A national indicator has been established to record ‘young people’s participation in positive activities’ (NI 110). 2008/9 was the first year that the data for this indicator was available in Warwickshire. The indicator is based on the annual TellUs survey of school pupils.
Source: Warwickshire Hub, TellUs Survey Results, Warwickshire County Council In 2009/10 there was a slight reduction in the number of school pupils that were participating in positive activities and the county missed out on achieving its target of 76.2%. It is hoped that greater detail split down by district/borough will be available for next year’s Needs Analysis.
Year Results
2008/9
69.9%
2009/10
68.5%

23
School leavers not in employment, education or training (NEET) School leavers not in employment, education or training at 31st November 2010, by Ward
Top 10 Wards District / Borough
No. of NEET
Brunswick Warwick 29 Warwick West Warwick 26 Willes Warwick 22 Crown Warwick 20 Warwick North Warwick 18
Clarendon Warwick 14
Alcester Stratford 11
Warwick South Warwick 11
Shipston Stratford 10
Abbey Warwick 10 Source: Connexions, Warwickshire County Council The destinations of young people who complete their statutory education are recorded by Connexions and an annual index produced which reports on the total number of positive and negative outcomes. • The total number of School Leavers not in Education,
Employment or Training in the South Area is 299. • This represents 33% of the total Warwickshire NEET
population.
24
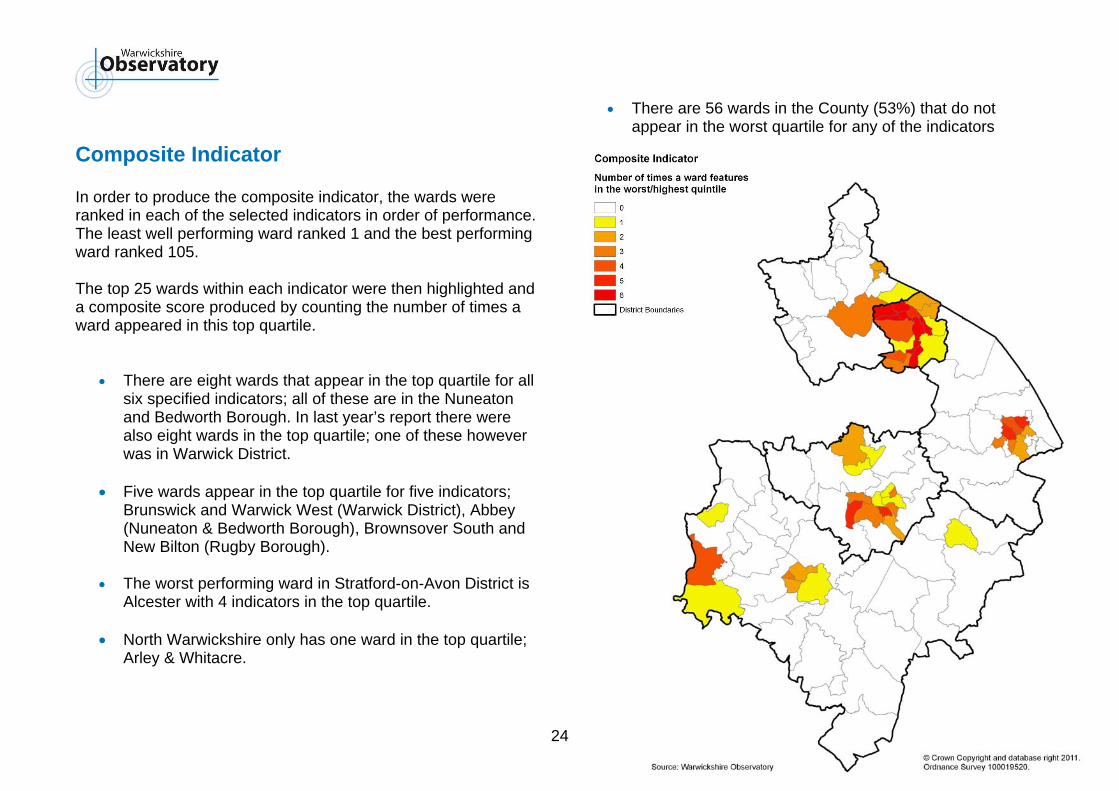
Composite Indicator In order to produce the composite indicator, the wards were ranked in each of the selected indicators in order of performance. The least well performing ward ranked 1 and the best performing ward ranked 105. The top 25 wards within each indicator were then highlighted and a composite score produced by counting the number of times a ward appeared in this top quartile.
• There are eight wards that appear in the top quartile for all six specified indicators; all of these are in the Nuneaton and Bedworth Borough. In last year’s report there were also eight wards in the top quartile; one of these however was in Warwick District.
• Five wards appear in the top quartile for five indicators;
Brunswick and Warwick West (Warwick District), Abbey (Nuneaton & Bedworth Borough), Brownsover South and New Bilton (Rugby Borough).
• The worst performing ward in Stratford-on-Avon District is
Alcester with 4 indicators in the top quartile.
• North Warwickshire only has one ward in the top quartile; Arley & Whitacre.
• There are 56 wards in the County (53%) that do not appear in the worst quartile for any of the indicators

25
WARD STATISTICS WORST/HIGHEST QUARTILE HIGHLIGHTED IN RED
Ward District/Borough Composite 13-19 years
Youth offenders
Unauthorised absence
Pupils not achieving
GCSE A*-C
NEETs Pupils receiving Free School
Meals Wem Brook Nuneaton & Bedworth 6 736 24 223 35 40 121 Camp Hill Nuneaton & Bedworth 6 656 38 283 48 39 100 Kingswood Nuneaton & Bedworth 6 664 30 278 61 17 86 Attleborough Nuneaton & Bedworth 6 750 30 162 28 27 81 Bar Pool Nuneaton & Bedworth 6 682 29 253 51 18 65 Bede Nuneaton & Bedworth 6 608 18 231 38 17 65 Poplar Nuneaton & Bedworth 6 696 17 205 23 13 42 Galley Common Nuneaton & Bedworth 6 829 21 221 32 23 36 Brunswick Warwick 5 898 25 101 34 29 126 Warwick West Warwick 5 809 31 69 20 26 83 Abbey Nuneaton & Bedworth 5 651 7 180 27 24 55 Brownsover South Rugby 5 408 28 118 25 21 44 New Bilton Rugby 5 562 33 113 22 21 42 Newbold Rugby 4 557 66 121 17 23 46 Alcester Stratford-on-Avon 4 547 32 183 27 11 40 Heath Nuneaton & Bedworth 4 613 9 114 8 16 37 Arbury Nuneaton & Bedworth 4 553 20 128 33 16 29 Overslade Rugby 3 536 17 90 33 23 53 Crown Warwick 3 533 13 101 38 20 53 Willes Warwick 3 670 16 62 9 22 48 Admirals Rugby 3 806 13 106 12 15 45 Stratford Mount Pleasant Stratford-on-Avon 3 349 8 180 25 8 41 Exhall Nuneaton & Bedworth 3 690 29 102 10 12 39 Warwick North Warwick 3 585 7 46 24 18 38 Warwick South Warwick 3 917 19 42 21 11 35 Arley and Whitacre North Warwickshire 3 531 18 154 26 11 29 Benn Rugby 2 601 17 107 19 20 53 Whitnash Warwick 2 780 14 46 17 7 45 Atherstone Central North Warwickshire 2 279 12 84 24 21 27

26
WARD STATISTICS WORST/HIGHEST QUARTILE HIGHLIGHTED IN RED Ward District/Borough Composite 13-19
years Youth
offenders Unauthorised
absence Pupils not achieving
GCSE A*-C
NEETs Pupils receiving Free School
Meals Atherstone North North Warwickshire 2 316 8 52 20 14 17 Caldecott Rugby 2 1079 46 64 16 7 17 Stratford Guild and Hathaway Stratford-on-Avon 2 536 45 140 15 4 16 Abbey Warwick 2 574 119 67 21 10 14 Slough Nuneaton & Bedworth 2 618 6 194 16 7 14 Weddington Nuneaton & Bedworth 2 653 18 59 6 4 8 Stratford Avenue and New Town Stratford-on-Avon 2 478 32 129 6 9 6 St Nicolas Nuneaton & Bedworth 1 714 10 70 9 6 31 Hartshill North Warwickshire 1 322 28 91 11 8 30 Southam Stratford-on-Avon 1 598 12 154 16 8 29 St John's Warwick 1 604 3 88 21 7 27 Bidford and Salford Stratford-on-Avon 1 577 9 155 15 7 26 Studley Stratford-on-Avon 1 496 15 123 16 3 23 Milverton Warwick 1 657 14 43 13 9 22 Stratford Alveston Stratford-on-Avon 1 540 4 147 10 2 22 Manor Warwick 1 665 9 54 9 6 18 Park Hill Warwick 1 763 2 78 5 3 13 Clarendon Warwick 1 274 29 23 6 14 12 Bulkington Nuneaton & Bedworth 1 399 15 109 12 9 10 Whitestone Nuneaton & Bedworth 1 672 15 78 13 8 8 Hurley and Wood End North Warwickshire 0 382 3 105 19 13 33 Atherstone South and Mancetter North Warwickshire 0 317 16 65 19 11 28 Dordon North Warwickshire 0 267 10 54 12 9 27 Polesworth East North Warwickshire 0 322 11 28 12 6 23 Wellesbourne Stratford-on-Avon 0 569 5 60 18 2 23 Kineton Stratford-on-Avon 0 314 9 40 11 5 22 Baddesley and Grendon North Warwickshire 0 340 4 58 18 11 21 Hillmorton Rugby 0 413 5 73 18 10 21 Earl Craven and Wolston Rugby 0 488 6 57 12 9 19 Lawford and King's Newnham Rugby 0 304 3 39 9 7 19 Shipston Stratford-on-Avon 0 365 15 38 5 10 16

27
WARD STATISTICS WORST/HIGHEST QUARTILE HIGHLIGHTED IN RED Ward District/Borough Composite 13-19
years Youth
offenders Unauthorised
absence Pupils not achieving
GCSE A*-C
NEETs Pupils receiving Free School
Meals Fosse Rugby 0 324 5 45 8 5 15 Cubbington Warwick 0 478 7 45 9 1 15 Harbury Stratford-on-Avon 0 333 7 86 8 6 14 Henley Stratford-on-Avon 0 279 12 28 13 0 14 Paddox Rugby 0 312 14 27 11 6 13 Eastlands Rugby 0 584 11 71 17 0 13 Quinton Stratford-on-Avon 0 195 6 32 2 6 11 Brownsover North Rugby 0 584 1 49 12 9 10 Budbrooke Warwick 0 490 1 45 11 6 10 Newton Regis and Warton North Warwickshire 0 327 3 24 7 6 10 Stockton and Napton Stratford-on-Avon 0 264 1 54 13 3 10 Fillongley North Warwickshire 0 298 7 31 8 3 9 Dunchurch and Knightlow Rugby 0 558 3 45 5 3 9 Aston Cantlow Stratford-on-Avon 0 144 0 37 1 0 9 Kingsbury North Warwickshire 0 316 6 41 12 9 8 Bilton Rugby 0 381 5 42 6 2 8 Curdworth North Warwickshire 0 285 2 42 3 0 7 Leam Valley Rugby 0 150 1 13 3 0 7 Avon and Swift Rugby 0 197 1 42 3 4 6 Bardon Stratford-on-Avon 0 188 0 51 6 2 6 Brailes Stratford-on-Avon 0 167 1 18 2 0 6 Lapworth Warwick 0 216 0 12 1 0 6 Bishop's Tachbrook Warwick 0 269 2 9 3 5 5 Water Orton North Warwickshire 0 347 2 53 10 4 5 Radford Semele Warwick 0 201 5 23 3 4 5 Coleshill South Warwick 0 246 7 33 10 2 5 Kinwarton Stratford-on-Avon 0 185 4 44 3 1 5 Sambourne Stratford-on-Avon 0 153 0 29 3 1 5 Fenny Compton Stratford-on-Avon 0 169 0 16 3 1 5 Burton Dassett Stratford-on-Avon 0 153 1 8 3 1 5 Stoneleigh Warwick 0 370 1 9 1 1 5

28
WARD STATISTICS WORST/HIGHEST QUARTILE HIGHLIGHTED IN RED Ward District/Borough Composite 13-19
years Youth
offenders Unauthorised
absence Pupils not achieving
GCSE A*-C
NEETs Pupils receiving Free School
Meals Ryton-on-Dunsmore Rugby 0 136 3 6 3 4 4 Tanworth Stratford-on-Avon 0 318 4 17 6 3 4 Long Itchington Stratford-on-Avon 0 221 2 38 6 2 4 Vale of the Red Horse Stratford-on-Avon 0 207 3 19 5 2 4 Claverdon Stratford-on-Avon 0 179 0 11 7 1 4 Long Compton Stratford-on-Avon 0 126 0 8 2 0 3 Polesworth West North Warwickshire 0 288 5 21 5 4 2 Coleshill North North Warwickshire 0 277 4 47 12 2 2 Snitterfield Stratford-on-Avon 0 170 2 52 3 1 2 Leek Wootton Warwick 0 228 5 24 1 1 2 Welford Stratford-on-Avon 0 173 0 44 6 0 2 Ettington Stratford-on-Avon 0 174 1 23 2 0 1 Tredington Stratford-on-Avon 0 198 0 16 3 0 0 Wolvey Rugby 0 179 0 18 1 0 0
29
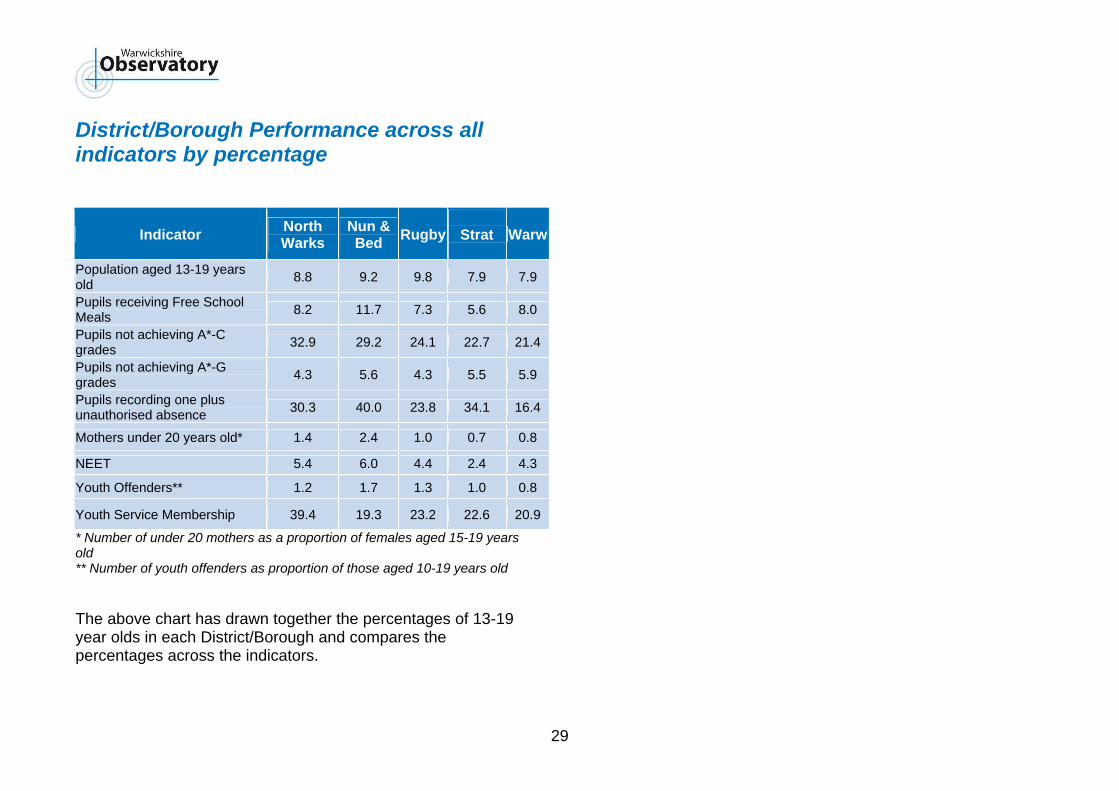
District/Borough Performance across all indicators by percentage
* Number of under 20 mothers as a proportion of females aged 15-19 years old ** Number of youth offenders as proportion of those aged 10-19 years old
The above chart has drawn together the percentages of 13-19 year olds in each District/Borough and compares the percentages across the indicators.
Indicator North Warks
Nun &Bed Rugby
Strat
Warw
Population aged 13-19 years old 8.8 9.2 9.8 7.9 7.9
Pupils receiving Free School Meals 8.2 11.7 7.3 5.6 8.0
Pupils not achieving A*-C grades 32.9 29.2 24.1 22.7 21.4
Pupils not achieving A*-G grades 4.3 5.6 4.3 5.5 5.9
Pupils recording one plus unauthorised absence 30.3 40.0 23.8 34.1 16.4
Mothers under 20 years old* 1.4 2.4 1.0 0.7 0.8
NEET 5.4 6.0 4.4 2.4 4.3
Youth Offenders** 1.2 1.7 1.3 1.0 0.8
Youth Service Membership 39.4 19.3 23.2 22.6 20.9