WARRINGAH COUNCIL QUARTERLY BUDGET REVIEW …
50
WARRINGAH COUNCIL QUARTERLY BUDGET REVIEW STATEMENT WARRINGAH COUNCIL September 2011 warringah.nsw.com.au
Transcript of WARRINGAH COUNCIL QUARTERLY BUDGET REVIEW …

WARRINGAH COUNCIL
QUARTERLY BUDGET REVIEW STATEMENT
WARRINGAH COUNCIL
September 2011
warringah.nsw.com.au

September 2011 Quarterly Report - General Manager’s Message
Report by Responsible Accounting Officer
The following statement is made in accordance with Clause 203(2) of the Local Government (General) Regulations 2005.
It is my opinion that the Quarterly Budget Review Statement for Warringah Council for the three months ended 30 September 2011 indicates that Council’s projected financial position at 30 June 2012 will be satisfactory, having regard to the projected estimates of income and expenditure and the original budgeted income and expenditure.
David Walsh Responsible Accounting Officer, Warringah Council
Income - Consolidated By Service
YTD YTD YTD Annual Approved CurrentActual Forecast Variance Budget Forecast Forecast
$ $ $ $ $ $
Income From Continuing OperationsRates and Annual Charges 21,744,387 21,303,420 440,967 82,872,392 82,872,392 83,022,392 User Charges & Fees 9,543,081 9,132,561 410,521 37,292,644 37,292,644 37,597,707 Investment Fees and Revenues 1,492,078 1,284,932 207,146 4,686,848 4,686,848 4,702,848 Other Revenues 1,407,302 1,467,843 (60,541) 8,003,002 8,003,002 7,877,002 Grants and Contributions - Operating Purposes 1,108,572 1,077,936 30,636 7,133,800 7,133,800 7,416,550 Grants and Contributions - Capital Purposes 1,549,009 1,070,250 478,759 3,860,927 3,860,927 3,735,927 Gains on disposal of Assets 11,934 40,000 (28,066) 160,000 160,000 160,000
Total Income From Continuing Operations 36,856,363 35,376,941 1,479,421 144,009,613 144,009,613 144,512,426
Expenses From Continuing OperationsEmployee Benefits & Oncosts (14,312,814) (15,002,895) 690,082 (57,497,207) (57,477,029) (56,946,349) Borrowing Costs (26,548) (18,957) (7,592) (305,948) (305,948) (305,948) Materials and Contracts (11,832,567) (12,090,930) 258,364 (50,890,048) (51,000,226) (51,772,221) Depreciation and Amortisation (3,458,820) (3,397,263) (61,557) (13,889,348) (13,889,348) (13,870,348) Other Expenses (4,008,037) (3,833,525) (174,512) (15,641,862) (15,661,862) (15,806,312) Loss on Disposal of Assets - Share of Interest In Joint Venture (159,032) (150,346) (8,687) (601,383) (601,383) (601,383) Internal Charges - - - - - - Overhead Allocation - - - - - -
Total Expenses From Continuing Operations (33,797,818) (34,493,916) 696,099 (138,825,796) (138,935,796) (139,302,561)
Surplus / (Deficit) from Continuing Operations 3,058,545 883,025 2,175,520 5,183,817 5,073,817 5,209,865
Surplus / (Deficit) Before Capital Grants & Contribution 1,509,536 (187,225) 1,696,761 1,322,890 1,212,890 1,473,938
Surplus / (Deficit) from Continuing Operations 3,058,545 883,025 2,175,520 5,183,817 5,073,817 5,209,865
Rates Yet to be Allocated to Services
Rates and Charges yet to be allocated to Services 61,568,970 61,568,970 -
Surplus/ (Deficit) from Continuing Operations 64,627,515 62,451,995 2,175,520
Surplus/ (Deficit) before Capital Grants & Contributions 63,078,506 61,381,745 1,696,761
The above Income Statement shows Council’s consolidated financial result for the three months ended 30 September 2011.
The result for the three months ended 30 September 2011 shows some variations between budgeted and actual results. Comments have been provided by responsible budget managers and the forecasts have been amended where necessary. The reports for each of the 16 services provided in the Strategic Community Plan 2011 are each provided separately.
2

September 2011 Quarterly Report - General Manager’s Message
Forecast Changes
These overall movements are detailed in the table below:
Annual Approved Current
Budget Forecast Variance Forecast Variance
$ $ $ $ $
Total Income from Continuing Operations 144,009,613 144,009,613 (0) 144,512,426 502,813
Total Expenses from Continuing Operations (138,825,796) (138,935,796) (110,000) (139,302,561) (366,765)
Surplus/Deficit from Continuing Operations 5,183,817 5,073,817 (110,000) 5,209,865 136,048
Surplus/Deficit before Capital Grants & Contributions 1,322,890 1,212,890 (110,000) 1,473,938 261,048
The principal feature of the forecast changes is an increase in the Surplus from Continuing Operations before Capital Grants and Contributions for the full financial year from the original budget of $151,048 to $1,473,938. As this increase principally relates to Domestic Waste Income and is therefore restricted to being spent on domestic waste services it is not available for other purposes. It should be noted that at this point in time no change has been made to forecast for Fine Income. This matter is still subject to negotiation with the State Debt Recovery Office which is anticipated to be finalised in the second quarter.
The significant changes related to Income from Continuing Operations are:
Rates and Annual Charges have been forecast to increase by $150,000 due to additional Domestic Waste Management Charges.
User Fees & Charges have been forecast to increase by $305,063 due mainly to additional road restoration income and additional child care fees due to additional places at Brookvale offset by a reduction in Glen Street Theatre due to lower attendance levels.
The forecast for Interest and Investment Revenues has been increased by $16,000 reflecting Glen Street Theatre interest.
Other Revenues have been forecast to decrease by $126,000 principally due to a reduction in both Sorlies and kiosk income at Glen Street Theatre resulting from reduced attendances.
Grants & Contributions – Operating Purposes have been forecast to increase by $282,750. $117,750 is within Natural Environment due to additional grant funding from the Office of Environment and Heritage for Manly and Narrabeen Flood Studies, additional grant funding from the Rural Fire Service for Bush Fire Mitigation and additional grant funding from the Sydney Metro Catchment Management Authority for Dee Why Creek Wetland and Habitat Corridor, Long Reef Bitou Bush Control and Middle/Deep Creek Wetland Restoration offset by a reduction in funding from the Office of Environment and Heritage for Estuary Condition Assessments, $15,000 within Parks, Reserves & Foreshores for a grant from Sydney Water for the Irrigation and Landscape Efficiency Project Stage 2 and $150,000 within Roads, Traffic & Waste due to an additional grant from the Department of Planning in relation to the Brookvale Transport Management Study.
Grants & Contributions – Capital Purposes have been forecast to decrease by $125,000 due to the Narrabeen Lagoon Multiuse Trail contribution no longer anticipated to be received before 2012/13.
The significant changes generally related to Expenses from Continuing Operations are:
Employee Benefits and OnCosts have been forecast to decrease by $530,680 due mainly to vacancies which have not been filled in a number of services and net savings from the realignment of Child Care and Community & Safety Services.
Materials and Contracts have been forecast to increase by $771,995. There have been a number of changes to this item within the individual services. The principal increases have been in
3

September 2011 Quarterly Report - General Manager’s Message
Roads, Traffic and Waste related to road and pavement repair work (funded from the Roads restoration income noted above) and costs associated with the Brookvale Transport Management Study (funded from the grant income noted above), Cultural Services for costs associated with Council resolutions from last year allocating funds toward various events and costs associated with grants received within Natural Environment in June 2011 which we noted as restricted in the 2010/11 Financial Statements Report to Council on 23 August 2011. These increases have been partially offset by reductions in Glen Street Theatre to offset lower income from reduced attendance levels noted above.
Other Expenses has been forecast to increase by $144,450 due mainly the realignment of Child care and Community & Safety Services and increases in Agency Costs in a number of Services to cover vacant positions noted above.
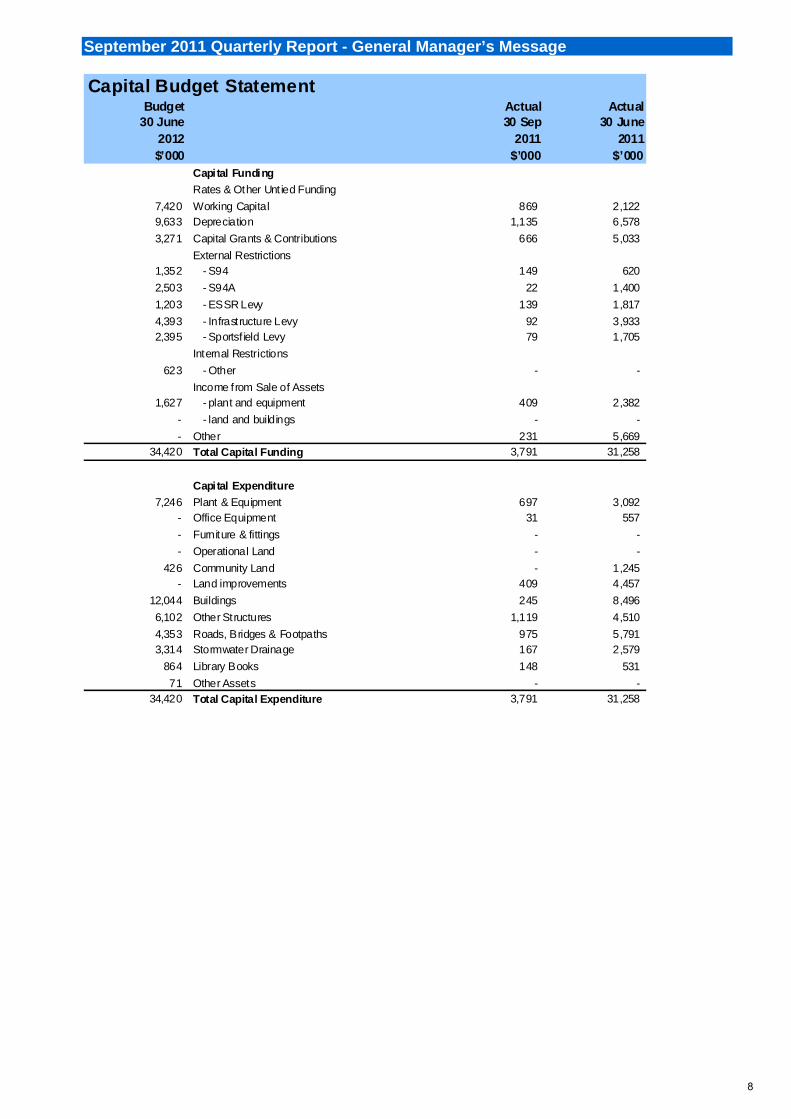
Capital Works
Expenditure on Capital Works for the three months ended 30 September 2011 totalled $3,791,303.
YTD Actual
$
YTD Forecast
$Variance
$
Total Capital Expenditure 3,791,303 3,955,225 (163,922)
Changes to the forecast details of which are included for the individual reports of each of the Services are detailed below.
AnnualBudget
$
ApprovedForecast
$Variance
$
CurrentForecast
$Variance
$
Total Capital Expenditure 34,419,985 35,233,585 (813,600) 33,928,845 1,304,740
4

September 2011 Quarterly Report - General Manager’s Message
$
(99,617)
(823,983)
110,000
(813,600)
(50,000)
20,000
45,000
50,000
(110,000)
10,000
(100,000)
20,000
10,000
15,000
38,037
31,074
(31,074)
5,000
10,000
(38,037)
85,000
50,750
5,000
37,384
(37,384)
12,000
100,000
110,000
(200,000)
1,216,990
1,304,740
491,140
Council Resolution 219/11 of Council meeting 23 August 2011:
Council Resolution 196/11 of Council meeting 26 July 2011:Sth Curl Curl Rock Pool - Stage 1
Rollover of projects from 2010/11
Total Net Changes identified in the Proposed Forecast
Description
Changes by Council Resolution during the first quarter:
Total Net Changes by Council Resolution during the first quarter
Reallocation of Funds Rolled Over to the 2011/12 Budget
Implement IP Telephony Platform
Complaints Management System
Mobile Computing Solutions
Online Time Attendance
Upgrade Enterprise Management System
TRIM EDRMS Upgrade
Tech1 Enterpise Licence Agreement
Light Fleet Replacement Program
Dee Why Beach Viewing Tower
Wheeler Park - New Public Amenity
South Narrabeen SLSC
Replace water cooling tower and chiller
Community Buildings Minor Renewal Works
Yo Yo's Kitchen Renewal
Capital Renewal Works on Council Bldgs
RTR - Local Road Resurfacing
BCA and Fire Safety Compliance Works
Long Reef Beach viewing tower
PAIP - Passmore Reserve
Comm Ctr Bldgs - DDA Audit & stg 1 works
Mayoral Minute 30/2011 of Council meeting 27 September 2011:
Emergency Stormwater Works
Kimbriki Land Improvements
Total Net Changes
Changes identified in the Proposed Forecast
Local Road Resurfacing
South Creek Cycleway
Restoration Narrabeen Lagoon
Collaroy Stormwater Outlet
5

September 2011 Quarterly Report - General Manager’s Message
Balance SheetBudget Actual Actual30 June
201230 Sep
201130 June
2011$’000 $’000 $’000
ASSETS
Current Assets
15,672 Cash & Cash Equivalents 25,773 11,182
47,016 Investments 66,000 71,038
7,471 Receivables 58,949 8,29490 Inventories 91 90
537 Other 499 862
2,944 Non Current Assets Classified as "held for sale" 2,945 2,944
73,730 Total Current Assets 154,257 94,410
Non-Current Assets
3,921 Investments 5,588 5,623
446 Receivables 497 497
3,538,980 Infrastructure, Property, Plant & Equipment 2,369,597 2,369,616778 Investments Accounted for using the equity method 849 849
2,050 Investment Property 2,100 2,100
135 Intangible Assets 1,472 1,270
3,546,310 Total Non-Current Assets 2,380,103 2,379,955
3,620,040 TOTAL ASSETS 2,534,360 2,474,365
LIABILITESCurrent Liabilities
10,850 Payables 14,965 18,602
575 Borrowings 650 574
10,996 Provisions 11,354 11,582
22,421 Total Current Liabil ities 26,969 30,758
Non-Current Liabil ities
200 Payables 450 400
441 Borrowings 508 5086,087 Provisions 6,338 6,338
6,728 Total Non-Current Liabilities 7,296 7,246
29,149 TOTAL LIABILITIES 34,264 38,004
3,590,891 Net Assets 2,500,096 2,436,361
EQUITY
3,492,793 Retained Earnings 2,443,338 2,318,82790,296 Revaluation Reserves 50,153 110,929
3,583,089 Council Equity Interest 2,493,491 2,429,756
7,802 Minority Equity Interest 6,605 6,605
3,590,891 Total Equity 2,500,096 2,436,361
6

September 2011 Quarterly Report - General Manager’s Message
Cash FlowBudget Actual Actual 30 June 30 Sep 30 June
2012 2011 2011$’000 $’000 $’000
Cash Flows from Operating Activities
Receipts:
82,872 Rates & Annual Charges 30,969 79,628 37,293 User Charges & Fees 9,543 29,449
4,687 Interest & Investment Revenue Received 1,492 5,810
11,000 Grants & Contribut ions 2,658 13,906 8,158 Other 1,407 7,498
Payments:
(57,390) Employee Benefits & On-Costs (14,211) (51,973)
(55,890) Materials & Contracts (5,538) (45,260) (306) Borrowing Costs (27) (133)
(16,243) Other (4,008) (14,279)
14,181 22,285 24,646
Cash Flows from Investing Activities
Receipts:
- Sale of Investment Securities 24,521 143,150 1,650 Sale of Infrastructure, Property, Plant & Equipment 409 2,249
- Sale of Non-current assets classif ied as "held for resale" - -
Payments:
- Purchase of Investment Securities (29,000) (134,041) - Purchase of Investment Property - -
(34,420) Purchase of Infrastructure, Property, Plant & Equipment (3,423) (32,068)
- Purchase of Intangibles (202) (1,135)
- Contributions Paid to Joint Ventures & Associates - -
(32,770) Net Cash provided (or used in) Investing Activities (7,694) (21,845)
Cash Flows from Financing ActivitiesReceipts:
- Proceeds from Borrowings & Advances - 707
- Share Capital from minority interest - -
Payments:- Repayment of Borrowings & Advances - (1,863)
- Dividends Paid to Minority Interests - (409)
- Net Cash Flow provided (used in) Financing Activities - (1,565) (18,589) Net Increase/(Decrease) in Cash & Cash Equivalents 14,591 1,236
- Net Increase/(Decrease) in Investments (5,073) (9,112)
85,199 87,843 95,719
66,610 97,361 87,843
Net Cash provided (or used in) Operating Activities
plus: Cash & Cash Investments at beginning of the yearCash & Investments - end of the year
7
September 2011 Quarterly Report - General Manager’s Message
Capital Budget StatementBudget Actual Actual
30 June 30 Sep 30 June2012 2011 2011$’000 $’000 $’000
Capital Funding
Rates & Other Unt ied Funding
7,420 Working Capital 869 2,122 9,633 Depreciation 1,135 6,578
3,271 Capital Grants & Contributions 666 5,033
External Restrictions1,352 - S94 149 620
2,503 - S94A 22 1,400
1,203 - ESSR Levy 139 1,817
4,393 - Infrastructure Levy 92 3,933 2,395 - Sportsf ield Levy 79 1,705
Internal Restrictions
623 - Other - -
Income from Sale of Assets1,627 - plant and equipment 409 2,382
- - land and buildings - -
- Other 231 5,669 34,420 Total Capital Funding 3,791 31,258
Capital Expenditure
7,246 Plant & Equipment 697 3,092 - Office Equipment 31 557
- Furniture & fittings - -
- Operational Land - -
426 Community Land - 1,245 - Land improvements 409 4,457
12,044 Buildings 245 8,496
6,102 Other Structures 1,119 4,510
4,353 Roads, Bridges & Footpaths 975 5,791 3,314 Stormwater Drainage 167 2,579
864 Library Books 148 531
71 Other Assets - - 34,420 Total Capital Expenditure 3,791 31,258
8
September 2011 Quarterly Report - General Manager’s Message
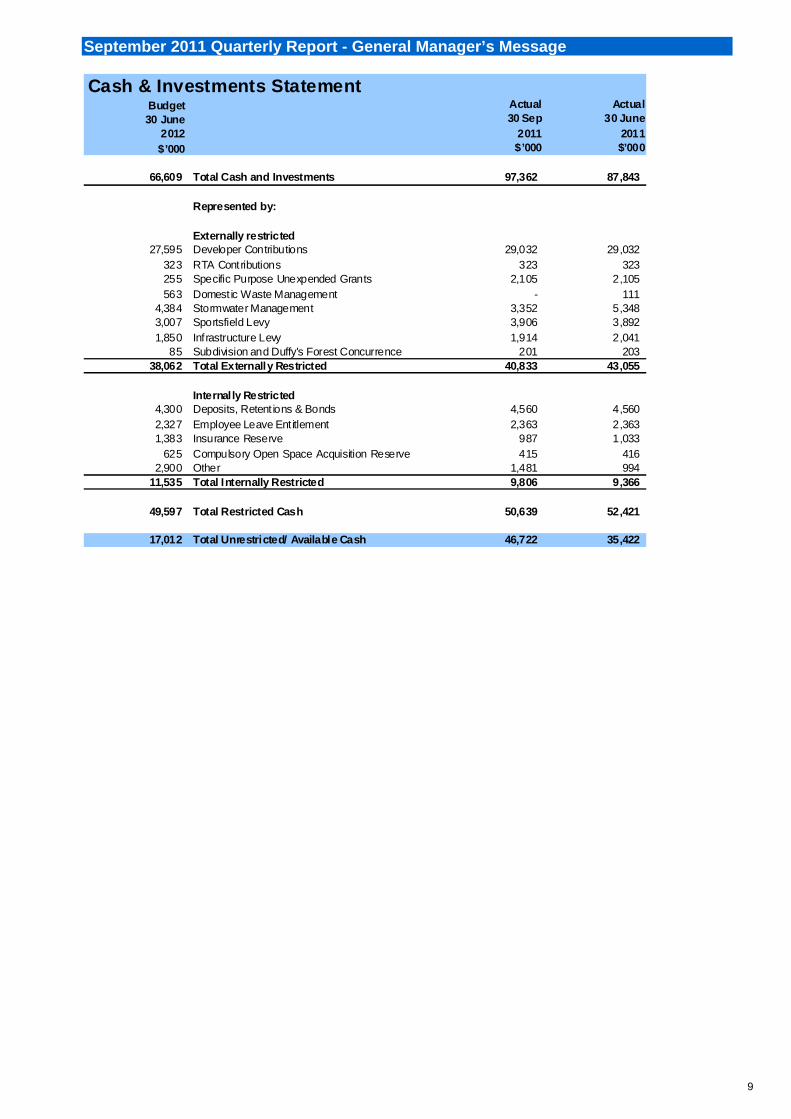
Cash & Investments StatementBudget Actual Actual 30 June 30 Sep 30 June
2012 2011 2011$’000 $’000 $’000
66,609 Total Cash and Investments 97,362 87,843
Represented by:
Externally restricted27,595 Developer Contributions 29,032 29,032
323 RTA Contributions 323 323 255 Specific Purpose Unexpended Grants 2,105 2,105 563 Domest ic Waste Management - 111
4,384 Stormwater Management 3,352 5,348 3,007 Sportsfield Levy 3,906 3,892 1,850 Infrastructure Levy 1,914 2,041
85 Subdivision and Duffy's Forest Concurrence 201 203 38,062 Total Externally Restricted 40,833 43,055
Internally Restricted4,300 Deposits, Retent ions & Bonds 4,560 4,560 2,327 Employee Leave Entitlement 2,363 2,363 1,383 Insurance Reserve 987 1,033
625 Compulsory Open Space Acquisition Reserve 415 416 2,900 Other 1,481 994
11,535 Total Internally Restricted 9,806 9,366
49,597 Total Restricted Cash 50,639 52,421
17,012 Total Unrestricted/ Available Cash 46,722 35,422
9

Overall Progress Progress Capital Works and Key Initiatives
146 Key Initiatives at least 90% of target
3 Key Initiatives between 70 and 90% of
Action target achieved
2 Key Initiatives less than 70% of target
Total 151 Actions
1%
97%
2%
The majority of actions are on schedule. However, delays have been experienced in with the following projects: Delays have been experienced with the Oxford falls constraint study due to contractual
issues. The South Curl Curl rock pool has been delayed due to bad weather and unfavourable sea
conditions.
The Strand Dee Why streetscape has been delayed due to unfavourable weather
conditions. The commencement of renewal of Brookvale children’s centre bathroom is dependent on
the completion of the occasional care centre project due to logistical issues. Thus, it is proposed that the budget funding is rolled over to the next financial year.
The Long reef surf life saving club design and development application is delayed as the
project is on hold by Council resolution.
10
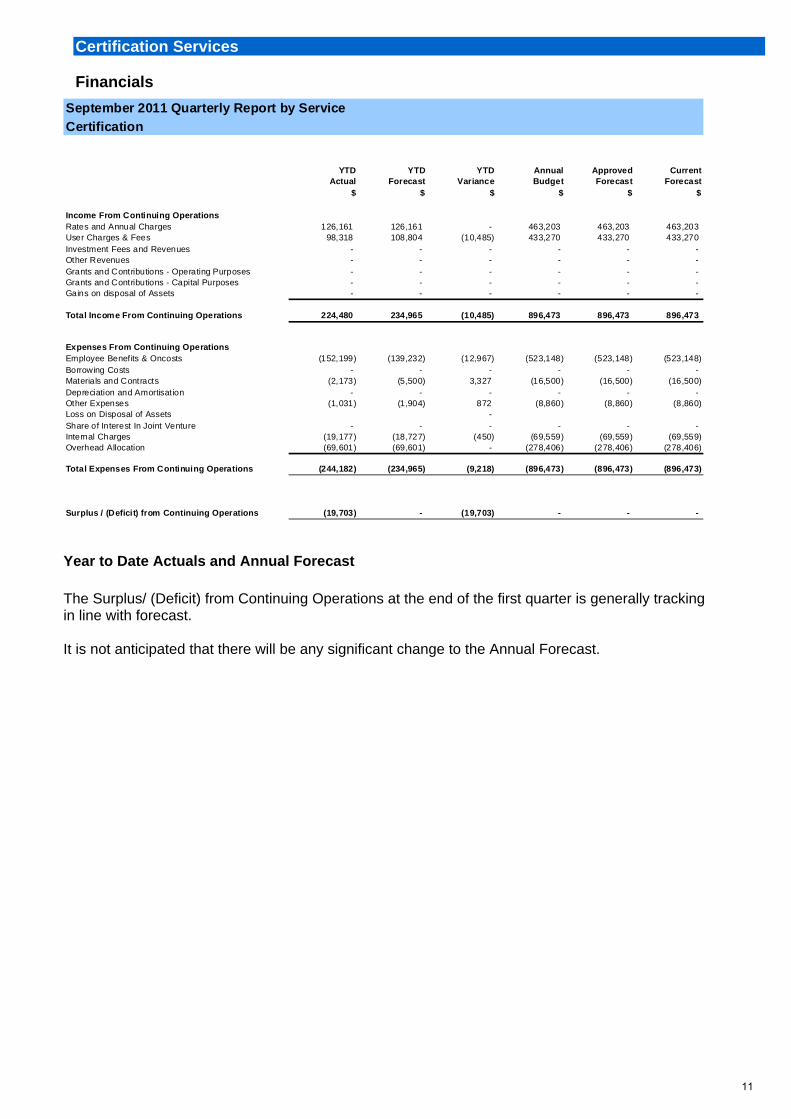
Certification Services Financials
September 2011 Quarterly Report by Service
Certification
YTD YTD YTD Annual Approved CurrentActual Forecast Variance Budget Forecast Forecast
$ $ $ $ $ $
Income From Continuing OperationsRates and Annual Charges 126,161 126,161 - 463,203 463,203 463,203 User Charges & Fees 98,318 108,804 (10,485) 433,270 433,270 433,270 Investment Fees and Revenues - - - - - - Other Revenues - - - - - - Grants and Contributions - Operating Purposes - - - - - - Grants and Contributions - Capital Purposes - - - - - - Gains on disposal of Assets - - - - - -
Total Income From Continuing Operations 224,480 234,965 (10,485) 896,473 896,473 896,473
Expenses From Continuing OperationsEmployee Benefits & Oncosts (152,199) (139,232) (12,967) (523,148) (523,148) (523,148) Borrowing Costs - - - - - - Materials and Contracts (2,173) (5,500) 3,327 (16,500) (16,500) (16,500) Depreciation and Amortisation - - - - - - Other Expenses (1,031) (1,904) 872 (8,860) (8,860) (8,860) Loss on Disposal of Assets - Share of Interest In Joint Venture - - - - - - Internal Charges (19,177) (18,727) (450) (69,559) (69,559) (69,559) Overhead Allocation (69,601) (69,601) - (278,406) (278,406) (278,406)
Total Expenses From Continuing Operations (244,182) (234,965) (9,218) (896,473) (896,473) (896,473)
Surplus / (Deficit) from Continuing Operations (19,703) - (19,703) - - -
Year to Date Actuals and Annual Forecast
The Surplus/ (Deficit) from Continuing Operations at the end of the first quarter is generally tracking in line with forecast. It is not anticipated that there will be any significant change to the Annual Forecast.
11

Certification Services Progress Capital Works and Key Initiatives
Key Highlights Council's Building Certification and Fire Safety Team initiated a new Construction Certificate (CC) processing system in the quarter 1 July 2011 to 30 September 2011. During the quarter, the Team processed 46 applications at an average processing time of 2 days. This represents a fantastic service to Council's customers and is a significant improvement over the same quarter last year where 37 CCs where processed at an average processing time of 33 days.
12
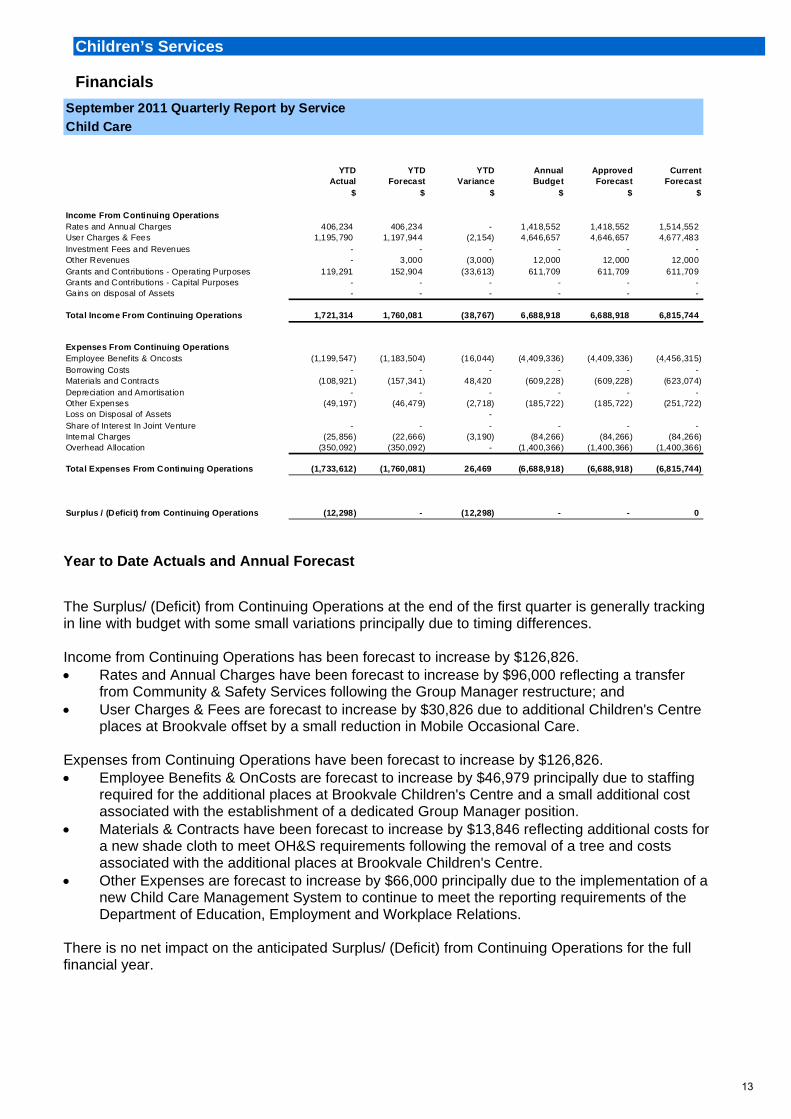
Children’s Services Financials
September 2011 Quarterly Report by Service
Child Care
YTD YTD YTD Annual Approved CurrentActual Forecast Variance Budget Forecast Forecast
$ $ $ $ $ $
Income From Continuing OperationsRates and Annual Charges 406,234 406,234 - 1,418,552 1,418,552 1,514,552 User Charges & Fees 1,195,790 1,197,944 (2,154) 4,646,657 4,646,657 4,677,483 Investment Fees and Revenues - - - - - - Other Revenues - 3,000 (3,000) 12,000 12,000 12,000 Grants and Contributions - Operating Purposes 119,291 152,904 (33,613) 611,709 611,709 611,709 Grants and Contributions - Capital Purposes - - - - - - Gains on disposal of Assets - - - - - -
Total Income From Continuing Operations 1,721,314 1,760,081 (38,767) 6,688,918 6,688,918 6,815,744
Expenses From Continuing OperationsEmployee Benefits & Oncosts (1,199,547) (1,183,504) (16,044) (4,409,336) (4,409,336) (4,456,315) Borrowing Costs - - - - - - Materials and Contracts (108,921) (157,341) 48,420 (609,228) (609,228) (623,074) Depreciation and Amortisation - - - - - - Other Expenses (49,197) (46,479) (2,718) (185,722) (185,722) (251,722) Loss on Disposal of Assets - Share of Interest In Joint Venture - - - - - - Internal Charges (25,856) (22,666) (3,190) (84,266) (84,266) (84,266) Overhead Allocation (350,092) (350,092) - (1,400,366) (1,400,366) (1,400,366)
Total Expenses From Continuing Operations (1,733,612) (1,760,081) 26,469 (6,688,918) (6,688,918) (6,815,744)
Surplus / (Deficit) from Continuing Operations (12,298) - (12,298) - - 0
Year to Date Actuals and Annual Forecast
The Surplus/ (Deficit) from Continuing Operations at the end of the first quarter is generally tracking in line with budget with some small variations principally due to timing differences. Income from Continuing Operations has been forecast to increase by $126,826. Rates and Annual Charges have been forecast to increase by $96,000 reflecting a transfer
from Community & Safety Services following the Group Manager restructure; and User Charges & Fees are forecast to increase by $30,826 due to additional Children's Centre
places at Brookvale offset by a small reduction in Mobile Occasional Care. Expenses from Continuing Operations have been forecast to increase by $126,826. Employee Benefits & OnCosts are forecast to increase by $46,979 principally due to staffing
required for the additional places at Brookvale Children's Centre and a small additional cost associated with the establishment of a dedicated Group Manager position.
Materials & Contracts have been forecast to increase by $13,846 reflecting additional costs for a new shade cloth to meet OH&S requirements following the removal of a tree and costs associated with the additional places at Brookvale Children's Centre.
Other Expenses are forecast to increase by $66,000 principally due to the implementation of a new Child Care Management System to continue to meet the reporting requirements of the Department of Education, Employment and Workplace Relations.
There is no net impact on the anticipated Surplus/ (Deficit) from Continuing Operations for the full financial year.
13

Children’s Services Key Highlights
Two major surveys assessed satisfaction with Council’s Family Day Care (FDC) service. The Family Survey was completed by 22% of client families, yielding very good results: 97% agreed that the FDC location, operating hours and days meet their family's needs; that
the Educator’s program is enriching, stimulating and meets their child's needs and interests. 93% agreed the FDC Unit Staff are accessible, approachable and responsive. 93% agreed that the FDC Educator communication was effective and supported their child. 92% felt that the care provided overall to their child was either very good or excellent. 81% rated the FDC scheme management and administration as either very good or excellent. Aspects liked best about FDC include enriching learning environments with personal care,
flexibility, individual needs catered for, and being like a second home. Aspects they would like improved include: A new software system & less paperwork, more
feedback on child’s progress, more flexibility and alternate care, more craft and music/dance. The Educator Survey was completed by 62% of Family Day Care providers: 97% agreed that FDC Unit staff provided them with adequate information and assistance to
meet all the regulatory requirements; and provide assistance in emergencies. 95% agreed that FDC Unit staff provided them with information and support with the Early
Years Learning Framework; continuous improvement; ongoing program and professional development support through home visits, play session activities, support for children with additional needs, access to toys and equipment and training.
89% agreed that FDC Unit staff assist in filling child care vacancies and enrolment. 30% were satisfied with the current software system regarding benefits & payments. Aspects liked best about FDC include support provided by FDC Unit and other Educators;
support through play sessions, home visits and Toy library; the children and families. Aspects they would like improved include: A new software system & less paperwork; more
assistance to fill vacancies; more positive feedback; consistent payments.
14
Community & Safety Services Financials
September 2011 Quarterly Report by Service
Community & Safety
YTD YTD YTD Annual Approved CurrentActual Forecast Variance Budget Forecast Forecast
$ $ $ $ $ $
Income From Continuing OperationsRates and Annual Charges 1,131,250 1,131,250 - 5,089,093 5,089,093 4,966,153 User Charges & Fees 419,007 393,216 25,791 1,411,120 1,411,120 1,411,120 Investment Fees and Revenues - - - - - - Other Revenues 10,706 - 10,706 53,730 53,730 35,730 Grants and Contributions - Operating Purposes 83,527 61,066 22,461 169,464 169,464 169,464 Grants and Contributions - Capital Purposes - - - - - - Gains on disposal of Assets - - - - - -
Total Income From Continuing Operations 1,644,491 1,585,532 58,958 6,723,407 6,723,407 6,582,467
Expenses From Continuing OperationsEmployee Benefits & Oncosts (735,116) (706,591) (28,525) (3,441,298) (3,441,298) (3,209,639) Borrowing Costs - - - - - - Materials and Contracts (169,754) (188,770) 19,016 (1,064,473) (1,064,473) (1,042,692) Depreciation and Amortisation (83,442) (83,442) - (333,770) (333,770) (333,770) Other Expenses (102,583) (241,484) 138,901 (424,502) (424,502) (432,002) Loss on Disposal of Assets - Share of Interest In Joint Venture - - - - - - Internal Charges (35,032) (30,592) (4,440) (120,753) (120,753) (120,753) Overhead Allocation (334,653) (334,653) - (1,338,611) (1,338,611) (1,338,611)
Total Expenses From Continuing Operations (1,460,580) (1,585,532) 124,952 (6,723,407) (6,723,407) (6,477,467)
Surplus / (Deficit) from Continuing Operations 183,911 - 183,911 - - 105,000
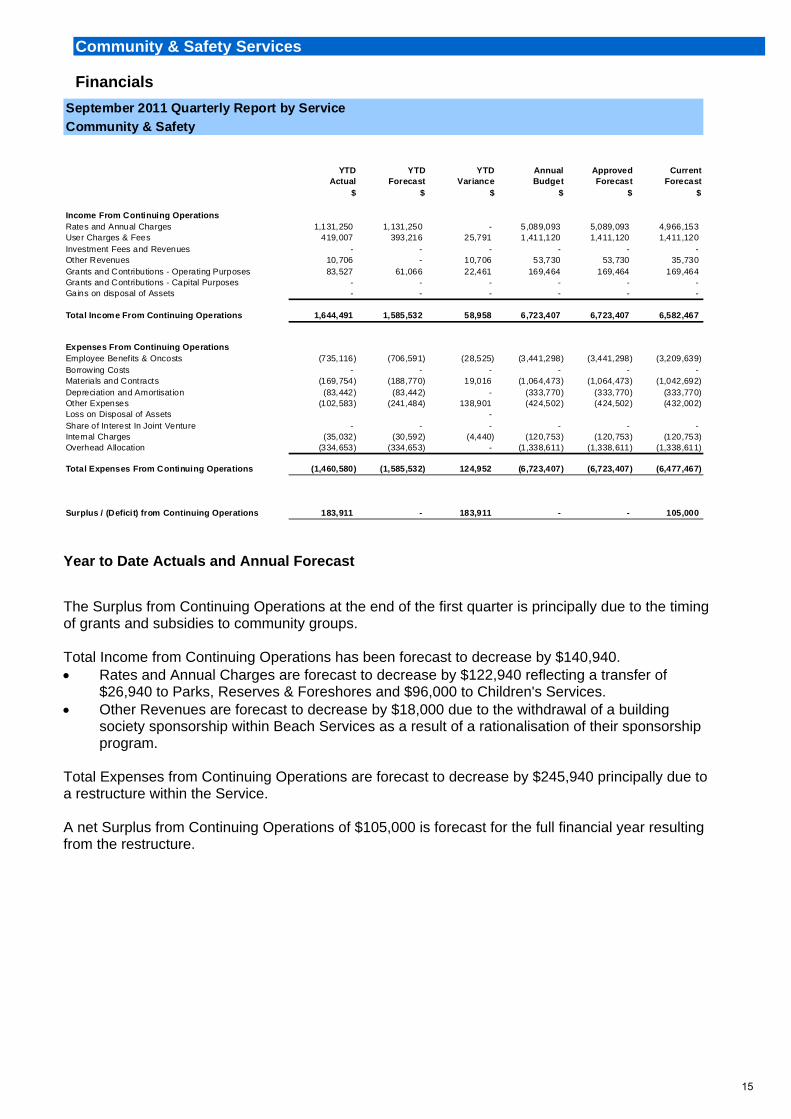
Year to Date Actuals and Annual Forecast
The Surplus from Continuing Operations at the end of the first quarter is principally due to the timing of grants and subsidies to community groups. Total Income from Continuing Operations has been forecast to decrease by $140,940. Rates and Annual Charges are forecast to decrease by $122,940 reflecting a transfer of
$26,940 to Parks, Reserves & Foreshores and $96,000 to Children's Services. Other Revenues are forecast to decrease by $18,000 due to the withdrawal of a building
society sponsorship within Beach Services as a result of a rationalisation of their sponsorship program.
Total Expenses from Continuing Operations are forecast to decrease by $245,940 principally due to a restructure within the Service. A net Surplus from Continuing Operations of $105,000 is forecast for the full financial year resulting from the restructure.
15
Community & Safety Services Key Highlights
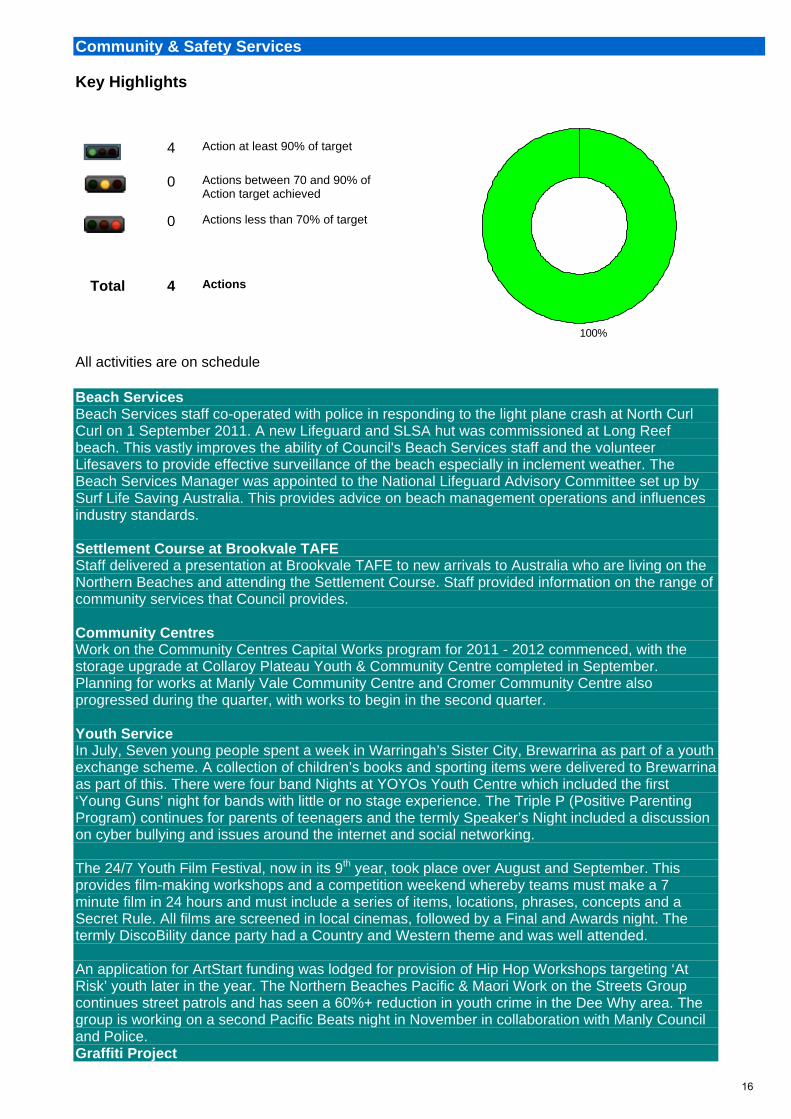
All activities are on schedule Beach Services Beach Services staff co-operated with police in responding to the light plane crash at North Curl Curl on 1 September 2011. A new Lifeguard and SLSA hut was commissioned at Long Reef beach. This vastly improves the ability of Council's Beach Services staff and the volunteer Lifesavers to provide effective surveillance of the beach especially in inclement weather. The Beach Services Manager was appointed to the National Lifeguard Advisory Committee set up by Surf Life Saving Australia. This provides advice on beach management operations and influences industry standards. Settlement Course at Brookvale TAFE Staff delivered a presentation at Brookvale TAFE to new arrivals to Australia who are living on the Northern Beaches and attending the Settlement Course. Staff provided information on the range of community services that Council provides. Community Centres Work on the Community Centres Capital Works program for 2011 - 2012 commenced, with the storage upgrade at Collaroy Plateau Youth & Community Centre completed in September. Planning for works at Manly Vale Community Centre and Cromer Community Centre also progressed during the quarter, with works to begin in the second quarter. Youth Service In July, Seven young people spent a week in Warringah’s Sister City, Brewarrina as part of a youth exchange scheme. A collection of children’s books and sporting items were delivered to Brewarrina as part of this. There were four band Nights at YOYOs Youth Centre which included the first ‘Young Guns’ night for bands with little or no stage experience. The Triple P (Positive Parenting Program) continues for parents of teenagers and the termly Speaker’s Night included a discussion on cyber bullying and issues around the internet and social networking. The 24/7 Youth Film Festival, now in its 9th year, took place over August and September. This provides film-making workshops and a competition weekend whereby teams must make a 7 minute film in 24 hours and must include a series of items, locations, phrases, concepts and a Secret Rule. All films are screened in local cinemas, followed by a Final and Awards night. The termly DiscoBility dance party had a Country and Western theme and was well attended. An application for ArtStart funding was lodged for provision of Hip Hop Workshops targeting ‘At Risk’ youth later in the year. The Northern Beaches Pacific & Maori Work on the Streets Group continues street patrols and has seen a 60%+ reduction in youth crime in the Dee Why area. The group is working on a second Pacific Beats night in November in collaboration with Manly Council and Police. Graffiti Project
4 Action at least 90% of target
0 Actions between 70 and 90% of
Action target achieved
0 Actions less than 70% of target
Total 4 Actions
0%
100%
16

Community & Safety Services Key Highlights
Legal murals were undertaken at Brookvale Primary School and initial consultation undertaken with residents and businesses around Brookvale Wall (corner of Pittwater Road and Alfred Road). Initial work was carried out on the feasibility of Green Street Playground Mural and planning continues for the Narrabeen Scout Hall Mural project with an October start date. Council’s Graffiti Plan was discussed at the NSW Youth Action & Policy Association Conference on 24-26 August.
17

Compliance Services Financials
September 2011 Quarterly Report by Service
Compliance
YTD YTD YTD Annual Approved CurrentActual Forecast Variance Budget Forecast Forecast
$ $ $ $ $ $
Income From Continuing OperationsRates and Annual Charges 402,285 402,285 - 533,069 533,069 533,069 User Charges & Fees 270,271 341,178 (70,908) 1,516,057 1,516,057 1,516,057 Investment Fees and Revenues - - - - - - Other Revenues 504,078 659,377 (155,298) 3,940,909 3,940,909 3,940,909 Grants and Contributions - Operating Purposes - - - - - - Grants and Contributions - Capital Purposes - - - - - - Gains on disposal of Assets - - - - - -
Total Income From Continuing Operations 1,176,634 1,402,840 (226,206) 5,990,035 5,990,035 5,990,035
Expenses From Continuing OperationsEmployee Benefits & Oncosts (659,623) (858,036) 198,413 (3,215,774) (3,215,774) (3,215,774) Borrowing Costs - - - - - - Materials and Contracts (105,257) (38,575) (66,682) (767,200) (767,200) (767,200) Depreciation and Amortisation - - - - - - Other Expenses (14,161) (11,710) (2,451) (60,676) (60,676) (60,676) Loss on Disposal of Assets - Share of Interest In Joint Venture - - - - - - Internal Charges (107,364) (110,914) 3,550 (411,964) (411,964) (411,964) Overhead Allocation (383,605) (383,605) - (1,534,421) (1,534,421) (1,534,421)
Total Expenses From Continuing Operations (1,270,009) (1,402,840) 132,830 (5,990,035) (5,990,035) (5,990,035)
Surplus / (Deficit) from Continuing Operations (93,375) - (93,375) - - -
Year to Date Actuals and Annual Forecast
The Deficit from Continuing Operations at the end of the first quarter relates to lower than anticipated income which has been partially offset by lower than anticipated expenses. The lower than anticipated income principally relates to the timing of parking fees and lower than originally anticipated Other Fine income processed by the State Debt Recovery Office. The lower than anticipated expenses principally relates to employment costs associated with vacant positions and leave offset by higher than anticipated Materials and Contracts expenditure principally due to timing and higher agency costs associated with the vacant positions and leave. No changes have been made at this point to the anticipated Surplus/ Deficit from Continuing Operations for the full financial year pending the result of upcoming meetings with the State Debt Recovery Office.
18

Cultural Services Financials
September 2011 Quarterly Report by Service
Cultural Services
YTD YTD YTD Annual Approved CurrentActual Forecast Variance Budget Forecast Forecast
$ $ $ $ $ $
Income From Continuing OperationsRates and Annual Charges 187,769 187,769 - 844,794 844,794 912,744 User Charges & Fees 3,964 4,361 (397) 8,054 8,054 8,054 Investment Fees and Revenues - - - - - - Other Revenues 6,968 12,000 (5,032) 45,000 45,000 20,000 Grants and Contributions - Operating Purposes - - - - - - Grants and Contributions - Capital Purposes - - - - - - Gains on disposal of Assets - - - - - -
Total Income From Continuing Operations 198,701 204,129 (5,428) 897,848 897,848 940,798
Expenses From Continuing OperationsEmployee Benefits & Oncosts (79,787) (85,571) 5,784 (318,541) (318,541) (320,541) Borrowing Costs - - - - - - Materials and Contracts (53,463) (58,092) 4,628 (310,503) (325,503) (361,303) Depreciation and Amortisation - - - - - - Other Expenses (26,555) (8,896) (17,659) (63,843) (63,843) (68,993) Loss on Disposal of Assets - Share of Interest In Joint Venture - - - - - - Internal Charges (6,912) (4,976) (1,937) (18,579) (18,579) (18,579) Overhead Allocation (46,595) (46,595) - (186,382) (186,382) (186,382)
Total Expenses From Continuing Operations (213,313) (204,129) (9,184) (897,848) (912,848) (955,798)
Surplus / (Deficit) from Continuing Operations (14,612) - (14,612) - (15,000) (15,000)
Year to Date Actuals and Annual Forecast
The Surplus/ (Deficit) from Continuing Operations at the end of the first quarter is generally tracking in line with forecast. Both Total Income from Continuing Operations and Total Expenses from Continuing Operations have been forecast to increase by $42,950. This is principally due to Council resolutions from last financial year allocating funds toward various events. The net annual forecast is a Deficit from Continuing Operations of $15,000 which is a result of Council Resolution 262/11 on 27 September 2011 allocating $15,000 towards hosting an event at the Dee Why Strand to celebrate the completion of the upgrade works and launch the New Strand works.
19

Cultural Services Progress Capital Works and Key Initiatives
1 Key Initiatives at least 90% of target
0 Key Initiatives between 70 and 90% of
Action target achieved
0 Key Initiatives less than 70% of target
Total 1 Actions
0%
100%
All activities are on schedule
Key Highlights Sustainable Events Policy adopted July 2011 This is a new policy for Council. It will help ensure that events delivered within the Warringah Council Local Government Area (LGA) conform to Council’s Environmental Sustainability Policy and ‘quadruple bottom line’ management practices. It applies to major festivals and events run by Council, as well as other events run by other operators within Warringah.
Guringai festival - Call for constitutional change Warringah Council hosted a forum about the need for proper recognition of Indigenous Australians in our constitution. Jeff McMullen chaired the discussion which included members of the Federal Government's expert panel, the Hon. Fred Chaney and Professor Megan Davis. Cultural Development Grants Program Council awarded $20,000 to local organisations to support the development of cultural projects. Bob Waterer book launch Bob Waterer found that he had a remarkable Indigenous background, following the discovery of a leather pouch containing family certificates. A book about his life and heritage, spanning over 200 years, was launched with the Governor NSW, Professor Marie Bashir AC, CVO. Local Government Week – School Tours Local primary school students took part in mock council meetings as part of Local Government Week. Students were also visited by the Local Government Minister, The Hon. Don Page, MP. Dogs Big Day Out Thousands of four legged friends enjoyed a day out and took part in competitions including best trick, cutest puppy, rags to riches and best fancy dress. Festival of Children’s literature – Tashi Day Hundreds of children took part in literary games and activities to celebrate the works of local author, Anna Fienberg including a special performance by Point Break Drama students. Art Exhibitions Over 130 artworks were selected for the Warringah Art Exhibition for 2011and close to 30 artworks were selected for the Waste to Art category promoting sustainable art. The Forest Art and Craft Exhibition had 200 people attend the opening by Mayor Regan. Councillor Julie Sutton presented the prize awards. Some 1000 people attended the exhibition over the weekend, enjoying the works and activities of the Forest Community Arts Centre. Genuine community interest was reflected in the wonderful comments and feedback received.
20

Development Assessment Services Financials
September 2011 Quarterly Report by Service
Development Assessment
YTD YTD YTD Annual Approved CurrentActual Forecast Variance Budget Forecast Forecast
$ $ $ $ $ $
Income From Continuing OperationsRates and Annual Charges 1,122,298 1,122,298 - 4,188,654 4,188,654 4,188,654 User Charges & Fees 492,914 488,270 4,643 1,943,308 1,943,308 1,943,308 Investment Fees and Revenues - - - - - - Other Revenues - - - - - - Grants and Contributions - Operating Purposes - - - - - - Grants and Contributions - Capital Purposes - - - - - - Gains on disposal of Assets - - - - - -
Total Income From Continuing Operations 1,615,212 1,610,569 4,643 6,131,962 6,131,962 6,131,962
Expenses From Continuing OperationsEmployee Benefits & Oncosts (998,295) (1,042,645) 44,350 (3,870,599) (3,870,599) (3,870,599) Borrowing Costs - - - - - - Materials and Contracts (29,530) (40,550) 11,020 (177,445) (177,445) (177,445) Depreciation and Amortisation - - - - - - Other Expenses (18,368) (32,444) 14,076 (128,167) (148,167) (148,167) Loss on Disposal of Assets - Share of Interest In Joint Venture - - - - - - Internal Charges (86,358) (83,890) (2,468) (311,591) (311,591) (311,591) Overhead Allocation (411,040) (411,040) - (1,644,160) (1,644,160) (1,644,160)
Total Expenses From Continuing Operations (1,543,591) (1,610,569) 66,978 (6,131,962) (6,151,962) (6,151,962)
Surplus / (Deficit) from Continuing Operations 71,621 - 71,621 - (20,000) (20,000)
Year to Date Actuals and Annual Forecast
The Surplus from Continuing Operations at the end of the first quarter largely relates to higher than anticipated income and lower than anticipated expenditure. The higher than anticipated Income from Continuing Operations is principally due to timing differences. The lower than anticipated Expenses from Continuing Operations is principally due to a number of staff being on leave which have mostly been backfilled by casual positions and not expected to be ongoing as well as timing differences in other expenditure areas.
The net annual forecast is a Deficit from Continuing Operations of $20,000 which is a result of Council Resolution 262/11 on 27 September 2011 allocating $20,000 towards the future policy for waiving of DA fees for Not-For-Profit Sporting and Community Organisations.
21

Development Assessment Services Progress Capital Works and Key Initiatives
Key Highlights
The Development Assessment service has maintained processing times despite two additional types of applications (Section 82B and Section 96AB) being introduced into the EP&A Act 1979. Planning Panel applications have continued to meet or better the required processing times.
22
Glen Street Theatre Financials
September 2011 Quarterly Report by ServiceGlen Street Theatre
YTD YTD YTD Annual Approved CurrentActual Forecast Variance Budget Forecast Forecast
$ $ $ $ $ $
Income From Continuing OperationsRates and Annual Charges 346,502 346,502 - 1,249,790 1,249,790 1,249,790 User Charges & Fees 419,174 537,252 (118,078) 1,849,469 1,849,469 1,623,706 Investment Fees and Revenues 5,097 - 5,097 - - 16,000 Other Revenues 73,785 130,062 (56,277) 519,784 519,784 386,784 Grants and Contributions - Operating Purposes - - - - - - Grants and Contributions - Capital Purposes - - - - - - Gains on disposal of Assets - - - - - -
Total Income From Continuing Operations 844,558 1,013,816 (169,258) 3,619,043 3,619,043 3,276,280
Expenses From Continuing OperationsEmployee Benefits & Oncosts (269,687) (330,590) 60,903 (1,240,307) (1,240,307) (1,157,307) Borrowing Costs - - - - - - Materials and Contracts (294,298) (376,440) 82,142 (1,205,428) (1,205,428) (982,665) Depreciation and Amortisation (25,248) (30,387) 5,139 (121,596) (121,596) (102,596) Other Expenses (67,970) (94,532) 26,562 (325,603) (325,603) (307,603) Loss on Disposal of Assets - Share of Interest In Joint Venture - - - - - - Internal Charges (3,196) (5,424) 2,227 (20,335) (20,335) (20,335) Overhead Allocation (176,444) (176,444) - (705,774) (705,774) (705,774)
Total Expenses From Continuing Operations (836,842) (1,013,816) 176,973 (3,619,043) (3,619,043) (3,276,280)
Surplus / (Deficit) from Continuing Operations 7,716 - 7,716 - - -
Year to Date Actuals and Annual Forecast
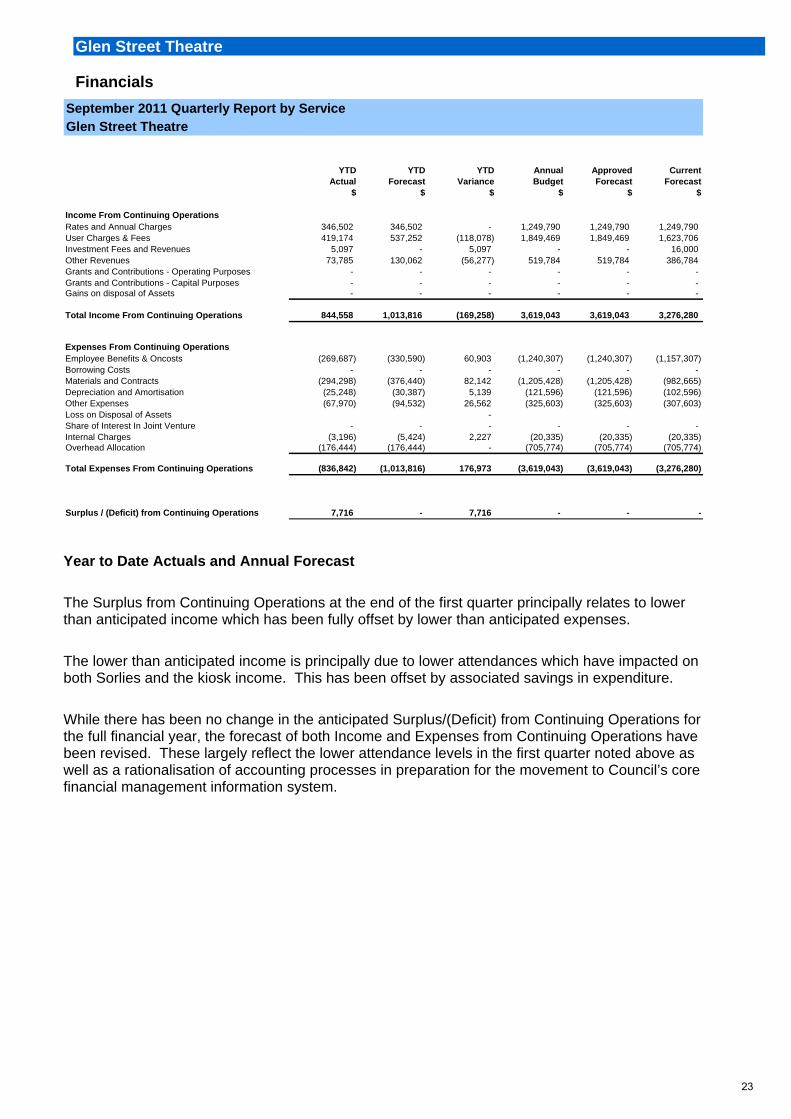
The Surplus from Continuing Operations at the end of the first quarter principally relates to lower than anticipated income which has been fully offset by lower than anticipated expenses.
The lower than anticipated income is principally due to lower attendances which have impacted on both Sorlies and the kiosk income. This has been offset by associated savings in expenditure.
While there has been no change in the anticipated Surplus/(Deficit) from Continuing Operations for the full financial year, the forecast of both Income and Expenses from Continuing Operations have been revised. These largely reflect the lower attendance levels in the first quarter noted above as well as a rationalisation of accounting processes in preparation for the movement to Council’s core financial management information system.
23

Glen Street Theatre Progress Capital Works and Key Initiatives
2 Key Initiatives at least 90% of target
0 Key Initiatives between 70 and 90% of
Action target achieved
0 Key Initiatives less than 70% of target
Total 0 Actions
0%
100%
All activities are on schedule.
Key Highlights Visual Arts, Musical and Literary Cultural Programs
The Main Stage season has seen the presentation of THE SUM OF US and UNDERDOGS. Both productions were thoroughly appreciated and enjoyed by audiences, but did not achieve budgeted capacity. Successful Literary Lunches have taken place with Ita Buttrose and Gerald Stone.
StageArts presented PETER PAN which achieved 90% capacity, a record for the organisation.
MUSIC AT THE GLEN has seen Peter Cousens and Stephen Fisher- King take to the stage to delight the morning audiences for this popular program.
KidsPlay
This quarter has seen the presentation of MY GRANDMA LIVED IN GOOLIGULCH which was extremely well received by children during the July school holidays.
24

Information and Library Services Financials
September 2011 Quarterly Report by Service
Information & Library
YTD YTD YTD Annual Approved CurrentActual Forecast Variance Budget Forecast Forecast
$ $ $ $ $ $
Income From Continuing OperationsRates and Annual Charges 1,574,471 1,574,471 - 5,657,473 5,657,473 5,657,473 User Charges & Fees 54,920 77,293 (22,373) 308,784 308,784 308,784 Investment Fees and Revenues - - - - - - Other Revenues 4,783 250 4,533 1,000 1,000 1,000 Grants and Contributions - Operating Purposes 8,138 8,138 (0) 120,755 120,755 120,755 Grants and Contributions - Capital Purposes - - - 258,000 258,000 258,000 Gains on disposal of Assets - - - - - -
Total Income From Continuing Operations 1,642,312 1,660,152 (17,840) 6,346,012 6,346,012 6,346,012
Expenses From Continuing OperationsEmployee Benefits & Oncosts (1,013,416) (1,024,147) 10,731 (3,806,090) (3,806,090) (3,806,090) Borrowing Costs - - - - - - Materials and Contracts (158,830) (137,895) (20,936) (551,765) (551,765) (551,765) Depreciation and Amortisation (143,538) (143,538) - (574,149) (574,149) (574,149) Other Expenses (21,283) (26,431) 5,148 (105,708) (105,708) (105,708) Loss on Disposal of Assets - Share of Interest In Joint Venture - - - - - - Internal Charges (17,823) (14,937) (2,886) (55,483) (55,483) (55,483) Overhead Allocation (313,204) (313,204) - (1,252,817) (1,252,817) (1,252,817)
Total Expenses From Continuing Operations (1,668,095) (1,660,152) (7,942) (6,346,012) (6,346,012) (6,346,012)
Surplus / (Deficit) from Continuing Operations (25,783) - (25,783) - - -
Year to Date Actuals and Annual Forecast
The Surplus/ (Deficit) from Continuing Operations at the end of the first quarter is generally tracking in line with forecast.
There are some differences on individual lines however these are principally due to timing differences.
It is not anticipated that there will be any significant change in the Forecast for the full financial year.
25

Information and Library Services Progress Capital Works and Key Initiatives
3 Key Initiatives at least 90% of target
0 Key Initiatives between 70 and 90% of
Action target achieved
0 Key Initiatives less than 70% of target
Total 3 Actions
0%
100%
All activities are on schedule.
Key Highlights Children's Programs Warringah Young Writers Competition held with winning entries published on the Library Website This program was a demonstration of the partnerships that exist between the Library service, local school Librarians and teachers, childrens authors and Library patrons. The Festival of Children's Literature Tashi Day was held in September and is the culmination of a range of activities that included author talks, Tashi competitions, Morning tea and Lunch with the Stars (children's authors and illustrators). Young Actors from the Point Break Drama group performed entries from the Young Writers competition and an adaptation of the book "There Once was a boy called Tashi'. The author of the popularTashi series is a local and Anna Fienberg worked with the Library staff to develop the Festival. Council's Events team assisted with the infrastructure for the day. The Festival attracted 700 children to Belrose Park. Research Excellence Awards Research Excellence Award conducted. The winning examples of student research using the Library's databases were submitted by the School Librarians from the local High schools and winning students were invited to attend a training session at TAFE. This is an example of a very productive partnership between the Library Service with the 15 high schools in the area and TAFE.
26

Kimbriki Environmental Enterprises Financials
September 2011 Quarterly Report by Service
Kimbriki Waste & Recycling Centre
YTD YTD YTD Annual Approved CurrentActual Forecast Variance Budget Forecast Forecast
$ $ $ $ $ $
Income From Continuing OperationsRates and Annual Charges - - - - - - User Charges & Fees 4,430,903 4,249,709 181,194 17,853,746 17,853,746 17,853,746 Investment Fees and Revenues 215,186 90,000 125,186 360,000 360,000 360,000 Other Revenues 578,511 507,380 71,131 1,774,365 1,774,365 1,774,365 Grants and Contributions - Operating Purposes - - - - - - Grants and Contributions - Capital Purposes - - - - - - Gains on disposal of Assets - - - - - -
Total Income From Continuing Operations 5,224,600 4,847,089 377,511 19,988,111 19,988,111 19,988,111
Expenses From Continuing OperationsEmployee Benefits & Oncosts (634,291) (606,854) (27,437) (2,642,203) (2,642,203) (2,642,203) Borrowing Costs - - - - - - Materials and Contracts (2,138,419) (2,050,530) (87,889) (8,647,136) (8,647,136) (8,647,136) Depreciation and Amortisation (58,026) (100,608) 42,582 (402,440) (402,440) (402,440) Other Expenses (1,515,927) (1,489,907) (26,020) (6,097,826) (6,097,826) (6,097,826) Loss on Disposal of Assets - Share of Interest In Joint Venture - - - - - - Internal Charges - - - - - - Overhead Allocation - - - - - -
Total Expenses From Continuing Operations (4,346,663) (4,247,900) (98,763) (17,789,605) (17,789,605) (17,789,605)
Surplus / (Deficit) from Continuing Operations 877,938 599,190 278,748 2,198,506 2,198,506 2,198,506
Year to Date Actuals and Annual Forecast
The Surplus from Continuing Operations at the end of the first quarter is tracking higher than budget principally due to higher than anticipated revenue and higher than anticipated expenses.
User Fees & Charges are ahead as a result of higher than anticipated tip fees related to higher tonnage. This has resulted in a consequential increase in waste costs impacting on a higher level of Expenses from Continuing Operations.
There is no change in the anticipated Surplus from Continuing Operations for the full financial year.
27

Kimbriki Environmental Enterprises Progress Capital Works and Key Initiatives
1 Action at least 90% of target
0 Actions between 70 and 90% of
Action target achieved
0 Actions less than 70% of target
Total 1 Actions
0%
100%
All activities are on schedule
28
Natural Environment Financials
September 2011 Quarterly Report by Service
Natural Environment
YTD YTD YTD Annual Approved CurrentActual Forecast Variance Budget Forecast Forecast
$ $ $ $ $ $
Income From Continuing OperationsRates and Annual Charges 2,497,037 2,497,037 - 10,222,238 10,222,238 10,222,238 User Charges & Fees 9,787 14,968 (5,180) 55,772 55,772 55,772 Investment Fees and Revenues - - - - - - Other Revenues 376 - 376 - - - Grants and Contributions - Operating Purposes 16,000 - 16,000 578,180 578,180 695,930 Grants and Contributions - Capital Purposes - - - 133,000 133,000 8,000 Gains on disposal of Assets - - - - - -
Total Income From Continuing Operations 2,523,200 2,512,005 11,196 10,989,190 10,989,190 10,981,940
Expenses From Continuing OperationsEmployee Benefits & Oncosts (681,358) (723,566) 42,208 (2,401,312) (2,401,312) (2,401,312) Borrowing Costs - - - - - - Materials and Contracts (306,924) (297,770) (9,154) (2,549,416) (2,549,416) (2,739,366) Depreciation and Amortisation (842,823) (842,823) - (3,371,295) (3,371,295) (3,371,295) Other Expenses (23,508) (9,584) (13,924) (79,105) (79,105) (66,905) Loss on Disposal of Assets - Share of Interest In Joint Venture - - - - - - Internal Charges (302,131) (300,378) (1,753) (1,236,532) (1,236,532) (1,236,532) Overhead Allocation (337,883) (337,883) - (1,351,530) (1,351,530) (1,351,530)
Total Expenses From Continuing Operations (2,494,626) (2,512,005) 17,379 (10,989,190) (10,989,190) (11,166,940)
Surplus / (Deficit) from Continuing Operations 28,574 - 28,574 - - (185,000)
Year to Date Actuals and Annual Forecast
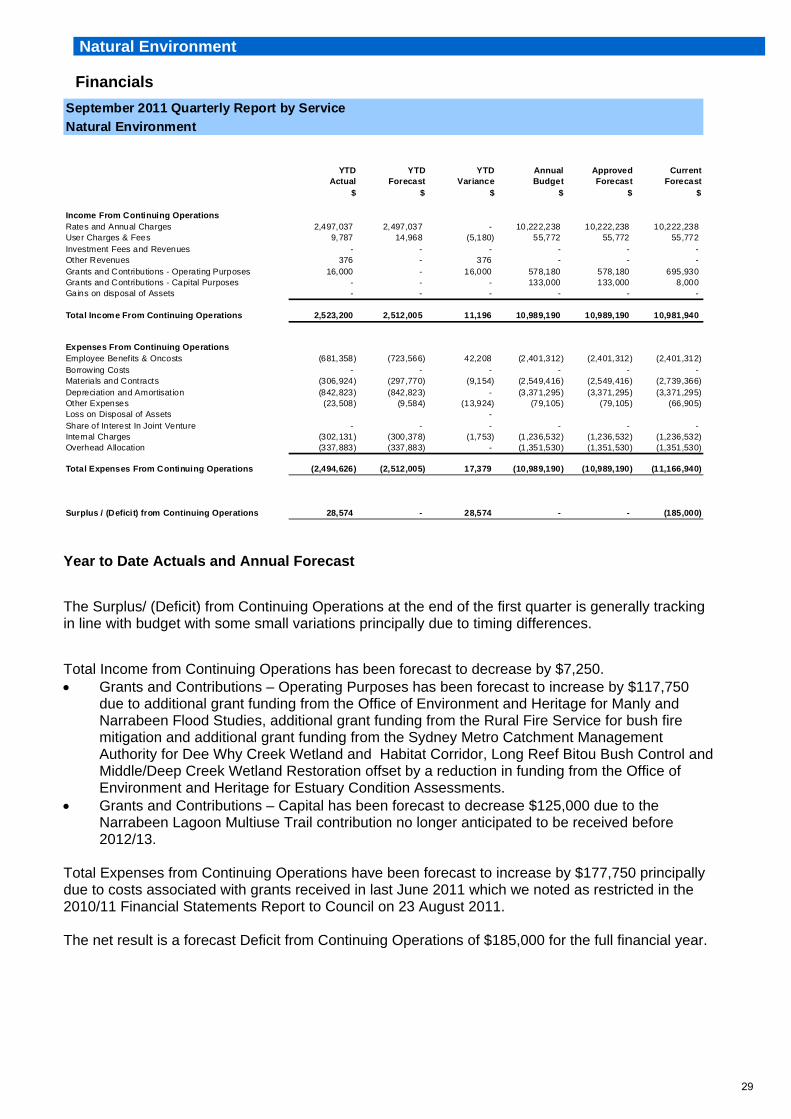
The Surplus/ (Deficit) from Continuing Operations at the end of the first quarter is generally tracking in line with budget with some small variations principally due to timing differences.
Total Income from Continuing Operations has been forecast to decrease by $7,250. Grants and Contributions – Operating Purposes has been forecast to increase by $117,750
due to additional grant funding from the Office of Environment and Heritage for Manly and Narrabeen Flood Studies, additional grant funding from the Rural Fire Service for bush fire mitigation and additional grant funding from the Sydney Metro Catchment Management Authority for Dee Why Creek Wetland and Habitat Corridor, Long Reef Bitou Bush Control and Middle/Deep Creek Wetland Restoration offset by a reduction in funding from the Office of Environment and Heritage for Estuary Condition Assessments.
Grants and Contributions – Capital has been forecast to decrease $125,000 due to the Narrabeen Lagoon Multiuse Trail contribution no longer anticipated to be received before 2012/13.
Total Expenses from Continuing Operations have been forecast to increase by $177,750 principally due to costs associated with grants received in last June 2011 which we noted as restricted in the 2010/11 Financial Statements Report to Council on 23 August 2011. The net result is a forecast Deficit from Continuing Operations of $185,000 for the full financial year.
29

Natural Environment Progress Capital Works and Key Initiatives
15 Key Initiatives at least 90% of target
0 Key Initiatives between 70 and 90% of
Action target achieved
1 Key Initiatives less than 70% of target
Total 16 Actions
94%
0%6%
The majority of actions are on schedule. Delays have been experienced with the Oxford falls constraint study due to contractual issues. Key Highlights Narrabeen Lagoon Multi-Use Trail Stage 1 of the Trail, the amenities building and design of the Reserve upgrade at Middle Creek (Stage 2A) were completed. A preferred route for Stage 2B has been established.
Stormwater and flood control The hydraulic model for Dee Why CBD indicated greater flooding than anticipated. Council has approved a further Flood Study and investigation into a detention basin for the upper catchment. A design contract for the Collaroy stormwater outlet pipe was awarded and survey work commenced.
Dee Why Creek Cycleway The Cycleway was completed and the formal opening is scheduled for 19 November 2011. Bushland and Pest Species Projects The Friends of the Bush Code of Practice was adopted. All bushland restoration and fire management access zone contracts are underway. Four bush fire hazard reductions burns were completed. The first round of fox control under the Fox Threat Abatement Plan was completed. Coastal Zone and Flood Mitigation Projects The Draft Coastal Erosion Emergency Action Subplan was submitted to the Minister for the Environment. Construction works commenced for the Narrabeen Lagoon Entrance Clearance project. Stage 1 of the Narrabeen Lagoon Flood Study and Manly Lagoon Flood Study, consisting of a data review and community consultation, are nearing completion.
Stormwater Assets and Development Engineering The ‘Development Engineering’ and ‘Stormwater Assets’ Teams were successfully integrated, improving effectiveness and efficiency, including improvements to the DA referral process.
Renewal works under the Emergency Stormwater Works Program during this quarter include completion of the collapsed road/drainage upgrade works at Norfolk Ave, Collaroy; pit enlargement at Brighton Street, Freshwater; and drainage renewal works at Clontarf Street, North Balgowlah. Stormwater design plans were completed for drainage works at Notting Lane, Cottage Point and at Owen Stanley Avenue, Allambie Heights.
30

Parks Reserves And Foreshores Financials
September 2011 Quarterly Report by Service
Parks, Reserves & Foreshores
YTD YTD YTD Annual Approved CurrentActual Forecast Variance Budget Forecast Forecast
$ $ $ $ $ $
Income From Continuing OperationsRates and Annual Charges 2,468,239 2,468,239 - 9,392,998 9,392,998 9,419,938 User Charges & Fees 95,816 79,759 16,057 327,259 327,259 327,259 Investment Fees and Revenues - - - - - - Other Revenues - - - - - - Grants and Contributions - Operating Purposes 14,408 - 14,408 - - 15,000 Grants and Contributions - Capital Purposes - - - - - - Gains on disposal of Assets - - - - - -
Total Income From Continuing Operations 2,578,462 2,547,998 30,465 9,720,257 9,720,257 9,762,197
Expenses From Continuing OperationsEmployee Benefits & Oncosts (941,389) (991,780) 50,390 (3,689,778) (3,689,778) (3,584,778) Borrowing Costs - - - - - - Materials and Contracts (807,627) (1,003,596) 195,969 (3,841,414) (3,866,414) (3,993,354) Depreciation and Amortisat ion - - - - - - Other Expenses (43,687) (11,777) (31,910) (55,512) (55,512) (75,512) Loss on Disposal of Assets - Share of Interest In Joint Venture - - - - - - Internal Charges (108,811) (105,088) (3,722) (390,527) (390,527) (390,527) Overhead Allocation (435,756) (435,756) - (1,743,026) (1,743,026) (1,743,026)
Total Expenses From Continuing Operations (2,337,270) (2,547,998) 210,727 (9,720,257) (9,745,257) (9,787,197)
Surplus / (Deficit) from Continuing Operations 241,192 - 241,192 - (25,000) (25,000)
Year to Date Actuals and Annual Forecast
The Surplus from Continuing Operations at the end of the first quarter relates to both higher than anticipated income and lower than anticipated expenses. The higher than anticipated income relates to a grant from Sydney Water for the Irrigation and Landscape Efficiency Project Stage 2 and venue hire income which is principally due to timing differences. The lower than anticipated expenses relates to lower Employee Benefits & OnCosts due to vacancies which have now been filled, lower than anticipated Materials & Contracts expenditure principally due to timing differences offset by higher than anticipated Other Expenses due to additional agency costs used to cover vacant positions. Total Income from Continuing Operations has been forecast to increase by $41,940. Rates and Annual Charges have been increased by $26,940 reflecting a transfer from
Community & Safety in relation to grounds maintenance. Grants and Contributions – Operating purposes have been forecast to increase by $15,000 due
to the additional capital grant noted above. Total Expenses from Continuing Operations have been forecast to increase by $41,940. Employee Benefits and OnCosts are forecast to decrease by $105,000 due to vacancies. Materials & Contracts have been forecast to increase by $126,940 for additional ground
maintenance expenditure of which $26,940 represents a reallocation of funds from Community & Safety Services
Other Expenses have been forecast to increase by $20,000 for agency costs noted above. The net annual forecast is a Deficit from Continuing Operations of $25,000 which is a result of Council Resolution 262/11 on 27 September 2011 allocating $25,000 towards the urgent and necessary maintenance of cricket pitch facilities.
31

Parks Reserves And Foreshores Progress Capital Works and Key Initiatives
22 Action at least 90% of target
1 Actions between 70 and 90% of
Action target achieved
0 Actions less than 70% of target
Total 23 Actions
96%
4%
The majority of actions are on schedule. The South Curl Curl rock pool has been delayed due to bad weather and unfavourable sea conditions. Key Highlights Maintenance Delivery Seasonal sporting change over from winter to summer sporting codes has now been completed. A large renovation program is planned with users and maintenance workloads redistributed which will result in improvements to the service being delivered. Asset Management The Sporting Club Capital Assistance Grant 2012 process attracted over $1 million worth of applications, making it the most competitive grant process yet. Council will fund $250,000 of new capital projects. John Fisher Park Field 3 and Nolans Reserve Lighting Stage One projects have been completed and are operating. This will provide Australian Standard lighting for four sporting fields across these regional facilities. The difficult renovation of South Curl Curl Rock Pool is progressing well, considering initial supplier and weather delays. Weldon Oval has been sand slitted to improve drainage. Three new playgrounds were completed and opened at Cook Reserve in Forestville, Costa Reserve in Frenchs Forest and Palomar Reserve in Freshwater.
32
Roads, Traffic and Waste Financials
September 2011 Quarterly Report by ServiceRoads, Traffic & Waste
YTD YTD YTD Annual Approved CurrentActual Forecast Variance Budget Forecast Forecast
$ $ $ $ $ $
Income From Continuing OperationsRates and Annual Charges 6,635,605 6,472,666 162,939 26,912,404 26,912,404 27,062,404 User Charges & Fees 835,283 473,315 361,968 1,900,339 1,900,339 2,400,339 Investment Fees and Revenues 8,227 - 8,227 - - - Other Revenues 4,263 - 4,263 882,000 882,000 882,000 Grants and Contributions - Operating Purposes 314,822 305,828 8,994 2,049,907 2,049,907 2,199,907 Grants and Contributions - Capital Purposes 447,000 445,500 1,500 969,927 969,927 969,927 Gains on disposal of Assets - - - - - -
Total Income From Continuing Operations 8,245,200 7,697,309 547,891 32,714,577 32,714,577 33,514,577
Expenses From Continuing OperationsEmployee Benefits & Oncosts (1,105,703) (1,231,219) 125,515 (4,589,116) (4,589,116) (4,589,116) Borrowing Costs - - - - - - Materials and Contracts (4,582,617) (4,351,990) (230,626) (18,927,134) (18,927,134) (19,557,134) Depreciation and Amortisation (883,134) (883,134) - (3,532,537) (3,532,537) (3,532,537) Other Expenses (456,234) (448,455) (7,778) (2,556,548) (2,556,548) (2,576,548) Loss on Disposal of Assets - Share of Interest In Joint Venture - - - - - - Internal Charges (216,765) (216,951) 186 (847,004) (847,004) (847,004) Overhead Allocation (565,560) (565,560) - (2,262,238) (2,262,238) (2,262,238)
Total Expenses From Continuing Operations (7,810,012) (7,697,309) (112,703) (32,714,577) (32,714,577) (33,364,577)
Surplus / (Deficit) from Continuing Operations 435,188 - 435,188 - - 150,000
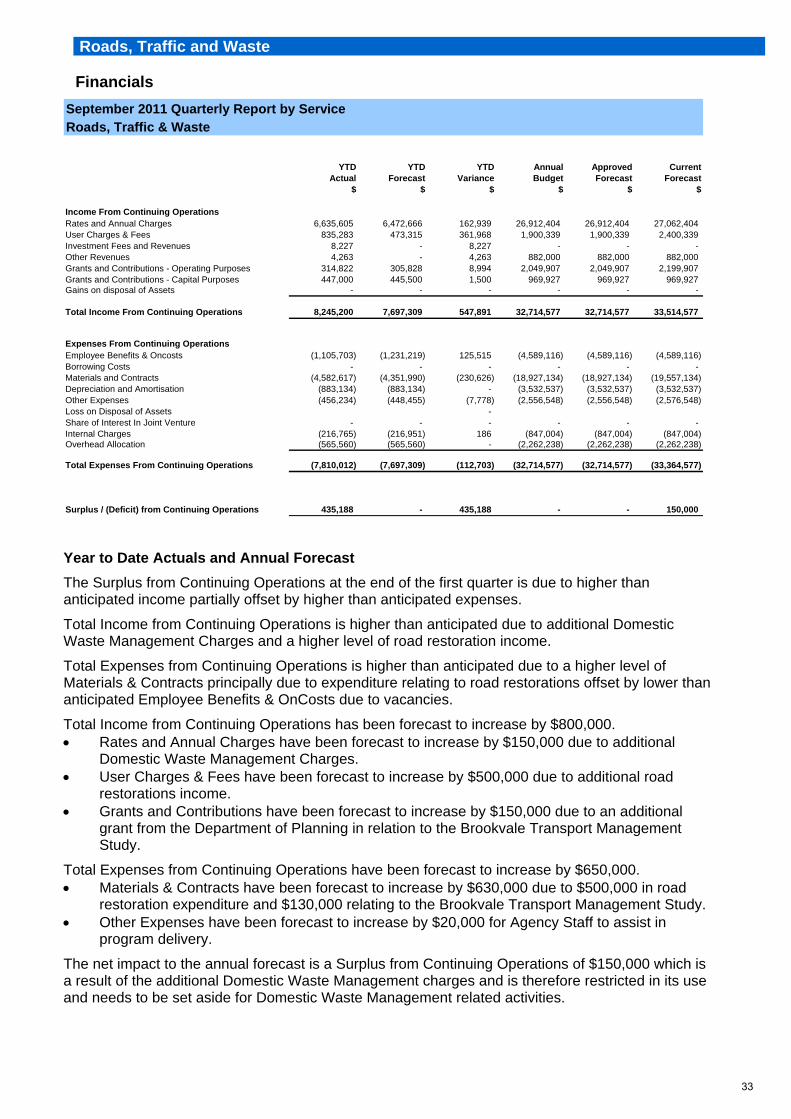
Year to Date Actuals and Annual Forecast
The Surplus from Continuing Operations at the end of the first quarter is due to higher than anticipated income partially offset by higher than anticipated expenses.
Total Income from Continuing Operations is higher than anticipated due to additional Domestic Waste Management Charges and a higher level of road restoration income.
Total Expenses from Continuing Operations is higher than anticipated due to a higher level of Materials & Contracts principally due to expenditure relating to road restorations offset by lower than anticipated Employee Benefits & OnCosts due to vacancies.
Total Income from Continuing Operations has been forecast to increase by $800,000. Rates and Annual Charges have been forecast to increase by $150,000 due to additional
Domestic Waste Management Charges. User Charges & Fees have been forecast to increase by $500,000 due to additional road
restorations income. Grants and Contributions have been forecast to increase by $150,000 due to an additional
grant from the Department of Planning in relation to the Brookvale Transport Management Study.
Total Expenses from Continuing Operations have been forecast to increase by $650,000. Materials & Contracts have been forecast to increase by $630,000 due to $500,000 in road
restoration expenditure and $130,000 relating to the Brookvale Transport Management Study. Other Expenses have been forecast to increase by $20,000 for Agency Staff to assist in
program delivery.
The net impact to the annual forecast is a Surplus from Continuing Operations of $150,000 which is a result of the additional Domestic Waste Management charges and is therefore restricted in its use and needs to be set aside for Domestic Waste Management related activities.
33

Roads, Traffic and Waste Progress Capital Works and Key Initiatives
20 Action at least 90% of target
1 Actions between 70 and 90% of
Action target achieved
0 Actions less than 70% of target
Total 21 Actions
95%
0% 5%
The majority of actions are on schedule. The Strand Dee Why streetscape has been delayed due to unfavourable weather conditions. Key Highlights During the last quarter, the Works team completed 1,455 roads and drainage maintenance tasks and the after hour emergency response officers received 177 calls for assistance. 33 of these required attendance by the officer. Council completed the Lagoon View Road retaining wall in July. The 2011 - 2012 Road Asset Renewal Program commenced including the Road Re-sheeting Program. New footpaths were also completed in Park Street and Brighton Street in Curl Curl, Water Reserve Road in North Balgowlah and Rabbett Street in Frenchs Forest The Traffic team commissioned a consultant to commence the Brookvale and Dee Why Major Centres Transport Management and Accessibility Study . There were three (3) Traffic Committee Meetings during the quarter where 60 reports were prepared by staff and considered by the committee. Traffic projects were submitted to the RTA for possible grant funding in the Roads and Traffic Authorities 2012 - 2013 Program. Public consultation on current traffic projects in the 2011 - 2012 Capital Expenditure Program was also undertaken in this quarter. A Chemical CleanOut event was held in Allambie Heights at the Aquatic Centre Car park over the weekend of 3rd and 4th September 2011. The event ran very smoothly and was attended by 2,097 vehicles and recovered just over 70 tonnes of chemicals for safe disposal or recycling. Approximately 66% was paint. 2,253 graffiti incidents were removed totalling approximately 4,050 square metres of graffiti removed in the quarter. 15,734 tonnes of household waste was collected from Warringah residents, of which 54% (8,412 tonnes) was recycled through Kimbriki.
34

Strategic Planning Financials
September 2011 Quarterly Report by Service
Strategic Planning
YTD YTD YTD Annual Approved CurrentActual Forecast Variance Budget Forecast Forecast
$ $ $ $ $ $
Income From Continuing OperationsRates and Annual Charges 503,218 503,218 - 1,984,589 1,984,589 1,984,589 User Charges & Fees 136,116 86,633 49,482 420,831 420,831 420,831 Investment Fees and Revenues - - - - - - Other Revenues - 17,500 (17,500) 70,000 70,000 70,000 Grants and Contributions - Operating Purposes 2,727 - 2,727 - - - Grants and Contributions - Capital Purposes - - - - - - Gains on disposal of Assets - - - - - -
Total Income From Continuing Operations 642,061 607,351 34,710 2,475,420 2,475,420 2,475,420
Expenses From Continuing OperationsEmployee Benefits & Oncosts (349,788) (379,460) 29,672 (1,405,962) (1,391,784) (1,391,784) Borrowing Costs - - - - - - Materials and Contracts (25,740) (40,592) 14,853 (314,096) (378,274) (378,274) Depreciation and Amortisation - - - - - - Other Expenses (17,700) (12,722) (4,979) (62,904) (62,904) (62,904) Loss on Disposal of Assets - Share of Interest In Joint Venture - - - - - - Internal Charges (21,213) (20,492) (721) (76,118) (76,118) (76,118) Overhead Allocation (154,085) (154,085) - (616,340) (616,340) (616,340)
Total Expenses From Continuing Operations (568,527) (607,351) 38,825 (2,475,420) (2,525,420) (2,525,420)
Surplus / (Deficit) from Continuing Operations 73,534 - 73,534 - (50,000) (50,000)
Year to Date Actuals and Annual Forecast
The Surplus from Continuing Operations at the end of the first quarter relates to both higher than anticipated income and lower than anticipated expenses. The higher than anticipated income relates to additional income from s149 Certificates. Although this is trending higher there is insufficient transparency at this time to make a forecast change for the full financial year. The lower than anticipated expenses are principally due to timing differences. The net annual forecast is a Deficit from Continuing Operations of $50,000 which is a result of Council Resolution 262/11 on 27 September 2011 allocating $50,000 towards economic development projects.
35

Strategic Planning Progress Capital Works and Key Initiatives
13 Key Initiatives at least 90% of target
0 Key Initiatives between 70 and 90% of
Action target achieved
0 Key Initiatives less than 70% of target
Total 13 Actions
0%
100%
All activities are on schedule. Key Highlights Mountain biking Approximately 1,600 people participated in an online survey of riders which was aimed at collecting demographic and participation data. A follow up meeting was held with mountain bike clubs and some randomly selected mountain bikers who indicated an interest in further involvement via the online survey. The meeting provided an opportunity to discuss the survey results and the opportunities identified for increasing the provision of facilities in Warringah. The input from riders has subsequently been incorporated into the research document. Community gardens A random and representative telephone survey of 600 people was undertaken in July 2011 to identify the level of demand for community gardens within Warringah. Council also offered an online survey and an online discussion forum on the Your Say Warringah website from August through September 2011. There were 186 completed online surveys and a total of 76 comments with 44 registered participants in the online forum. Both the telephone and online surveys and the discussion forum indicate a high level of support for community gardens in Warringah.
36

Warringah Aquatic Centre Financials
September 2011 Quarterly Report by ServiceWarringah Aquatic Centre
YTD YTD YTD Annual Approved CurrentActual Forecast Variance Budget Forecast Forecast
$ $ $ $ $ $
Income From Continuing OperationsRates and Annual Charges 596,315 596,315 - 1,732,899 1,732,899 1,778,899 User Charges & Fees 474,320 429,482 44,838 2,097,891 2,097,891 2,097,891 Investment Fees and Revenues - - - - - - Other Revenues 47,698 49,245 (1,547) 211,000 211,000 211,000 Grants and Contributions - Operating Purposes - - - - - - Grants and Contributions - Capital Purposes - - - - - - Gains on disposal of Assets - - - - - -
Total Income From Continuing Operations 1,118,334 1,075,043 43,291 4,041,790 4,041,790 4,087,790
Expenses From Continuing OperationsEmployee Benefits & Oncosts (552,337) (571,379) 19,042 (2,138,647) (2,138,647) (2,138,647) Borrowing Costs (841) - (841) - - - Materials and Contracts (122,876) (155,549) 32,673 (509,324) (509,324) (509,324) Depreciation and Amortisation (61,861) (61,650) (211) (246,605) (246,605) (246,605) Other Expenses (107,629) (70,061) (37,568) (283,867) (283,867) (329,867) Loss on Disposal of Assets - Share of Interest In Joint Venture - - - - - - Internal Charges (10,190) (9,080) (1,110) (34,051) (34,051) (34,051) Overhead Allocation (207,324) (207,324) - (829,296) (829,296) (829,296)
Total Expenses From Continuing Operations (1,063,059) (1,075,043) 11,983 (4,041,790) (4,041,790) (4,087,790)
Surplus / (Deficit) from Continuing Operations 55,274 - 55,274 - - -
Year to Date Actuals and Annual Forecast
The Surplus from Continuing Operations at the end of the first quarter is principally due to both higher than anticipated income and lower than anticipated expenses. Total Income from Continuing Operations is higher than anticipated due to additional Child and Adult Swim revenue as a result of the closure of Hornsby pool, timing of facility hire income offset by lower than anticipated Learn to Swim income due to a shortage of Learn to Swim teachers. The Learn to Swim teachers have now been appointed so this trend is now positive with class numbers increasing and as a result there has been no change for this in the full year forecast at this point. Total Expenses from Continuing Operations is lower than anticipated due to the shortage of Learn to Swim teacher noted offset by additional costs associated with the reception realignment. While there is no change in the anticipated Surplus/(Deficit) from Continuing Operations, Total Expenses from Continuing Operations have been increased by $46,000 due to additional electricity charges offset by an additional Rates allocation.
37

Warringah Aquatic Centre Progress Capital Works and Key Initiatives
5 Action at least 90% of target
0 Actions between 70 and 90% of
Action target achieved
0 Actions less than 70% of target
Total 5 Actions
0%
100%
All actions are on schedule. Key Highlights Water consumption is now averaging less than 140 kilo litres per week which is down from 360 kilo litres per week prior to implementation of water saving measure. This gives a percentage saving of over 60%. The WAC has also been used as an example of best practice for water saving in the Sydney Water manual for water saving at aquatic facilities.
38
Corporate Support Services Financials
September 2011 Quarterly Report by ServiceCorporate Support
YTD YTD YTD Annual Approved Current
Actual Forecast Variance Budget Forecast Forecast
$ $ $ $ $ $
Income From Continuing OperationsRates and Annual Charges 2,460,839 2,182,811 278,028 8,731,244 8,731,244 8,617,294
User Charges & Fees 605,004 647,655 (42,651) 2,509,979 2,509,979 2,509,979
Investment Fees and Revenues 1,263,567 1,194,932 68,635 4,326,848 4,326,848 4,326,848
Other Revenues 574,141 479,030 95,112 2,053,214 2,053,214 2,103,214
Grants and Contributions - Operating Purposes - - - 803,000 803,000 803,000
Grants and Contributions - Capital Purposes 1,102,009 624,750 477,259 2,500,000 2,500,000 2,500,000
Gains on disposal of Assets 11,934 40,000 (28,066) 160,000 160,000 160,000
Total Income From Continuing Operations 6,017,495 5,169,177 848,317 21,084,285 21,084,285 21,020,335
Expenses From Continuing OperationsEmployee Benefits & Oncosts (4,531,861) (4,686,893) 155,032 (18,154,714) (18,154,714) (17,994,714)
Borrowing Costs (25,707) (18,957) (6,750) (305,948) (305,948) (305,948)
Materials and Contracts (2,767,893) (2,965,560) 197,666 (10,560,060) (10,560,060) (10,580,060)
Depreciation and Amortisation (1,360,748) (1,251,681) (109,067) (5,306,956) (5,306,956) (5,306,956)
Other Expenses (1,126,410) (924,823) (201,587) (3,518,322) (3,518,322) (3,528,322)
Loss on Disposal of Assets -
Share of Interest In Joint Venture (159,032) (150,346) (8,687) (601,383) (601,383) (601,383)
Internal Charges 969,940 956,607 13,333 3,723,162 3,723,162 3,723,162
Overhead Allocation 4,156,311 4,156,311 - 16,625,244 16,625,244 16,625,244
Total Expenses From Continuing Operations (4,845,401) (4,885,342) 39,941 (18,098,977) (18,098,977) (17,968,977)
Surplus / (Deficit) from Continuing Operations 1,172,094 283,836 888,258 2,985,308 2,985,308 3,051,358
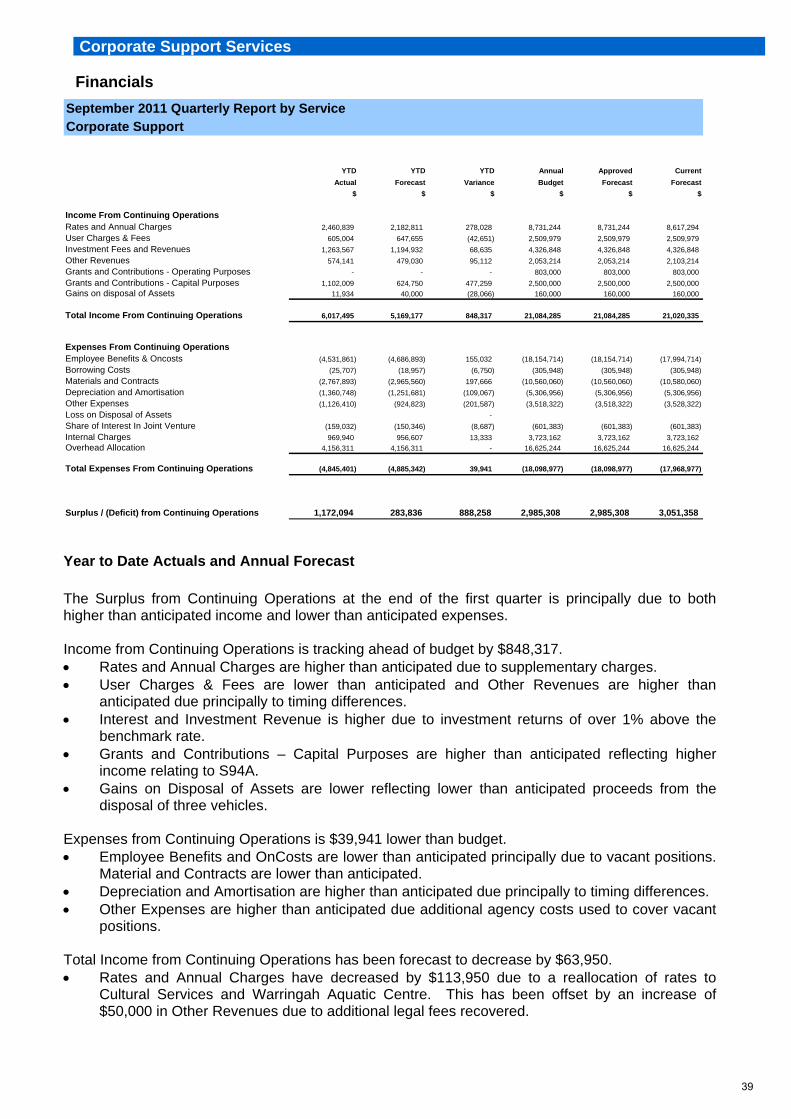
Year to Date Actuals and Annual Forecast
The Surplus from Continuing Operations at the end of the first quarter is principally due to both higher than anticipated income and lower than anticipated expenses. Income from Continuing Operations is tracking ahead of budget by $848,317. Rates and Annual Charges are higher than anticipated due to supplementary charges. User Charges & Fees are lower than anticipated and Other Revenues are higher than
anticipated due principally to timing differences. Interest and Investment Revenue is higher due to investment returns of over 1% above the
benchmark rate. Grants and Contributions – Capital Purposes are higher than anticipated reflecting higher
income relating to S94A. Gains on Disposal of Assets are lower reflecting lower than anticipated proceeds from the
disposal of three vehicles. Expenses from Continuing Operations is $39,941 lower than budget. Employee Benefits and OnCosts are lower than anticipated principally due to vacant positions.
Material and Contracts are lower than anticipated. Depreciation and Amortisation are higher than anticipated due principally to timing differences. Other Expenses are higher than anticipated due additional agency costs used to cover vacant
positions. Total Income from Continuing Operations has been forecast to decrease by $63,950. Rates and Annual Charges have decreased by $113,950 due to a reallocation of rates to
Cultural Services and Warringah Aquatic Centre. This has been offset by an increase of $50,000 in Other Revenues due to additional legal fees recovered.
39

Corporate Support Services Financials
Total Expenses from Continuing Operations has been forecast to decrease by $130,000. Employee Benefits and OnCosts have been forecast to decrease by $160,000 due principally
to the vacant positions noted above and a reallocation of budget to Materials & Contracts and Other Expenses.
The net result is an increase in the Surplus from Continuing Operations by $66,050 to $3,051,358.
40

Corporate Support Services Progress Capital Works and Key Initiatives
The majority of actions are on schedule. The commencement of renewal of Brookvale children’s centre bathroom is dependent on the completion of the occasional care centre project due to logistical issues. The Long reef surf life saving club design and development application is delayed as the project is on hold by Council resolution. Key Highlights Customer Support Service Despite being down two full time equivalents (FTE’s), the Customer Service Centre maintained acceptable service levels for the quarter at 78%. The Community Database (NAR) Improvement Program is starting to take traction and to date, over 30,000 records have been updated. Our E-Services scheme has been implemented and a small increase of online customer requests has been realised with same day turnaround. The Planning and Development Services counter has also experienced a significant improvement in overall service levels. Turnaround times for applications is now within 3 days (from an average of 8 days six months ago). Business Excellence The first Business Excellence Self Assessment was undertaken delivering a positive result which indicated Council was at a Foundational level of excellence. This was done in readiness to inform the Corporate Plan for 2012 - 2013. Business and Enterprise Risk In the last quarter we have been developing the Enterprise Risk Management System framework which included internal consultation with key stakeholders (Legal and Finance) and will be fully compliant with AS31010. Further consultation will be undertaken next quarter with Internal Audit and Ombudsman, the Executive Team and Leadership Group. Our Business Continuity (BC) staff have been working with key operational staff in the organisation to further develop their BC Plans and concise Incident Management Plans for all business units. Finance We are incorporating new schedules mandated by the DLG into our reporting framework. Marketing and Communications Over this period, the media team put out 69 media releases and alerts, resulting in positive coverage in the Manly Daily, The Telegraph, Peninsula Living and The Australian. The strategy of setting up more photo opportunities and releasing more photos has increased the uptake of positive stories by the media. The team also promoted the launch of Council’s E-Services and has promoted several public exhibitions.
51 Action at least 90% of target
1 Actions between 70 and 90% of
Action target achieved
1 Actions less than 70% of target
Total 53 Actions
2%
96%
2%
41
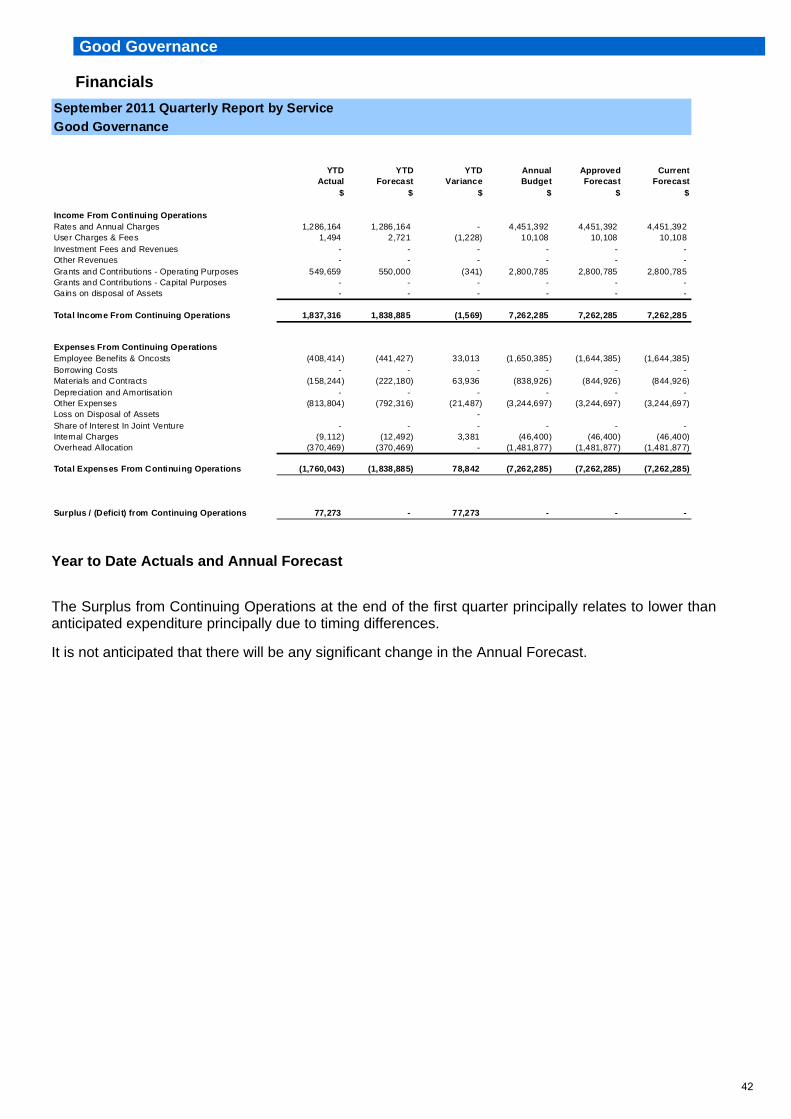
Good Governance Financials
September 2011 Quarterly Report by Service
Good Governance
YTD YTD YTD Annual Approved CurrentActual Forecast Variance Budget Forecast Forecast
$ $ $ $ $ $
Income From Continuing OperationsRates and Annual Charges 1,286,164 1,286,164 - 4,451,392 4,451,392 4,451,392 User Charges & Fees 1,494 2,721 (1,228) 10,108 10,108 10,108 Investment Fees and Revenues - - - - - - Other Revenues - - - - - - Grants and Contributions - Operating Purposes 549,659 550,000 (341) 2,800,785 2,800,785 2,800,785 Grants and Contributions - Capital Purposes - - - - - - Gains on disposal of Assets - - - - - -
Total Income From Continuing Operations 1,837,316 1,838,885 (1,569) 7,262,285 7,262,285 7,262,285
Expenses From Continuing OperationsEmployee Benefits & Oncosts (408,414) (441,427) 33,013 (1,650,385) (1,644,385) (1,644,385) Borrowing Costs - - - - - - Materials and Contracts (158,244) (222,180) 63,936 (838,926) (844,926) (844,926) Depreciation and Amortisation - - - - - - Other Expenses (813,804) (792,316) (21,487) (3,244,697) (3,244,697) (3,244,697) Loss on Disposal of Assets - Share of Interest In Joint Venture - - - - - - Internal Charges (9,112) (12,492) 3,381 (46,400) (46,400) (46,400) Overhead Allocation (370,469) (370,469) - (1,481,877) (1,481,877) (1,481,877)
Total Expenses From Continuing Operations (1,760,043) (1,838,885) 78,842 (7,262,285) (7,262,285) (7,262,285)
Surplus / (Deficit) from Continuing Operations 77,273 - 77,273 - - -
Year to Date Actuals and Annual Forecast
The Surplus from Continuing Operations at the end of the first quarter principally relates to lower than anticipated expenditure principally due to timing differences.
It is not anticipated that there will be any significant change in the Annual Forecast.
42

Good Governance Progress Capital Works and Key Initiatives
9 Key Initiatives at least 90% of target
0 Key Initiatives between 70 and 90% of
Action target achieved
0 Key Initiatives less than 70% of target
Total 9 Actions
0%
100%
All activities are on schedule. Key Highlights Key Documents and policies Key documents completed and approved include the Annual Report 2010 -2011, Strategic Community Plan for 2011-2012, and the schedule of Fees & Charges for 2011-2012. The SHOROC Governance Policy was adopted. Documents placed on exhibition included the Code of Meeting Practice; and Policy for Payment and Re-imbursement of Expenses (Incurred by, and Provision of Facilities to, The Mayor, Deputy Mayor and Councillors). Community Engagement The results from the annual community survey were finalised and adopted by Council. Results showed an increase in overall satisfaction from 57% in 2010 to 67% in 2011, now back in line with 2009 and 2008 results. The results will be incorporated into the business planning process. Council’s Leadership Group approved the roll-out of community engagement training across the organisation. There are a number of different sessions being developed to support staff at all levels and the first sessions are being delivered in November 2011. Engaging Business - Small Business September - Warringah & Pittwater Over 150 businesses attended 3 local seminars to celebrate the second year of this State wide event, with speakers focusing on the growth and needs of small business. Council received a financial assistance grant from NSW Trade & Investment to support this series. The collaborative, free seminars covered: Trades Business, Legal Risks for owners and Sales Success Strategies. More than 90% of feedback rated the seminars excellent for the topics and calibre of speaker. Local Government Reform Warringah commissioned a discussion paper to be prepared on the implications and options for Warringah’s future. The paper examines the pressures on local government, the need for change, and options for Warringah such as strengthening shared services in the SHOROC region, and voluntary amalgamation in this region and beyond. An 8-week public exhibition period commenced. The NSW Government is also driving reform, under the Destination 2036 initiative of the Division of Local Government. Council has been engaged in this process, with the Mayor and General Manager attending a high-level workshop in Dubbo in August for all 152 Councils in the State, which will help lead to the development of an Action Plan for NSW commencing early in 2012.
43

Additional Financial disclosures
Quarter ending 30 September 2011 Following statements are attached;
Consolidated income and expenses budget review statement Income and expense budget review statement by service Capital budget statement Cash & investment statement Financial performance indicators Budget review contract Consultancy and Legal expenses
44

Original Budget(000's)
Changes Already
Approved By Council(000's)
Approved Forecast(000's)
Recommended changes for
Council Resolution
(000's)Current Forecast
(000's)Actual YTD
(000's)
Income from Continuing OperationsRates & Annual Charges 82,872 - 82,872 150 83,022 21,744 User Charges & Fees 37,293 - 37,293 305 37,598 9,543 Interest & Investment Revenues 4,687 - 4,687 16 4,703 1,492 Other Revenues 8,003 - 8,003 (126) 7,877 1,407 Grants & Contributions - Operating Purposes 7,134 - 7,134 283 7,417 1,109 Grants & Contributions - Capital Purposes 3,861 - 3,861 (125) 3,736 1,549 Gains on Disposal of Assets 160 - 160 - 160 12 Total Income from Continuing Operations 144,010 - 144,010 503 144,512 36,856
Expenses from Continuing OperationsEmployee Benefits & On-Costs (57,497) - (57,497) 551 (56,946) (14,313) Borrowing Costs (306) - (306) - (306) (27) Materials & Contracts (50,890) (110) (51,000) (772) (51,772) (11,833)
Depreciation & Amortisation (13,889) - (13,889) 19 (13,870) (3,459)
Other Expenses (15,642) - (15,642) (164) (15,806) (4,008)
Loss on Disposal of Assets - - - - - -
Share of Interest in Joint Ventures (601) - (601) - (601) (159)
Internal Charges - - - - - -
Overhead Allocation - - - - - -
Total Expenses from Continuing Operations (138,826) (110) (138,936) (367) (139,303) (33,798)
Surplus / (Deficit) from Continuing Operations 5,184 (110) 5,074 136 5,210 3,059
Budget review for the quarter ended - 30 September 2011Warringah Council
Consolidated Income and Expenses Budget Review Statement
45

Original Budget (000's)
Changes Already
Approved By Council (000's)
Approved Forecast (000's)
Recommended changes for
Council Resolution (000's)
Current Forecast (000's)
Actual YTD (000's)
Income
Certification 896 - 896 - 896 224
Children's Services 6,689 - 6,689 127 6,816 1,721 Community & Safety 6,723 - 6,723 (141) 6,582 1,644
Compliance 5,990 - 5,990 - 5,990 1,177
Corporate Support 21,084 - 21,084 (64) 21,020 6,017
Cultural Services 898 - 898 43 941 199 Development Assessment 6,132 - 6,132 - 6,132 1,615
Glen Street Theatre 3,619 - 3,619 (343) 3,276 845
Good Governance 7,262 - 7,262 - 7,262 1,837
Information & Library 6,346 - 6,346 - 6,346 1,642 Kimbriki 19,988 - 19,988 - 19,988 5,225
Natural Environment 10,989 - 10,989 (7) 10,982 2,523
Parks, Reserves & Foreshores 9,720 - 9,720 42 9,762 2,578
Roads, Traffic & Waste 32,715 - 32,715 800 33,515 8,245 Strategic Planning 2,475 - 2,475 - 2,475 642
Warringah Aquatic Centre 4,042 - 4,042 46 4,088 1,118
Inter Service Eliminat ions (1,560) - (1,560) - (1,560) (398)
Total Income 144,010 - 144,010 503 144,512 36,856
Expenses
Certification (896) - (896) - (896) (244)
Children's Services (6,689) - (6,689) (127) (6,816) (1,734)
Community & Safety (6,723) - (6,723) 246 (6,477) (1,461)
Compliance (5,990) - (5,990) - (5,990) (1,270) Corporate Support (18,099) - (18,099) 130 (17,969) (4,845)
Cultural Services (898) (15) (913) (43) (956) (213)
Development Assessment (6,132) (20) (6,152) - (6,152) (1,544)
Glen Street Theatre (3,619) - (3,619) 343 (3,276) (837) Good Governance (7,262) - (7,262) - (7,262) (1,760)
Information & Library (6,346) - (6,346) - (6,346) (1,668)
Kimbriki (17,790) - (17,790) - (17,790) (4,347) Natural Environment (10,989) - (10,989) (178) (11,167) (2,495)
Parks, Reserves & Foreshores (9,720) (25) (9,745) (42) (9,787) (2,337)
Roads, Traffic & Waste (32,715) - (32,715) (650) (33,365) (7,810)
Strategic Planning (2,475) (50) (2,525) - (2,525) (569) Warringah Aquatic Centre (4,042) - (4,042) (46) (4,088) (1,063)
Inter Service Eliminat ions 1,560 - 1,560 - 1,560 398
Total Expenses (138,826) (110) (138,936) (367) (139,303) (33,798)
Surplus / (Deficit) from Continuing Operations 5,184 (110) 5,074 136 5,210 3,059
Budget review for the quarter ended - 30 September 2011Warr ingah Council
Income and Expenses Budget Review Statement by Service
46

Original Budget(000's)
Changes Already
Approved By Council(000's)
Approved Forecast(000's)
Recommended changes for
Council Resolution
(000's)
Current Forecast (000's)
Actual YTD (000's)
Capital Funding
Rates & Other Untied Funding
Working Capital 7,420 222 7,642 (1,332) 6,310 869 Depreciation 9,633 208 9,841 143 9,984 1,135
Capital Grants & Contributions 3,271 - 3,271 - 3,271 666
External Restrict ions
- S94 1,352 224 1,576 - 1,576 149 - S94A 2,503 - 2,503 (25) 2,478 22
- ESSR Levy 1,203 17 1,220 (22) 1,198 139
- Infrastructure Levy 4,393 155 4,548 (69) 4,479 92
- Sportsfield Levy 2,395 96 2,491 - 2,491 79 Internal Restrictions
- Other 623 - 623 - 623 -
Income from Sale of Assets
- plant and equipment 1,627 - 1,627 - 1,627 409 - land and buildings - - - - - -
Other - - - - - 231
Total Capital Funding 34,420 922 35,342 (1,305) 34,037 3,791
Capital Expenditure
Plant & Equipment 7,246 200 7,446 115 2,525 697 Office Equipment - - - - 1,202 31
Furniture & fit tings - - - - - -
Operational Land - - - - - -
Community Land 426 - 426 - 250 - Land improvements - - - (1,217) 2,974 409
Buildings 12,044 175 12,219 (181) 9,704 245
Other Structures 6,102 505 6,607 - 7,709 1,119
Roads, Bridges & Footpaths 4,353 - 4,353 - 7,292 975 Stormwater Drainage 3,314 42 3,356 (22) 1,465 167
Library Books 864 - 864 - 864 148
Other Assets 71 - 71 - - -
Total Capital Expenditure 34,420 922 35,342 (1,305) 33,985 3,791
Budget review for the quarter ended - 30 September 2011Warringah Council
Capital Budget Statement
47
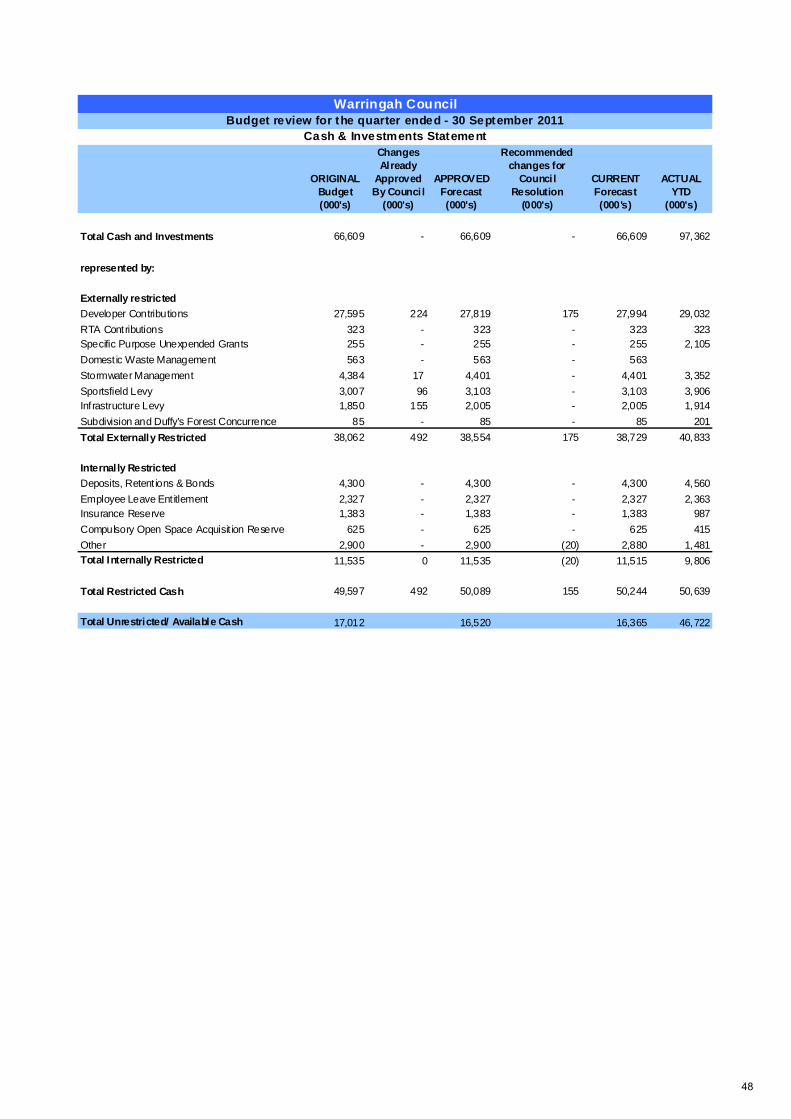
ORIGINAL Budget(000's)
Changes Already
Approved By Council
(000's)
APPROVED Forecast(000's)
Recommended changes for
Council Resolution
(000's)
CURRENT Forecast(000's)
ACTUAL YTD
(000's)
Total Cash and Investments 66,609 - 66,609 - 66,609 97,362
represented by:
Externally restricted
Developer Contributions 27,595 224 27,819 175 27,994 29,032
RTA Contributions 323 - 323 - 323 323Specific Purpose Unexpended Grants 255 - 255 - 255 2,105
Domestic Waste Management 563 - 563 - 563
Stormwater Management 4,384 17 4,401 - 4,401 3,352
Sportsfield Levy 3,007 96 3,103 - 3,103 3,906Infrastructure Levy 1,850 155 2,005 - 2,005 1,914
Subdivision and Duffy's Forest Concurrence 85 - 85 - 85 201
Total Externally Restricted 38,062 492 38,554 175 38,729 40,833
Internally Restricted
Deposits, Retent ions & Bonds 4,300 - 4,300 - 4,300 4,560
Employee Leave Entitlement 2,327 - 2,327 - 2,327 2,363Insurance Reserve 1,383 - 1,383 - 1,383 987
Compulsory Open Space Acquisit ion Reserve 625 - 625 - 625 415
Other 2,900 - 2,900 (20) 2,880 1,481
Total Internally Restricted 11,535 0 11,535 (20) 11,515 9,806
Total Restricted Cash 49,597 492 50,089 155 50,244 50,639
Total Unrestricted/ Available Cash 17,012 16,520 16,365 46,722
Budget review for the quarter ended - 30 September 2011Warringah Council
Cash & Investments Statement
48

Indicator # 1 - Cash / Liquidity Position - after accounting for external reserves
Indicator Title: Unrestricted Current Ratio
Indicator Definition:
Indicator / Local Government Benchmark: Greater than 2:1Between 1:1 and 2:1Less than 1:1Successive years > 10:1
Actual30 June 2011
Budget30 June 2012
2.74 2.46
Commentary:
Indicator # 2 - Operating Result - using trend analysis
Indicator Title: Result from Continuing Operations before Capital Grants & Contributions
Indicator Definition: Result from ordinary operations before the receipt of Capital Grants and Contributions
ie. Operating Result after depreciation
Indicator / Local Government Benchmark: Three (3) years of successive surplusesSurplusDeficit
Actual30 June 2011
$'000
Budget30 June 2012
$'000
2,266 1,323
Commentary:
Indicator # 3 - Asset Renewal Expenditure
Indicator Title: Asset Renewal Ratio
Indicator Definition: Capital Renewal Capacity - amount of funds spent on renewing assets (as opposed to maintaining them) = Capital Expenditure on Existing Assets/Annual Depreciation
Indicator / Local Government Benchmark: 1 to 1Less than 1:1
Actual30 June 2011
Budget30 June 2012
1.65 1.35
Commentary:
During the first quarter of the financial year Council undertakes the planning and scoping phases of its Capital W orks Program. So while capital renewal expenditure is tracking behind depreciation at the end of the first quarter projects are in line with forecast and Council will achieve a positive Asset Renewal Ratio for the full financial year.
Actual30 Sept 2011
0.57
Council's liquidity is more than satisfactory. Council can easily pay its debts as they fall due. The high ratio at the end of the first quarter reflects the rates and annual charges having been raised for the full financial year.
OPERATING RESULT
ASSET RENEWAL EXPENDITURE
FINANCIAL PERFORMANCE INDICATORS
Actual30 Sept 2011
6.88
Actual30 Sept 2011
$'000
1,510
CASH / LIQUIDITY POSITION
Council is forecasting a surplus from Continuing Operations before Capital Grants & Contributions for the year ending 30 June 2012. As noted in the Septemeber 2011 QBRS due to timing difference the result is tracking ahead of schedule.
WARRINGAH COUNCIL
Current Assets less Externally Restricted Current AssetsCurrent Liabilities less Specific Purpose Current Liabilities
49

Contractor Contract detail & purpose Contract value Commencement date Duration of contract Budgeted (Y/N)
Griffith Consulting Group Provision of Leadership Program $74,700 17/10/2011 6 months Y
Woolacotts Detailed design of new footpath program $54,000 20/07/2011 6 months Y
GPM Constructions Pty Ltd Narrabeen Lagoon Entrance Cleaning Works $822,438 2/09/2011 6 months Y
Warringah Council Budget review for the quarter ended - 30 September 2011
Budget Review Contracts
Expense Expenditure YTD
$Budgeted
(Y/N)
Consultancies 57,828 Y
Legal Fees 263,459 Y
Consultancy and Legal ExpensesBudget review for the quarter ended - 30 September 2011
Warringah Council
50