Warnock, Christopher and Infield, David (2016)...
15
Warnock, Christopher and Infield, David (2016) Detailed pseudo-static drive train modelling with generator short circuit. Journal of Physics: Conference Series, 753. ISSN 1742-6596 , http://dx.doi.org/10.1088/1742- 6596/753/11/112004 This version is available at https://strathprints.strath.ac.uk/59337/ Strathprints is designed to allow users to access the research output of the University of Strathclyde. Unless otherwise explicitly stated on the manuscript, Copyright © and Moral Rights for the papers on this site are retained by the individual authors and/or other copyright owners. Please check the manuscript for details of any other licences that may have been applied. You may not engage in further distribution of the material for any profitmaking activities or any commercial gain. You may freely distribute both the url ( https://strathprints.strath.ac.uk/ ) and the content of this paper for research or private study, educational, or not-for-profit purposes without prior permission or charge. Any correspondence concerning this service should be sent to the Strathprints administrator: [email protected] The Strathprints institutional repository (https://strathprints.strath.ac.uk ) is a digital archive of University of Strathclyde research outputs. It has been developed to disseminate open access research outputs, expose data about those outputs, and enable the management and persistent access to Strathclyde's intellectual output.
Transcript of Warnock, Christopher and Infield, David (2016)...

Warnock, Christopher and Infield, David (2016) Detailed pseudo-static
drive train modelling with generator short circuit. Journal of Physics:
Conference Series, 753. ISSN 1742-6596 , http://dx.doi.org/10.1088/1742-
6596/753/11/112004
This version is available at https://strathprints.strath.ac.uk/59337/
Strathprints is designed to allow users to access the research output of the University of
Strathclyde. Unless otherwise explicitly stated on the manuscript, Copyright © and Moral Rights
for the papers on this site are retained by the individual authors and/or other copyright owners.
Please check the manuscript for details of any other licences that may have been applied. You
may not engage in further distribution of the material for any profitmaking activities or any
commercial gain. You may freely distribute both the url (https://strathprints.strath.ac.uk/) and the
content of this paper for research or private study, educational, or not-for-profit purposes without
prior permission or charge.
Any correspondence concerning this service should be sent to the Strathprints administrator:
The Strathprints institutional repository (https://strathprints.strath.ac.uk) is a digital archive of University of Strathclyde research
outputs. It has been developed to disseminate open access research outputs, expose data about those outputs, and enable the
management and persistent access to Strathclyde's intellectual output.

This content has been downloaded from IOPscience. Please scroll down to see the full text.
Download details:
IP Address: 130.159.82.39
This content was downloaded on 05/01/2017 at 11:50
Please note that terms and conditions apply.
Detailed Pseudo-Static Drive Train Modelling with Generator Short Circuit
View the table of contents for this issue, or go to the journal homepage for more
2016 J. Phys.: Conf. Ser. 753 112004
(http://iopscience.iop.org/1742-6596/753/11/112004)
Home Search Collections Journals About Contact us My IOPscience

Detailed Pseudo-Static Drive Train Modelling with Generator
Short Circuit
Christopher Warnock, David Infield
CDT Wind Energy Systems, Rm 3.36 University of Strathclyde, 204 George Street,
Glasgow, G1 1XW
Abstract. Drivetrain failures contribute significantly to wind turbine downtime. Although the
root causes of these failures are not yet fully understood, transient events are regarded as an
important contributory factor. Despite extensive drive train modelling, limited work has been
carried out to assess the impact of a generator short circuit on the drivetrain. In most cases, a
generator short circuit is classed as a failure in itself with minimal focus on the subsequent
effects on the gearbox and other drivetrain components. This paper will look to analyse the
loading on the drivetrain for a doubly fed induction generator (DFIG) short circuit event with
turbine ride through using a combination of Simulink, Garrad Hassan’s Bladed and RomaxWind drive train modelling software.
1. Background
As energy generation from offshore wind increases, it is essential that turbine downtime and
maintenance costs are significantly reduced due to loss of generation resulting from limited access to
turbines for repair. In depth analysis of wind turbine systems allows for efficient scheduling of
maintenance, reduction of turbine downtime and optimisation of control strategies.
According to analysis carried out by Spinato and Tavner [1] using Windstats survey data, although
the drivetrain, gearbox and generator’s failure rates are lower than other failure modes such as
electrical systems, the associated downtime is much greater as can be seen in Figure 1.
Figure 1: Reliability and downtime analysis of turbine subassemblies [1]
The Science of Making Torque from Wind (TORQUE 2016) IOP Publishing
Journal of Physics: Conference Series 753 (2016) 112004 doi:10.1088/1742-6596/753/11/112004
Content from this work may be used under the terms of the Creative Commons Attribution 3.0 licence. Any further distribution
of this work must maintain attribution to the author(s) and the title of the work, journal citation and DOI.
Published under licence by IOP Publishing Ltd 1

Work carried out by Sheng with NREL has revealed the components within the drivetrain
contributing most to failures. The High Speed Shaft (HSS) bearing accounts for 48% of failures from a
database of 289 gearbox failure incidents. The data shows that both bearing and gear faults are
concentrated in the parallel stage of the gearbox[2].
The DFIG is presently the most commonly used generator for wind turbines. Extensive modelling
of DFIGs has been undertaken including analysis of short circuits to demonstrate ride through as
required by grid codes. However, this research has focused in the main on the electrical aspects
associated with the fault such as protection, the transient current contribution and local voltage impact,
[3]–[5]. It should be noted that the most common cause of generator short circuit is a short within the
power system network to which the generator is connected. Such events are not uncommon and this is
the reason why grid codes require wind turbines to ride through such faults, thus minimizing adverse
impacts on the network itself. Nevertheless such events will impose transient torque loads. Despite
this, the subsequent mechanical loading on the drivetrain following a generator short circuit has not
been adequately investigated in literature. An in depth analysis of the gearbox and drivetrain
mechanics is presented here in order to identify which individual components are most affected by the
resultant torque transient.
2. Methodology
2.1. Simulink Generator Model
The analysis involves using a combination of three models representing different stages of the
drivetrain with varying degrees of fidelity. The generator has been represented by a 2MW DFIG
model within Simulink. Primarily this model is used to investigate how protection and control can be
implemented to mitigate the effects of generator faults however, in the context of this analysis it has
been used to determine the transient torque profile transmitted to the High Speed Shaft (HSS). Using a
wind speed of 10m/s so as to avoid controlled pitching during the event, a 3 phase short circuit has
been simulated. According to grid code standards, a Generating Plant must be able to maintain grid
connection during unbalanced and balanced faults for up to 140ms.[6] In this case a Generator Short
Circuit (GSC) fault of 150ms has been used to simulate a wind turbine fault ride through.
.
The simulation has been carried out with and without crowbar protection enabled so as to assess the
extent to which the crowbar can mitigate further loading on the drivetrain. In order to fully capture the
effects of the GSC, a high sampling interval of 5e-5s (20 kHz) has been used.
Figure 2: Component contribution to failure according to NREL gearbox failure database
The Science of Making Torque from Wind (TORQUE 2016) IOP Publishing
Journal of Physics: Conference Series 753 (2016) 112004 doi:10.1088/1742-6596/753/11/112004
2

The fault has been triggered at 3seconds as shown in Figure 3. Directly following the short circuit,
the electromagnetic torque spikes, followed by a torque reversal and continuing oscillations until the
fault is cleared after 150ms. While it is clear that through enabling the crowbar protection the increase
in torque has been significantly reduced as well as removing the initial torque reversal, the magnitude
of this increase is almost fifteen times greater than that of steady state operational torque. This torque
profile acts as the input parameters to a turbine model in Garrad Hassan’s Bladed and represents the
airgap torque produced by the generator as a result of the short circuit.
2.2. Bladed Turbine Model
The turbine model in Bladed represents a 2MW, 3 bladed upwind, variable speed turbine with a
DFIG. Bladed uses a simplified model of a DFIG generator. However, when combined with this
externally calculated torque profile it can simulate how the entire turbine will react following the GSC.
Simulations have been carried out using both torque profiles to obtain the shaft rotational speeds and
resultant Low Speed Shaft (LSS) torque under these conditions. Initially these were captured using a
sample interval equal to that of the Simulink model of 5e-5 seconds. This was later reduced to 5e-3
seconds (200Hz) so as to reduce computational time while maintaining adequate resolution.
The torque profile has been applied to simulate a short circuit at 0.5s as opposed to 3s, again to
minimise computational time. The generator torque shown in Figure 4 also shows a slightly different
torque profile to that of the Simulink output. Figure 4 shows the torque observed at the generator
during operation of the wind turbine and therefore includes all inertias within the drivetrain as opposed
to the airgap torque profile produced by the generator without any consideration of inertia or other
drive train properties. This has subsequently reduced the initial torque spike of the profile with the
crowbar disabled. The fault is cleared at 0.65s and the turbine then begins to return to normal
operation.
Figure 3: Resultant electromagnetic torque following a 3 phase short circuit with duration of
150ms
The Science of Making Torque from Wind (TORQUE 2016) IOP Publishing
Journal of Physics: Conference Series 753 (2016) 112004 doi:10.1088/1742-6596/753/11/112004
3
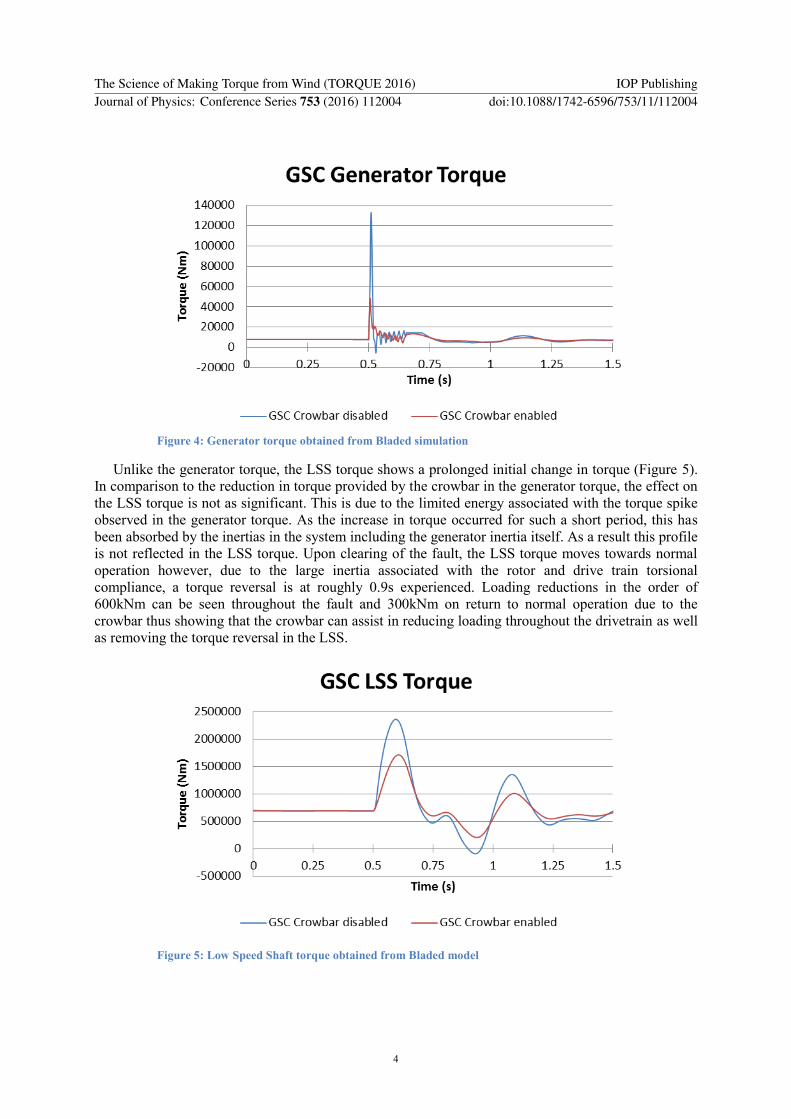
Unlike the generator torque, the LSS torque shows a prolonged initial change in torque (Figure 5).
In comparison to the reduction in torque provided by the crowbar in the generator torque, the effect on
the LSS torque is not as significant. This is due to the limited energy associated with the torque spike
observed in the generator torque. As the increase in torque occurred for such a short period, this has
been absorbed by the inertias in the system including the generator inertia itself. As a result this profile
is not reflected in the LSS torque. Upon clearing of the fault, the LSS torque moves towards normal
operation however, due to the large inertia associated with the rotor and drive train torsional
compliance, a torque reversal is at roughly 0.9s experienced. Loading reductions in the order of
600kNm can be seen throughout the fault and 300kNm on return to normal operation due to the
crowbar thus showing that the crowbar can assist in reducing loading throughout the drivetrain as well
as removing the torque reversal in the LSS.
Figure 4: Generator torque obtained from Bladed simulation
Figure 5: Low Speed Shaft torque obtained from Bladed model
The Science of Making Torque from Wind (TORQUE 2016) IOP Publishing
Journal of Physics: Conference Series 753 (2016) 112004 doi:10.1088/1742-6596/753/11/112004
4

The rotor speed of the turbine shows similar results where the effect of the short circuit is reduced
by enabling the crowbar. It can also be seen that higher frequency variations observed with the
crowbar disabled simulation are partially removed with the enabling of the crowbar.
2.3. RomaxWind Drivetrain Model
Much like the generator model within Bladed, the gearbox is represented by a simplified lumped
mass model, which cannot provide insight into the effects experienced by the gearbox on a component
level. In order to assess how the individual components react to this transient load, a detailed
drivetrain model has been implemented in RomaxWind for which the time series calculated by Bladed
act as the input parameters. Each 5e-3s time step provides a load case input to the RomaxWind model.
These load cases are each run as a static model to provide a pseudo-static time domain model. Upon
completion, the results are combined to provide a representation of the full transient event and its
effects on the system. Work carried out by Kenneth Scott [7] compared the use of this pseudo-static
approach to that of a fully dynamic model, showing that this method could sufficiently replicate the
dynamic results.
The drivetrain created in RomaxWind consists of a 2 stage planetary and 1 stage parallel gearbox
along with LSS, HSS and generator. The model uses non-linear analysis to determine the deflections
of shafts and non-linear contact to determine the loading on bearings and gears within the system. This
analysis has investigated the housing displacement due to the GSC, the contact stresses experienced by
Figure 7: 2MW 3 stage drivetrain model in RomaxWind[7]
Figure 6: Rotor Speed obtained from Bladed model
The Science of Making Torque from Wind (TORQUE 2016) IOP Publishing
Journal of Physics: Conference Series 753 (2016) 112004 doi:10.1088/1742-6596/753/11/112004
5
the gears and bearings and subsequently their associated safety factors. In order to place the effects of
the GSC in context, a simulation of an Emergency Stop (Estop) has also been carried out alongside the
crowbar enabled and disabled events.
3. RomaxWind Results
The modelling of the GSC event has been carried out using 3 duty cycles: the first of which focuses on
the period of 0-0.495s, followed by 0.5-0.995 and 1-1.495s. Each of these contains 100 load cases,
covering a simulation time of 1.5s. As shown in Figures 3-5, the short circuit is triggered at 0.5s and is
cleared at 0.65s. In light of this, in some cases results have only been shown for the duty cycle
encapsulating the short circuit event during the period of 0.5-0.995 as this period experienced the most
significant loading.
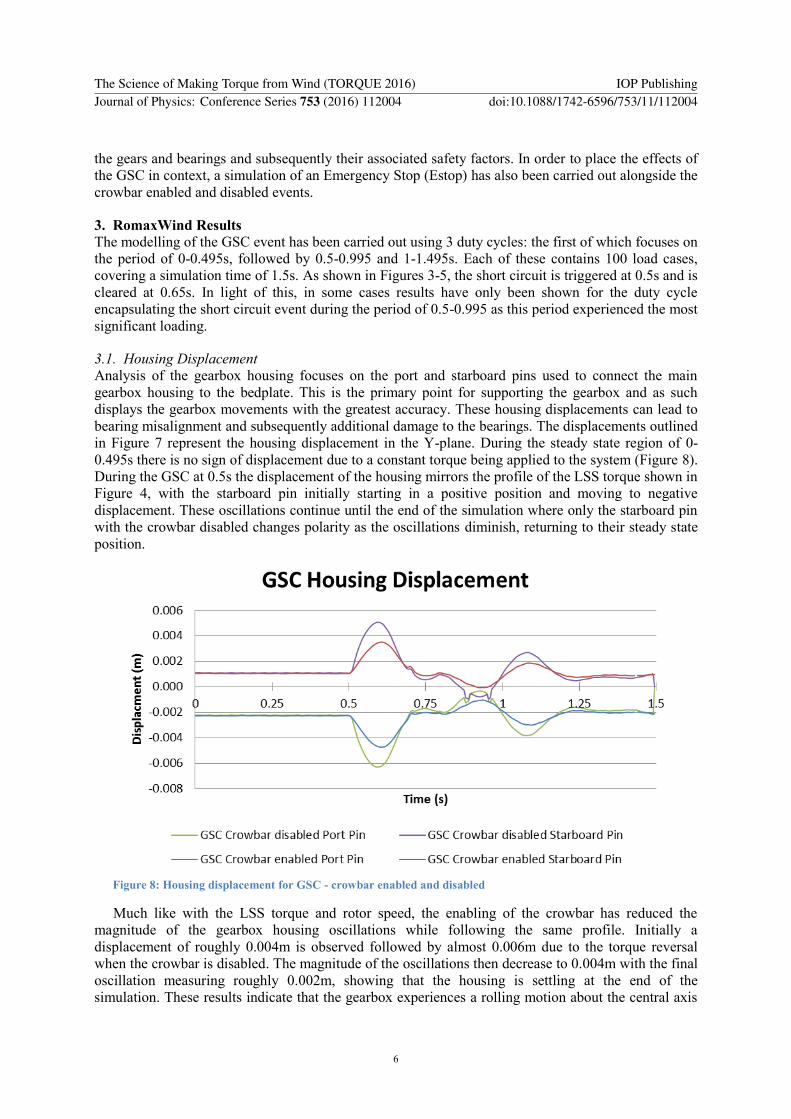
3.1. Housing Displacement
Analysis of the gearbox housing focuses on the port and starboard pins used to connect the main
gearbox housing to the bedplate. This is the primary point for supporting the gearbox and as such
displays the gearbox movements with the greatest accuracy. These housing displacements can lead to
bearing misalignment and subsequently additional damage to the bearings. The displacements outlined
in Figure 7 represent the housing displacement in the Y-plane. During the steady state region of 0-
0.495s there is no sign of displacement due to a constant torque being applied to the system (Figure 8).
During the GSC at 0.5s the displacement of the housing mirrors the profile of the LSS torque shown in
Figure 4, with the starboard pin initially starting in a positive position and moving to negative
displacement. These oscillations continue until the end of the simulation where only the starboard pin
with the crowbar disabled changes polarity as the oscillations diminish, returning to their steady state
position.
Much like with the LSS torque and rotor speed, the enabling of the crowbar has reduced the
magnitude of the gearbox housing oscillations while following the same profile. Initially a
displacement of roughly 0.004m is observed followed by almost 0.006m due to the torque reversal
when the crowbar is disabled. The magnitude of the oscillations then decrease to 0.004m with the final
oscillation measuring roughly 0.002m, showing that the housing is settling at the end of the
simulation. These results indicate that the gearbox experiences a rolling motion about the central axis
Figure 8: Housing displacement for GSC - crowbar enabled and disabled
The Science of Making Torque from Wind (TORQUE 2016) IOP Publishing
Journal of Physics: Conference Series 753 (2016) 112004 doi:10.1088/1742-6596/753/11/112004
6

of the gearbox. It can also be seen that the effect of the crowbar is maintained throughout the
simulation.
On comparison with the housing displacement of the Estop simulation (Figure 9), both simulations
share the initial steady state housing position. However, the magnitude of the oscillations are greater
as a result of the short circuit. Although the magnitude is greater for the short circuit case its duration
is significantly less than that of the Estop. As a result the potential damage caused by the displacement
during the Estop case is greater. Unlike the GSC case, the Estop housing displacement does not return
to the original steady state position as the turbine has been brought to a stop.
3.2. Gear Analysis
A shock load passing through a gear system has the potential to cause serious damage to gear
arrangements and gear teeth. An increased load above the gears threshold can cause pitting of the gear
teeth and in severe cases a fracture. In a planetary gear system, planet gears are used to not only
increase the rotational speed while minimising the space required but also to split the torque load
between more gears. In some cases the torque is not split evenly, known as unequal load sharing
which can result in gears deteriorating at an increased rate in comparison to the others. In this analysis,
focus has been aimed at the contact and bending stresses observed by the gears during the GSC. The
bending and contact stress of each gear is summarised by the operational safety factor. The safety
factor is defined as the ratio of the calculated maximum contact/bending stress to the maximum
allowable contact stress defined in the component definition.
On a component level, it remains clear that the addition of the crowbar can mitigate the loading on
the system (Figure 10). If a gear were to have a safety factor of 1, the calculated maximum stress the
gear experiences is equal to that of the allowable stress it has been designed for. Figure 10 shows the
worst case safety factors calculated within the duty cycle of 0.5-0.995s and it can be seen that a higher
safety factor has been calculated for each of the gears when the crowbar is enabled. Gears with the
lowest safety factor are contained within stage 1 of the gearbox which is the first gear stage met by the
Figure 9: Housing displacement for emergency stop
The Science of Making Torque from Wind (TORQUE 2016) IOP Publishing
Journal of Physics: Conference Series 753 (2016) 112004 doi:10.1088/1742-6596/753/11/112004
7

LSS and therefore are exposed to the largest torque loads. The same is true for the bending stress
safety factors shown in Figure 11
In both cases the safety factor increases moving through the drivetrain as the torque decreases. The
ring gears of stage 1 and stage 2 do not follow this trend regarding contact stresses. The ring gear is
the only stationary gear within the gearbox and the load applied to this gear is split across the 3 planet
gears. As such the contact stress applied to a gear tooth at any one time is reduced. Although the safety
factor for each gear is greater than 1, the loading remains large enough to potentially reduce gear life.
Figure 10: Contact stress safety factor for duty cycle 0.5-1.0s
Figure 11: Bending stress safety factor for duty cycle 0.5-1.0s
The Science of Making Torque from Wind (TORQUE 2016) IOP Publishing
Journal of Physics: Conference Series 753 (2016) 112004 doi:10.1088/1742-6596/753/11/112004
8
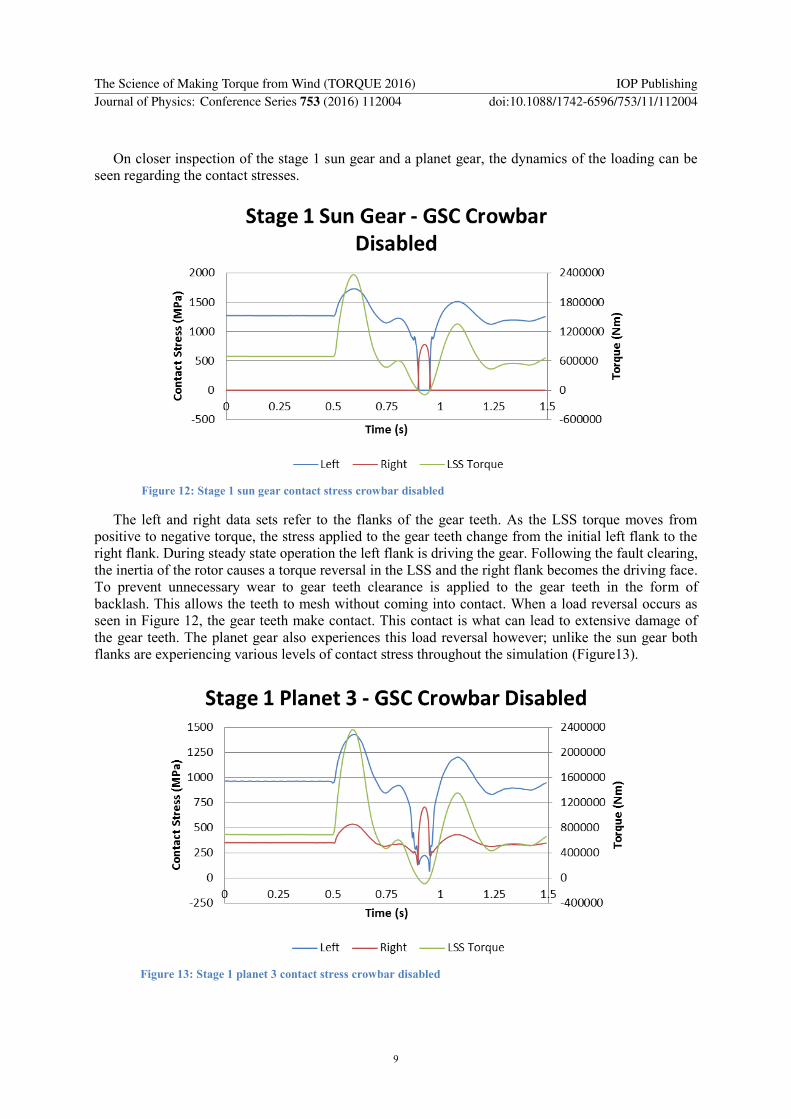
On closer inspection of the stage 1 sun gear and a planet gear, the dynamics of the loading can be
seen regarding the contact stresses.
The left and right data sets refer to the flanks of the gear teeth. As the LSS torque moves from
positive to negative torque, the stress applied to the gear teeth change from the initial left flank to the
right flank. During steady state operation the left flank is driving the gear. Following the fault clearing,
the inertia of the rotor causes a torque reversal in the LSS and the right flank becomes the driving face.
To prevent unnecessary wear to gear teeth clearance is applied to the gear teeth in the form of
backlash. This allows the teeth to mesh without coming into contact. When a load reversal occurs as
seen in Figure 12, the gear teeth make contact. This contact is what can lead to extensive damage of
the gear teeth. The planet gear also experiences this load reversal however; unlike the sun gear both
flanks are experiencing various levels of contact stress throughout the simulation (Figure13).
Figure 12: Stage 1 sun gear contact stress crowbar disabled
Figure 13: Stage 1 planet 3 contact stress crowbar disabled
The Science of Making Torque from Wind (TORQUE 2016) IOP Publishing
Journal of Physics: Conference Series 753 (2016) 112004 doi:10.1088/1742-6596/753/11/112004
9

During the planet gears operation, it is meshed with both the ring gear and the sun gear. The planet
gear applies the driving force through its left flank to the left flank of the sun gear. However, the right
flank of the planet gear also makes contact with the right flank of the ring gear. During the torque
reversal these loads are switched and the right flank of the planet gear now makes contact with the
right flank of the sun gear and subsequently the left flank makes contact with the left flank of the ring
gear.
With the crowbar enabled, the torque reversal is removed and therefore the loading on the sun gear
remains on the left flank as can be seen in Figure 14.
Similarly the driving load remains on the left flank of the planet gear whilst the right flank only
experiences loading due to the contact with the ring gear (Figure 15).
Figure 14: Stage 1 sun gear contact stress crowbar enabled
Figure 15: Stage 1 planet 3 contact stress crowbar enabled
The Science of Making Torque from Wind (TORQUE 2016) IOP Publishing
Journal of Physics: Conference Series 753 (2016) 112004 doi:10.1088/1742-6596/753/11/112004
10

3.3. Bearing Analysis
Testing and field data have shown that bearings are one of the major contributors to drivetrain and
gearbox failure. Bearings have numerous failure modes such as skidding and pitting of the rolling
elements and raceway. Shock loads to the bearings can contribute significantly to these failures,
especially during load reversals. During a load reversal the load quickly shifts through 180 degrees to
the unloaded rolling elements. This can cause the rolling elements to make contact with the raceway
through the film of lubrication resulting in skidding, thus damaging the raceway and rolling element.
misalignment of the bearings can also result in truncation where the rolling element makes contact
outside of the raceway.
Figure 16 depicts the safety factor for each bearing as a result of the worst stress experienced by
this bearing. The worst stress refers to the greatest magnitude of stress exerted on the bearing during
the GSC. These safety factors are well above 1, signifying that the bearings can withstand the load
applied. However, this shock loading will contribute to bearing fatigue and will reduce the overall
lifetime of the bearings. Figure 16 shows that each bearing shares a similar safety factor. The same can
be said for the bearing safety factors under an Estop event. Literature shows that the high speed
bearings are those which more commonly fail in the field.
The contact stresses experienced by the output shaft downwind bearing reflect the LSS torque
profile however; when a torque reversal occurs the contact stress is applied to previously unloaded
bearings. In this case the contact stress observed during the torque reversal is lower than the steady
state stress.
Figure 16: Worst stress safety factor for duty cycle 0.5-1.0s
The Science of Making Torque from Wind (TORQUE 2016) IOP Publishing
Journal of Physics: Conference Series 753 (2016) 112004 doi:10.1088/1742-6596/753/11/112004
11
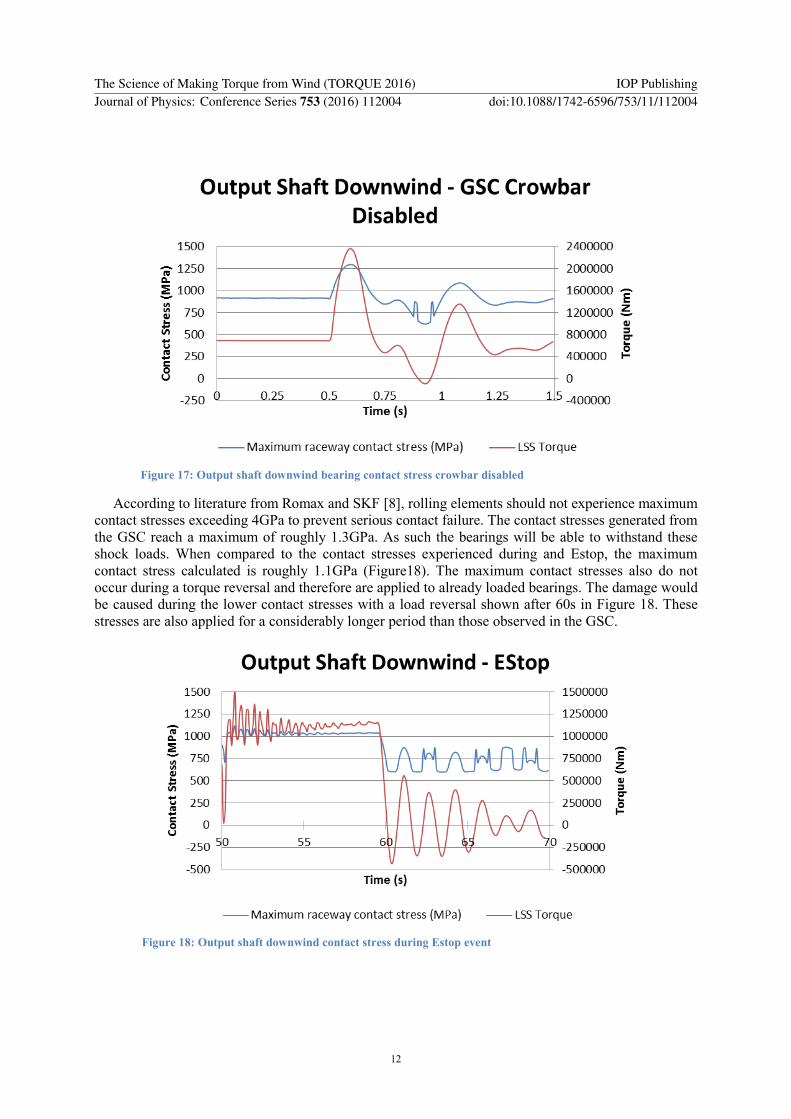
According to literature from Romax and SKF [8], rolling elements should not experience maximum
contact stresses exceeding 4GPa to prevent serious contact failure. The contact stresses generated from
the GSC reach a maximum of roughly 1.3GPa. As such the bearings will be able to withstand these
shock loads. When compared to the contact stresses experienced during and Estop, the maximum
contact stress calculated is roughly 1.1GPa (Figure18). The maximum contact stresses also do not
occur during a torque reversal and therefore are applied to already loaded bearings. The damage would
be caused during the lower contact stresses with a load reversal shown after 60s in Figure 18. These
stresses are also applied for a considerably longer period than those observed in the GSC.
Figure 17: Output shaft downwind bearing contact stress crowbar disabled
Figure 18: Output shaft downwind contact stress during Estop event
The Science of Making Torque from Wind (TORQUE 2016) IOP Publishing
Journal of Physics: Conference Series 753 (2016) 112004 doi:10.1088/1742-6596/753/11/112004
12
4. Conclusion
This paper has combined 3 models of varying fidelity in order to simulate wind turbine ride through
following a DFIG 3 phase short circuit on the drivetrain using pseudo-static modelling methods. The
analysis focused on the effects this transient event had on the drivetrain at component level as well as
the level of loading mitigation provided by the use of crowbar protection. Following a short circuit
event, the gearbox housing displacement was greater than that of a simulated emergency stop although
for a much shorter period. Analysis on the gears and bearings showed signs of load reversal without
the assistance of crowbar protection however, the safety factors calculated for all components showed
that these shock loads were well within their operating thresholds. It is believed that although these
loads are not of a magnitude which could directly cause a component to fail, they could significantly
contribute to reducing the lifetime of the component depending on the frequency of the events. This
will be the subject of future study and analysis.
Acknowledgements:
This work has been carried out with the support of Romax Technology and has been funded by the
EPSRC, project reference number EP/G037728/1. The author would also like to acknowledge
assistance from Dr Alasdair McDonald, University of Strathclyde.
References
[1] F. Spinato, P. J. Tavner, G. J. W. van Bussel, and E. Koutoulakos, “Reliability of wind turbine subassemblies,” IET Renew. Power Gener., vol. 3, no. 4, p. 387, Dec. 2009.
[2] S. Sheng, “Report on Wind Turbine Subsystem Reliability-A Survey of Various Databases,” 2013.
[3] J. Morren and S. W. H. de Haan, “Short-Circuit Current of Wind Turbines With Doubly Fed
Induction Generator,” IEEE Trans. Energy Convers., vol. 22, no. 1, pp. 174–180, 2007.
[4] J. Ouyang and X. Xiong, “Research on short-circuit current of doubly fed induction generator
under non-deep voltage drop,” Electr. Power Syst. Res., vol. 107, pp. 158–166, 2014.
[5] F. Sulla, J. Svensson, and O. Samuelsson, “Short-circuit analysis of a doubly fed induction
generator wind turbine with direct current chopper protection,” Wind Energy, vol. 16, no. 1, pp.
37–49, 2013.
[6] A. Johnson, “Grid Code Workshop Fault Ride Through – Background,” 2013.
[7] K. Scott, “Effects of Transient Loading on Wind Turbine Drivetrains,” University of Strathclyde, 2014.
[8] SKF, “SKF rating life.” [Online]. Available: http://www.skf.com/group/products/bearings-
units-housings/roller-bearings/principles/selection-of-bearing-size/selecting-bearing-size-using-
the-life-equations/skf-rating-life/index.html. [Accessed: 28-Sep-2014].
The Science of Making Torque from Wind (TORQUE 2016) IOP Publishing
Journal of Physics: Conference Series 753 (2016) 112004 doi:10.1088/1742-6596/753/11/112004
13


![Feed My Sheep [George h. Warnock] ~ Book](https://static.fdocuments.in/doc/165x107/577cdaac1a28ab9e78a639d6/feed-my-sheep-george-h-warnock-book.jpg)