Warming Up to Direct Install Refrigeration Measures - …€¦ · · 2017-07-07Warming Up to...
12
2015 International Energy Program Evaluation Conference, Long Beach Warming Up to Direct Install Refrigeration Measures Arlis Reynolds, Cadmus, Irvine, CA Tim Murray, Cadmus, Waltham, MA Carlyn Aarish, Cadmus, Waltham, MA Elizabeth Titus, NEEP, Lexington, MA David Jacobson, Jacobson Energy Research, Providence, RI Stephen P. Waite, West Haven, CT Jay Robbins, DMI, Needham, MA Kevin McGaffigan, DMI, Needham, MA ABSTRACT Direct install programs have focused primarily on high-savings, cost-effective lighting retrofits, often giving refrigeration measures the cold shoulder. In trying to deliver deeper savings for customers, however, program administrators are incorporating more measures that improve refrigeration equipment efficiency. A subset of common refrigeration measures, simple to install and unobtrusive to customers, are providing reliable energy savings and demand reductions during peak periods. Opportunities for efficiency extend beyond refrigerated warehouses and large grocery store market segments. Refrigeration measures prove appropriate for many large and small commercial businesses throughout the country—any business with food service (restaurants), smaller food retail (convenience stores), or conditioned storage (food distributors), regardless of size or location. On behalf of its Evaluation, Measurement, and Verification (EM&V) Forum membership, the Northeast Energy Efficiency Partnerships (NEEP) conducted a multistate pre- and post-installation study of the performance of common refrigeration retrofit measures. The study examined baseline (pre- retrofit) and installed (post-retrofit) equipment performance and developed hourly savings loadshapes for these most common, highest-savings refrigeration measures: Upgrading motors on evaporator fans in reach-in or walk-in refrigerated spaces Adding controls for evaporator fan motors in the same spaces Adding controls to anti-sweat door heaters in in the same spaces This paper discusses the study methods and results, key issues such as managing bias while leveraging implementers for pre- and post-installation data collection, using secondary data to guide sample design and to enhance the study sample; modeling the interactive impacts on refrigeration energy consumption, and addressing the competing interests of technology versus impact evaluation. Introduction In 2014, the Northeast Energy Efficiency Partnerships’ (NEEP) Evaluation, Measurement, and Verification (EM&V) Forum commissioned a loadshape study to examine the hourly impacts of the three commercial refrigeration retrofit measures most common among energy efficiency programs in the Northeast and Mid-Atlantic states. Conducted by Cadmus and DMI, the commercial refrigeration loadshape (CRL) study is the fourth in the EM&V Forum’s series of loadshape studies, after its commercial lighting, unitary HVAC, and variable speed drive studies (Cadmus 2015). The CRL study examined the three most common direct install refrigeration retrofit measures implemented by program administrators in the Northeast—evaporator fan motor retrofits, evaporator fan motor controls, and anti-condensate door heater controls.
Transcript of Warming Up to Direct Install Refrigeration Measures - …€¦ · · 2017-07-07Warming Up to...

2015 International Energy Program Evaluation Conference, Long Beach
Warming Up to Direct Install Refrigeration Measures
Arlis Reynolds, Cadmus, Irvine, CA
Tim Murray, Cadmus, Waltham, MA
Carlyn Aarish, Cadmus, Waltham, MA
Elizabeth Titus, NEEP, Lexington, MA
David Jacobson, Jacobson Energy Research, Providence, RI
Stephen P. Waite, West Haven, CT
Jay Robbins, DMI, Needham, MA
Kevin McGaffigan, DMI, Needham, MA
ABSTRACT
Direct install programs have focused primarily on high-savings, cost-effective lighting retrofits,
often giving refrigeration measures the cold shoulder. In trying to deliver deeper savings for customers,
however, program administrators are incorporating more measures that improve refrigeration equipment
efficiency. A subset of common refrigeration measures, simple to install and unobtrusive to customers,
are providing reliable energy savings and demand reductions during peak periods.
Opportunities for efficiency extend beyond refrigerated warehouses and large grocery store
market segments. Refrigeration measures prove appropriate for many large and small commercial
businesses throughout the country—any business with food service (restaurants), smaller food retail
(convenience stores), or conditioned storage (food distributors), regardless of size or location.
On behalf of its Evaluation, Measurement, and Verification (EM&V) Forum membership, the
Northeast Energy Efficiency Partnerships (NEEP) conducted a multistate pre- and post-installation study
of the performance of common refrigeration retrofit measures. The study examined baseline (pre-
retrofit) and installed (post-retrofit) equipment performance and developed hourly savings loadshapes
for these most common, highest-savings refrigeration measures:
Upgrading motors on evaporator fans in reach-in or walk-in refrigerated spaces
Adding controls for evaporator fan motors in the same spaces
Adding controls to anti-sweat door heaters in in the same spaces
This paper discusses the study methods and results, key issues such as managing bias while
leveraging implementers for pre- and post-installation data collection, using secondary data to guide
sample design and to enhance the study sample; modeling the interactive impacts on refrigeration energy
consumption, and addressing the competing interests of technology versus impact evaluation.
Introduction
In 2014, the Northeast Energy Efficiency Partnerships’ (NEEP) Evaluation, Measurement, and
Verification (EM&V) Forum commissioned a loadshape study to examine the hourly impacts of the
three commercial refrigeration retrofit measures most common among energy efficiency programs in the
Northeast and Mid-Atlantic states. Conducted by Cadmus and DMI, the commercial refrigeration
loadshape (CRL) study is the fourth in the EM&V Forum’s series of loadshape studies, after its
commercial lighting, unitary HVAC, and variable speed drive studies (Cadmus 2015).
The CRL study examined the three most common direct install refrigeration retrofit measures
implemented by program administrators in the Northeast—evaporator fan motor retrofits, evaporator fan
motor controls, and anti-condensate door heater controls.

2015 International Energy Program Evaluation Conference, Long Beach
Evaporator fan motor retrofits install electronically-commutated motors (ECMs) in walk-in
and reach-in refrigerated cases, replacing shaded pole (SP) and permanent split capacitor (PSC) motors.
The ECMs save energy through reduced power requirements to circulate the same volume of air
compared to SP and PSC motors.
Figure 1 demonstrates the power reduction of an motor replacement from our sample that is
representative of the typical behavior we observed. (Unless otherwise noted, all figures in this paper are
from Cadmus’ CRL study.) Before the retrofit, the baseline motor operated continuously at an average
power of 55 watts. After the new ECM was installed in mid-September, the new motor drew an average
power of 20 watts, for an average power reduction of 35 watts.
Figure 1. Power Impact of an Example Motor Retrofit
Evaporator fan motor controls vary the speed or operation of an evaporator fan to maintain
temperature and humidity setpoints in the refrigerated space. These controls reduce energy consumption
by reducing the equivalent full load run time of the fan motors. As demonstrated in Figure 2, fans
without controls often operate continuously at constant power. Although controls can be installed on SP
or PSC motors, evaporator fan controls are often installed at the same time as an evaporator fan motor
retrofit so the new controls are installed on a new ECM. The figure also demonstrates fan control
operation for two types of controls—multispeed and on/off controls. Multispeed controls vary the fan
motor between high and low speed settings depending on the cooling requirement in the space.
Similarly, on/off controls turn the motor on and off in response to space cooling loads.
Fan
Po
we
r (W
)
Multi-speed controls On/off controls
Figure 2. Examples of Evaporator Fan Motor Operation with Controls
Anti-sweat door heater controls use humidity sensors to control the resistance heat required to
prevent or eliminate condensate on refrigerated display cases. Door heater controls reduce energy
consumption by decreasing the run time of the door heaters compared to uncontrolled door heaters that
usually operate continuously at full power. Figure 3 demonstrates two types of door heater controls
observed in the CRL study. On/off controllers turn the heaters on and off in response to measured
moisture levels on the door. Micropulse controllers use high-frequency signals to modulate power to the
door heaters in response to detected humidity levels.

2015 International Energy Program Evaluation Conference, Long Beach
H
eat
er
Po
we
r (W
)
On/off controller Micropulse controller
Figure 3. Examples of Door Heater Operation with Controls
All three measures also reduce energy consumption through interactive impacts on the
refrigeration system. Since each piece of equipment resides inside the refrigerated space—whether
reach-in cooler or walk-in freezer—equipment efficiency improvements also reduce the system’s heat-
rejection requirements. We discuss the method and results of these interactive effects later in this paper.
Study Methods
Cadmus developed savings loadshapes and key savings parameters for each refrigeration retrofit
measure through primary and secondary data collection and analysis.1 We collected secondary data from
a recent study of door heater controls in Connecticut conducted by DNV-GL (The United Illuminating
Company 2012) and research conducted by DMI on evaporator fan motors in Massachusetts (KEMA et
al. 2013). Figure 4 shows the number of each type of measurement—including both primary and
secondary data—used to develop the CRL study results.
Evaporator Fan Motor Retrofit Evaporator Fan Motor Control Door Heater Controls
Figure 4. Pre-Installation and Post-Installation Measurement Sample for Refrigeration Measures
Unique measurements refer to data measured on a single circuit with one or more evaporator
fan/door heater. On average, there were three motors and eight door heaters per unique measurement of
evaporator fans and door heaters respectively. For evaporator fan motor retrofits, Cadmus collected
92 unique measurements at 48. We collected measurements before and after installation at nine sites; the
remaining sites provided data either before or after installation only. The majority of our measurements
were in coolers (80% coolers, 10% freezers, 9% unknown) and walk-in spaces (53% walk-in, 11%
1 Secondary data refers to existing meter data or results from previously completed evaluations or other available literature.
2015 International Energy Program Evaluation Conference, Long Beach
reach-in, and 36% unknown).2
For evaporator fan controls, Cadmus collected 57 unique measurements at 35 sites. We
collected measurements before and after installation at nine sites; the remaining sites provided data
either before or after installation only. The majority of measurements were in coolers (93% coolers and
7% freezers) and walk-in spaces (79% walk-in and 21% reach-in).
For door heater controls, we collected 29 unique measurements at 22 sites. We collected
measurements before and after installation at three sites; the remaining sites provided data either before
or after installation only. The majority of our measurements were in coolers (55% coolers, 17% freezers,
and 28% unknown) and walk-in spaces (72% walk-in, 14% reach-in, and 14% unknown).
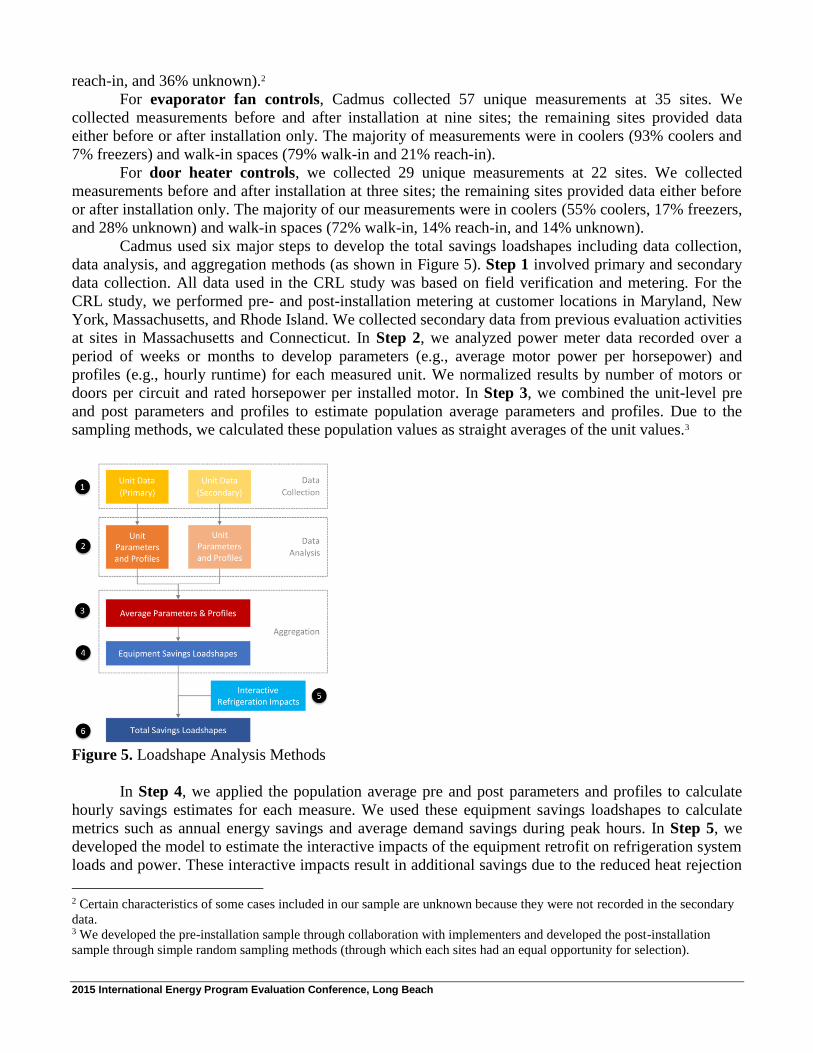
Cadmus used six major steps to develop the total savings loadshapes including data collection,
data analysis, and aggregation methods (as shown in Figure 5). Step 1 involved primary and secondary
data collection. All data used in the CRL study was based on field verification and metering. For the
CRL study, we performed pre- and post-installation metering at customer locations in Maryland, New
York, Massachusetts, and Rhode Island. We collected secondary data from previous evaluation activities
at sites in Massachusetts and Connecticut. In Step 2, we analyzed power meter data recorded over a
period of weeks or months to develop parameters (e.g., average motor power per horsepower) and
profiles (e.g., hourly runtime) for each measured unit. We normalized results by number of motors or
doors per circuit and rated horsepower per installed motor. In Step 3, we combined the unit-level pre
and post parameters and profiles to estimate population average parameters and profiles. Due to the
sampling methods, we calculated these population values as straight averages of the unit values.3
Figure 5. Loadshape Analysis Methods
In Step 4, we applied the population average pre and post parameters and profiles to calculate
hourly savings estimates for each measure. We used these equipment savings loadshapes to calculate
metrics such as annual energy savings and average demand savings during peak hours. In Step 5, we
developed the model to estimate the interactive impacts of the equipment retrofit on refrigeration system
loads and power. These interactive impacts result in additional savings due to the reduced heat rejection
2 Certain characteristics of some cases included in our sample are unknown because they were not recorded in the secondary
data. 3 We developed the pre-installation sample through collaboration with implementers and developed the post-installation
sample through simple random sampling methods (through which each sites had an equal opportunity for selection).

2015 International Energy Program Evaluation Conference, Long Beach
requirements on the refrigeration system. Finally, in Step 6, we applied the interactive refrigeration
impacts model to the equipment savings loadshapes to calculate the total savings loadshapes. The total
savings loadshapes represents the combined impacts of the equipment retrofit and reduced refrigeration
load. We separated Steps 5 and 6 from Step 4 to distinguish between savings from the equipment
replacement and saving due to interactive load reduction on the refrigeration systems. Most TRMs use a
similar approach to apply these interactive effects as a multiplier on the equipment savings.
Leveraging Secondary Data
As the evaluation industry continues to grow, so should libraries of available metered data and
evaluators’ use of these resources for future evaluation planning and analysis. Cadmus used secondary
data in two ways. First, we collected and analyzed available secondary data from completed evaluations,
technology assessments, and TRMs from the Northeast to establish the sampling approach and metering
protocols for the overall analysis plan. Our review confirmed or determined the following operating
parameters and the variability in performance across measure installations (to inform the sampling plan):
Evaporator fan motors and door heaters without controls operate nearly continuously (24/7).
Door heater controller operation does not vary with outside temperatures, so data collection
can be short and at any time of year.
Although technology performance may not vary by location, implementers use different
equipment models in each region, so it is important to capture data in several regions.
There are limited baseline power measurements available, which suggests the existing TRM
savings estimates are based on assumptions and not baseline equipment measurements.
Second, we added any secondary data that met the minimum data collection requirements (e.g.,
metering duration) to the primary data set to create a more robust sample. This secondary data research
contributed to preparing a more effective evaluation plan, reducing the required evaluation sample,
shortening the expected data collection period, and reducing evaluation costs.
Collecting Pre-Installation Data
In most direct installation programs, the implementer manages most of the installation process by
recruiting and screening eligible customers, administering pre-installation audits, determining the
measures planned for installation, and managing the scheduling of participation activities. To set up pre-
installation metering and collect other data before measure installation, the evaluator must coordinate
with the implementer and avoid unnecessary delays in the final measure installation and payment of
incentives. However, this approach introduces opportunities for selection bias and performance bias.
Selection Bias
Collecting pre-installation data requires that the evaluator access the equipment before the
customer implements the energy-efficient measure. However, because the implementer is responsible
for most implementation activities it could select customers, sites, or projects that are likely to have the
best measure performance, for example, poor baseline performance (to demonstrate large improvement),
higher load or operating hours (to maximize savings potential), or customers most likely to optimize or
sustain measure performance.
Programs with measures that vary across customer sites (e.g., custom programs) or that perform
differently depending on the customer (e.g., lighting controls) are more vulnerable to this selection bias.
The evaluator can minimize the risk of this bias by coordinating with the implementer and the program
administrator. In the CRL study, Cadmus coordinated directly with the implementer in each state to

2015 International Energy Program Evaluation Conference, Long Beach
identify eligible customer sites that could delay having the measure installed by at least two weeks (to
allow for sufficient pre-installation metering). For convenience and to minimize customer burden, the
implementer recruited the sites for inspection and metering and scheduled all pre-installation visits. We
understood this exposed the sample to selection bias but made this choice because we anticipated little
variation in measure performance across customer sites (based on our secondary data review) and,
therefore, low risk of selection bias on the study results.
Performance Bias
Any pre-installation evaluation activities may also introduce performance bias in the overall
program and measure performance—just the presence of additional evaluation oversight could influence
the behavior of the implementer or customer. (Usually evaluations do not begin until after the
implementation processes is complete in a specific attempt to limit this possible influence on program
outcomes.) Because the implementer understands that the evaluation results are a report on the success
(or not) of the program, he or she may be more diligent with the measure installation, savings
estimation, data tracking, customer service, etc. Also, the additional oversight activity spurred by the
evaluation—especially if there is any measurement involved—could influence how that customer uses
the measure to achieve savings.
Although these biases were unavoidable in the CRL study, the simplicity of measure installation
and the limited opportunity of the customer to influence measure performance reduced the concerns for
these sources of bias. For all three refrigeration measures in the CRL study, installation is relatively
simple—it either works or it does not—so the implementer or customer has little influence on the
measure performance. The motor retrofit measure is a straightforward equipment replacement with little
variation in the selected make/model of the new equipment. For motor and door heater controls, the
implementer installs and connects a control box on the existing equipment, typically using the same
make and model of control equipment on all installations; controls typically require a one-time setup
with no future interaction by the customer. More complex measures—especially those that rely on post-
installation commissioning and customer maintenance, such as energy management systems—are more
vulnerable to performance bias.
Because the CRL study sample also included sites with only post-installation data, we could
compare these data from sites with and without evaluation influence to determine if the pre-installation
evaluation activity may have influenced post-installation results. We recommend designing this
comparison into the evaluation sample for any studies that may be vulnerable to this performance bias.
Equipment Savings Loadshape Results
As noted in Step 4 of the analysis methods (Figure 5, above), the CRL study developed
equipment savings loadshapes that estimate the hourly savings for each retrofit measure. Program
administrators can use these equipment savings loadshapes to estimate key savings metrics such as
annual energy savings (the sum of hourly savings estimates over a full year) or peak demand savings
(e.g., the average hourly savings during peak hours). Figure 6 shows the equipment savings loadshape
(in watts per horsepower) for an evaporator fan motor replacing a SP motor. The loadshape shows a
continuous average savings value just under 1.2 kilowatts per horsepower with minimal variation with
time of day or day type.

2015 International Energy Program Evaluation Conference, Long Beach
Figure 6. Equipment Savings Loadshape for Motor Retrofit (Typical Week)
Figure 7 shows the equipment savings loadshapes for multiple types of evaporator fan controls
installed on SP motors and ECMs. All loadshapes show a similar pattern, with higher savings values in
the morning hours and lower savings values in the afternoon and evenings, consistent with the level of
activity in the store. When the refrigerator doors are opened and closed frequently, the cooling system
has to work harder to maintain the setpoint in the space. Therefore, the evaporator fans controllers must
operate the motors more of the time, reducing the amount of savings. We observed that savings for
on/off controls tend to be higher than savings for multispeed controls. Additionally, savings for controls
on SP motors are higher than for EC motors due to the higher demand of the less efficient SP motor.
Figure 7. Equipment Savings Loadshape for Motor Controls (Typical Week)
Figure 8 shows the equipment savings loadshapes for multiple types of door heater controls, as
well as an average loadshape for all controls. Similar to the fan motor controls, the door heater control
savings loadshapes demonstrate a time-dependence, with higher savings values in the early mornings
and lower savings value in the afternoons and into the evening, similarly explained by store activity.
Although sample sizes were small, the micropulsing and unknown control types4 tended to save more
4 Because the unknown controls types are from the secondary dataset, we could not verify the type of controller. However,
based on the measure performance, we suspect they are micropulse controls.

2015 International Energy Program Evaluation Conference, Long Beach
than the on/off door heater controls.
Figure 8. Savings Loadshape for Door Heater Controls (Typical Week)
Results Compared to Existing TRM Estimates
We compared the evaluated parameters from the CRL study to existing parameters used in
TRMs across the Northeast. The following figures demonstrate these comparisons for each retrofit
measure. Figure 9 compares the three key parameters for estimating savings from evaporator fan motor
retrofits: ECM power, baseline motor power, and average load reduction factor.
EC
M P
ow
er
(W/m
oto
r)
Ba
seli
ne
Mo
tor
Po
wer
(W/m
oto
r)
Lo
ad
Red
uct
ion
(%
)
Figure 9. Key Parameters for Evaporator Fan Motor Retrofits
Figure 10 compares the key parameter (percentage run time for the fan with controls) for

2015 International Energy Program Evaluation Conference, Long Beach
estimating savings from evaporator fan controls. The percentage runtime value represents the equivalent
full load runtime. A lower percentage runtime value results in higher energy savings. The baseline motor
power shows is the average of only metered SP motors. We observed very few PSC motors in the field
so we removed them from our baseline condition.
%R
un
tim
e (%
)
Figure 10. Key Parameters for Evaporator Fan Controls
Figure 11 compares the key parameters for estimating savings from door heater controls: average
heater power per door and percentage off time with controls (% Off). The percentage off time represents
the equivalent full load off time. A higher percentage off value results in higher energy savings.
Do
or H
eate
r
Po
wer
(W
/do
or)
Per
cen
tag
e O
ff (
%)
Figure 11. Key Parameters for Door Heater Controls
Interactive Impacts
As noted in step 5, interactive refrigeration impacts, and step 6, total savings loadshapes
(described in the text following Figure 5, Loadshape Analysis Methods flow chart), the total savings
from these refrigeration retrofit measures include savings resulting from the reduced heat that must be
rejected by the refrigeration equipment. For a motor retrofit inside a refrigerated space, for example, the
total savings include both the direct power reduction of the more efficient fan motor and the reduced
load due to reduced waste heat from the motors in the refrigerated space.
We developed an Excel-based calculator to estimate these interactive impacts for each hour of
the year, based on the hourly equipment savings loadshape and ambient weather data. Figure 12 shows

2015 International Energy Program Evaluation Conference, Long Beach
our process for calculating these additional savings due to the reduced refrigeration load. Starting with
the hourly estimates of equipment savings, we convert the reduced equipment power requirements to
reduced refrigeration load using a simple unit conversion. The model also estimates scaling factors to
account for the fraction of reduced refrigeration load that must be served by the refrigeration system. We
assume that that 100% of the motor power must be removed by system because the equipment is fully
enclosed in the refrigerated space; and that 66% of the door heater power must be removed because
some of the heat is rejected through the case door into the ambient space.
Figure 12. Analysis Steps for Calculating Refrigeration Impacts
The next step is to estimate the reduction in refrigeration system energy due to the reduction in
refrigeration load. We developed a model to estimate this refrigeration performance (kW/ton) based on
performance curves for the packaged refrigeration systems observed in our study, typical cooler and
freezer evaporator temperatures (30°F for coolers and -10°F for freezers), and typical hourly outdoor
temperatures (from National Oceanic and Atmospheric Administration [NOAA] typical meteorological
year 3 [TMY3] weather data records).
Finally, we calculated the total savings by adding refrigeration savings to equipment savings for
each hour of the year. We examined the impacts of these savings by calculating the ratio of total savings
to equipment savings. We refer to this ratio as the bonus factor because it represents the additional or
bonus savings achieved at the refrigeration system when multiplied by the equipment savings. Figure 13
compares our modeled interactive bonus factor with similar factors from TRMs in the Northeast.
Figure 13. Comparing Interactive Refrigeration Impacts

2015 International Energy Program Evaluation Conference, Long Beach
The CRL study bonus factor for equipment retrofits in coolers is similar to the factors included in
TRMs across the Northeast. However, in freezers, the CRL study bonus factor for equipment retrofits is
20% to 50% higher than TRM estimates due to the higher proportion of small refrigeration systems
observed in the study sample. The TRM estimates are probably based on a population, such as
supermarkets, that has a significant percentage of central refrigeration systems (e.g., supermarkets). The
majority of CRL study participants have small, air-cooled, split systems with lower performance and
therefore higher savings compared to larger, central systems.
Balancing Impact vs. Technology Evaluation
A true impact evaluation (which should strictly report on the actual outcomes of a program’s
performance) should be balanced with a technology evaluation (which focuses on the expected
performance of a measure when operating as expected). Both types of studies are important for
estimating key savings metrics for energy efficiency programs, but one method may be more
retrospective while the other is more prospective.
In the CRL study, we encountered many instances of conflict between impact and technology
evaluations, for which we had to determine the most appropriate use of data to meet the objectives of the
CRL study. The following are examples of such conflicts with our final treatment and rationale:
Evaporator fan motor retrofit. We performed pre- and post-installation metering on a
motor retrofit project that ultimately did not participate in an energy efficiency program. We
discuss if the data were still valid since the project was not part of the program participant
population and eventually decided to keep the data since the measure performance is
probably representative of similar program installations.
Evaporator fan motor control. During our pre-installation metering of evaporator fans, we
found one site that had existing controls on SP motors. Implementers confirmed that is was
unusual to see existing controls on SP motors, so we did not include this SP-controller data
with the pre-installation dataset. However, we did use the meter data in the estimates of
average SP motor power draw per horsepower.
Evaporator fan motor control. Our post-installation evaporator fan control measurements
found two instances where the fan controls had been disconnected. Through discussions with
the implementers, we learned that it was not uncommon for customers to disconnect
equipment, even if only a temporary turn off was intended. Therefore, since we would expect
customers to behave similarly in future programs, we included these data points in the post-
installation dataset even though the technology was not performing.
Door heater control. Our post-installation door heater control measurements found three
units for which the controls had no impact on energy consumption. Although we could not
firmly establish the reason for non-performance, we confirmed that the three units were
installed in the same state and by the same installer. We decided these controls did not fairly
represent the success of controls in other states, so we dropped these non-working units from
the evaluation sample. Therefore, the results of the door heater study represent the savings
achieved by a working door heater control.
As evaluations push for more real-time results and prospective research, key decisions such as
these may be more common. Based on the CRL study experience (and similar issues in the previous
NEEP variable speed drive loadshape study), we recommend that future study sponsors, evaluation
implementers, and any stakeholders have early buy-in on the key study objectives and the most
important use of the study results. These early decisions should then drive the reasoning for impact
versus technology treatment decisions during the source of the study.
2015 International Energy Program Evaluation Conference, Long Beach
References
Cadmus. Commercial Refrigeration Loadshape Project. July 2015. Unpublished report.
DNV-GL. C9: Impact Evaluation of the Connecticut Small Business Energy Advantage (SBEA)
Program. 2014. http://www.energizect.com/government-municipalities/sbea-impact-evaluation-
c9-may-2014-2.
Efficiency Vermont. Technical Reference User Manual. Available online at:
https://www.veic.org/documents/default-source/resources/reports/trm-user-manual-excerpts.pdf
KEMA, Inc., DMI Inc., and SBW. Impact Evaluation of 2011 Custom Refrigeration, Motor and Other
Installations – Final Report. Prepared for the Massachusetts Program Administrators and
Massachusetts Energy Efficiency Advisory Council. June 2013. Available online at: http://ma-
eeac.org/wordpress/wp-content/uploads/Impact-Evaluation-of-2011-Custom-Refrigeration-
Motor-and-Other-Impact-Evaluation-Final-Report-6.18.13.pdf
Mass Save. Massachusetts Technical Reference Manual, 2013-2015 Program Years – Plan Version.
October 2012. Available online at: http://ma-eeac.org/wordpress/wp-
content/uploads/TRM_PLAN_2013-15.pdf
New York State Department of Public Service. New York Standard Approach for Estimating Energy
Savings from Energy-Efficiency Measures. Version 3. 2015.
http://www3.dps.ny.gov/W/PSCWeb.nsf/ca7cd46b41e6d01f0525685800545955/06f2fee55575b
d8a852576e4006f9af7/$FILE/TRM%20Version%203%20-%20June%201,%202015.pdf
The United Illuminating Company. Connecticut Program Savings Document for 2012 Program Year.
2012. Available online at:
http://www.energizect.com/sites/default/files/2012%20CT%20Program%20Savings%20Docume
ntation%20FINAL.pdf