Warm-Up If the variance of a set of data is 12.4, what is the standard deviation? If the standard...
16
Warm-Up If the variance of a set of data is 12.4, what is the standard deviation? If the standard deviation of a set of data is 5.7, what is the variance? If the mean of a set of data is 12.7 and the standard deviation is 1.74, what range should you consider to look for outliers? If the lower quartile of a data set is 32.3 and the IQR is 6.7, what range should you consider to look for outliers?
-
Upload
diana-sparks -
Category
Documents
-
view
216 -
download
0
Transcript of Warm-Up If the variance of a set of data is 12.4, what is the standard deviation? If the standard...
Warm-UpIf the variance of a set of data is 12.4, what is
the standard deviation?If the standard deviation of a set of data is
5.7, what is the variance?If the mean of a set of data is 12.7 and the
standard deviation is 1.74, what range should you consider to look for outliers?
If the lower quartile of a data set is 32.3 and the IQR is 6.7, what range should you consider to look for outliers?

Normal DistributionsHonors Advanced Algebra
Presentation 1-5

VocabularyNormal Distribution – A data
distribution where the data form a bell curve that has distinct statistical properties.
Z-Score – the number of standard deviations from the mean. Used to tabulate the area under a normal curve.
Essential Question and StandardsHow do we determine quartiles and
percentages for standardized tests?
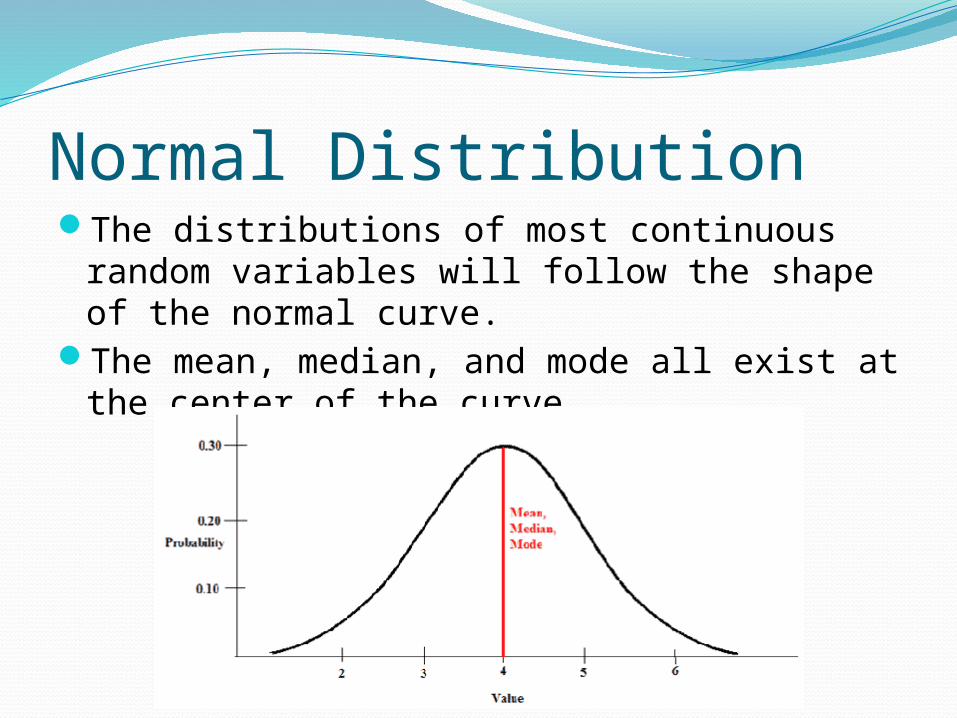
Normal DistributionThe distributions of most continuous random
variables will follow the shape of the normal curve.
The mean, median, and mode all exist at the center of the curve.

FormulaCalled Gaussian Distribution by Physicists

The Empirical RuleThe Empirical Rule
Defined by the numberof standard deviationsdata is from the mean.
68% of data within 1σ95% of data within 2σ99.7% of data within 3σ

Finding a Range of DataYou have a sample with = 15 and σ = 2.2.Between what range will 68% of your data fall?
Between what range will 95% of your data fall?
Between what range will 99.7% of your data fall?
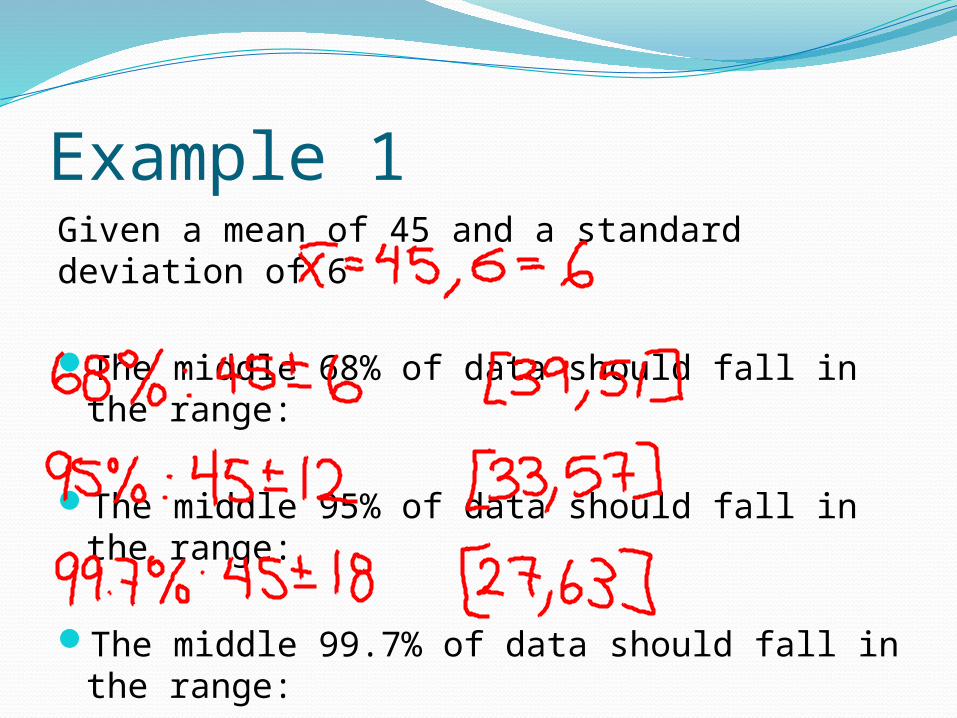
Example 1Given a mean of 45 and a standard deviation of 6
The middle 68% of data should fall in the range:
The middle 95% of data should fall in the range:
The middle 99.7% of data should fall in the range:

Example 2Given a mean of 810 and a standard deviation of 57
The middle 68% of data should fall in the range:
The middle 95% of data should fall in the range:
The middle 99.7% of data should fall in the range:
Example 3Given a mean of 20.5 and a standard deviation of 3.75
The middle 68% of data should fall in the range:
The middle 95% of data should fall in the range:
The middle 99.7% of data should fall in the range:
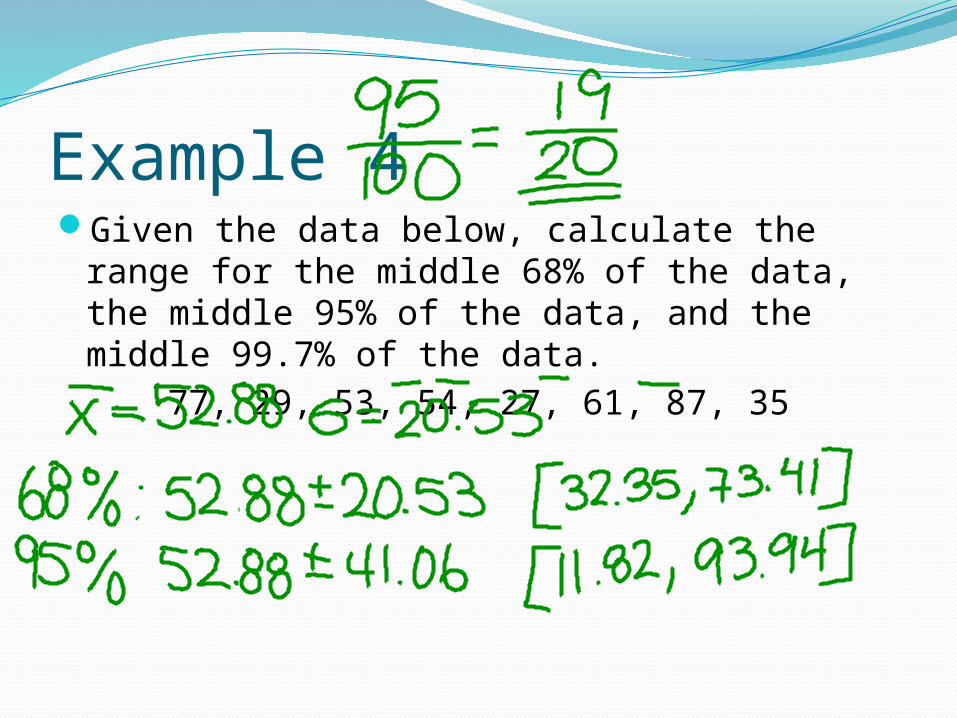
Example 4Given the data below, calculate the range for
the middle 68% of the data, the middle 95% of the data, and the middle 99.7% of the data.
77, 29, 53, 54, 27, 61, 87, 35
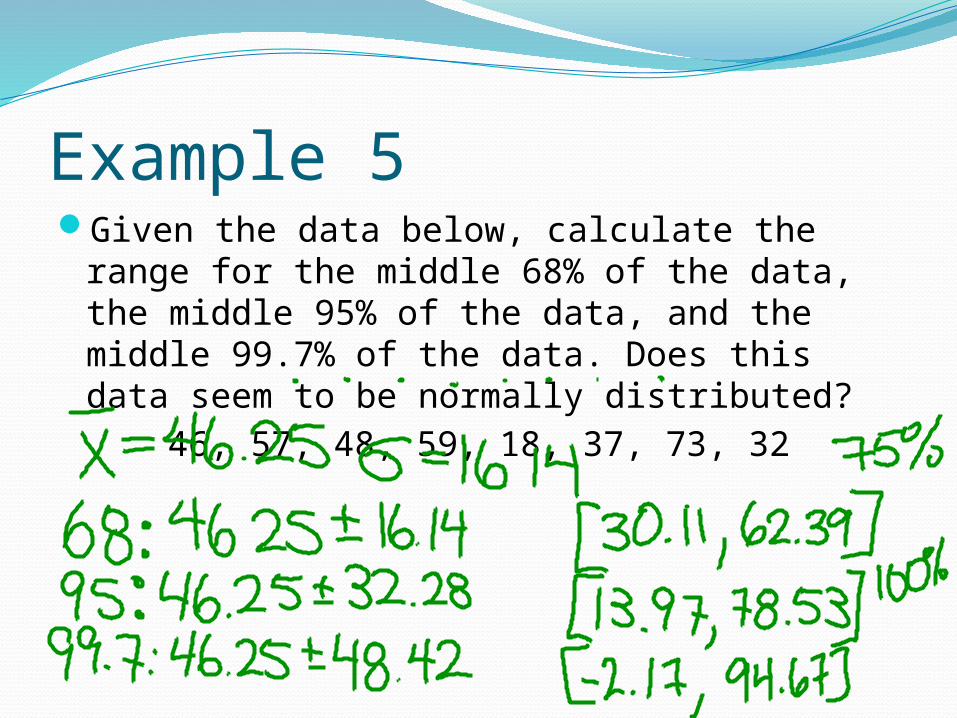
Example 5Given the data below, calculate the range for
the middle 68% of the data, the middle 95% of the data, and the middle 99.7% of the data. Does this data seem to be normally distributed?
46, 57, 48, 59, 18, 37, 73, 32
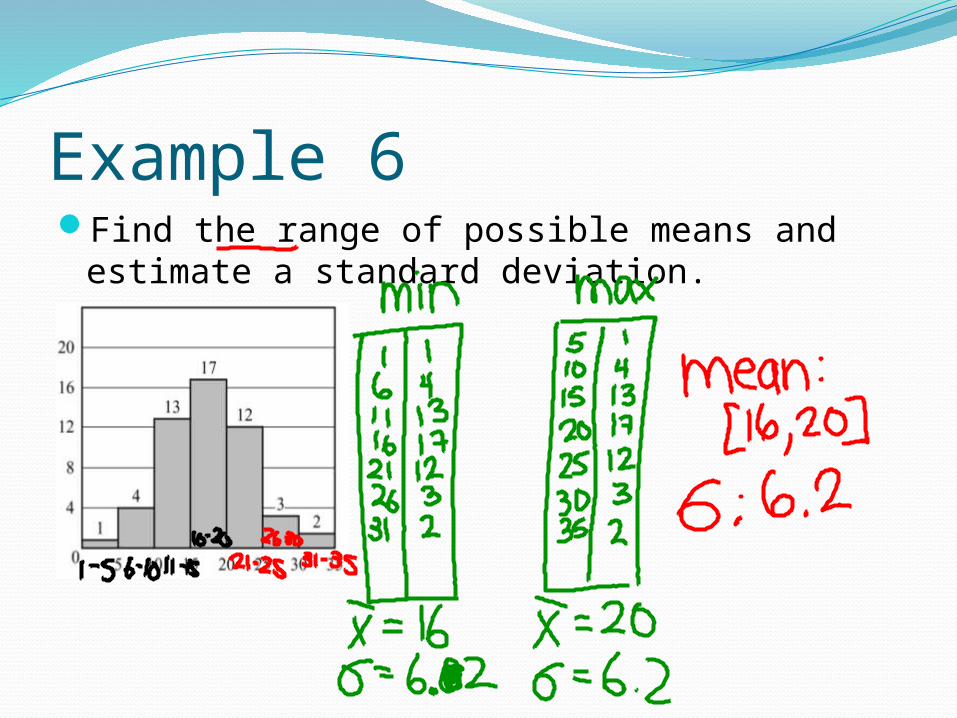
Example 6Find the range of possible means and
estimate a standard deviation.
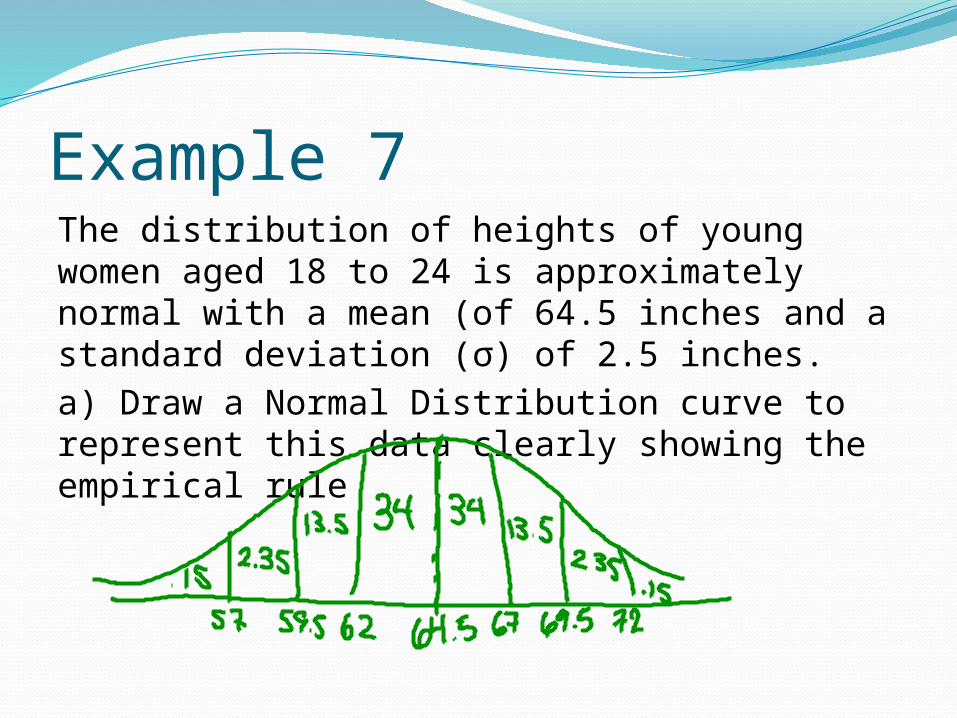
Example 7The distribution of heights of young women aged 18 to 24 is approximately normal with a mean (of 64.5 inches and a standard deviation (σ) of 2.5 inches.a) Draw a Normal Distribution curve to represent this data clearly showing the empirical rule

Example 7 (cont’d)b) What percent of women are taller than 69.5 inches?
c) Between what heights do the middle 95% of women fall?
d) What percent of women are shorter than 62 inches?