


WAREHOUSE & DC MANAGEMENT distribution … · DELIVERS. TMS THAT. . TMS that delivers. Welcome to...
60
Intermodal looks marvelous! 30 Freight forwarding: Choosing the right partner 38 2011 Technology Roundtable 42 MAY 2011 Page 24 WWW.LOGISTICSMGMT.COM ® SPECIAL REPORT: TOP 20 U.S. PORTS Where’s the money? 48S WAREHOUSE & DC MANAGEMENT GUESS’ distribution evolution Tom Boyle, project manager, GUESS + ROUNDTABLE WEBCAST: May 31, 2011, 2:00 pm ET logisticsmgmt.com/tech2011
Transcript of WAREHOUSE & DC MANAGEMENT distribution … · DELIVERS. TMS THAT. . TMS that delivers. Welcome to...

Intermodal looks marvelous! 30Freight forwarding:Choosing the right partner 382011 Technology Roundtable 42
MAY 2011
Page 24
WWW.LOGISTICSMGMT.COM
®
SPECIAL REPORT: TOP 20 U.S. PORTS
Where’s the money? 48S
Page 24
WAREHOUSE & DC MANAGEMENT
GUESS’distributionevolution
Tom Boyle, project manager, GUESS
+ ROUNDTABLE WEBCAST:May 31, 2011, 2:00 pm ETlogisticsmgmt.com/tech2011
LM_1105_Cover.indd 1 5/5/11 1:25 PM

DELIVERSTMS THAT
w w w. m e r c u r y g a t e . c o m
TMS that delivers.
Welcome to the most sophisticated and fl exible Transportation Management System in the industry-
MercuryGate’s TMS with Mojo - designed to meet the challenges of shippers and logistics services
providers just like you. Get all the tools you need to plan, execute, rate, track, and settle shipments
in any mode in any direction at any time. Improve service
levels and grow your business in ways you never before
thought possible while our on-demand delivery model
reduces your risk and accelerates your journey to value.
ADskytoroad.LogMgmt.indd 1 3/22/11 12:14 PMLM0511_Ads.indd 2 5/3/11 3:14 PM

Get your daily fix of industry news on logisticsmgmt.com
May 2011 | WWW.LOGISTICSMGMT.COM Logistics ManageMent 1
n Diesel cracks $4 per gallon. As if there was any doubt, the price per gallon of diesel fuel officially eclipsed the $4 mark last month. This increase marked the first time diesel has been above the $4 per gallon mark since the week of September 15, 2008, when it hit $4.023. Many shippers have expressed concern about the pace of these diesel increases, explaining that if prices continue to rise at their current pace it has the potential to hinder growth and increase operating costs; which will, in turn, force them to raise rates and offset the increased prices to consumers. For a better under-standing on where oil and fuel prices are headed, read Andreoli on Oil & Fuel (page 22).
n Holding the line on infrastructure. When discussing what stays or goes in the next federal budget, President Barack Obama made it clear that reducing investments in infrastructure is not an option. “We're not going to reduce the deficit by sacrificing investments in our infrastructure,” Obama said at Northern Virginia Community Col-lege in April. This statement follows a recently-released six-year, $556 billion federal surface trans-portation reauthorization proposal rolled out by the White House earlier this year. While the bill is ambitious and far-reaching, how to effectively fund it remains an obstacle.
n TransCore says March truckload spot market sets another record. As trucking capacity remains tight, one of the biggest beneficiaries is the spot market. That was made clear in data released by TransCore, which indicated that spot market truck-load freight volume in March hit its highest level since the firm’s North American Freight Index was rolled out in 1996. TransCore said that truckload spot market freight availability in March hit its highest level for any month since October 2005. March load volume was up 23 percent from Febru-ary and 40 percent annually, with freight volumes paced by a 57 percent gain in flatbed freight and dry van freight availability up 32 percent and reefer loads up 26 percent.
n ATA data points to increased driver turnover and hiring numbers. Recent data released by the American Trucking Associations (ATA) suggests that data pointing to increasing driver hiring and turnover translates into signs of an economic recovery. The
ATA reported that during the fourth quarter of 2010, truckload (TL) and less-than-truckload (LTL) carri-ers bumped up their payrolls, with small TL carriers boosting employment by 0.8 percent within their driver pool and large TL carriers adding 0.3 percent to payroll by adding linehaul drivers and reduc-ing local driver pools. On the LTL side, the ATA reported that fourth quarter employment was up 0.4 percent, with all categories up except for linehaul drivers, which were down 0.2 percent.
n Unrest weakens air cargo. The International Air Transport Association (IATA) announced scheduled international traffic for February 2011 showed increases of 2.3 percent for cargo demand compared to February 2010. February demand growth was down significantly from the revised 8.7 percent expansion recorded in January for cargo traffic. The political unrest in the Middle East and North Africa during February is estimated to have cut international traffic by about 1 percent. In addition to the political unrest in the Middle East and North Africa, the more dramatic fall in air cargo growth (from 8.7 percent in January 2011 to 2.3 percent in February) was affected in part by factory shutdowns due to the Chinese New Year period that fell in the first part of February in 2011. “Another series of shocks is denting the industry’s recovery from the recession,” said Giovanni Bisig-nani, IATA’s Director General and CEO.
n Stretched supply chain due to quake. Analysts for IDC Manufacturing Insights and IDC Retail Insights reported that Japanese manufacturers face severe disruptions across several value chains in the coming months. According to IDC’s Bob Parker, Toyota is losing $80 million per day largely due to several strategic suppliers located in the Northeast of the country. “Even if plants were not damaged, power has been unreliable,” he said. “General Motors, who also relies on suppliers in northern Japan for global production, has cut overtime at its Korea plants in anticipation of parts shortages and expects the impact to reach other parts of the world. GM reported that the complete picture wouldn’t be known for several weeks.” In the high-tech sector, Parker sees a similar crisis playing out, with a crunch put on semiconductor supply—particularly flash memory.
A n e x e c u t i v e s u m m A r y o f i n d u s t r y n e w s
Get your daily fix of industry news on logisticsmgmt.com
continued, page 2 >>
LM_1105_MgmtUpdate.indd 1 5/5/11 11:47 AM

2 Logistics ManageMent WWW.LOGISTICSMGMT.COM | May 2011
continued
Get your daily fix of industry news on logisticsmgmt.com
n Rail earnings on the mark. There was no sign of a slow economic recovery when looking at first quarter earnings results from Class I rail carriers. This was evident in earnings reports by Union Pacific and CSX, among others, that cited strong pricing, increasing volume, and especially strong intermodal performances. Perhaps the only blemish cited in the earnings results was lower service metrics, but much of that can be attributed to harsh winter weather conditions that were prevalent throughout much of the first quarter. What’s more, at a time when the federal government has stated it wants more freight moved from the highways to the railways, sus-tained growth on the tracks looks promising for future quarters to come.
n U.S. ports: Follow the money. As all of our nation’s major ocean cargo gateways attempt to expand their footprints and compete with enhanced infrastructure, finding the money for many such projects continues to be a daunting challenge. Last month’s biennial Port Administration and Legal Issues Seminar in San Francisco (sponsored by The American Association of Port Authorities) featured an in-depth discussion on port funding and public finance management. And while many paths can be taken toward achieving a financing goal, most speakers advised a “go slow” approach. “It’s crucial that one set priorities with all the port stakehold-ers before moving forward,” said Karl Pan, chief financial officer for the Port of Los Angeles. “Before getting started, make sure you understand the risks and whether you are staffed with the administrative skill sets to the get the job done.”
n Expanding its footprint. Last month, China Shipping completed a major phase of its terminal expansion project at the Port of Los Angeles, add-ing a new 925-foot section of wharf, 18 additional acres of backland, and four new container cranes that will increase cargo throughput. China Ship-ping operates the West Basin Container Terminal at the port. With the most recent $47.6 million expansion phase completed, the terminal now has 2,125 feet of wharf space and eight super post-Pan-amax cranes, handling cargo operations for China Shipping, Yang Ming, K-Line, Cosco, Hanjin, Sino-trans, and Zim shipping lines. China Shipping also
has a joint venture with a neighboring container terminal at the port, operated by Yang Ming Ship-ping Line. As part of the latest improvements, an access bridge was also constructed between China Shipping and Yang Ming for truck movement of cargo between the two terminals.
n Too much space. While the world’s leading cargo vessel operators had seen a remarkable reversal of fortune last year, industry analysts predict that the turnaround will be “short-lived.” Alphaliner, the Paris-based shipping consultancy, reported that 19 of the top 25 ocean carriers it surveyed earned an estimated $14 billion in 2010, after losing $15 billion just the year before. “Con-tainer carriers’ margins recovered strongly in 2010 to a positive 7 percent from a negative 16 percent in 2009,” said Alphaliner. But analysts added that margins in the Asia-EU trade have softened, and that 2011 is likely to be a much weaker year in gen-eral. Indeed, container rates have been sliding on all the major trading lanes since July 2010, with the exception of a small “hiccup” last winter, as liner companies tried to push for implementation of general rate increases in a weakening market, said analysts at the Baltic and International Maritime Council in Copenhagen.
n Fissures fixed. Minor subsurface cracking was found on five Southwest aircraft last month, but the abrupt withdrawal of Boeing 737 aircraft from its fleet had little impact on shippers, said an industry leader. “Only about 100 planes were grounded,” said Brandon Fried, executive director of the Air Forwarders Association. “We get that many aircraft pulled just when a major weather event occurs.” Meanwhile, Southwest said that it had completed all aircraft inspections in accor-dance with the Federal Aviation Administration (FAA) Airworthiness Directive (AD) that was released in early April. The airline began operat-ing a normal schedule a few days later, and did not anticipate the directive to effect the schedule moving forward. Mike Van de Ven, Southwest’s executive vice president and COO. “Our event, though obviously not what we would want to happen, is ultimately working to improve the effectiveness of 737 inspections and maintenance programs world-wide.”
LM_1105_MgmtUpdate.indd 2 5/5/11 11:47 AM

When it comes to finding a partner to handle your logistics needs, choose someone with the strategic expertise and experience to streamline or transform your supply chain. Through lean methodologies and innovation, we have a proven track record of delivering solutions that improve your bottom line. When you need a competitive advantage, trust the master.
Visit www.menloworldwide.com/lm for more information.
Menlo Worldwide Logistics.Masters of the supply chain.
LM0511_Ads.indd 3 5/3/11 3:14 PM

May 2011 | WWW.LOGISTICSMGMT.COM LOGISTICS MANAGEMENT 5
Logistics Management® (ISSN 1540-3890) is published monthly by Peerless Media, LLC, a Division of EH Publishing, Inc., 111 Speen St, Ste 200, Framingham, MA 01701. Annual subscrip-tion rates for non-qualified subscribers: USA $119, Canada $159, Other International $249. Single copies are available for $20.00. Send all subscription inquiries to Logistics Management, 111 Speen Street, Suite 200, Framingham, MA 01701 USA. Periodicals postage paid at Framingham, MA and additional mailing offices. POSTMASTER: Send address changes to: Logistics Management, PO Box 1496 Framingham MA 01701-1496. Reproduction of this magazine in whole or part without written permission of the publisher is prohibited. All rights reserved. ©2011 Peerless Media, LLC.
TRANSPORTATION BEST PRACTICES/TRENDS
Intermodal looks marvelous! The red-hot intermodal sector is “in fashion” these days as shippers opt for lower rates at near-truck service levels. Our intrepid trucking correspondent examines the factors driving this impressive growth as well as how logistics professionals are using the option as part of their 2011 transportation tool kit.
SUPPLY CHAIN & LOGISTICS TECHNOLOGY
LMS: Coming into its ownThe need to drive down costs is pushing labor management system adoption rates. Our Technology Correspondent offers a snapshot of the market and examines the issues pushing its use inside the four walls and the cabs of private fleets.
GLOBAL LOGISTICS
Freight Forwarding: Choosing the best partnerWith President Obama continuing to emphasize exports, specialized shipping intermediaries are more important than ever to global logistics operations. But how do shippers identify and choose the right freight forwarder?
2011 TECHNOLOGY ROUNDTABLE
Putting data into contextOur recent Software Users Survey revealed that shippers are showing a renewed interest in achieving a better understanding of the data supply chain software systems are capable of churning out. Three top technology analysts tell us how to get this done.
Freight Forwarding 38
2011 Technology Roundtable 42
VOL. 50, NO.5
WAREHOUSE & DC MANAGEMENT
GUESS’ distribution evolution
For more than a decade, the fashion giant’s WMS has kept pace with several ERP
integrations and the installation of a slew of materials handling equipment—
all in an effort to keep the company on top of the fickle fashion world. 24
Cover photography: Roman Cho
30
34
38
Contents
42
Intermodal 30
MAY 2011
LM_1105_TOC.indd 5 5/5/11 12:03 PM

6 Logistics ManageMent WWW.LogisticsMgMt.coM | May 2011
departments 1 Management update
9 Viewpoint
10 Price trends
13 News & analysis
18 Moore on pricing
20 Pearson on excellence
22 Andreoli on oil & fuel
56 Sage advice
Get your daily news fix at logisticsmgmt.com
t speciaL report
TOP 20 U.S. PORTS
Where’s the money?creative funding for expansion and infrastructure improvement is critical for the top U.s. ports, especially as shippers are slowly reconfiguring their supply chains to become less dependent on the West coast. 48S
V i r t U a L c o n f e r e n c e
Winning in the global arenaLogistics Management and Supply Chain Management Review are joining forces on this virtual conference designed to help companies succeed in the global marketplace. We have put together a great series of educational sessions and speakers to address critical topics like how to work more effectively with your global 3pL providers and how to accurately track shipments through the supply chain. our expert panelists will also provide practical tips on meeting trade compliance regulations in a timely and cost-efficient manner. they will also discuss innovative approaches to supply chain financing.
“Winning in the global arena” will feature a keynote presentation on managing global supply chain risk. in addition, attendees can visit our “virtual booths” to obtain valuable information on supply chain products and services.
Date: June 29, 2011 from 11:00 aM to 4:00 pM et Register: www.supplychainvirtualevents.com
LM ExcLuSivE WEbcaSt2011 Technology Roundtable: Putting data into context
Date: tuesday, May 31, 2011 @ 2:00 p.m. et Register: logisticsmgmt.com/tech2011
the results of our 2011 Software Users Survey found that shippers are showing renewed interest in achieving a better understanding of the data that
supply chain management (scM) software systems are capable of churning out.
in an effort to help shippers put their data into better context and improve overall supply chain visibility, we’ve gathered a few of the top market analysts to put their perspective around the evolution of the scM market.
our panelists will discuss:• The rising importance of business analytics in logistics operations;
• How TMS is becoming essential to improving control of all shipments;
• How and why to move your WMS to the cloud;• Where SCM software currently stands in offering true supply chain visibility.
ModeratorMichael Levans, group editorial director, supply chain group
PanelistsBob Heaney, senior research analyst, scM, the aberdeen group; Shanton Wilcox, principal of supply chain management at capgemini consulting; Jerry O’Dwyer, U.s. sourcing and procurement leader for Deloitte consulting; Greg Aimi, director of supply chain research at gartner
LM_1105_TOC.indd 6 5/5/11 12:03 PM
LAST YEAR, A CUSTOMER ACHIEVEDA POSITIVE ROI IN 2 YEARS.
(ACTUALLY IT WAS 2 MONTHS, BUT WE DIDN’T THINK YOU’D BELIEVE THAT.)
TIME & ATTENDANCE SCHEDULING ABSENCE MANAGEMENT HR & PAYROLL HIRING LABOR ANALYTICS
TO LEARN HOW COMPANIES OF ALL TYPES AND SIZES HAVE ACHIEVED EYE-POPPING ROI USING KRONOS VISIT KRONOS.COM/STORIES30
©2011 Kronos Incorporated. Kronos and the Kronos logo are registered trademarks of Kronos Incorporated or a related company. All rights reserved.
How can a customer achieve these eye-popping results? With our fully integrated suite that makes it easy to do things like track
employee time and set schedules. Streamline HR and payroll processes. Hire better people. And make better decisions. All of the
tools that you need to manage your workforce, from the company that is proving workforce management doesn’t have to be so hard.
BELIEVABILITY
High
Not SoHigh
SANTA ROI
LM0511_Ads.indd 7 5/5/11 1:14 PM

May 2011 | WWW.LOGISTICSMGMT.COM Logistics ManageMent 9
DISTR
IBUTION
Putting data into action
after putting together our 2011 Technology Roundtable (page 42) and then reading John Schulz’s excel-lent examination of the state of the intermodal market (page 30), I had a revelation: Logistics professionals are beginning to see the benefits of effectively applying data to their opera-tions—in this case, their choice of transportation modes.
How did I arrive at this conclusion? Well, as our 2011 technology panel pro-claims, shippers that put supply chain management software (SCM) to its full-est use are not only able to land the most favorable rates and the capac-ity they need, but are also positioned to execute against their long-term transportation strategy. Those savvy ship-pers have better “visibility” to their transportation needs many months in advance and are able to improve their modal mix and shift into contingency mode when necessary—and not miss a beat.
I would go out on a limb to say that the fact that the intermodal market is “in fashion” in mid-2011 is more a testament to improved transporta-tion planning—thanks to that business intelligence and access to data—than it is to shippers simply reacting to higher rates or a recently implemented “green” strategy. These somewhat surprising intermodal growth numbers can only point to better shipper foresight that kicked into high gear back in late 2009 and early 2010—and to this I say “con-gratulations.”
In his article, Schulz gives shippers the deep dive, but I’d like to share the high-level numbers. At the end of Q1 2011, intermodal freight volumes were up 10 percent overall from year-ago vol-umes—11 percent up on international moves and 9 percent up on domestic moves. That’s about twice the rate of growth of all North American rail traffic, and three times the growth in the U.S. trucking industry.
And as fuel surcharges continue to mount—some ringing in at about 50 percent of a long haul TL bill—and as the specter of a driver shortage slowly reveals itself, transportation analysts say that intermodal should grow at about twice the rate as trucking over the next 12 months.
“The service is as good if not better than solo driver truckload in terms of transit times and reliability,” analyst John Larkin tells Schulz. “The base price is 10 percent to 15 percent below truckload, and the fuel surcharge can be half as much.”
Sector experts contend that the only threats to intermodal growth at this point would be if the rail system starts to bog down, service begins to suffer, or shippers take their eye off the ball in terms of their improved modal mix.
“The strong correlation between intermodal volume growth and improved transportation planning over the past two years was quite evident during my reporting,” says Schulz. “A shipper orga-nization can only maximize the mode’s benefits if they have a handle on their complete distribution network and can clearly plan, long term, for their needs.”
If you’re willing to open your eyes to the world of analytics and put data into action to improve your planning, you have your required reading for this month.
Michael A. Levans, group editorial Director
Comments? E-mail me at [email protected]
DISTR
IBUTION
®
®
®
®
EditoriAL StAff
Michael A. Levansgroup editorial Director
francis J. Quinneditorial advisor
Patrick Burnsonexecutive editor
Sarah E. PetrieManaging editor
Jeff Bermangroup news editor
John Kerrcontributing editor, global Logistics
Bridget McCreacontributing editor, technology
Maida Napolitanocontributing editor, Warehousing & Dc
John d. Schulzcontributing editor, transportation
Mike roachcreative Director
Wendy delCampoart Director
CoLuMNiStS
Elizabeth BaatzPrice trends
Mark Pearsonexcellence
Peter MoorePricing
John A. Gentle Wayne Bournesage advice
PEErLESS MEdiA, LLC A division of EH Publishing, inc.
Kenneth MoyesPresident and ceo eH Publishing, inc.
Brian CeraoloPublisher and executive Vice President
EditoriAL offiCE 111 speen street, suite 200 Framingham, Ma 01701-2000 Phone: 1-800-375-8015
MAGAziNE SuBSCriPtioNS start, renew or update your magazine subscription at www.logisticsmgmt.com/subscribe. contact customer service at: Web: www.logisticsmgmt.com/subscribeEmail: [email protected] Phone: 1-800-315-1578 Mail: Peerless Media P.o. Box 1496 Framingham, Ma 01701
ENEWSLEttEr SuBSCriPtioNS sign up or manage your FRee enewsletter subscriptions at www.logisticsmgmt.com/enewsletters.
rEPriNtSFor information about reprints, visit us at www.logisticsmgmt.com/info/reprints.
Logistics professionals are beginning to see the benefits of effectively applying data to their operations—in this case, their choice of transportation modes.
LM_1105_ViewPoint.indd 9 5/5/11 12:06 PM

2007 2008 2009 2010 2011 2012
135
131
127
123
119
115
% change (left scale) Index 2001=100 (right scale)
(2001 = 100)
Forecast
12
8
4
0
-4
-8
12
8
4
0
-4
-8
% CHANGE VS.: 1 month ago 6 mos. ago 1 yr. ago
General freight - local 2.9 3.1 2.7Truckload 1.9 5.1 6.9Less-than-truckload 3.2 8.0 8.5Tanker & other specialized freight 2.4 4.9 5.5
TruckingShippers often feel the sting of shifting inflationary winds before others in the economy, and we’re there again. In March, average transaction prices for LTL jumped 3.2% from the prior month and 8.5% from the same month last year. Average prices for TL hauling of general freight increased 6.9% above year-ago levels as did long-distance specialized freight trucking, where prices were up 6.6%. Only local trucking exhibited restraint, raising prices 2.7% above year-ago. Looking ahead, one dismal precursor remains: underlying costs to operate trucks have been inflating faster than prices. Our latest forecast calls for a 5.8% annual price increase in 2011, more than two percentage points higher than our previous forecast.
2007 2008 2009 2010 2011 2012
160
154
148
142
136
130
% change (left scale) Index 2001=100 (right scale)
(2001 = 100)
Forecast
15
10
5
0
-5
-10
15
10
5
0
-5
-10
% CHANGE VS.: 1 month ago 6 mos. ago 1 yr. ago
Rail freight 1.9 5.6 7.2 Intermodal 2.5 8.6 10.1 Carload 1.9 5.3 6.9
railThis economic recovery, no matter how nascent, combined with a good dose of negotiation power, has put rail industry prices back on the inflation track. In March, average prices for intermodal rail service increased 2.5%, which was the third significant monthly price hike in a row. The last time rail operators pushed through three consecutive large price increases was the spring of 2008, just before all U.S. transportation markets were forced to cut prices in the throes of the Great Recession. Now, in Q1, intermodal rail prices increased 7.8% above year-ago levels and carload rail tags gained 5.6%. Our trend forecast for all railroad industry prices shows the average rate of rail inflation returning to 5.3% in 2011.
2007 2008 2009 2010 2011 2012
160
150
140
130
120
110
% change (left scale) Index 2001=100 (right scale)
(2001 = 100)
Forecast
24
16
8
0
-8
-16
24
16
8
0
-8
-16
% CHANGE VS.: 1 month ago 6 mos. ago 1 yr. ago
Scheduled air freight 3.6 8.3 8.7Chartered air freight & passenger 0.1 0.9 0.7Domestic air courier 0.9 11.5 11.1International air courier 0.9 13.4 15.0
airAverage prices for flying cargo in U.S.-owned planes via sched-uled flights soared 3.6% from month-ago and 8.7% from same-month-year-ago price levels in March. On a year-over-year basis, fuel costs have skyrocketed over 30%, but transaction prices for these air cargo services have increased only around 8%. The airline industry helped itself by checking wage inflation. Indeed, wages and salaries have declined 3.2% on a year-over-year basis. As pressure from higher jet fuel costs show no sign of abatement, the inflation forecast for ship-pers buying air cargo services will be challenging. Just looking at air cargo on scheduled flights of U.S.-owned planes, our forecast been adjusted upward to an 8% average annual price hike in 2011.
2007 2008 2009 2010 2011 2012
185
175
165
155
145
135
% change (left scale) Index 2001=100 (right scale)
(2001 = 100)
Forecast
24
16
8
0
-8
-16
24
16
8
0
-8
-16
% CHANGE VS.: 1 month ago 6 mos. ago 1 yr. ago
Deep-sea freight 2.2 3.5 14.8Coastal & intercoastal freight 0.4 2.9 11.6Grt. Lks.-St. Lawrence Seaway 0.0 11.6 7.0Inland water freight 1.9 5.0 14.5
WaTerOverall, the U.S. waterborne transportation industry increased average transaction prices 1.1% from month-ago and 12.3% from same-month-year-ago in March. For the entire first quarter 2011, U.S.-owned vessels reported prices up 3.1% from previous quarter and up 10.3% above first quarter 2010. Impetus for inflation has come from all categories, with deep sea operators reporting the largest quarterly increase (up 13% from year-ago), followed by barges and ships on inland waterways (up 9.7%). Worldwide, Drewry Shipping Consultants predicts ocean carri-ers will drop rates by 13.2% in 2011, excluding fuel. Reading price trends reported by U.S.-owned ships in our database, our forecast continues to predict average annual prices up 5.1% in 2011.
Source: Elizabeth Baatz,Thinking Cap Solutions. E-mail: [email protected]
10 LOGISTICS MANAGeMeNT WWW.LOGISTICSMGMT.COM | May 2011
LM_1105_PriceTrends.indd 10 5/5/11 11:55 AM

LM0511_Ads.indd 11 5/3/11 3:14 PM

May 2011 | WWW.LOGISTICSMGMT.COM Logistics ManageMent 13
WASHINGTON, D.C.—Following a recent announcement that called for reducing United States oil imports by one-third in the next decade, Presi-dent Barack Obama last month rolled out a new energy-focused initiative focusing on trucking in a speech at a UPS facility in Landover, Md.
The initiative, entitled the National Clean Fleets Partner-ship, will help large companies cut down on diesel and gasoline usage in their fleets by meshing electronic vehicles, alternative fuels, and fuel-savings measures into their daily operations, according to the White House.
The two defined goals of this effort, said the White House, are to reduce fuel through the use of more efficient vehicles and tech-nologies, including hybrids, and replace gasoline and diesel pow-ered vehicles with advanced tech-nology vehicles or those that run on alternative fuels like electric-ity, natural gas, biodiesel, ethanol, hydrogen, or propane.
The five charter members are AT&T, FedEx, PepsiCo, UPS, and Verizon, companies that col-lectively represent five of the 10 largest fleets in the U.S. and own and operate more than 275,000
vehicles, according to the White House. The planned, near-term petro-leum reduction strate-gies under the National Clean Fleets Partner-ship will account for the deployment of more than 20,000 advanced technol-ogy vehicles and annual petroleum displacement topping more than 7 mil-lion gallons.
A sustainable transpor-tation and logistics expert lauded this plan, calling it a foundational step that will generate much more interest and acceptance of alternative powered vehicles as participants in the program will not be forced to shoulder the costs on their own.
“I have been waiting for several years to see this plan come to frui-tion,” said Brittain Ladd, global sup-ply chain consultant for Capgemini Consulting. “It’s not that corpora-tions or carriers are against the use of alternative fuel powered vehicles, they simply don’t want to have to bear the costs of converting their fleets.”
Companies like the five charter
members of this initiative can all bring scale to the table, which has long been a drawback to more widely accepted usage of alternative fuel and energy vehicles, according to Kevin Smith, president and CEO of Sustain-able Supply Chain Consulting.
The reason being, said Smith, is that it’s a losing battle for the majority of companies and consum-ers that don’t have access to things like hydrogen-powered vehicles, for example.
By Jeff Berman, group news editor
•Oberstarstressesneedforpartisancooperationandinfrastructureinvestment,p.14
•Schneidereyesshorter-haul,Mexicanfreightforintermodalshift,p.16
UPS, FedEx, AT&T, PepsiCo, and Verizon are the five charter members of a push to reduce petroleum dependence in U.S. fleets
White House unveils National Clean Fleets Initiative
inside
LM_1105_News.indd 13 5/5/11 11:51 AM

ORLANDO, Fla.—With political dividing lines sharper than ever, the role of transportation infrastructure in fostering economic growth is one which cannot have partisan-led objectives halting meaningful progress.
That sentiment was made clear by James Oberstar, former Chair-man of the House Transportation and Infrastructure Committee and Min-nesota Congressman, at last month’s NASSTRAC Logistics Conference and Expo in Orlando, Florida.
In a wide-ranging speech largely focusing on the role transportation plays in our nation’s strength, Oberstar pulled no punches when describing the biggest challenges the U.S. faces and what needs to happen for them to be overcome.
“Congestion affects economics, quality of life, and the delivery of goods, and that is the biggest challenge for you in serving your customers and
making America work,” Oberstar told the audience comprised of shippers and carriers.
And given the political dividing lines and tension in play, Oberstar noted that poli-tics is the busi-ness of the people and the policies of the nation. What is wrong in this mix, he said, is partisanship.
“But when par-tisanship is preva-lent and the busi-ness of the people becomes highly charged and polar-ized is when things break down,” he said. But an excep-tion to this parti-sanship, according
to Oberstar, was the House Transporta-tion and Infrastructure Committee he led from 2007-2011.
“I have never seen a Republican road or a Democratic bridge,” said Ober-star. “We can work together to build all American roads and bridges for the good of the country. When we stick together, we can pass good legislation.”
Aside from the current partisan dif-ferences, Oberstar said more priority needs to be placed on the movement of freight in the U.S., given the aging transportation system which is no lon-ger keeping pace with international trade.
This is key considering the U.S. transportation infrastructure system has long been the envy of the world, with Oberstar pointing out that would not be possible without the financial support of the Highway Trust Fund.
“The answer is American ingenuity and know-how and the will to make it work,” said Oberstar. “But today we are investing 1.9 percent of our GDP in our infrastructure. Europe is investing 5 percent, and China is investing 9 percent. You often hear things like ‘we will do more with less,’ but nobody does more with less with infrastructure.”
Looking to the future, Oberstar said that the U.S. population is slated to grow by more than 40 percent in the next 30 years to roughly 420 million people, with freight volumes expected to rise about 70 percent from current
levels in the next 10 years. “That growth is going to
put additional demands on our intermodal system,” said Oberstar. “If we don’t make the investments and don’t look ahead and do what’s right to deliver those investments, then goods will move more slowly, congestion will resume, people will spend more time in traffic, air quality will deteriorate, fatalities will increase, and our quality of life will be diminished.”
—Jeff Berman, Group News Editor
“The thing we lose sight of is that alternative energy sources come from somewhere, like coal or oil-driven plants,” said Smith. “Rather than being renewable, it pushes the petroleum reliance further upstream. Hydrogen, though, appears to be a much more renewable resource for operating vehicles, because it is actu-ally clean. But to do that you need scale.”
The White House plan to find the best alternative energy resources is the right thing to do, said Smith. “Clean Fleets providing an impetus to facilitate these efforts for fleets is something that can help eventually pave the way for an economical renewable energy source to power vehicles,” said Smith.
But he cautioned that if compa-nies like UPS and FedEx are hav-ing success, and if federal mandates require all companies to do the same thing a few years from now, it could be difficult for small carriers
to switch to alternative fuel sources because of cost pressures. Until these types of things are accessible to everybody, it will be difficult to mandate, he added.
The National Clean Fleets Partner-ship has been endorsed by the Ameri-can Trucking Associations (ATA). But like Smith at SSCC, the ATA pointed out some caveats.
“The trucking industry is a very diverse industry,” said Rich Moskow-itz, ATA vice president and regulatory affairs counsel. “What works well for one company may not work as well for another. As we begin to transi-tion to alternatives, it’s important to remember that there’s not going to be a ‘one size fits all’ approach. That is true in respect to things like natural gas, hybrids, and biofuels. Depend-ing on the industry you operate in, some of these alternatives may be attractive and some may not be able to be implemented.” M
14 Logistics ManageMent WWW.LOGISTICSMGMT.COM | May 2011
government
Oberstar stresses need for partisan cooperation and infrastructure investment in NASSTRAC keynote
“I have never seen a Republican road or a Democratic bridge.”
—James Oberstar
LM_1105_News.indd 14 5/5/11 11:51 AM

The Sprint 3G Network reaches over 271 million people. ©2011 Sprint. Sprint and the logo are trademarks of Sprint.
It has ETDs and ETAs down to a T. Sprint’s mobile fl eet management
applications are the next best thing to driving the entire
fl eet yourself. With a long list of indispensable tools like GPS
tracking, fuel-effi ciency reports and wireless time cards,
you’ll be able to manage your fl eet every step of the way.
And you’ll be able to make time-saving adjustments right
there on the spot. Only on the Now Network.™
sprint.com/transportation 1-800-SPRINT-1 (1-800-777-4681)
BlackBerry® Bold™ 9650 smartphone
“Sprint showed the biggest improvement in customer experience across 14 industries.”–Forrester Research Report: Customer Experience Index 2010
LM0511_Ads.indd 15 5/3/11 3:14 PM
Wherever you find business, you’ll find us.Today, Union Pacific coordinates the global reach of ocean carriers with the economy of our vast rail network plus the flexibility of truck transit. So, even if you don’t have rail service at your door, we can still give you unmatched, door-to-door service. Find out more at UnionPacific.com or call (800) 877–0513.
UPcomm110987 Log Management Half Spread.indd 1 4/5/11 1:42 PM
GREEN BAY, Wisc.—Schneider National, the nation’s second-largest truckload carrier which traditionally has been a major player in long-haul intermodal traffic, is increasingly mar-keting its shorter-haul freight options in a major shift that is sure to impact ship-per choice and rates.
Steve Van Kirk, Schneider Nation-al’s senior vice president of intermo-dal commercial management, told LM that service improvements by the rails, plus issues affecting driver avail-ability, are making shorter-haul inter-modal moves more attractive to many customers. Schneider moves about one-third of its total freight loads by intermodal, according to trucking industry sources.
“Overall, driver availability is an issue,” said Van Kirk. “Due to demo-graphics and the impact of CSA 2010, you can debate how many drivers might not be drivers going forward. I’ve seen estimates as high as 250,000. But even if it’s only 100,000, so what? You still have rising freight demand and less people entering our industry to become drivers…and that helps intermodal, especially in shorter lengths of haul.”
The average length of haul for an intermodal move is 1,575 miles, according to Larry Gross, consultant with FTR Associates and principal of Gross Transportation Consulting. But increasingly, traditional truckload carri-ers such as Schneider and J.B. Hunt are targeting lengths of haul under 1,000
miles as rail services improve, fuel costs increase, and driver availability becomes tougher and wages increase.
Traditionally, intermodal has always been strong in the 2,000-mile Chicago-to-Los Angeles, Chicago-to-Portland runs. Chicago-to-Dallas is another strong intermodal market historically.
But now truckers are eying shorter-haul runs—700 miles from Columbus, Ohio to Kansas City, for example—as potential markets to increase intermodal use. This has helped drive intermodal freight vol-umes up 10 percent from year-ago volumes—11 percent on interna-tional moves, 9 percent domestic. That is roughly twice the rate of growth of all North American rail traffic, and three times the growth in the U.S. trucking industry.
“What you’re seeing is the really long lengths of haul will not grow at previous levels,” Van Kirk explained. “There will
truckload
Schneider eyes shorter-haul, Mexican freight for intermodal shift
LM_1105_News.indd 16 5/5/11 2:16 PM
be more growth at intermediate lengths of haul—1,000 miles or less. That’s what’s driving the growth.”
Truck driver hours-of-service limits a driver to no more than 600 miles in a day. So anything over that amount is ripe to be used for intermodal as long
as rail service is reliable, he said. “That’s where intermodal can deliver a lot of value for capacity at a very competitive price point,” Van Kirk says.
Besides shorter hauls, Schneider wants to increase intermodal usage in and out of the Northeast, where back-
hauls can be problematic for truckload moves. “We like to ship into the North-east on intermodal. It helps with our load balance. Demand is great going into the Northeast, but because of the imbalance coming back, intermodal is a great option.”
Van Kirk’s advice to shippers is easy. “If I were a shipper, I would start with anything moving more than 500 miles and look at intermodal.”
Another area of intermodal growth for Schneider is cross-border moves in and out of Mexico. Up until a couple of years ago, Schneider basically trucked goods to the border, transloaded there and used Mexican power units for final deliv-ery south of the border. It was costly, and cargo security was an issue, he said.
With the help of the Kansas City Southern—the “NAFTA Railroad”—Schneider has redesigned its Mexican freight network in the past two years.
—John D. Schulz, Contributing Editor
Wherever you find business, you’ll find us.Today, Union Pacific coordinates the global reach of ocean carriers with the economy of our vast rail network plus the flexibility of truck transit. So, even if you don’t have rail service at your door, we can still give you unmatched, door-to-door service. Find out more at UnionPacific.com or call (800) 877–0513.
UPcomm110987 Log Management Half Spread.indd 1 4/5/11 1:42 PM
“The really long lengths of haul will not grow at previous levels, there will be more growth at intermediate lengths of haul—1,000 miles or less. That’s what’s driving the growth.”
—Steve Van Kirk, Schneider National
LM_1105_News.indd 17 5/5/11 2:16 PM
18 Logistics ManageMent WWW.LOGISTICSMGMT.COM | May 2011
Moore on
DISTR
IBUTION
Peter Moore is a program faculty member at the University of Tennessee Center for Executive Education, adjunct professor at The University of South Carolina-Beaufort, and vice president of Celerant Consulting, a supply chain advisory firm. Peter can be reached at [email protected].
Bucking the pricing trend in rail/intermodal
in my march column i wrote about encouraging competition in intermodal and international shipping by promoting infrastructure projects. But what can we do about better controlling the core cost in domestic and land bridge movements, also known as rail rates?
As a captive rail shipper for many years, I learned the hard way that North American railroads con-stitute a classic oligarchy with limited competi-tion, strong lobbies, and varying quality of service. I respect the value and efficiencies that make the case for rail, but I’m sure that with the current trends in energy savings, equipment restrictions, and increased trucking regulation, we’ll continue to see general price increases in bulk rail and intermodal as more shippers seek to utilize these modes.
Shippers may feel that there’s very little that can be done to buck the rail and inter-modal price trends. I’m here to say that’s not true. In fact, rail service buyers have several options, but it takes hard work and planning to optimize these modes.
First, the shipper needs to put on an “analytical hat” and look at the modes utilized as a portfolio that in aggregate has a mixed cost per ton/mile or per unit of product sold. It’s this aggregate that offers perspective on the role of rail and intermodal. Rail costs per ton/mile generally compare favorably with highway and air costs. In the case of bulk commodities rail has price competi-tion from water. The first cut at savings then is modal shifts and opportunities to introduce competition.
A second is network optimization. Think in terms of what a change of distribution points and modes might mean to the cost per ton/mile. Network mod-eling provides options to rethink your network and that of your suppliers and customers. One example is analyzing potential intermodal transloading loca-tions and opportunities to leverage two modes in delivering or receiving goods.
Third, explore options for alternate bulk equipment usage. One of these is larger “jumbo” rail cars to maxi-mize payloads. Alternatively, perhaps you can join those who are moving more bulk in intermodal containers. In this case I suggest “thinking inside the box.”
Fourth, look to see if there’s anything you’re doing that’s unnecessarily increasing your rail costs. Examples are equipment detention, special service requests, and lack of a post-audit of bills. My experience as a former internal auditor for a Class 1 railroad is that they have about a 1 percent error rate.
Before I leave bulk rail, I encourage every bulk rail
shipper to look at rate comparison services based upon historic waybill analysis in order to understand how each of your moves fits in the railroad network and at what pricing levels.
In intermodal, load factors and routes are important as well. Equipment balancing and optimizing the carrier network can yield real savings for you and the intermo-dal provider. As in highway, you need to understand what’s moving in the lanes that you want to utilize. Get out of the office, visit the intermodal yard and see what’s moving. If you see a large number of empty containers being loaded for backhaul, get aggressive. If you see loads but not enough to fill a train, get aggressive. You might well see one of your “truckload” moves being quietly loaded onto a railcar for a portion of the route.
In rail, like other services, you need information. If you find you don’t know enough about your rail moves, you need to start investing in discussion with providers, asking for data, and doing some analysis to understand these modes of transport as well as you know your own products. With planning and creative thinking you can buck the current rail and intermodal pricing trends. M
If you see a large number of empty containers
being loaded for backhaul, get aggressive.
If you see loads but not enough to fill a train,
get aggressive.
LM_1105_MooreOnPricing.indd 18 5/5/11 11:48 AM

Driving industry change.
Shipping is easy with FedEx Freight. One truck arrives at your dock for all your LTL (less-than-truckload) shipping needs.
Choose FedEx Freight® Priority when speed is critical to your supply chain needs or FedEx Freight® Economy when you
can trade time for savings. Either way, you can count on FedEx reliability, all-points coverage and easy online shipping tools.
Take the weight off with FedEx Freight: one pickup and delivery, one Bill of Lading, one invoice statement and one FedEx
representative. Simple. Go to fedex.com/shipfreight7.
One pickup and delivery. Because the best things in life are simple.
All services are subject to the terms and conditions of the FXF 100 Series Rules Tariff.
Bob Zimmer, Manager Corporate Traffi c, Standard Register
By offering two shipping services in the same network, FedEx Freight has fi lled a long-standing void in the LTL industry: the ability to conveniently segment time- sensitive from inventory-replenishment shipments. Others will likely follow their lead.
LM0511_Ads.indd 19 5/3/11 3:14 PM

20 Logistics ManageMent WWW.LOGISTICSMGMT.COM |May 2011
Pearson on
The New Panama Canal: Ground-breaking implications for global supply chains
Mark Pearson is the managing director of the Accenture’s Sup-ply Chain Management practice. He has worked in supply chain for more than 20 years and has extensive international experience, particularly in Europe, Asia, and Russia. Based in Munich, Mark can be reached at [email protected]
Construction is on schedule and the first ship is expected to pass through a greatly expanded Panama Canal on August 14th, 2014—100 years to the day from the passageway’s first use.
This $5.2 billion upgrade is truly significant. It will deepen and widen both the Pacific and the Atlantic entrances, enlarge the navigational channels, and add a third set of expanded locks connecting the two oceans. As a result, the Panama Canal will be able to accommodate the world’s largest container ships and pass-through time will decrease.
There are many ways that this ground-breaking achievement could re-level the oceanic playing field for shippers that move goods around the Western hemisphere. For example:
• Companies that import a high volume of manu-factured goods from Asia and distribute those goods across North America may benefit from new access routes and distribution hubs.
• New markets could open for China to source raw materials, such as coal from Colum-bia and iron ore from Venezuela. These markets do not currently have a cost-effective transporta-tion option.
• Shipping oil to the U.S. from Ecuador might become less expensive than the current point of origin: Nigeria. Venezuela could decide to shift its supply from the U.S. to China.
• The expanded Canal could become a key transit point for new vessels carrying liquefied natural gas from Trinidad to Chile and from Peru to Texas.
• Overland transportation between South American countries is complicated by inadequate rail and highway systems, as well as the Andes Mountains. Passage around the southern tip of South America is arduous in winter, and an expanded Canal could make those obsolete.
• U.S. grain exports to Asia move either by barge or rail to Southern Louisiana and on to Asia via a Panama Canal transit or by rail to the U.S. West Coast and then on to Asia. New advantages will now be associated with the Canal option.
• Moving oil from ship to ship via pipeline across the Isthmus of Panama may no longer offer advantages over larger tankers that will now be able to transit the Canal.
• Perishables from western South and Central America may no longer need to be transported on refrigerated ships to the U.S. East Coast. With shorter transit times through the Canal, they can instead be transported in containers.
Eastbound: Asia to US West Coast (75% of Asian imports)Eastbound: Asia to Panama Canal to US East Coast (19% of Asian imports)Westbound: Asia to Suez Canal to US East Coast (6% of Asian imports)
Today’s container routes for goods from Asia to U.S.
LM1105_Excellence.indd 20 5/5/11 11:37 AM

May 2011 | WWW.LOGISTICSMGMT.COM LOGISTICS MANAGEMENT 21
Pearson on
MYRIAD STAKEHOLDERS AND SUPPLY CHAIN TRADEOFFS
All manner of entities, countries, and companies (The Panama Canal Author-ity; the Republic of Panama, U.S. ports along the east, west, and gulf coasts; railroads; trucking companies) will potentially be affected by the Canal’s enhanced capabilities. The core reality, however, is more opportunity combined with more complexity.
For example, while vessels are oper-ated by ocean carriers, routing decisions are made by supply chain managers for the companies shipping freight. Speci� c estimates vary, but American ports antic-ipate an increase in shipments rerouted through the Panama Canal when the expansion is completed.
Cities hoping to attract the business include New York, Boston, Norfolk, Charleston, Miami, Jacksonville, Port Everglades, Savannah, New Orleans, and Houston. However, there are many complex trade-offs that must be balanced by each shipper's supply chain decision-maker. Tradeoffs include speed, reliability, and economy across various or multiple modalities; regulatory concerns; labor requirements and availability; varying affects on the environment; and port char-acteristics such as water depth, marine ter-minal design, intermodal connectivity, and availability of warehousing. Making the right choices will require solid expertise for reaching sourcing decisions, choosing routes and ports, and locating distribution centers and other infrastructure.
Leading-edge technology will also be needed to help freight buyers determine the true cost of any one route. Such tools will also need to calculate total landed cost: the sum of all expenses associated with developing, producing, delivering and selling a product. Along with identi-fying optimal routes, these same calcula-tions might also reveal that a company’s current low-cost supply source is no longer the best overall choice.
Companies may further bene� t by adding � exibility to their supply chains—leveraging people, processes, and tech-nology to better route, execute, and track the movement of goods at the SKU level as they are transloaded from a single ocean container onto multiple domes-tic containers bound for distribution
centers. This ability could reduce inventory and storage costs, while enhancing companies’ ability to respond rapidly when customers’ needs change.
And of course, the best people will be needed to fully leverage the new Canal’s capabilities: those
with the skills and empower-ment to make real-time decisions based on reliable demand fore-casts. Like so many supply chain events, it’s physical changes that make the news, but people that formulate and help ensure effec-tive responses. �
LM1105_Excellence.indd 21 5/5/11 11:37 AM
22 Logistics ManageMent WWW.LOGISTICSMGMT.COM | May 2011
oil has recaptured the attention of the popular press recently, and has done so for one important rea-son: the price for West Texas Intermediate (WTI)—the benchmark crude stream traded on the New York Mercantile Exchange (NYMEX)—sprinted past $100 in the first week of March and past $110 in the first week of April.
While this is an important story, an even more impor-tant story has thus far escaped the headlines. The situ-ation described here has implications on diesel prices and the bottom lines of shippers and carriers across the U.S. Communicating this situation, however, requires a working understanding of futures markets.
The price for a futures contract represents the aggre-gate sentiment of the market—the point of equilibrium between all buyers and sellers of futures contracts—and as such, futures markets provide a valuable price search function. When it comes to oil futures, bullish sentiments prevail when an oil supply dis-ruption occurs or when news portending better than expected economic performance is released.
By contrast, the bears emerge from hibernation when significant new supply is brought online, or, as is more often the case, when the economic outlook is revised down. Hence just as oil traders can push prices up, their same trading behaviors can push the price down—and there are plenty of winners and losers during both bull and bear markets.
When the majority of market participants believe that oil demand will climb faster than supply, the market goes into contango, meaning that long term futures contracts are valued more highly than near term contracts. And when in contango, the market exerts powerful pressures on the owners of physical product to stockpile. After all, why should the owner of physical product sell today a product that will be worth more tomorrow? And thus the futures market influences the physical market.
But herein lies the problem. Physical storage is lim-ited, and as storage tanks fill up, physical products are pushed to the market. Hence any relative shortage of end use products caused by stockpiling along the sup-ply chain will be temporary. This is why traders keep a
close eye on crude oil and refined product inventories. The tricky task is deciphering whether the change in
inventories is due to buyers being unwilling or unable to purchase fuels at the prevailing price (too high) or whether sellers are unwilling to sell at that price (too low). If the high price of crude (which was set by speculators) is not supported by the fundamentals of the physical fuels markets, which is to say if fuels don’t sell at a price point that justifies the traded price, the high price for paper barrels will not be sustained.
Considering that diesel prices, at least through March, have outpaced the front month futures price for West Texas Intermediate, it appears that the futures market has not created a speculative bubble. Instead, demand for oil products has risen as the U.S. and many Eurozone economies continue along the path of recovery and emerging economies continue to grow. The rise in demand has not been met by a sufficient
increase in the supply of the right types of crude from the right places.
Saudi crude is not a perfect substitute for the 1.3 million barrels per day of Libyan crude that European refineries are configured to process. Libyan crude is both lighter and lower sulfur than Saudi crude. Because it is lighter, Libyan crude produces a higher fraction of diesel through fractional distillation.
To get an equal amount of diesel from Saudi crude requires secondary processing, which is expensive and energy intensive. Removing the sulfur from Saudi crude also requires further processing which is costly from a financial and energetic perspective. Perhaps even more importantly, the pace at which heavy sour crudes can be refined is slower than light sweet crudes. The shutter-ing of exports from Libya has caused demand for other light sweet crudes like Brent Blend to increase; and, in turn, the price for Brent and other light sweet crudes has spiked.
There is a single exception to this trend: the price for West Texas Intermediate has grown at a much slower rate than other light sweet crude streams. Looking back
Keep your eyes on the road, not on the price of oil
Demand for oil products has risen as the U.S.
and many Eurozone economies continue along
the path of recovery and emerging economies
continue to grow.
Andreoli on
DISTR
IBUTION
Derik Andreoli, Ph.D.c. is the Senior Analyst at Mercator International, LLC. He welcomes any comments or questions, and can be contacted at [email protected].
LM_1105_Oil_Fuel.indd 22 5/5/11 11:54 AM

May 2011 | WWW.LOGISTICSMGMT.COM Logistics ManageMent 23
at the year-over-year price change for the top 11 benchmark crude streams, we see that the per barrel price for WTI increased by 26 percent, while the price for every other light sweet crude stream increased by more than 40 percent.
The price for Brent Blend has increased 43 percent despite the fact that WTI is slightly lighter and sweeter. And the reason for this discrepancy is that Brent Blend is delivered to the European market and is a near substitute for the Libyan Es Sider crude stream.
The WTI price anomaly can be explained by the recent shift in the geography of oil production in North America as Canadian syncrude and shale oil from the Bakken forma-tion in North Dakota ramp up. Both of these crude streams contribute to the bottleneck in Cushing, Okla., the delivery point for the NYMEX traded West Texas Intermediate crude stream; and this bottleneck has suppressed the WTI price for the reasons described above.
Of course, only a portion of the oil supplied to refineries across the entire U.S. is delivered through Cushing, and as a consequence, the refiner average acquisition cost (RAAC) has for the first time in the history of the Energy Informa-tion Agency’s data climbed above the WTI spot price. This means that the WTI futures and spot prices are no longer indicative of the price that refiners pay to acquire crude, and are no longer adequate for setting expectations for future fuel prices.
Just how big and out of the ordinary is the spread
between the WTI and RAAC? Between January 1992 and December 2003, the average spread was just under $2.00 per barrel, meaning that refiners paid $2.00 less for a barrel of crude than the WTI spot average. Between January 2004 and June 2007, this spread had climbed as high as $8.16 per barrel, and the average spread over this period was $5.22. Between July 2008 (the height of the price spike) and December 2010, the average of the spread fell to $3.67, but volatility remained high (bouncing back and forth from $2.00 to over $4.00).
Between December 2010 and February 2011, however, the WTI-RAAC spread fell from $3.29 to negative $3.92. This downward movement is rooted in the structural change that has affected Cushing inventories and suppressed only the WTI price.
From a practical perspective, fuel consumers should not be concerned with the WTI price so much as the price that refiners pay for crude. Historically, WTI has been a good estimator of the RAAC, but this is no longer the case. There has been an absolute swing of $7.21 cents per barrel over the last few months. One way to interpret this swing is that relative to the price of WTI, the average refiner acquisition cost has increased somewhere between $4 per barrel and $8 per barrel on top of the rising price of WTI. This means that in the months heading into the summer driving season, the price for diesel and other fuels will increase far more rapidly than the WTI suggests. M
Calvin Coolidge
The Business of Alliance Shippers, Inc. is . . .
“To Manage Our Customers’ Business.”®
For more information about all of our services, visit us at: www.alliance.com
® denotes a registered trademark of Alliance Shippers, Inc.
asi_halfpg_LM_final 4/25/11 8:40 AM Page 1
Andreoli on
DISTR
IBUTION
LM_1105_Oil_Fuel.indd 23 5/5/11 11:54 AM

GUESS’ distribution evolution
Roman Cho
warEhoUSE & dc manaGEmEnt
24 Logistics ManageMent WWW.LOGISTICSMGMT.COM | May 2011
“One of the great things about our WMS is how we’ve been able to bolt on just about anything we need. The way the system is configured allows for a number of access points in the software; and we’ve never had an absolute ‘no’ in terms of what we needed to do.”
—Tom Boyle, project manager, GUESS
LM_1105_GuessWMS.indd 24 5/5/11 1:42 PM
GUESS’ distribution evolution
May 2011 | WWW.LOGISTICSMGMT.COM Logistics ManageMent 25
BY maida napolitano, contriButing editor
Established in 1981, GUESS has grown from its early beginnings of selling just jeans to a global brand with a full offering of apparel
and accessories in over 80 countries. In North America, this fashion-forward company remains an iconic leader in the apparel industry, shipping 30 mil-lion units annually to major department stores, over 400 specialty retail stores, and directly to consumers online.
The company has grown dramati-cally from a $6 million family business in 1982 to a global fashion empire with revenues of over $2 billion in 2010. Such exponential growth over three decades is accomplished in part by a strong distribution system; but back in 1999—just about halfway through the company’s journey—this distribution system was showing clear signs of wear.
In fact, its Los Angeles distribution center (DC) was bursting at the seams. “We literally had goods in tents out in the parking lot because we had no room inside the DC,” recalls GUESS’ proj-ect manager Tom Boyle. Not only was the DC overflowing, but its distribu-tion network was also grappling with issues of lengthy transit times to most of its customers. Merchandise had to be regularly transported from Los Ange-les clear across the country to where 60 percent to 70 percent of its wholesale
For more than a decade, the fashion giant’s WmS has kept pace with several ERp integrations and the installation of a slew of materials handling equipment—all in an effort to keep the company on top of the fickle fashion world.
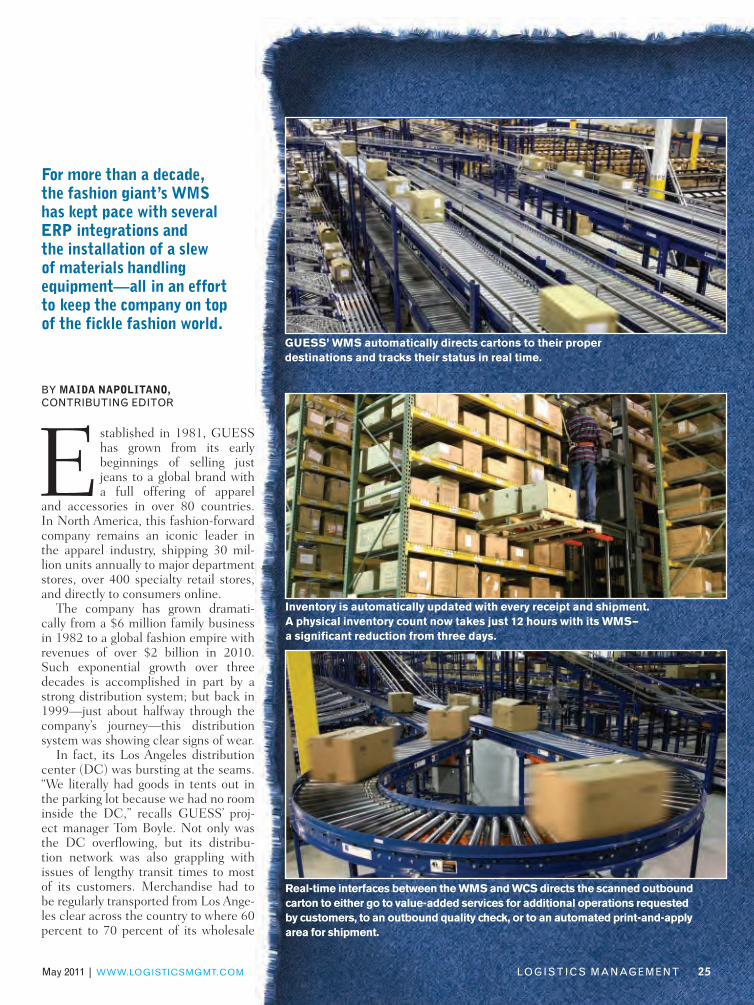
GUESS’ WMS automatically directs cartons to their proper destinations and tracks their status in real time.
Inventory is automatically updated with every receipt and shipment. A physical inventory count now takes just 12 hours with its WMS— a significant reduction from three days.
Real-time interfaces between the WMS and WCS directs the scanned outbound carton to either go to value-added services for additional operations requested by customers, to an outbound quality check, or to an automated print-and-apply area for shipment.
LM_1105_GuessWMS.indd 25 5/5/11 11:45 AM

Warehouse & DC Management
26 Logistics ManageMent WWW.LOGISTICSMGMT.COM | May 2011
business was located. Systems-wise, the company was using
an off-the-shelf, relatively manual, pick-pack system that didn’t interface well with any of their other software or hard-ware. “This old system was built for a much smaller business, and as we grew, the controls that we needed in order to ensure that our inventory was under control just didn’t exist,” adds Boyle.
So in early 1999, GUESS hired Kurt Salmon Associates (KSA), a global management consulting firm, to assist the retailer in achieving two goals: the selection of a site for a new DC to improve service times to cus-tomers east of the Mississippi; and the selection of a new, full-featured ware-house management system (WMS) that would help GUESS execute this new strategy.
Keeping the company’s business needs in mind, KSA conducted a full-scale site selection study. Lower labor rates, impressive tax breaks, and the opening of a few well-known carrier hubs were the principal reasons that had the team zeroing in on a brand new, 580,000-square foot facility in Louis-ville, Ky.
Once the building selection was made, a very aggressive schedule was launched to search and install a best-of-breed, advanced WMS for this new facility. The team selected Manhattan Associates’ WMS (then called PkMS, now known as WM), and a two-phased roll-out schedule was initiated. In December 1999, GUESS’ new WMS went live with the inbound functions of receiving and putaway, followed closely in January 2000 by outbound functions of pick-ing, packing, and shipping.
But all this was just the beginning. Over the next decade, the company
transformed its distribution operation out of its Louisville site to meet vari-ous business challenges. And with each transformation, their WMS would be repeatedly tried and tested. Over the next few pages we’ll follow how this fashion giant’s WMS kept pace with a new ERP software solution and the installation of a whole slew of materi-als handling equipment in an effort to keep the company on top of the fickle fashion world.
TransforMaTion #1: new eRPAs part of its continuing quest to effi-ciently deliver uncompromising qual-ity to its customers, the company’s first transformation occurred in 2003 when the company decided to implement a new ERP software solution called Jesta I. S. (formerly Essentus). “The overall project for this new ERP lasted a year, but the integration with the WMS took about four months, and that’s due to ‘mapping,’” says Boyle.
Bryan Feddersen, Manhattan Asso-ciates’ senior manager for its client services organization and the lead for the GUESS project, explains this map-ping process: “It’s a very detailed and involved exercise to map all of the data elements flowing between a WMS and the host ERP system. In most cases, you do not have the same data structure and integrity requirements on the host that you do in the WMS.” He adds that data needs to be translated into a for-mat that is valid and recognizable to the system receiving the data and also to the system sending the data. The data being mapped may range from inbound carton information at receiving to out-bound order data and store distribution at shipping.
Fortunately, Jesta had integrated with Manhattan’s WMS many times in the past in similar projects with other supply chain organizations; thus, much of its mapping had already been
pre-configured. “Host interface design is always complex, especially when it is the first time you’ve worked with a particular vendor’s software,” says Fed-derson. “But with several hundred cli-ents in our client base, we’ve been able to build a repository of knowledge and experience from working with a large number of different host systems.”
TransforMaTion #2: sePaRating whoLesaLe and RetaiLAfter a couple of years, another major change further tested the flexibility of its WMS. For years, inventory for both wholesale and retail had always been combined, and wholesale sold to retail as if retail were a wholesale customer.
In 2005, GUESS decided to split its business into two separate entities with each owning their own inventory—but still running both out of one DC. Not only did the WMS have to be modified to reflect this split, but it now had to integrate with retail’s JDA ERP system.
“Dividing the inventory into retail and wholesale was not tremendously difficult,” recalls Manhattan’s Fedder-sen. “The complexity was in trying to decide when you made an adjustment whether you made an adjustment to retail’s or to wholesale’s inventory.”
Louisville’s distribution team suc-cessfully tested the concept over two weekends, both operationally and within the WMS, bringing in full crews
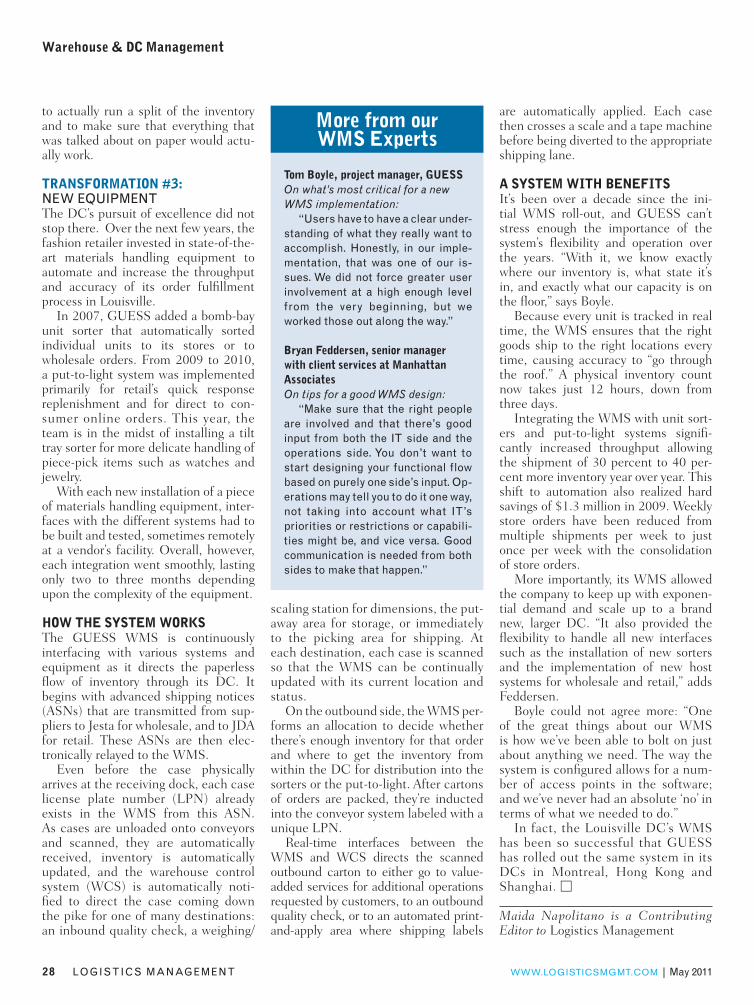
Jesta I.S.(Wholesale ERP)
JDA(Retail ERP)
Guess’ WMSSolution Provider: Manhattan Associates
Platform: IBM iRF Equipment: Motorola
Put To Light System
Unit Sortation SystemsX
CartonSortation System
Print and Apply System
WCS
Louisville, Kentucky DC
How different systems and equipment interact with Guess’ warehouse management system for the Louisville DC.
LM_1105_GuessWMS.indd 26 5/5/11 11:45 AM
to actually run a split of the inventory and to make sure that everything that was talked about on paper would actu-ally work.
TransformaTion #3: New equipmeNtThe DC’s pursuit of excellence did not stop there. Over the next few years, the fashion retailer invested in state-of-the-art materials handling equipment to automate and increase the throughput and accuracy of its order fulfillment process in Louisville.
In 2007, GUESS added a bomb-bay unit sorter that automatically sorted individual units to its stores or to wholesale orders. From 2009 to 2010, a put-to-light system was implemented primarily for retail’s quick response replenishment and for direct to con-sumer online orders. This year, the team is in the midst of installing a tilt tray sorter for more delicate handling of piece-pick items such as watches and jewelry.
With each new installation of a piece of materials handling equipment, inter-faces with the different systems had to be built and tested, sometimes remotely at a vendor’s facility. Overall, however, each integration went smoothly, lasting only two to three months depending upon the complexity of the equipment.
How THe sysTem worksThe GUESS WMS is continuously interfacing with various systems and equipment as it directs the paperless flow of inventory through its DC. It begins with advanced shipping notices (ASNs) that are transmitted from sup-pliers to Jesta for wholesale, and to JDA for retail. These ASNs are then elec-tronically relayed to the WMS.
Even before the case physically arrives at the receiving dock, each case license plate number (LPN) already exists in the WMS from this ASN. As cases are unloaded onto conveyors and scanned, they are automatically received, inventory is automatically updated, and the warehouse control system (WCS) is automatically noti-fied to direct the case coming down the pike for one of many destinations: an inbound quality check, a weighing/
scaling station for dimensions, the put-away area for storage, or immediately to the picking area for shipping. At each destination, each case is scanned so that the WMS can be continually updated with its current location and status.
On the outbound side, the WMS per-forms an allocation to decide whether there’s enough inventory for that order and where to get the inventory from within the DC for distribution into the sorters or the put-to-light. After cartons of orders are packed, they’re inducted into the conveyor system labeled with a unique LPN.
Real-time interfaces between the WMS and WCS directs the scanned outbound carton to either go to value-added services for additional operations requested by customers, to an outbound quality check, or to an automated print-and-apply area where shipping labels
are automatically applied. Each case then crosses a scale and a tape machine before being diverted to the appropriate shipping lane.
a sysTem wiTH benefiTsIt’s been over a decade since the ini-tial WMS roll-out, and GUESS can’t stress enough the importance of the system’s flexibility and operation over the years. “With it, we know exactly where our inventory is, what state it’s in, and exactly what our capacity is on the floor,” says Boyle.
Because every unit is tracked in real time, the WMS ensures that the right goods ship to the right locations every time, causing accuracy to “go through the roof.” A physical inventory count now takes just 12 hours, down from three days.
Integrating the WMS with unit sort-ers and put-to-light systems signifi-cantly increased throughput allowing the shipment of 30 percent to 40 per-cent more inventory year over year. This shift to automation also realized hard savings of $1.3 million in 2009. Weekly store orders have been reduced from multiple shipments per week to just once per week with the consolidation of store orders.
More importantly, its WMS allowed the company to keep up with exponen-tial demand and scale up to a brand new, larger DC. “It also provided the flexibility to handle all new interfaces such as the installation of new sorters and the implementation of new host systems for wholesale and retail,” adds Feddersen.
Boyle could not agree more: “One of the great things about our WMS is how we’ve been able to bolt on just about anything we need. The way the system is configured allows for a num-ber of access points in the software; and we’ve never had an absolute ‘no’ in terms of what we needed to do.”
In fact, the Louisville DC’s WMS has been so successful that GUESS has rolled out the same system in its DCs in Montreal, Hong Kong and Shanghai. M
Maida Napolitano is a Contributing Editor to Logistics Management
warehouse & DC management
28 Logistics maNagemeNt WWW.LOGISTICSMGMT.COM | may 2011
more from our wms experts
Tom boyle, project manager, GUessOn what’s most critical for a new WMS implementation:
“users have to have a clear under-standing of what they really want to accomplish. Honestly, in our imple-mentation, that was one of our is-sues. we did not force greater user involvement at a high enough level from the very beginning, but we worked those out along the way.”
bryan feddersen, senior manager with client services at manhattan associatesOn tips for a good WMS design:
“make sure that the right people are involved and that there’s good input from both the it side and the operations side. You don’t want to start designing your functional flow based on purely one side’s input. op-erations may tell you to do it one way, not taking into account what it’s priorities or restrictions or capabili-ties might be, and vice versa. good communication is needed from both sides to make that happen.”
LM_1105_GuessWMS.indd 28 5/5/11 11:45 AM

LM0511_Ads.indd 29 5/3/11 3:14 PM

transportation best practices/trends
30 Logistics ManageMent WWW.LOGISTICSMGMT.COM | May 2011
Whether it’s truck-rail for domestic freight or ocean-rail for international moves, the situation is the same no matter how you analyze the num-bers: Intermodal is the hottest game in town.
At the end of this year’s first quarter, inter-modal freight volumes are up 10 percent from year-ago volumes—11 percent up on international moves and 9 per-cent up on domestic moves. That’s roughly twice the rate of growth of all North American rail traffic, and three times the growth in the U.S. trucking industry.
“Intermodal is looking very strong as we roll into the middle of 2011,” says Larry Gross, an intermodal expert and a consultant with FTR Associates and principal of Gross Transportation Consulting. “It’s been a bang-up year.”
Analysts, academics, and some industry officials have long called intermodal the “sexiest” part of freight transpor-tation due to several factors. One is its inherent ability to take the best efficiencies from the various modes—cheap ocean transport, long-haul rail shipment, and just-in-time truck transport—and use them in one coordinated move. And then, of course, there’s intermodal’s “green” appeal as it reduces overall diesel fuel usage.
For various reasons, from the staggering rise in crude oil prices to shippers and manufacturers increasingly wanting to reduce their carbon footprint and “go green,” analysts pre-dict intermodal growth will continue to exceed overall freight demand as the nation ramps up from the recession.
So how big is intermodal in 2011? According to the Inter-modal Association of North America, intermodal revenue was $13.5 billion. About 45.9 percent of that is purely domestic moves with international accounting for the rest.
While IANA does not do forecasts, analysts are conser-vatively predicting total intermodal growth this year to rise between 5 percent and 6 percent year-over-year, more if the price of crude oil continues unabated.
And while Class I rail volumes were up 5.1 percent year-over-year for all five North American railroads (6.1 percent for the four U.S. carriers), the intermodal share at each of the five railroads was significantly higher in the first quarter of 2011. Depending on the carrier, intermodal rose between 8 percent and 10 percent year-over-year at Burlington North-ern Santa Fe and Union Pacific in the West as well as CSX and Norfolk Southern in the East.
Over the next few pages we’ll example the factors that are driving this impressive growth as well as how shippers and carriers are best using the intermodal option in their trans-portation tool kit.
Under the hot lightsShippers are being inundated right now. Fuel surcharges are rising to the point where they can be 50 percent of their bill for a long-haul truckload move.
And while this is going on, there are growing capacity concerns in the trucking industry. Because of CSA 2010 and other initiatives, truck drivers are under increased scrutiny and are in short supply.
During the recession, many large truckload carriers such as J.B. Hunt, Swift, Werner, and others parked as many as 10 percent to 15 percent of their fleets to match reduced demand levels. Some of those carriers have been slow to replace those trucks, creating spot shortages along some lanes, particularly in the Upper Midwest, parts of the Southeast, and in and out
BY john d. schUlz, contriButing editor
intermodal looks marveloUs!
the red-hot intermodal sector is “in fashion” these days as shippers opt for lower rates at near-truck service levels. our intrepid trucking correspondent examines the factors driving this impressive growth as well as how logistics professionals are using the option as part of their 2011 transportation tool kit.
LM_1105_Rail_Intermodal.indd 30 5/5/11 11:57 AM

May 2011 | WWW.LOGISTICSMGMT.COM Logistics ManageMent 31
Intermodal looks marvelous!
Da
nie
L V
as
co
nc
eL
Lo
s
of California.But while this was occurring, the railroads were investing
billions in their infrastructure, double-tracking, and increas-ing capacity where needed. Burlington Northern Santa Fe, for example, bought 331 new locomotives in 2009. Union Pacific (UP) added 127.
They’ve also become creative in seeking out help from the government. Most recently, UP announced in April that the New Mexico legislature has granted the railroad a locomo-tive fuel tax deduction. That paves the way for UP to start construction on a new $400 million intermodal center near Santa Teresa, N.M., that will have an annual lift capac-ity of up to 250,000 intermodal containers. UP Chairman Jim Young calls the move a “strategic investment” that will improve intermodal capacity and efficiency.
Rails have also spent the better part of the past decade tightening up their service standards. Trucking companies, meanwhile, are facing ever-higher fuel costs and driver short-ages. Analyst Noel Perry of FTR Associates is predicting that the trucking industry will face a shortfall of as many as 400,000 drivers as early as 2012.
Today, truckers are increasingly eying the railroads as “partners” instead of competitors and are using the rails for their line hauls, particularly over 1,500-mile lengths of haul.
“Intermodal is in fashion right now,” says John Larkin, managing director of transportation equity research for Stifel, Nicolaus. “The service is as good or better than solo driver truckload both in terms of transit times and reliability. The base price is 10 percent to 15 percent below truckload, and the fuel surcharges can be half as much.”
LM_1105_Rail_Intermodal.indd 31 5/5/11 11:57 AM

Considering all these factors, Lar-kin is predicting that intermodal will grow this year at about twice the rate of growth as trucking. That is as long as there’s sufficient capacity both in terms of equipment and terminal capacity.
“The future is bright as long as suffi-cient boxes, chassis, locomotives, intermo-dal rail cars of the right type, and terminals capacity exists,” explains Larkin. “Line capacity is less of an issue, especially as more sidings are added or extended.”
Larkin noted that most intermodal loads will still go via truck as intermodal is service limited to a relative handful of lanes—Chicago to the West Coast, Chicago to Dallas, and, to a lesser extent, along the I-95 corridor in the East Coast.
The crowd is loving iTIntermodal has other things going for it as well. The mode’s ability to reduce carbon footprint, coupled with the cur-rent, global sustainability drive, is cer-tainly a large part of its appeal.
Recently, Whirlpool made a signifi-cant investment to increase its intermo-dal moves. The appliance giant reached a major milestone last year when it loaded its 3,000th boxcar as part of a revamped supply chain—that’s the equivalent of taking 9,000 trucks off the road.
“Plus shippers get to check the sus-tainability box in their strategic plans,” adds Larkin. “So, it will keep on grab-bing market share in the long-haul, high-density lanes anchored by big cit-ies and mechanized intermodal ramps.”
Sustainability and the green move-ment is also a factor in manufacturers’ preference for intermodal, which can reduce their carbon footprint by cutting fuel consumption and saving money. About two years ago, Whirlpool did this by conquering one of the centuries-old disadvantages of intermodal—lack of accessibility. It did this by building 10 new distribution centers, all with rail docks in key locations near mainline or short haul tracks and close to highway access. Whirlpool now reports that it’s using fewer trucks, products are mov-ing uninterrupted, and there’s less dam-age when shipped by rail.
Whirlpool is not alone. Other man-ufacturers are making similar, if less dramatic, steps in increasing intermo-dal usage.
In the meantime, truckers are increas-ingly relying on intermodal service as well. UPS, the world’s largest transportation company, is also the single largest rail ship-per. UPS will spend more than $3 billion this year on rail transport, much of it on regularly scheduled, 50-hour nightly trains out of Chicago to just outside Los Angeles that run as smooth as most truck moves.
“UPS is in a class of their own,” says consultant Gross. “They’ve used rail forever. For many, many years they were the backbone of intermodal service demand, and they really drive the high service side of the intermodal equa-tion.” In fact, adds Gross, their trailer
trains tend to be the faster trains in the intermodal world.
But UPS is hardly alone among truckers utilizing rail. FedEx Freight, the nation’s largest LTL carrier, recently began using intermodal when it started its “two-tiered” system of service—economy and priority. The unionized LTL carriers such as YRC Worldwide and ABF Freight System long have moved as much as one-fourth of their trailers on the rails, mostly for long-haul line haul efficiency.
Truckload carriers are increasing their intermodal usage as well. Steve Van Kirk, senior vice president of intermodal commercial management for Schneider National, says that intermodal’s attrac-tiveness will continue to grow as over-the-road capacity gets tighter.
“What you’re seeing right now is really strong freight demand relative to capacity,” Van Kirk says. “That applies to all modes—dry van, truckload, intermodal. Capacity is getting tighter, and intermodal is seen as a viable option for many shippers.”
But there are other factors driving intermodal growth, including a shift in how it’s perceived by shippers.
“The biggest thing intermodal has going for it is that it has moved from the mode of last resort to a core trans-portation function,” says Gross. “That’s a function of reliability and quality of intermodal product. It’s never going
to be as fast as a truck, but intermodal offers a combination of speed and reli-ability at a price that makes sense.”
Gross adds that the proof of that was in the most recent recession. In the past, intermodal usage fell off during economic downturns as truck capac-ity increased and rates fell down. “That didn’t happen this time,” says Gross. “Intermodal share has been slowly, but steadily increasing, and I would cer-tainly expect that to continue.”
FuTure projecTsAs long as fuel stays in the $4-a-gal-lon range and qualified truck drivers increasingly are difficult to hire and retain, intermodal should continue to gain market share, say our analysts, with a few caveats.
In general, analysts and intermodal experts say, the only thing that would threaten intermodal would be if the rail system starts to bog down and service begins to suffer. That is not likely, but rail service meltdowns have occurred in the past in the wake of industry merg-ers, and other factors.
One trend to watch for in the future is increased intermodal use in shorter lengths of haul. Right now the average length of an intermodal move is 1,575 miles. But increasingly intermodal is being used in “mid-lengths” of haul, or around 1,000 miles.
“It’s a great challenge to bring down that average length of haul,” says Gross. “You need a denser network of termi-nals. That gets more complicated and more expensive to operate. It’s a change to move into these shorter lengths of haul. But I would expect these intermo-dal players to enter that market in the future.”
Even a drop in the cost of diesel fuel may not hinder intermodal’s growth, experts say. In the past, the “tipping point” for rail vs. truck moves seems to have been about the $3 per gallon price of diesel. That may not apply any longer.
“That day is done,” concludes Gross. “Everybody understands that if fuel were to go down to $3, that situation is not going to endure. Intermodal’s attractiveness is not totally dependent on the price of fuel any longer.” M
John D. Schulz is a Contributing Editor to Logistics Management
Transportation Best practices/Trends
32 Logistics ManageMent WWW.LOGISTICSMGMT.COM | May 2011
“ what you’re seeing right now is really strong freight demand relative to capacity.”
—Steve Van Kirk, Schneider National
LM_1105_Rail_Intermodal.indd 32 5/5/11 11:57 AM

If it were easy, everyone would do it.
“No carrier is perfect – but they
should be accountable. That’s why
I use Saia. When Jeff and I review my
Customer Service Indicators® each
month he addresses any issue up front.
He explains how it was resolved and
we discuss areas for improvements on
both sides. I like knowing he’s not here
to sell me… he doesn’t have to.”
John GreasonLogistics Manager, Houston, TX
Saia’s Customer Service Indicators –
Six key metrics that help improve the
quality of our service to you, month
after month.
“Saia’s Customer Service Indicators are
powerful tools. They’re for shippers who
are serious about creating a productive
partnership with their carrier. If I’m not
using them to help improve John’s shipping
effi ciency, I’m not helping either of us.”
Now with our newest measurement –
Exception-free Deliveries – we’re taking
the most comprehensive commitment in
the industry a step further.
Jeff DavidsonSaia Account Representative, Houston, TX
Customer Service Indicators
On-time Pick-up • On-time Delivery • Exception-free Delivery • Claims-free Service • Invoicing Accuracy • Claims Settled within 30 Days
1.800.765.7242 • www.saia.com
LM0511_Ads.indd 33 5/3/11 3:14 PM
LMS: Coming into its own
By Bridget MCCrea, ContriButing Editor
Labor management systems (LMS) have been around for years, making the market a fairly mature and proven one by supply chain software standards.
Used primarily as a way to manage and track the labor activities for distribution operations, LMS typically incorporates real-time interaction with warehouse manage-ment systems (WMS). Most often used within the four walls of a warehouse, these systems report on labor activity, and then compare that activity against historical data and estab-lished labor standards.
However, despite LMS’ knack for enhancing worker pro-ductivity and shaving labor costs, adoption rates for the soft-ware have been less than impressive over the last few years. “Historically, LMS was the purview of large facilities with 200 or more workers, with the grocery segment being a par-ticularly large user of these systems,” says Dwight Klappich, research vice president for Gartner, Inc. “And as this history shows, LMS implementation costs have just been easier to justify with larger labor forces.”
But that sentiment could change, says Klappich, as more software vendors offer LMS as part of their supply chain software suites—and as companies across the board strive for improved labor management practices. “Demand for labor management is up, and at the same time the solutions
have become more achievable for a wider array of compa-nies,” he says. “As a result, we could see more companies turning to LMS.”
Also pushing companies to explore their labor manage-ment is a continued need to drive costs out of the supply chain. While business activity is picking up nationally, the number of jobs isn’t increasing to meet that growth. Call-ing this phenomenon a “people-less” recovery, Klappich says companies are using technology like LMS to maintain growth without having to add new employees to the roster.
“LMS is a key productivity tool that addresses labor, and is particularly relevant for logistics professionals that want to be able to do more work with the same number of peo-ple, or fewer,” Klappich says. To help companies achieve that goal, LMS creates an environment where worker pro-ductivity can be monitored, and adjusted accordingly, to ensure that all employees are performing optimally, and as efficiently as possible.
Over the next few pages, we’ll look more closely at the LMS market and the key issues pushing its adoption inside the four walls as well as in the driver seats of the nation’s pri-vate fleets. We’ll also introduce you to a national waste man-agement firm that’s managed to get its arms around driver tracking to create a leaner workforce as a result of its labor management process.
SuppLy Chain teChnoLogy
34 LogistiCs ManagEMEnt WWW.LOGISTICSMGMT.COM | May 2011
the continued need to drive costs out of the supply chain is slowly, but surely pushing labor management system adoption rates. our technology Correspondent offers a snapshot of the LMS market and examines the issues driving its use inside the four walls as well as in the cabs of the nation’s private fleets.
LM_1105_StateOfLabor.indd 34 5/5/11 11:59 AM

All eyes on lAborIn most cases, LMS is used to manage what’s going in within the four walls of a warehouse or distribution center where the highest number of opportu-nities to track and control labor costs exist.
“There’s so much labor concentrated in the warehouse, and many opportu-nities to optimize those labor activi-ties,” explains Marc Bessho, consulting manager at supply chain advisory firm Capgemini. “There’s also room for cost reduction and asset utilization—both of which can be tackled by an LMS.”
Klappich concurs, and says ven-dors like Kronos, Red Prairie, and Manhattan Associates have all honed their LMSs—either standalone, or as part of a larger supply chain software platform—to the point where imple-mentations result in improved human capital management, and better over-
sight on important factors like time and attendance.
Supply chain organizations that implement LMS frequently experi-ence a “pretty massive upside in return for their investments,” according to Bessho, although convincing logistics managers of that ROI isn’t always easy. “Sometimes it’s a hard sell,” he says. “What many companies don’t realize is that by putting key performance indica-tors (KPIs) in place to measure worker inactivity, they can gain 30 percent to 40 percent improvements in utilization within the warehouse.”
Couple those gains with the produc-tivity gains that result when a shipper achieves better workforce visibility, and the pay-for-performance associated with engineering labor standards, says Bessho, and the case for LMS becomes even more compelling.
“Using an LMS, companies can
track and report on individual perfor-mance, and then compare actual ver-sus standard performance,” says Clint Reiser, a research analyst with supply chain technology consultancy ARC Advisory Group. “Using that data, ship-pers can keep a closer eye on employ-ees and work processes, and use that feedback to make improvements, man-age processes more effectively, and cre-ate incentive-based programs.”
Addressing hAng-ups LMSs come with their own unique set of challenges, most of them cultural in nature. For starters, a “big brother” barrier can come into play when an employee-tracking system is put into place. Warehouses or distribution cen-ter sites that are unionized tend to run into the most resistance in this area, according to Klappich, who has seen a few labor forces use their union clout to
May 2011 | WWW.LOGISTICSMGMT.COM Logistics ManageMent 35
LM_1105_StateOfLabor.indd 35 5/5/11 11:59 AM

block the use of LMS in the workplace. Exactly how the LMS implementa-
tion is introduced and rolled out can make or break it, says Klappich, who advises logistics professionals to lead with a strategy that clearly explains how the tools will be used on a day-to-day basis—not as a big brother-type tool, but as a way to solve warehousing labor issues and improve productivity.
“If you just drop this on the work-force, there’s definitely going to be resistance,” says Klappich. “Employees will assume you’re trying to microman-age them, and that you’re going to use the information to fire them.”
Effective LMS implementations also take time, and must be supported by internal standards and processes, says Klappich, who has watched more than one warehouse or distribution site install such a system, only to shelve it a few months later out of frustration. “If you’re going to use an LMS, you have to establish a center of excellence and a support structure for it,” says Klappich. “Without these elements, your LMS will simply become a scorecard for penalizing employees who don’t meet your standards.”
Republic SeRviceS: All About empoweRmentRepublic Services of Phoenix, Ariz., is one company that definitely hasn’t let its LMS gather dust, nor has the sys-tem become a point of contention for the waste management firm’s 26,000 employees and 3,800 managers. With locations in 47 states, and more than 50 different divisions under its corpo-rate umbrella, Republic Services uses its Kronos LMS to manage a geographi-cally dispersed labor force with ease.
That decision has paid off for Republic Services, which uses its LMS as a tracking and reporting tool for all man-hours worked to manage its logistics-related labor. The software manages time and attendance pro-cesses for employees, and allows the shipper to control labor costs, mini-mize compliance risk, and improve labor productivity.
Supervisors and managers use the system for labor tracking, for exam-ple, and also to generate reports that “help them stay accountable for their
employees,” says Debbie Stackhouse, time and attendance manager.
Republic Services, which has been using the LMS for several years, migrated its newest acquisition, Allied Waste, to the system in 2008. In doing so, the former added 20,000 new employees to its existing LMS. Previ-ously, Allied was using 63 different eTIME standalone databases to man-age its workforce, and the databases were only accessible to their respective users and didn’t provide any type of company-wide visibility.
“When the merger took place, we decided to get everyone on the Kronos system,” recalls Stackhouse, “know-ing it would give everyone insights into what was going on across the merged entities.”
Getting there required a conversion, and an upgrade to the latest, web-based version of the LMS. The projects were undertaken concurrently—a move that created a few challenges for the com-pany. For example, Stackhouse says internal IT resources were stretched to the limit during the changeover, which required extensive user training (based on the fact that the company was mov-ing to a web-based system).
“We have a very small team made up of me, and one support person,” Stackhouse explains. “It was a big undertaking, but we really felt it was the right way to go. We knew we could get more gains out of the newer, upgraded system.”
Payroll administrators, dispatchers, and clerks also use the LMS, namely for
reporting, Stackhouse adds. The system includes a controlled access function, which allows certain users to edit infor-mation and approve data and others to simply print out applicable reports. “With each user role, there is a different security level,” Stackhouse explains.
Rudy Leon, Republic’s HR systems manager, says the LMS has proven itself especially useful when it comes to tracking driver hours and ensuring that employees don’t exceed FMCSA hours of service rules. “We have a lot of safety-related managers who use the system for DOT reporting,” says Leon, “to make sure they don’t exceed the maximum number of hours while driving.”
With 3,800 users currently on its LMS, Republic plans to enhance the system even further this year by imple-menting a module that will allow the company to test and certify driver time. “While we’ve already seen a lot of benefits from being able to monitor our employees,” says Stackhouse, “now we’re looking to leverage our LMS with additional add-ons.”
Leon sees the LMS as a vital tool in today’s competitive business environ-ment, where companies are continually forced to do more with less. “Through technology,” says Leon, “we can empower our managers to get the data they need to make the best decisions, instead of having to rely on others for that information. That’s invaluable.” M
Bridget McCrea is a Contributing Editor to Logistics Management
State of labor management
36 Logistics ManageMent WWW.LOGISTICSMGMT.COM | May 2011
LM_1105_StateOfLabor.indd 36 5/5/11 11:59 AM

SUPPLY CHAIN • DISTRIBUTION • TRANSPORTATION • CONTROL TOWER
1-888-887-9337 www.ryderscs.com
Execution is Everything.
©2011 Ryder System, Inc. All rights reserved.
Navigate Uncertainty.
Synchronize Positions.
Harness Speed.
Chart The Course.
Create Balance.
Predict Conditions.
Execute Fearlessly.
LM0511_Ads.indd 37 5/3/11 3:15 PM

BY PATRICK BURNSON, EXECUTIVE EDITOR
Lost in all the recent discussion of what differen-tiates a 3PL from a 4PL, comes the question: Whither the common freight forwarder? Once charged with simply arranging the movement of goods through Customs clearance, the role
remains in what some experts call “deeper shades of grey.”“Third- and fourth-party logistics providers are always
freight forwarders,” says Shay Scott, director of the Global Supply Chain Institute (GSCI) at The University of Tennes-see. “But it’s never the other way around.”
Nor should it be, he adds. Given that not every ship-per faces the complexity of penetrating a new global market or extending its existing supply chain across vast “borderless” regions. “A lot of logisticians are taking issue with economists who say the world is flat,” he says. “We know that globalization has been vastly exaggerated, and that relying on a ‘mega-forwarder’ is not always the distri-bution answer.”
Shay points to the work of Pankaj Ghemawat, of IESE Business School in Spain, who recently authored the book, World 3.0. In it, he notes that the number of American com-panies with any foreign operations is vastly overstated, and that exports remain a relatively small part of GDP.
“So while some Fortune 500 companies really do need a Fedex Trade Network, or UPS Logistics, or a Penske, many other U.S. exporters only require a basic forwarder,” says Shay.
But that doesn’t keep forwarders from over-promising on their services, he adds.
“Thirty years ago, a small trucker would call itself a freight forwarder,” Shay says. “Then they’d build a warehouse and call themselves a 3PL. And if that worked, they’d offer con-sulting and call themselves a 4PL. It’s all become rather con-fusing…and often unnecessary.”
What is necessary, however, is � nding the right forwarder for “niche” shipping, says Shay. He notes that U.S. compa-nies doing business in Mexico, for example, might be better off with a small forwarder located near the border. The same holds true for shippers of specialized commodities like phar-maceuticals or hazardous materials.
“The shipper’s focus should not be on the country he’s try-ing to enter, but the port of entry,” says Shay. “And many of the smaller forwarders have better relationships with Cus-toms at these stations than the bigger players.”
DUE DILIGENCEAt the same time, say other industry experts, smaller for-warders may provide a better price point and speed of deliv-ery, too. According to Rosalyn Wilson, senior business ana-lyst at Delcan Corp., a supply chain consultancy in Vienna, Va., picking the right global freight forwarder still involves considerable diligence.
“Imagine your goods have gotten stuck somewhere en route—perhaps the paperwork wasn’t � led correctly because the regulation has changed, or the promised transportation service didn’t materialize,” she says. “The delay can hit your bottom line in terms of dollars, but can also damage the rep-utation of your product or company.”
GLOBAL LOGISTICS
38 LOGISTICS MANAGEMENT WWW.LOGISTICSMGMT.COM | May 2011
With President Obama continuing to emphasize exports, specialized shipping intermediaries are more important than ever to global logistics operations. But how do shippers identify and choose the right freight forwarder?
Choosing the best partnerFREIGHT FORWARDING:
LM_1105_GlobalFreightForwarders.indd 38 5/5/11 11:41 AM

According to Wilson, a good freight forwarder will be an asset to the shipper, allowing them to focus on their core competencies. Therefore, she says, it is worth the time to thoroughly research options and choose the forwarder that � ts their needs now and in the future.
“Probably the most important factor to consider is experi-ence with the types of products you ship and familiarity with the routes you use,” she says. “A good forwarder should be experienced enough to be able to balance your speed and
cost requirements, offer-ing a range of shipment choices—ocean, truck, rail, barge, or plane.”
Wilson advises ship-pers to narrow their short-list to those with impec-cable track records as well as those that keep completely up to date on changing regulations and reporting requirements. She says shippers should know the condition and service levels of the car-riers they use, and have a deep knowledge that matches their needs.
“For instance, if your product requires refrigera-
tion or other special handling, � nd out about their experi-ence with these types of shipments,” says Wilson. “If your shipment involves hazardous cargo, does the forwarder have certi� ed and trained staff on both ends of the move to man-age your shipment?”
She also encourages shippers to ask if the forwarder has of� ces, partners, and employees around the globe—local agents in the origin or destination country or city to ensure that the cargo was handled correctly.
May 2011 | WWW.LOGISTICSMGMT.COM LOGISTICS MANAGEMENT 39
Choosing the best partner
LM_1105_GlobalFreightForwarders.indd 39 5/5/11 11:42 AM

Gain visibilityOther supply chain analysts stress that forwarders must provide a “visibility network” in any offering they provide.
“I would say that today’s integrated logistics capability puts a premium on visibility and information,” says Greg Aimi, director of supply chain research at Gartner. “Visibility for tighter con-trol of processes supporting leaner and leaner inventory strategies prevents exceptions from occurring where possible.”
Aimi also maintains that shipper and forwarder should have shared track-ing and tracing systems for capturing data. This is vital, he says, because companies want to be able to analyze processes for continuous improvement opportunities. “So making sure that your forwarder’s IT systems are capable is another factor worth con-sidering,” he says.
Charles Clowdis, Jr., managing director of transportation consult-ing and advisory services at IHS Global Insight, agrees with Aimi, not-ing that with the rapid changes in supply chain methodology, attention to detail, especially in your forwarder’s IT capabili-ties, is critical.
“Certainly, selecting a forwarder who knows your product and its most efficient transport options is also impor-tant,” he says. “Furthermore, select-ing a forwarder who can measure costs versus delivery requirements is vital to controlling a budget. I would add that proper documentation and compliance with any pertinent regu-lations should be a given.”
Clowdis adds that these key ele-ments should be supported by a robust visibility network that allows the for-warder to see each incremental step along the supply chain and to react to any event “affecting the smooth and
scheduled flow of shipments…and support contingency options should the need arise,” he says.
CreatinG the CheCklistAll three of our analysts come to the same conclusion regarding a strate-gic plan for evaluating forwarders and advise creating a basic checklist before making a final decision.
For starters, the forwarder must be
bonded and licensed with all the appli-cable government agencies. Another strong point would be accreditation under the International Quality Stan-dard ISO9000:2000. Also keep in mind that a forwarder that’s a member of C-TPAT means they have met certain security standards and will ensure a smoother trip for your shipment.
Some other things to check:• Are they financially stable? Check
credit references and check with carri-ers to be certain that they have a good
payment record.• Is the forwarder large enough, with
ample staff and facilities to handle your needs?
• Can the forwarder ensure visibility of your shipment as it moves through the supply chain?
• Do they have the market buying power to get you space, without the premium price?
• Do they have customs-bonded warehousing allowing your goods to be stored without taxes and duties being paid improving your cash flow and stock management?
• Are they also customs brokers? Do they have an Automated Broker inter-face to U.S. Customs?
• Do they offer compre-hensive cargo insurance to cover all risks, including loss and damage?
• Do they offer consoli-dation services to reduce costs?
• Do they offer door-to-door, destination port/airport-to-door?
• What services are considered ancillary and how do they charge for those services?
Wilson, Clowdis, and Aimi all certainly agree that a shipper should ask for references, for both their forwarding business in general and specific ref-erences for the product, markets, and services that the shipper will be using.
“It’s critical to find out how long they have been operating and how well established they are in your target mar-kets,” says Wilson. “But once you have a good forwarder, the temptation will be to use them for everything. So, make sure to evaluate if your shipment really needs that level of service or if a stan-dard courier service would work just as well at a lower cost.” M
Patrick Burnson is Executive Editor of Logistics Management
Global logistics
40 Logistics ManageMent WWW.LOGISTICSMGMT.COM | May 2011
the eU DefinitionWhile there remains considerable confusion over how a freight for-warder differs from a 3PL, 4PL, or the newly coined “lead logistics provider,” the international Federation of Freight Forwarders as-sociations (Fiata) has come up with a description for assessment that covers the whole range of intermediaries.
“Freight Forwarding and logistic services” means services of any kind relating to the carriage (performed by single mode or multimodal transport means). It also means consolidation, storage, handling, packing or distribution of the goods as well as ancillary and advisory services. This includes—but is not limited to—customs and fiscal matters, declaring the goods for official purposes, procuring insurance of the goods and collecting or procuring payment or documents relating to the goods.
Freight Forwarding Services also include logistical services with modern information and communication technology in connec-tion with the carriage, handling or storage of the goods, and de facto total supply chain management. These services can be tailored to meet the flexible application of the services provided.”
an even more complete description has been recently adopted by the european association for Forwarding, transport, Logistic and customs services (cLecat). and just in time, too.
transport Logistic 2011, the world’s largest trade show examining international logistics, mobility, it, and supply chain management, takes place in Munich, germany, on May 10 - 13. a major focus of the conference agenda will be on the entire spectrum of global intermo-dal movement of goods on the roads, rail, water, and air. Logistics Management will be in attendance.
LM_1105_GlobalFreightForwarders.indd 40 5/5/11 11:42 AM

At APL Logistics, we makeyour business our business.
At APL Logistics, partnership takes on new meaning, because we know we’re only successful if you are. We’ll work one-on-one with your company to find a warehousing and distribution solution that improves inventory management, reduces operation costs and shortens order cycle times. From quality assurance and kitting to custom packaging and light assembly, our capabilities and value-added services ensure your products arrive as ordered, on time, and within budget. Our logistics solutions engineering team will join forces with your business to develop an integrated global supply chain solution that increases reliability and visibility while boosting profits. You can trust APL Logistics with your business because we treat every business as if it’s our own.
Visit www.apllogistics.com for a full listing of our value-added warehousing and distribution management services.
Origin and Destination Services in 260 Locations WorldwideInnovative IT Solutions for Maximum Supply Chain Visibility and ControlScalable and Flexible Solutions to Meet Your Needs
LM0511_Ads.indd 41 5/3/11 3:15 PM

LM excLusive2011 technoLogy roundtabLe
+ Live webcast: May 31, 2011, 2:00 pM et logisticsmgmt.com/tech2011
42 Logistics ManageMent WWW.LOGISTICSMGMT.COM | May 2011
By MichaeL Levans, group editoriaL director
2011 technology roundtable:
0101100101010010111011100111 01011001010100101110110110010101001011101101001011101010010111011010010111011
The results of our 2011 Software Users Survey revealed that even though logistics professionals
are taking a more calculated approach to vendor and product selection, they’re finally ready to turn up the spending—welcome relief for over-burdened users across the supply chain who are still toiling on outdated systems.
While our research team found the improved-spending data refreshing, we also learned that many logistics profes-sionals are showing renewed interest in achieving a better understanding of the data that supply chain software systems are capable of churning out. In an effort to help shippers put this data into better context, we’ve gathered a few of the top supply chain software analysts who are closely watching the progress of supply chain visibility, busi-ness intelligence (BI), advanced ana-lytics, as well as the steady evolution of today’s warehouse management sys-tems (WMS).
Leading off this year is Shanton Wil-cox, principal of supply chain manage-ment at Capgemini Consulting, who will explore the often-misunderstood concept of supply chain visibility. Jerry O’Dwyer, U.S. sourcing and procure-ment leader for Deloitte Consulting, then joins us to explain the growing importance of BI and analytics in logis-tics management. Greg Aimi, director of
putting data into context
LM_1105_TechRoundtable.indd 42 5/5/11 12:01 PM

supply chain research at Gartner, will wrap things up this year by giving readers an update on the new capabilities WMS ven-dors are adding to these mature systems.
Visibility: the holy GrailLogistics Management: In a recent survey of supply chain professionals your organization just conducted, 45 percent of the respondents said that supply chain visibility projects would be a main focus area for the coming year. What kinds of projects fall into that category? Shanton Wilcox: Visibility is a very misunderstood term, in many ways it’s similar to the many interpretations of supply chain. From my perspective, visibility spans a continuum, from general or less mature visibility, to state-of-the-art vis-ibility. Simple electronic information integrated between trad-ing partners counts as simple visibility, as systems are directly connected. At the other end of the continuum are the visibil-ity platforms that directly update based on order or shipment status, real-time across several trading partners, providing proactive exception-based management capabilities.
LM: Can you give us an example of how improved visibility might help logistics and supply chain professionals better manage the challenge of market volatility? Wilcox: If you consider the more advanced form of visibility, shippers can proactively direct in-transit shipments to mar-kets where products are moving at a higher velocity. Or man-ufacturers can determine what parts or materials are actually being shipped in the event of a catastrophe and re-plan man-ufacturing based on actual in-transit parts and materials. So, advanced forms of visibility allow partners to more efficiently execute management decisions based on real information, reducing latency and costs.
LM: What’s technology’s role in improving visibility? Is there a
single solution that shippers can install to gain these benefits?Wilcox: As is the case with all situations that drive significant value, there is no silver bullet, but it is achievable. Advanced vis-ibility is complicated by distance as supply chains were extended globally and by the number of partners added to operations to drive efficiency and competitive advantage. So, many factors have to be aligned to achieve advanced visibility, and it starts with roles and responsibilities enforced with contracts.
It ends and materializes via visibility platforms, and many are commercially available that integrate the information flows in a business context that facilitate the definition of alerts and subsequent identification of exceptions. With-out exception-based management governing visibility, the amount of information flowing between global partners would be too great for organizations to manage; so, technol-ogy serves as the unifying mechanism.
LM: What are the early steps logistics professionals need to take to get started in putting the right software into place?Wilcox: As in most situations that involve the extended sup-ply chain, look to partners that may be more advanced or experienced. It could be a supplier that gains experience from a different trading network or a logistics service provider that provides the capability to other partners. And when all else fails, read. There is a lot of information available regarding visibility and potential solutions.
LM: Where do you see visibility-enabling software heading going in the next 10 years? Wilcox: Ten years from now, advanced visibility is going to be a “must have.” Companies are beginning to co-mingle freight on the same shipment. Supply chains will be become more virtual, with contract manufacturers all over the world ship-ping directly to customers. So, in this case, visibility will be required to operate in the future.
May 2011 | WWW.LOGISTICSMGMT.COM Logistics ManageMent 43
2011 technology Roundtable:
our recent software Users survey revealed that shippers are showing a renewed
interest in achieving a better understanding of the data supply chain software systems
are capable of churning out. three top technology analysts tell us how to get this done.
010110010101001011101101011001010100101110110110010101001011101101001011101010010111011010010111011
Putting data into context
LM_1105_TechRoundtable.indd 43 5/5/11 12:01 PM

Picture a remote call center literally anywhere in the world taking a cus-tomer order over the phone; the order is transmitted to the OEM and the con-tract manufacturer simultaneously; the order is manufactured anywhere in the world; and upon completion it’s dropped shipped directly to the customer. In this situation, visibility technology will allow the customer to monitor the status of the order on-line and will allow the cus-tomer service representative to update the customer should anything change or require further attention.
AdvAnced AnAlytics explAinedLM: In a recent article for our sister publication Supply Chain Manage-ment Review, you go into terrific detail in defining “advanced supply chain ana-lytics.” Can you offer us your “elevator pitch” version of this concept? Jerry O’Dwyer: Advanced supply chain analytics represents an operational shift away from management models built on responding to data. Emerging capabili-ties in this area seek to introduce a pro-active management model, equipping supply chain professionals with the abil-ity to continually sense and respond as business changes around them.
Moreover, advanced supply chain analytics can help supply chain pro-fessionals analyze increasingly larger sets of data using demonstrated and tested analytical and mathematical techniques, thus allowing them to spot patterns and correlations that may have been missed in the past.
LM: How does this advanced level of ana-lytics differ from some of the statistical BI that many of the more sophisticated logis-tics and supply chain organizations have been putting to use over the past few years? O’Dwyer: The biggest difference between pure-play analytics and advanced analytics we talk about is the level of complexity that can be simul-taneously dealt with. Traditional ana-lytics models include BI and statistical models addressing specific problems. But, those tools essentially provide
outputs that require further interpre-tation to help leaders make meaning-ful business decisions. The success of traditional models was very dependent on the advisory expertise involved.
Advanced supply chain analytics can enable users to simultaneously factor in a host of problems and provide BI that involves synthesizing real-time data into meaningful information. It also includes a host of toolkits designed to address multi-ple problems that could potentially impact each other, providing a holistic solution.
LM: In terms of logistics and transporta-tion management, can you share a brief example of what advanced supply chain analytics would act like in the context of day-to-day operations? O’Dwyer: Advanced analytics seeks to take logistics decision support to the next level. Consider international con-tainer shipping. Oil prices are rising, capacity is constrained, and transit times are longer due to carriers’ slow steam-ing. Providing your carrier partners with accurate forecasts is key; however, it’s also typically very challenging.
Advanced analytics are designed to help you go further upstream, looking at demand patterns, forecasts, manu-facturing schedules—even seasonal-ity—to model your shipping require-ments with more precision. The output is typically a more accurate capacity forecast that you can share with your carriers to secure capacity and make sure your shipments aren’t held up.
LM: How does a logistics and supply chain organization take steps to imple-ment this concept? O’Dwyer: To implement advanced ana-lytics, companies can start with the following three steps. First, develop a well-defined vision for advanced ana-lytics so your organization knows what to expect out of its development. Once goals are set, a clear implementation plan should be set. Then, individual analytics efforts could be prioritized depending on the ROI and the critical-ity of the application.
Finally, from a people perspective,
many supply chain organizations don’t have enough business experts with func-tional knowledge of different supply chain areas. Finding this diversity and breadth of experience is important, as is emphasizing analytical competency and expectation in the hiring and promotion process. In addition, companies should not ignore the IT skills challenge.
LM: What technology is involved? O’Dwyer: A range of technologies can serve as the underpinning for the next generation of supply chain analytics. Many of these solutions are beginning to enter the market today or are already used by more innovative companies, albeit in select supply chain areas. The fundamental change is not necessar-ily to the types of analytics performed, though that will continue to evolve. Rather, the fundamental change is to the quantity, frequency, and types of information analyzed and how it is shared. Perhaps one of the most signifi-cant emerging and continually evolving relevant technology is a next-generation business intelligence and self-structur-ing data logic that can bring together different datasets, putting data into a context to enable rapid insight.
These new business intelligence and self-structuring data logic applications will allow users to ask questions of data con-stantly—as opposed to a weekly, quarterly or yearly basis. In the future, logistics and supply chain managers will ask questions of their own advanced analytics tools rather than the IT department facilitating a data-warehousing-led information hunt.
LM: For the logistics and transportation management function, what would you say is the greatest benefit? O’Dwyer: The greatest benefit for the logistics management function is the forward-looking view and, in turn, the competitive advantage that advanced analytics can provide. For instance, if you’re trying to solve a network strat-egy problem, you want to keep material flowing through your supply chain from manufacturing plants to datacenters, and ultimately to customers in a cost-effective
2011 technology Roundtable
44 Logistics ManageMent WWW.LOGISTICSMGMT.COM | May 2011
01011001010100101110110110010101001011101101001011101010010111011010010111011
+ live webcAst: MAy 31, 2011, 2:00 pM et logisticsmgmt.com/tech2011
LM_1105_TechRoundtable.indd 44 5/5/11 12:01 PM

WE DO WHAT MATTERS.WE DO WHAT MATTERS.When you ’re runn ing shor t on t ime and opt ions , look to our Demand Cr i t ica l se rv ices .
Managed by Xp ress D i rec t , we supp l y on -demand and su rge -p ro jec t capac i t y w i th
a w ide range o f asse t s , i nc lud ing spec ia l i zed equ ipment . Ou r bes t - i n - the -bus iness
d r i ve r s can reach 60 ma jo r marke t s i n 6 hou r s o r l e ss , and we ’re ava i l ab le 24/7
wi th supply -and-demand spot quotes . Contact us today, and turn your nex t c r i t ica l
sh ipment in to a done dea l .
S O L O T R U C K L O A D / T E A M / D E D I C A T E D / D E M A N D C R I T I C A L / I N T E R M O D A L / L O G I S T I C S / B R O K E R A G E / S P E C I A L I Z E D L T L / I N T E R N A T I O N A L
8 6 6 . 8 0 1 . F A S T ( 3 2 7 8 ) / X P R E S S D I R E C T . C O M
ON-DEMAND CAPAC I TY
P ICKUP IN 6 HOURS OR LESS
IN 60 MAJOR MARKETS
DEMAND CRIT ICAL SER V ICES
EXCLUS IVE -USE CAPAC I TY
SPEC IAL I ZED EQU IPMENT
AND HANDL ING
LATEST TRACK ING AND
REPORT ING TECHNOLOGY
USX XD Ad - Logistics Management.indd 1 10/27/10 2:38 PMLM0511_Ads.indd 45 5/3/11 3:15 PM
Feature Kicker
46 Logistics ManageMent WWW.LOGISTICSMGMT.COM | May 2011
way that adheres to required service levels.Traditional analytical tools could
allow a user to optimize on a fixed set of variables, like number of plant loca-tions, warehouses, demand centers and carrier-mix. However, they may not support the next level of decision-mak-ing determining a flow-path strategy to drive network configuration decisions. This is where advanced analytics helps organizations to provide enhanced sup-port to logistics managers.
the new role oF wmsLM: Many WMS vendors are adding new flair to these “mature” systems. What new capabilities should logistics professionals put to use?Greg Aimi: There are four areas I would call out pertaining to more recent advancements over basic WMS. First, the mobile input devices for record-ing activities and inventory moves have a lot going on. We’ve long had RF hand-helds for scanning barcodes, but now we’re seeing the movement to voice, RFID, and more complex coding gaining momentum. Also, the mobile devices themselves are getting smaller and more capable, and there seems to be some convergence going on with smartphones and other mobile devices.
Second, we’ve seen a pretty dramatic increase in the use of labor benchmarking systems for comparing task performance and obtaining higher levels of productiv-ity of the worker. Third, we’re seeing a growth in the use of robotics with “smart” vehicles from the likes of Kiva and Seegrid that introduce significant change in cer-tain warehouse environments where they make sense over heavy automation. And fourth, we’ve certainly seen a rise in col-laboration with suppliers and carriers to coordinate dock-door schedules with the yard and with internal workers.
LM: Last year we discussed the move by WMS vendors toward Software as a Service (SaaS) and the broader, greater cloud. How has that progressed? Aimi: Our research estimates that in the next five years spending on SaaS-based applications in supply chain execution will
grow from around 12 percent today to over 18 percent. While there are new entrants to the pure SaaS WMS arena, which accordingly have light to basic capabilities, there are also a couple of vendors that have more sophisticated and robust WMS solu-tions than the market is probably aware of.
At the same time, the major inde-pendent software vendors of WMS are beginning to offer a hosted version of their traditional applications hosted in the cloud. This requires a change in the pric-ing model to convert it to an “expense or fee” that has perplexed some of the larger companies that depend on the big upfront license fees for their revenue structure.
LM: What type of operation is the best fit for a SaaS solution?Aimi: There are a number of ware-houses and depots that carry inventory for which the Tier-1 WMS solutions are simply overkill. The basic capabil-ity SaaS would be appropriate for these environments both from a capabilities standpoint and a cost perspective.
LM: It seems that industry jargon freely uses “cloud” and “SaaS” interchange-ably. Is that safe to do when discussing WMS delivery?Aimi: I think it’s important to distin-guish “cloud” from SaaS WMS. A few of the SaaS WMS solutions are quite new and the features and functions are correspondingly light compared to the existing, on-premise Tier-1 and Tier-2 solutions. Moreover, if widespread adoption occurred I would imagine the SaaS environments being challenged to handled the throughput—granted this would be a short-term complication.
Cloud WMS can be one of the more capable solutions—a single pri-vate instance—hosted on behalf of the customer by a cloud service provider. This environment would be as capable as any on premise deployment, except the IT environment and management would be outsourced.
LM: Our 2011 Software Users Survey found that 35 percent of respondents say they’re ready to upgrade or dive into a new
WMS. What steps do you suggest they take?Aimi: The WMS market is mature. There’s such parity in core WMS capa-bilities across the leading product offer-ings, which makes other criteria, like breadth, depth, technical architecture, company stability, and service reputa-tion critical for differentiating solutions. Technical architecture is now a more important evaluation criterion as com-ponentized architectures like SOA are prevalent and can prevent the traditional challenge of one-off customizations.
WMS is moving beyond just process execution, with more emphasis on add-ing value through better intelligence and decision making; so, it’s time to move technical architecture higher on the list of evaluation criteria. Make it second only to functionality. Matching proven implementations with the processes you need to support is a best practice. This doesn’t necessarily mean they have to have customers in your same industry, but the internal processes supported or required should be the same. Focus as much time on investigating support for enhanced decision-making as you will on process and activity execution.
LM: Gartner writes about understanding warehouse complexity before moving into this assessment. What should ware-house/DC managers take into consider-ation when going through this exercise?Aimi: Most companies operate multiple facilities if not multiple supply chains. Complexity may be different at each facil-ity or across different businesses. More complex facilities require more functional breadth and depth to support their needs, while less complex operations often require less functional robustness.
However, the problem with terms like complexity is that many users say, “I’ll know it when I see it.” But, defining it is much more difficult. This vague-ness is especially unacceptable when selecting new WMS applications if complexity is a strong indicator of the functional requirements. M
Michael Levans is Group Editorial Director of the Supply Chain Group
2011 technology roundtable
01011001010100101110110110010101001011101101001011101010010111011010010111011
+ live webcast: may 31, 2011, 2:00 pm et logisticsmgmt.com/tech2011
LM_1105_TechRoundtable.indd 46 5/5/11 12:01 PM

pilotdelivers.com / 1-800-HI-PILOT
© 2010 Pilot Freight Services
In the world of international shipping, you either lead, follow, or better yet—Pilot. By helping businesses navigate the intricacies of international commerce in 190 countries, we offer them unique
efficiencies and advantages that fuel business growth and success. And after 40-plus
years in the freight business, we’ve learned it’s far better to be making the waves
than following in someone else’s wake. That’s why everything we do revolves
around helping our clients get ahead—and stay there.
That’s not just good business, that’s
LM0511_Ads.indd 47 5/3/11 3:15 PM

If there is one lesson learned by the catastrophic global events recently, it’s that “just-in-case” scenarios trump “just-
in-time” imperatives. Japan’s earthquake, continued political unrest in the Middle East, and wild world currency fluctuations have shippers hedging their bets these days—and that includes domestic seaport selection.
Even on the West Coast, mega-ports in San Pedro, the San Francisco Bay, and the Puget Sound face daunting competition from a foreign gateway to the north. According to
Peter Gatti, executive vice president of the National Industrial Transportation League (NITL), British Columbia’s Prince Rupert is becoming the favored gateway for many of the League’s members sourcing goods from the Far East.
“It is a day’s shorter transit time,” Gatti notes, “and they don’t have the labor prob-lems U.S. ports have.” But the real advan-tage, he adds, is the rail link provided by CN that not only feeds across the continent, but also down into Kansas City. “Canada
Where’s the money?
Creative funding for expansion and infrastructure improvement is critical for the top U.S. ports, especially as shippers are slowly reconfiguring their supply chains to become less dependent on the West Coast.
By Patrick Burnson, Executive Editor
Special ReportA speciAl supplement to:
TOP 20 U.S. PORTS
48S May 2011 • Logistics Management
LM_1105_Top20USPorts.indd 48 5/5/11 12:24 PM

A DIVISION OF C.H. ROBINSON WORLDWIDE, INC.
Single Source
ManagedTMS®
LeadLogistics
InboundLogistics
YOUR SUPPLY CHAIN IS GLOBAL.
WHY ISN’T YOUR TMS?
© 2
011
C.H
. Rob
inso
n W
orld
wid
e, In
c. A
ll R
ight
s R
eser
ved.
ww
w.c
hrob
inso
n.co
m
EXPERIENCE SAVINGS AND SUSTAINED ROI FASTER.
It’s here—a TMS that combines managed services and true global capabilities. Unlike solutions that are isolated to a region of the world, Managed TMS® provides comprehensive capabilities that ensure global visibility, business intelligence, and the enhanced supply chain outcomes you’ve been looking for. It’s a big world out there. Find out how TMS software plus managed services get you to your global goals faster.
Discover how your business can cover more ground with Managed TMS®
Call 800.323.7587 (Domestic) or +1 952.683.3950 (International) to connect with one of our experts.
LM0511_Ads.indd 49 5/3/11 3:15 PM

50S May 2011 • Logistics Management
has clearly been investing in the port’s infrastructure.”
Infrastructure, or rather the lack thereof, is also a key growth indica-tor for Richard Thompson, ex-ecutive vice president of the global supply chain practice for Jones Lang LaSalle. He maintains that “con-nectivity” will be the watchword for U.S. ports in the future.
“Given the current energy picture, shippers are becoming ever more reliant on rail and intermo-dal,” says Thompson. “That means that the ports will be concentrating on on-dock or near-dock rail service and the DCs to support intermodal transfer. This kind of connectivity softens risk as well.”
Thompson’s recent research suggests that shippers are slowly reconfiguring their supply chains to become less dependent on West Coast ports. With California’s economy in tatters, raising capital to improve infrastructure in that state alone has been daunting.
Three of the nation’s top 10 ports—Los Angeles, Long Beach, and Oakland—are constantly seeking new ways to maintain existing “connectiv-ity” and build for the future. But as we’re finding, all of our nation’s ports are struggling with similar funding challenges.
What does this mean for shippers? Thompson explains: “All the multi-nationals are trying to get locked into long-term contracts with specific ocean carriers. And if the carriers are call-ing ports that can’t meet all the inland distributions needs, the shipper is out of luck.”
Consequently, ports are more intent than ever to keep both carriers and ship-pers happy—but to do that they need to find the proper investment capital.
In search of fundingWitness last month’s biennial Port
Administration and Legal Issues Semi-nar in San Francisco sponsored by the American Association of Port Au-thorities. The event featured an in-depth discussion on port funding and public finance management. While many paths can be taken toward achieving a financ-ing goal, most speakers advise a “go slow” approach for port administrators.
“It’s crucial that one set priorities with all the port stakeholders before moving forward,” says Karl Pan, chief financial officer for the Port of Los An-geles. “Before getting started, make sure you understand the risks and whether you’re staffed with the administrative skill sets to the get the job done.”
According to Pan, interest costs are not the only concern ports should have when borrowing money. There are debt service reserve fees, financial covenants, and unique reporting requirements.
“So when you’re trying to sell your
plan to a Board,” he says, “it’s im-portant to avoid financial jargon.” Pan also insists that complete trans-parency be provided in any presen-tation, as “there is no place to hide.” Given the economies of scale that most ports are now under, financial advisors are “a must” says Pan.
Jessica Soltz Rudd, senior direc-tor with Frasca & Associates, LLC, concurs, noting that advisors can help ports navigate the intricacies of the financial marketplace.
“Back in the ‘go-go ’90s’ ports were bringing in so much cargo that money for expansion was a given,” she says. “The growth mul-tiples were three times or more each year; and given the capital intensive nature of port operations, money was not that hard to raise.”
But in the wake of a severe recession, and with consumer con-fidence now just beginning to gain traction, ports are under pressure to justify investment before trying to raise cash. “Even with a bond rating like the one Los Angeles has
it’s not an easy thing to do,” says Sotlz Rudd. “And once you get the funding, it’s important to stay on your guard, and remain proactive. You are only as good as your credit.”
Industry analysts say that there’s been a direct correlation between capital in-vestment in port infrastructure, and the volume growth at those load centers.
Zepol Corporation—a leading trade data and market intelligence company specializing in ocean cargo data—notes that there’s been a shift in share over the past year. “Long Beach and Los Angeles lost a combined 4 percent and 14 percent, respectively,” says Zepol’s president, Paul Rasmussen. “East Coast ports are picking up this traffic. New York/New Jersey and Houston were the biggest winners on the container front in the past two years.”
Meanwhile, Houston increased its
Special Report A speciAl supplement to logistics mAnAgement
U.S. Port Ranking for Q1, 2011Rank US_Port TEU
1 Los Angeles, CA 928,348
2 Long Beach, CA 692,036
3 Newark/New York 646,621
4 Savannah, GA 262,629
5 Seattle, WA 203,656
6 Norfolk, VA 182,411
7 Oakland, CA 176,597
8 Charleston, SC 140,984
9 Houston, TX 140,376
10 Tacoma, WA 108,666
11 Miami, FL 89,647
12 Port Everglades, FL 84,629
13 Baltimore, MD 73,267
14 Philadelphia, PA 38,049
15 San Juan, PR 36,269
16 Wilmington, DE 36,106
17 Wilmington, NC 31,168
18 Gulfport, MS 27,084
19 Jacksonville, FL 26,273
20 Boston, MA 24,141
Other 125,028
Total 4,073,987Source: Zepol
LM_1105_Top20USPorts.indd 50 5/5/11 12:24 PM

Add Maersk Line certainty to your transpacific shipments
maerskline.com
*Drewry Shipping Consultants Q2,3&4 2008, Q1,2&4 2009, Q1,2,3&4 2010 Reports. Ranked #1 amongst the top 20 largest carriers.
It’s the Maersk LineDifference
Putting your products in your customer’s hands is our top priority. Doing it reliably is key to our mission. We know that 80% reliability is not good enough. That’s why we will improve our #1* rated schedule reliability. Within the next year, we aspire to reach 95% on-time delivery for all shipments. We believe this gives you a real supply chain advantage. Speak to your Maersk Line Sales contact about what we are doing to achieve this.
Maersk_TransPacAd_LM.indd 1 4/12/11 11:43 AMLM0511_Ads.indd 51 5/3/11 3:15 PM

52S May 2011 • Logistics Management
throughput by 31 percent over 2010, and other lower volume ports increased their market share, as well. Earlier this year, Houston opened the Cargo Bay Road truck entrance with considerable fanfare. Presently, trucks transport about 75 percent of the port’s inbound and outbound cargo.
Houston City Council member James Rodriguez, whose District I includes several Port Authority opera-tional facilities, notes that the new truck entrance will help improve traffic flow with three inbound and two outbound lanes. “It will be open around the clock and staffed by contract security person-nel,” says Rodriguez.
Investment paying offHouston is not the only “mid-tier” port investing in its future, says Zepol’s president. “Port Everglades, Miami, New Orleans, and Baltimore, all ports that invested recently, all saw significant percentage increases in TEU volumes
versus 2010,” he says. Ongoing capital improvements,
including widening and deepening of its entrance channel and waterways, ensure that Port Everglades will have the ability to handle future growth in container traffic, say officials there.
“We have been saying for years that
cargo ships are getting larger and more efficient,” says Port Everglades’ executive director Phil Allen. “Our 20-year master plan recognizes that Port Everglades will need to widen and deepen its chan-nels to handle fully loaded ships of the current generation and even larger ships once the Panama Canal expansion is
Oakland was ranked 7th on Zepol’s Top 20 list for the first quarter of 2011. Like Los Angeles and Long Beach to the south, the California ports are constantly seeking new ways to maintain existing “connectivity” and build for the future.
Many shipping industry insiders were caught off guard when Richard Steinke an-nounced his intention to retire as executive director of the Port of Long Beach last April. Even port staffers were surprised.
“He (Steinke) is such a young man,” says spokesman Art Wong. “And we really hoped that he would be with us for a long time. Ideally…forever.”
Wong adds that a national search for a new director is now underway. An executive recruiting firm might be part of the plan, he says, as well as internal resources.
The outpouring of industry regret suggests that this will be a daunting proposition.
“Dick is an extremely thoughtful and knowledgeable leader,” says John McLau-ren, president of the Pacific Merchant Shipping Association. “He will be missed in many ways but, most of all, he will be missed for his strength of character.”
McLauren adds that Steinke’s “even keel, common sense, personality, and manage-ment style served the port and city of Long Beach extremely well.”
Kurt Nagle, president and CEO of the American Association of Port Authorities, notes that Steinke is a “strong and recog-nized voice” for the critical role that ports play in our economy, as well as a leader in the ports’ role in environmental enhance-ments and sustainable port development and operations.
At the same time, there is concern within the shipping community that Steinke’s departure would create a vacuum where organized labor may seek an advantage.
“The Teamsters have been trying to organize truckers down there without much success,” says Dave Enberg, a board mem-ber of the Pacific Transportation Association. “This was in large part due to Steinke’s resistance to the idea.”
Amid all the doom and gloom about the flight of freight from the West Coast comes news that the nation’s largest ocean cargo gateway is moving forward with its strategic plans for expansion.
China Shipping has completed a major phase of its terminal expansion project at
the Port of Los Angeles, adding a new 925-foot section of wharf, 18 additional acres of backland and four new container cranes that will increase cargo throughput.
“This allows for the berthing of two ships simultaneously and positively positions China Shipping and the port for considerable growth opportunities,” says the carrier’s chairman, Li Shaode.
As part of the latest improvements, an access bridge was also constructed between China Shipping and Yang Ming for truck movement of cargo between the two terminals. Over the next three years, 375 feet of additional wharf space will be added, along with more backland space that will eventually double the size of China Shipping to 142 acres.
When completed, China Shipping’s expanded terminal operations will increase container terminal capacity to accommodate an annual throughput of 1.5 million TEUs (twenty-foot equivalent units). China Ship-ping plans to install two additional super Post-Panamax cranes after the final wharf expansion is completed, bringing the total crane count to 10.
Don’t count California out just yet
A speciAl supplement to logistics mAnAgementSpecial Report
LM_1105_Top20USPorts.indd 52 5/5/11 12:24 PM

With our proximity to Eastern and Midwest U.S. markets, today’s major retailers and distributors know Virginia really delivers the savings in time and money they need. Target, Wal-Mart, Dollar Tree, QVC Network, and Cost Plus all have supply chain centers here. In fact, some 13 million square feet of new warehousing space has been added at more than 30 new distribution centers. And more growth is on the horizon as more global market leaders see the advantage of making Virginia their ideal logistics hub.
To learn how Virginia can deliver for you, call 800.446.8098 or visit portofvirginia.com
6 0 0 W o r l d T r a d e C e n t e r . N o r f o l k , V A 2 3 5 1 0 . 7 5 7. 6 8 3 . 8 0 0 0 . 8 0 0 . 4 4 6 . 8 0 9 8 . w w w . p o r t o f v i r g i n i a . c o m
No r fo l k I n te r na t i o na l Te rm i na l s . N ewpo r t N ews Ma r i n e Te rm i na l . P o r tsmouth Ma r i n e Te rm i na l . A PM Te rm i na l s V i r g i n i a . V i r g i n i a I n l a nd P o r t
THE LOG IST ICS HUB THAT REALLY DEL IVERS .
LM0511_Ads.indd 53 5/3/11 3:15 PM

54S May 2011 • Logistics Management
completed in 2014.” Meanwhile, Florida’s Governor Rick
Scott asked the Department of Trans-portation to allocate $77 million to the Port of Miami to deepen the channel to minus 50 feet so larger ships can gain access to the port.
“This is a solid first step toward enhancing Florida’s infrastructure and getting our state ready for a new genera-tion of international trade with South America and beyond,” says Scott. “There are a number of worthy infrastructure projects that deserve our attention, and as Floridians, we know best where our resources should be focused.”
As LM has reported in the recent past, the Port of New Orleans is also continuing with its expansion—particu-larly in regard to greater hemispheric trade with Latin America.
In the past 10 years, the port has invested more than $400 million in new facilities. Improved breakbulk and container terminals feature modern, multipurpose cranes, expanded marshal-ling yards, and a new roadway to handle truck traffic.
The Port Authority of New York and New Jersey has started the engineering and design work for a project to “Raise the Roadway” of the Bayonne Bridge. This unique alternative to dredging is designed to accommodate larger ships after the
Panama Canal upgrades are completed. The authority, which is continuing
the development of the Global Con-tainer Terminal in Jersey City to accom-modate future growth, is also upgrad-ing and expanding the capacity of the cross-harbor rail float barge operation between Brooklyn and Jersey City. Plans are on the books to also develop the
Greenville Yards in Jersey City.However, the limited increase in rev-
enue to the NY/NJ Port Authority gener-ated by the increase in cargo volumes does not cover the costs of the port’s annual state of good repair—nor does it cover all of the
capital improvements needed to maintain the port’s competitive position.
“In this economic environment, the competition for port business is fierce,” says Chris Ward the NY/NJ port author-ity’s executive director. “That is why we continue to take steps with our industry partners to improve our position.”
Despite the extremely competitive
environment among ports on the East Coast, NY/NJ remains the largest ocean cargo gateway there, and the third largest in the United States behind Los Angeles and Long Beach. The port handles approximately 31 percent of all East Coast cargo.
But while much of that cargo is headed to the immediate region, more than 20 percent of the cargo is destined for locations that can be served by other ports. “This discretionary cargo is part of a highly competitive market that every port in the U.S. and Canada seeks,” says Ward. “To meet the challenges of future growth, the we will invest $283 mil-lion in 2011 to upgrade the port road network, enhance the existing Express-Rail system, and continue its program to deepen the port’s channels to 50 feet.”
—Patrick Burnson is Executive Editor of Logistics Management
Seattle was ranked 5th on Zepol’s Top 20 list for the first quarter of 2011. And while the port is doing well, it’s facing daunting competition from a foreign gateway to the north.
“In this economic environment, the competition for port
business is fierce. That is why we continue to take steps with
our industry partners to improve our position.”
–Chris Ward, Executive Director, NY/NJ port authority
A speciAl supplement to logistics mAnAgementSpecial Report
LM_1105_Top20USPorts.indd 54 5/5/11 12:24 PM
Orig
inal
Art
wor
k by
Byr
on B
irdsa
ll
Philadelphia is the cradle of independence – and Sea Star Line honors that spirit by o�ering freedom.
Freedom to choose from the widest selection of equipment
Freedom to avoid port congestion
Freedom to enjoy the fastest and most reliable transit in the trade
Freedom to work with a �nancially solid partner that invests in the future
www.seastarline.com877.SSL.SHIP
PhiladelphiaFreedom
SEA STAR
Philadelphia Freedom
LM0511_Ads.indd 55 5/3/11 3:15 PM

56 Logistics ManageMent WWW.LOGISTICSMGMT.COM | May 2011
By Wayne Bourne
early on in my career, I was introduced to the con-cept of fair-haired managers, fast trackers, golden rook-ies, and folks dubbed to be on the inside track. These terms more or less described the same group of kids that we called “teacher’s pets” back in school. Back then we remember them as generally smarter, but not by much. They were certainly very helpful to the teacher, usually passing out papers while the rest of us were sitting on the edge of our seats waiting for the recess bell.
During the first half of my corporate logistics career, I became intuitively aware of my new cultural surroundings. It was made apparent to me that there were some of my peers that were definitely on a faster track than others. Were they smarter? Was their father related to the founder or the boss? Did they graduate from more prestigious schools?
Eventually I found that most of these folks actu-ally had working mentors, although they called them “sponsors” back then. They had a management part-ner within the organization—presumably at a fairly high level—that would assist them in navigating the bureaucratic elements of the organization.
The mentor was often a senior manager in the verti-cal area in which you were working. In that case, the mentor was able to share his experience and knowl-edge with you and help you on your way to success.
Now, I was never the “teacher’s pet,” but I was, and still am, a mentor. I’ve also personally been blessed with some of the best mentors one could expect in all stages of my logistics and transportation career.
While you’re offering your skills and secrets, it’s actually a value-added service to your company. A men-tor helps in cutting the on-boarding acclimation process into small digestible bits, thus allowing the mentee to progress faster, with fewer mistakes. It also encourages the mentee to take positive risks knowing that they have a sounding board off of which to bounce their ideas.
If you feel that you have the time and energy to become a mentor, and you have sufficient experience in a field, then I’m going to suggest you go find some-one who can benefit from your experiences.
If your company currently has a formal mentor-ing program, then that’s terrific. That means that the rules of engagement are already established, and you merely need to sign up. If not, my advice is to target an individual you believe may benefit from mentoring and immediately enlist the support of the supervising manager of this person.
Solicit from the supervisor detailed work perfor-mance and opportunities that, if improved, would make the mentee more successful and better pre-pared. Then advise the supervisor that from then on all contact with the mentee will be confidential.
Mentoring can also be outside the vertical you’re in. You may simply be needed to assist in the area of gen-eral business or management development. My first “official” mentee was not related to supply chain at all. She was a full director with aspirations to become a corporate vice president.
This was particularly interesting, as I knew very lit-tle about her field and she knew even less about mine. However, I knew the politics pretty well myself having had to go through the gauntlet a few years previous. We spent real quality time away from the interruptions of the office and discussed the how to become an offi-cer of the company.
Most importantly, we discussed how to embrace a “proactive approach” in her dealings with the officer group. We also discussed the importance of not only impressing the officers, but her peer group as well. Those would be the folks that will be supporting her after her promotion. She was promoted within a year, and I was the second person she called with the thrill-ing news—her husband was first. Truly I felt like a million bucks.
I am pleased to say that I get quite a number of emails from my readers regarding their thoughts on my columns, and I thank your for that. Coincidentally, the columns that elicit the most emails are those deal-ing with mentoring. So, if you are a senior manager out there reading this column, put the magazine down and go find a new manager and offer to help them out one on one.
Trust me, when that mentee gets promoted it will feel like it was one of your own kids graduating. And if you are a newly minted logistician reading this column and do not currently have a mentor, go out and find one. It may be the best thing you ever do for your career. M
Wayne Bourne is founder and president of The Bourne Manage-ment Group, a consulting firm specializing in supply chain, logistics, and transportation network creation, economics, organizational development, and process analysis. A recipient of several industry awards, he has nearly three decades of experience in transporta-tion and logistics management. Mr. Bourne may be reached at [email protected].
Time to become a mentor
LM_1105_SageAdvice.indd 56 5/5/11 11:58 AM