Wanted: A renewableEurope
56
B AROMÈTRE DE L ’ATTRACTIVITÉ EUROPÉENNE 2007 E UROPEAN ATTRACTIVENESS S URVEY 2007 Wanted: A renewable Europe Ernst & Young European Attractiveness Survey
Transcript of Wanted: A renewableEurope
BA RO M È T R E D E
L’AT T R AC T I V I T É
E U RO P É E N N E 2007EUROPEAN
ATTRACTIVENESS
SURVEY 2007
Wanted:A renewable Europe
Ernst & Young European Attractiveness Survey

ContentsEditorial 1
Key Points of the Ernst & Young 2007European Attractiveness Survey 2
Methodology and sources 4
1 Europe’s Perceived Attractiveness 7
2 The Reality of Foreign Investment in Europe 19
3 Europe in the future 35
4 Challenges 45
Today's children are the European citizens of tomorrow; to reflect this we have includedgraphic representations of their own particular vision in our survey.These young artists (aged between 5 and 11), the children of Ernst & Young employees,express via their drawings their perception of some of the survey’s issues (towns, work,new technologies, transportation, eco-energies...).

Europe feels – and in some respects is – threatened by new, fast-growingand more creative economies. Where is Europe’s place in the world?Europe is the world’s largest economy, its biggest trading area andthe number one destination for foreign direct investment, accountingfor 45% of global flows in 2006. However, it also represents the leadingconcentration of scepticism and attempts at protectionism. This situationis due to the head-on confrontation of Europe, the historic sourceof globalisation, with its aggressive and dynamic competitors, in Asia,North America and all developing economies.
Having celebrated the 50th birthday of the Treaties of Rome, the grandvision of Europe has reached a time of renewal, a turning point for meetingnew challenges and addressing new risks. The time is ripe for a regenerationof its competitiveness policy, its political agenda, its institutions.Such modifications imply not only a renewal of social scales between vastlydifferent economic situations and a renewal of local strategies, but alsoa renewal of tax and legal systems, hard and soft infrastructure, equipmentand talents.
Is Europe really renewable? What are the tools that will enable Europeto flourish in a globalising world? How do companies act and adapt to thisenlarged world of business? Are there significant trends within the growingsectors and more challenged industries? What is the sustainability of Europe’ssocial, economic and environmental models?
These issues form the core of the Ernst & Young Attractiveness Survey,based on a two-fold, original methodology that reflects (1) the “perceived”attractiveness of Europe and its competitors by a representative panelof 809 international decision makers and (2) Europe’s real attractivenessfor foreign direct investors, based on Ernst & Young’s European InvestmentMonitor.
This year we have added more interviews, together with the opinionsof a selected panel of global observers, from the business community,leading institutions and the Ernst & Young network. As the Ernst & YoungAttractiveness Survey enters its fifth year, we would like to extendour gratitude to the thousands of decision makers around the world who,over the years, have taken the time to share their thoughts with us.
The success of this unique survey is directly attributable to their participationand commitment.
Editorial
Patrick GounellePresident of Ernst & YoungFrance & Southern Europe
Marc LhermittePartner,
International LocationAdvisory Services

2007 ER N S T & YO U N G EU RO P E A N AT T R AC T I V E N E S S SU RV E Y
Key PointsPerception of internationaldecision makers:the mature economic markets of Europeare losing their hold on investors, as theemerging economies of Asia gain ground
22
◗ Western Europe’s attractiveness for foreign investors declinedsignificantly in 2007, along with Central and Eastern Europe’s rating.Both European areas lost 13 points between 2006 and 2007.
◗ However, Europe maintains its lead as the most attractive globalinvestment region, placing five countries in the global Top 10.At the same time, the European focus is shifting eastwards,with France and Spain dropping out of the top 10.
◗ Asia showed a significant gain in investor confidence, closingthe gap with Europe. China now lies in second place among the listof preferred regions, with only seven points separating it from WesternEurope’s lead. India also gained significant ground (+8 points)and is placed fifth by global investors.
◗ At a country level, the rise of China has resulted in a declinein popularity for the United States with an 8 points fall, to givean attractiveness rating of 33% in 2007.
◗ Despite the gain in popularity of more dynamic FDI destinations,business leaders express confidence in Europe’s future, with 56%believing its attractiveness will improve over the next three years.
◗ In order to improve Europe’s attractiveness, investors cite, above all,the need for reforms providing greater flexibility (47%), simpleradministrative procedures (44%) and more support for innovation (35%).
◗ Over half (56%) of respondents believe that the adoption of newenvironmental regulations by European countries would providea means of increasing its attractiveness. They are divided as to whetherthe European Union gives sufficient support to environmental issues.

33
Reality of foreign directinvestment (FDI) in Europe:an intense level of activity, resulting in a 15%increase in FDI projects in 2006
◗ In terms of number of projects, Europe attracted 3,531 foreigninvestments in 2006, compared with 3,065 in 2005, representing a 15%increase. 71% of these were “Greenfield” projects, a further signof investment intensity.
◗ The top two destinations for FDI were the UK and France, with 19%and 16% of total projects respectively. The UK’s lead became morepronounced in 2006. Investment in other European countries fell wellbehind these two market leaders.
◗ The steady increase in foreign investments in the services sectorof recent years was confirmed in 2006: tertiary activities represented 60%of international investments in Europe, compared with 48% in 2004.At a sector level, software and business services generated the greatestnumber of projects (472 and 446 projects respectively, representingmore than 25% of the total).
◗ Investments by European players continue to dominate investmentflows, representing 50% of investments announced for 2006. Interest bythe BRIC countries is increasing significantly: the number of Europeaninvestments generated by these four countries increased from 112 in 2005,to 163 in 2006. This was accompanied by India’s entry into the rankingof the top 10 investor countries in 2006.
◗ In terms of employment, international investments resulted inthe creation of 211,373 jobs over the year, an increase of 8.3% on 2005.An average of 101 jobs were created per project across Europe (basedon projects for which employment information is available).
◗ Investment projects in Central & Eastern Europe were particularlylabour intensive. While Central and Eastern Europe attracted only 26%of investment projects, they benefited from 51% of the new jobs createdby foreign investors. This represented an average of 217 jobs per project,compared with 64 jobs per project in Western Europe. Poland wasthe largest creator of FDI jobs, with almost 15% of the total.

2007 ER N S T & YO U N G EU RO P E A N AT T R AC T I V E N E S S SU RV E Y
Methodologyand Sources
4
The Ernst & Young European AttractivenessSurvey is based on a two-fold, originalmethodology that reflects:
The “perceived” attractivenessof Europe and its competitorsby foreign investors
The views and opinions ofa representative panel of 809international decision makerson Europe’s attractiveness.
These executives – from all regions,industries and business models –were interviewed by telephoneby the “Institut CSA” in Februaryand March 2007 in the followinglanguages: Dutch, English, French,German, Italian and Spanish.
The “real” attractivenessof Europe for foreigninvestors
The reality of foreign directinvestment (FDI) is evaluated on thebasis of “Ernst & Young’s EuropeanInvestment Monitor” (EIM).
This unique database tracks foreigndirect investment projects thatresulted in new facilities and/orthe creation of new jobs.
By excluding portfolio investments,mergers and acquisitions, it showsthe reality of investment inmanufacturing or services operationsby foreign companies across thecontinent.

5
An international sample of decision makers from allorigins with a clear view and experience of Europe
The survey sample was established to provide the mostaccurate profile of foreign investors in Europe,as a whole and in each European country, with regardto the EIM data since 2000.
In order to take into account the distance ofthe respondents from their respective locations, eachnationality quota was divided into two equal groupsof businesses:■ the first half corresponding to the subsidiaries
of international groups, was surveyed at theirEuropean investment location,
■ the second half corresponding to the parent companiesof international groups, was surveyed in their countryof origin.
The sample is composed of:■ 53% European businesses,■ 35% North American businesses,■ 12% Asian businesses and other.
Of the non European companies interviewed, 45% haveestablished operations in Europe. As a result an overall704 of the 809 companies (87%) interviewed havea presence in Europe.
Nationality of the companies surveyed
All business modelsand sectorsTo further guarantee a representative sample with regardto the diversity of the type of company and theirinternational strategies, the survey ensured thatit obtained the opinion of:■ SMEs (small and medium enterprises), as well as
those of multinationals,■ Industrial companies as well as service providers.
Divided into five main sectors, the businesses surveyedare representative of the key European and globaleconomic sectors:■ Industry/Automotive/Energy,■ B-to-B and B-to-C services,■ Telecoms and Hi-tech,■ Consumer goods,■ Real estate and construction.
Size of companies surveyed (by turnover)
Company business sectors surveyed


Europe’s PerceivedAttractiveness
Global competition Local Drivers

8 2007 ER N S T & YO U N G EU RO P E A N AT T R AC T I V E N E S S SU RV E Y
Ranking of the most attractive global areas 2007(total superior to 100% - 3 possible choices)
Europe loses 13 points in its attractiveness rating,but retains a global leadership
1.1
Having successfully fended off advances by other global regions in recent years, Europe’sclear lead as the location of choice is narrowing. While over half (55%) of decision-makerscite Western Europe as one of their three most preferred business locations, this representsa full thirteen-point fall from the 2006 score. Similarly, Central and Eastern Europe loses13 percentage points in 2007, placing it third on the global scoreboard.

9
Ranking of the selection criteria for an investment location (2006 data)
Market and access factors: One of the most significant reasonsfor a change in location strategy is a change in the market – in its scale,geography, nature or diversity – as well as competitor activity, and qualityand price issues related to market access. Location factors thereforeencompass criteria relating to project activities, such as the qualityof the infrastructure, proximity to markets and the quality of thetelecommunication networks.
Labour and productivity factors: In addition to market factors,a company’s need or desire to find new resources or arbitrate betweenvarious labour profiles influences business location decisions. Factorsevaluated are labour skills, labour availability and, of course, labour costswhen factored with productivity.
Fiscal and legal factors: These factors concern the tax planningof an investment, but also its flexibility – directly or indirectly – and itsprofitability. Of particular importance are the tax burdens and incentives,legal and regulatory factors, and also public incentives.
Environmental and regional factors: These criteria concernthe operating environment of the company in a given country or regionand the extent to which they offer the company the necessary meansto develop. In particular, they concern the availability of capital andfinancial markets, specific expertise in a given region, the wealthof innovation and research and the quality of life.
Why and how companies invest in new locationsThis first section provides a view of the most attractive global regions and their respective attractiveness profiles, as seen by our global panelof business executives. It ranks key economic zones against the factors considered by companies when making location decisions.Analysis of the criteria used by international corporate executives in selecting locations for investment projects confirms that their decisionsare dominated by four sets of factors:

10 2007 ER N S T & YO U N G EU RO P E A N AT T R AC T I V E N E S S SU RV E Y
The zone is most strongly valued for its
infrastructure, quality of life, labour skills,
language and transparency of its legal environment.
Over half of decision makers identify WesternEurope as their first choice location for these“quality-driven” criteria. Investors appear more
unanimous in their evaluation of quality and risk
issues than in their stringent demands relating to costs
and productivity pressures. They seem to have
understood the permanent change Europe has
undergone, from a historic base of heavy
manufacturing and labour intensive industries,
to a region of high skills and concentration
of value-added activities.
Western Europe: Evolution of the zone’s rating by location selection criteria 2004-2007(% of respondants citing zone as most attractive location)
Business leaders’ view of Western Europe:predictable, reasonably wealthy and stable,if not dynamic
1.2
Western Europe maintains a solid following among potential investors: the region is the firstchoice location for all attractiveness factors, with the exception of labour costs.

11
After maintaining a consistent second place in
our previous surveys, Central and Eastern Europehas ceded its second position to China in the ranks
of regional attractiveness.
Central and Eastern European locations are unable
to rely solely on their position at the heart of change
in Europe, nor draw the full benefit from a favourable
labour environment. The region still appears to be
having difficulty in convincing investors of its merits
as an “all-round” business location. It fails to score
first for any of the location factors for which it was
surveyed: it comes second on potential productivity
increases, corporate taxation level and financial
incentives. The region shows little sign of
consolidating its image. The increased level
of interest identified by our survey in 2005 as a result
of favourable labour costs has not been maintained.
While 27% of respondents ranked Central andEastern Europe top for this strategic locationfactor in 2005, it has fallen to 20% in 2007.
Central & Eastern Europe (including Russia): Evolution of the zone’s ratingby location selection criteria 2004-2007(% of respondants citing zone as most attractive location)
Central and Eastern Europe finds newcompetition
1.3
The traditional strongholds been forced to accept a reduced level of business interest as Chinarises through the ranks.

12 2007 ER N S T & YO U N G EU RO P E A N AT T R AC T I V E N E S S SU RV E Y
However, Europe’s economic focus is continuing its Easterntransition. While the UK and Germany retain a firm foothold
on the global attractiveness map, other old, established economies
have witnessed a reduced level of investor interest as eyes turn
to the east – to the new Europe and beyond.
As a result France and Spain no longer enter into the Top 10
preferred countries, with two Western European countries
(Germany and the UK) and two Central and Eastern European
countries (Poland and the Czech Republic) featuring in
the ranking.
This eastward shift, however, does not extend as far as Russia,
which is ranked amongst the top three investment locations
by only 12% of respondents, in marked contrast to the 39%
of voters citing Central and Eastern Europe.
The Top 10 most attractive countries in 2007(total superior to 100% - 3 possible choices)
US companies have expressed great interestin understanding the capabilities of Centraland Eastern European countries to supportlight manufacturing and global businessservices operations. Investors perceive thatstrong language skills and familiarity with USculture can drive location decisions toward EUcountries; however, there are concerns overthe sustainability of wage arbitrage benefitsand the flexibility of labour regulations withinEU countries. To maintain the growth ofinvestments from US companies, EU countriesmust continue to aggressively developprogrammes and incentives focused onworkforce quality rather than competing withother global locations on a cost basis.
Mark CostelloManaging PartnerReal Estate Advisory ServicesErnst &Young, New York, USA
Quality versus cost

13
Of the top 5 areas, 29 points now separatethe score of the fifth placed India, from WesternEurope – the lowest spread yet recorded. At the same
time, China’s advance on Western Europe has
considerably increased since 2006.
China and India’s marked rise in popularity is even
more evident at a country level, where their mounting
popularity places them first and third respectively
on the podium of global countries. In 2007 our survey
shows that almost half (48%) of all respondents now
cite China as one of their top three preferred business
locations (up from 41% in 2006). However, China,
while topping the rankings for its favourable labour
costs, is still challenged by investors for the quality
of its workforce – only 4% of interviewed investors
cited it as the most attractive region for labour skills.
In addition, only 4% of respondents mentioned China
as the most attractive region for R&D availability
and quality, as opposed to 43% for Europe and 27%
for North America.
India’s popularity is increasing fast. While 11%
of respondents cited the country amongst their top
three preferences in 2004, this figure has risen to 26%
in 2007.
Whilst China, and to a lesser extent India, have now
earned a secure place on the world map as potential
investment locations, their favourable business image
has yet to filter through to the other Asian business
regions. The difference in the image rating of China,
rated overall second, compared with Japan (ranked
eighth, with 8% of votes) is remarkable.
Evolution of interest in the most attractive areas(total superior to 100% - 3 possible choices)
China and India reshuffle the cards1.4
Our 2007 survey shows a reshuffling of the cards amongst the most attractive regions.The attractiveness of the traditional top ranked regions of Europe and North America is givingway to a rise in popularity of India and China. The differences between the key global businessregions are blurring in terms of their perceived attractiveness. The global business worldhas become increasingly multi-polar.
14 2007 ER N S T & YO U N G EU RO P E A N AT T R AC T I V E N E S S SU RV E Y
Aside from India and China, the remaining so-called
BRIC countries of Brazil and Russia feature much
less prominently in terms of investor interest. Despite
the abundant energy supplies of Russia, internal
political uncertainties seem to deter investors.
Similarly for Brazil, the considerable efforts
by the government to secure macro economic stability
have so far failed to convince decision makers.
A total of only 7% of executives surveyed cited Brazil
among their top three preferred locations, while 12%
identified Russia.
■ With the exception of Western Europeancompanies, the strongest attention to the region is
paid by US companies, with 55% citing it among
their top three locations. Despite recent corporate
acquisitions, notably in the ICT, consumer goods
& steel industries, increased European interest from
Asian companies, has yet to be reflected in voter
preferences. Only 40% of Asian companies citedWestern Europe among their choices, compared
with an average response rate of 55%.
■ Central and Eastern Europe has more of a localfollowing. While 39% of all voters identified
Europe’s new entrants amongst their top three
preferred locations, the zone was cited by less than
a third (30%) of North American companies
and only 23% of Asian companies.
■ Interest in Asia, by companies of non Asian
nationality, is focused on China. American
companies view the country more favourably (51%
citations) than their Western European counterparts
(45%). However, it is worth noting that overall,
China’s rating shows relatively limited variation
amongst Asian and non-Asian companies, resulting
in a combined attractiveness score of 48%.
■ At a sector level, Central & Eastern European
interest is concentrated among consumer industries
(45% vs. an average 39%). At present, the regionfails to seduce a significant number of hi-techindustries however, with only 27% of hi-tech/
telecom companies voting for the region.
Such companies, together with those in Business
Services indicate a preference for the USA
and Canada (47% compared with an average
38% of respondents).
■ Relatively higher operating costs in Western
Europe no doubt play a part in the more limitedpreference of manufacturing industries for
the zone (49% of votes compared with an average
55%).
■ In terms of company size, no regional voting
pattern is apparent – small and large companies
showing similar location preferences.
Within Europe, a slight difference is seen by
company size, smaller companies preferringthe reassurance of their home markets (33%),while larger companies take a more global view
of business location (22% favouring the region).
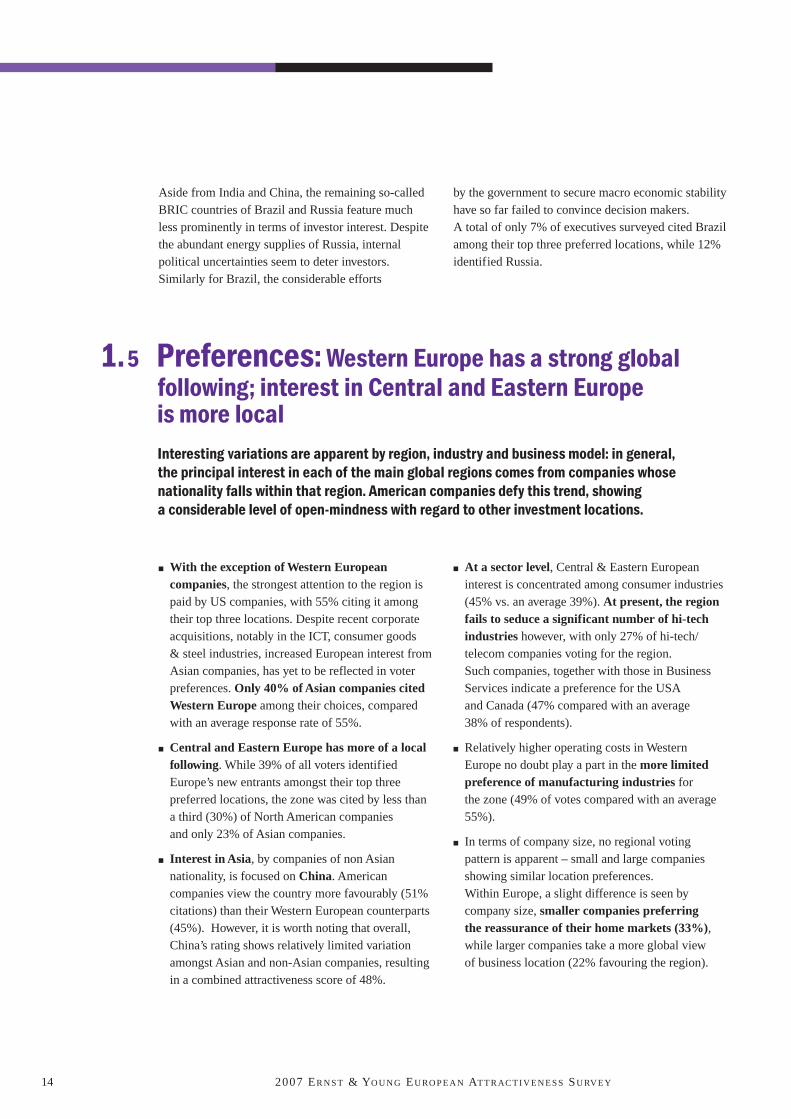
Preferences: Western Europe has a strong globalfollowing; interest in Central and Eastern Europeis more local
1.5
Interesting variations are apparent by region, industry and business model: in general,the principal interest in each of the main global regions comes from companies whosenationality falls within that region. American companies defy this trend, showinga considerable level of open-mindness with regard to other investment locations.
15
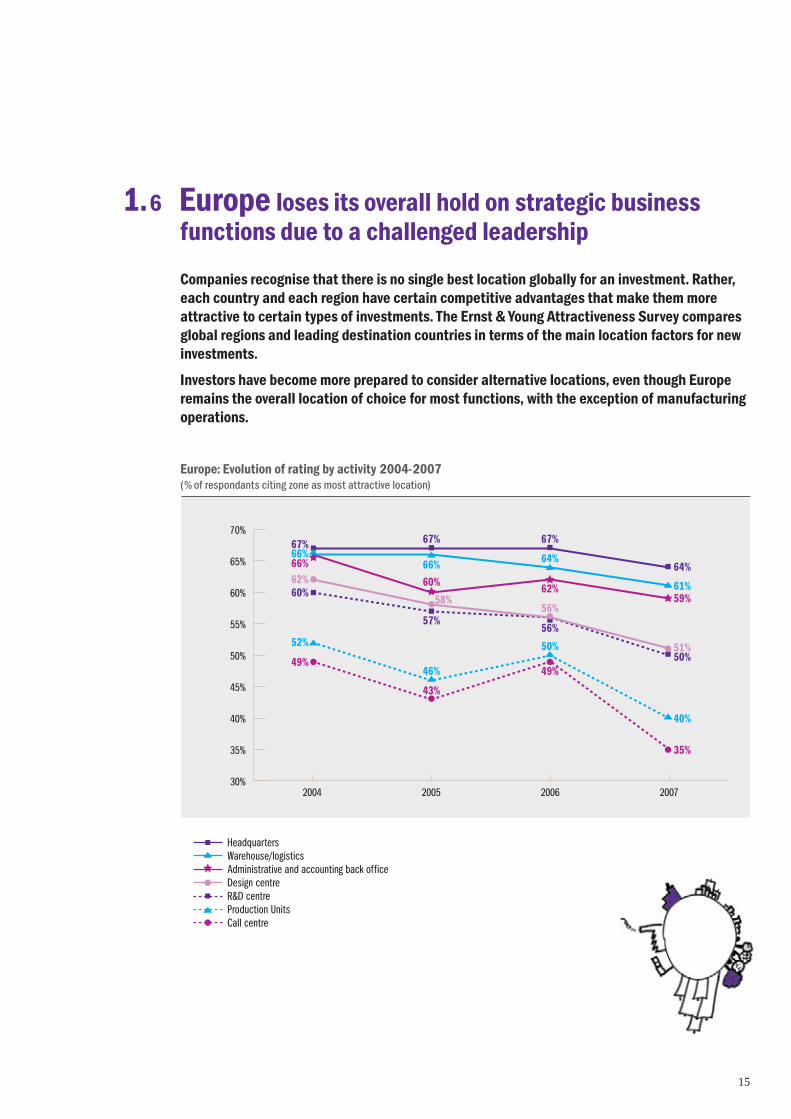
Europe: Evolution of rating by activity 2004-2007(% of respondants citing zone as most attractive location)
Europe loses its overall hold on strategic businessfunctions due to a challenged leadership
1.6
Companies recognise that there is no single best location globally for an investment. Rather,each country and each region have certain competitive advantages that make them moreattractive to certain types of investments. The Ernst & Young Attractiveness Survey comparesglobal regions and leading destination countries in terms of the main location factors for newinvestments.
Investors have become more prepared to consider alternative locations, even though Europeremains the overall location of choice for most functions, with the exception of manufacturingoperations.

16 2007 ER N S T & YO U N G EU RO P E A N AT T R AC T I V E N E S S SU RV E Y
Call-centre retreat
Particularly notable is the sharp decline in Europe’s attractiveness
score for call-centre functions. At the same time, the region
maintains a firm following for other support functions, such
as back office operations.
The pull of India as a global call-centre location remainsundisputable, despite a cooling off in investor interest in
the region in 2006. Although there have been considerable annual
variations, the region has gained thirteen points since the start
of our analysis in 2004. Technology advances in recent years have
allowed India to bypass its previous economic disadvantages,
such as a lack of infrastructure, and capitalise on its strengths
of a well-educated, computer literate and English speaking
workforce.
Europe is likely to continue to lose ground to India as a location
for R&D and administrative/back office functions in the future.
Ranking of top countries for call-centres(% of respondants citing zone as most attractive location)
Ranking of top countries for production units(% of respondants citing zone as most attractive location)
Factory production increasinglymulti-polarFollowing a number of years of wide variations in investor
location preferences for factory/production units, decision makers
now seem to have reached a consensus that the three regions
of Western Europe, Central and Eastern Europe and China all
have their merits as factory locations, but for different reasons.
China gained significant ground in 2007 with 24% of votes,
but the need to maintain control of operations, and proximity
to distribution channels and research and development operations
continues to guarantee a strong (18%) presence for Western
Europe.
Central and Eastern Europe remains popular and earns a second
place ranking. The region benefits from its relative proximity
to the target market, while at the same time playing to its strength
as a low cost location.

17
Europe faces increased competitionfor R&DOur previous surveys have shown a majority of potential investors
favouring Europe as a location for their R&D activities. In 2007,interest in Europe as an R&D location sees a 6 point fall, with
50% of respondents citing it as their preferred location.
Germany, although remaining in second place, sees a significant
decline in its image as an R&D location (-6 points). France similarly
falls from favour, losing its fourth spot to rank seventh in 2007.
India is cited by 5% of voters, with Japan and China obtaining
4% of responses – percentages which remain on a par with
our previous survey.
Ranking of top countries for R&D centres(% of respondants citing zone as most attractive location)
Ranking of top countries for headquarters(% of respondants citing zone as most attractive location)
Overwhelming preference for Europefor headquarters’ functionsDespite declines in its ratings for other business activities,
our 2007 survey is marked by a reaffirmation of Europe’s clearlead as the preferred location for headquarters’ activities,with 64% of voter preferences. This rating places it head and
shoulders above its nearest rival USA/Canada with 21% of votes.
This strong preference for Europe is seen continent-wide, with
the region taking all the top ten country slots, with the exception
of the USA and Japan. New to the top ten ranking in 2007
are Spain, Luxemburg and Sweden, displacing notably China
from the ranking.
This result raises questions on the real level and depth
of globalisation: just how much power are European
multinationals prepared to relinquish when they show
a distinct reluctance to release their control on decision-making
and relocate their headquarters’ activities to emerging markets ?


Eur-hope
The Reality of ForeignInvestment in Europe

20 2007 ER N S T & YO U N G EU RO P E A N AT T R AC T I V E N E S S SU RV E Y
At a macro level, data is available on foreign direct
investment (FDI) which includes equity capital,
reinvested earnings and intra-company loans.
While this information is broadly comparable
(although many countries do not report all
components of investment), most companies and
development experts are interested in where inward
investment projects have been undertaken, the type
of investment concerned, who made the investment
and in which sectors.
To map the investments carried out in Europe,
Ernst and Young created the Ernst & Young
European Investment Monitor (EIM) in 1997
to monitor investments and expansions of activity
in the region. In 2004, methodological changes
were implemented to this database to better
reflect the diversity of European investments
and the evolution of investment tracking methods
in individual regions and countries.
Introduction: Monitoring inward investment in Europe
Inward investment activity in Europereached a record high in 2006 with 3,531 projectannouncements, representing an annual increaseof 15.2% (3,065 projects). 2006’s increase was
significantly above that of the previous year (5.3%).
Contrary to common perception, European countries
and regions alike are experiencing the most active
time in their modern economic history in terms
of FDI.
This is a sign of a very active, highly volatile
period, with sectoral, functional and consequently
geographical changes in investment patterns within
Europe; while outside its borders, the region is faced
with increased competition.
Total number of FDI projects in Europe
Project announcements: New record for Europeand maintained leadership for the United Kingdom
2.1
FDI activity at the turn of the century was constrained by business conditions. However,today’s strong economic indicators and moves by multinational corporations and SMEs to takepositions in a rapidly changing Europe have allowed FDI to resume a path of growth, bothin terms of number of projects and volumes.
21
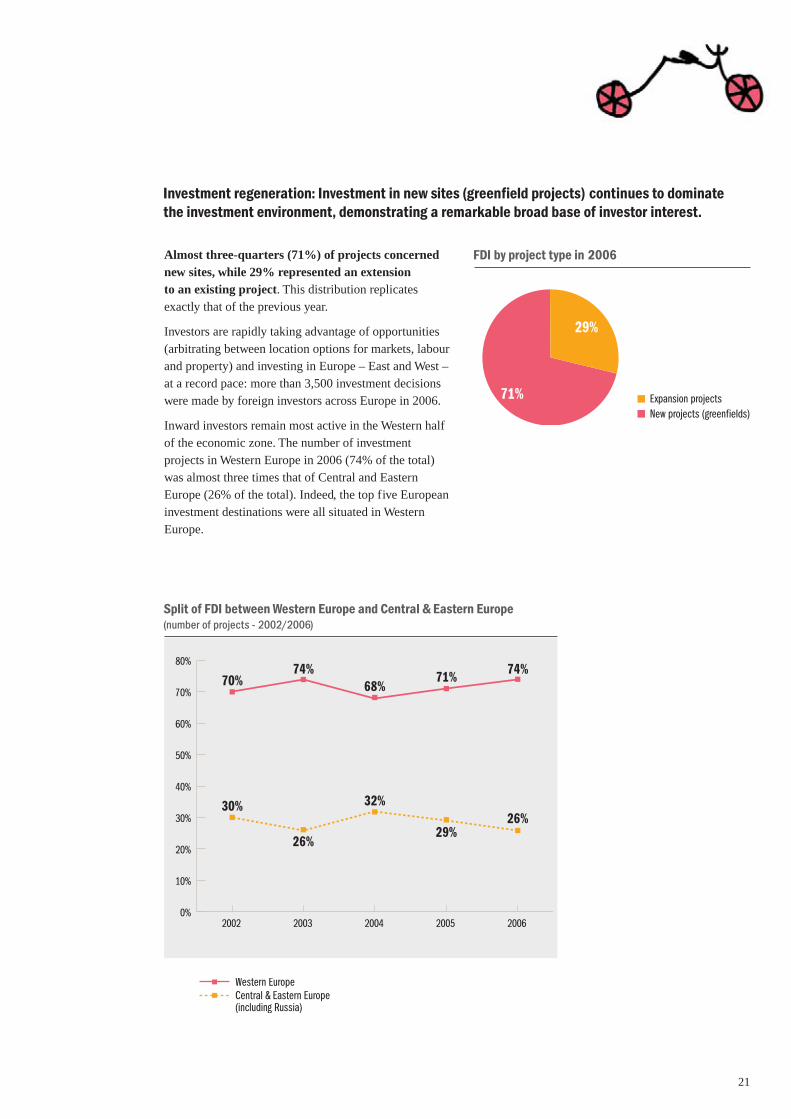
Investment regeneration: Investment in new sites (greenfield projects) continues to dominatethe investment environment, demonstrating a remarkable broad base of investor interest.
FDI by project type in 2006
Split of FDI between Western Europe and Central & Eastern Europe(number of projects - 2002/2006)
Almost three-quarters (71%) of projects concernednew sites, while 29% represented an extensionto an existing project. This distribution replicates
exactly that of the previous year.
Investors are rapidly taking advantage of opportunities
(arbitrating between location options for markets, labour
and property) and investing in Europe – East and West –
at a record pace: more than 3,500 investment decisions
were made by foreign investors across Europe in 2006.
Inward investors remain most active in the Western half
of the economic zone. The number of investment
projects in Western Europe in 2006 (74% of the total)
was almost three times that of Central and Eastern
Europe (26% of the total). Indeed, the top five European
investment destinations were all situated in Western
Europe.
22 2007 ER N S T & YO U N G EU RO P E A N AT T R AC T I V E N E S S SU RV E Y
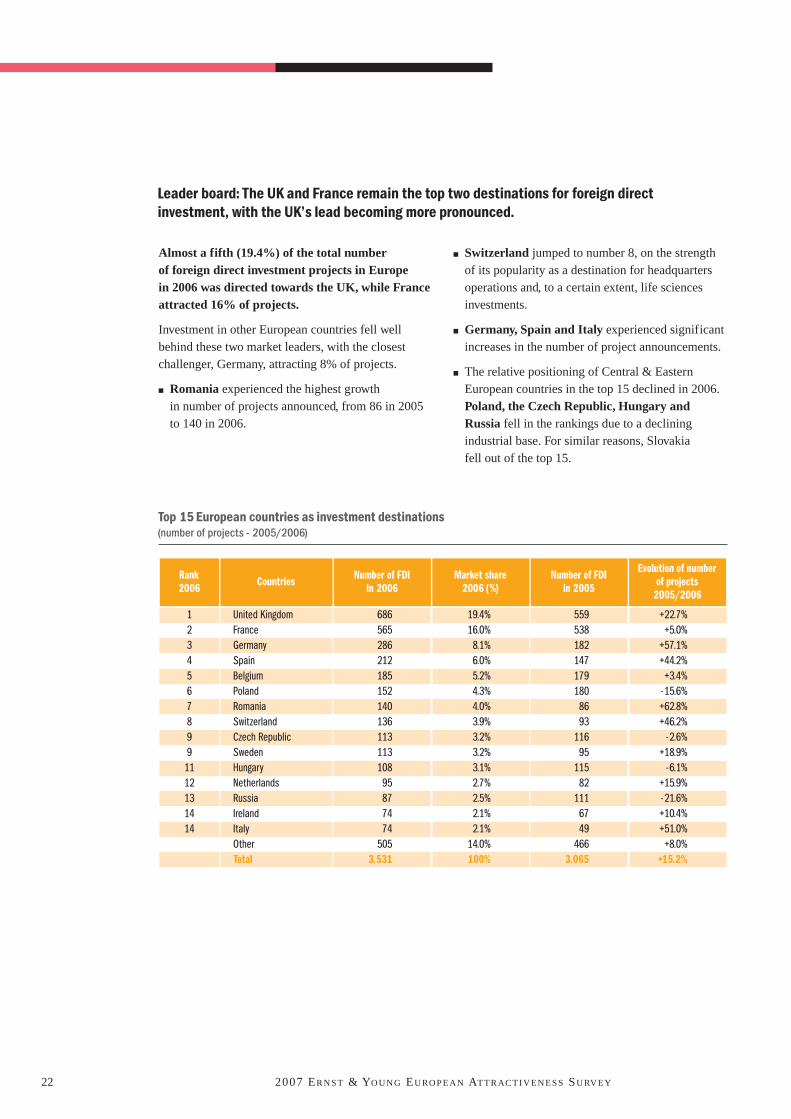
Almost a fifth (19.4%) of the total numberof foreign direct investment projects in Europein 2006 was directed towards the UK, while Franceattracted 16% of projects.
Investment in other European countries fell well
behind these two market leaders, with the closest
challenger, Germany, attracting 8% of projects.
■ Romania experienced the highest growth
in number of projects announced, from 86 in 2005
to 140 in 2006.
■ Switzerland jumped to number 8, on the strength
of its popularity as a destination for headquarters
operations and, to a certain extent, life sciences
investments.
■ Germany, Spain and Italy experienced significant
increases in the number of project announcements.
■ The relative positioning of Central & Eastern
European countries in the top 15 declined in 2006.
Poland, the Czech Republic, Hungary andRussia fell in the rankings due to a declining
industrial base. For similar reasons, Slovakia
fell out of the top 15.
Top 15 European countries as investment destinations(number of projects - 2005/2006)
Rank2006 Countries Number of FDI
in 2006Market share
2006 (%)Number of FDI
in 2005
Evolution of number of projects
2005/2006
12345678991112131414
United KingdomFranceGermanySpainBelgiumPolandRomaniaSwitzerlandCzech RepublicSwedenHungaryNetherlandsRussiaIrelandItalyOtherTotal
68656528621218515214013611311310895877474
5053,531
19.4%16.0%8.1%6.0%5.2%4.3%4.0%3.9%3.2%3.2%3.1%2.7%2.5%2.1%2.1%
14.0%100%
5595381821471791808693
11695
11582
1116749
4663,065
+22.7%+5.0%
+57.1%+44.2%+3.4%
-15.6%+62.8%+46.2%
-2.6%+18.9%
-6.1%+15.9%-21.6%+10.4%+51.0%+8.0%
+15.2%
Leader board: The UK and France remain the top two destinations for foreign directinvestment, with the UK’s lead becoming more pronounced.

23
Foreign investment in key European countries 2006(number of projects and total job creation)
* based on projects for which the information is available.

24 2007 ER N S T & YO U N G EU RO P E A N AT T R AC T I V E N E S S SU RV E Y
Available employment data indicate that Western Europein general was characterised by investment in a large numberof projects that were less labour intensive; a factor undoubtedly
linked with the higher staff costs in the region. The number
of jobs created increased in most of the 15 European FDI
destinations.
An average of only 64 jobs was created per project in Western
Europe. By contrast, while the number of jobs created in Central
and Eastern Europe was almost identical (108,795 jobs),
the region welcomed a significantly fewer number of projects and
capitalised on the reduced labour costs to create a significantly
higher number of jobs per project (an average of 217 jobs
per project).
Total job creation by FDI in Europe*(number of jobs created - 2004/2006)
* based on projects for which the information is available.
Job creation: Poland maintains its lead asthe number one destination for employment flowsvia FDI
2.2
General activity: FDI activity resulted in the creation of a record 211,373 jobs in Europein 2006, an increase of 8.3% on the previous year. This reversed the trend of 2005,which witnessed a sharp (-18%) fall in the number of FDI created jobs, and confirms2006 as a remarkable year.
Job creation split between Western Europeand Central & Eastern Europe - 2006
Job creationby project
(average 2006)*
Total job creationby region (2006)
Market share(% 2006)
Western EuropeCentral & Eastern EuropeTotal
64217101
102,578108,795
211,373
49%51%
100%
* based on projects for which the information is available.

25
At a national level, the UK and France remainedsecond and third respectively in terms of jobcreation, although the number of jobs created
declined slightly (27,481 jobs created in the UK
and 20,509 in France).
Spain and Ireland experienced a significant increase
in job creation (+35% and +17% respectively). Spain
rose to be placed ahead of Germany, while Ireland out
paced Russia.
Whereas Slovakia left the top 15 destination
countries in 2006 for FDI projects, the country
retained its ranking in 6th place in terms of job
creation due to a significant increase of the number
of jobs created (+24.7%, with 13,527 jobs created
in 2006).
Conversely, Romania and Hungary experienced
a slight decrease in the number of jobs created, with
the creation of 13,969 and 10,906 jobs respectively.
Country positioning in 2006*(jobs created per project/total job creation)
* based on projects for which the information is available.
Country profiles: Poland remained the largest job creator, with the implementation of 31,115new posts due to foreign investment, spread across a relatively restricted number of projects.
Top 15 European countries for FDI by job creation - 2006
Rank 2006 Countries Total job creationin 2006*
Market share of job creation 2006 (%)
Job creation by project(average 2006)*
123456789101112131415
PolandUnited KingdomFranceCzech RepublicRomaniaSlovakiaHungarySpainGermanyPortugalIrelandRussiaBelgiumSerbiaBulgariaOtherTotalEuropean average
31,11527,48120,50917,36913,96913,52710,9069,9709,8939,8167,1536,9605,4175,2124,080
17,996211,373
14.7%13.0%9.7%8.2%6.6%6.4%5.2%4.7%4.7%4.6%3.4%3.3%2.6%2.5%1.9%8.5%
100%
3246053
2141914361518770
49113821148
372128
101

26 2007 ER N S T & YO U N G EU RO P E A N AT T R AC T I V E N E S S SU RV E Y
Europe’s growth in business services (advisory,
design, recruitment and maintenance, etc.) also
incited a significant number of overseas investors
to develop projects; with the sector accounting
for 12.6% of FDI projects in 2006.
Despite a marked trend of a migration of automotive
related jobs towards emerging destinations, Europe
managed to attract a full 226 automotive related
projects in 2006 (6.4% of the total). However, with
increasing automation and cost pressures, there was
a sharp fall in the associated number of posts created.
In 2005 the sector was the largest creator of FDI jobs;
in 2006 almost 9,000 fewer automotive jobs were
developed, resulting in a total of 31,884 posts.
Nonetheless, sector related jobs represented 15.1%
of the FDI total.
Top 15 sectors for FDI by projects - 2006
Rank Sector name Number of FDI in 2006
Market shareof FDI projects
2006 (%)
Total job creation in 2006*
Market share of FDI job creation 2006 (%)*
123456789101112131415
SoftwareBusiness ServicesElectronicsMachinery & EquipmentAutomotiveFinancial IntermediationChemicalsOther Transport ServicesPharmaceuticalsFoodFabricated MetalsNon-metallic mineral productsElectricalPlastic & RubberScientific InstrumentOtherTotal
47244623422722619516414813011810095948972
7213,531
13.4%12.6%6.6%6.4%6.4%5.5%4.6%4.2%3.7%3.3%2.8%2.7%2.7%2.5%2.0%
20.4%100%
9,36620,11232,529
9,98931,8846,3075,353
13,6498,0267,5475,6303,2537,9976,2352,111
41,385211,373
4.4%9.5%
15.4%4.7%
15.1%3.0%2.5%6.5%3.8%3.6%2.7%1.5%3.8%2.9%1.0%
19.6%100%
Industries: The European FDI economyis increasingly reliant on service-related sectors
2.3
The software industry continued to dominate FDI projects in 2006, following a trend identifiedsince 1998. A record 472 software related investment projects were identified, representing13.4% of total projects by number.
* based on projects for which the information is available.

27
■ The Top 10 sectors represented more than
two-thirds of total FDI and job creation.
■ The number of software and business services
projects increased by 30.4% and 39.4%
respectively.
■ In total, High-Tech and knowledge-intensive
industries represented a significant share of total
FDI throughout Europe: 46.5% of all FDI in 2006
and 38.6% of total job creation.
■ The electronics sector ranked 3rd, generating
234 foreign investment projects in 2006 (compared
with 226 in 2005) and became the top job creator
(32,529 jobs created), ahead of the automotive
sector.
Sector positioning in 2006*(number of projects/total job creation)
* based on projects for which the information is available.
Whereas in 2005 the two top companies
investing in Europe were German, in 2006
American companies took the lead.
IBM and Microsoft were placed first
and second respectively, with DHL
and GlaxoSmithKline in joint third place.
In 1997, this list was led by Ford, Daewoo
and Siemens.
Main investors Number of FDIin 2006
IBMMicrosoftDHLGlaxoSmithKlineProcter & GambleAirbusCatlinCemexDellHSBCITC InfotechKronospanMazda MotorMicroStrategyOne Planet CorpSAPStora EnsoTNT
865554444444444444
Top investors in Europe - 2006
28 2007 ER N S T & YO U N G EU RO P E A N AT T R AC T I V E N E S S SU RV E Y
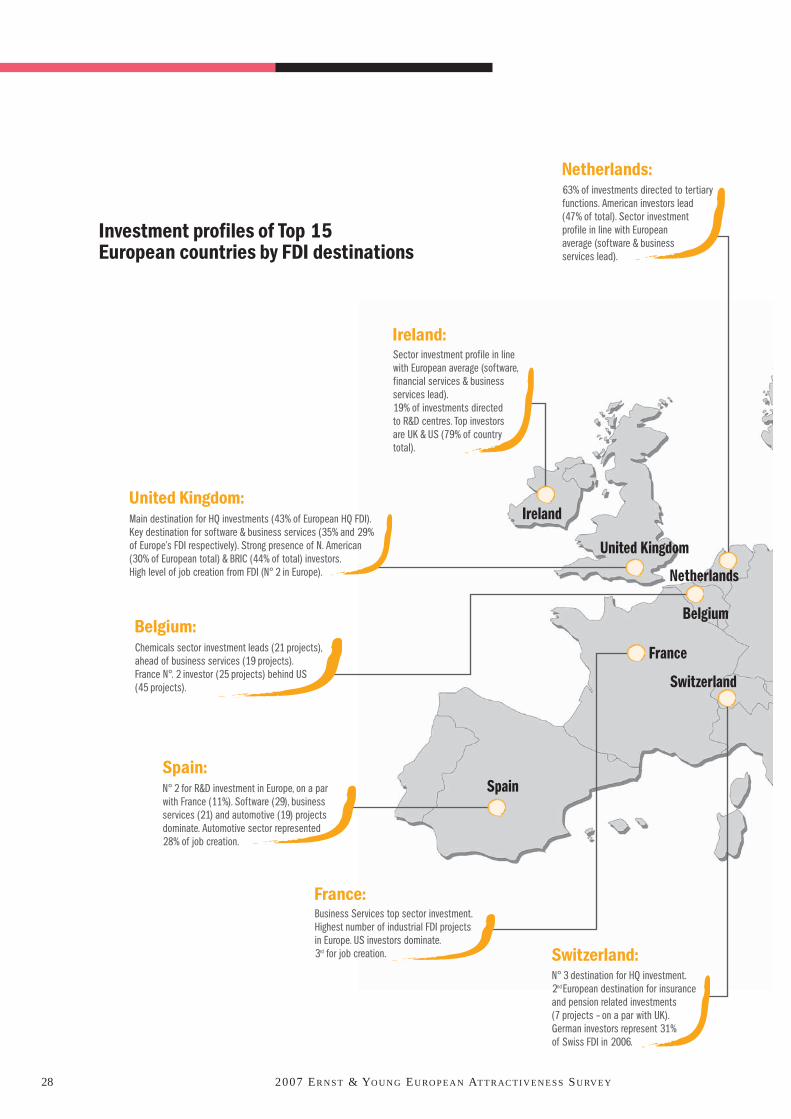
Investment profiles of Top 15European countries by FDI destinations
Sector investment profile in linewith European average (software,financial services & businessservices lead). 19% of investments directed to R&D centres. Top investors are UK & US (79% of countrytotal).
63% of investments directed to tertiaryfunctions. American investors lead(47% of total). Sector investmentprofile in line with European average (software & business services lead).
Chemicals sector investment leads (21 projects),ahead of business services (19 projects).France N°. 2 investor (25 projects) behind US(45 projects).
N° 2 for R&D investment in Europe, on a parwith France (11%). Software (29), businessservices (21) and automotive (19) projectsdominate. Automotive sector represented28% of job creation.
Business Services top sector investment.Highest number of industrial FDI projects in Europe. US investors dominate. 3rd for job creation.
Main destination for HQ investments (43% of European HQ FDI).Key destination for software & business services (35% and 29%of Europe’s FDI respectively). Strong presence of N. American(30% of European total) & BRIC (44% of total) investors. High level of job creation from FDI (N° 2 in Europe).
N° 3 destination for HQ investment.2nd European destination for insuranceand pension related investments (7 projects – on a par with UK).German investors represent 31%of Swiss FDI in 2006.
Ireland:
United Kingdom:
Belgium:
Spain:
France:
Switzerland:
Netherlands:

29
Domination of business services (41 projects) and electronics (32)
ahead of software (19). US investorsdominate. Large number of projects
(3rd in Europe), not reflected in job creation (9th).
Germans show greatest investment interest(28% of total). Automotive projects lead (17 projects). Electronics & automotive
sectors key job creators (each with 16% of total).
3rd European destination for automotiverelated investment (20 projects).
Germany & US representtop investors.
2nd country for FDI in the automotivesector (22 projects). Industrial activitiesrepresent 59% of FDI projects. Germany
N°. 1 investor in Romania (21%).
N° 1 for jobs created via FDI (31,115 jobs).Industrial projects represent 65% of total,
of which automotive sector projectsdominate (19 projects). Business
services and electronics No. 2 (13 projects each).
Automotive projects lead (12 projects), financialintermediation rates second (9 projects).
Industrial projects represent 62% of total, with automotive projects representing
47% of FDI jobs. US investors N° 1.
Software & Business Services representtop sectors for FDI projects (16% and
13% respectively). US investors N° 1(15%), followed by Germany & Norway
(each with 12% of total).
Majority of interest comes from Europe(61% of projects). Limited manufacturingrelated projects – top 3 sectors: software
(14%), business services (16%) andfinancial intermediation (12%). Business
services account for 49% of job creation.
Germany: Sweden:
Russia:
Poland:
Czech Republic:
Hungary:
Romania:
Italy:

30 2007 ER N S T & YO U N G EU RO P E A N AT T R AC T I V E N E S S SU RV E Y
Manufacturing functions retained a highlyrespectable 40% of the total number of projectsin 2006.
In terms of the average number of jobs created,
one single industrial project created the same number
of jobs as three tertiary projects: an average of 157
posts were created per project for industrial functions,
compared with 55 for tertiary functions in 2006.
In terms of the overall number of jobs created, FDI
directed towards industrial functions resulted in over
twice the number of jobs realised by tertiary
functions.
However, drilling down, certain tertiary functions are
also seen to have created a significant number of jobs.
FDI investment in both shared services and contact
centres resulted in an average of over 200 jobs per
project. Conversely, sales and marketing projects,
R&D and headquarters implantations resulted in
the creation of relatively few new posts, bringing
down the tertiary function average.
Distribution of FDI and job creation by activity type(number of projects and total job creation - 2004/2006)
* Tertiary functions: contact centres, sales & marketing, shared servicescentres, research and development, headquarters
** Industrial functions: manufacturing, logistics
FDI job creation 2006: distribution by activity
■ Manufacturing represented almost60% of employment by inwardinvestment in 2006, contradicting
the perception that Europe is now
a “fab-less” area .
■ Still industrial in many respects,
Europe is also relying on its strengths
in the knowledge economy, realising
technology-intensive investments and
establishing new services operations:
a full 20% of 2006 inward investmentwas in headquarters, call-centres,accounting and IT back officesor R&D operations, creating
approximately 52,500 new jobs.
Activity Number of jobscreated 2006*
Market share2006 (%)*
Job creation by project
(average 2006)*
ManufacturingLogisticsOther industrial functionsSub total industrial functions
Contact CentreSales & MarketingShared Services CentreResearch & DevelopmentHeadquartersOther tertiary functionsSub total tertiary functions
Total
122,72719,7055,831
148,263
23,38310,59010,51410,1817,857
58563,110
211,373
58.1%9.3%2.8%
70.1%
11.1%5.0%5.0%4.8%3.7%0.3%
29.9%
100%
16714380
157
20717
22961434555
101
Activities: Industrial functions are fundamentalto job creation
2.4
Europe, particularly Western zones, has now confirmed its place in the global marketas a prime location for service sector related jobs; the region nonetheless remains attractiveto traditional, manufacturing related industries.
* based on projects for which the information is available.

31
The combined North American zonehad a 35% share of European FDI in2002, which had fallen to 30% by the end
of 2006. American investors created a total
of 990 FDI projects in 2006, compared
with 813 the previous year.
Germany dominated among European
investors, securing a clear second
position with a 13% share of all projects
announced in 2006. German companies’
level of investment in the region was
on a par with 2005.
Investment originating from the BRICcountries is increasing significantly.
The number of investments generated by
these four countries increased from 112
in 2005 to 163 in 2006, representing
a growth rate of +50%. India entered
the ranking of the top 10 investors in
2006, rating on a par with Canada,
each recording 78 projects.
For India this represented an increase
of +66% on 2005, in terms of number
of projects.
Evolution of the origin of European FDI(number of projects - 2002/2006)
Origin: European investment is fuelled by Europeancompanies
2.5
Cross border investment by companies of European origin continued to be the main drivingforce behind foreign investment patterns in Europe in 2006. Whilst American interestremained strong, its hold on the region has declined since the beginning of the decadeas the region becomes of interest to a broader audience.
Top 10 origin countries for European FDI(number of projects - 2005/2006)
Rank Origin country Number of FDI2006
Market share2006 (%)
Number of FDI2005
Market share2005 (%)
Evolution ofnumber of projects
2005/2006
1234567899
USAGermanyUnited KingdomJapanFranceSwitzerlandNetherlandsSwedenCanadaIndia
990449239189169113102877878
28.0%12.7%6.8%5.4%4.8%3.2%2.9%2.5%2.2%2.2%
81342017816015985
104897049
26.5%13.7%5.8%5.2%5.2%2.8%3.4%2.9%2.3%1.6%
+21.8%+6.9%
+34.3%+18.1%+6.3%
+32.9%-1.9%-2.2%
+11.4%+59.2%
British investors, while remaining in third place, showed
a significant increase in their level of investment, with the
number of projects rising from 177 in 2005, to 239 in 2006.
Investments originating from Japan increased by 18.1%,
with a total 189 projects.

32 2007 ER N S T & YO U N G EU RO P E A N AT T R AC T I V E N E S S SU RV E Y
From an Indian perspective, Europe seems extremely attractive for several reasons.Its many assets include the rich and dense EU market, its logistics infrastructure andunsurpassed connectivity in the world. In addition, high quality consumer expectationscreate an entry barrier for low cost producers like China. I would also point outthat India's cultural affinity with Europe is relatively higher than that with the US.On the downside, healthcare infrastructure is heavily overburdened in Europe, making itextremely expensive. Labour costs are high, necessitating investment in automationtechnologies to reduce recurring costs. Europe may be concerned that the very highproportion of investment and trade within the EU block make it a little inwardlooking… expectations are extremely high. Many Indian companies have made majoracquisitions in Europe in the recent past and these acquisitions are likely to spurthis trend over the next 3-4 years.
Utkarsh PalnitkarPartnerErnst & YoungIndia
Why Europe could be seen as an offshore location... of India
In terms of the distribution of investment within
the zone, North American investors focused mainlyon Western Europe, while German companies were
more geographically diverse in their location choices
(investments were split between approximately two-
thirds in Western Europe and a third in Central and
Eastern Europe).
Amongst investors based outside the region, the most
notable location decisions were made by the Japanese.
They demonstrated a more balanced repartition
in their location decisions, with a surprising 27.5%
of projects in Central and Eastern Europe and
the remainder in Western European countries.
European FDI by country of origin 2006 - Split between Western Europe and Central & Eastern Europe
Rank2006 Origin country Number of FDI
Western EuropeMarket share Western
Europe
Number of FDI Central & Eastern
Europe
Market share Central & Eastern
Europe
1234567899
USAGermanyUnited KingdomJapanFranceSwitzerlandNetherlandsSwedenCanadaIndia
8242841961371228087617371
83.2%63.3%82.0%72.5%72.2%70.8%85.3%70.1%93.6%91.0%
16616543524733152657
16.8%36.7%18.0%27.5%27.8%29.2%14.7%29.9%6.4%9.0%

33


Europein the future
Wanted: Reform

36 2007 ER N S T & YO U N G EU RO P E A N AT T R AC T I V E N E S S SU RV E Y
Whether indicating a sign of excessive
bullishness or rational expectations,
investors’ confidence nonetheless remains
high.
56% of our global panel expect theregion’s attractiveness to improve overthe next three years. This figure is on a
par with the 2006 rating. At the same time,
fewer executives expect Europe’s business
environment to decline (12%).
The “future” perception of Europe’s attractiveness
Executive’s perception of Europe’s attractiveness over the next three years
Most of the improvement in perceptions is related
to the prospects for Central and Eastern Europe,with almost three-quarters (71%) of our global
panel believing its attractiveness will improve.
This percentage is in line with that recorded in our
previous survey. By contrast, investors’ perceptions
of the future of Western Europe have declined since
last year, with less than half (49%) of executives
believing its attractiveness will increase, compared
with 54% in 2006. This shows that investors expect
that, soon, “East will meet West”, that future growth
and certainly future investments will take place
in the new Europe. One of the intriguing results
is the position of non-EU countries, such as Russia
or the Ukraine, this part of Europe being placed
second on the “future attractiveness” scale.
Eastern prospects
Investors monitor Europe at a crucial timeof change
3.1
Globalisation is on the march, deeply affecting Europe, however our survey showsthat business leaders maintain their confidence in the region.

37
Once again our survey demonstrates the
central role of Germany at the expense
of the previously favoured Central and
Eastern European economies.
Companies in search of a Europeanbase for their operations cited Germanyspontaneously in 20% of cases. Centraland Eastern European countries also
gain ground however, with notably
the Czech Republic rising in popularity
to take the third place slot (13% of votes).
Poland remains in second place, with 18%
of votes.
At a regional level, the significant advance
of the Czech Republic places Centraland Eastern Europe above WesternEurope as a future potential investmentlocation. The region earns 49% of votes,
compared with 43% for its Western
European counterpart.
Intentions to create investment or development projectsin Europe
The European location sites considered for new investmentor expansion projects(% of citations for each country - several responses possible)
Half of respondents plan to develop their activitiesin the enlarged Europe
3.2
Investors confirm that they will continue to entertain projects in Europe in the near future,while also developing complex, longer-term investment projects in Asia and other emerginglocations.

38 2007 ER N S T & YO U N G EU RO P E A N AT T R AC T I V E N E S S SU RV E Y
Of destinations currently under consideration
for relocation outside of Europe, the key competition
comes almost exclusively from Asia. China attracts
the interest of 50% of respondents currently
undergoing a relocation search, while India
is considered by 30% of voters.
As competitive cost pressures intensify, companies
will continue to offshore services and manufacturing
to lower-cost and higher-growth countries and expect
their governments and main operators to improve
business conditions for foreign investors.
Intentions to relocate outside Europe
One company in five intends to relocate all or partof its European activities outside the region
3.3

39
Europe’s labour framework is cited as the keyissue of European reform in order to increasethe region’s attractiveness. Business decisionmakers consider that Europe is being put at adisadvantage by the lack of flexibility in its labourmarkets and demand action by the EuropeanCommission. Additional key areas of reform cited
to encourage business investment in the region
include a modernisation and simplification of
the regulatory environment on a national and
European level and steps to encourage innovation
and investment in research and development.
The lack of progress made in reform is becoming
a subject of increasing frustration. While 37%of respondents in 2006 considered reformof European policies was required to increase
the region’s attractiveness, by 2007 this figure
has risen to almost half of those surveyed (47%).
The most important topics for the development of the European Union’s attractiveness(total superior to 100% - 3 possible choices)
In a complex global economy, there is a challenge for publicpolicy in reaching a view about how Europe’s governments atthe national, regional and local level can make an effectivecontribution to enhancing attractiveness for investment.This goes well beyond ensuring that the commercialconditions are favourable. Attracting people with the talentto contribute to investment success is vital. Whilst marketforces are clearly the great driver in all of this, policyprogrammes which go with the grain of the market are likelyto be the most useful. More work is needed to define whatthe programmes to achieve maximum impact might look like.
David WalburnDirector, Local Economy Policy UnitLondon South Bank UniversityLondon, UK
Global Talent, Local Solutions
Labour flexibility, simplified regulationsand stronger support for R&D are the most urgentlyrequired reforms
3.4
40 2007 ER N S T & YO U N G EU RO P E A N AT T R AC T I V E N E S S SU RV E Y
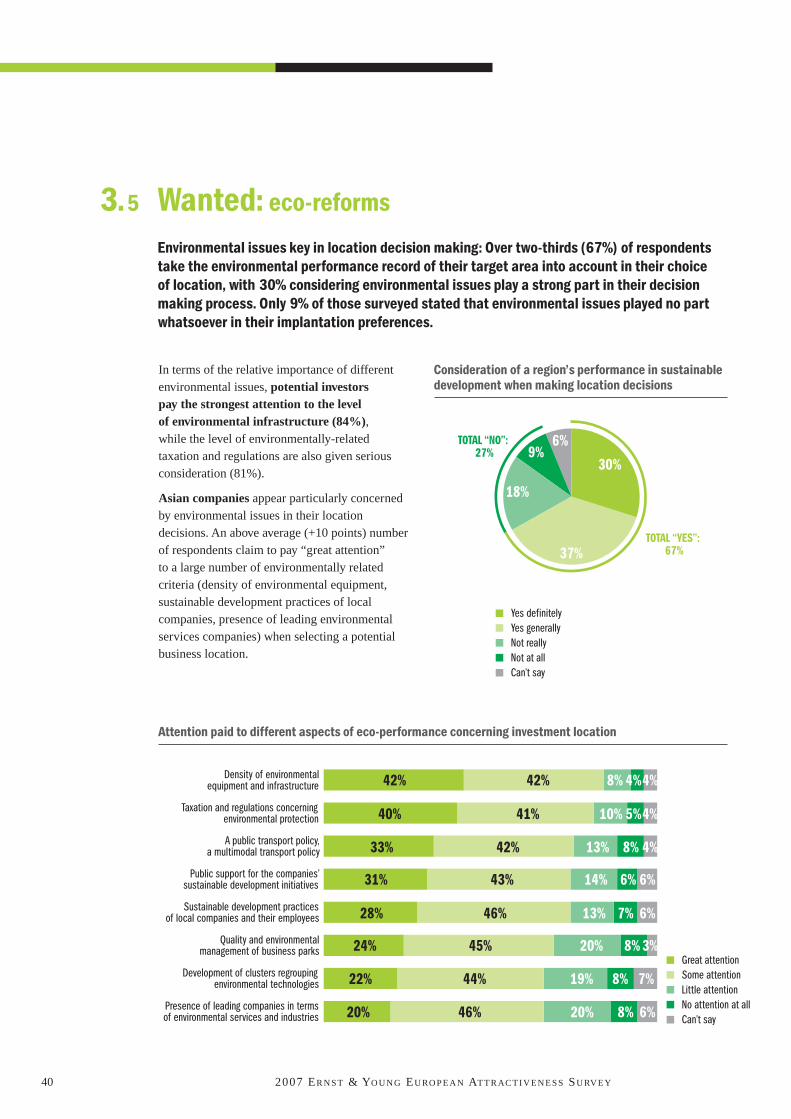
Attention paid to different aspects of eco-performance concerning investment location
In terms of the relative importance of different
environmental issues, potential investorspay the strongest attention to the levelof environmental infrastructure (84%),while the level of environmentally-related
taxation and regulations are also given serious
consideration (81%).
Asian companies appear particularly concerned
by environmental issues in their location
decisions. An above average (+10 points) number
of respondents claim to pay “great attention”
to a large number of environmentally related
criteria (density of environmental equipment,
sustainable development practices of local
companies, presence of leading environmental
services companies) when selecting a potential
business location.
Consideration of a region’s performance in sustainabledevelopment when making location decisions
Wanted: eco-reforms3.5
Environmental issues key in location decision making: Over two-thirds (67%) of respondentstake the environmental performance record of their target area into account in their choiceof location, with 30% considering environmental issues play a strong part in their decisionmaking process. Only 9% of those surveyed stated that environmental issues played no partwhatsoever in their implantation preferences.
41
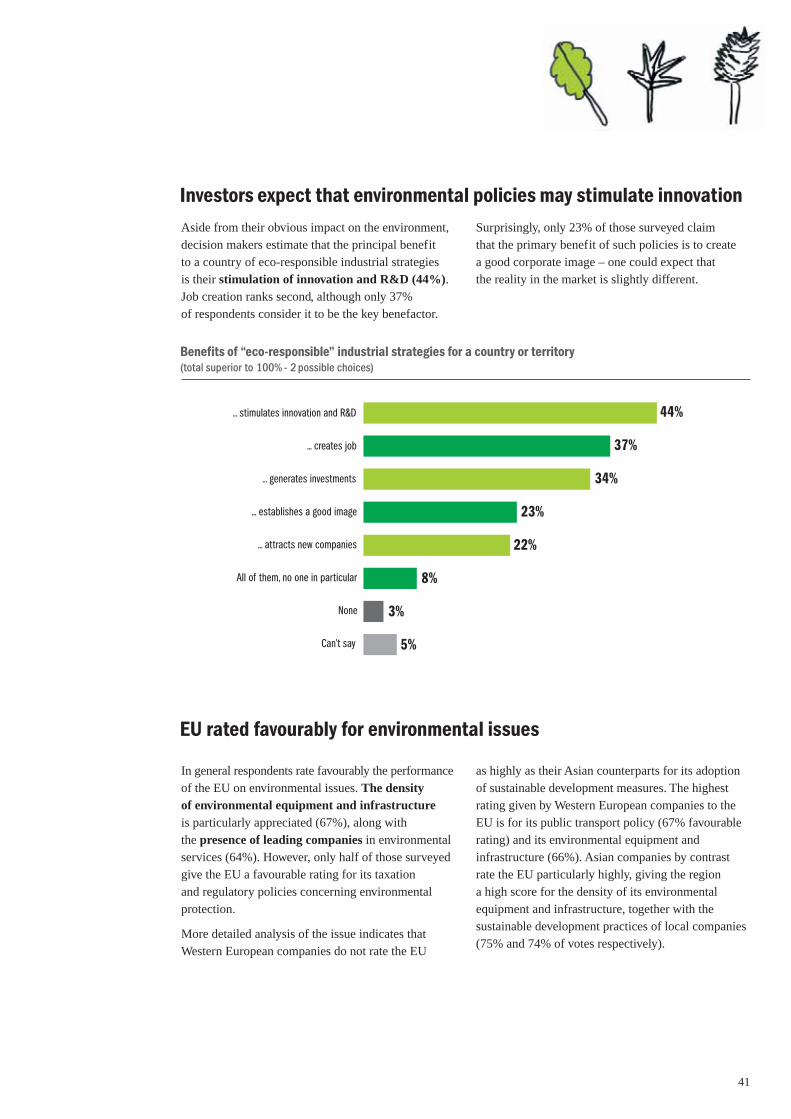
Benefits of “eco-responsible” industrial strategies for a country or territory(total superior to 100% - 2 possible choices)
In general respondents rate favourably the performance
of the EU on environmental issues. The densityof environmental equipment and infrastructureis particularly appreciated (67%), along with
the presence of leading companies in environmental
services (64%). However, only half of those surveyed
give the EU a favourable rating for its taxation
and regulatory policies concerning environmental
protection.
More detailed analysis of the issue indicates that
Western European companies do not rate the EU
as highly as their Asian counterparts for its adoption
of sustainable development measures. The highest
rating given by Western European companies to the
EU is for its public transport policy (67% favourable
rating) and its environmental equipment and
infrastructure (66%). Asian companies by contrast
rate the EU particularly highly, giving the region
a high score for the density of its environmental
equipment and infrastructure, together with the
sustainable development practices of local companies
(75% and 74% of votes respectively).
EU rated favourably for environmental issues
Aside from their obvious impact on the environment,
decision makers estimate that the principal benefit
to a country of eco-responsible industrial strategies
is their stimulation of innovation and R&D (44%).Job creation ranks second, although only 37%
of respondents consider it to be the key benefactor.
Surprisingly, only 23% of those surveyed claim
that the primary benefit of such policies is to create
a good corporate image – one could expect that
the reality in the market is slightly different.
Investors expect that environmental policies may stimulate innovation

42 2007 ER N S T & YO U N G EU RO P E A N AT T R AC T I V E N E S S SU RV E Y
Opinion of adequacy of European Union supportfor environmental excellence in companiesand R&D centres
Business leaders are divided in equal numbersbetween those who consider that the EuropeanUnion provides sufficient support for environ-mental excellence and those who would liketo see a greater level of action. It is possible that
respondents interpreted the question differently;
those who were satisfied, thinking more of European
environmental legislation, while the remainder
focused more on political support for environmental
innovation. Concerning environmental legislation,
there is clear agreement that the most advanced and
successful environmental policies have been those
initiated by Europe: the EU Emissions Trading
Scheme for greenhouse gases, widespread
manufacturers’ responsibility for product disposal at
the end of its useful life, the REACH regulation on
dangerous chemicals. Businesses operating in Europe
are aware of the constraints on competition that
sometimes arise as a result of the enforcement
of these regulations.
However, many business operators would like to see
the EU provide more support for environmental
excellence. The economic measures proposed
by the EU to support innovation and R&D remain
insufficient. Europe currently possesses no
harmonised environmental fiscal policy. The only
tool dedicated to the development of a European
environmental policy is the LIFE programme, but
its financial resources appear derisory given the scale
of the project (€317m for 2005-2006). To combat
the effect of greenhouse gases for example, apart
from emission quotas, industry will probably need
to be given aid to structure and coordinate research
and development programmes permitting the rapid
development of technological solutions such as
capturing and sequestering carbon for use by power
stations.
It is likely that respondents envisage this type
of balanced environmental policy, involving clear
direction and encompassing at the same time
environmental constraints and support for innovation.
Business leaders are divided as to the level and quality of supportprovided by the European Union to R&D

43

Towards a renewable Europe
Challenges

46 2007 ER N S T & YO U N G EU RO P E A N AT T R AC T I V E N E S S SU RV E Y
■ Collaborative strategies are increasingly valued.
What will be the impact of the more flexible
structures, multi-cultural approaches, collaborative
partnerships and new forms of out and co-sourcing
of production and service delivery?
■ The race for talent is crucial. Will the race
for skills, talent and creativity, in locations where
competition for specific competencies is fiercer by
the week, weaken some countries or metropolitan
areas? Will companies develop protectionist
strategies and, in turn, slow down a region’s ability
to grow through new inward investment?
■ The seven new global powers by 2050 willcomprise the so-called BRIC economies(Brazil, Russia, India and China), together withIndonesia, Mexico and Turkey. They will overtake
the economies of the G7 countries in terms of GDP,
but will they be able to develop their infrastructure
at a sufficient rate to keep up with the pace of
global investment? Will they be able to profit fully
from the benefits of value-added inward investment
and will they undertake changes in transparency,
fairness and openness?
■ Risk management is now at the heart of
a company’s location decisions, prompted by
the prevailing climate of uncertainty. The current
priority is for transparency, stability and clarity
in the countries chosen for investment projects.
This is on a political and labour-related basis,
as well as at an economic level.
■ Large cash incentives have decreased considerably
in importance... and availability in most developed
countries. Have they been replaced by support for
intangibles, such as training, technology transfers
and clustering?
■ Effective integration of capital markets remains
hampered by legal, political and regulatory barriers,
as well as a common financial reporting language.
What measures will emerging markets need to
undertake to promote stability for companies and
investors? Will the regulatory reform in Europe,
the US, and elsewhere charting a new landscape
for corporate governance and global accounting
standards really help create the right climate
for investment?
■ Companies involved in the knowledge economylook for the potential of encouraging localentrepreneurship. Will they take into
consideration the ability of a territory to provide
the infrastructure, environment and funding
to support this ambition?
■ And finally, how will companies perceivesustainable and eco-responsible policies?Our 2007 survey takes a closer look at the
sensitivity of decision-makers to these policies
and their evaluation of Europe’s performance.
Renewable location strategies4.1
Economic development, corporate strategies, financial markets and industry trends affect howcompanies perceive the attractiveness and competitive advantages of an inward investmentdestination. Here are some of the key issues raised throughout our interviews and analysis:

47
Renewing flexibilityEurope’s future attractiveness is undeniablylinked to the flexibility of its business environmentand capacity to challenge its competitors.
Investors expect reforms – first and foremost –
on labour flexibility and the simplification of
the legal environment (47% and 44% respectively).
Conversely, international executives do not express
any specific expectation regarding financial support
from public authorities, except for research and
innovation which is cited third (35% of votes).
This is not a one-way demand where businesses
would demand more rights and fewer regulations,
but a recognition that businesses will be partners
with governments and communities in developing
solutions for Europe’s future. The reform will take
place in a collaborative manner whereby businesses
will offer more – productivity, qualified jobs,
support for enlargement efforts, and performance in
innovation and research – while benefiting from more
flexibility to adapt to the new face of globalisation.
Renewing connectivityInvestors perceive the European market asa unique opportunity, but demand, above all,an improvement in the region’s levelof homogeneity and accessibility.
This is reflected in the importance that investors
place on the quality of infrastructure in their location
strategy (54% view transportation infrastructure
as fundamental in their location decisions, while
the rating for telecommunications is 48%).
There is therefore a need to focus on creating
efficient communication networks throughout
Europe in order to maximize the benefit from
the convergence between East and West.
Such infrastructure improvements could include
high-speed networks connecting all key European
cities, trans-European motorways, inter-modal
logistics platforms and increased investment in data
transportation. At the same time, Europe needs
to accelerate the interconnection of its scientists,
entrepreneurs and public decision-makers.
Renewing Europe’s attractiveness4.2
The rising powers of Asia and the economic transitions within Europe define new frontiers andraise new challenges. Throughout the Ernst & Young Attractiveness Survey, decision-makersraise five issues concerning Europe’s attractiveness and its future orientation: flexibility,connectivity, talents and image.
48 2007 ER N S T & YO U N G EU RO P E A N AT T R AC T I V E N E S S SU RV E Y
Competition will help Europe meet the challenges ofthe knowledge economy, because competition stimulatesinnovation. Within highly regulated markets, such as energy,fixed telecom or transportation, companies are slowerin applying new technologies, developing new productsand getting them to the market, than within highlycompetitive sectors such as the automotive, IT, mobiletelecommunications and machinery markets. In addition,Europe has to generate a state of the economy, whichclearly shows investors that they are missing somethingby not investing in Europe. What companies fear the most isto miss out on big opportunities in hot economies.For instance, in some of our leading sectors – medicalsystems, environmental services or transportation – we cancreate the conditions to concentrate investor’s attentionon the unique market potential of Europe: encouragingnew technologies in the “infrastructure” segment andthe realisation of trans-European networks; improvingthe orchestration and the use of public and private capital;introducing more competition which stimulates innovationin highly regulated industries.
Pr. Edward KrubasikPresident of Orgalimeand Former Executive Vice-Presidentof Siemens, Germany
When competitiondrives innovation
Renewing talentsIn today’s and tomorrow’s global markets, future
opportunities will be increasingly based on skills and
education. In order to fulfil its ambition to become
the most competitive knowledge economy in
the world, the European Union must maintain
its competitive educational advantages. It must
convince investors of its capacity to innovate and
ensure its durability through an efficient and adequate
training system. Europe as a whole may capitalise on
its leadership in R&D (43% of favourable opinions)
and labour force quality (50% of favourable opinions)
and extend it throughout the rest of the territory.
In the words of business leaders, Europe needs
to provide its citizens with the core skill sets of
the knowledge society and the idea that everyone
can use technology to make a difference in their work,
at home and in their communities.
Renewing imageEurope’s strength lies largely in its diversity; its
considerable variations guaranteeing its attractiveness
to business decision-makers, despite the considerable
attention paid to emerging zones. Europe must work
at maintaining this uniqueness which enables it
to remain attractive to investors in search of a wide
range of opportunities. In particular, its vast single
market offers numerous advantages and opportunities
to rival the world’s major monoliths.
Cultivating its image will enable Europe
to demonstrate at a global level the dynamism
resulting from its diversity through the development
of numerous bilateral and multi-national projects that
draw on the complementarity of each of its members.
In addition, by encouraging initiatives promoting
the unique virtues of individual member countries,
the European Union will further promote its own
attractiveness.

49
Our 2007 survey takes a closer look at the sensitivity of decision-makers to sustainable development
and their evaluation of Europe’s performance. As the debate grows over the social responsibility of business
and institutions, and the regulatory constraints imposed on industry, we have to explore the real and positive
inputs of these major issues.
Clean tech best practices may help Europe’s differentiation
Respondents overwhelmingly state that
Europe may find a decisive competitive
advantage in implementing new
environmental rules : 56% of businessleaders surveyed assess that tighterregulations may provide an opportunityfor Europe to differentiate itself from
other investment destinations and even
help the development of its activities.
Opinion on impact of adopting new environmental regulationson European countries’ attractiveness
The issue is thus raised of how a European model for environmental excellence or eco-attractiveness mayhelp to ensure the continuing presence and development of investment in Europe, based on its currentattractiveness status.
The European Attractiveness survey poses key questions, in terms of both supply and demand. What is the real
potential for green technologies and services? What cities, regions and countries may expect to benefit
from clean-tech investments and employment? Should business and research organisations create strategic
partnerships and joint ventures to increase their critical size and visibility? How can best practices be shared?
Does Europe present a credible and specific environmental strategy based on a common commitment between
businesses, institutions and citizens? Is there a European environmental model – as there is a social or economic
model? In summary, how can Europe create its eco-attractiveness?
“Eco-attractiveness”: a proposition for Europe4.3

2007 ER N S T & YO U N G EU RO P E A N AT T R AC T I V E N E S S SU RV E Y
Notes
..................................................................................................................................................................................................................................................................................................................
..................................................................................................................................................................................................................................................................................................................
..................................................................................................................................................................................................................................................................................................................
..................................................................................................................................................................................................................................................................................................................
..................................................................................................................................................................................................................................................................................................................
..................................................................................................................................................................................................................................................................................................................
..................................................................................................................................................................................................................................................................................................................
..................................................................................................................................................................................................................................................................................................................
..................................................................................................................................................................................................................................................................................................................
..................................................................................................................................................................................................................................................................................................................
..................................................................................................................................................................................................................................................................................................................
..................................................................................................................................................................................................................................................................................................................
..................................................................................................................................................................................................................................................................................................................
..................................................................................................................................................................................................................................................................................................................
..................................................................................................................................................................................................................................................................................................................
..................................................................................................................................................................................................................................................................................................................
..................................................................................................................................................................................................................................................................................................................
..................................................................................................................................................................................................................................................................................................................
..................................................................................................................................................................................................................................................................................................................
..................................................................................................................................................................................................................................................................................................................
..................................................................................................................................................................................................................................................................................................................
..................................................................................................................................................................................................................................................................................................................
..................................................................................................................................................................................................................................................................................................................
..................................................................................................................................................................................................................................................................................................................
..................................................................................................................................................................................................................................................................................................................

..................................................................................................................................................................................................................................................................................................................
..................................................................................................................................................................................................................................................................................................................
..................................................................................................................................................................................................................................................................................................................
..................................................................................................................................................................................................................................................................................................................
..................................................................................................................................................................................................................................................................................................................
..................................................................................................................................................................................................................................................................................................................
..................................................................................................................................................................................................................................................................................................................
..................................................................................................................................................................................................................................................................................................................
..................................................................................................................................................................................................................................................................................................................
..................................................................................................................................................................................................................................................................................................................
..................................................................................................................................................................................................................................................................................................................
..................................................................................................................................................................................................................................................................................................................
..................................................................................................................................................................................................................................................................................................................
..................................................................................................................................................................................................................................................................................................................
..................................................................................................................................................................................................................................................................................................................
..................................................................................................................................................................................................................................................................................................................
..................................................................................................................................................................................................................................................................................................................
..................................................................................................................................................................................................................................................................................................................
..................................................................................................................................................................................................................................................................................................................
..................................................................................................................................................................................................................................................................................................................
..................................................................................................................................................................................................................................................................................................................
..................................................................................................................................................................................................................................................................................................................
..................................................................................................................................................................................................................................................................................................................
..................................................................................................................................................................................................................................................................................................................
..................................................................................................................................................................................................................................................................................................................


About Ernst & YoungErnst & Young, a global leader in professional services, is committed
to restoring the public's trust in professional services firms and in
the quality of financial reporting. Its 114,000 people in 140 countries
pursue the highest levels of integrity, quality, and professionalism
in providing a range of sophisticated services centred on its core
competencies of auditing, accounting, tax and transactions.
Further information about Ernst & Young and its approach to a variety
of business issues can be found at www.ey.com/perspectives.
Ernst & Young refers to the global organisation of member firms
of Ernst & Young Global Limited, each of which is a separate legal
entity. Ernst & Young Global Limited does not provide services
to clients.

www.ey.comER N S T & YO U N G
Ernst & Young wishes to thank all the companies that took part in this 2007 survey.
This survey was carried out by Ernst & Young, under the direction of Marc Lhermittewith the participation of Agnès Caradec, Claire de Loynes, Eric Duvaud, Sue Litvack,Rudolphe Pennec, Vincent Raufast, Fabrice Reynaud, Valentine Vignalou, the studio graphic team,and with the collaboration of Stéphane Rozès, Christelle Fumey and the teams of the CSA.
We also wish to express special thanks to all the children who participated to the graphicand visual identity of this survey by providing drawings: Agathe, Alexis, Amandine, Antoine, Arthur,Claire, Clément, Fanny, François, Laura, Marin, Maxime C., Maxime G., Pia, Thomas, Tom.
Contacts
Marc Lhermitte Partner, Ernst & YoungInternational Location Advisory ServicesTél. : + 33 1 46 93 72 76E-mail : [email protected]
Kevin Russell Press RelationsTél. : + 44 (0)20 7980 0502E-mail : [email protected]
Mélissa Levine Press RelationsTél. : + 33 1 46 93 81 09E-mail : [email protected]
© 2007 Ernst & Young.
All right reserved.
0705SG775 - June 2007 - Studio Ernst & Young
Printed on ecological non-chloride paper