
Waltham Real Estate Market Data - Dwell360
8
Single Family, Condominium, and Multifamily Homes Year End 2014 Waltham, Massachusetts Market Report
-
Upload
dwell360-real-estate -
Category
Documents
-
view
215 -
download
1
description
Dwell360 has published this report on the residential real estate market statistics for 2014, 2013, 2012, 2011, 2010, 2009, 2008, 2007, 2006, and 2005 for Waltham, Massachusetts. The market statistics include residential sales averages for single family, condominium, and multifamily homes. Review the information presented by the Massachusetts boutique real estate brokerage Dwell360 based in Newton.
Transcript of Waltham Real Estate Market Data - Dwell360
Single Family, Condominium, and Multifamily Homes
Year End 2014
Waltham, Massachusetts
Market Repor t
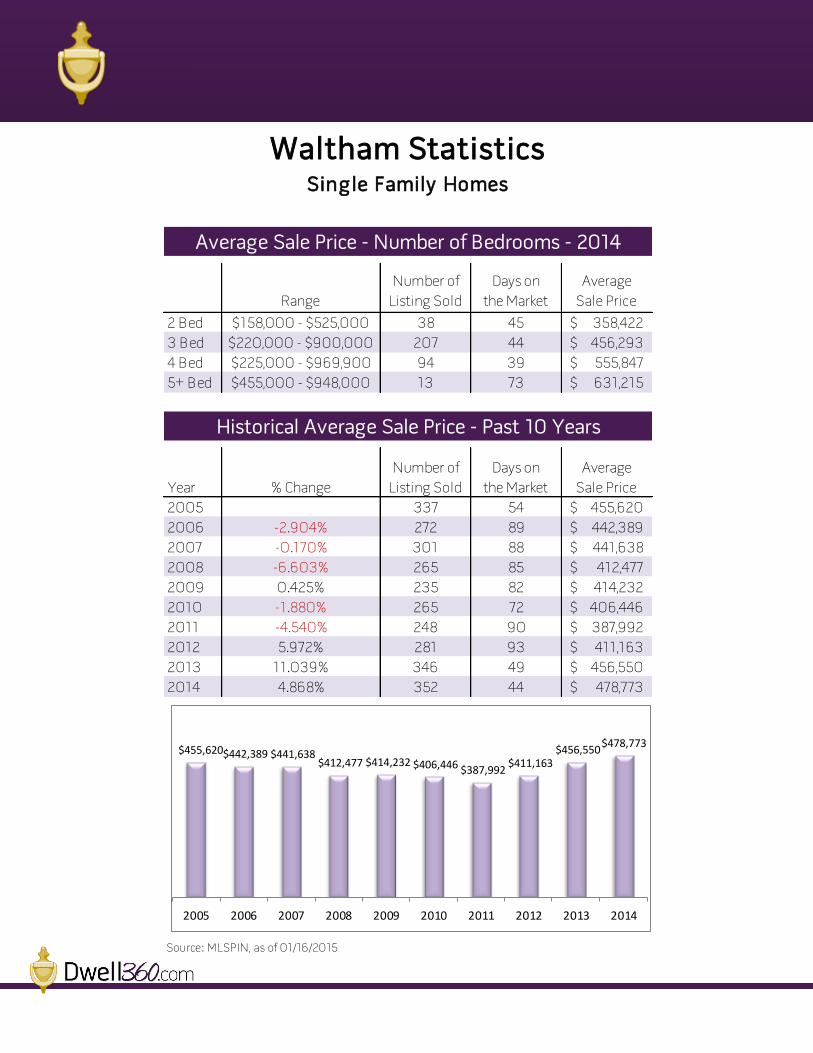
Range
Number of
Listing Sold
Days on
the Market
Average
Sale Price
2 Bed $158,000 - $525,000 38 45 358,422$
3 Bed $220,000 - $900,000 207 44 456,293$
4 Bed $225,000 - $969,900 94 39 555,847$
5+ Bed $455,000 - $948,000 13 73 631,215$
Year % Change
Number of
Listing Sold
Days on
the Market
Average
Sale Price
2005 337 54 455,620$
2006 -2.904% 272 89 442,389$
2007 -0.170% 301 88 441,638$
2008 -6.603% 265 85 412,477$
2009 0.425% 235 82 414,232$
2010 -1.880% 265 72 406,446$
2011 -4.540% 248 90 387,992$
2012 5.972% 281 93 411,163$
2013 11.039% 346 49 456,550$
2014 4.868% 352 44 478,773$
Source: MLSPIN, as of 01/16/2015
Waltham Statistics
Average Sale Price - Number of Bedrooms - 2014
Historical Average Sale Price - Past 10 Years
Single Family Homes
$455,620 $442,389 $441,638 $412,477 $414,232 $406,446 $387,992
$411,163 $456,550
$478,773
2005 2006 2007 2008 2009 2010 2011 2012 2013 2014

Market stat ist ics
[email protected] | 617-299-1854
Single Family, 1/1/2014 - 12/31/2014
# of Avg. Days Average Average SP:LP Average SP:OP
Listings
on
Market Sale Price List Price Ratio Orig Price Ratio
$150,000 - $199,999 1 18 $158,000 $159,900 99 $159,900 99
$200,000 - $249,999 6 75 $236,567 $257,917 92 $269,583 89
$250,000 - $299,999 6 45 $269,833 $276,983 98 $291,133 94
$300,000 - $349,999 37 51 $328,952 $336,095 98 $343,289 96
$350,000 - $399,999 58 35 $375,207 $379,568 99 $384,589 98
$400,000 - $449,999 56 49 $427,683 $431,924 99 $439,890 97
$450,000 - $499,999 49 40 $470,441 $470,451 100 $476,626 99
$500,000 - $599,999 90 47 $542,675 $545,330 100 $555,987 98
$600,000 - $699,999 25 34 $635,436 $634,883 100 $641,088 99
$700,000 - $799,999 11 59 $743,564 $763,555 97 $771,282 97
$800,000 - $899,999 8 30 $859,113 $864,375 99 $870,625 99
$900,000 - $999,999 5 25 $923,580 $958,980 97 $973,980 95
Total Properties 352 44 $478,773 $483,297 99 $491,209 98
Source: MLSPIN, as of 01/16/2015
Price Range
Total Sold - Waltham, MA

Range
Number of
Listing Sold
Days on
the Market
Average
Sale Price
1 Bed $110,000 - $329,000 37 46 225,216$
2 Bed $215,000 - $610,000 163 52 340,992$
3 Bed $250,000 - $650,000 66 46 434,546$
4+ Bed $295,100 - $637,900 7 82 458,843$
Year % Change
Number of
Listing Sold
Days on
the Market
Average
Sale Price
2005 316 47 350,961$
2006 -0.286% 280 87 349,959$
2007 -0.030% 283 92 349,854$
2008 -7.207% 211 100 324,639$
2009 -3.977% 265 91 311,728$
2010 2.115% 207 87 318,322$
2011 -2.307% 172 104 310,977$
2012 4.712% 244 86 325,631$
2013 5.202% 259 46 342,570$
2014 2.443% 273 50 350,940$
Source: MLSPIN, as of 01/16/2015
Waltham StatisticsCondominiums
Average Sale Price - Number of Bedrooms - 2014
Historical Average Sale Price - Past 10 Years
$350,961 $349,959 $349,854
$324,639
$311,728
$318,322
$310,977
$325,631
$342,570
$350,940
2005 2006 2007 2008 2009 2010 2011 2012 2013 2014

Market stat ist ics
[email protected] | 617-299-1854
Condominiums, 1/1/2014 - 12/31/2014
# of Avg. Days Average Average SP:LP Average SP:OP
Listings
on
Market Sale Price List Price Ratio Orig Price Ratio
$100,000 - $149,999 5 46 $122,780 $132,920 92 $132,920 92
$150,000 - $199,999 7 34 $173,571 $174,800 99 $177,643 98
$200,000 - $249,999 30 61 $231,777 $237,700 98 $243,027 96
$250,000 - $299,999 54 52 $274,750 $277,962 99 $280,425 98
$300,000 - $349,999 46 48 $322,752 $324,134 100 $329,024 98
$350,000 - $399,999 51 53 $373,975 $372,943 100 $380,220 99
$400,000 - $449,999 32 49 $423,391 $424,915 100 $426,759 99
$450,000 - $499,999 26 41 $466,048 $464,715 100 $469,335 100
$500,000 - $599,999 14 51 $545,229 $546,663 100 $551,521 99
$600,000 - $699,999 8 41 $621,213 $615,950 101 $615,950 101
Total Properties 273 50 $350,940 $352,455 99 $356,689 98
Source: MLSPIN, as of 01/16/2015
Total Sold - Waltham, MA
Price Range

Range
Number of
Listing Sold
Days on
the Market
Average
Sale Price
2 Units $345,000 - $657,500 31 45 503,794$
3 Units $490,000 - $615,000 4 65 565,000$
4 Units $400,000 - $837,500 7 43 689,571$
5 Units $525,000 1 70 525,000$
Year % Change
Number of
Listing Sold
Days on
the Market
Average
Sale Price
2005 71 59 563,294$
2006 2.406% 71 55 576,847$
2007 -5.872% 33 63 542,974$
2008 -16.021% 41 111 455,984$
2009 8.001% 33 100 492,467$
2010 -12.745% 41 90 429,702$
2011 2.817% 39 83 441,808$
2012 0.478% 50 101 443,921$
2013 20.195% 38 37 533,570$
2014 2.643% 44 46 547,673$
Source: MLSPIN, as of 01/16/2015
Waltham StatisticsMultifamily Homes
Average Sale Price - Number of Units in Building - 2014
Historical Average Sale Price - Past 10 Years
$563,294 $576,847 $542,974
$455,984 $492,467
$429,702 $441,808 $443,921
$533,570 $547,673
2005 2006 2007 2008 2009 2010 2011 2012 2013 2014

Market stat ist ics
[email protected] | 617-299-1854
Multifamily Homes, 1/1/2014 - 12/31/2014
# of Avg. Days Average Average SP:LP Average SP:OP
Listings
on
Market Sale Price List Price Ratio Orig Price Ratio
$300,000 - $349,999 1 66 $345,000 $395,000 87 $395,000 87
$350,000 - $399,999 2 13 $352,500 $359,950 98 $359,950 98
$400,000 - $449,999 6 25 $417,083 $468,950 91 $485,467 88
$450,000 - $499,999 5 110 $470,005 $472,760 100 $502,760 94
$500,000 - $599,999 20 38 $550,380 $548,625 101 $556,380 99
$600,000 - $699,999 5 70 $640,000 $673,340 95 $700,260 92
$700,000 - $799,999 2 9 $734,000 $749,500 98 $749,500 98
$800,000 - $899,999 3 35 $839,833 $835,967 100 $837,633 100
Total Properties 44 46 $547,673 $559,966 98 $572,325 96
Source: MLSPIN, as of 01/16/2015
Total Sold - Waltham, MA
Price Range

www.Dwell360.com [email protected]
617-299-1854
Dwell360 46 Austin Street Suite 302 Newton, MA 02460
Trust. Knowledge. Experience.
You want an agent who cares – We are experienced real estate agents who use professional marketing tools. We have neighborhood insight and are current with local market conditions. We know the inventory, have opinions about each property, are confident negotiators, and care about our clients – because buying and selling a home is a big deal!