
Walter J. Rogan, MD Aimin Chen, MD, PhD NIH Public … · Wechsler Intelligence Scale for...
16
Lead exposure, IQ, and behavior in urban 5-7 year olds: Does lead affect behavior only by lowering IQ? Aimin Chen, MD, PhD a,e , Bo Cai, PhD b , Kim N. Dietrich, PhD c , Jerilynn Radcliffe, PhD d , and Walter J. Rogan, MD a aEpidemiology Branch, National Institute of Environmental Health Sciences, National Institutes of Health, Department of Health and Human Services, Research Triangle Park, North Carolina bBiostatistics Branch, National Institute of Environmental Health Sciences, National Institutes of Health, Department of Health and Human Services, Research Triangle Park, North Carolina cDepartment of Environmental Health, University of Cincinnati, Cincinnati, Ohio dDepartment of Psychology, Children's Hospital of Philadelphia, and University of Pennsylvania School of Medicine, Philadelphia, Pennsylvania Abstract Background—Lead exposure in childhood lowers IQ scores, but its effect on children's behavior is less clear. Since IQ per se affects behavior, measuring lead's direct effect requires measuring and then adjusting for IQ. In addition, either peak blood lead concentration, usually at age 2 years, or the lower blood lead measured at school age may be the most relevant. Few studies have all this information. Objective—To differentiate the direct effect of lead on behavior and the indirect effect through IQ, and to examine the strength of the association for peak and concurrent blood lead concentration. Methods—Data come from a clinical trial of the chelating drug succimer to prevent cognitive impairment in 780 urban 12-33 month olds with blood lead concentration of 20-44 μg/dL. The children were followed from ages 2 to 7 years. The trial data were analyzed as a prospective observational study. Results—Blood lead concentration at age 2 years was not associated with Conners' Parent Rating Scale-Revised (CPRS-R) scores at age 5 years or Behavioral Assessment Systems for Children (BASC) scores at age 7 years. Blood lead at age 7 years had direct effects on the BASC Behavioral Symptoms Index, Externalizing, and School Problems at age 7. Conclusions—Concurrent blood lead concentration was associated with Externalizing and School Problems scales at age 7 years, and the effect was not entirely mediated through lead's effect on IQ. Keywords lead; cognition; behavior; child; longitudinal studies Corresponding author: Walter J. Rogan MD, Epidemiology Branch, NIEHS, MD A3-05, P.O. Box 12233, Research Triangle Park, NC 27709, USA Tel: (919) 541-4578, Fax: (919) 541-2511, E-mail: [email protected]. e Currently Department of Preventive Medicine, Creighton University School of Medicine, Omaha, Nebraska Some of this work was presented at Pediatric Academic Societies' Annual meeting in San Francisco, CA, April 29-May 2, 2006 and at Second North American Congress of Epidemiology in Seattle, WA, June 21-24, 2006. NIH Public Access Author Manuscript Pediatrics. Author manuscript; available in PMC 2007 November 16. Published in final edited form as: Pediatrics. 2007 March ; 119(3): e650–e658. NIH-PA Author Manuscript NIH-PA Author Manuscript NIH-PA Author Manuscript
Transcript of Walter J. Rogan, MD Aimin Chen, MD, PhD NIH Public … · Wechsler Intelligence Scale for...
Lead exposure, IQ, and behavior in urban 5-7 year olds: Does leadaffect behavior only by lowering IQ?
Aimin Chen, MD, PhDa,e, Bo Cai, PhDb, Kim N. Dietrich, PhDc, Jerilynn Radcliffe, PhDd, andWalter J. Rogan, MDa
aEpidemiology Branch, National Institute of Environmental Health Sciences, National Institutes of Health,Department of Health and Human Services, Research Triangle Park, North Carolina
bBiostatistics Branch, National Institute of Environmental Health Sciences, National Institutes of Health,Department of Health and Human Services, Research Triangle Park, North Carolina
cDepartment of Environmental Health, University of Cincinnati, Cincinnati, Ohio
dDepartment of Psychology, Children's Hospital of Philadelphia, and University of Pennsylvania School ofMedicine, Philadelphia, Pennsylvania
AbstractBackground—Lead exposure in childhood lowers IQ scores, but its effect on children's behavioris less clear. Since IQ per se affects behavior, measuring lead's direct effect requires measuring andthen adjusting for IQ. In addition, either peak blood lead concentration, usually at age 2 years, or thelower blood lead measured at school age may be the most relevant. Few studies have all thisinformation.
Objective—To differentiate the direct effect of lead on behavior and the indirect effect through IQ,and to examine the strength of the association for peak and concurrent blood lead concentration.
Methods—Data come from a clinical trial of the chelating drug succimer to prevent cognitiveimpairment in 780 urban 12-33 month olds with blood lead concentration of 20-44 μg/dL. Thechildren were followed from ages 2 to 7 years. The trial data were analyzed as a prospectiveobservational study.
Results—Blood lead concentration at age 2 years was not associated with Conners' Parent RatingScale-Revised (CPRS-R) scores at age 5 years or Behavioral Assessment Systems for Children(BASC) scores at age 7 years. Blood lead at age 7 years had direct effects on the BASC BehavioralSymptoms Index, Externalizing, and School Problems at age 7.
Conclusions—Concurrent blood lead concentration was associated with Externalizing and SchoolProblems scales at age 7 years, and the effect was not entirely mediated through lead's effect on IQ.
Keywordslead; cognition; behavior; child; longitudinal studies
Corresponding author: Walter J. Rogan MD, Epidemiology Branch, NIEHS, MD A3-05, P.O. Box 12233, Research Triangle Park, NC27709, USA Tel: (919) 541-4578, Fax: (919) 541-2511, E-mail: [email protected] Department of Preventive Medicine, Creighton University School of Medicine, Omaha, NebraskaSome of this work was presented at Pediatric Academic Societies' Annual meeting in San Francisco, CA, April 29-May 2, 2006 and atSecond North American Congress of Epidemiology in Seattle, WA, June 21-24, 2006.
NIH Public AccessAuthor ManuscriptPediatrics. Author manuscript; available in PMC 2007 November 16.
Published in final edited form as:Pediatrics. 2007 March ; 119(3): e650–e658.
NIH
-PA Author Manuscript
NIH
-PA Author Manuscript
NIH
-PA Author Manuscript
INTRODUCTIONEven small amounts of lead exposure in childhood appear to lower scores on IntelligenceQuotient (IQ) tests. Multiple cohort and cross sectional studies give similar estimates of thesize of the effect.1-5 Although the Centers for Disease Control and Prevention had set a “levelof concern” at 10 μg/dL blood lead concentration, a threshold below which lead does not affectIQ has not been determined, and recent studies have extended the relation to below 10 μg/dL.6-8 Whether lead exposure produces other psychological or behavioral damage in children isless well studied. These other dimensions are important because they may affect learning andschool performance even in children with higher IQ. Older reports suggested associationsbetween lead exposure and poorer classroom performance,9 impaired educational attainment,10, 11 inattention and hyperactivity,12, 13 juvenile delinquency,14 motor development,15-17 or behavioral problems.18-25 Lead was associated with externalizing (i.e., aggression)and internalizing (i.e., worry) problems in several studies using behavioral measures such asthe Child Behavior Checklist.19, 20, 25
Studying behavior in the presence of an effect of lead on IQ presents both practical andinferential problems. First, understanding how lead exposure might affect the child'spsychological and emotional function at school and at home is approached both by questioningthe parent and teacher about the child's behavior and by testing specific relevant functionaldomains of mood and behavior. However, the tests may not isolate the specific domain ofinterest from IQ, and in practice are often significantly correlated with IQ. Moreover, IQ maybe on the pathway leading to behavioral problems.26 So, without appropriate control for IQ,the nature of the lead effect on behavior cannot be distinguished.25, 27 Second, exposure tolead may continue from the fetal period through childhood. Even though children's leadconcentrations correlate over time, the trajectories vary enough that a single measurement ofblood concentration is insufficient to characterize an individual child's exposure over time. Inparticular, we need to be able to distinguish whether peak blood lead, which occurs at aboutage 2 years in the US, or concurrent blood lead, which is usually lower by school age when IQand behavioral testing is done, accounts for any effect on behavior.
In the Treatment of Lead-exposed Children (TLC) study, we measured blood leadconcentration periodically from age 2 to 7 years and have IQ, neuropsychological, andbehavioral test scores at ages 5 and 7. Thus, we can analyze the association between lead andbehavior while taking IQ into account, and examine the relative strength of association betweenblood lead concentrations at different ages, IQ, and behavioral test scores.
SUBJECTS AND METHODSThe TLC study was a multi-center, randomized, placebo-controlled clinical trial of 780 children12 to 33 months old (mean 2 years, standard deviation 0.5 year) who had blood leadconcentrations of 20-44 μg/dL, to investigate effects of succimer, an oral chelating agent, oncognitive, behavioral and physical development.28 The study was approved by the institutionalreview boards at the clinical centers, the Harvard School of Public Health, the Centers forDisease Control and Prevention, and the National Institute of Environmental Health Sciences.The parent(s) of all children provided written informed consent. Although up to three coursesof treatment with succimer was effective in lowering blood lead concentrations for about 9-10months, it did not improve scores on tests of cognition, behavior, or neuropsychologicalfunction in children at 36 months29 or 60 months of follow-up30 as compared with placebo.Since the succimer treatment did not affect lead concentrations at baseline and ages 5 and 7,nor did it affect IQ and behavior scores at ages 5 and 7, the succimer and placebo study groupscan be combined to study prospectively the effect of blood lead concentrations on the scoresof neuropsychological and behavioral tests.
Chen et al. Page 2
Pediatrics. Author manuscript; available in PMC 2007 November 16.
NIH
-PA Author Manuscript
NIH
-PA Author Manuscript
NIH
-PA Author Manuscript
Blood lead concentrationsVenous blood was collected with lead-free containers twice before randomization and on day7, 28, and 42 after the beginning of each course of treatment. After treatment ended, blood leadconcentrations were measured every 3 to 4 months. We use the second blood sample beforerandomization (n=780) as baseline (at about age 2), the blood sample at 36 months follow-up(n=731) as the age 5 sample, and the last blood sample at 60 months follow-up (n=623) as theage 7 sample. The blood lead concentrations were measured at the Nutritional BiochemistryBranch of CDC by atomic absorption spectrometry based on the methods described by Milleret al.31 For blood lead concentrations at 7 years, one child who had a very high blood leadconcentration of 51 μg/dL was excluded, leaving 622 for use in this analysis.
Cognitive testsAt about age 5 years, the child's IQ was determined with the Wechsler Preschool and PrimaryScales of Intelligence-Revised (WPPSI-R);32 at age 7 years, child IQ was tested with theWechsler Intelligence Scale for Children-III (WISC-III).33 At one of the visits betweenenrollment and the 36 months follow-up, the caregiver's IQ (the mother for 88% of children,the father for 4%, and another caregiver for 8%) was measured with the two subtest version ofthe Wechsler Adult Intelligence Scale-Revised.34, 35
Behavioral test batteriesAt about 5 years of age, the Conners' Parent Rating Scale-Revised (CPRS-R)36 wasadministered. The CPRS-R is a 27-item scale and yields an Oppositional Index, HyperactivityIndex, Attention Deficit Hyperactivity Disorder (ADHD) Index; the average of these threeindices yields what we called the Behavioral Index.
At age 7 years, the children were tested with the Behavior Assessment System for Childrenteacher rating scale (BASC-TRS) and BASC parent rating scale (BASC-PRS).37 The BASCfor parents yields 4 composite scales: Adaptive Skills, Behavioral Symptoms Index,Externalizing Problems, and Internalizing Problems. The BASC for teachers yields those 4scales plus a School Problems scale. Both CPRS-R and BASC yield T scores that have a meanof 50 and a standard deviation of 10 in the general population. Higher CPRS-R and BASCscores generally indicated worse behavioral problems except the BASC Adaptive Skills scalewhere higher scores were optimal.
Statistical analysisWe examined the lead and behavioral associations while controlling for the lead effect on IQ.First we did a correlation analysis of behavior scores and concurrent IQ (i.e., behavior at age5 and IQ at age 5). Then we examined the lead and behavior associations using scatter plot andnon-parametric spline regressions with S-PLUS software (Insightful Corp., Seattle, WA).Because spline regressions showed an approximately linear relation, we used linear models forexamining the lead effect. Blood lead concentrations in TLC children were part of the eligibilitycriteria, and thus have a restricted spread. This allows us to use the original (i.e., untransformed)values of blood lead concentrations, facilitating the interpretation of the models. Based on theliterature and our previous work with the data,19, 24, 25, 38, 39 a priori covariates includeclinic center (Baltimore, Newark, Philadelphia, and Cincinnati), race (black, white and others),gender (male, female), language (English or Spanish), parent's education (under 12 years, 12years, over 12 years), parent's employment (neither working, either working), single parent(yes, no), age at blood lead concentration test, and caregiver's IQ. Treatment per se was notassociated with behavior scores, and additional adjustment for treatment group did notmarkedly change the results and thus was not included in subsequent analyses.
Chen et al. Page 3
Pediatrics. Author manuscript; available in PMC 2007 November 16.
NIH
-PA Author Manuscript
NIH
-PA Author Manuscript
NIH
-PA Author Manuscript
We simultaneously estimated the strengths of lead effects on behavior, both the direct andindirect (through IQ), by using path analysis, a special case of structural equation modeling,which tests the fit of the correlation matrix against two or more causal models. In path analysis,a regression is done for each variable in the model (in our case, the behavioral test scores) asdependent on others that may be causal. When the model has two or more causal variables (inour case, lead and IQ, plus covariates), path coefficients are partial regression coefficients thatmeasure the extent of effect of one variable on another in the path model controlling for otherprior variables. Path coefficients can be used to decompose associations into direct and indirecteffects. A more detailed description of this procedure can be found in several references.40,41 The path analysis was tested via the LISREL 8 program,42 using a maximum likelihoodstructural equation model, which provides unstandardized regression coefficients and theirstandard errors for both direct and indirect effects.43 The total effect of lead on behavior wouldbe the sum of direct and indirect effects.
Blood lead concentrations in the same child are correlated, and multiple measures in one modelare collinear and the coefficients are difficult to interpret. We thus constructed separate modelsfor the different blood lead concentrations, either peak (at ∼ age 2 years) or concurrent withbehavioral and IQ testing (5 or 7 years). All the tests were two-sided. Due to the difference inthe number of children tested for each follow-up measurement, the sample sizes in the variousregression models differ slightly.
For BASC scores at 7 years, we also did logistic regression on the percentage of children withBASC problem scores ≥ 60, including at risk for (score 60-69) and with clinical behavioralproblems (score over 70), by concurrent blood lead concentration. Mplus software was usedto calculate the direct and indirect effect of lead in the logistic models.44
RESULTSFour centers were involved in the recruitment, treatment and follow-up of a total of 780 childrenin the TLC study: Baltimore (n=213), Newark (n=208), Philadelphia (n=165), and Cincinnati(n=194). Three hundred and ninety six children were randomly assigned to receive succimerand 384 to placebo. There were no differences between treatment and placebo groups in age,gender, race, and socioeconomic status at recruitment. Overall the children were mostly black(77%), spoke English (95%), with a single parent (72%), and with parent receiving publicassistance (97%). Females accounted for 44% of children, 40% of children had parents withless than 12 years education, and 58% of children had neither parent employed.
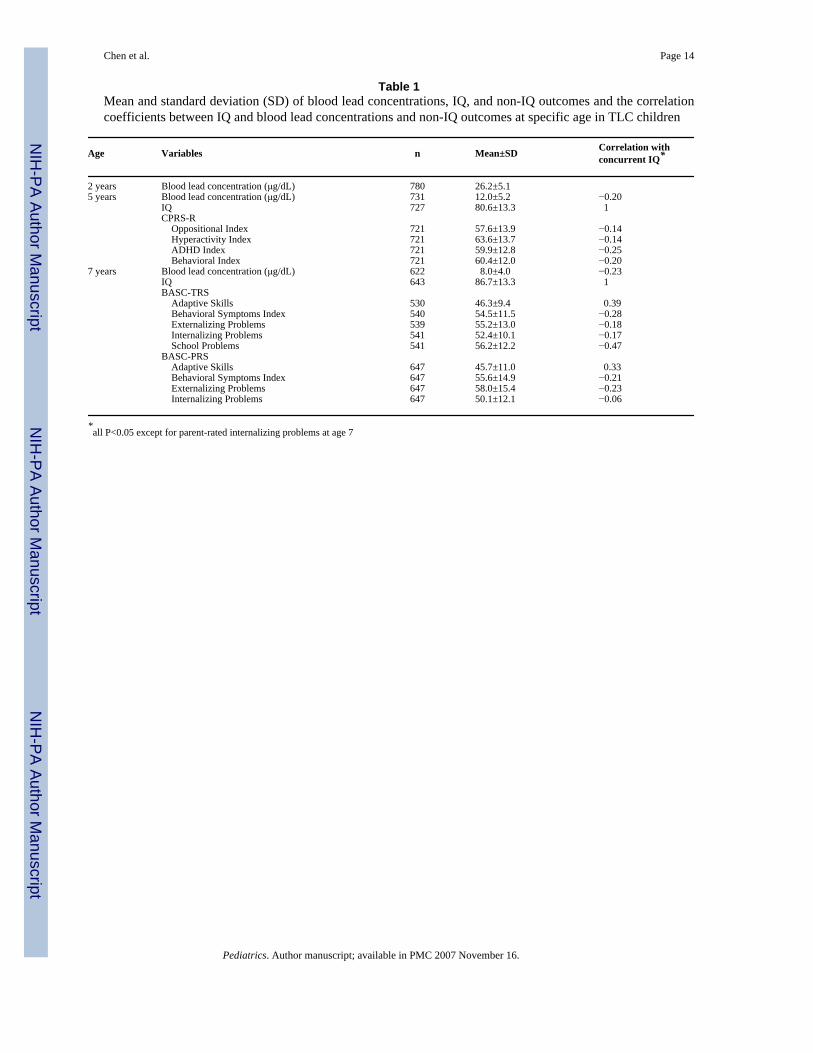
Blood Lead concentrationsAt baseline, the mean blood lead concentration was 26 μg/dL. It declined to 12 μg/dL (range2-35 μg/dL) at 36 months follow-up and to 8 μg/dL (range 0-26 μg/dL) at 60 months follow-up (Table 1). There were no differences in blood lead concentrations between succimer andplacebo groups at these three age points (mean±SD age: 2.0±0.5, 5.0±0.5, and 7.0±0.2 years,respectively).
Cognitive testsThe cognitive scores (mean±SD) in TLC children at baseline, age 5 and age 7 are shown inTable 1. Caregiver's IQ of these children had a mean of 80 and a standard deviation of 11.Again, these cognitive scores of both children and caregivers did not differ by treatment group.
Behavioral testsThe behavioral test scores (mean±SD) at 5 and 7 years are shown in Table 1. Also shown arethe correlation coefficients of these test scores with IQ measured at the same age.
Chen et al. Page 4
Pediatrics. Author manuscript; available in PMC 2007 November 16.
NIH
-PA Author Manuscript
NIH
-PA Author Manuscript
NIH
-PA Author Manuscript
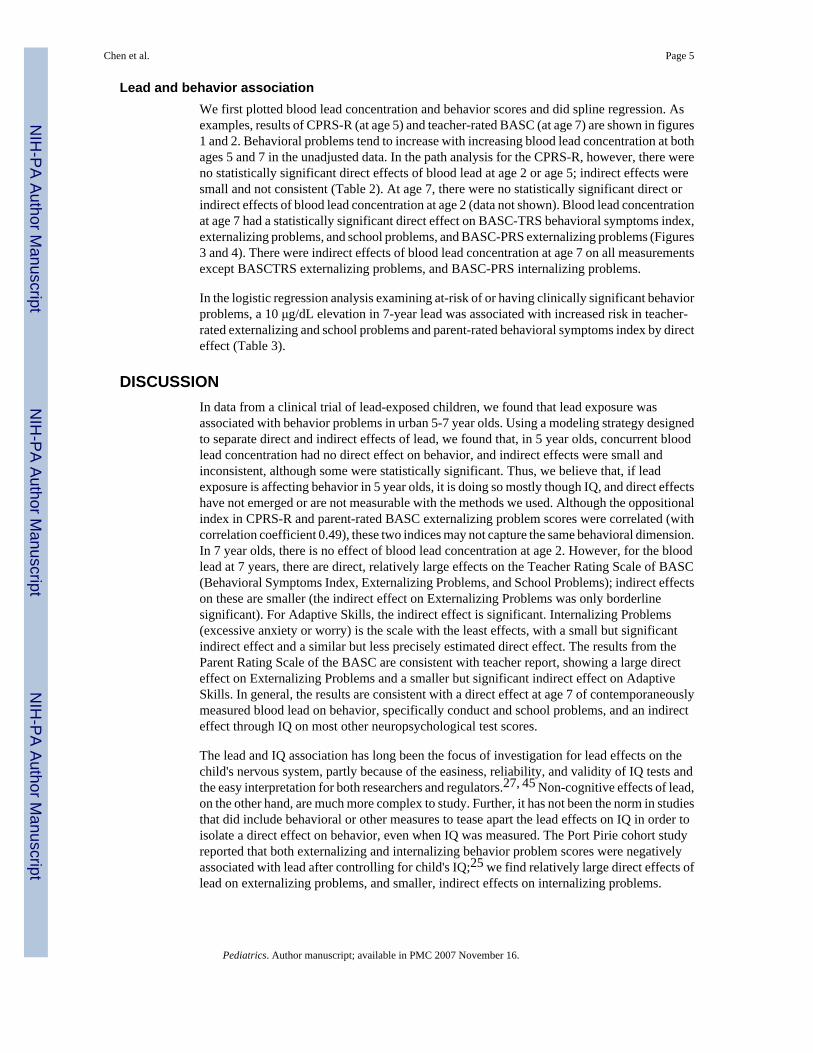
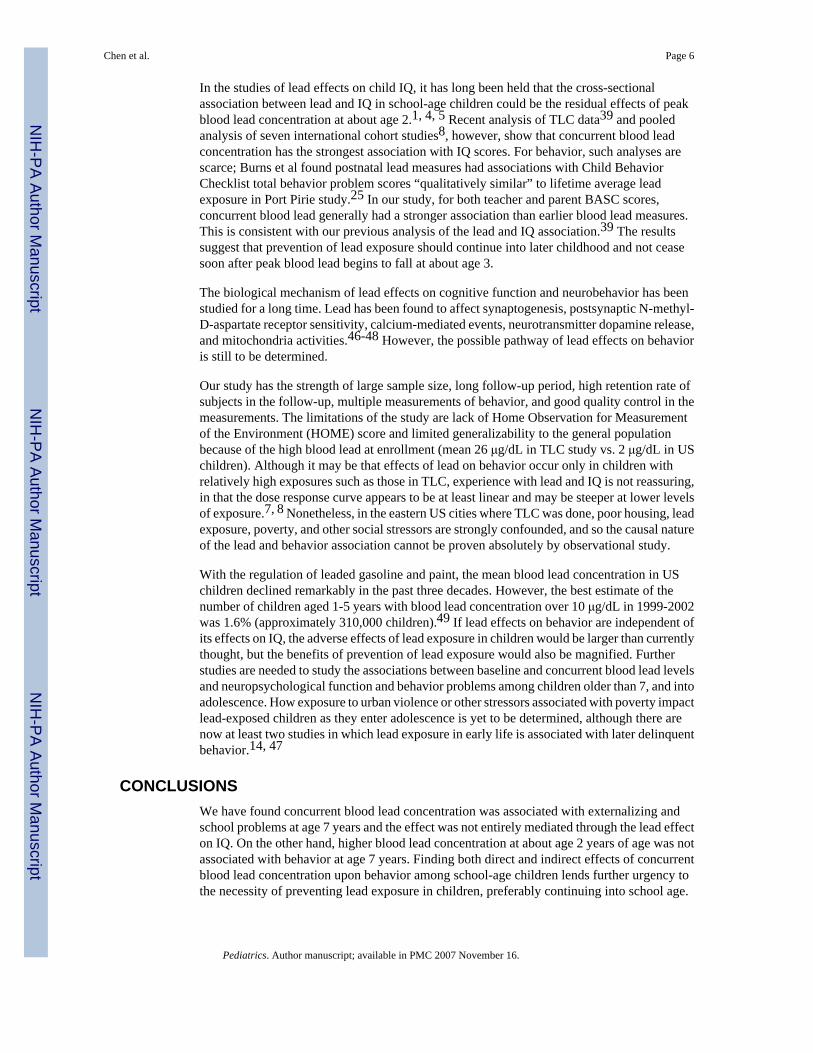
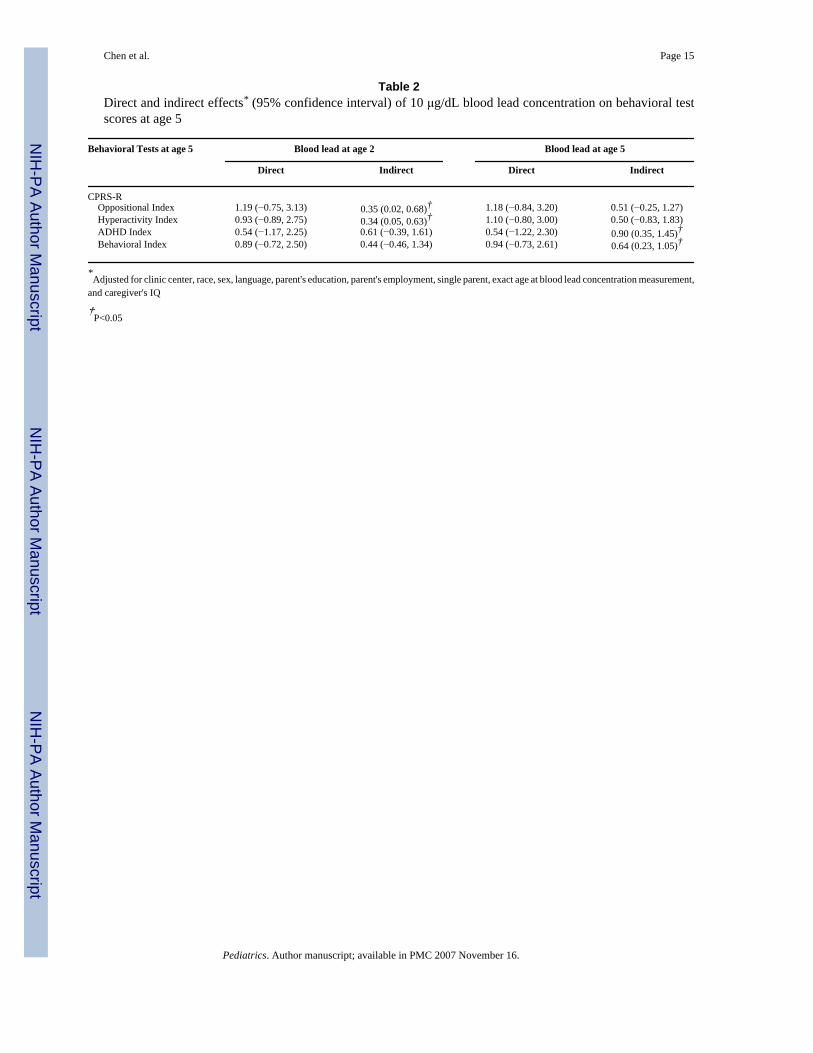
Lead and behavior associationWe first plotted blood lead concentration and behavior scores and did spline regression. Asexamples, results of CPRS-R (at age 5) and teacher-rated BASC (at age 7) are shown in figures1 and 2. Behavioral problems tend to increase with increasing blood lead concentration at bothages 5 and 7 in the unadjusted data. In the path analysis for the CPRS-R, however, there wereno statistically significant direct effects of blood lead at age 2 or age 5; indirect effects weresmall and not consistent (Table 2). At age 7, there were no statistically significant direct orindirect effects of blood lead concentration at age 2 (data not shown). Blood lead concentrationat age 7 had a statistically significant direct effect on BASC-TRS behavioral symptoms index,externalizing problems, and school problems, and BASC-PRS externalizing problems (Figures3 and 4). There were indirect effects of blood lead concentration at age 7 on all measurementsexcept BASCTRS externalizing problems, and BASC-PRS internalizing problems.
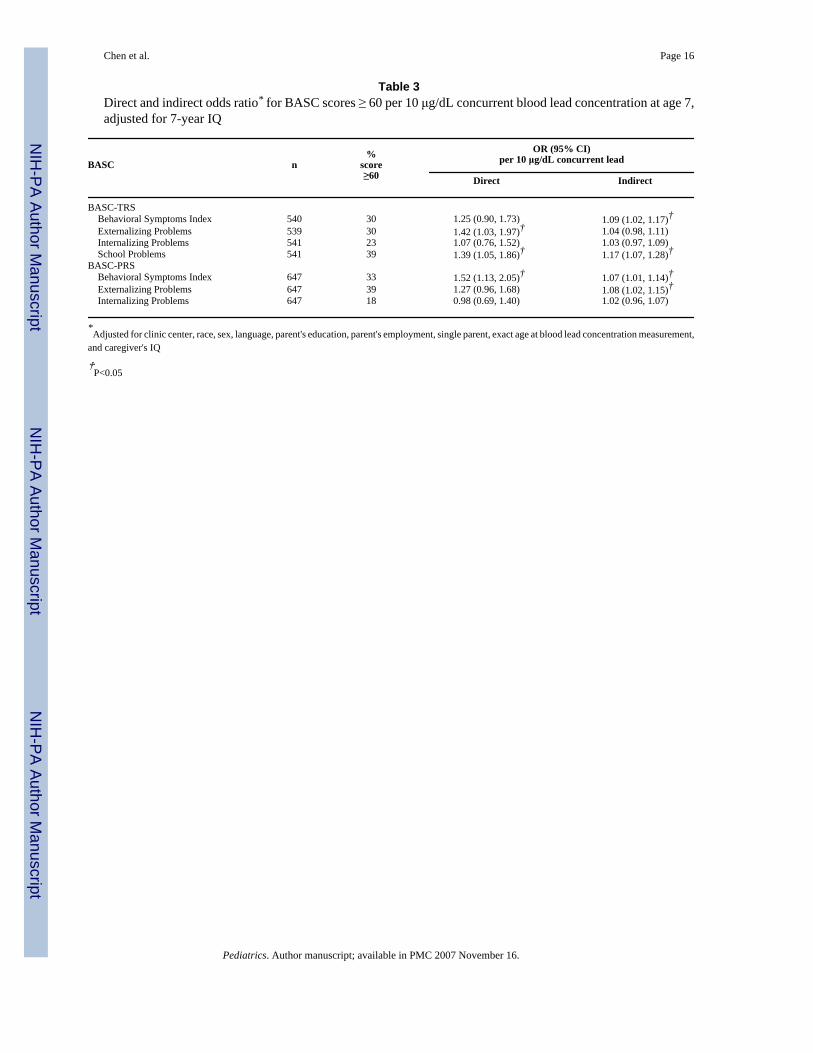
In the logistic regression analysis examining at-risk of or having clinically significant behaviorproblems, a 10 μg/dL elevation in 7-year lead was associated with increased risk in teacher-rated externalizing and school problems and parent-rated behavioral symptoms index by directeffect (Table 3).
DISCUSSIONIn data from a clinical trial of lead-exposed children, we found that lead exposure wasassociated with behavior problems in urban 5-7 year olds. Using a modeling strategy designedto separate direct and indirect effects of lead, we found that, in 5 year olds, concurrent bloodlead concentration had no direct effect on behavior, and indirect effects were small andinconsistent, although some were statistically significant. Thus, we believe that, if leadexposure is affecting behavior in 5 year olds, it is doing so mostly though IQ, and direct effectshave not emerged or are not measurable with the methods we used. Although the oppositionalindex in CPRS-R and parent-rated BASC externalizing problem scores were correlated (withcorrelation coefficient 0.49), these two indices may not capture the same behavioral dimension.In 7 year olds, there is no effect of blood lead concentration at age 2. However, for the bloodlead at 7 years, there are direct, relatively large effects on the Teacher Rating Scale of BASC(Behavioral Symptoms Index, Externalizing Problems, and School Problems); indirect effectson these are smaller (the indirect effect on Externalizing Problems was only borderlinesignificant). For Adaptive Skills, the indirect effect is significant. Internalizing Problems(excessive anxiety or worry) is the scale with the least effects, with a small but significantindirect effect and a similar but less precisely estimated direct effect. The results from theParent Rating Scale of the BASC are consistent with teacher report, showing a large directeffect on Externalizing Problems and a smaller but significant indirect effect on AdaptiveSkills. In general, the results are consistent with a direct effect at age 7 of contemporaneouslymeasured blood lead on behavior, specifically conduct and school problems, and an indirecteffect through IQ on most other neuropsychological test scores.
The lead and IQ association has long been the focus of investigation for lead effects on thechild's nervous system, partly because of the easiness, reliability, and validity of IQ tests andthe easy interpretation for both researchers and regulators.27, 45 Non-cognitive effects of lead,on the other hand, are much more complex to study. Further, it has not been the norm in studiesthat did include behavioral or other measures to tease apart the lead effects on IQ in order toisolate a direct effect on behavior, even when IQ was measured. The Port Pirie cohort studyreported that both externalizing and internalizing behavior problem scores were negativelyassociated with lead after controlling for child's IQ;25 we find relatively large direct effects oflead on externalizing problems, and smaller, indirect effects on internalizing problems.
Chen et al. Page 5
Pediatrics. Author manuscript; available in PMC 2007 November 16.
NIH
-PA Author Manuscript
NIH
-PA Author Manuscript
NIH
-PA Author Manuscript
In the studies of lead effects on child IQ, it has long been held that the cross-sectionalassociation between lead and IQ in school-age children could be the residual effects of peakblood lead concentration at about age 2.1, 4, 5 Recent analysis of TLC data39 and pooledanalysis of seven international cohort studies8, however, show that concurrent blood leadconcentration has the strongest association with IQ scores. For behavior, such analyses arescarce; Burns et al found postnatal lead measures had associations with Child BehaviorChecklist total behavior problem scores “qualitatively similar” to lifetime average leadexposure in Port Pirie study.25 In our study, for both teacher and parent BASC scores,concurrent blood lead generally had a stronger association than earlier blood lead measures.This is consistent with our previous analysis of the lead and IQ association.39 The resultssuggest that prevention of lead exposure should continue into later childhood and not ceasesoon after peak blood lead begins to fall at about age 3.
The biological mechanism of lead effects on cognitive function and neurobehavior has beenstudied for a long time. Lead has been found to affect synaptogenesis, postsynaptic N-methyl-D-aspartate receptor sensitivity, calcium-mediated events, neurotransmitter dopamine release,and mitochondria activities.46-48 However, the possible pathway of lead effects on behavioris still to be determined.
Our study has the strength of large sample size, long follow-up period, high retention rate ofsubjects in the follow-up, multiple measurements of behavior, and good quality control in themeasurements. The limitations of the study are lack of Home Observation for Measurementof the Environment (HOME) score and limited generalizability to the general populationbecause of the high blood lead at enrollment (mean 26 μg/dL in TLC study vs. 2 μg/dL in USchildren). Although it may be that effects of lead on behavior occur only in children withrelatively high exposures such as those in TLC, experience with lead and IQ is not reassuring,in that the dose response curve appears to be at least linear and may be steeper at lower levelsof exposure.7, 8 Nonetheless, in the eastern US cities where TLC was done, poor housing, leadexposure, poverty, and other social stressors are strongly confounded, and so the causal natureof the lead and behavior association cannot be proven absolutely by observational study.
With the regulation of leaded gasoline and paint, the mean blood lead concentration in USchildren declined remarkably in the past three decades. However, the best estimate of thenumber of children aged 1-5 years with blood lead concentration over 10 μg/dL in 1999-2002was 1.6% (approximately 310,000 children).49 If lead effects on behavior are independent ofits effects on IQ, the adverse effects of lead exposure in children would be larger than currentlythought, but the benefits of prevention of lead exposure would also be magnified. Furtherstudies are needed to study the associations between baseline and concurrent blood lead levelsand neuropsychological function and behavior problems among children older than 7, and intoadolescence. How exposure to urban violence or other stressors associated with poverty impactlead-exposed children as they enter adolescence is yet to be determined, although there arenow at least two studies in which lead exposure in early life is associated with later delinquentbehavior.14, 47
CONCLUSIONSWe have found concurrent blood lead concentration was associated with externalizing andschool problems at age 7 years and the effect was not entirely mediated through the lead effecton IQ. On the other hand, higher blood lead concentration at about age 2 years of age was notassociated with behavior at age 7 years. Finding both direct and indirect effects of concurrentblood lead concentration upon behavior among school-age children lends further urgency tothe necessity of preventing lead exposure in children, preferably continuing into school age.
Chen et al. Page 6
Pediatrics. Author manuscript; available in PMC 2007 November 16.
NIH
-PA Author Manuscript
NIH
-PA Author Manuscript
NIH
-PA Author Manuscript
ACKNOWLEDGEMENTS
The Treatment of Lead-exposed Children Trial was supported by NIEHS intramural and extramural funds, incooperation with the NIH Office of Minority Health, and by the Centers for Disease Control and Prevention. Succimerand placebo capsules were gifts from McNeil Labs, Fort Washington, PA.
We thank Dr. David Dunson at National Institute of Environmental Health Sciences for helpful comments on earlierversion of the manuscript.
ABBREVIATIONADHD, Attention Deficit Hyperactivity Disorder; BASC-PRS, Behavioral AssessmentSystems for Children – Parent Rating Scale; BASC-TRS, Behavioral Assessment Systems forChildren – Teacher Rating Scale; CPRS-R, Conners' Parent Rating Scale – Revised; IQ,Intelligence quotient; TLC, Treatment of Lead-exposed Children study; WISC-III, WechslerIntelligence Scale for Children-III; WPPSI-R, Wechsler Preschool and Primary Scales ofIntelligence – Revised.
REFERENCES1. Bellinger DC, Stiles KM, Needleman HL. Low-level lead exposure, intelligence and academic
achievement: a long-term follow-up study. Pediatrics 1992;90:855–861. [PubMed: 1437425]2. Baghurst PA, McMichael AJ, Wigg NR, et al. Environmental exposure to lead and children's
intelligence at the age of seven years. The Port Pirie Cohort Study. N Engl J Med 1992;327:1279–1284. [PubMed: 1383818]
3. Dietrich KN, Berger OG, Succop PA, Hammond PB, Bornschein RL. The developmental consequencesof low to moderate prenatal and postnatal lead exposure: intellectual attainment in the Cincinnati LeadStudy Cohort following school entry. Neurotoxicol Teratol 1993;15:37–44. [PubMed: 8459787]
4. Pocock SJ, Smith M, Baghurst P. Environmental lead and children's intelligence: a systematic reviewof the epidemiological evidence. BMJ 1994;309:1189–1197. [PubMed: 7987149]
5. Schwartz J. Low-level lead exposure and children's IQ: a meta-analysis and search for a threshold.Environ Res 1994;65:42–55. [PubMed: 8162884]
6. Lanphear BP, Dietrich K, Auinger P, Cox C. Cognitive deficits associated with blood leadconcentrations <10 microg/dL in US children and adolescents. Public Health Rep 2000;115:521–529.[PubMed: 11354334]
7. Canfield RL, Henderson CR Jr. Cory-Slechta DA, Cox C, Jusko TA, Lanphear BP. Intellectualimpairment in children with blood lead concentrations below 10 microg per deciliter. N Engl J Med2003;348:1517–1526. [PubMed: 12700371]
8. Lanphear BP, Hornung R, Khoury J, et al. Low-level environmental lead exposure and children'sintellectual function: an international pooled analysis. Environ Health Perspect 2005;113:894–899.[PubMed: 16002379]
9. Needleman HL, Gunnoe C, Leviton A, et al. Deficits in psychologic and classroom performance ofchildren with elevated dentine lead levels. N Engl J Med 1979;300:689–695. [PubMed: 763299]
10. Munoz H, Romiew I, Palazuelos E, Mancilla-Sanchez T, Meneses-Gonzalez F, Hernandez-Avila M.Blood lead level and neurobehavioral development among children living in Mexico City. ArchEnviron Health 1993;48:132–139. [PubMed: 8333782]
11. Leviton A, Bellinger D, Allred EN, Rabinowitz M, Needleman H, Schoenbaum S. Pre- and postnatallow-level lead exposure and children's dysfunction in school. Environ Res 1993;60:30–43. [PubMed:7679348]
12. David OJ, Hoffman SP, Clark J, Grad G, Sverd J. The relationship of hyperactivity to moderatelyelevated lead levels. Arch Environ Health 1983;38:341–346. [PubMed: 6667034]
13. Tuthill RW. Hair lead levels related to children's classroom attention-deficit behavior. Arch EnvironHealth 1996;51:214–220. [PubMed: 8687242]
14. Needleman HL, McFarland C, Ness RB, Fienberg SE, Tobin MJ. Bone lead levels in adjudicateddelinquents. A case control study. Neurotoxicol Teratol 2002;24:711–717. [PubMed: 12460653]
Chen et al. Page 7
Pediatrics. Author manuscript; available in PMC 2007 November 16.
NIH
-PA Author Manuscript
NIH
-PA Author Manuscript
NIH
-PA Author Manuscript

15. Dietrich KN, Berger OG, Succop PA. Lead exposure and the motor developmental status of urbansix-year-old children in the Cincinnati Prospective Study. Pediatrics 1993;91:301–307. [PubMed:7678702]
16. Winneke G, Altmann L, Kramer U, et al. Neurobehavioral and neurophysiological observations insix year old children with low lead levels in East and West Germany. Neurotoxicology 1994;15:705–713. [PubMed: 7854610]
17. Altmann L, Sveinsson K, Kramer U, Winneke G, Wiegand H. Assessment of neurophysiologic andneurobehavioral effects of environmental pollutants in 5-and 6-year-old children. Environ Res1997;73:125–131. [PubMed: 9311538]
18. Benetou-Marantidou A, Nakou S, Micheloyannis J. Neurobehavioral estimation of children with life-long increased lead exposure. Arch Environ Health 1988;43:392–395. [PubMed: 3196074]
19. Sciarillo WG, Alexander G, Farrell KP. Lead exposure and child behavior. Am J Public Health1992;82:1356–1360. [PubMed: 1415859]
20. Bellinger D, Leviton A, Allred E, Rabinowitz M. Pre- and postnatal lead exposure and behaviorproblems in school-aged children. Environ Res 1994;66:12–30. [PubMed: 8013435]
21. Needleman HL, Riess JA, Tobin MJ, Biesecker GE, Greenhouse JB. Bone lead levels and delinquentbehavior. Jama 1996;275:363–369. [PubMed: 8569015]
22. Mendelsohn AL, Dreyer BP, Fierman AH, et al. Low-level lead exposure and behavior in earlychildhood. Pediatrics 1998;101:E10. [PubMed: 9481029]
23. Counter SA, Buchanan LH, Rosas HD, Ortega F. Neurocognitive effects of chronic lead intoxicationin Andean children. J Neurol Sci 1998;160:47–53. [PubMed: 9804116]
24. Wasserman GA, Staghezza-Jaramillo B, Shrout P, Popovac D, Graziano J. The effect of lead exposureon behavior problems in preschool children. Am J Public Health 1998;88:481–486. [PubMed:9518990]
25. Burns JM, Baghurst PA, Sawyer MG, McMichael AJ, Tong SL. Lifetime low-level exposure toenvironmental lead and children's emotional and behavioral development at ages 11-13 years. ThePort Pirie Cohort Study. Am J Epidemiol 1999;149:740–749. [PubMed: 10206624]
26. Goodman R, Simonoff E, Stevenson J. The impact of child IQ, parent IQ and sibling IQ on childbehavioural deviance scores. J Child Psychol Psychiatry 1995;36:409–425. [PubMed: 7782405]
27. Walkowiak J, Altmann L, Kramer U, et al. Cognitive and sensorimotor functions in 6-year-oldchildren in relation to lead and mercury levels: adjustment for intelligence and contrast sensitivity incomputerized testing. Neurotoxicol Teratol 1998;20:511–521. [PubMed: 9761589]
28. TLC. The Treatment of Lead-exposed Children (TLC) trial: design and recruitment for a study of theeffect of oral chelation on growth and development in toddlers. Paediatr Perinat Epidemiol1998;12:313–333. [PubMed: 9690266]
29. Rogan WJ, Dietrich KN, Ware JH, et al. The effect of chelation therapy with succimer onneuropsychological development in children exposed to lead. N Engl J Med 2001;344:1421–1426.[PubMed: 11346806]
30. Dietrich KN, Ware JH, Salganik M, et al. Effect of chelation therapy on the neuropsychological andbehavioral development of lead-exposed children after school entry. Pediatrics 2004;114:19–26.[PubMed: 15231903]
31. Miller DT, Paschal DC, Gunter EW, Stroud PE, D'Angelo J. Determination of lead in blood usingelectrothermal atomisation atomic absorption spectrometry with a L'vov platform and matrixmodifier. Analyst 1987;112:1701–1704. [PubMed: 3445938]
32. Wechsler, D. The Wechsler Preschool and Primary Scales of Intelligence-Revised. The PsychologicalCorporation; San Antonio, TX: 1989.
33. Wechsler, D. Wechsler Intelligence Scale for Children-III. The Psychological Corporation; SanAntonio, TX: 1991.
34. Wechsler, D. Wechsler Adult Intelligence Scale, Revised. The Psychological Corporation; SanAntonio, TX: 1981.
35. Silverstein AB. Two- and four-subtest short forms of the WAIS-R: a closer look at validity andreliability. J Clin Psychol 1985;41:95–97. [PubMed: 3973047]
36. Conners, CK. Conners' Rating Scales: technical manual. Revised. Multi-Health systems; NorthTonawanda, NY: 1997.
Chen et al. Page 8
Pediatrics. Author manuscript; available in PMC 2007 November 16.
NIH
-PA Author Manuscript
NIH
-PA Author Manuscript
NIH
-PA Author Manuscript
37. Reynolds, CR.; Kamphaus, RW. Behavior Assessment System for Children. American GuidanceService; Circle Pines, MN: 1992.
38. Chiodo LM, Jacobson SW, Jacobson JL. Neurodevelopmental effects of postnatal lead exposure atvery low levels. Neurotoxicol Teratol 2004;26:359–371. [PubMed: 15113598]
39. Chen A, Dietrich KN, Ware JH, Radcliffe J, Rogan WJ. IQ and blood lead from 2 to 7 years of age:are the effects in older children the residual of high blood lead concentrations in 2-year-olds? EnvironHealth Perspect 2005;113:597–601. [PubMed: 15866769]
40. Bollen, KA. Structural Equations with Latent Variables. John Wiley; New York: 1989.41. Bollen KA, Stine R. Direct and indirect effects: classical and bootstrap estimates of variability.
Sociological Methodology 1990;20:115–140.42. Jöreskog, KG.; Sörbom, D. LISREL 8 User's Guide. Scientific Software International; Uppsala,
Sweden: 1996.43. Sobel, ME. Asymptotic Confidence Intervals for Indirect Effects in Structural Equation Models. In:
Leinhart, S., editor. Sociological Methodology. Jossey-Bass; San Francisco: 1982. p. 290-312.44. Muthén, LK.; Muthén, BO. Mplus User's guide, Release 3.5. Muthén & Muthén; Los Angeles, CA:
2004.45. Bellinger DC. Lead. Pediatrics 2004;113:1016–1022. [PubMed: 15060194]46. Banks EC, Ferretti LE, Shucard DW. Effects of low level lead exposure on cognitive function in
children: a review of behavioral, neuropsychological and biological evidence. Neurotoxicology1997;18:237–281. [PubMed: 9216005]
47. Dietrich KN, Ris MD, Succop PA, Berger OG, Bornschein RL. Early exposure to lead and juveniledelinquency. Neurotoxicol Teratol 2001;23:511–518. [PubMed: 11792521]
48. Brockel BJ, Cory-Slechta DA. Lead-induced decrements in waiting behavior: involvement of D2-like dopamine receptors. Pharmacol Biochem Behav 1999;63:423–434. [PubMed: 10418784]
49. Schwemberger JG, Mosby JE, Doa MJ, et al. Blood lead levels - United States, 1999-2002. MMWRMorb Mortal Wkly Rep 2005;54:513–516. [PubMed: 15917736]
Chen et al. Page 9
Pediatrics. Author manuscript; available in PMC 2007 November 16.
NIH
-PA Author Manuscript
NIH
-PA Author Manuscript
NIH
-PA Author Manuscript
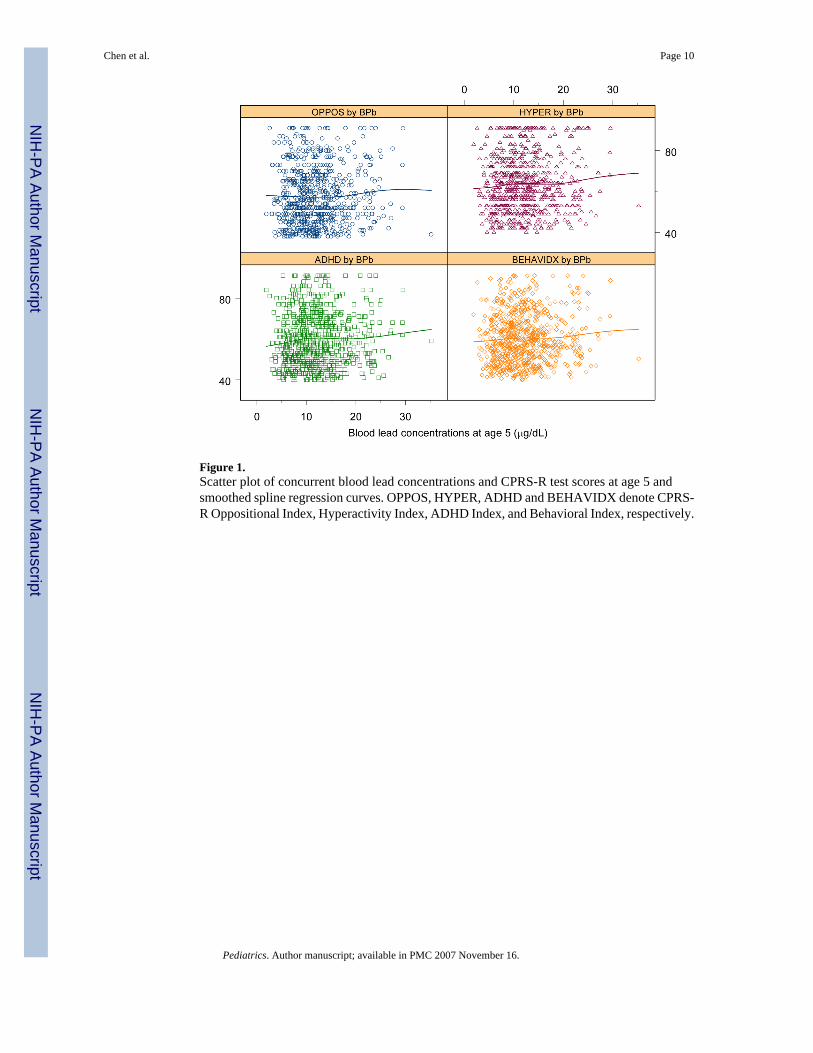
Figure 1.Scatter plot of concurrent blood lead concentrations and CPRS-R test scores at age 5 andsmoothed spline regression curves. OPPOS, HYPER, ADHD and BEHAVIDX denote CPRS-R Oppositional Index, Hyperactivity Index, ADHD Index, and Behavioral Index, respectively.
Chen et al. Page 10
Pediatrics. Author manuscript; available in PMC 2007 November 16.
NIH
-PA Author Manuscript
NIH
-PA Author Manuscript
NIH
-PA Author Manuscript
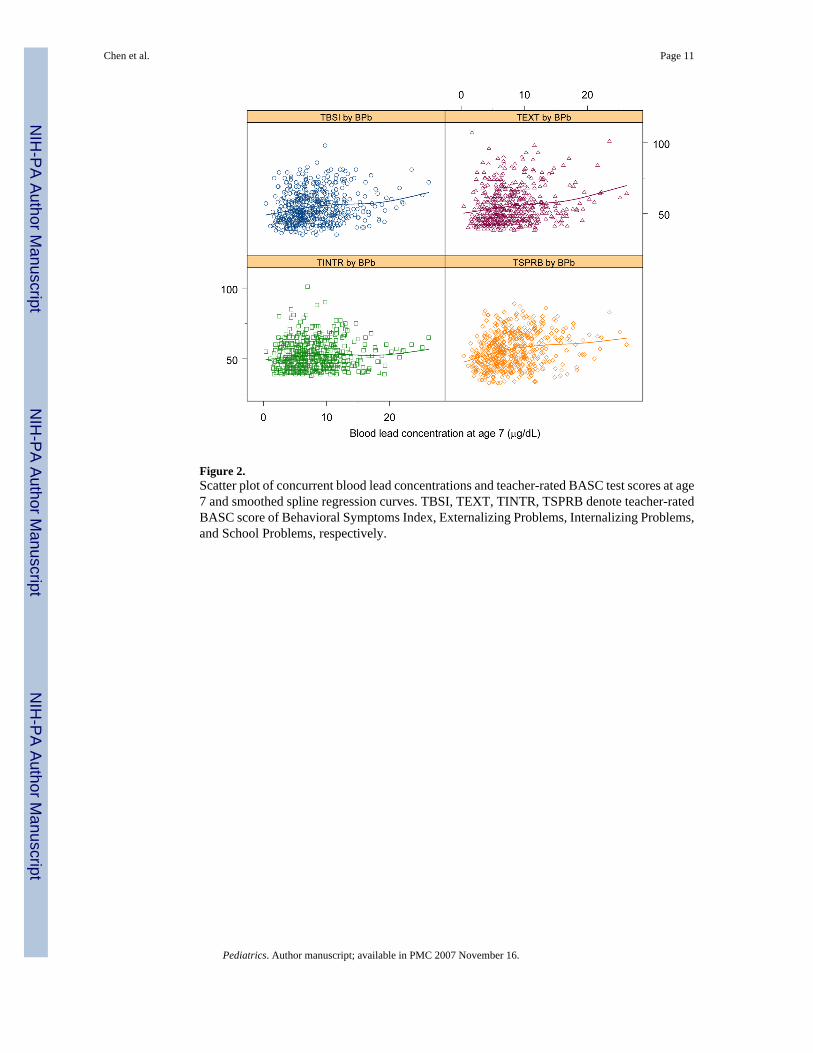
Figure 2.Scatter plot of concurrent blood lead concentrations and teacher-rated BASC test scores at age7 and smoothed spline regression curves. TBSI, TEXT, TINTR, TSPRB denote teacher-ratedBASC score of Behavioral Symptoms Index, Externalizing Problems, Internalizing Problems,and School Problems, respectively.
Chen et al. Page 11
Pediatrics. Author manuscript; available in PMC 2007 November 16.
NIH
-PA Author Manuscript
NIH
-PA Author Manuscript
NIH
-PA Author Manuscript
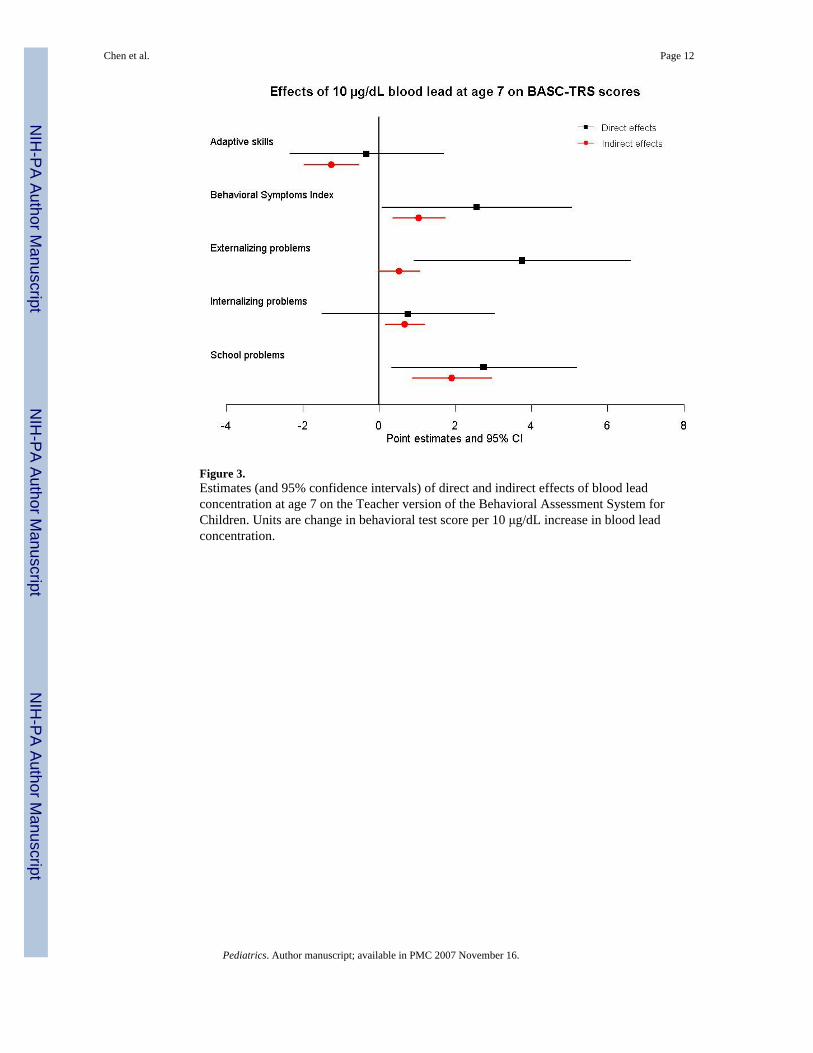
Figure 3.Estimates (and 95% confidence intervals) of direct and indirect effects of blood leadconcentration at age 7 on the Teacher version of the Behavioral Assessment System forChildren. Units are change in behavioral test score per 10 μg/dL increase in blood leadconcentration.
Chen et al. Page 12
Pediatrics. Author manuscript; available in PMC 2007 November 16.
NIH
-PA Author Manuscript
NIH
-PA Author Manuscript
NIH
-PA Author Manuscript
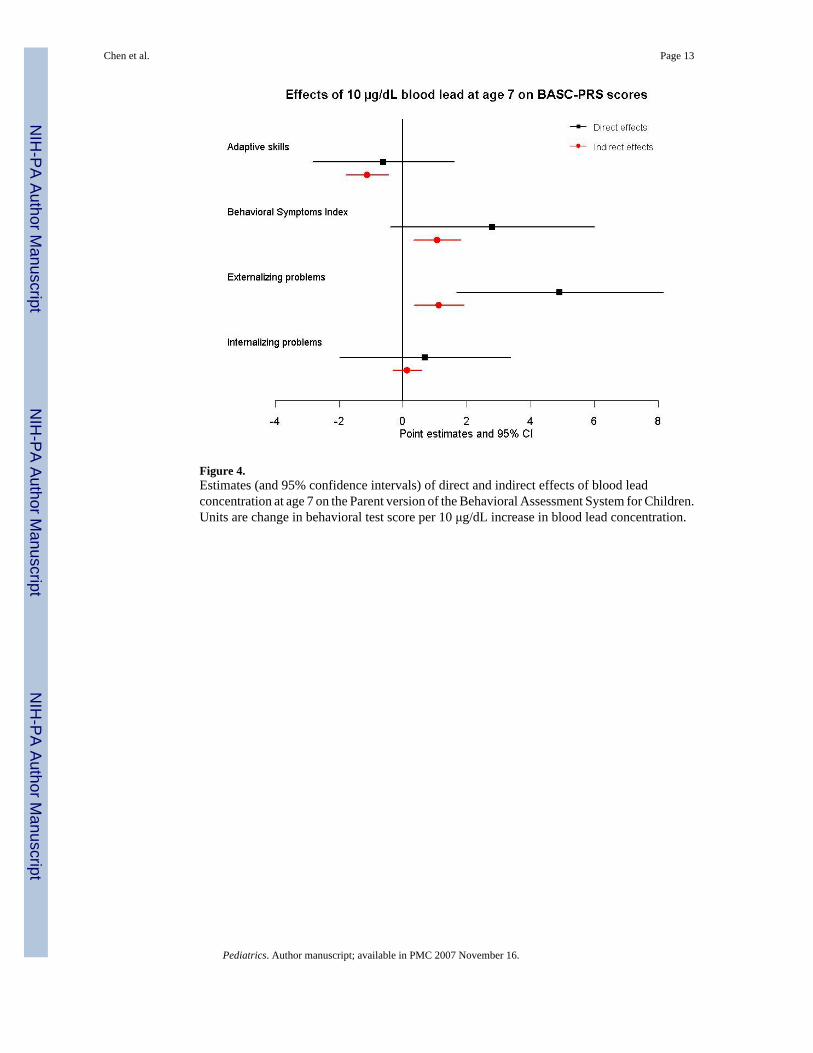
Figure 4.Estimates (and 95% confidence intervals) of direct and indirect effects of blood leadconcentration at age 7 on the Parent version of the Behavioral Assessment System for Children.Units are change in behavioral test score per 10 μg/dL increase in blood lead concentration.
Chen et al. Page 13
Pediatrics. Author manuscript; available in PMC 2007 November 16.
NIH
-PA Author Manuscript
NIH
-PA Author Manuscript
NIH
-PA Author Manuscript
NIH
-PA Author Manuscript
NIH
-PA Author Manuscript
NIH
-PA Author Manuscript
Chen et al. Page 14
Table 1Mean and standard deviation (SD) of blood lead concentrations, IQ, and non-IQ outcomes and the correlationcoefficients between IQ and blood lead concentrations and non-IQ outcomes at specific age in TLC children
Age Variables n Mean±SD Correlation withconcurrent IQ*
2 years Blood lead concentration (μg/dL) 780 26.2±5.15 years Blood lead concentration (μg/dL) 731 12.0±5.2 −0.20
IQ 727 80.6±13.3 1CPRS-R Oppositional Index 721 57.6±13.9 −0.14 Hyperactivity Index 721 63.6±13.7 −0.14 ADHD Index 721 59.9±12.8 −0.25 Behavioral Index 721 60.4±12.0 −0.20
7 years Blood lead concentration (μg/dL) 622 8.0±4.0 −0.23IQ 643 86.7±13.3 1BASC-TRS Adaptive Skills 530 46.3±9.4 0.39 Behavioral Symptoms Index 540 54.5±11.5 −0.28 Externalizing Problems 539 55.2±13.0 −0.18 Internalizing Problems 541 52.4±10.1 −0.17 School Problems 541 56.2±12.2 −0.47BASC-PRS Adaptive Skills 647 45.7±11.0 0.33 Behavioral Symptoms Index 647 55.6±14.9 −0.21 Externalizing Problems 647 58.0±15.4 −0.23 Internalizing Problems 647 50.1±12.1 −0.06
*all P<0.05 except for parent-rated internalizing problems at age 7
Pediatrics. Author manuscript; available in PMC 2007 November 16.
NIH
-PA Author Manuscript
NIH
-PA Author Manuscript
NIH
-PA Author Manuscript
Chen et al. Page 15
Table 2Direct and indirect effects* (95% confidence interval) of 10 μg/dL blood lead concentration on behavioral testscores at age 5
Behavioral Tests at age 5 Blood lead at age 2 Blood lead at age 5
Direct Indirect Direct Indirect
CPRS-R Oppositional Index 1.19 (−0.75, 3.13) 0.35 (0.02, 0.68)† 1.18 (−0.84, 3.20) 0.51 (−0.25, 1.27) Hyperactivity Index 0.93 (−0.89, 2.75) 0.34 (0.05, 0.63)† 1.10 (−0.80, 3.00) 0.50 (−0.83, 1.83) ADHD Index 0.54 (−1.17, 2.25) 0.61 (−0.39, 1.61) 0.54 (−1.22, 2.30) 0.90 (0.35, 1.45)† Behavioral Index 0.89 (−0.72, 2.50) 0.44 (−0.46, 1.34) 0.94 (−0.73, 2.61) 0.64 (0.23, 1.05)†
*Adjusted for clinic center, race, sex, language, parent's education, parent's employment, single parent, exact age at blood lead concentration measurement,
and caregiver's IQ
†P<0.05
Pediatrics. Author manuscript; available in PMC 2007 November 16.
NIH
-PA Author Manuscript
NIH
-PA Author Manuscript
NIH
-PA Author Manuscript
Chen et al. Page 16
Table 3Direct and indirect odds ratio* for BASC scores ≥ 60 per 10 μg/dL concurrent blood lead concentration at age 7,adjusted for 7-year IQ
BASC n%
score≥60
OR (95% CI)per 10 μg/dL concurrent lead
Direct Indirect
BASC-TRS Behavioral Symptoms Index 540 30 1.25 (0.90, 1.73) 1.09 (1.02, 1.17)† Externalizing Problems 539 30 1.42 (1.03, 1.97)† 1.04 (0.98, 1.11) Internalizing Problems 541 23 1.07 (0.76, 1.52) 1.03 (0.97, 1.09) School Problems 541 39 1.39 (1.05, 1.86)† 1.17 (1.07, 1.28)†BASC-PRS Behavioral Symptoms Index 647 33 1.52 (1.13, 2.05)† 1.07 (1.01, 1.14)† Externalizing Problems 647 39 1.27 (0.96, 1.68) 1.08 (1.02, 1.15)† Internalizing Problems 647 18 0.98 (0.69, 1.40) 1.02 (0.96, 1.07)
*Adjusted for clinic center, race, sex, language, parent's education, parent's employment, single parent, exact age at blood lead concentration measurement,
and caregiver's IQ
†P<0.05
Pediatrics. Author manuscript; available in PMC 2007 November 16.