
WALT DISNEY CO/ - zonebourse.com · WALT DISNEY CO/ FORM 10-Q (Quarterly Report) Filed 02/07/17 for...
48
WALT DISNEY CO/ FORM 10-Q (Quarterly Report) Filed 02/07/17 for the Period Ending 12/31/16 Address 500 SOUTH BUENA VISTA ST BURBANK, CA 91521 Telephone 8185601000 CIK 0001001039 Symbol DIS SIC Code 4841 - Cable and Other Pay Television Services Industry Broadcasting Sector Consumer Cyclicals Fiscal Year 09/30 http://www.edgar-online.com © Copyright 2017, EDGAR Online, Inc. All Rights Reserved. Distribution and use of this document restricted under EDGAR Online, Inc. Terms of Use.
Transcript of WALT DISNEY CO/ - zonebourse.com · WALT DISNEY CO/ FORM 10-Q (Quarterly Report) Filed 02/07/17 for...

WALT DISNEY CO/
FORM 10-Q(Quarterly Report)
Filed 02/07/17 for the Period Ending 12/31/16
Address 500 SOUTH BUENA VISTA ST
BURBANK, CA 91521Telephone 8185601000
CIK 0001001039Symbol DIS
SIC Code 4841 - Cable and Other Pay Television ServicesIndustry Broadcasting
Sector Consumer CyclicalsFiscal Year 09/30
http://www.edgar-online.com© Copyright 2017, EDGAR Online, Inc. All Rights Reserved.
Distribution and use of this document restricted under EDGAR Online, Inc. Terms of Use.
UNITED STATESSECURITIES AND EXCHANGE COMMISSION
Washington, D.C. 20549FORM 10-Q
QUARTERLY REPORT PURSUANT TO SECTION 13 OR 15(d) OFTHE SECURITIES EXCHANGE ACT OF 1934
For the Quarterly Period Ended Commission File Number 1-11605December 31, 2016
Incorporated in Delaware I.R.S. Employer Identification No. 95-4545390
500 South Buena Vista Street, Burbank, California 91521(818) 560-1000
Indicate by check mark whether the registrant (1) has filed all reports required to be filed by Section 13 or 15(d) of the Securities
Exchange Act of 1934 during the preceding 12 months (or for such shorter period that the registrant was required to file such reports), and(2) has been subject to such filing requirements for the past 90 days. Yes x No ¨
Indicate by check mark whether the registrant has submitted electronically and posted on its corporate Web site, if any, every InteractiveData File required to be submitted and posted pursuant to Rule 405 of Regulation S-T during the preceding 12 months (or for such shorterperiod that the registrant was required to submit and post such files). Yes x No ¨
Indicate by check mark whether the registrant is a large accelerated filer, an accelerated filer, a non-accelerated filer, or a smallerreporting company. See the definitions of “large accelerated filer,” “accelerated filer” and “smaller reporting company” in Rule 12b-2 of theExchange Act (Check one).
Large accelerated filer x Accelerated filer ¨
Non-accelerated filer (do not check if smaller reportingcompany) ¨ Smaller reporting company ¨
Indicate by check mark whether the registrant is a shell company (as defined in Rule 12b-2 of the Act). Yes ¨ No x
There were 1,581,248,242 shares of common stock outstanding as of February 1, 2017 .

PART I. FINANCIAL INFORMATION
Item 1: Financial Statements
THE WALT DISNEY COMPANYCONDENSED CONSOLIDATED STATEMENTS OF INCOME
(unaudited; in millions, except per share data)
Quarter Ended
December 31,
2016 January 2,
2016Revenues:
Services $ 12,406 $ 12,622Products 2,378 2,622
Total revenues 14,784 15,244Costs and expenses:
Cost of services (exclusive of depreciation and amortization) (7,020) (7,056)Cost of products (exclusive of depreciation and amortization) (1,386) (1,567)Selling, general, administrative and other (1,985) (2,025)Depreciation and amortization (687) (607)
Total costs and expenses (11,078) (11,255)Restructuring and impairment charges — (81)Interest expense, net (99) (24)Equity in the income of investees 118 474Income before income taxes 3,725 4,358Income taxes (1,237) (1,448)Net income 2,488 2,910Less: Net income attributable to noncontrolling interests (9) (30)Net income attributable to The Walt Disney Company (Disney) $ 2,479 $ 2,880
Earnings per share attributable to Disney: Diluted $ 1.55 $ 1.73
Basic $ 1.56 $ 1.74
Weighted average number of common and common equivalent shares outstanding: Diluted 1,603 1,668
Basic 1,592 1,654
Dividends declared per share $ 0.78 $ 0.71
See Notes to Condensed Consolidated Financial Statements
2
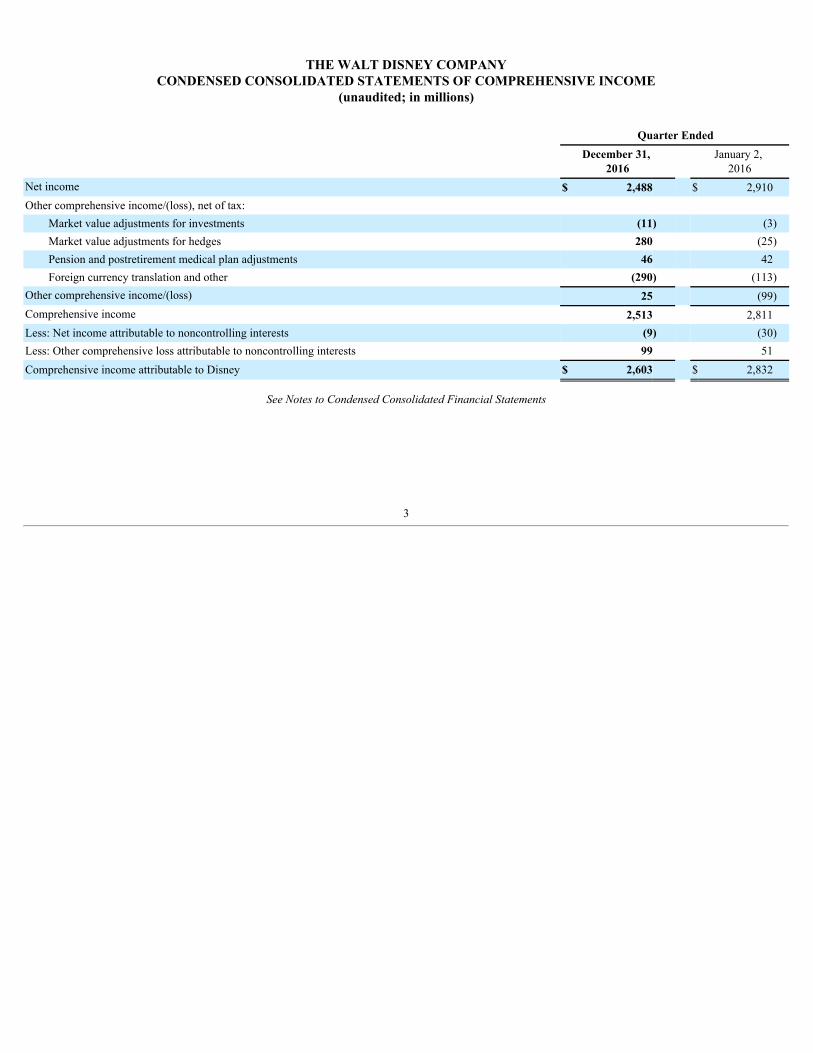
THE WALT DISNEY COMPANYCONDENSED CONSOLIDATED STATEMENTS OF COMPREHENSIVE INCOME
(unaudited; in millions)
Quarter Ended
December 31,
2016 January 2,
2016Net income $ 2,488 $ 2,910Other comprehensive income/(loss), net of tax:
Market value adjustments for investments (11) (3)Market value adjustments for hedges 280 (25)Pension and postretirement medical plan adjustments 46 42Foreign currency translation and other (290) (113)
Other comprehensive income/(loss) 25 (99)Comprehensive income 2,513 2,811Less: Net income attributable to noncontrolling interests (9) (30)Less: Other comprehensive loss attributable to noncontrolling interests 99 51Comprehensive income attributable to Disney $ 2,603 $ 2,832
See Notes to Condensed Consolidated Financial Statements
3
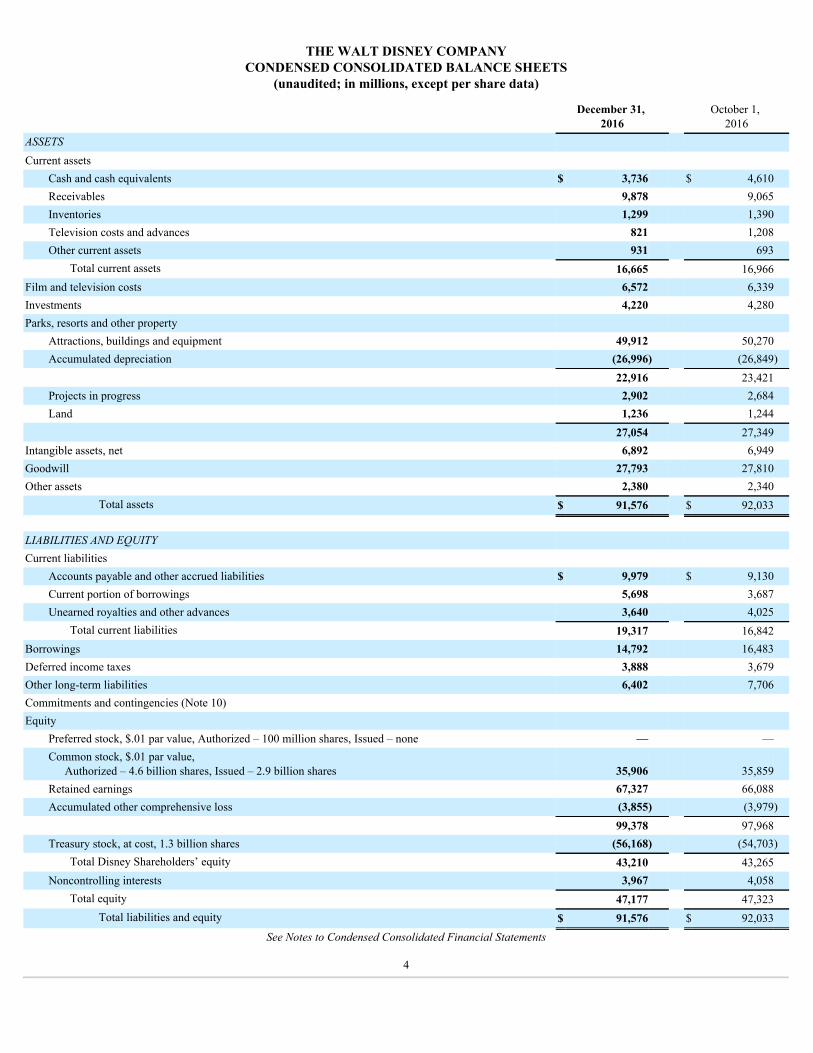
THE WALT DISNEY COMPANYCONDENSED CONSOLIDATED BALANCE SHEETS
(unaudited; in millions, except per share data)
December 31,
2016 October 1,
2016ASSETS Current assets
Cash and cash equivalents $ 3,736 $ 4,610Receivables 9,878 9,065Inventories 1,299 1,390Television costs and advances 821 1,208Other current assets 931 693
Total current assets 16,665 16,966Film and television costs 6,572 6,339Investments 4,220 4,280Parks, resorts and other property
Attractions, buildings and equipment 49,912 50,270Accumulated depreciation (26,996) (26,849)
22,916 23,421Projects in progress 2,902 2,684Land 1,236 1,244
27,054 27,349Intangible assets, net 6,892 6,949Goodwill 27,793 27,810Other assets 2,380 2,340
Total assets $ 91,576 $ 92,033
LIABILITIES AND EQUITY Current liabilities
Accounts payable and other accrued liabilities $ 9,979 $ 9,130Current portion of borrowings 5,698 3,687Unearned royalties and other advances 3,640 4,025
Total current liabilities 19,317 16,842Borrowings 14,792 16,483Deferred income taxes 3,888 3,679Other long-term liabilities 6,402 7,706Commitments and contingencies (Note 10) Equity
Preferred stock, $.01 par value, Authorized – 100 million shares, Issued – none — —Common stock, $.01 par value,
Authorized – 4.6 billion shares, Issued – 2.9 billion shares 35,906 35,859Retained earnings 67,327 66,088Accumulated other comprehensive loss (3,855) (3,979)
99,378 97,968Treasury stock, at cost, 1.3 billion shares (56,168) (54,703)
Total Disney Shareholders’ equity 43,210 43,265Noncontrolling interests 3,967 4,058
Total equity 47,177 47,323Total liabilities and equity $ 91,576 $ 92,033
See Notes to Condensed Consolidated Financial Statements
4
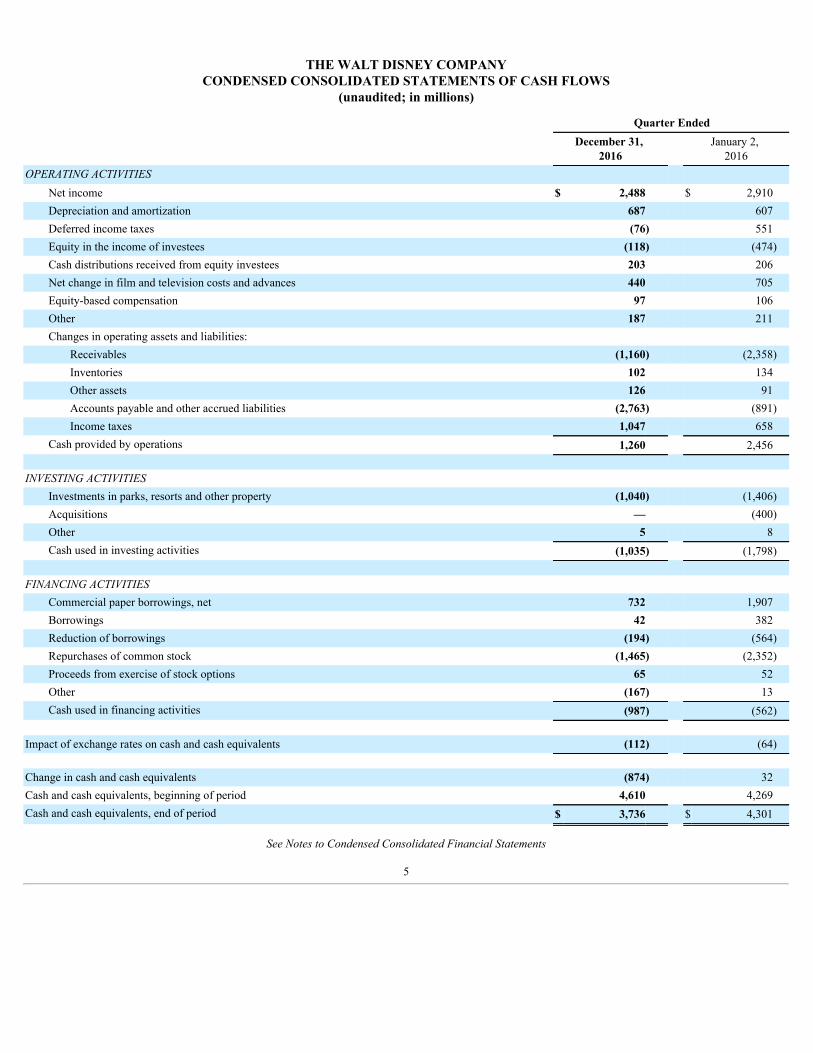
THE WALT DISNEY COMPANYCONDENSED CONSOLIDATED STATEMENTS OF CASH FLOWS
(unaudited; in millions)
Quarter Ended
December 31,
2016 January 2,
2016OPERATING ACTIVITIES
Net income $ 2,488 $ 2,910Depreciation and amortization 687 607Deferred income taxes (76) 551Equity in the income of investees (118) (474)Cash distributions received from equity investees 203 206Net change in film and television costs and advances 440 705Equity-based compensation 97 106Other 187 211Changes in operating assets and liabilities:
Receivables (1,160) (2,358)Inventories 102 134Other assets 126 91Accounts payable and other accrued liabilities (2,763) (891)Income taxes 1,047 658
Cash provided by operations 1,260 2,456 INVESTING ACTIVITIES
Investments in parks, resorts and other property (1,040) (1,406)Acquisitions — (400)Other 5 8Cash used in investing activities (1,035) (1,798)
FINANCING ACTIVITIES
Commercial paper borrowings, net 732 1,907Borrowings 42 382Reduction of borrowings (194) (564)Repurchases of common stock (1,465) (2,352)Proceeds from exercise of stock options 65 52Other (167) 13Cash used in financing activities (987) (562)
Impact of exchange rates on cash and cash equivalents (112) (64) Change in cash and cash equivalents (874) 32Cash and cash equivalents, beginning of period 4,610 4,269Cash and cash equivalents, end of period $ 3,736 $ 4,301
See Notes to Condensed Consolidated Financial Statements
5

THE WALT DISNEY COMPANYCONDENSED CONSOLIDATED STATEMENTS OF EQUITY
(unaudited; in millions)
Quarter Ended
December 31, 2016 January 2, 2016
Disney
Shareholders
Non-controlling
Interests Total
Equity Disney
Shareholders
Non-controlling
Interests Total
Equity
Beginning balance $ 43,265 $ 4,058 $ 47,323 $ 44,525 $ 4,130 $ 48,655Comprehensive income/(loss) 2,603 (90) 2,513 2,832 (21) 2,811Equity compensation activity 48 — 48 128 — 128Dividends (1,237) — (1,237) (1,168) — (1,168)Common stock repurchases (1,465) — (1,465) (2,352) — (2,352)Distributions and other (4) (1) (5) (7) 131 124Ending balance $ 43,210 $ 3,967 $ 47,177 $ 43,958 $ 4,240 $ 48,198
See Notes to Condensed Consolidated Financial Statements
6
THE WALT DISNEY COMPANYNOTES TO CONDENSED CONSOLIDATED FINANCIAL STATEMENTS
(unaudited; tabular dollars in millions, except for per share data)
1. Principles of Consolidation
These Condensed Consolidated Financial Statements have been prepared in accordance with accounting principles generally accepted in the United States ofAmerica (GAAP) for interim financial information and the instructions to Rule 10-01 of Regulation S-X. Accordingly, they do not include all of the informationand footnotes required by GAAP for complete financial statements. We believe that we have included all normal recurring adjustments necessary for a fairpresentation of the results for the interim period. Operating results for the quarter ended December 31, 2016 are not necessarily indicative of the results that may beexpected for the year ending September 30, 2017 . Certain reclassifications have been made in the prior-year financial statements to conform to the current-yearpresentation.
These financial statements should be read in conjunction with the Company’s 2016 Annual Report on Form 10-K.
The Company enters into relationships or investments with other entities that may be a variable interest entity (VIE). A VIE is consolidated in the financialstatements if the Company has the power to direct activities that most significantly impact the economic performance of the VIE and has the obligation to absorblosses or the right to receive benefits from the VIE that could potentially be significant to the VIE (as defined by ASC 810-10-25-38). Disneyland Paris, HongKong Disneyland Resort and Shanghai Disney Resort (collectively the International Theme Parks) are VIEs. Company subsidiaries (the Management Companies)have management agreements with the International Theme Parks, which provide the Management Companies, subject to certain protective rights of joint venturepartners, with the ability to direct the day-to-day operating activities and the development of business strategies that we believe most significantly impact theeconomic performance of the International Theme Parks. In addition, the Management Companies receive management fees under these arrangements that webelieve could be significant to the International Theme Parks. Therefore, the Company has consolidated the International Theme Parks in its financial statements.
The terms “Company,” “we,” “us,” and “our” are used in this report to refer collectively to the parent company and the subsidiaries through which ourvarious businesses are actually conducted.
2. Segment Information
The operating segments reported below are the segments of the Company for which separate financial information is available and for which segment resultsare evaluated regularly by the Chief Executive Officer in deciding how to allocate resources and in assessing performance.
Segment operating results reflect earnings before corporate and unallocated shared expenses, restructuring and impairment charges, interest expense, incometaxes and noncontrolling interests. Segment operating income includes equity in the income of investees. Corporate and unallocated shared expenses principallyconsist of corporate functions, executive management and certain unallocated administrative support functions.
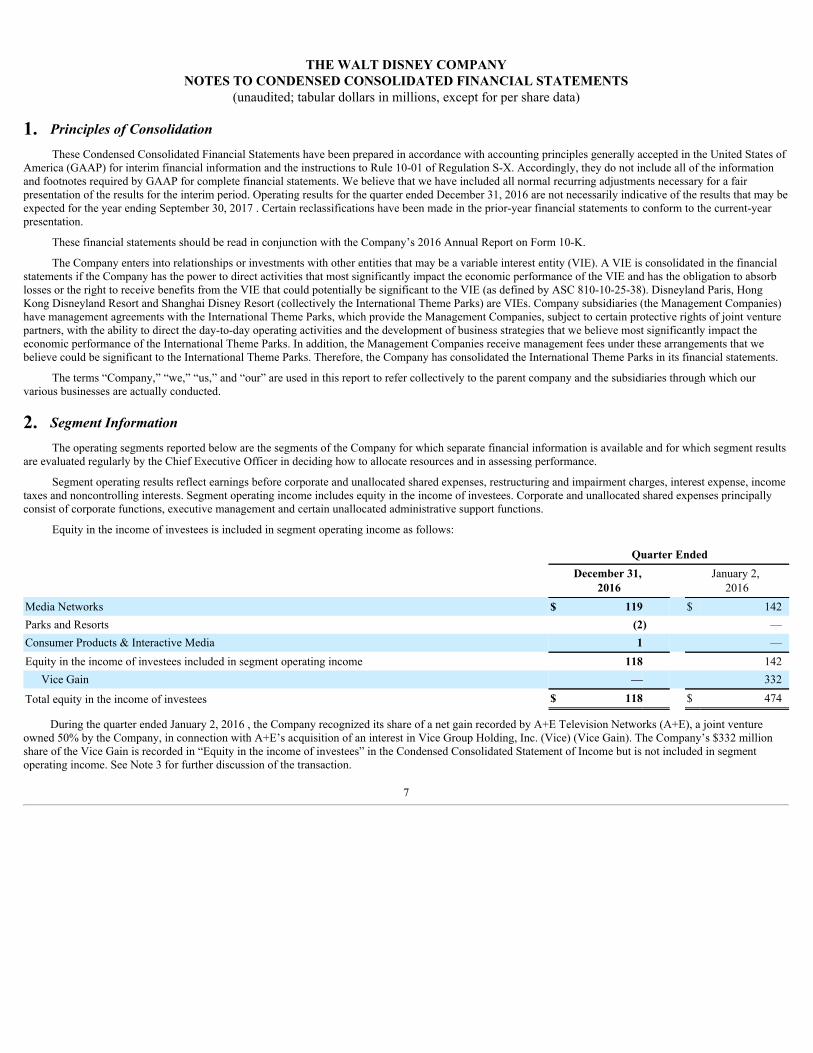
Equity in the income of investees is included in segment operating income as follows:
Quarter Ended
December 31,
2016 January 2,
2016Media Networks $ 119 $ 142Parks and Resorts (2) —Consumer Products & Interactive Media 1 —Equity in the income of investees included in segment operating income 118 142
Vice Gain — 332
Total equity in the income of investees $ 118 $ 474
During the quarter ended January 2, 2016 , the Company recognized its share of a net gain recorded by A+E Television Networks (A+E), a joint ventureowned 50% by the Company, in connection with A+E’s acquisition of an interest in Vice Group Holding, Inc. (Vice) (Vice Gain). The Company’s $332 millionshare of the Vice Gain is recorded in “Equity in the income of investees” in the Condensed Consolidated Statement of Income but is not included in segmentoperating income. See Note 3 for further discussion of the transaction.
7

THE WALT DISNEY COMPANYNOTES TO CONDENSED CONSOLIDATED FINANCIAL STATEMENTS
(unaudited; tabular dollars in millions, except for per share data)
Segment revenues and segment operating income are as follows:
Quarter Ended
December 31,
2016 January 2,
2016Revenues (1) :
Media Networks $ 6,233 $ 6,332Parks and Resorts 4,555 4,281Studio Entertainment 2,520 2,721Consumer Products & Interactive Media 1,476 1,910
$ 14,784 $ 15,244
Segment operating income (1) : Media Networks $ 1,362 $ 1,412Parks and Resorts 1,110 981Studio Entertainment 842 1,014Consumer Products & Interactive Media 642 860
$ 3,956 $ 4,267
(1) Studio Entertainment segment revenues and operating income include an allocation of Consumer Products & Interactive Media revenues, which is meantto reflect royalties on sales of merchandise based on certain film properties. The increase to Studio Entertainment revenues and operating income andcorresponding decrease to Consumer Products & Interactive Media revenues and operating income totaled $181 million and $262 million for the quartersended December 31, 2016 and January 2, 2016 , respectively.
A reconciliation of segment operating income to income before income taxes is as follows:
Quarter Ended
December 31,
2016 January 2,
2016Segment operating income $ 3,956 $ 4,267Corporate and unallocated shared expenses (132) (136)Restructuring and impairment charges — (81)Interest expense, net (99) (24)Vice Gain — 332Income before income taxes $ 3,725 $ 4,358
3. Acquisitions
Vice/A+EVice is a media company targeting a millennial audience through news and pop culture content and creative brand integration. During the first quarter of
fiscal 2016, A+E acquired an 8% interest in Vice in exchange for a 49.9% interest in one of A+E’s cable channels, H2, which has been rebranded as Viceland andprogrammed with Vice content. As a result of this exchange, A+E recognized a net non-cash gain based on the estimated fair value of H2. The Company’s share ofthe Vice Gain totaled $332 million and was recorded in “Equity in the income of investees” in the Condensed Consolidated Statement of Income in the first quarterof fiscal 2016. At December 31, 2016, A+E had a 20% interest in Vice.
In addition, during the first quarter of fiscal 2016, the Company acquired an 11% interest in Vice for $400 million of cash.
The Company accounts for its interests in A+E and Vice as equity method investments.
BAMTechIn August 2016, the Company acquired a 15% interest in BAMTech, an entity which holds Major League Baseball’s streaming technology and content
delivery businesses, for $450 million . In January 2017, the Company acquired an additional 18% interest for $557 million . In addition, the Company has anoption to increase its ownership to 66% by acquiring additional shares at fair market value from Major League Baseball between August 2020 and August 2023.The Company accounts for its interest in BAMTech as an equity method investment.
8

THE WALT DISNEY COMPANYNOTES TO CONDENSED CONSOLIDATED FINANCIAL STATEMENTS
(unaudited; tabular dollars in millions, except for per share data)
4. Borrowings
During the quarter ended December 31, 2016 , the Company’s borrowing activity was as follows:
October 1,
2016 Borrowings Payments Other
Activity December 31,
2016Commercial paper with original maturities
less than three months (1) $ 777 $ — $ (117) $ 1 $ 661Commercial paper with original maturities
greater than three months 744 1,594 (745) 2 1,595U.S. medium-term notes 16,827 — — 5 16,832International Theme Parks borrowings 1,087 13 — (27) 1,073Foreign currency denominated debt and other
(2) 735 29 (194) (241) 329Total $ 20,170 $ 1,636 $ (1,056) $ (260) $ 20,490
(1) Borrowings and payments are reported net.(2) The other activity is primarily market value adjustments for debt with qualifying hedges.
The Company has bank facilities with a syndicate of lenders to support commercial paper borrowings as follows:
CommittedCapacity
CapacityUsed
UnusedCapacity
Facility expiring March 2017 $ 1,500 $ — $ 1,500Facility expiring March 2019 2,250 — 2,250Facility expiring March 2021 2,250 — 2,250
Total $ 6,000 $ — $ 6,000
All of the above bank facilities allow for borrowings at LIBOR-based rates plus a spread depending on the credit default swap spread applicable to theCompany’s debt, subject to a cap and floor that vary with the Company’s debt rating assigned by Moody’s Investors Service and Standard and Poor’s. The spreadabove LIBOR can range from 0.23% to 1.63%. The Company also has the ability to issue up to $800 million of letters of credit under the facility expiring in March2019, which if utilized, reduces available borrowings under this facility. As of December 31, 2016 , the Company has $172 million of outstanding letters of credit,of which none were issued under this facility. The facilities specifically exclude certain entities, including the International Theme Parks, from any representations,covenants, or events of default and contain only one financial covenant relating to interest coverage, which the Company met on December 31, 2016 by asignificant margin.
Interest expense, netInterest and investment income and interest expense are reported net in the Condensed Consolidated Statements of Income and consist of the following (net
of capitalized interest):
Quarter Ended
December 31,
2016 January 2,
2016Interest expense $ (121) $ (66)Interest and investment income 22 42Interest expense, net $ (99) $ (24)
Interest and investment income includes gains and losses on the sale of publicly and non-publicly traded investments, investment impairments and interestearned on cash and cash equivalents and certain receivables.
9

THE WALT DISNEY COMPANYNOTES TO CONDENSED CONSOLIDATED FINANCIAL STATEMENTS
(unaudited; tabular dollars in millions, except for per share data)
5. International Theme Park InvestmentsThe Company has an 81% effective ownership interest in the operations of Disneyland Paris, a 47% ownership interest in the operations of Hong Kong
Disneyland Resort and a 43% ownership interest in the operations of Shanghai Disney Resort. The International Theme Parks are VIEs consolidated in theCompany’s financial statements. See Note 1 for the Company’s policy on consolidating VIEs.
The following table summarizes the carrying amounts of the International Theme Parks’ assets and liabilities included in the Company’s CondensedConsolidated Balance Sheets as of December 31, 2016 and October 1, 2016 :
International Theme Parks
December 31, 2016 October 1, 2016Cash and cash equivalents $ 717 $ 1,008Other current assets 343 331
Total current assets 1,060 1,339Parks, resorts and other property 8,960 9,270Other assets 89 88
Total assets $ 10,109 $ 10,697
Current liabilities $ 1,265 $ 1,499Borrowings - long-term 1,073 1,087Other long-term liabilities 267 256
Total liabilities $ 2,605 $ 2,842
The following table summarizes the International Theme Parks’ revenues and costs and expenses included in the Company’s Condensed ConsolidatedStatement of Income for the quarter ended December 31, 2016 :
December 31, 2016Revenues $ 737Costs and expenses (760)
International Theme Parks royalty and management fees of $32 million recognized for the quarter ended December 31, 2016 are eliminated in consolidationbut are considered in calculating earnings allocated to noncontrolling interests.
For the quarter ended December 31, 2016 , International Theme Parks’ cash flows included in the Company’s Condensed Consolidated Statement of CashFlows are $113 million generated from operating activities, $304 million used in investing activities and $13 million generated from financing activities.
Disneyland Paris The Company has term loans to Disneyland Paris with outstanding balances totaling €1.0 billion at December 31, 2016 bearing interest at a 4% fixed rate and
maturing in 2024. In addition, the Company has provided Disneyland Paris a €0.4 billion line of credit bearing interest at EURIBOR plus 2% and maturing in2023. At December 31, 2016 , €155 million is outstanding under the line of credit. The amounts of the loans and line of credit are eliminated upon consolidation.
The Company has waived royalties and management fees for the fourth quarter of fiscal 2016 through the third quarter of fiscal 2018.
Hong Kong Disneyland ResortAt December 31, 2016 , the Government of the Hong Kong Special Administrative Region (HKSAR) and the Company had 53% and 47% equity interests in
Hong Kong Disneyland Resort, respectively.
As part of financing the construction of a third hotel, the Company and HKSAR have provided loans with outstanding balances of $136 million and $91million , respectively, which bear interest at a rate of three month HIBOR plus 2% and mature in September 2025. The amount of the Company’s loan iseliminated upon consolidation.
10
THE WALT DISNEY COMPANYNOTES TO CONDENSED CONSOLIDATED FINANCIAL STATEMENTS
(unaudited; tabular dollars in millions, except for per share data)
Shanghai Disney ResortShanghai Disney Resort is owned through two joint venture companies, in which Shanghai Shendi (Group) Co., Ltd (Shendi) owns 57% and the Company
owns 43% . A management company, in which the Company has a 70% interest and Shendi a 30% interest, is responsible for operating Shanghai Disney Resort.
The Company has provided Shanghai Disney Resort with long-term loans totaling $762 million , bearing interest at rates up to 8% . In addition, theCompany has an outstanding balance of $288 million due from Shanghai Disney Resort related to development and pre-opening costs of the resort and outstandingroyalties and management fees. The Company has also provided Shanghai Disney Resort with a $157 million line of credit bearing interest at 8% . There is nooutstanding balance under the line of credit at December 31, 2016 . The amounts of the loan and line of credit are eliminated upon consolidation.
Shendi has provided Shanghai Disney Resort with term loans totaling 6.5 billion yuan (approximately $0.9 billion ), bearing interest at rates up to 8% andmaturing in 2036; however, early repayment is permitted. Shendi has also provided Shanghai Disney Resort with a 1.4 billion yuan (approximately $197 million )line of credit bearing interest at 8% . There is no outstanding balance under the line of credit at December 31, 2016 .
6. Pension and Other Benefit Programs
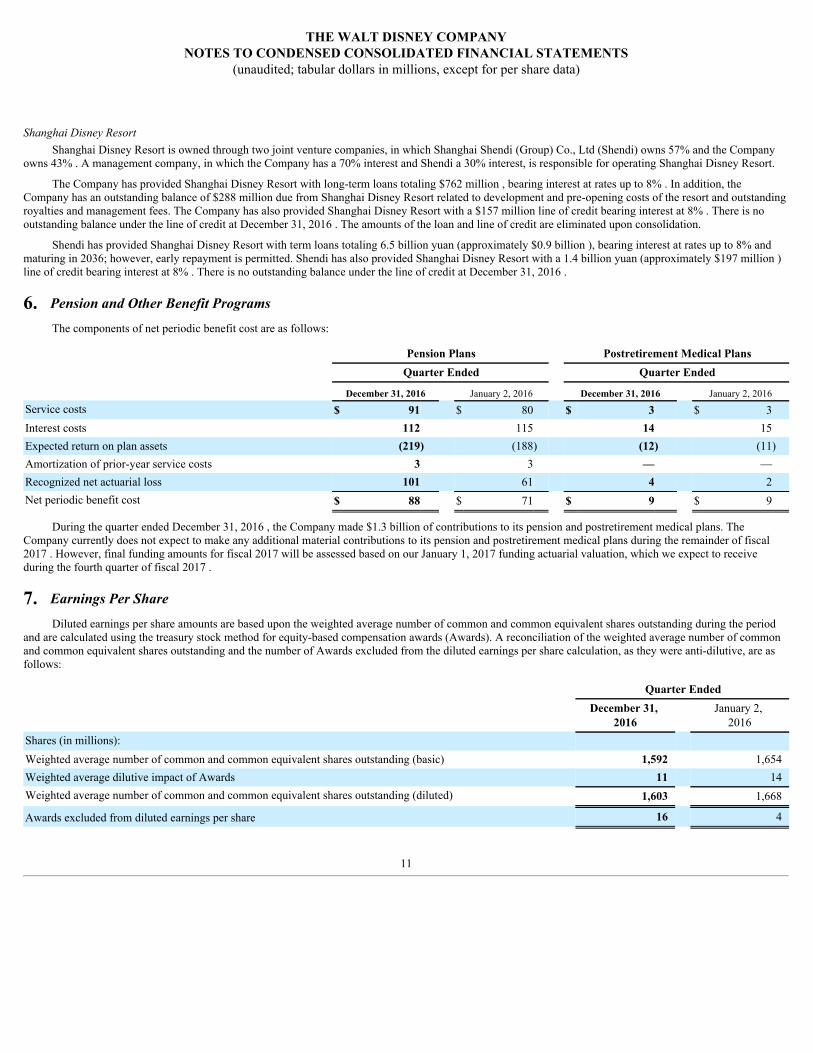
The components of net periodic benefit cost are as follows:
Pension Plans Postretirement Medical Plans
Quarter Ended Quarter Ended
December 31, 2016 January 2, 2016 December 31, 2016 January 2, 2016Service costs $ 91 $ 80 $ 3 $ 3Interest costs 112 115 14 15Expected return on plan assets (219) (188) (12) (11)Amortization of prior-year service costs 3 3 — —Recognized net actuarial loss 101 61 4 2Net periodic benefit cost $ 88 $ 71 $ 9 $ 9
During the quarter ended December 31, 2016 , the Company made $1.3 billion of contributions to its pension and postretirement medical plans. TheCompany currently does not expect to make any additional material contributions to its pension and postretirement medical plans during the remainder of fiscal2017 . However, final funding amounts for fiscal 2017 will be assessed based on our January 1, 2017 funding actuarial valuation, which we expect to receiveduring the fourth quarter of fiscal 2017 .
7. Earnings Per Share
Diluted earnings per share amounts are based upon the weighted average number of common and common equivalent shares outstanding during the periodand are calculated using the treasury stock method for equity-based compensation awards (Awards). A reconciliation of the weighted average number of commonand common equivalent shares outstanding and the number of Awards excluded from the diluted earnings per share calculation, as they were anti-dilutive, are asfollows:
Quarter Ended
December 31,
2016 January 2,
2016Shares (in millions): Weighted average number of common and common equivalent shares outstanding (basic) 1,592 1,654Weighted average dilutive impact of Awards 11 14Weighted average number of common and common equivalent shares outstanding (diluted) 1,603 1,668
Awards excluded from diluted earnings per share 16 4
11

THE WALT DISNEY COMPANYNOTES TO CONDENSED CONSOLIDATED FINANCIAL STATEMENTS
(unaudited; tabular dollars in millions, except for per share data)
8. Equity
The Company paid the following dividends in fiscal 2017 and 2016 :
Per Share Total Paid Payment Timing Related to Fiscal Period$0.78 $1.2 billion Second Quarter of Fiscal 2017 Second Half 2016$0.71 $1.1 billion Fourth Quarter of Fiscal 2016 First Half 2016$0.71 $1.2 billion Second Quarter of Fiscal 2016 Second Half 2015
During the quarter ended December 31, 2016 , the Company repurchased 15 million shares of its common stock for $1.5 billion . As of December 31, 2016 ,the Company had remaining authorization in place to repurchase approximately 267 million additional shares. The repurchase program does not have an expirationdate.
The following table summarizes the changes in each component of accumulated other comprehensive income (loss) (AOCI) including our proportional shareof equity method investee amounts, which is generally net of 37% estimated tax:
Unrecognized Pension and
Postretirement Medical Expense
Foreign Currency
Translation and Other (1) AOCI
Market Value Adjustments
Investments Cash Flow Hedges Balance at October 1, 2016 $ 26 $ (25) $ (3,651) $ (329) $ (3,979)Quarter Ended December 31, 2016: Unrealized gains (losses) arising during the period (11) 324 (22) (191) 100Reclassifications of realized net
(gains) losses to net income — (44) 68 — 24
Balance at December 31, 2016 $ 15 $ 255 $ (3,605) $ (520) $ (3,855)
Balance at October 3, 2015 $ 13 $ 334 $ (2,497) $ (271) $ (2,421)Quarter Ended January 2, 2016: Unrealized gains (losses) arising during the period (3) 41 — (62) (24)Reclassifications of realized net
(gains) losses to net income — (66) 42 — (24)
Balance at January 2, 2016 $ 10 $ 309 $ (2,455) $ (333) $ (2,469)
(1) Foreign Currency Translation and Other is net of an average 22% estimated tax at December 31, 2016 as the Company has not recognized deferred taxassets for some of our foreign entities.
Details about AOCI components reclassified to net income are as follows:
Gains/(losses) in net income:
Affected line item in the Condensed Consolidated Statements of Income:
Quarter Ended
December 31,
2016 January 2,
2016Cash flow hedges Primarily revenue $ 70 $ 105Estimated tax Income taxes (26) (39) 44 66 Pension and postretirement medical expense Costs and expenses (108) (67)
Estimated tax Income taxes 40 25 (68) (42) Total reclassifications for the period $ (24) $ 24
12
THE WALT DISNEY COMPANYNOTES TO CONDENSED CONSOLIDATED FINANCIAL STATEMENTS
(unaudited; tabular dollars in millions, except for per share data)
At December 31, 2016 and October 1, 2016 , the Company held available-for-sale investments in unrecognized gain positions totaling $29 million and $49million , respectively, and no investments in significant unrecognized loss positions.
9. Equity-Based Compensation
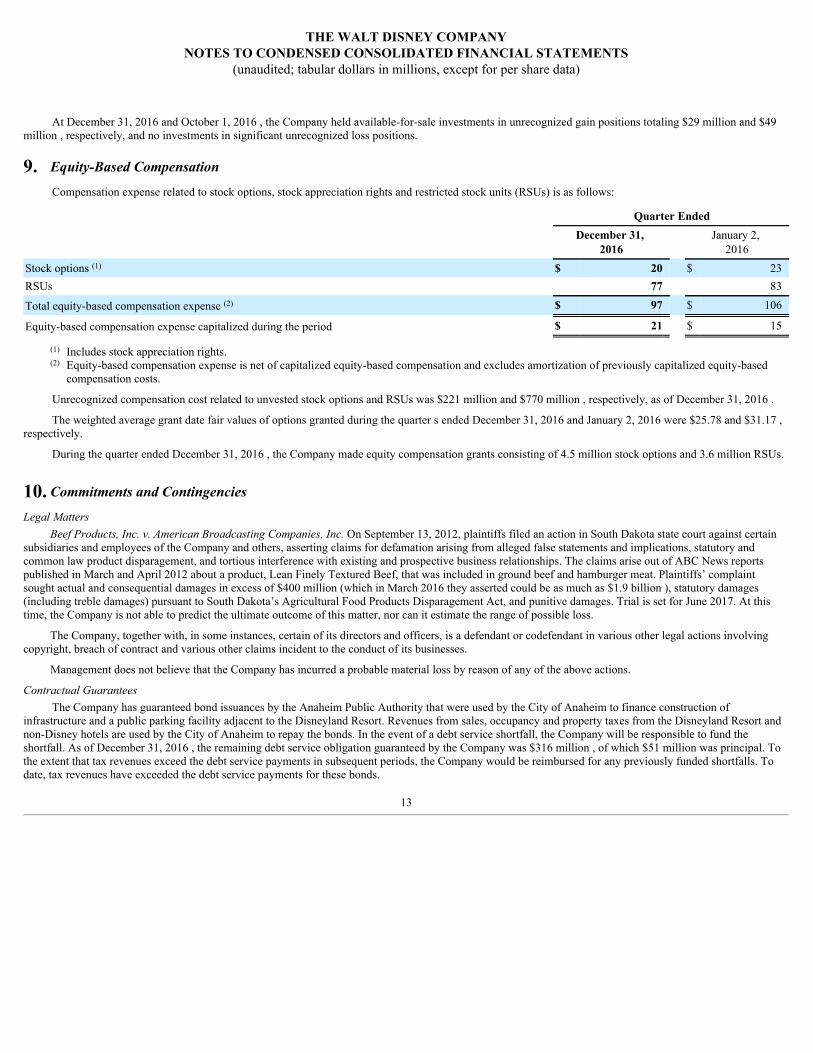
Compensation expense related to stock options, stock appreciation rights and restricted stock units (RSUs) is as follows:
Quarter Ended
December 31,
2016 January 2,
2016Stock options (1) $ 20 $ 23RSUs 77 83
Total equity-based compensation expense (2) $ 97 $ 106
Equity-based compensation expense capitalized during the period $ 21 $ 15
(1) Includes stock appreciation rights.(2) Equity-based compensation expense is net of capitalized equity-based compensation and excludes amortization of previously capitalized equity-based
compensation costs.
Unrecognized compensation cost related to unvested stock options and RSUs was $221 million and $770 million , respectively, as of December 31, 2016 .
The weighted average grant date fair values of options granted during the quarter s ended December 31, 2016 and January 2, 2016 were $25.78 and $31.17 ,respectively.
During the quarter ended December 31, 2016 , the Company made equity compensation grants consisting of 4.5 million stock options and 3.6 million RSUs.
10. Commitments and Contingencies
Legal MattersBeef Products, Inc. v. American Broadcasting Companies, Inc. On September 13, 2012, plaintiffs filed an action in South Dakota state court against certain
subsidiaries and employees of the Company and others, asserting claims for defamation arising from alleged false statements and implications, statutory andcommon law product disparagement, and tortious interference with existing and prospective business relationships. The claims arise out of ABC News reportspublished in March and April 2012 about a product, Lean Finely Textured Beef, that was included in ground beef and hamburger meat. Plaintiffs’ complaintsought actual and consequential damages in excess of $400 million (which in March 2016 they asserted could be as much as $1.9 billion ), statutory damages(including treble damages) pursuant to South Dakota’s Agricultural Food Products Disparagement Act, and punitive damages. Trial is set for June 2017. At thistime, the Company is not able to predict the ultimate outcome of this matter, nor can it estimate the range of possible loss.
The Company, together with, in some instances, certain of its directors and officers, is a defendant or codefendant in various other legal actions involvingcopyright, breach of contract and various other claims incident to the conduct of its businesses.
Management does not believe that the Company has incurred a probable material loss by reason of any of the above actions.
Contractual GuaranteesThe Company has guaranteed bond issuances by the Anaheim Public Authority that were used by the City of Anaheim to finance construction of
infrastructure and a public parking facility adjacent to the Disneyland Resort. Revenues from sales, occupancy and property taxes from the Disneyland Resort andnon-Disney hotels are used by the City of Anaheim to repay the bonds. In the event of a debt service shortfall, the Company will be responsible to fund theshortfall. As of December 31, 2016 , the remaining debt service obligation guaranteed by the Company was $316 million , of which $51 million was principal. Tothe extent that tax revenues exceed the debt service payments in subsequent periods, the Company would be reimbursed for any previously funded shortfalls. Todate, tax revenues have exceeded the debt service payments for these bonds.
13

THE WALT DISNEY COMPANYNOTES TO CONDENSED CONSOLIDATED FINANCIAL STATEMENTS
(unaudited; tabular dollars in millions, except for per share data)
Long-Term Receivables and the Allowance for Credit LossesThe Company has accounts receivable with original maturities greater than one year related to the sale of television program rights and vacation ownership
units. Allowances for credit losses are established against these receivables as necessary.
The Company estimates the allowance for credit losses related to receivables from the sale of television programs based upon a number of factors, includinghistorical experience and the financial condition of individual companies with which we do business. The balance of television program sales receivables recordedin other non-current assets, net of an immaterial allowance for credit losses, was $0.8 billion as of December 31, 2016 . The activity in the current period related tothe allowance for credit losses was not material.
The Company estimates the allowance for credit losses related to receivables from sales of its vacation ownership units based primarily on historicalcollection experience. Estimates of uncollectible amounts also consider the economic environment and the age of receivables. The balance of mortgage receivablesrecorded in other non-current assets, net of a related allowance for credit losses of approximately 4% , was approximately $0.7 billion as of December 31, 2016 .The activity in the current period related to the allowance for credit losses was not material.
Income TaxesDuring the quarter ended December 31, 2016 , the Company decreased its gross unrecognized tax benefits by $23 million to $821 million .
In the next twelve months, it is reasonably possible that our unrecognized tax benefits could change due to resolutions of open tax matters. These resolutionswould reduce our unrecognized tax benefits by approximately $120 million , of which $23 million would reduce our income tax expense and effective tax rate ifrecognized.
11. Fair Value Measurements
Fair value is defined as the amount that would be received for selling an asset or paid to transfer a liability in an orderly transaction between marketparticipants and is classified in one of the following three categories:
Level 1 - Quoted prices for identical instruments in active markets
Level 2 - Quoted prices for similar instruments in active markets; quoted prices for identical or similar instruments in markets that are not active; and model-derived valuations in which all significant inputs and significant value drivers are observable in active markets
Level 3 - Valuations derived from valuation techniques in which one or more significant inputs or significant value drivers are unobservable
The Company’s assets and liabilities measured at fair value are summarized in the following tables by fair value measurement Level:
Fair Value Measurement at December 31, 2016
Level 1 Level 2 Level 3 TotalAssets
Investments $ 55 $ — $ — $ 55Derivatives
Interest rate — 16 — 16Foreign exchange — 1,025 — 1,025Other — 12 — 12
Liabilities Derivatives
Interest rate — (149) — (149)Foreign exchange — (339) — (339)Other — (1) — (1)
Total recorded at fair value $ 55 $ 564 $ — $ 619
Fair value of borrowings $ — $ 19,597 $ 1,389 $ 20,986
14
THE WALT DISNEY COMPANYNOTES TO CONDENSED CONSOLIDATED FINANCIAL STATEMENTS
(unaudited; tabular dollars in millions, except for per share data)
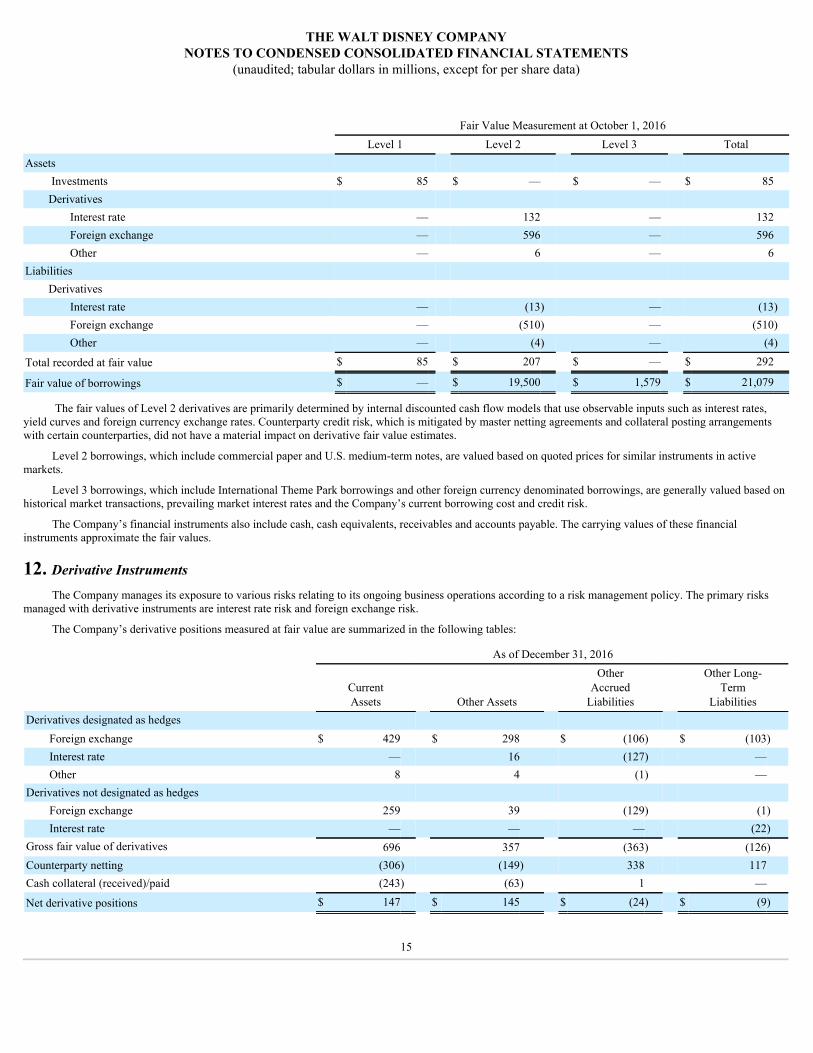
Fair Value Measurement at October 1, 2016
Level 1 Level 2 Level 3 TotalAssets
Investments $ 85 $ — $ — $ 85Derivatives
Interest rate — 132 — 132Foreign exchange — 596 — 596Other — 6 — 6
Liabilities Derivatives
Interest rate — (13) — (13)Foreign exchange — (510) — (510)Other — (4) — (4)
Total recorded at fair value $ 85 $ 207 $ — $ 292
Fair value of borrowings $ — $ 19,500 $ 1,579 $ 21,079
The fair values of Level 2 derivatives are primarily determined by internal discounted cash flow models that use observable inputs such as interest rates,yield curves and foreign currency exchange rates. Counterparty credit risk, which is mitigated by master netting agreements and collateral posting arrangementswith certain counterparties, did not have a material impact on derivative fair value estimates.
Level 2 borrowings, which include commercial paper and U.S. medium-term notes, are valued based on quoted prices for similar instruments in activemarkets.
Level 3 borrowings, which include International Theme Park borrowings and other foreign currency denominated borrowings, are generally valued based onhistorical market transactions, prevailing market interest rates and the Company’s current borrowing cost and credit risk.
The Company’s financial instruments also include cash, cash equivalents, receivables and accounts payable. The carrying values of these financialinstruments approximate the fair values.
12. Derivative Instruments
The Company manages its exposure to various risks relating to its ongoing business operations according to a risk management policy. The primary risksmanaged with derivative instruments are interest rate risk and foreign exchange risk.
The Company’s derivative positions measured at fair value are summarized in the following tables:
As of December 31, 2016
CurrentAssets Other Assets
OtherAccrued
Liabilities
Other Long-Term
LiabilitiesDerivatives designated as hedges
Foreign exchange $ 429 $ 298 $ (106) $ (103)Interest rate — 16 (127) —Other 8 4 (1) —
Derivatives not designated as hedges Foreign exchange 259 39 (129) (1)Interest rate — — — (22)
Gross fair value of derivatives 696 357 (363) (126)Counterparty netting (306) (149) 338 117Cash collateral (received)/paid (243) (63) 1 —
Net derivative positions $ 147 $ 145 $ (24) $ (9)
15
THE WALT DISNEY COMPANYNOTES TO CONDENSED CONSOLIDATED FINANCIAL STATEMENTS
(unaudited; tabular dollars in millions, except for per share data)
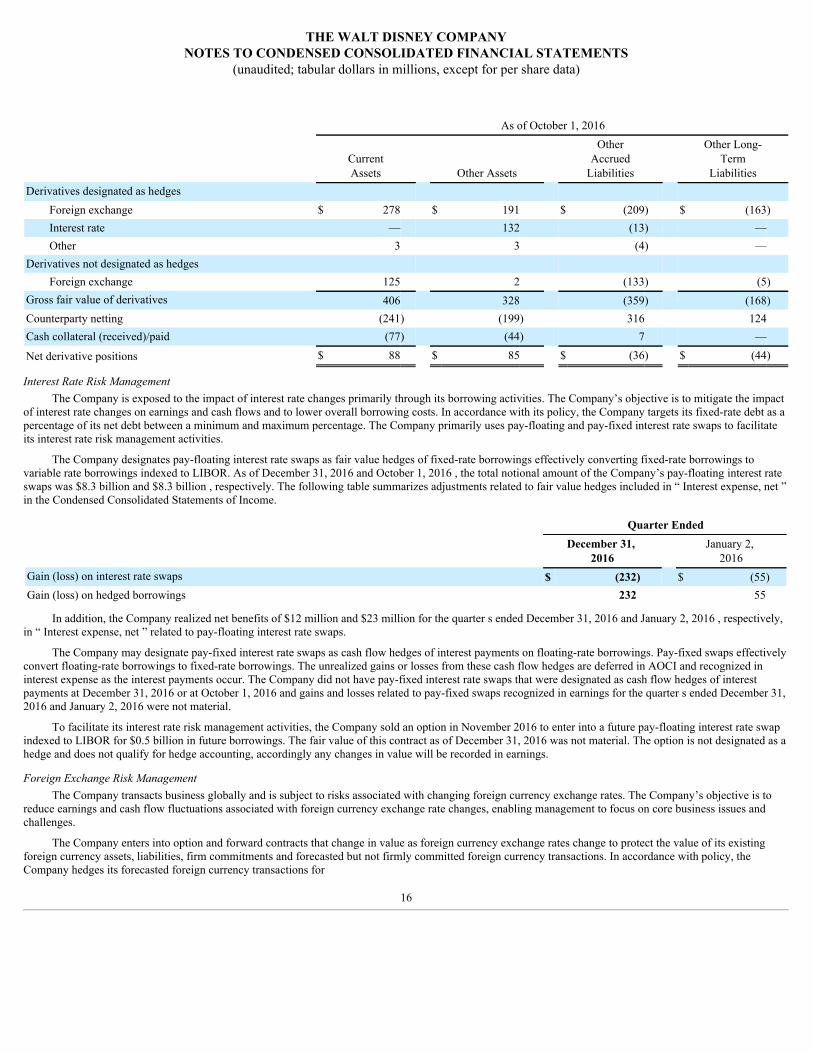
As of October 1, 2016
CurrentAssets Other Assets
OtherAccrued
Liabilities
Other Long-Term
LiabilitiesDerivatives designated as hedges
Foreign exchange $ 278 $ 191 $ (209) $ (163)Interest rate — 132 (13) —Other 3 3 (4) —
Derivatives not designated as hedges Foreign exchange 125 2 (133) (5)
Gross fair value of derivatives 406 328 (359) (168)Counterparty netting (241) (199) 316 124Cash collateral (received)/paid (77) (44) 7 —
Net derivative positions $ 88 $ 85 $ (36) $ (44)
Interest Rate Risk ManagementThe Company is exposed to the impact of interest rate changes primarily through its borrowing activities. The Company’s objective is to mitigate the impact
of interest rate changes on earnings and cash flows and to lower overall borrowing costs. In accordance with its policy, the Company targets its fixed-rate debt as apercentage of its net debt between a minimum and maximum percentage. The Company primarily uses pay-floating and pay-fixed interest rate swaps to facilitateits interest rate risk management activities.
The Company designates pay-floating interest rate swaps as fair value hedges of fixed-rate borrowings effectively converting fixed-rate borrowings tovariable rate borrowings indexed to LIBOR. As of December 31, 2016 and October 1, 2016 , the total notional amount of the Company’s pay-floating interest rateswaps was $8.3 billion and $8.3 billion , respectively. The following table summarizes adjustments related to fair value hedges included in “ Interest expense, net ”in the Condensed Consolidated Statements of Income.
Quarter Ended
December 31,
2016 January 2,
2016Gain (loss) on interest rate swaps $ (232) $ (55)Gain (loss) on hedged borrowings 232 55
In addition, the Company realized net benefits of $12 million and $23 million for the quarter s ended December 31, 2016 and January 2, 2016 , respectively,in “ Interest expense, net ” related to pay-floating interest rate swaps.
The Company may designate pay-fixed interest rate swaps as cash flow hedges of interest payments on floating-rate borrowings. Pay-fixed swaps effectivelyconvert floating-rate borrowings to fixed-rate borrowings. The unrealized gains or losses from these cash flow hedges are deferred in AOCI and recognized ininterest expense as the interest payments occur. The Company did not have pay-fixed interest rate swaps that were designated as cash flow hedges of interestpayments at December 31, 2016 or at October 1, 2016 and gains and losses related to pay-fixed swaps recognized in earnings for the quarter s ended December 31,2016 and January 2, 2016 were not material.
To facilitate its interest rate risk management activities, the Company sold an option in November 2016 to enter into a future pay-floating interest rate swapindexed to LIBOR for $0.5 billion in future borrowings. The fair value of this contract as of December 31, 2016 was not material. The option is not designated as ahedge and does not qualify for hedge accounting, accordingly any changes in value will be recorded in earnings.
Foreign Exchange Risk ManagementThe Company transacts business globally and is subject to risks associated with changing foreign currency exchange rates. The Company’s objective is to
reduce earnings and cash flow fluctuations associated with foreign currency exchange rate changes, enabling management to focus on core business issues andchallenges.
The Company enters into option and forward contracts that change in value as foreign currency exchange rates change to protect the value of its existingforeign currency assets, liabilities, firm commitments and forecasted but not firmly committed foreign currency transactions. In accordance with policy, theCompany hedges its forecasted foreign currency transactions for
16
THE WALT DISNEY COMPANYNOTES TO CONDENSED CONSOLIDATED FINANCIAL STATEMENTS
(unaudited; tabular dollars in millions, except for per share data)
periods generally not to exceed four years within an established minimum and maximum range of annual exposure. The gains and losses on these contracts offsetchanges in the U.S. dollar equivalent value of the related forecasted transaction, asset, liability or firm commitment. The principal currencies hedged are the euro,Japanese yen, Canadian dollar and British pound. Cross-currency swaps are used to effectively convert foreign currency-denominated borrowings into U.S. dollardenominated borrowings.
The Company designates foreign exchange forward and option contracts as cash flow hedges of firmly committed and forecasted foreign currencytransactions. As of December 31, 2016 and October 1, 2016 , the notional amounts of the Company’s net foreign exchange cash flow hedges were $5.2 billion and$5.6 billion , respectively. Mark-to-market gains and losses on these contracts are deferred in AOCI and are recognized in earnings when the hedged transactionsoccur, offsetting changes in the value of the foreign currency transactions. Gains and losses recognized related to ineffectiveness for the quarter s endedDecember 31, 2016 and January 2, 2016 were not material. Net deferred gains recorded in AOCI for contracts that will mature in the next twelve months totaled $332 million .
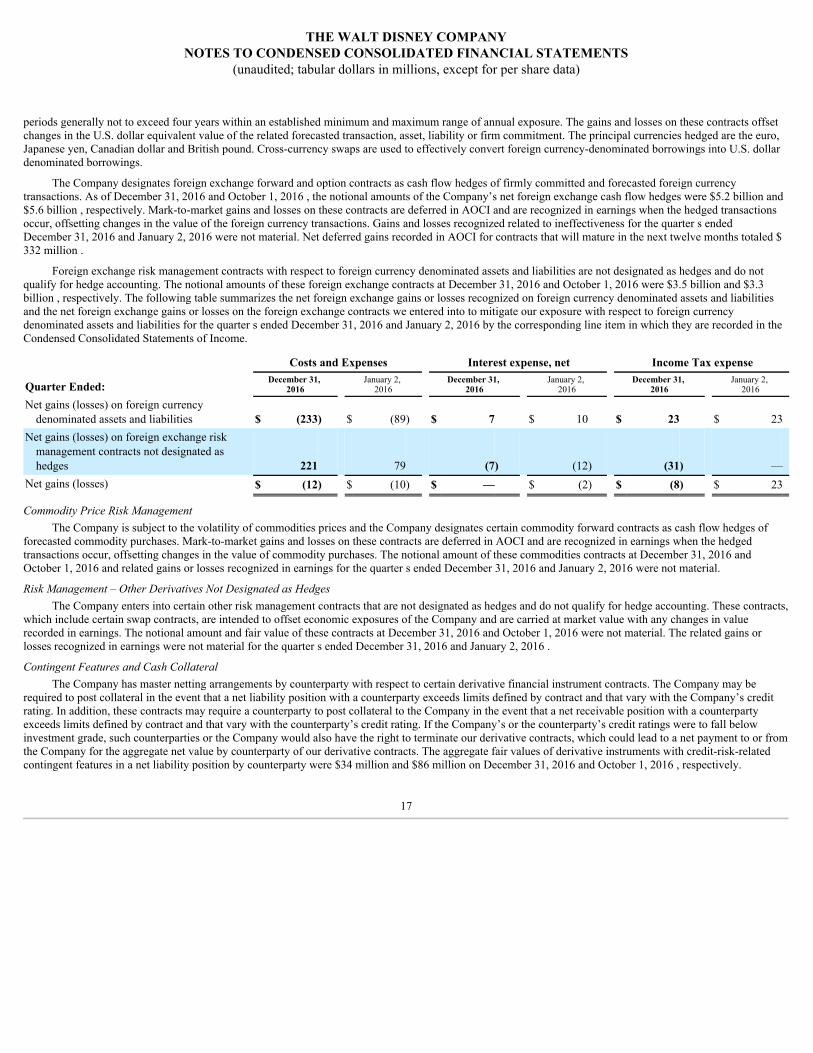
Foreign exchange risk management contracts with respect to foreign currency denominated assets and liabilities are not designated as hedges and do notqualify for hedge accounting. The notional amounts of these foreign exchange contracts at December 31, 2016 and October 1, 2016 were $3.5 billion and $3.3billion , respectively. The following table summarizes the net foreign exchange gains or losses recognized on foreign currency denominated assets and liabilitiesand the net foreign exchange gains or losses on the foreign exchange contracts we entered into to mitigate our exposure with respect to foreign currencydenominated assets and liabilities for the quarter s ended December 31, 2016 and January 2, 2016 by the corresponding line item in which they are recorded in theCondensed Consolidated Statements of Income.
Costs and Expenses Interest expense, net Income Tax expense
Quarter Ended:December 31,
2016 January 2,
2016 December 31,
2016 January 2,
2016 December 31,
2016 January 2,
2016
Net gains (losses) on foreign currencydenominated assets and liabilities $ (233) $ (89) $ 7 $ 10 $ 23 $ 23
Net gains (losses) on foreign exchange riskmanagement contracts not designated ashedges 221 79 (7) (12) (31) —
Net gains (losses) $ (12) $ (10) $ — $ (2) $ (8) $ 23
Commodity Price Risk ManagementThe Company is subject to the volatility of commodities prices and the Company designates certain commodity forward contracts as cash flow hedges of
forecasted commodity purchases. Mark-to-market gains and losses on these contracts are deferred in AOCI and are recognized in earnings when the hedgedtransactions occur, offsetting changes in the value of commodity purchases. The notional amount of these commodities contracts at December 31, 2016 andOctober 1, 2016 and related gains or losses recognized in earnings for the quarter s ended December 31, 2016 and January 2, 2016 were not material.
Risk Management – Other Derivatives Not Designated as HedgesThe Company enters into certain other risk management contracts that are not designated as hedges and do not qualify for hedge accounting. These contracts,
which include certain swap contracts, are intended to offset economic exposures of the Company and are carried at market value with any changes in valuerecorded in earnings. The notional amount and fair value of these contracts at December 31, 2016 and October 1, 2016 were not material. The related gains orlosses recognized in earnings were not material for the quarter s ended December 31, 2016 and January 2, 2016 .
Contingent Features and Cash CollateralThe Company has master netting arrangements by counterparty with respect to certain derivative financial instrument contracts. The Company may be
required to post collateral in the event that a net liability position with a counterparty exceeds limits defined by contract and that vary with the Company’s creditrating. In addition, these contracts may require a counterparty to post collateral to the Company in the event that a net receivable position with a counterpartyexceeds limits defined by contract and that vary with the counterparty’s credit rating. If the Company’s or the counterparty’s credit ratings were to fall belowinvestment grade, such counterparties or the Company would also have the right to terminate our derivative contracts, which could lead to a net payment to or fromthe Company for the aggregate net value by counterparty of our derivative contracts. The aggregate fair values of derivative instruments with credit-risk-relatedcontingent features in a net liability position by counterparty were $34 million and $86 million on December 31, 2016 and October 1, 2016 , respectively.
17
THE WALT DISNEY COMPANYNOTES TO CONDENSED CONSOLIDATED FINANCIAL STATEMENTS
(unaudited; tabular dollars in millions, except for per share data)
13. Restructuring and Impairment Charges
The Company recorded $81 million of restructuring and impairment charges in the prior-year quarter for an investment impairment and contract terminationand severance costs.
14. New Accounting Pronouncements
Restricted CashIn November 2016, the Financial Accounting Standards Board (FASB) issued guidance that requires restricted cash to be presented with cash and cash
equivalents in the statement of cash flows. The guidance is required to be adopted retrospectively, and is effective beginning in the first quarter of the Company’s2019 fiscal year (with early adoption permitted). At December 31, 2016 and October 1, 2016 , the Company held restricted cash of approximately $335 million and$150 million , respectively, primarily associated with collateral received from counterparties to its derivative contracts. The Company’s restricted cash balances arepresented in the Condensed Consolidated Balance Sheets as Other current assets and Other assets based on the maturity dates of the related derivatives. Under thenew guidance, changes in the Company’s restricted cash will continue to be classified as either operating activities or investing activities in the CondensedConsolidated Statements of Cash Flows, depending on the nature of the activities that gave rise to the restricted cash balance.
Intra-Entity Transfers of Assets Other Than InventoryIn October 2016, the FASB issued guidance that requires the income tax consequences of an intra-entity transfer of an asset other than inventory to be
recognized when the transfer occurs instead of when the asset is sold to an outside party. The new guidance is effective beginning with the first quarter of theCompany’s 2019 fiscal year (with early adoption permitted as of the beginning of an annual period). The guidance is required to be adopted retrospectively byrecording a cumulative-effect adjustment to retained earnings as of the beginning of the adoption period. The Company is assessing the potential impact thisguidance will have on its financial statements.
Stock Compensation - Employee Share-based PaymentsIn March 2016, the FASB issued guidance to amend certain aspects of accounting for employee share-based awards, including accounting for income taxes
related to those transactions. This guidance will require recognizing excess tax benefits and deficiencies (that result from an increase or decrease in the value of anaward from grant date to the vesting date or exercise date) on share-based compensation arrangements in the tax provision, instead of in equity as under the currentguidance. In addition, these amounts will be classified as an operating activity in the statement of cash flows, instead of as a financing activity. The Companyreported excess tax benefits of $0.2 billion and $0.3 billion in fiscal 2016 and 2015, respectively. In addition, cash paid for shares withheld to satisfy employeetaxes will be classified as a financing activity, instead of as an operating activity. Cash paid for employee taxes was $0.2 billion and $0.3 billion in fiscal 2016 and2015, respectively. The fiscal 2016 and 2015 amounts of excess tax benefits and cash paid for employee taxes are not necessarily indicative of future amounts thatmay arise in years following implementation of the new accounting pronouncement.
The Company adopted the new guidance in the first quarter of fiscal 2017 as follows:• Excess tax benefits of $38 million in the current quarter were recognized as a benefit in “Income taxes” in the Condensed Consolidated Statement of
Income and classified as a source in operating activities in the Condensed Consolidated Statement of Cash Flows. The guidance required prospectiveadoption for the statement of income and allowed for either prospective or retrospective adoption for the statement of cash flows. The Company elected toprospectively adopt the effect to the statement of cash flows and accordingly, did not restate the Condensed Consolidated Statement of Cash Flows for thequarter ended January 2, 2016 .
• Cash paid for shares withheld to satisfy employee taxes of $135 million for the quarter ended December 31, 2016 was classified as a use in financingactivities in the Condensed Consolidated Statement of Cash Flows. The guidance required retrospective adoption; accordingly, a $94 million use wasreclassified from an operating activity to a financing activity in the Condensed Consolidated Statement of Cash Flows for the quarter ended January 2,2016 .
LeasesIn February 2016, the FASB issued a new lease accounting standard, which requires the present value of committed operating lease payments to be recorded
as right-of-use lease assets and lease liabilities on the balance sheet. As of October 1, 2016, the Company had an estimated $3.1 billion in undiscounted futureminimum lease commitments. The Company is currently assessing the impact of the new guidance on its financial statements. The guidance is required to beadopted retrospectively, and is effective beginning in the first quarter of the Company’s 2020 fiscal year (with early adoption permitted).
18

THE WALT DISNEY COMPANYNOTES TO CONDENSED CONSOLIDATED FINANCIAL STATEMENTS
(unaudited; tabular dollars in millions, except for per share data)
Revenue from Contracts with CustomersIn May 2014, the FASB issued guidance that replaces the existing accounting standards for revenue recognition with a single comprehensive five-step
model, eliminating industry-specific accounting rules. The core principle is to recognize revenue upon the transfer of goods or services to customers at an amountthat reflects the consideration expected to be received. Since its issuance, the FASB has amended several aspects of the new guidance, including provisions thataddress revenue recognition associated with the licensing of intellectual property. The new guidance, including the amendments, is effective beginning with thefirst quarter of the Company’s 2019 fiscal year (with early adoption permitted beginning fiscal year 2018). The guidance may be adopted either by restating allyears presented in the Company’s financial statements or by recording the impact of adoption as an adjustment to retained earnings at the beginning of the year ofadoption. We are continuing to assess the potential impact of this guidance, including the impact on those areas currently subject to industry-specific guidance suchas licensing of intellectual property. As part of our assessment, we are reviewing representative samples of customer contracts to determine the impact on revenuerecognition under the new guidance. Our method of adoption will in part be based on the degree of change identified in our assessment.
19
MANAGEMENT’S DISCUSSION AND ANALYSIS OFFINANCIAL CONDITION AND RESULTS OF OPERATIONS
Item 2: Management’s Discussion and Analysis of Financial Condition and Results of Operations
ORGANIZATION OF INFORMATIONManagement’s Discussion and Analysis provides a narrative of the Company’s financial performance and condition that should be read in conjunction with
the accompanying financial statements. It includes the following sections:
Consolidated Results and Non-segment ItemsSeasonalitySegment ResultsTax Impact of Employee Share-Based AwardsFinancial ConditionCommitments and ContingenciesOther MattersMarket Risk
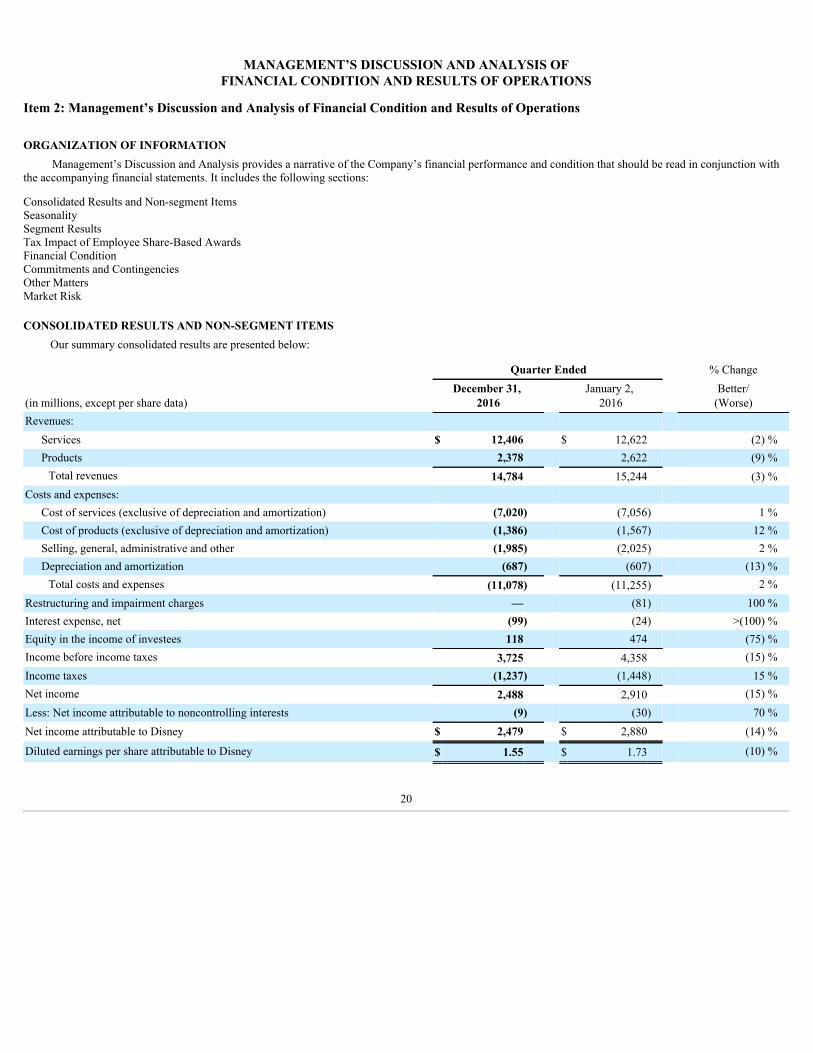
CONSOLIDATED RESULTS AND NON-SEGMENT ITEMSOur summary consolidated results are presented below:
Quarter Ended % Change
(in millions, except per share data)December 31,
2016 January 2,
2016 Better/
(Worse)Revenues:
Services $ 12,406 $ 12,622 (2) %Products 2,378 2,622 (9) %
Total revenues 14,784 15,244 (3) %Costs and expenses:
Cost of services (exclusive of depreciation and amortization) (7,020) (7,056) 1 %Cost of products (exclusive of depreciation and amortization) (1,386) (1,567) 12 %Selling, general, administrative and other (1,985) (2,025) 2 %Depreciation and amortization (687) (607) (13) %
Total costs and expenses (11,078) (11,255) 2 %Restructuring and impairment charges — (81) 100 %Interest expense, net (99) (24) >(100) %Equity in the income of investees 118 474 (75) %Income before income taxes 3,725 4,358 (15) %Income taxes (1,237) (1,448) 15 %Net income 2,488 2,910 (15) %Less: Net income attributable to noncontrolling interests (9) (30) 70 %Net income attributable to Disney $ 2,479 $ 2,880 (14) %
Diluted earnings per share attributable to Disney $ 1.55 $ 1.73 (10) %
20

MANAGEMENT’S DISCUSSION AND ANALYSIS OFFINANCIAL CONDITION AND RESULTS OF OPERATIONS — (continued)
Quarter Results
Revenues for the quarter decreased 3% , or $460 million , to $14.8 billion ; net income attributable to Disney decreased 14% , or $401 million , to $2.5billion ; and diluted earnings per share attributable to Disney (EPS) decreased 10% from $1.73 to $1.55 . The EPS decrease for the quarter was due to the ViceGain recognized in the prior-year quarter (see Note 3 to the Condensed Consolidated Financial Statements), lower operating results and higher net interest expense,partially offset by a decrease in weighted average shares outstanding as a result of our share repurchase program. Operating results reflected declines in the sale ofservices and products and were adversely impacted by foreign currency translation due to the movement of the U.S. dollar against major currencies including theimpact of our hedging program (FX Impact).
RevenuesService revenues for the quarter decreased 2% , or $216 million , to $12.4 billion , due to lower licensing revenue from merchandise and games, sales of
television programs, attendance at our domestic parks, advertising revenue and theatrical distribution revenues. These decreases were partially offset by the benefitof the opening of Shanghai Disney Resort in the prior-year third quarter, higher guest spending at our domestic parks and resorts and higher fees from Multi-channel Video Distributors (MVPDs) (Affiliate Fees). Service revenue reflected an approximate 1 percentage point decrease due to an unfavorable FX Impact.
Product revenues for the quarter decreased 9% , or $244 million , to $2.4 billion , due to the discontinuation of the Infinity business in the second quarter ofthe prior year and lower volumes at our home entertainment distribution and retail businesses. These decreases were partially offset by the benefit of the opening ofShanghai Disney Resort and higher guest spending at our domestic parks and resorts. Product revenue reflected an approximate 1 percentage point decrease due toan unfavorable FX Impact.
Costs and expensesCost of services for the quarter decreased 1% , or $36 million , to $7.0 billion , due to lower programming and production costs and lower film cost
amortization, partially offset by the impact of the opening of Shanghai Disney Resort.
Cost of products for the quarter decreased 12% , or $181 million , to $1.4 billion , due to the discontinuation of the Infinity business and lower retail andhome entertainment volumes, partially offset by the impact of the opening of Shanghai Disney Resort.
Selling, general, administrative and other costs decreased 2% , or $40 million , to $2.0 billion , due to the discontinuation of the Infinity business, partiallyoffset by higher theatrical marketing costs. Selling, general, administrative and other costs reflected an approximate 2 percentage point benefit due to a favorableFX Impact.
Depreciation and amortization costs increased 13% , or $80 million , to $0.7 billion , due to the opening of Shanghai Disney Resort.
Restructuring and impairment chargesThe Company recorded $81 million of restructuring and impairment charges in the prior-year quarter for an investment impairment and contract termination
and severance costs.
Interest expense, netInterest expense, net is as follows:
Quarter Ended
(in millions)December 31,
2016 January 2,
2016 % Change
Better/(Worse)Interest expense $ (121) $ (66) (83)%Interest and investment income 22 42 (48)%Interest expense, net $ (99) $ (24) >(100)%
The increase in interest expense was due to higher average debt balances, higher average interest rates and lower capitalized interest. Capitalized interest waslower due to the completion of the majority of construction at Shanghai Disney Resort in the prior-year third quarter.
The decrease in interest and investment income for the quarter was due to gains on sales of investments in the prior-year quarter.
21

MANAGEMENT’S DISCUSSION AND ANALYSIS OFFINANCIAL CONDITION AND RESULTS OF OPERATIONS — (continued)
Equity in the income of investeesEquity in the income of investees decreased $356 million to $118 million for the quarter due to the $332 million Vice
Gain ($0.13 of EPS in the prior-year quarter) (see Note 3 to the Condensed Consolidated Financial Statements).
Effective Income Tax Rate
Quarter Ended
December 31,
2016 January 2,
2016 Change
Better/(Worse)Effective income tax rate 33.2% 33.2% — ppt
The effective income tax rate for the quarter was comparable to the prior-year quarter as a favorable impact of an accounting change ($38 million) was offsetby an adverse impact of a tax law change ($34 million). In the current quarter, the Company adopted new accounting guidance, which requires that excess taxbenefits or tax deficiencies on employee share-based awards be included in “Income taxes” in the Condensed Consolidated Statement of Income. An excess taxbenefit arises when the value of employee share-based award on the exercise or vesting date is higher than the fair value on the grant date. A tax deficiency ariseswhen the value is lower than the fair value. These amounts were previously recorded in “Common stock” in the Condensed Consolidated Balance Sheet (see Note14 to the Condensed Consolidated Financial Statements).
Noncontrolling Interests
Quarter Ended
(in millions)December 31,
2016 January 2,
2016 % Change
Better/(Worse) Net income attributable to noncontrolling interests $ 9 $ 30 70%
The decrease in net income attributable to noncontrolling interests for the quarter was primarily due to lower net income at ESPN.
Net income attributable to noncontrolling interests is determined on income after royalties and management fees, financing costs and income taxes.
SEASONALITYThe Company’s businesses are subject to the effects of seasonality. Consequently, the operating results for the quarter ended December 31, 2016 for each
business segment, and for the Company as a whole, are not necessarily indicative of results to be expected for the full year.
Media Networks revenues are subject to seasonal advertising patterns, changes in viewership levels and timing of program sales. In general, advertisingrevenues are somewhat higher during the fall and somewhat lower during the summer months.
Parks and Resorts revenues fluctuate with changes in theme park attendance and resort occupancy resulting from the seasonal nature of vacation travel andleisure activities. Peak attendance and resort occupancy generally occur during the summer months when school vacations occur and during early-winter andspring-holiday periods.
Studio Entertainment revenues fluctuate due to the timing and performance of releases in the theatrical, home entertainment and television markets. Releasedates are determined by several factors, including competition and the timing of vacation and holiday periods.
Consumer Products & Interactive Media revenues are influenced by seasonal consumer purchasing behavior, which generally results in increased revenuesduring the Company’s first fiscal quarter, and the timing and performance of theatrical and game releases and cable programming broadcasts.
22
MANAGEMENT’S DISCUSSION AND ANALYSIS OFFINANCIAL CONDITION AND RESULTS OF OPERATIONS — (continued)
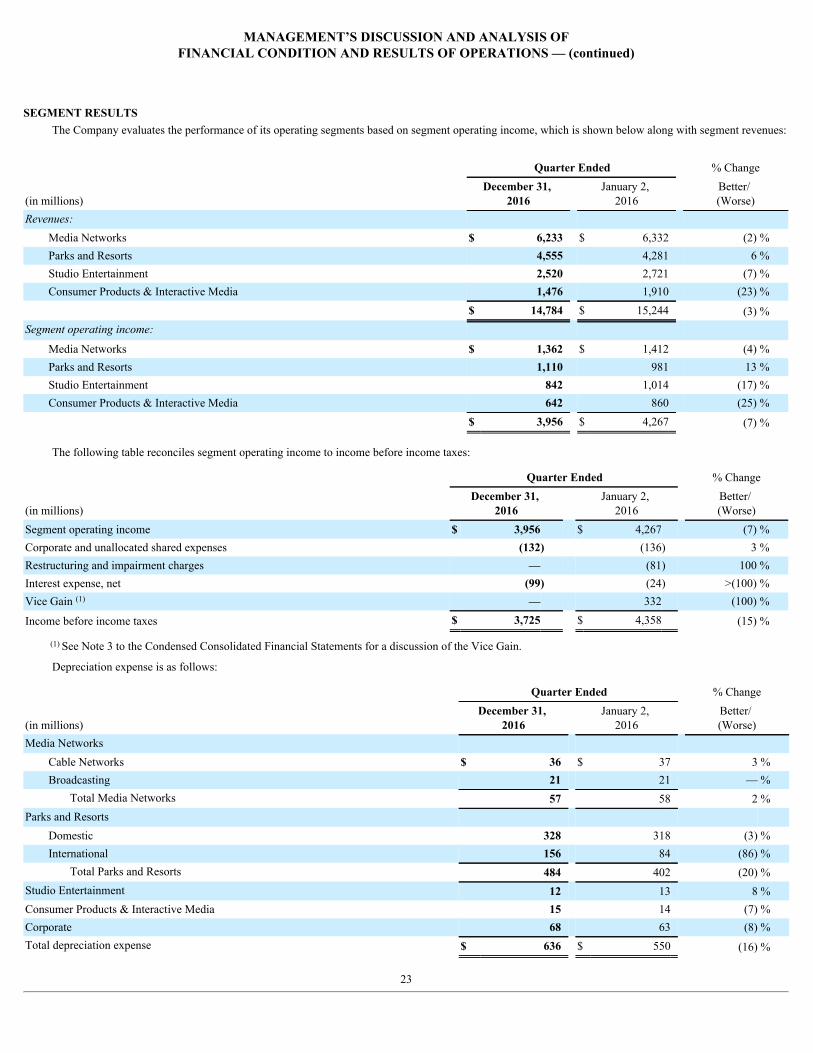
SEGMENT RESULTSThe Company evaluates the performance of its operating segments based on segment operating income, which is shown below along with segment revenues:
Quarter Ended % Change
(in millions)December 31,
2016 January 2,
2016 Better/ (Worse)
Revenues: Media Networks $ 6,233 $ 6,332 (2) %Parks and Resorts 4,555 4,281 6 %Studio Entertainment 2,520 2,721 (7) %Consumer Products & Interactive Media 1,476 1,910 (23) %
$ 14,784 $ 15,244 (3) %Segment operating income:
Media Networks $ 1,362 $ 1,412 (4) %Parks and Resorts 1,110 981 13 %Studio Entertainment 842 1,014 (17) %Consumer Products & Interactive Media 642 860 (25) %
$ 3,956 $ 4,267 (7) %
The following table reconciles segment operating income to income before income taxes:
Quarter Ended % Change
(in millions)December 31,
2016 January 2,
2016 Better/ (Worse)
Segment operating income $ 3,956 $ 4,267 (7) %Corporate and unallocated shared expenses (132) (136) 3 %Restructuring and impairment charges — (81) 100 %Interest expense, net (99) (24) >(100) %Vice Gain (1) — 332 (100) %
Income before income taxes $ 3,725 $ 4,358 (15) %
(1) See Note 3 to the Condensed Consolidated Financial Statements for a discussion of the Vice Gain.
Depreciation expense is as follows:
Quarter Ended % Change
(in millions)December 31,
2016 January 2,
2016 Better/ (Worse)
Media Networks Cable Networks $ 36 $ 37 3 %Broadcasting 21 21 — %
Total Media Networks 57 58 2 %Parks and Resorts
Domestic 328 318 (3) %International 156 84 (86) %
Total Parks and Resorts 484 402 (20) %Studio Entertainment 12 13 8 %Consumer Products & Interactive Media 15 14 (7) %Corporate 68 63 (8) %Total depreciation expense $ 636 $ 550 (16) %
23

MANAGEMENT’S DISCUSSION AND ANALYSIS OFFINANCIAL CONDITION AND RESULTS OF OPERATIONS — (continued)
Amortization of intangible assets is as follows:
Quarter Ended % Change
(in millions)December 31,
2016 January 2,
2016 Better/ (Worse)
Media Networks $ 2 $ 5 60 %Parks and Resorts 1 1 — %Studio Entertainment 16 20 20 %Consumer Products & Interactive Media 32 31 (3) %
Total amortization of intangible assets $ 51 $ 57 11 %
Media NetworksOperating results for the Media Networks segment are as follows:
Quarter Ended % Change
(in millions)December 31,
2016 January 2,
2016 Better/ (Worse)
Revenues Affiliate fees $ 3,075 $ 2,960 4 %Advertising 2,529 2,619 (3) %TV/SVOD distribution and other 629 753 (16) %
Total revenues 6,233 6,332 (2) %Operating expenses (4,298) (4,355) 1 %Selling, general, administrative and other (633) (644) 2 %Depreciation and amortization (59) (63) 6 %Equity in the income of investees 119 142 (16) %Operating Income $ 1,362 $ 1,412 (4) %
RevenuesThe increase in affiliate fees was due to growth of 7% from higher contractual rates, partially offset by decreases of 2% from fewer subscribers and 1% from
an unfavorable FX Impact.The decrease in advertising revenues was due to a decrease of $81 million at Cable Networks, from $1,488 million to $1,407 million and a decrease of $9
million at Broadcasting, from $1,131 million to $1,122 million . The decrease at Cable Networks was due to a 5% decrease from lower impressions, partially offsetby a 1% increase from higher rates, both of which were negatively impacted by the shift in timing of College Football Playoff (CFP) bowl games relative to ourfiscal quarter end. Six CFP games were aired in the first quarter of the prior year, whereas three CFP games were aired in the current quarter. Lower impressionsreflected a decrease in average viewership, partially offset by an increase in units delivered. Broadcasting advertising revenues reflected an 11% decrease fromlower impressions and a 2% decrease from other advertising, partially offset by a 12% increase from higher rates at the ABC Television Network and the ownedtelevision stations. The decrease in impressions was due to lower average viewership and, to a lesser extent, fewer network units delivered, which reflected theimpact of higher political coverage. The increase in rates at the owned television stations was due to higher political advertising.
TV/SVOD distribution and other revenue decreased $124 million , from $753 million to $629 million due to the sale of Jessica Jones in the prior-yearquarter, lower sales of cable programs in the current quarter and an unfavorable FX Impact, partially offset by higher sales of ABC programs in the current quarter.
Costs and ExpensesOperating expenses include programming and production costs, which decreased $48 million , from $4,059 million to $4,011 million . At Broadcasting,
programming and production costs decreased $82 million due to the impact of lower program sales and a decrease in cost write-downs for network programming.At Cable Networks, programming and production costs increased $34 million due to contractual rate increases for NBA, NFL and CFP programming, partiallyoffset by the timing of CFP games and the impact of lower program sales.
Selling, general, administrative and other costs decreased $11 million , from $644 million to $633 million due to a favorable FX Impact.
24

MANAGEMENT’S DISCUSSION AND ANALYSIS OFFINANCIAL CONDITION AND RESULTS OF OPERATIONS — (continued)
Equity in the Income of InvesteesIncome from equity investees decreased $23 million , from $142 million to $119 million . Approximately half of the decrease was due to lower equity
income from A+E Television Networks (A+E) and approximately half of the decrease was due to equity losses from BAMTech, which was acquired in August2016. The decrease at A+E was due to lower advertising revenue and higher programming costs, partially offset by higher affiliate fees and lower intangibleamortization. The decrease also reflected a negative impact from the conversion of the H2 channel to Viceland in November 2015. Results at Hulu werecomparable to the prior-year quarter.
Segment Operating Income
Segment operating income decreased $50 million , to $1,362 million due to a decrease at ESPN and lower income from equity investees, partially offset byincreases at the ABC Television Network and the owned television stations.
The following table provides supplemental revenue and segment operating income detail for the Media Networks segment:
Quarter Ended % Change
(in millions)December 31,
2016 January 2,
2016 Better/ (Worse)
Revenues Cable Networks $ 4,428 $ 4,521 (2) %Broadcasting 1,805 1,811 — %
$ 6,233 $ 6,332 (2) %Segment operating income
Cable Networks $ 864 $ 975 (11) %Broadcasting 379 295 28 %Equity in the income of investees 119 142 (16) %
$ 1,362 $ 1,412 (4) %
Restructuring and impairment charges
The Company recorded restructuring and impairment charges of $81 million related to Media Networks in the first quarter of fiscal 2016 for an investmentimpairment and contract termination and severance costs.
Parks and ResortsOperating results for the Parks and Resorts segment are as follows:
Quarter Ended % Change
(in millions)December 31,
2016 January 2,
2016 Better/ (Worse)
Revenues Domestic $ 3,740 $ 3,674 2 %International 815 607 34 %
Total revenues 4,555 4,281 6 %Operating expenses (2,547) (2,475) (3) %Selling, general, administrative and other (411) (422) 3 %Depreciation and amortization (485) (403) (20) %Equity in the loss of investees (2) — nmOperating Income $ 1,110 $ 981 13 %
RevenuesParks and Resorts revenues increased 6% , or $274 million , to $4.6 billion due to increase s of $208 million at our international operations and $66 million
at our domestic operations. Revenues were unfavorably impacted by Hurricane Matthew at our domestic operations and a shift in the timing of the New Year’sholiday relative to our fiscal periods.
25

MANAGEMENT’S DISCUSSION AND ANALYSIS OFFINANCIAL CONDITION AND RESULTS OF OPERATIONS — (continued)
Revenue growth at our international operations reflected an increase of 33% from the opening of Shanghai Disney Resort in the prior-year third quarter andthe benefit of a full period of operations at Disneyland Paris as the park was closed for four days in the prior-year quarter.
Revenue growth at our domestic operations reflected a 4% increase from higher average guest spending, partially offset by a 3% decrease from lowervolumes. Guest spending growth was due to higher average ticket prices for admissions to our theme parks and sailings at our cruise line, increased food andbeverage spending and higher average daily rates at our hotels. Lower volumes were due to decreases in attendance and occupied room nights. The decrease inattendance reflected the prior-year benefit of the 60th Anniversary celebration at Disneyland Resort, the impact in the current quarter from Hurricane Matthew atWalt Disney World Resort and the impact of the New Year’s holiday shift.
The following table presents supplemental park and hotel statistics:
Domestic International (2) Total
Quarter Ended Quarter Ended Quarter Ended
Dec. 31,
2016 Jan. 2, 2016
Dec. 31, 2016
Jan. 2, 2016
Dec. 31, 2016
Jan. 2, 2016
Parks Increase/(decrease) Attendance (5) % 10% 50 % (7) % 6% 6%Per Capita Guest Spending 7 % 7% (3) % 5 % 2% 7%
Hotels (1) Occupancy 91 % 92% 79 % 77 % 88% 89%Available Room Nights (in
thousands) 2,569 2,608 731 620 3,300 3,228Per Room Guest Spending $324 $314 $289 $281 $317 $309
(1) Per room guest spending consists of the average daily hotel room rate, as well as guest spending on food, beverage and merchandise at the hotels. Hotelstatistics include rentals of Disney Vacation Club units.
(2) Per capita guest spending growth rate is stated on a constant currency basis. Per room guest spending is stated at the fiscal 2016 first quarter averageforeign exchange rate. The euro to U.S. dollar weighted average foreign currency exchange rate was $1.08 and $1.10 for the quarters ended December 31,2016 and January 2, 2016 , respectively.
Costs and ExpensesOperating expenses include operating labor, which increased $40 million , from $1,162 million to $1,202 million , infrastructure costs, which decreased $1
million , from $463 million to $462 million and cost of sales, which increased $8 million , from $411 million to $419 million . The increase in operating labor wasprimarily due to the opening of Shanghai Disney Resort and inflation, partially offset by efficiency initiatives. The increase in cost of sales was due to the openingof Shanghai Disney Resort. Infrastructure costs were flat as decreases due to efficiency initiatives and lower dry-dock expenses were offset by increased costs dueto the opening of Shanghai Disney Resort and inflation. A portion of the dry-dock costs for the Disney Wonder were incurred in the current quarter whereas all ofthe dry-dock costs for the Disney Dream were incurred in the prior-year first quarter. Other operating expenses, which include costs for items such as supplies,commissions and entertainment offerings, increased due to the opening of Shanghai Disney Resort.
The increase in depreciation and amortization was due to the opening of Shanghai Disney Resort.
Segment Operating IncomeSegment operating income increased 13% , or $129 million , to $1.1 billion due to growth at our domestic and international operations.
26
MANAGEMENT’S DISCUSSION AND ANALYSIS OFFINANCIAL CONDITION AND RESULTS OF OPERATIONS — (continued)
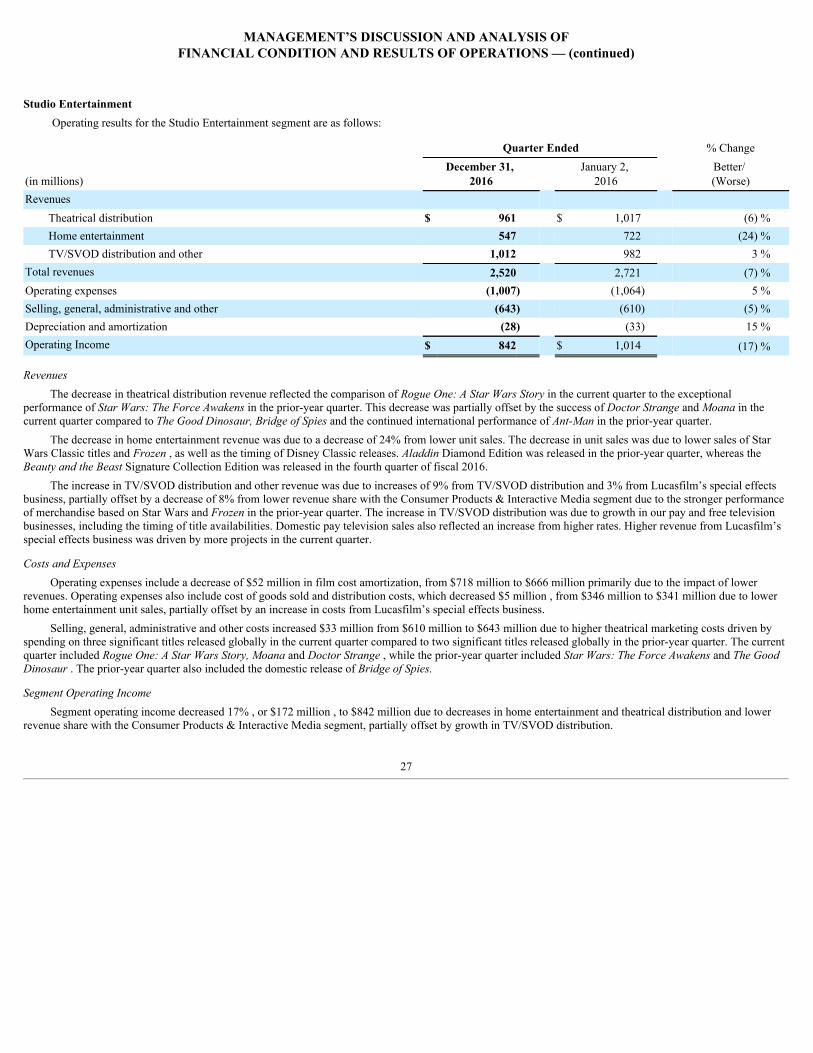
Studio EntertainmentOperating results for the Studio Entertainment segment are as follows:
Quarter Ended % Change
(in millions)December 31,
2016 January 2,
2016 Better/ (Worse)
Revenues Theatrical distribution $ 961 $ 1,017 (6) %Home entertainment 547 722 (24) %TV/SVOD distribution and other 1,012 982 3 %
Total revenues 2,520 2,721 (7) %Operating expenses (1,007) (1,064) 5 %Selling, general, administrative and other (643) (610) (5) %Depreciation and amortization (28) (33) 15 %Operating Income $ 842 $ 1,014 (17) %
RevenuesThe decrease in theatrical distribution revenue reflected the comparison of Rogue One: A Star Wars Story in the current quarter to the exceptional
performance of Star Wars: The Force Awakens in the prior-year quarter. This decrease was partially offset by the success of Doctor Strange and Moana in thecurrent quarter compared to The Good Dinosaur, Bridge of Spies and the continued international performance of Ant-Man in the prior-year quarter.
The decrease in home entertainment revenue was due to a decrease of 24% from lower unit sales. The decrease in unit sales was due to lower sales of StarWars Classic titles and Frozen , as well as the timing of Disney Classic releases. Aladdin Diamond Edition was released in the prior-year quarter, whereas theBeauty and the Beast Signature Collection Edition was released in the fourth quarter of fiscal 2016.
The increase in TV/SVOD distribution and other revenue was due to increases of 9% from TV/SVOD distribution and 3% from Lucasfilm’s special effectsbusiness, partially offset by a decrease of 8% from lower revenue share with the Consumer Products & Interactive Media segment due to the stronger performanceof merchandise based on Star Wars and Frozen in the prior-year quarter. The increase in TV/SVOD distribution was due to growth in our pay and free televisionbusinesses, including the timing of title availabilities. Domestic pay television sales also reflected an increase from higher rates. Higher revenue from Lucasfilm’sspecial effects business was driven by more projects in the current quarter.
Costs and ExpensesOperating expenses include a decrease of $52 million in film cost amortization, from $718 million to $666 million primarily due to the impact of lower
revenues. Operating expenses also include cost of goods sold and distribution costs, which decreased $5 million , from $346 million to $341 million due to lowerhome entertainment unit sales, partially offset by an increase in costs from Lucasfilm’s special effects business.
Selling, general, administrative and other costs increased $33 million from $610 million to $643 million due to higher theatrical marketing costs driven byspending on three significant titles released globally in the current quarter compared to two significant titles released globally in the prior-year quarter. The currentquarter included Rogue One: A Star Wars Story, Moana and Doctor Strange , while the prior-year quarter included Star Wars: The Force Awakens and The GoodDinosaur . The prior-year quarter also included the domestic release of Bridge of Spies.
Segment Operating IncomeSegment operating income decreased 17% , or $172 million , to $842 million due to decreases in home entertainment and theatrical distribution and lower
revenue share with the Consumer Products & Interactive Media segment, partially offset by growth in TV/SVOD distribution.
27
MANAGEMENT’S DISCUSSION AND ANALYSIS OFFINANCIAL CONDITION AND RESULTS OF OPERATIONS — (continued)
Consumer Products & Interactive MediaOperating results for the Consumer Products & Interactive Media segment are as follows:
Quarter Ended % Change
(in millions)December 31,
2016 January 2,
2016 Better/ (Worse)
Revenues Licensing, publishing and games $ 936 $ 1,300 (28) %Retail and other 540 610 (11) %
Total revenues 1,476 1,910 (23) %Operating expenses (554) (729) 24 %Selling, general, administrative and other (234) (276) 15 %Depreciation and amortization (47) (45) (4) %Equity in the income of investees 1 — nmOperating Income $ 642 $ 860 (25) %
RevenuesThe decrease in licensing, publishing and games revenue was due to decreases of 15% from our games business and 11% from our merchandise licensing
business. Lower games revenue was due to the discontinuation of the Infinity business in the second quarter of the prior year and decreased licensing revenue fromStar Wars: Battlefront, which was released in the prior-year quarter, partially offset by higher minimum guarantee shortfall recognition. Lower merchandiselicensing revenue was due to higher revenue in the prior-year quarter from merchandise based on Star Wars and Frozen and an unfavorable FX Impact, partiallyoffset by higher minimum guarantee shortfall recognition.
The decrease in retail and other revenue was driven by a decrease of 11% from our retail business due to lower comparable store and online sales, reflectinghigher sales of Frozen and Star Wars merchandise in the prior-year quarter. This decrease was partially offset by sales of Moana merchandise in the currentquarter.
Costs and Expenses
Operating expenses include a $147 million decrease in cost of goods sold and distribution costs, from $489 million to $342 million , a $7 million decrease inlabor and occupancy costs, from $141 million to $134 million and an $18 million decrease in product development expense, from $79 million to $61 million . Thedecrease in cost of goods sold and distribution costs was due to the discontinuation of Infinity and lower retail sales. The decrease in product development expensewas due to the discontinuation of Infinity.
Selling, general, administrative and other costs decreased $42 million from $276 million to $234 million primarily due to the discontinuation of Infinity.
Segment Operating IncomeSegment operating income decreased 25% , or $218 million, to $642 million , due to lower results at our merchandise licensing, games and retail businesses.
TAX IMPACT OF EMPLOYEE SHARE-BASED AWARDS
As disclosed in Note 14 to the Condensed Consolidated Financial Statements, the Company adopted new accounting guidance in the current quarter withrespect to the tax impacts (i.e. excess tax benefits or tax deficiencies) associated with employee share-based awards. For the current quarter, the Companyrecognized $38 million of excess tax benefits in “Income Taxes” in the Condensed Consolidated Statement of Income. Based on expectedvesting/forfeiture/exercise of employee awards over the remainder of the year, we estimate that for fiscal 2017 we will recognize approximately $150 million ofexcess tax benefits in “Income Taxes”. We expect that the majority of this impact will occur in the first half of the fiscal year. The market price of Companycommon stock and actual exercise decisions of employee option holders will determine the actual excess tax benefits and, accordingly, the excess tax benefit thatwe recognize may be different than this estimate.
28

MANAGEMENT’S DISCUSSION AND ANALYSIS OFFINANCIAL CONDITION AND RESULTS OF OPERATIONS — (continued)
FINANCIAL CONDITIONThe change in cash and cash equivalents is as follows:
Quarter Ended % Change Better/ (Worse)(in millions)
December 31, 2016
January 2, 2016
Cash provided by operations $ 1,260 $ 2,456 (49) %Cash used in investing activities (1,035) (1,798) 42 %Cash used in financing activities (987) (562) (76) %Impact of exchange rates on cash and cash equivalents (112) (64) (75) %Change in cash and cash equivalents $ (874) $ 32 nm
Operating ActivitiesCash provided by operating activities decreased 49% to $1.3 billion for the current quarter compared to $2.5 billion in the prior-year quarter due to an
increase in contributions to the Company’s pension plans.
Film and Television CostsThe Company’s Studio Entertainment and Media Networks segments incur costs to acquire and produce feature film and television programming. Film and
television production costs include all internally produced content such as live-action and animated feature films, animated direct-to-video programming, televisionseries, television specials, theatrical stage plays or other similar product. Programming costs include film or television product licensed for a specific period fromthird parties for airing on the Company’s broadcast and cable networks and television stations. Programming assets are generally recorded when the programmingbecomes available to us with a corresponding increase in programming liabilities. Accordingly, we analyze our programming assets net of the related liability.
The Company’s film and television production and programming activity for the quarter s ended December 31, 2016 and January 2, 2016 are as follows:
Quarter Ended
(in millions)December 31,
2016 January 2,
2016Beginning balances:
Production and programming assets $ 7,547 $ 7,353Programming liabilities (1,063) (989)
6,484 6,364Spending:
Television program licenses and rights 2,031 1,767Film and television production 1,275 1,231
3,306 2,998Amortization:
Television program licenses and rights (2,728) (2,558)Film and television production (1,018) (1,145)
(3,746) (3,703)
Change in film and television production and programming costs (440) (705)Other non-cash activity (36) 13Ending balances:
Production and programming assets 7,393 7,141Programming liabilities (1,385) (1,469)
$ 6,008 $ 5,672
29

MANAGEMENT’S DISCUSSION AND ANALYSIS OFFINANCIAL CONDITION AND RESULTS OF OPERATIONS — (continued)
Investing ActivitiesInvesting activities consist principally of investments in parks, resorts and other property and acquisition and divestiture activity. The Company’s
investments in parks, resorts and other property for the quarter s ended December 31, 2016 and January 2, 2016 are as follows:
Quarter Ended
(in millions)December 31,
2016 January 2,
2016Media Networks
Cable Networks $ 46 $ 27Broadcasting 22 30
Total Media Networks 68 57Parks and Resorts
Domestic 609 627International 291 607
Total Parks and Resorts 900 1,234Studio Entertainment 27 27Consumer Products & Interactive Media 6 13Corporate 39 75
$ 1,040 $ 1,406
Capital expenditures for the Parks and Resorts segment are principally for theme park and resort expansion, new attractions, cruise ships, capitalimprovements and systems infrastructure. The decrease at our international parks and resorts was due to lower spending for Shanghai Disney Resort.
Capital expenditures at Media Networks primarily reflect investments in facilities and equipment for expanding and upgrading broadcast centers, productionfacilities and television station facilities.
Capital expenditures at Corporate primarily reflect investments in corporate facilities, information technology infrastructure and equipment.
The Company currently expects its fiscal 2017 capital expenditures will be approximately $0.4 billion higher than fiscal 2016 capital expenditures of $4.8billion primarily due to increased investments at our domestic parks and resorts partially offset by decreased investments at our international parks and resorts.
Other Investing Activities
During the prior-year quarter , acquisitions reflected $400 million for an 11% interest in Vice.
Financing ActivitiesCash used in financing activities was $1.0 billion in the current quarter , which reflected repurchases of common stock of $1.5 billion partially offset by net
cash inflows from borrowings of $0.6 billion .Cash used in financing activities of $1.0 billion was $0.4 billion more than the $0.6 billion used in the prior-year quarter . The increase from the prior-year
quarter reflected lower borrowings of $1.1 billion ($0.6 billion in the current quarter compared to $1.7 billion in the prior-year quarter). These impacts werepartially offset by the benefit of lower common stock repurchases of $0.9 billion ( $1.5 billion in the current quarter compared to $2.4 billion in the prior-yearquarter).
See Note 4 to the Condensed Consolidated Financial Statements for a summary of the Company’s borrowing activities during the quarter endedDecember 31, 2016 and information regarding the Company’s bank facilities. The Company may use commercial paper borrowings up to the amount of its unusedbank facilities, in conjunction with term debt issuance and operating cash flow, to retire or refinance other borrowings before or as they come due.
See Note 8 to the Condensed Consolidated Financial Statements for a summary of the Company’s dividends in fiscal 2017 and 2016 and share repurchasesduring the quarter ended December 31, 2016 .
We believe that the Company’s financial condition is strong and that its cash balances, other liquid assets, operating cash flows, access to debt and equitycapital markets and borrowing capacity, taken together, provide adequate resources to fund
30
MANAGEMENT’S DISCUSSION AND ANALYSIS OFFINANCIAL CONDITION AND RESULTS OF OPERATIONS — (continued)
ongoing operating requirements and future capital expenditures related to the expansion of existing businesses and development of new projects. However, theCompany’s operating cash flow and access to the capital markets can be impacted by macroeconomic factors outside of its control. In addition to macroeconomicfactors, the Company’s borrowing costs can be impacted by short- and long-term debt ratings assigned by nationally recognized rating agencies, which are based,in significant part, on the Company’s performance as measured by certain credit metrics such as interest coverage and leverage ratios. As of December 31, 2016 ,Moody’s Investors Service’s long- and short-term debt ratings for the Company were A2 and P-1, respectively, with stable outlook; Standard & Poor’s long- andshort-term debt ratings for the Company were A and A-1, respectively, with stable outlook; and Fitch’s long- and short-term debt ratings for the Company were Aand F1, respectively, with stable outlook. The Company’s bank facilities contain only one financial covenant, relating to interest coverage, which the Company meton December 31, 2016 by a significant margin. The Company’s bank facilities also specifically exclude certain entities, including the International Theme Parks,from any representations, covenants or events of default.
COMMITMENTS AND CONTINGENCIESLegal Matters
As disclosed in Note 10 to the Condensed Consolidated Financial Statements, the Company has exposure for certain legal matters.
GuaranteesSee Note 10 to the Condensed Consolidated Financial Statements for information regarding the Company’s guarantees.
Tax MattersAs disclosed in Note 9 to the Consolidated Financial Statements in the 2016 Annual Report on Form 10-K, the Company has exposure for certain tax
matters.
Contractual CommitmentsSee Note 14 to the Consolidated Financial Statements in the 2016 Annual Report on Form 10-K for information regarding the Company’s contractual
commitments.
OTHER MATTERSAccounting Policies and Estimates
We believe that the application of the following accounting policies, which are important to our financial position and results of operations requiresignificant judgments and estimates on the part of management. For a summary of our significant accounting policies, including the accounting policies discussedbelow, see Note 2 to the Consolidated Financial Statements in the 2016 Annual Report on Form 10-K.
Film and Television Revenues and CostsWe expense film and television production, participation and residual costs over the applicable product life cycle based upon the ratio of the current period’s
revenues to the estimated remaining total revenues (Ultimate Revenues) for each production. If our estimate of Ultimate Revenues decreases, amortization of filmand television costs may be accelerated. Conversely, if our estimate of Ultimate Revenues increases, film and television cost amortization may be slowed. For filmproductions, Ultimate Revenues include revenues from all sources that will be earned within ten years from the date of the initial theatrical release. For televisionseries, Ultimate Revenues include revenues that will be earned within ten years from delivery of the first episode, or if still in production, five years from deliveryof the most recent episode, if later.
With respect to films intended for theatrical release, the most sensitive factor affecting our estimate of Ultimate Revenues (and therefore affecting future filmcost amortization and/or impairment) is theatrical performance. Revenues derived from other markets subsequent to the theatrical release (e.g., the homeentertainment or television markets) have historically been highly correlated with the theatrical performance. Theatrical performance varies primarily based uponthe public interest and demand for a particular film, the popularity of competing films at the time of release and the level of marketing effort. Upon a film’s releaseand determination of the theatrical performance, the Company’s estimates of revenues from succeeding windows and markets are revised based on historicalrelationships and an analysis of current market trends. The most sensitive factor affecting our estimate of Ultimate Revenues for released films is the level ofexpected home entertainment sales. Home
31

MANAGEMENT’S DISCUSSION AND ANALYSIS OFFINANCIAL CONDITION AND RESULTS OF OPERATIONS — (continued)
entertainment sales vary based on the number and quality of competing home entertainment products, as well as the manner in which retailers market and price ourproducts.
With respect to television series or other television productions intended for broadcast, the most sensitive factors affecting estimates of Ultimate Revenuesare program ratings and the strength of the advertising market. Program ratings, which are an indication of market acceptance, directly affect the Company’s abilityto generate advertising revenues during the airing of the program. In addition, television series with greater market acceptance are more likely to generateincremental revenues through the licensing of program rights worldwide to television distributors, SVOD services and in home entertainment formats.Alternatively, poor ratings may result in cancellation of the program, which would require an immediate write-down of any unamortized production costs. Asignificant decline in the advertising market would also negatively impact our estimates.
We expense the cost of television broadcast rights for acquired series, movies and other programs based on the number of times the program is expected tobe aired or on a straight-line basis over the useful life, as appropriate. Amortization of those television programming assets being amortized on a number of airingsbasis may be accelerated if we reduce the estimated future airings and slowed if we increase the estimated future airings. The number of future airings of aparticular program is impacted primarily by the program’s ratings in previous airings, expected advertising rates and availability and quality of alternativeprogramming. Accordingly, planned usage is reviewed periodically and revised if necessary. We amortize rights costs for multi-year sports programmingarrangements during the applicable seasons based on the estimated relative value of each year in the arrangement. The estimated value of each year is based on ourprojections of revenues over the contract period, which include advertising revenue and an allocation of affiliate revenue. If the annual contractual paymentsrelated to each season approximate each season’s estimated relative value, we expense the related contractual payments during the applicable season. If plannedusage patterns or estimated relative values by year were to change significantly, amortization of our sports rights costs may be accelerated or slowed.
Costs of film and television productions are subject to regular recoverability assessments, which compare the estimated fair values with the unamortizedcosts. The net realizable values of television broadcast program licenses and rights are reviewed using a daypart methodology. A daypart is defined as anaggregation of programs broadcast during a particular time of day or programs of a similar type. The Company’s dayparts are: primetime, daytime, late night, newsand sports (includes broadcast and cable networks). The net realizable values of other cable programming assets are reviewed on an aggregated basis for each cablenetwork. Individual programs are written off when there are no plans to air or sublicense the program. Estimated values are based upon assumptions about futuredemand and market conditions. If actual demand or market conditions are less favorable than our projections, film, television and programming cost write-downsmay be required.
Revenue RecognitionThe Company has revenue recognition policies for its various operating segments that are appropriate to the circumstances of each business. See Note 2 to
the Consolidated Financial Statements in the 2016 Annual Report on Form 10-K for a summary of these revenue recognition policies.
We reduce home entertainment revenues for estimated future returns of merchandise and for customer programs and sales incentives. These estimates arebased upon historical return experience, current economic trends and projections of customer demand for and acceptance of our products. If we underestimate thelevel of returns or sales incentives in a particular period, we may record less revenue in later periods when returns or sales incentives exceed the estimated amount.Conversely, if we overestimate the level of returns or sales incentives for a period, we may have additional revenue in later periods when returns or sales incentivesare less than estimated.
We recognize revenues from advance theme park ticket sales when the tickets are used. We recognize revenues from expiring multi-use tickets ratably overthe estimated usage period. The estimated usage periods are derived from historical usage patterns. If actual usage is different than our estimated usage, revenuesmay not be recognized in the periods the related services are rendered. In addition, a change in usage patterns would impact the timing of revenue recognition.
Pension and Postretirement Medical Plan Actuarial AssumptionsThe Company’s pension and postretirement medical benefit obligations and related costs are calculated using a number of actuarial assumptions. Two critical
assumptions, the discount rate and the expected return on plan assets, are important elements of expense and/or liability measurement, which we evaluate annually.Refer to the 2016 Annual Report on Form 10-K for estimated impacts of changes in these assumptions. Other assumptions include the healthcare cost trend rateand employee demographic factors such as retirement patterns, mortality, turnover and rate of compensation increase.
32

MANAGEMENT’S DISCUSSION AND ANALYSIS OFFINANCIAL CONDITION AND RESULTS OF OPERATIONS — (continued)
The discount rate enables us to state expected future cash payments for benefits as a present value on the measurement date. A lower discount rate increasesthe present value of benefit obligations and increases pension expense. The guideline for setting this rate is a high-quality long-term corporate bond rate. TheCompany’s discount rate was determined by considering yield curves constructed of a large population of high-quality corporate bonds and reflects the matching ofthe plans’ liability cash flows to the yield curves.
To determine the expected long-term rate of return on the plan assets, we consider the current and expected asset allocation, as well as historical andexpected returns on each plan asset class. A lower expected rate of return on pension plan assets will increase pension expense.
Goodwill, Other Intangible Assets, Long-Lived Assets and InvestmentsThe Company is required to test goodwill and other indefinite-lived intangible assets for impairment on an annual basis and if current events or
circumstances require, on an interim basis. Goodwill is allocated to various reporting units, which are generally an operating segment or one level below theoperating segment. The Company compares the fair value of each reporting unit to its carrying amount to determine if there is a potential goodwill impairment. Ifthe fair value of a reporting unit is less than its carrying value, an impairment loss is recorded to the extent that the fair value of the goodwill within the reportingunit is less than the carrying value of the goodwill.
To determine the fair value of our reporting units, we generally use a present value technique (discounted cash flows) corroborated by market multiples whenavailable and as appropriate. We apply what we believe to be the most appropriate valuation methodology for each of our reporting units. The discounted cash flowanalyses are sensitive to our estimates of future revenue growth and margins for these businesses. We include in the projected cash flows an estimate of therevenue we believe the reporting unit would receive if the intellectual property developed by the reporting unit that is being used by other reporting units waslicensed to an unrelated third party at its fair market value. These amounts are not necessarily the same as those included in segment operating results. We believeour estimates of fair value are consistent with how a marketplace participant would value our reporting units.
In times of adverse economic conditions in the global economy, the Company’s long-term cash flow projections are subject to a greater degree of uncertaintythan usual. If we had established different reporting units or utilized different valuation methodologies or assumptions, the impairment test results could differ, andwe could be required to record impairment charges.
The Company is required to compare the fair values of other indefinite-lived intangible assets to their carrying amounts. If the carrying amount of anindefinite-lived intangible asset exceeds its fair value, an impairment loss is recognized for the excess. Fair values of other indefinite-lived intangible assets aredetermined based on discounted cash flows or appraised values, as appropriate.
The Company tests long-lived assets, including amortizable intangible assets, for impairment whenever events or changes in circumstances (triggeringevents) indicate that the carrying amount may not be recoverable. Once a triggering event has occurred, the impairment test employed is based on whether theintent is to hold the asset for continued use or to hold the asset for sale. The impairment test for assets held for use requires a comparison of cash flows expected tobe generated over the useful life of an asset group to the carrying value of the asset group. An asset group is established by identifying the lowest level of cashflows generated by a group of assets that are largely independent of the cash flows of other assets and could include assets used across multiple businesses orsegments. If the carrying value of an asset group exceeds the estimated undiscounted future cash flows, an impairment would be measured as the differencebetween the fair value of the group’s long-lived assets and the carrying value of the group’s long-lived assets. The impairment is allocated to the long-lived assetsof the group on a pro rata basis using the relative carrying amounts, but only to the extent the carrying value of each asset is above its fair value. For assets held forsale, to the extent the carrying value is greater than the asset’s fair value less costs to sell, an impairment loss is recognized for the difference. Determining whethera long-lived asset is impaired requires various estimates and assumptions, including whether a triggering event has occurred, the identification of the asset groups,estimates of future cash flows and the discount rate used to determine fair values. If we had established different asset groups or utilized different valuationmethodologies or assumptions, the impairment test results could differ, and we could be required to record impairment charges.
The Company has cost and equity investments. The fair value of these investments is dependent on the performance of the investee companies, as well asvolatility inherent in the external markets for these investments. In assessing the potential impairment of these investments, we consider these factors, as well as theforecasted financial performance of the investees and market values, where available. If these forecasts are not met or market values indicate an other-than-temporary decline in value, impairment charges may be required.
33

MANAGEMENT’S DISCUSSION AND ANALYSIS OFFINANCIAL CONDITION AND RESULTS OF OPERATIONS — (continued)
Allowance for Doubtful AccountsWe evaluate our allowance for doubtful accounts and estimate collectability of accounts receivable based on our analysis of historical bad debt experience in
conjunction with our assessment of the financial condition of individual companies with which we do business. In times of domestic or global economic turmoil,our estimates and judgments with respect to the collectability of our receivables are subject to greater uncertainty than in more stable periods. If our estimate ofuncollectible accounts is too low, costs and expenses may increase in future periods, and if it is too high, costs and expenses may decrease in future periods.
Contingencies and LitigationWe are currently involved in certain legal proceedings and, as required, have accrued estimates of the probable and estimable losses for the resolution of
these proceedings. These estimates are based upon an analysis of potential results, assuming a combination of litigation and settlement strategies and have beendeveloped in consultation with outside counsel as appropriate. From time to time, we may also be involved in other contingent matters for which we have accruedestimates for a probable and estimable loss. It is possible, however, that future results of operations for any particular quarterly or annual period could be materiallyaffected by changes in our assumptions or the effectiveness of our strategies related to legal proceedings or our assumptions regarding other contingent matters.See Note 10 to the Condensed Consolidated Financial Statements for more detailed information on litigation exposure.
Income Tax AuditsAs a matter of course, the Company is regularly audited by federal, state and foreign tax authorities. From time to time, these audits result in proposed
assessments. Our determinations regarding the recognition of income tax benefits are made in consultation with outside tax and legal counsel, where appropriate,and are based upon the technical merits of our tax positions in consideration of applicable tax statutes and related interpretations and precedents and upon theexpected outcome of proceedings (or negotiations) with taxing and legal authorities. The tax benefits ultimately realized by the Company may differ from thoserecognized in our future financial statements based on a number of factors, including the Company’s decision to settle rather than litigate a matter, relevant legalprecedent related to similar matters and the Company’s success in supporting its filing positions with taxing authorities.
New Accounting PronouncementsSee Note 14 to the Condensed Consolidated Financial Statements for information regarding new accounting pronouncements.
MARKET RISKThe Company is exposed to the impact of interest rate changes, foreign currency fluctuations, commodity fluctuations and changes in the market values of its
investments.
Policies and ProceduresIn the normal course of business, we employ established policies and procedures to manage the Company’s exposure to changes in interest rates, foreign
currencies and commodities using a variety of financial instruments.
Our objectives in managing exposure to interest rate changes are to limit the impact of interest rate volatility on earnings and cash flows and to lower overallborrowing costs. To achieve these objectives, we primarily use interest rate swaps to manage net exposure to interest rate changes related to the Company’sportfolio of borrowings. By policy, the Company targets fixed-rate debt as a percentage of its net debt between minimum and maximum percentages.
Our objective in managing exposure to foreign currency fluctuations is to reduce volatility of earnings and cash flow in order to allow management to focuson core business issues and challenges. Accordingly, the Company enters into various contracts that change in value as foreign exchange rates change to protect theU.S. dollar equivalent value of its existing foreign currency assets, liabilities, commitments and forecasted foreign currency revenues and expenses. The Companyutilizes option strategies and forward contracts that provide for the purchase or sale of foreign currencies to hedge probable, but not firmly committed, transactions.The Company also uses forward and option contracts to hedge foreign currency assets and liabilities. The principal foreign currencies hedged are the euro, Britishpound, Japanese yen and Canadian dollar. Cross-currency swaps are used to effectively convert foreign currency denominated borrowings to U.S. dollardenominated borrowings. By policy, the Company maintains hedge coverage between minimum and maximum percentages of its forecasted foreign exchangeexposures generally for periods not to exceed four years. The gains and losses on these contracts offset changes in the U.S. dollar
34

MANAGEMENT’S DISCUSSION AND ANALYSIS OFFINANCIAL CONDITION AND RESULTS OF OPERATIONS — (continued)
equivalent value of the related exposures. The economic or political conditions in a country could reduce our ability to hedge exposure to currency fluctuations inthe country or our ability to repatriate revenue from the country.
Our objectives in managing exposure to commodity fluctuations are to use commodity derivatives to reduce volatility of earnings and cash flows arisingfrom commodity price changes. The amounts hedged using commodity swap contracts are based on forecasted levels of consumption of certain commodities, suchas fuel oil and gasoline.
It is the Company’s policy to enter into foreign currency and interest rate derivative transactions and other financial instruments only to the extent considerednecessary to meet its objectives as stated above. The Company does not enter into these transactions or any other hedging transactions for speculative purposes.
35
Item 3. Quantitative and Qualitative Disclosures about Market Risk.See Item 2. Management’s Discussion and Analysis of Financial Condition and Results of Operations.
Item 4. Controls and ProceduresEvaluation of Disclosure Controls and Procedures – We have established disclosure controls and procedures to ensure that the information required to be
disclosed by the Company in the reports that it files or submits under the Securities Exchange Act of 1934 is recorded, processed, summarized and reported withinthe time periods specified in SEC rules and forms and that such information is accumulated and made known to the officers who certify the Company’s financialreports and to other members of senior management and the Board of Directors as appropriate to allow timely decisions regarding required disclosure.
Based on their evaluation as of December 31, 2016 , the principal executive officer and principal financial officer of the Company have concluded that theCompany’s disclosure controls and procedures (as defined in Rules 13a-15(e) and 15d-15(e) under the Securities Exchange Act of 1934) are effective.
There have been no changes in our internal controls over financial reporting during the first quarter of fiscal 2017 that have materially affected, or arereasonably likely to materially affect, our internal control over financial reporting.
36
PART II. OTHER INFORMATION
ITEM 1. Legal ProceedingsAs disclosed in Note 10 to the Condensed Consolidated Financial Statements, the Company is engaged in certain legal matters, and the disclosure set forth in
Note 10 relating to certain legal matters is incorporated herein by reference.
ITEM 1A. Risk FactorsThe Private Securities Litigation Reform Act of 1995 (the Act) provides a safe harbor for “forward-looking statements” made by or on behalf of the
Company. We may from time to time make written or oral statements that are “forward-looking,” including statements contained in this report and other filingswith the Securities and Exchange Commission and in reports to our shareholders. All forward-looking statements are made on the basis of management’s viewsand assumptions regarding future events and business performance as of the time the statements are made and the Company does not undertake any obligation toupdate its disclosure relating to forward-looking matters. Actual results may differ materially from those expressed or implied. Such differences may result fromactions taken by the Company, including restructuring or strategic initiatives (including capital investments or asset acquisitions or dispositions), as well as fromdevelopments beyond the Company’s control, including: changes in domestic and global economic conditions, competitive conditions and consumer preferences;adverse weather conditions or natural disasters; health concerns; international, political or military developments; and technological developments. Suchdevelopments may affect entertainment, travel and leisure businesses generally and may, among other things, affect the performance of the Company’s theatricaland home entertainment releases, the advertising market for broadcast and cable television programming, demand for our products and services, expenses ofproviding medical and pension benefits and performance of some or all company businesses either directly or through their impact on those who distribute ourproducts. Additional factors are discussed in the 2016 Annual Report on Form 10-K under the Item 1A, “Risk Factors.”
37
ITEM 2. Unregistered Sales of Equity Securities and Use of ProceedsThe following table provides information about Company purchases of equity securities that are registered by the Company pursuant to Section 12 of the
Exchange Act during the quarter ended December 31, 2016 :
Period
TotalNumber of
SharesPurchased (1)
WeightedAverage
Price Paidper Share
Total Numberof Shares
Purchased asPart of Publicly
AnnouncedPlans or
Programs
MaximumNumber ofShares thatMay Yet BePurchasedUnder thePlans or
Programs (2)
October 2, 2016 – October 31, 2016 4,170,379 $ 92.21 4,141,500 278 millionNovember 1, 2016 – November 30, 2016 4,911,949 96.22 4,885,500 273 millionDecember 1, 2016 – December 31, 2016 5,998,579 102.59 5,974,000 267 millionTotal 15,080,907 97.64 15,001,000 267 million
(1) 79,907 shares were purchased on the open market to provide shares to participants in the Walt Disney Investment Plan (WDIP). These purchases were notmade pursuant to a publicly announced repurchase plan or program.
(2) Under a share repurchase program implemented effective June 10, 1998, the Company is authorized to repurchase shares of its common stock. OnJanuary 30, 2015, the Company’s Board of Directors increased the share repurchase authorization to a total of 400 million shares as of that date. Therepurchase program does not have an expiration date.
38

ITEM 6. ExhibitsSee Index of Exhibits.
39
SIGNATURE
Pursuant to the requirements of the Securities Exchange Act of 1934, the registrant has duly caused this report to be signed on its behalf by the undersignedthereunto duly authorized.
THE WALT DISNEY COMPANY (Registrant)
By: /s/ CHRISTINE M. MCCARTHY
Christine M. McCarthy,Senior Executive Vice President and Chief Financial Officer
February 7, 2017Burbank, California
40
INDEX OF EXHIBITS
Number and Description of Exhibit(Numbers Coincide with Item 601 of Regulation S-K)
Document Incorporated by Reference from aPrevious Filing or Filed Herewith, as Indicatedbelow
3.2
Amended and Restated Bylaws
Exhibit 3.2 to the Current Report onForm 8-K of the Company datedNovember 30, 2016.
12.1 Ratio of Earnings to Fixed Charges Filed herewith 31(a)
Rule 13a-14(a) Certification of Chief Executive Officer of the Company in accordance withSection 302 of the Sarbanes-Oxley Act of 2002
Filed herewith
31(b)
Rule 13a-14(a) Certification of Chief Financial Officer of the Company in accordance withSection 302 of the Sarbanes-Oxley Act of 2002
Filed herewith
32(a)
Section 1350 Certification of Chief Executive Officer of the Company in accordance withSection 906 of the Sarbanes-Oxley Act of 2002*
Furnished
32(b)
Section 1350 Certification of Chief Financial Officer of the Company in accordance withSection 906 of the Sarbanes-Oxley Act of 2002*
Furnished
101
The following materials from the Company’s Quarterly Report on Form 10-Q for the quarterended December 31, 2016 formatted in Extensible Business Reporting Language (XBRL):(i) the Condensed Consolidated Statements of Income, (ii) the Condensed ConsolidatedStatements of Comprehensive Income, (iii) the Condensed Consolidated Balance Sheets,(iv) the Condensed Consolidated Statements of Cash Flows, (v) the Condensed ConsolidatedStatements of Equity and (vi) related notes
Filed
* A signed original of this written statement required by Section 906 has been provided to the Company and will be retained by the Company and furnishedto the Securities and Exchange Commission or its staff upon request.
41

Exhibit 12.1
THE WALT DISNEY COMPANYRATIO OF EARNINGS TO FIXED CHARGES(AMOUNTS IN MILLIONS, EXCEPT RATIOS)
Quarter Ended Fiscal Year Ended
Dec. 31,
2016 Jan. 2, 2016 2016 2015 2014 2013 2012
EARNINGS Income from continuing operations before income taxes $ 3,725 $ 4,358 $ 14,868 $ 13,868 $ 12,246 $ 9,620 $ 9,260Equity in the income of investees (118) (474) (926) (814) (854) (688) (627)Cash distributions received from equity investees 203 206 799 752 718 694 663Interest expense, amortization of debt discounts and
premiums on all indebtedness and amortization ofcapitalized interest 139 86 433 325 360 415 525
Imputed interest on operating leases (1) 70 72 282 286 294 292 288TOTAL EARNINGS $ 4,019 $ 4,248 $ 15,456 $ 14,417 $ 12,764 $ 10,333 $ 10,109
FIXED CHARGES Interest expense and amortization of debt discounts and
premiums on all indebtedness $ 121 $ 66 $ 354 $ 265 $ 294 $ 349 $ 472Capitalized interest 21 34 139 110 73 77 92Imputed interest on operating leases (1) 70 72 282 286 294 292 288TOTAL FIXED CHARGES $ 212 $ 172 $ 775 $ 661 $ 661 $ 718 $ 852
RATIO OF EARNINGS TO FIXED CHARGES (2) 19.0 24.7 19.9 21.8 19.3 14.4 11.9 (1) The portion of operating rental expense which management believes is representative of the interest component of rent expense.
(2) The ratio does not adjust for interest on unrecognized tax benefits that are recorded as a component of income tax expense.
Exhibit 31(a)
RULE 13a-14(a) CERTIFICATION INACCORDANCE WITH SECTION 302
OF THE SARBANES-OXLEY ACT OF 2002
I, Robert A. Iger, Chairman and Chief Executive Officer of The Walt Disney Company (the “Company”), certify that:
1. I have reviewed this quarterly report on Form 10-Q of the Company;
2. Based on my knowledge, this report does not contain any untrue statement of a material fact or omit to state a material fact necessary to make thestatements made, in light of the circumstances under which such statements were made, not misleading with respect to the period covered by this report;
3. Based on my knowledge, the financial statements, and other financial information included in this report, fairly present in all material respects thefinancial condition, results of operations and cash flows of the registrant as of, and for, the periods presented in this report;
4. The registrant’s other certifying officer and I are responsible for establishing and maintaining disclosure controls and procedures (as defined in ExchangeAct Rules 13a-15(e) and 15d-15(e)) and internal control over financial reporting (as defined in Exchange Act Rules 13a-15(f) and 15d-15(f)) for theregistrant and have:
a) designed such disclosure controls and procedures, or caused such disclosure controls and procedures to be designed under our supervision, toensure that material information relating to the registrant, including its consolidated subsidiaries, is made known to us by others within thoseentities, particularly during the period in which this report is being prepared;
b) designed such internal control over financial reporting, or caused such internal control over financial reporting to be designed under oursupervision, to provide reasonable assurance regarding the reliability of financial reporting and the preparation of financial statements forexternal purposes in accordance with generally accepted accounting principles;
c) evaluated the effectiveness of the registrant’s disclosure controls and procedures and presented in this report our conclusions about theeffectiveness of the disclosure controls and procedures, as of the end of the period covered by this report based on such evaluation; and
d) disclosed in this report any change in the registrant’s internal control over financial reporting that occurred during the registrant’s most recentfiscal quarter (the registrant’s fourth fiscal quarter in the case of an annual report) that has materially affected, or is reasonably likely tomaterially affect, the registrant’s internal control over financial reporting; and
5. The registrant’s other certifying officer and I have disclosed, based on our most recent evaluation of internal control over financial reporting, to theregistrant’s auditors and the audit committee of the registrant’s board of directors (or persons performing the equivalent functions):
a) all significant deficiencies and material weaknesses in the design or operation of internal control over financial reporting which are reasonablylikely to adversely affect the registrant’s ability to record, process, summarize and report financial information; and
b) any fraud, whether or not material, that involves management or other employees who have a significant role in the registrant’s internal controlover financial reporting.
Date: February 7, 2017 By: /s/ ROBERT A. IGER Robert A. Iger Chairman and Chief Executive Officer
Exhibit 31(b)
RULE 13a-14(a) CERTIFICATION INACCORDANCE WITH SECTION 302
OF THE SARBANES-OXLEY ACT OF 2002
I, Christine M. McCarthy, Senior Executive Vice President and Chief Financial Officer of The Walt Disney Company (the “Company”), certify that:
1. I have reviewed this quarterly report on Form 10-Q of the Company;
2. Based on my knowledge, this report does not contain any untrue statement of a material fact or omit to state a material fact necessary to make thestatements made, in light of the circumstances under which such statements were made, not misleading with respect to the period covered by this report;
3. Based on my knowledge, the financial statements, and other financial information included in this report, fairly present in all material respects thefinancial condition, results of operations and cash flows of the registrant as of, and for, the periods presented in this report;
4. The registrant’s other certifying officer and I are responsible for establishing and maintaining disclosure controls and procedures (as defined in ExchangeAct Rules 13a-15(e) and 15d-15(e)) and internal control over financial reporting (as defined in Exchange Act Rules 13a-15(f) and 15d-15(f)) for theregistrant and have:
a) designed such disclosure controls and procedures, or caused such disclosure controls and procedures to be designed under our supervision, toensure that material information relating to the registrant, including its consolidated subsidiaries, is made known to us by others within thoseentities, particularly during the period in which this report is being prepared;
b) designed such internal control over financial reporting, or caused such internal control over financial reporting to be designed under oursupervision, to provide reasonable assurance regarding the reliability of financial reporting and the preparation of financial statements forexternal purposes in accordance with generally accepted accounting principles;
c) evaluated the effectiveness of the registrant’s disclosure controls and procedures and presented in this report our conclusions about theeffectiveness of the disclosure controls and procedures, as of the end of the period covered by this report based on such evaluation; and
d) disclosed in this report any change in the registrant’s internal control over financial reporting that occurred during the registrant’s most recentfiscal quarter (the registrant’s fourth fiscal quarter in the case of an annual report) that has materially affected, or is reasonably likely tomaterially affect, the registrant’s internal control over financial reporting; and
5. The registrant’s other certifying officer and I have disclosed, based on our most recent evaluation of internal control over financial reporting, to theregistrant’s auditors and the audit committee of the registrant’s board of directors (or persons performing the equivalent functions):
a) all significant deficiencies and material weaknesses in the design or operation of internal control over financial reporting which are reasonablylikely to adversely affect the registrant’s ability to record, process, summarize and report financial information; and
b) any fraud, whether or not material, that involves management or other employees who have a significant role in the registrant’s internal controlover financial reporting.

Date: February 7, 2017 By: /s/ CHRISTINE M. MCCARTHY Christine M. McCarthy Senior Executive Vice President and Chief Financial Officer
Exhibit 32(a)
CERTIFICATION PURSUANT TOSECTION 906 OF THE SARBANES-OXLEY ACT OF 2002*
In connection with the Quarterly Report of The Walt Disney Company (the “Company”) on Form 10-Q for the fiscal quarter ended December 31, 2016 asfiled with the Securities and Exchange Commission on the date hereof (the “Report”), I, Robert A. Iger, Chairman and Chief Executive Officer of the Company,certify, pursuant to 18 U.S.C. §1350, as adopted pursuant to §906 of the Sarbanes-Oxley Act of 2002, that:
1. The Report fully complies with the requirements of Section 13(a) or 15(d), as applicable, of the Securities Exchange Act of 1934; and
2. The information contained in the Report fairly presents, in all material respects, the financial condition and result of operations of the Company.
By: /s/ ROBERT A. IGER Robert A. Iger Chairman and Chief Executive Officer February 7, 2017
* A signed original of this written statement required by Section 906 has been provided to The Walt Disney Company and will be retained by The WaltDisney Company and furnished to the Securities and Exchange Commission or its staff upon request.
Exhibit 32(b)
CERTIFICATION PURSUANT TOSECTION 906 OF THE SARBANES-OXLEY ACT OF 2002*
In connection with the Quarterly Report of The Walt Disney Company (the “Company”) on Form 10-Q for the fiscal quarter ended December 31, 2016 asfiled with the Securities and Exchange Commission on the date hereof (the “Report”), I, Christine M. McCarthy, Senior Executive Vice President and ChiefFinancial Officer of the Company, certify, pursuant to 18 U.S.C. §1350, as adopted pursuant to §906 of the Sarbanes-Oxley Act of 2002, that:
1. The Report fully complies with the requirements of Section 13(a) or 15(d), as applicable, of the Securities Exchange Act of 1934; and
2. The information contained in the Report fairly presents, in all material respects, the financial condition and result of operations of the Company.
By: /s/ CHRISTINE M. MCCARTHY Christine M. McCarthy Senior Executive Vice President and Chief Financial Officer February 7, 2017
* A signed original of this written statement required by Section 906 has been provided to The Walt Disney Company and will be retained by The WaltDisney Company and furnished to the Securities and Exchange Commission or its staff upon request.