Walney Extension Offshore Wind Farm - Planning … · 2016-05-12 · the Walney Extension Offshore...
22
2 nd December 2013 WALNEY EXTENSION OFFSHORE WIND FARM Walney Extension Offshore Wind Farm Offshore Ornithology Clarification Note: Cumulative Impact Assessment Source Data
Transcript of Walney Extension Offshore Wind Farm - Planning … · 2016-05-12 · the Walney Extension Offshore...

2nd December 2013
WALNEY
EXTENSION
OFFSHORE
WIND FARM
Walney Extension Offshore Wind Farm
Offshore Ornithology
Clarification Note: Cumulative Impact Assessment Source
Data
Walney Extension Offshore Wind Farm
Clarification Note – Cumulative Impact Assessment source data
2nd December 2013 Page ii
PINS Reference: EN010027
Walney Extension Offshore Wind Farm
Clarification Note– Offshore Ornithology: Cumulative Impact Assessment Source Data
DONG Energy Walney Extension (UK) Ltd.
33 Grosvenor Place, Belgravia, London, SW1X 7HY
Version: 2
Date: 2nd
December 2013
© DONG Energy Power (UK) Ltd. 2013. All rights reserved.
Pictures: © DONG Energy Power (UK) Ltd., 2012.
Prepared by: Matthew Hazleton and Robin Ward (NIRAS Consulting Ltd)
Checked: Ian Ellis and Robin Ward (NIRAS Consulting Ltd)
Accepted: Allen Risby (DONG Energy)
Approved: Sally Holroyd (DONG Energy)
Doc no. 1677853
Revision history
Version Date Author History
1 26/11/2013 Matthew Hazleton (NIRAS)
2 02/12/2013 Matthew Hazleton (NIRAS)

Walney Extension Offshore Wind Farm
Clarification Note – Cumulative Impact Assessment source data
2nd
December 2013 Page 1
1 Introduction
1.1 DONG Energy Walney Extension (UK) Ltd. (“the Applicant”) made an Application to the
Planning Inspectorate (PINS) on 28th June 2013 for a Development Consent Order (DCO) for
the Walney Extension Offshore Wind Farm ("the Project") located in UK waters in the Irish Sea
between Cumbria and the Isle of Man.
1.2 This Paper responds to comments made in the Natural England / JNCC Relevant Representation
(dated 20th September 2013, paragraphs 5.1.1.6 and 5.1.2.4) and provides a discussion on the
evidence used to inform the ornithological Cumulative Impact Assessment (CIA) within Chapter
15 of the Walney Extension Environmental Statement (PINS document reference 10.1.13) and
Annex 2 of the Walney Extension Habitats Regulations Assessment Report (PINS document
reference 7.2).
1.3 The paper provides an overview of the collision and displacement assessments provided in the
Environmental Impact Assessments (EIAs) of wind farm projects within the Irish Sea. The paper
then provides details of data availability and applicability from these projects in terms of their
utilisation to inform the Walney Extension EIA. The Paper provides a judgment on the level of
confidence that can be assumed in the assessment of collision and displacement effects.
1.4 This Paper also provides clarity through the cumulative assessment with regards to the recently
published tiered approach to assessment (JNCC and Natural England, 2013).
1.5 The Paper focuses on cumulative impacts via operational phase collisions with turbine rotors
and highlights two key species: lesser black-backed gull and herring gull. Also discussed is the
data sourced to inform cumulative displacement analysis for Manx shearwater, red-throated
diver, guillemot and razorbill.
2 Background
Environmental Impact Assessments of Irish Sea Wind Farms
2.1 The ten wind farms in the Irish Sea considered as part of the cumulative impact assessment for
Walney Extension are detailed in Table 1. These projects cover a 10 year operational period,
between 2003, when North Hoyle became operational, and 2013 when two Projects in addition
to Walney Extension, are currently in planning (Burbo Bank Extension and Rhiannon).
Table 1: Wind farms considered within the cumulative impact assessment for Walney Extension
Project Status Year Operational
North Hoyle Operational 2003
Barrow Operational 2006
Burbo Bank Operational 2007
Rhyl Flats Operational 2009
Walney I & II Operational 2011/12
Ormonde Operational 2011
West of Duddon Sands In construction n/a
Gwynt y Môr In construction n/a
Walney Extension Offshore Wind Farm
Clarification Note – Cumulative Impact Assessment source data
2nd
December 2013 Page 2
Project Status Year Operational
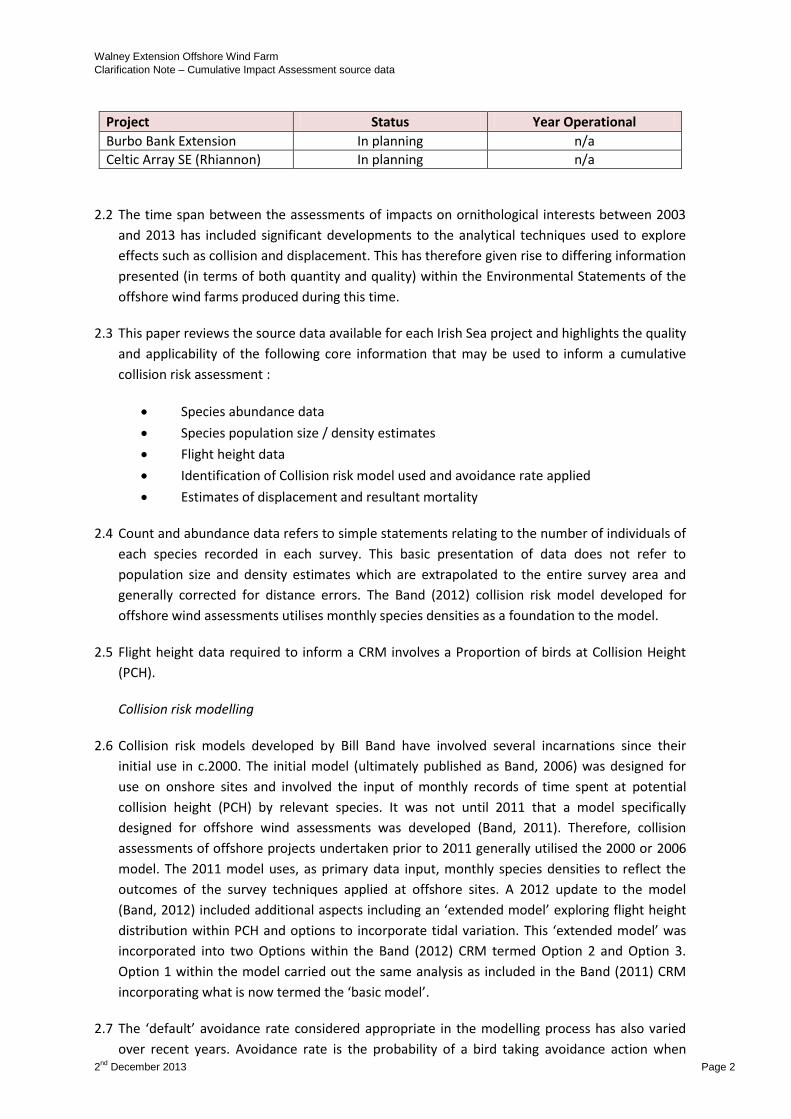
Burbo Bank Extension In planning n/a
Celtic Array SE (Rhiannon) In planning n/a
2.2 The time span between the assessments of impacts on ornithological interests between 2003
and 2013 has included significant developments to the analytical techniques used to explore
effects such as collision and displacement. This has therefore given rise to differing information
presented (in terms of both quantity and quality) within the Environmental Statements of the
offshore wind farms produced during this time.
2.3 This paper reviews the source data available for each Irish Sea project and highlights the quality
and applicability of the following core information that may be used to inform a cumulative
collision risk assessment :
Species abundance data
Species population size / density estimates
Flight height data
Identification of Collision risk model used and avoidance rate applied
Estimates of displacement and resultant mortality
2.4 Count and abundance data refers to simple statements relating to the number of individuals of
each species recorded in each survey. This basic presentation of data does not refer to
population size and density estimates which are extrapolated to the entire survey area and
generally corrected for distance errors. The Band (2012) collision risk model developed for
offshore wind assessments utilises monthly species densities as a foundation to the model.
2.5 Flight height data required to inform a CRM involves a Proportion of birds at Collision Height
(PCH).
Collision risk modelling
2.6 Collision risk models developed by Bill Band have involved several incarnations since their
initial use in c.2000. The initial model (ultimately published as Band, 2006) was designed for
use on onshore sites and involved the input of monthly records of time spent at potential
collision height (PCH) by relevant species. It was not until 2011 that a model specifically
designed for offshore wind assessments was developed (Band, 2011). Therefore, collision
assessments of offshore projects undertaken prior to 2011 generally utilised the 2000 or 2006
model. The 2011 model uses, as primary data input, monthly species densities to reflect the
outcomes of the survey techniques applied at offshore sites. A 2012 update to the model
(Band, 2012) included additional aspects including an ‘extended model’ exploring flight height
distribution within PCH and options to incorporate tidal variation. This ‘extended model’ was
incorporated into two Options within the Band (2012) CRM termed Option 2 and Option 3.
Option 1 within the model carried out the same analysis as included in the Band (2011) CRM
incorporating what is now termed the ‘basic model’.
2.7 The ‘default’ avoidance rate considered appropriate in the modelling process has also varied
over recent years. Avoidance rate is the probability of a bird taking avoidance action when

Walney Extension Offshore Wind Farm
Clarification Note – Cumulative Impact Assessment source data
2nd
December 2013 Page 3
encountering a turbine (Chamberlain et al., 2006). Prior to 2011, a default avoidance rate of
95% was suggested for all species by Scottish Natural Heritage (SNH), with this being updated
to 98% in 2011 (SNH, 2010). However, there is few empirical data on species avoidance,
particularly for seabirds. Some studies have suggested higher avoidance rates for certain
species e.g. 99.4% for gannet (Krijgsveld et al., 2011) and 98.83% for Sandwich tern (DECC,
2011). The default avoidance rate (98%) is applied to the number of transits through the rotors
of an offshore wind farm, significantly reducing the collision risk estimate to a level which is
believed to represent the actual number of collisions that will occur per annum.
2.8 The minimum requirement to inform and contribute to collision CIA, are population size /
density estimates even if no collision estimates are presented in the relevant project EIA. This
allows the implementation of Band (2012) modelling to provide indicative collision results.
Should collision estimates be provided at an inappropriate avoidance rate in the assessment
for a Project, simple calculations can revise the estimate.
Displacement analysis
2.9 Where given estimates of displacement (and resultant mortality) are not available for a project
population estimates are the minimum requirement in order to allow some indicative results to
inform a CIA. Guidance relating to displacement has recently been published (Natural England
and JNCC, 2012) so that quantified displacement assessments are generally absent from EIAs
prior to this time.
2.10 The interim guidance published by Natural England and JNCC (2012) suggests that analysis of
displacement should be carried out using a matrix approach incorporating mean-maximum
population estimates covering the breeding period, the non-breeding period and where
applicable, the post-breeding moult period. The guidance suggests population estimates should
cover the wind farm area plus a 2 km buffer for all species except seaducks and divers for
which a 4 km buffer should be used.
2.11 There is currently little evidence to support displacement and mortality predictions within the
matrix approach. As such, where displacement analysis has been conducted displacement and
mortality rates may differ between projects depending on the evidence base used to define
such rates.
Tiered approach to cumulative impact assessment
2.12 Recent guidance on the presentation of cumulative impact assessment suggested the
application of a tiered approach when considering data from other wind farm sites in order to
determine the confidence in the assessment performed (JNCC and Natural England, 2013).
Following this guidance each wind farm is designated to one of six tiers, where lower tiers
represent sites where there is an increased level of confidence in the data available. This
implies that projects in lower tiers have adequate environmental characterisation data through
both impact assessment and monitoring that projects in higher tiers may lack. This does not
however account for the potential data limitations as highlighted above.

Walney Extension Offshore Wind Farm
Clarification Note – Cumulative Impact Assessment source data
2nd
December 2013 Page 4
2.13 Descriptions of each tier (as defined by JNCC and Natural England, 2013) are shown in
Appendix 1. Table 2 presents the allocation of tiers to the Irish Sea projects by taking account
of the status of a project and the availability of environmental characterisation data.
Table 2: Allocated tiers to wind farms considered within the cumulative impact assessment for
Walney Extension
Project Status Tier
North Hoyle Operational 1
Barrow Operational 1
Burbo Bank Operational 1
Rhyl Flats Operational 1
Walney I & II Operational 1
Ormonde Operational 1
West of Duddon Sands In construction 2
Gwynt y Môr In construction 2
Burbo Bank Extension In planning 4
Celtic Array SE (Rhiannon) In planning 5
2.14 The assessment for North Hoyle Offshore Wind Farm was undertaken in 2002 (NWP Offshore,
2002). This work was therefore carried out before both the widespread use of the Band model
and the publishing of guidance concerning displacement. A qualitative assessment was carried
out for collision risk modelling with the assessment presenting the proportion of observations at
PCH for a select few species (red-throated diver, common scoter, cormorant). No population
estimate / density information was presented. North Hoyle Wind Farm is included in Tier 1 of
the Tier 1 to 6 model.
2.15 The assessment for Burbo Bank Offshore Wind Farm was undertaken in 2002 (Seascape Energy,
2002) and as such this project is included in Tier 1. This work was therefore carried out before
the widespread use of the Band model and the publishing of the displacement guidance. A
qualitative assessment was carried out in presenting the proportion of observations at PCH,
although not all species are included (large gull species are absent). No population estimate /
density information is presented. Similarly, the assessments of Barrow Offshore Wind Farm
were undertaken during a similar time period and no data beyond basic abundance information
is presented (Warwick Energy, 2002).
2.16 Walney I and II Offshore Wind Farm (considered as a single wind farm) was assessed in 2006
(RPS, 2006a) and incorporated collision risk modelling for lesser black-backed gull (in addition to
pink-footed goose and whooper swan) using the Band (2000) model. Avoidance rates are given
at a range between 0 and 99.99% (although 98% is not presented). The assessment also
presents peak monthly abundances corrected for distance and survey coverage which can be
used to provide an indication of monthly collision risk. As environmental characterisation data
are available and pre- and post-construction monitoring surveys have been completed, Walney I
and II is designated a Tier 1 project.

Walney Extension Offshore Wind Farm
Clarification Note – Cumulative Impact Assessment source data
2nd
December 2013 Page 5
2.17 The ornithological assessment of Ormonde Offshore Wind Farm was completed in 2005
(Ecology Consulting, 2005). Although collision risk modelling (via Band, 2000) was undertaken
the presentation of results is in graphical form with avoidance rate plotted against change in
background mortality, so that absolute values require interpretation. Annual peak and mean
population estimates are presented although monthly counts are again, only presented
graphically. As environmental characterisation data are available and the project is now fully
operational, Ormonde is designated a Tier 1 project.
2.18 West of Duddon Sands Offshore Wind Farm was assessed in 2006 (RPS, 2006b) with the
methodology following that used for Walney I and II. Collision estimates are provided for lesser
black-backed gull (and pink-footed goose, whooper swan), while monthly peak counts and
percentage flights at collision height (PCH) values are provided for other species. Environmental
characterisation data are available for West of Duddon Sands although the project is still in the
construction phase. As such West of Duddon Sands is designated a Tier 2 project.
2.19 Rhyl Flats was fully commissioned in 2009 following an assessment undertaken in the early
2000s. There does not appear to be any data available for this project that quantifies the
collision risk posed to lesser black-backed gull. There is also a lack of density or population
estimate data which could provide a qualitative description of collision risk at the site. Rhyl Flats
is designated a Tier 1 project.
2.20 Gwynt y Môr Offshore Wind Farm was assessed in 2007 (Npower renewables, 2007) although
no collision risk modelling was undertaken. In addition, no attempt is made to provide
population estimate or density data with only indicative abundances provided. An Appropriate
Assessment for Gwynt-y-Môr was published in 2008 (BERR, 2008). This presents collision risk
estimates for Gwynt-y-Môr and also details collision risk values for North Hoyle, Rhyl Flats and
Burbo Bank. Although not presented an avoidance rate of 98% can be calculated to inform the
cumulative assessment. Gwynt-y-Môr is yet to be fully commissioned and, as such, is designated
a Tier 2 project.
2.21 Burbo Bank Extension Offshore Wind Farm was assessed in 2013 (DONG Energy, 2013). The
collision estimates are based on Band (2012) and are presented using Options 2 and 3 of the
CRM (NIRAS Consulting, 2013). Displacement analysis for Burbo Bank Extension followed the
guidance published by Natural England and JNCC (2012). All four of the species included in the
displacement analysis for Walney Extension (red-throated diver, Manx shearwater, guillemot
and razorbill) were incorporated into the analysis for Burbo Bank Extension. The analysis used
mean-maximum population estimates for the breeding, non-breeding and when applicable a
post-breeding moult period. Population estimates used within the analysis represented birds
recorded in the wind farm area plus a 4 km buffer area. Environmental characterisation data are
available for Burbo Bank Extension although the project is currently in the examination phase.
As such, Burbo Bank Extension is designated a Tier 4 project.
2.22 The Zonal Appraisal and Planning (ZAP) report of the Irish Sea Zone (Centrica Energy, 2012)
presents initial collision results for the three proposed development zones in this area, including
Rhiannon, for selected species (including lesser black-backed and herring gulls) based on the
Band (2011) model. The Rhiannon Project within the ISZ is currently pre-application and is
designated a Tier 5 project.
Walney Extension Offshore Wind Farm
Clarification Note – Cumulative Impact Assessment source data
2nd
December 2013 Page 6
3 Cumulative collision risk for Walney Extension offshore wind farm
Herring gull
3.1 Herring gull is a qualifying feature at only one SPA within foraging range of Walney Extension,
Morecambe Bay SPA. As such, only those offshore wind farm sites within the foraging range of
herring gull from Morecambe Bay SPA are included in the cumulative assessment.
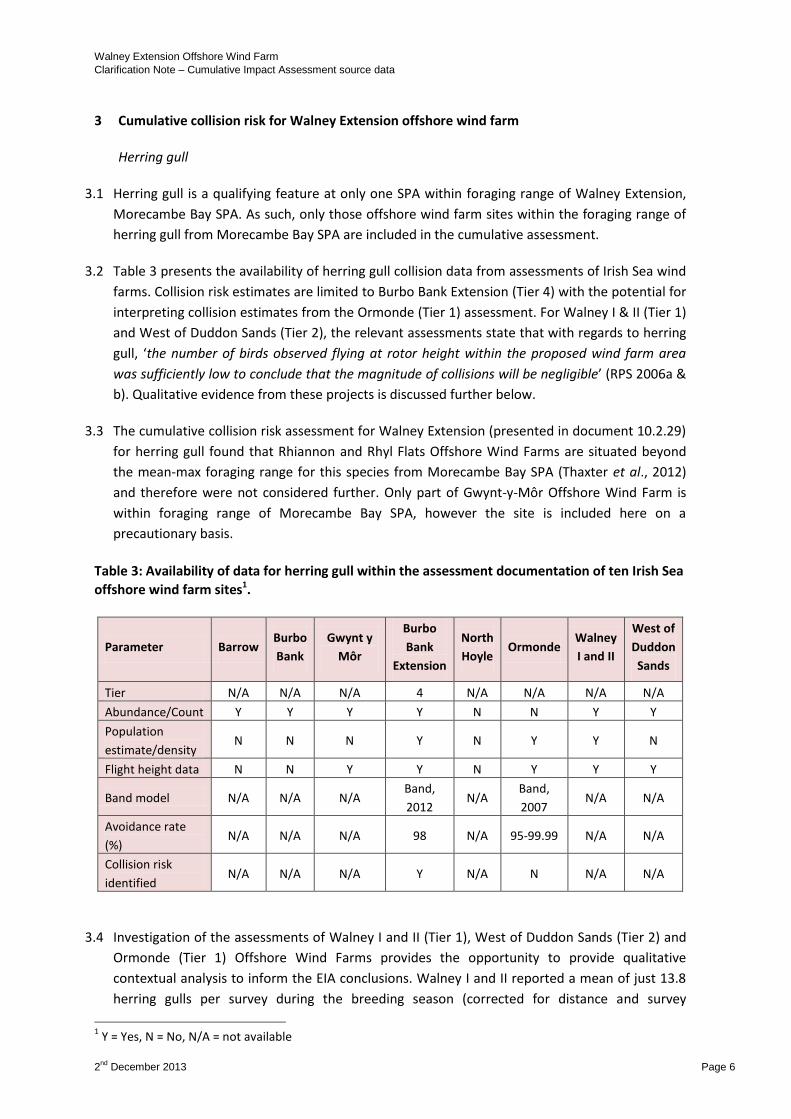
3.2 Table 3 presents the availability of herring gull collision data from assessments of Irish Sea wind
farms. Collision risk estimates are limited to Burbo Bank Extension (Tier 4) with the potential for
interpreting collision estimates from the Ormonde (Tier 1) assessment. For Walney I & II (Tier 1)
and West of Duddon Sands (Tier 2), the relevant assessments state that with regards to herring
gull, ‘the number of birds observed flying at rotor height within the proposed wind farm area
was sufficiently low to conclude that the magnitude of collisions will be negligible’ (RPS 2006a &
b). Qualitative evidence from these projects is discussed further below.
3.3 The cumulative collision risk assessment for Walney Extension (presented in document 10.2.29)
for herring gull found that Rhiannon and Rhyl Flats Offshore Wind Farms are situated beyond
the mean-max foraging range for this species from Morecambe Bay SPA (Thaxter et al., 2012)
and therefore were not considered further. Only part of Gwynt-y-Môr Offshore Wind Farm is
within foraging range of Morecambe Bay SPA, however the site is included here on a
precautionary basis.
Table 3: Availability of data for herring gull within the assessment documentation of ten Irish Sea
offshore wind farm sites1.
Parameter Barrow Burbo
Bank
Gwynt y
Môr
Burbo
Bank
Extension
North
Hoyle Ormonde
Walney
I and II
West of
Duddon
Sands
Tier N/A N/A N/A 4 N/A N/A N/A N/A
Abundance/Count Y Y Y Y N N Y Y
Population
estimate/density N N N Y N Y Y N
Flight height data N N Y Y N Y Y Y
Band model N/A N/A N/A Band,
2012 N/A
Band,
2007 N/A N/A
Avoidance rate
(%) N/A N/A N/A 98 N/A 95-99.99 N/A N/A
Collision risk
identified N/A N/A N/A Y N/A N N/A N/A
3.4 Investigation of the assessments of Walney I and II (Tier 1), West of Duddon Sands (Tier 2) and
Ormonde (Tier 1) Offshore Wind Farms provides the opportunity to provide qualitative
contextual analysis to inform the EIA conclusions. Walney I and II reported a mean of just 13.8
herring gulls per survey during the breeding season (corrected for distance and survey
1 Y = Yes, N = No, N/A = not available

Walney Extension Offshore Wind Farm
Clarification Note – Cumulative Impact Assessment source data
2nd
December 2013 Page 7
coverage) over the entire study area. The observation that the majority of herring gulls were
present below PCH (RPS, 2006a) further supports the view that collision risk is negligible at this
project. The West of Duddon Sands assessment (RPS, 2006b) reports the same results found for
Walney I and II as these sites were included in the same study area covered in the baseline
surveys.
3.5 The assessment for Ormonde Offshore Wind Farm (Tier 1) makes drawing conclusions on likely
collision rates difficult (Ecology Consulting, 2005). Although it is possible to derive a collision risk
estimate for the whole year from the graphs presented it is difficult to determine the number of
collisions during the breeding season. However, it is clear that herring gulls were scarce during
the breeding season and virtually absent during June and July 2004 boat surveys, with small
numbers recorded in May and August. Furthermore, most herring gulls were recorded outside
of a 2 km buffer of the project site. The assessment concludes that it would require an unlikely
avoidance rate of 82% in order to breach a threshold for a significant effect. Collision effects on
herring gull at Ormonde were therefore considered negligible at all realistic avoidance rates.
3.6 In summary, for herring gull the following conclusions are made with respect to the cumulative
collision assessment:
Few empirical data on collision rates exist for projects within foraging range of Morecambe
Bay SPA.
Quantitative data from Walney Extension, Burbo Extension and Ormonde with qualitative
data from other projects.
Although the availability / confidence in the full dataset can be considered to be low-
moderate, a qualitative analysis of three additional sites provides appropriate evidence to
support the conclusions of the EIA and HRA.
Appropriate data are available from one Tier 1 project (Ormonde) and one Tier 4 project
(Burbo Bank Extension). These are projects for which environmental characterisation data
is available, although interpretation is required for the Ormonde assessment
Lesser black-backed gull
3.7 There are three SPAs of concern in relation to the cumulative collision risk for lesser black-
backed gull. Bowland Fells SPA, Morecambe Bay SPA and the Ribble & Alt Estuaries SPA are all
within foraging range of the Project site. As such, every wind farm site within the foraging
range of lesser black-backed gull from these three SPAs is included in the cumulative
assessment.
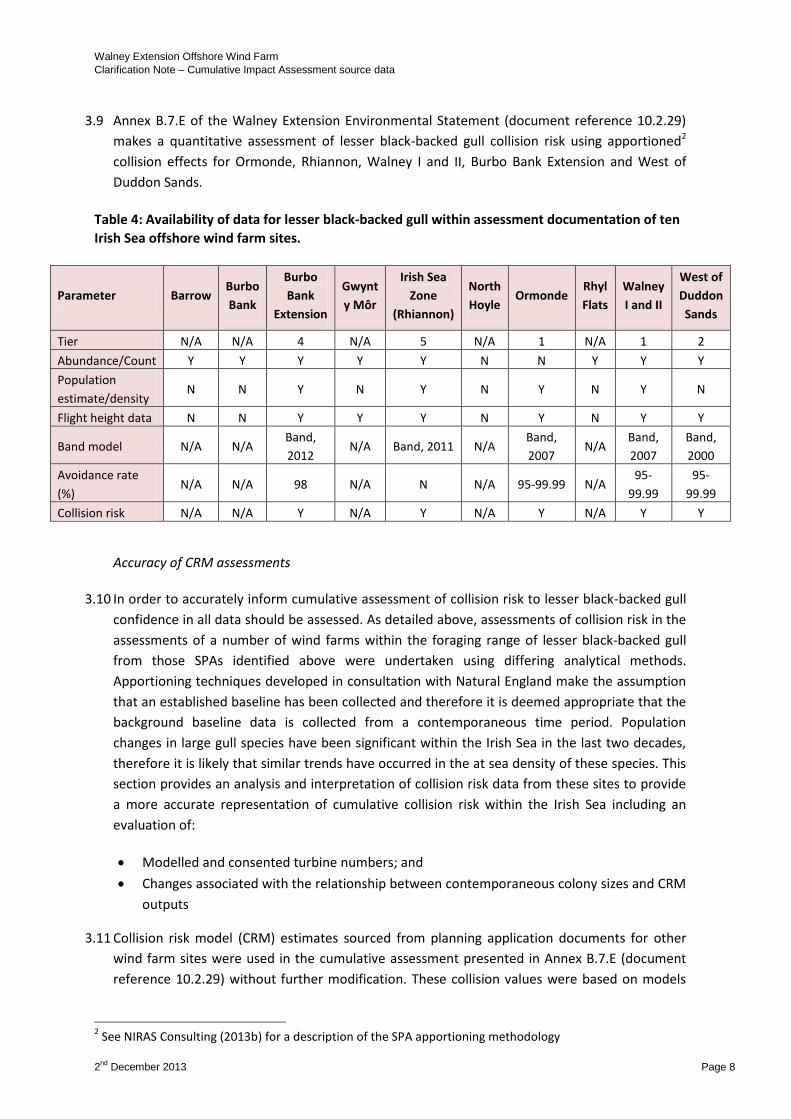
3.8 Table 4 presents the availability of lesser black-backed gull collision data from assessments of
Irish Sea wind farms. Availability is similar to herring gull, with the exception of Walney I and II
and West of Duddon Sands which do specifically model this species. Collision risk estimates are
therefore available for Rhiannon (Tier 5), Burbo Bank Extension (Tier 4), Walney I and II (Tier 1)
and West of Duddon Sands (Tier 2), with additional information available for Ormonde (Tier 1)
and within the Appropriate Assessment for Gwynt y Môr (Tier 2) (BERR, 2008) which assesses
the cumulative collision effect on the species incorporating data from Burbo Bank, North Hoyle
and Rhyl Flats (all Tier 1). However, no collision risk data are presented in the individual
assessments produced for Burbo Bank, Rhyl Flats, North Hoyle or Gwynt-y-Môr.
Walney Extension Offshore Wind Farm
Clarification Note – Cumulative Impact Assessment source data
2nd
December 2013 Page 8
3.9 Annex B.7.E of the Walney Extension Environmental Statement (document reference 10.2.29)
makes a quantitative assessment of lesser black-backed gull collision risk using apportioned2
collision effects for Ormonde, Rhiannon, Walney I and II, Burbo Bank Extension and West of
Duddon Sands.
Table 4: Availability of data for lesser black-backed gull within assessment documentation of ten
Irish Sea offshore wind farm sites.
Parameter Barrow Burbo
Bank
Burbo
Bank
Extension
Gwynt
y Môr
Irish Sea
Zone
(Rhiannon)
North
Hoyle Ormonde
Rhyl
Flats
Walney
I and II
West of
Duddon
Sands
Tier N/A N/A 4 N/A 5 N/A 1 N/A 1 2
Abundance/Count Y Y Y Y Y N N Y Y Y
Population
estimate/density N N Y N Y N Y N Y N
Flight height data N N Y Y Y N Y N Y Y
Band model N/A N/A Band,
2012 N/A Band, 2011 N/A
Band,
2007 N/A
Band,
2007
Band,
2000
Avoidance rate
(%) N/A N/A 98 N/A N N/A 95-99.99 N/A
95-
99.99
95-
99.99
Collision risk N/A N/A Y N/A Y N/A Y N/A Y Y
Accuracy of CRM assessments
3.10 In order to accurately inform cumulative assessment of collision risk to lesser black-backed gull
confidence in all data should be assessed. As detailed above, assessments of collision risk in the
assessments of a number of wind farms within the foraging range of lesser black-backed gull
from those SPAs identified above were undertaken using differing analytical methods.
Apportioning techniques developed in consultation with Natural England make the assumption
that an established baseline has been collected and therefore it is deemed appropriate that the
background baseline data is collected from a contemporaneous time period. Population
changes in large gull species have been significant within the Irish Sea in the last two decades,
therefore it is likely that similar trends have occurred in the at sea density of these species. This
section provides an analysis and interpretation of collision risk data from these sites to provide
a more accurate representation of cumulative collision risk within the Irish Sea including an
evaluation of:
Modelled and consented turbine numbers; and
Changes associated with the relationship between contemporaneous colony sizes and CRM
outputs
3.11 Collision risk model (CRM) estimates sourced from planning application documents for other
wind farm sites were used in the cumulative assessment presented in Annex B.7.E (document
reference 10.2.29) without further modification. These collision values were based on models
2 See NIRAS Consulting (2013b) for a description of the SPA apportioning methodology

Walney Extension Offshore Wind Farm
Clarification Note – Cumulative Impact Assessment source data
2nd
December 2013 Page 9
using the worst case turbine array scenario which for bird collision risk would typically be those
design envelope (Rochdale Envelope) scenarios involving the greatest rotor swept area.
3.12 Modelling outputs and the scenarios used to inform them are available for West of Duddon
Sands (RPS, 2006a) and Walney I and II (RPS, 2006b). The scenarios used in modelling for both
sites are notably different to the arrays that have actually been constructed, in both cases far
fewer turbines were constructed than had originally been proposed (and assessed in their
respective Environmental Statements). Consequently, the predicted collision risk estimates of
these projects are likely to be significant overestimates and, in reality, the rates actually
occurring will be lower than those used in the assessment detailed in Annex B.7.E.
3.13 Table 5 presents the number of turbines used in the CRM presented in the application
documents for West of Duddon Sands and Walney I and II, and that which was subsequently
constructed. Information indicates that the 3.6 MW Siemens turbine was used in both the
modelling process and subsequently then installed at both sites.
3.14 It is assumed that a reduction in turbines will translate into a corresponding reduction in
collisions. To investigate the relationship between the number of turbines and collision risk
estimates in the Band (2012) collision risk model, experimental numbers of turbines were
entered into the model. This indicated a direct linear relationship between the number of
turbines and the collision estimates produced (i.e. if turbine number doubles, collision risk also
doubles). Therefore, for the purposes of the cumulative assessment the predicted collision rates
for other wind farms have been corrected to take account of any differences in the number of
turbines proposed (and on which collision rate predictions were based) and the final build. The
correction factors used are as shown in Table 5.
Table 5: Walney I & II and West of Duddon Sands modelled and constructed turbine scenarios
and the resulting correction factor to be applied to cumulative assessment.
Specification Walney I & II West of Duddon Sands
No. of turbines used in CRM
152 139
No. of turbines constructed 102 108
Correction factor -32.9% -22.3%
3.15 The reduction in the number of turbines has previously been accepted by Natural England, as
part of the planning application for Burbo Bank Extension, as an appropriate method to
determine the cumulative impact of collision on lesser black-backed gull.
Contemporaneous colony size relationship with CRM outputs
3.16 Surveys for several projects considered cumulatively were undertaken much earlier than those
at Walney Extension. At the time of those surveys, the size of the population of lesser black-
backed gull and their distribution were different to those now and at the time that the baseline
surveys for Walney Extension were undertaken. These differences will have influenced the
predicted collision rates previously undertaken as it is assumed that the observed density of
gulls at sea will be related to the size of the breeding population.

Walney Extension Offshore Wind Farm
Clarification Note – Cumulative Impact Assessment source data
2nd
December 2013 Page 10
3.17 Any correction factor implemented to account for these changes requires assumptions in the
relationship between colony size and at sea density which cannot be comprehensively tested.
However, the changes in population for Bowland Fells SPA and Morecambe Bay SPA since the
surveys were undertaken to inform Walney I and II, West of Duddon Sands (2005) and Ormonde
(2004) have been dramatic (Table 6) and some attempt must be made to account for these
population changes. Therefore, in the absence of any other information, it is assumed that any
change in colony size translates, directly, into a change in collision risk.
Table 6: Lesser black-backed gull colony population size change since surveys at Walney I & II,
West of Duddon Sands, and Ormonde wind farms
Wind farm
Year
relevant to
site-specific
surveys
SPA Contemporaneous
colony size
Current
colony size
(individuals)
Change (%)
Walney I & II
and
West of
Duddon Sands
2005 Morecambe Bay 23,420 16,260 -30.6%
Bowland Fells 16,525 10,937 -33.8%
Ribble & Alt
Estuaries 6,696 6,6963 0
Ormonde 2004 Morecambe Bay 24,400 16,260 -33.36
Bowland Fells 15,483 10,937 -29.46
Ribble & Alt
Estuaries 6,696 6,6964 NC
3.18 The percentage changes presented here can be applied to collision risk estimates once the
overall collision risk estimate has been apportioned to individual SPA colonies. The cumulative
SPA apportioning assessment for lesser black-backed gull is presented in NIRAS Consulting
(2013b).
3.19 The Appropriate Assessment of Gwynt y Môr (BERR, 2008) updates the findings given in the ES
and provides a cumulative collision assessment for the site plus Burbo Bank, North Hoyle and
Rhyl Flats. An avoidance rate of 98% is not given although this can be calculated from the given
avoidance rates (e.g. 97%). A total of 17 lesser black-backed gulls per annum are predicted to
collide with turbine rotors (or 34 including unidentified black-backed gulls). This total does not
take into account any apportioning to source colony and is presumably based on Band (2007).
3.20 In summary, for lesser black-backed gull the following conclusions are made with respect to the
cumulative collision assessment:
Collision data exists for six projects within foraging range Morecambe Bay SPA. These are
all considered within the EIA and Habitats Regulation Assessment (HRA) for Walney
Extension.
An assessment of the cumulative effects of these sites on the Morecambe Bay SPA is given
in NIRAS Consulting (2013b). 3 Proposed colony size post-cull
4 Proposed colony size post-cull
Walney Extension Offshore Wind Farm
Clarification Note – Cumulative Impact Assessment source data
2nd
December 2013 Page 11
No collision data (or population estimates) are available in the assessments for the Burbo
Bank, North Hoyle, Rhyl Flats (all Tier 1 projects) or Gwynt y Môr (Tier 2) wind farms.
However, a cumulative collision assessment for these sites is presented in BERR (2008).
Data is available from two Tier 1 projects, one Tier 2 project, one Tier 4 project and one
Tier 5 project. Environmental characterisation data is available from projects in Tiers 1-4
although a degree of interpretation is required for those projects in Tier 1. Data for
Rhiannon is subject to change and as such confidence in these data is lower.
Further data could be incorporated from the Appropriate Assessment (BERR, 2008) which
contains data for four Tier 1 projects although interpretation is again required to acquire
usable collision risk estimates.
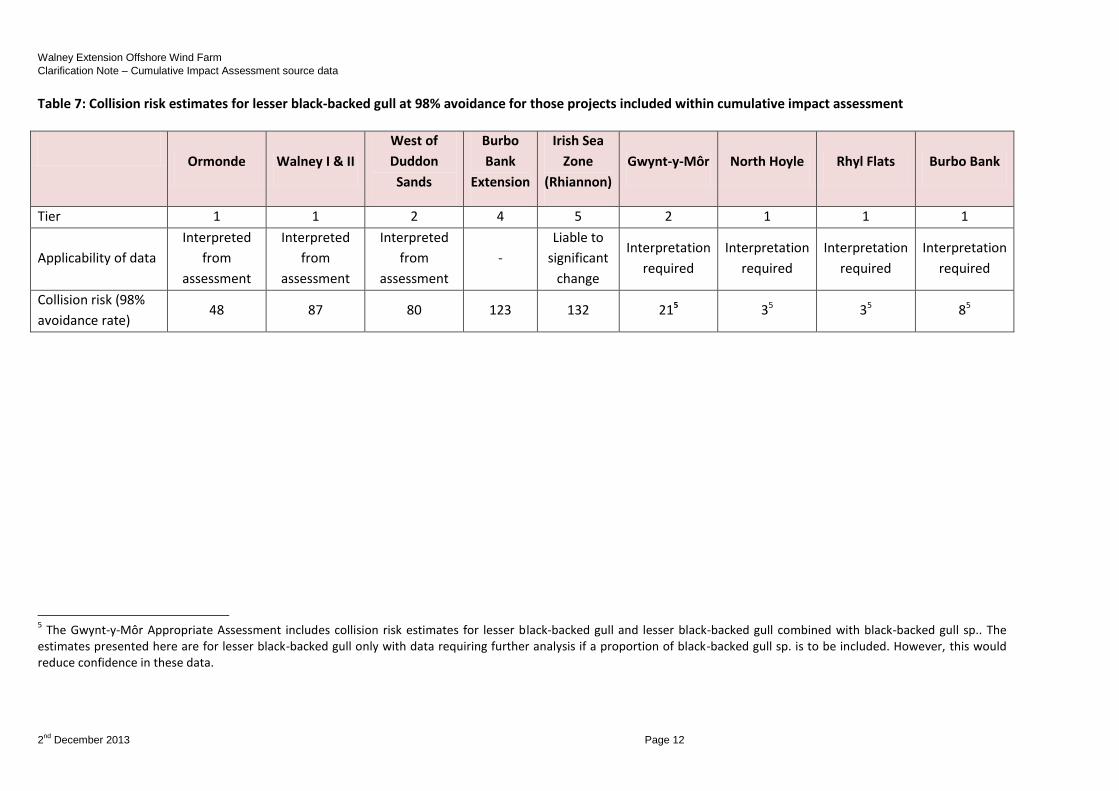
Table 7 presents the collision risk estimates that will be taken forward for use in the revised
cumulative assessment of collision risk for lesser black-backed gull at those offshore wind farms
within foraging range of the three SPAs within the Irish Sea.
Walney Extension Offshore Wind Farm
Clarification Note – Cumulative Impact Assessment source data
2nd
December 2013 Page 12
Table 7: Collision risk estimates for lesser black-backed gull at 98% avoidance for those projects included within cumulative impact assessment
Ormonde Walney I & II
West of
Duddon
Sands
Burbo
Bank
Extension
Irish Sea
Zone
(Rhiannon)
Gwynt-y-Môr North Hoyle Rhyl Flats Burbo Bank
Tier 1 1 2 4 5 2 1 1 1
Applicability of data
Interpreted
from
assessment
Interpreted
from
assessment
Interpreted
from
assessment
-
Liable to
significant
change
Interpretation
required
Interpretation
required
Interpretation
required
Interpretation
required
Collision risk (98%
avoidance rate) 48 87 80 123 132 215 35 35 85
5 The Gwynt-y-Môr Appropriate Assessment includes collision risk estimates for lesser black-backed gull and lesser black-backed gull combined with black-backed gull sp.. The
estimates presented here are for lesser black-backed gull only with data requiring further analysis if a proportion of black-backed gull sp. is to be included. However, this would reduce confidence in these data.

Walney Extension Offshore Wind Farm
Clarification Note – Cumulative Impact Assessment source data
2nd
December 2013 Page 13
4 Cumulative displacement assessment data
4.1 The inclusion of species in the assessment of displacement effects within the Walney Extension
Offshore Ornithology ES chapter was informed by the sensitivity of a species to displacement
as presented in Maclean et al. (2009) and Furness and Wade (2012). Based on this evidence
red-throated diver, Manx shearwater, guillemot and razorbill were included in the assessment
of displacement effects for both Walney Extension alone and cumulatively with other offshore
wind farms.
4.2 The displacement analysis at Walney Extension included only those wind farms in the north-
east of the Irish Sea. Therefore, if data were available the analysis would include Barrow,
Ormonde, Walney I and II, Walney Extension and West of Duddon Sands. However, the
projects considered cumulatively for Manx shearwater are informed by advice from Natural
Resources Wales (NRW) for the ornithological assessment at Burbo Bank Extension.
Manx shearwater
4.3 The cumulative displacement analysis presented within the Offshore Ornithology ES chapter
(document reference 10.1.13) has been superseded by an updated analysis incorporating data
from Burbo Bank Extension and Atlantic Array (both Tier 4 projects) (NIRAS Consulting, 2013c).
This analysis follows the advice given on the ornithological assessment for Burbo Bank
Extension by NRW (PINS project reference EN010026). Breeding period population estimates
have been combined from each of the three projects and results apportioned to relevant SPA
populations. A displacement rate of 30% and mortality rate of 10% were proposed, which leads
to a conclusion of no significant impacts predicted for any of the SPAs included within the
analysis (Skokholm and Skomer SPA, Aberdaron Coast and Bardsey Island SPA, and Copeland
Island SPA).
Guillemot
4.4 Table 8 presents the availability of data to inform a displacement analysis for guillemot in the
assessments of Irish Sea wind farms. Displacement analysis as outlined by Natural England and
JNCC (2012) is not available in any of the four other Irish sea wind farm sites considered in this
cumulative assessment although population data are available from Ormonde, Walney I and II
(both Tier 1) and West of Duddon Sands (Tier 2) which has enabled a qualitative approach
within these assessments.
4.5 The cumulative displacement analysis presented in the Walney Extension Offshore Ornithology
ES chapter (document reference 10.1.13) concludes that due to the large extent of habitat
available to guillemot within the Irish Sea any cumulative displacement effects will not be
significant in EIA terms.

Walney Extension Offshore Wind Farm
Clarification Note – Cumulative Impact Assessment source data
2nd
December 2013 Page 14
Table 8: Availability of data for guillemot within assessment documentation of Irish Sea offshore
wind farm sites.
Parameter Barrow Ormonde Walney I and II West of Duddon
Sands
Tier 1 1 1 2
Abundance/Count Y N Y Y
Population
estimate/density N Y N Y
Displacement
analysis N N N N
Geographic scale N/A N/A N/A N/A
4.6 The assessment for Barrow Offshore Wind Farm (Tier 1) only details the counts of guillemot
recorded in aerial and boat-based surveys (Warwick Energy, 2002) with no quantitative or
qualitative assessment on the effects of displacement. Few auks were however recorded in the
wind farm area during aerial surveys although auks were more abundant in the wider aerial
survey area.
4.7 Although no quantification of displacement is presented in the Ormonde Offshore Wind Farm
(Tier 1) assessment for guillemot, monthly population estimates from the aerial survey area
and the wind farm plus a 2 km buffer area are presented graphically. Guillemot were
distributed evenly across the boat-based survey although in aerial surveys distribution was
centred in areas further offshore. Guillemot were however, recorded in the wind farm area in
both boat-based and aerial surveys. The assessment presents a qualitative summary of
displacement suggesting an impact on razorbill. The assessment presents a qualitative
summary of displacement suggesting an impact of low significance for guillemot.
4.8 Auk species were widely distributed across the aerial survey area used in the Walney I and II
Offshore Wind Farm (Tier 1) assessment with many auks recorded within the wind farm area. A
detailed qualitative assessment is carried out for guillemot and suggests that the magnitude of
any displacement impacts if low for this species.
4.9 Population estimates from boat-based surveys and raw counts from aerial surveys are
presented for guillemot within the assessment for West of Duddon Sands (Tier 2). Observations
of auks indicate a wide distribution across the boat-based study area with many observations
within the wind farm area. A qualitative displacement assessment concludes that any
displacement impacts are of low magnitude.
Razorbill
4.10 Table 9 presents the availability of data to inform a displacement analysis for razorbill in the
assessments of Irish Sea wind farms. Displacement analysis as outlined by Natural England and
JNCC (2012) is not available in any of the four other Irish sea wind farm sites considered in this
cumulative assessment although population estimates are available from Ormonde, Walney I
and II (both Tier 1) and West of Duddon Sands (Tier 2) which has enabled a qualitative
approach within these assessments.
Walney Extension Offshore Wind Farm
Clarification Note – Cumulative Impact Assessment source data
2nd
December 2013 Page 15
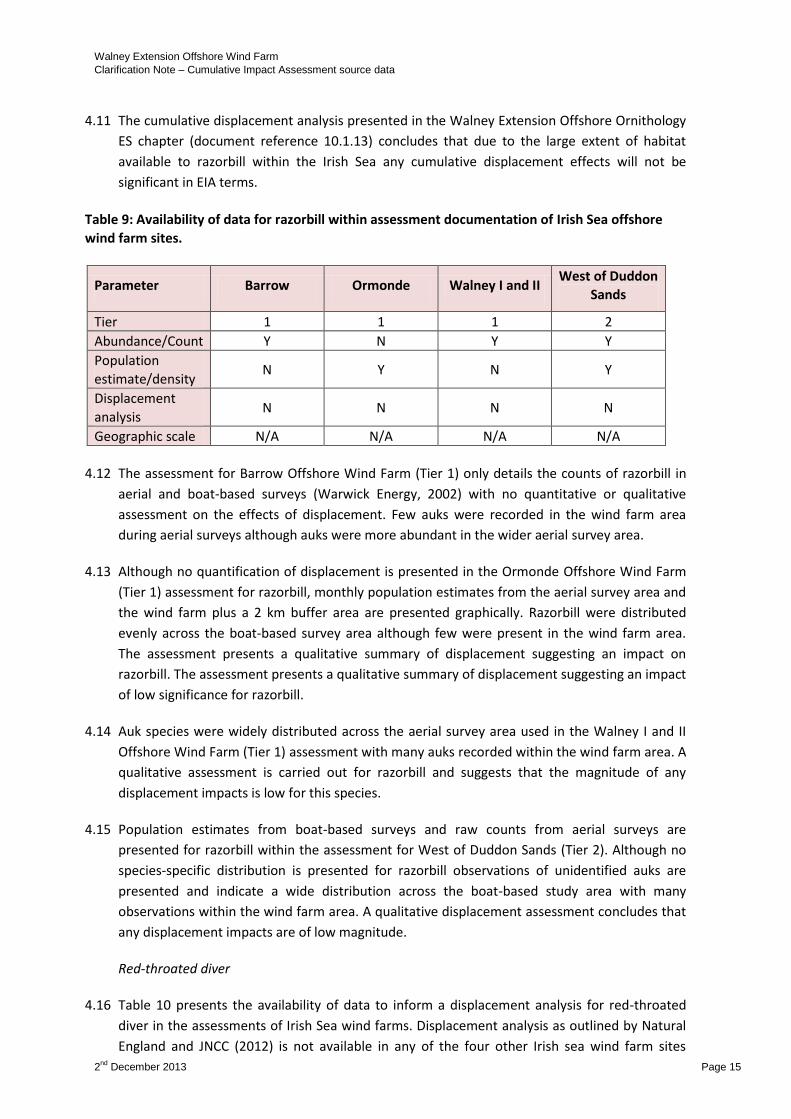
4.11 The cumulative displacement analysis presented in the Walney Extension Offshore Ornithology
ES chapter (document reference 10.1.13) concludes that due to the large extent of habitat
available to razorbill within the Irish Sea any cumulative displacement effects will not be
significant in EIA terms.
Table 9: Availability of data for razorbill within assessment documentation of Irish Sea offshore
wind farm sites.
Parameter Barrow Ormonde Walney I and II West of Duddon
Sands
Tier 1 1 1 2
Abundance/Count Y N Y Y
Population
estimate/density N Y N Y
Displacement
analysis N N N N
Geographic scale N/A N/A N/A N/A
4.12 The assessment for Barrow Offshore Wind Farm (Tier 1) only details the counts of razorbill in
aerial and boat-based surveys (Warwick Energy, 2002) with no quantitative or qualitative
assessment on the effects of displacement. Few auks were recorded in the wind farm area
during aerial surveys although auks were more abundant in the wider aerial survey area.
4.13 Although no quantification of displacement is presented in the Ormonde Offshore Wind Farm
(Tier 1) assessment for razorbill, monthly population estimates from the aerial survey area and
the wind farm plus a 2 km buffer area are presented graphically. Razorbill were distributed
evenly across the boat-based survey area although few were present in the wind farm area.
The assessment presents a qualitative summary of displacement suggesting an impact on
razorbill. The assessment presents a qualitative summary of displacement suggesting an impact
of low significance for razorbill.
4.14 Auk species were widely distributed across the aerial survey area used in the Walney I and II
Offshore Wind Farm (Tier 1) assessment with many auks recorded within the wind farm area. A
qualitative assessment is carried out for razorbill and suggests that the magnitude of any
displacement impacts is low for this species.
4.15 Population estimates from boat-based surveys and raw counts from aerial surveys are
presented for razorbill within the assessment for West of Duddon Sands (Tier 2). Although no
species-specific distribution is presented for razorbill observations of unidentified auks are
presented and indicate a wide distribution across the boat-based study area with many
observations within the wind farm area. A qualitative displacement assessment concludes that
any displacement impacts are of low magnitude.
Red-throated diver
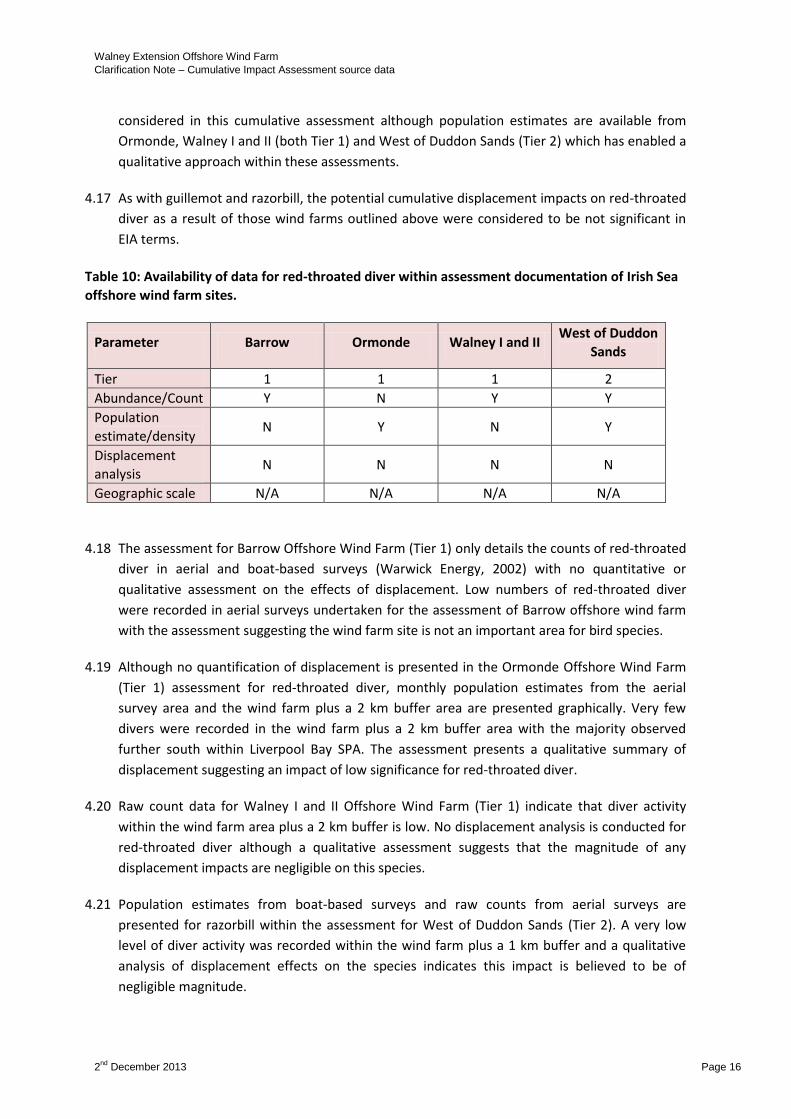
4.16 Table 10 presents the availability of data to inform a displacement analysis for red-throated
diver in the assessments of Irish Sea wind farms. Displacement analysis as outlined by Natural
England and JNCC (2012) is not available in any of the four other Irish sea wind farm sites
Walney Extension Offshore Wind Farm
Clarification Note – Cumulative Impact Assessment source data
2nd
December 2013 Page 16
considered in this cumulative assessment although population estimates are available from
Ormonde, Walney I and II (both Tier 1) and West of Duddon Sands (Tier 2) which has enabled a
qualitative approach within these assessments.
4.17 As with guillemot and razorbill, the potential cumulative displacement impacts on red-throated
diver as a result of those wind farms outlined above were considered to be not significant in
EIA terms.
Table 10: Availability of data for red-throated diver within assessment documentation of Irish Sea
offshore wind farm sites.
Parameter Barrow Ormonde Walney I and II West of Duddon
Sands
Tier 1 1 1 2
Abundance/Count Y N Y Y
Population
estimate/density N Y N Y
Displacement
analysis N N N N
Geographic scale N/A N/A N/A N/A
4.18 The assessment for Barrow Offshore Wind Farm (Tier 1) only details the counts of red-throated
diver in aerial and boat-based surveys (Warwick Energy, 2002) with no quantitative or
qualitative assessment on the effects of displacement. Low numbers of red-throated diver
were recorded in aerial surveys undertaken for the assessment of Barrow offshore wind farm
with the assessment suggesting the wind farm site is not an important area for bird species.
4.19 Although no quantification of displacement is presented in the Ormonde Offshore Wind Farm
(Tier 1) assessment for red-throated diver, monthly population estimates from the aerial
survey area and the wind farm plus a 2 km buffer area are presented graphically. Very few
divers were recorded in the wind farm plus a 2 km buffer area with the majority observed
further south within Liverpool Bay SPA. The assessment presents a qualitative summary of
displacement suggesting an impact of low significance for red-throated diver.
4.20 Raw count data for Walney I and II Offshore Wind Farm (Tier 1) indicate that diver activity
within the wind farm area plus a 2 km buffer is low. No displacement analysis is conducted for
red-throated diver although a qualitative assessment suggests that the magnitude of any
displacement impacts are negligible on this species.
4.21 Population estimates from boat-based surveys and raw counts from aerial surveys are
presented for razorbill within the assessment for West of Duddon Sands (Tier 2). A very low
level of diver activity was recorded within the wind farm plus a 1 km buffer and a qualitative
analysis of displacement effects on the species indicates this impact is believed to be of
negligible magnitude.

Walney Extension Offshore Wind Farm
Clarification Note – Cumulative Impact Assessment source data
2nd
December 2013 Page 17
5 Conclusion
5.1 This paper considers the data used to inform the cumulative collision assessments for herring
gull and lesser black-backed gull. Confidence in the source data used for lesser black-backed
gull is considered to be high. Confidence in herring gull data is considered to be low-moderate
due to the absence of collision estimates from projects within the foraging range of
Morecambe Bay SPA. However, a qualitative analysis of the data presented strongly suggests
that there is a negligible potential for a significant effect on this species.
5.2 Data relating to collision risk for lesser black-backed gull is available from a number of Tier 1-3
Projects (Ormonde, Walney I &II and West of Duddon Sands) although a degree of
interpretation is required in order to provide a consistent metric upon which to base a
cumulative assessment. Data from one Tier 4 project (Burbo Bank Extension) is available and
the quality of this data is considered to be high, as the analytical methodology is consistent
with that undertaken at Walney Extension. Lower quality data is available for one Tier 2 project
(Gwynt-y-Môr) three Tier 1 projects (Burbo Bank, North Hoyle and Rhyl Flats) presented in the
Gwynt-y-Môr Appropriate Assessment and one Tier 5 project (Rhiannon).
5.3 Also considered in this Paper is the data used to inform the cumulative displacement
assessments for Manx shearwater, guillemot, razorbill and red-throated diver. No displacement
analyses following the guidance published by Natural England and JNCC (2012) have been
carried out in any of the additional four projects included in the cumulative assessment for
Walney Extension due to these projects having been completed before the publishing of the
guidance. However, population data presented in each of the assessments provide guidance on
the number of birds of each species utilising each wind farm area and therefore the likely
displacement effects as a result of each wind farm. Although, no analyses have been carried
out it is believed that confidence in the data is high due to the population data presented
which is relatively similar across the four additional wind farms.
5.4 Additional analyses, relating to the cumulative collision risk to lesser black-backed gull and
impacts on Manx shearwater are presented in NIRAS Consulting (2013a) and NIRAS Consulting
(2013c), respectively. Following this review the conclusions drawn for herring gull, red-throated
diver, guillemot and razorbill in Chapter 13 of the Walney Extension Environmental Statement
(document reference 10.1.13) and Annex B.7.E of the Walney Extension Environmental
Statement (document reference 10.2.29) are considered to be appropriate.
Walney Extension Offshore Wind Farm
Clarification Note – Cumulative Impact Assessment source data
2nd
December 2013 Page 18
6 References
Band, W., Madders, M., and Whitfield, D. P., 2007. Developing field and analytical methods to
assess avian collision risk at wind farms. In: de Lucas, M., Janss , G. F. E., and Ferrer, M., eds. Birds
and wind farms: risk assessment and mitigation. Madrid: Quercus.
Band, B., 2011. Using a collision risk model to assess bird collision risks for offshore windfarms.
Thetford: BTO.
Band, B., 2012. Using a collision risk model to assess bird collision risks for offshore wind farms –
with extended method. [Online]. Available at: http://www.bto.org/science/wetland-and-
marine/soss/projects (Accessed July 2013).
BERR, 2008. Appropriate Assessment with regard to Gwynt-y-Mor. Department for Business,
Enterprise & Regulatory Reform.
Centrica Energy, 2012. Irish Sea Zone: Zonal Appraisal and Planning (ZAP) Report. Chapter 13.
Ornithology. [Online]. Available at: http://www.centrica.com/celticarray/ (Accessed July 2013).
Chamberlain, D.E., Rehfisch, M.R., Fox, A.D., Desholm, M. and Anthony, S.J, 2006. The effects of
avoidance rates on bird mortality predictions made by wind turbine collision risk models. Ibis, 148,
pp. 198-202.
DECC, 2011. Record of the Appropriate Assessment for Docking Shoal Wind Farm, Race Bank Wind
Farm and Dudgeon Wind Farm. Department of Energy and Climate Change.
DONG Energy, 2013. Walney Extension Offshore Wind Farm Environmental Statement Chapter 13:
Offshore Ornithology. London: DONG Energy.
Ecology Consulting, 2005. Ormonde Proposed Offshore Wind Farm. Ornithological Impact
Assessment. Durham: Ecology Consulting.
JNCC and Natural England, 2013. JNCC and Natural England Suggested Tiers for Cumulative Impact
Assessment.
Krijgsveld, K.L., Fijn, R.C., Japink, M., van Horssen, P.W., Heunks, C., Collier, M.P., Poot, M.J.M.,
Beukers, D. and Dirksen, S., 2011. Effect studies Offshore Wind Farm Egmond aan Zee. Flux, flight
altitude and behaviour of flying birds. Culemborg: Bureau Waardenburg.
Natural England and JNCC, 2012. Joint Natural England and JNCC Interim Advice Note – Presenting
information to inform assessment of the potential magnitude and consequences of displacement of
seabirds in relation of Offshore Windfarm Developments. Peterborough: JNCC.
NIRAS Consulting, 2013a. Walney Extension Offshore Wind Farm. Clarification Note: SPA
Apportioning and PBR analysis. Cambridge: NIRAS Consulting Ltd.
NIRAS Consulting, 2013b. Walney Extension Offshore Wind Farm. Clarification Note: Collision risk
modelling Options and Potential Collision Height. Cambridge: NIRAS Consulting Ltd.
NIRAS Consulting, 2013c. Walney Extension Offshore Wind Farm. Manx Shearwater Displacement.
Cambridge: NIRAS Consulting Ltd.
Npower renewables, 2007. Gwynt y Môr Offshore Wind Farm Environmental Statement Chapter 6
The existing biological environment.
NWP Offshore Ltd., 2002. North Hoyle Offshore Wind Farm Environmental Statement Chapter 5
Assessment of Environmental Impacts. [Online]. Available at:
http://www.rwe.com/web/cms/mediablob/en/312158/data/312146/1/rwe-innogy/sites/wind-
offshore/in-operation/north-hoyle/environment/environmental-statement/chapter5.pdf (Accessed
July 2013).

Walney Extension Offshore Wind Farm
Clarification Note – Cumulative Impact Assessment source data
2nd
December 2013 Page 19
RPS, 2006a. Walney Offshore Windfarm Environmental Statement. DONG Energy.
RPS, 2006b. West of Duddon Sands Offshore Windfarm Ornithological Impact Assessment. St Ives:
RPS.
Seascape Energy Ltd., 2002. Burbo Offshore Wind Farm – Ornithology. Final Report. [Online].
Available at:
http://www.dongenergy.com/SiteCollectionDocuments/New%20Corporate/Burbo/BurboAppVol4B
Birds.pdf (Accessed 30 October 2012).
Seascape Energy Ltd., 2008. Burbo Offshore Wind Farm – Construction Phase Environmental
Monitoring Report. Warrington: Hyder Consulting Ltd.
SNH, 2010. Use of Avoidance Rates in the SNH Wind Farm Collision Risk Model. [Online]. Available
at: http://www.snh.gov.uk/docs/B721137.pdf (Accessed July 2013).
Thaxter, C.B., Lascelles, B., Sugar, K., Cook, A.S.C.P., Roos, S., Bolton, M., Langston, R.H.W. and
Burton, N.H.K., 2012. Seabird foraging ranges as a preliminary tool for identifying candidate Marine
Protected Areas. Biological Conservation, 156, pp. 53-61.
Warwick Energy, 2002. Barrow Offshore Wind Farm Environmental Impact Statement. Helsby: RSK
Environment Limited.

Walney Extension Offshore Wind Farm
Clarification Note – Cumulative Impact Assessment source data
2nd
December 2013 Page 20
7 Appendix 1 – Tiered approach for cumulative assessment
Table 11: Suggested tiers for undertaking a staged cumulative impact assessment Tier
description.
Consenting or construction stage Data availability
Tier 1 Built and operational projects should be included within the cumulative assessment where they have not been included within the environmental characterisation survey, i.e. they were not operational when baseline surveys were undertaken, and/or any residual impact may not have yet fed through to and been captured in estimates of “baseline” conditions e.g. “background” distribution or mortality rate for birds.
Pre-construction (and possibly post-construction) survey data from the built project(s) and environmental characterisation survey data from proposed project (including data analysis and interpretation within the ES for the project).
Tier 2 Tier 1 + projects under construction As Tier 1 but not including post-construction survey data
Tier 3 Tier 2 + projects that have been consented (but construction has not yet commenced)
Environmental characterisation survey data from proposed project (including data analysis and interpretation within the ES for the project) and possibly pre-construction survey data from built project.
Tier 4 Tier 3 + projects that have an application submitted to the appropriate regulatory body that have not yet been determined
Environmental characterisation survey data from proposed project (including data analysis and interpretation within the ES for the project)
Tier 5 Tier 4 + projects that the regulatory body are expecting an application to be submitted for determination (e.g. projects listed under the Planning Inspectorate programme of projects)
Possibly environmental characterisation survey data (but strong likelihood that this data will not be publicly available at this stage).
Tier 6 Tier 5 + projects that have been identified in relevant strategic plans or programmes (e.g. projects identified in Round 3 wind farm zone appraisal and planning (ZAP) documents)
Historic survey data collected for other purposes/by other projects or industries or at a strategic level.