
Walking Assistant - A Mobile Aid for the Visually-Impaired
82
WALKING ASSISTANT - A MOBILE AID FOR THE VISUALLY-IMPAIRED A Thesis Presented to the Faculty of California Polytechnic State University San Luis Obispo In Partial Fulfillment of the Requirements for the Degree Master of Engineering in Computer Science by Adin Miller June 2014
Transcript of Walking Assistant - A Mobile Aid for the Visually-Impaired

WALKING ASSISTANT - A MOBILE AID FOR THE VISUALLY-IMPAIRED
A Thesis
Presented to
the Faculty of California Polytechnic State University
San Luis Obispo
In Partial Fulfillment
of the Requirements for the Degree
Master of Engineering in Computer Science
by
Adin Miller
June 2014

c© 2014
Adin Miller
ALL RIGHTS RESERVED
ii

COMMITTEE MEMBERSHIP
TITLE: Walking Assistant - A Mobile Aid for theVisually-Impaired
AUTHOR: Adin Miller
DATE SUBMITTED: June 2014
COMMITTEE CHAIR: Lynne Slivovsky, Ph.D.Professor of Electrical Engineering
COMMITTEE MEMBER: David Janzen, Ph.D.Professor of Computer Science
COMMITTEE MEMBER: Franz Kurfess, Ph.D.Professor of Computer Science
iii

ABSTRACT
Walking Assistant - A Mobile Aid for the Visually-Impaired
Adin Miller
The most common navigation aid visually-impaired people employ is a white
cane, but, recently, technology has given rise to a varied set of sophisticated
navigation aids. While these new aids can provide more assistance to a visually-
impaired person than a white cane, they tend to be expensive due to a small
market segment, which in turn can reduce their accessibility. In an effort to
produce a technologically-advanced yet accessible navigation aid, an Android
application is proposed that detects and notifies users about obstacles within
their path through the use of a smartphone’s camera. While the smartphone
is mounted on a harness worn by the user, the Walking Assistant application
operates by capturing images as the user walks, finding features of objects within
each frame, and determining how the features have moved from image to image.
If it is discovered that an object is moving towards the user, the Walking Assistant
will activate the smartphone’s vibration mode to alert the user to the object’s
presence. Additionally, the user can control the Walking Assistant through the
use of either touch or voice commands. By conducting real-world tests, it was
determined that the Walking Assistant can correctly identify obstacles 42.1%
of the time, while generating false positive obstacle identifications only 15.0%
of the time. The accuracy of the Walking Assistant can be further improved
by implementing additional features, such as a fuzzy-decision-based thresholding
system or image stabilization.
Keywords: computer vision, smartphone application, optical flow, visually-
impaired
iv

TABLE OF CONTENTS
List of Tables viii
List of Figures ix
I. Introduction 1
II. Background 5
Computer Vision . . . . . . . . . . . . . . . . . . . . . . . . . . . . . . 5
OpenCV . . . . . . . . . . . . . . . . . . . . . . . . . . . . . . . . . . . 6
Computer Vision and OpenCV Algorithms . . . . . . . . . . . . . . . . 6
Image Pre-Processing . . . . . . . . . . . . . . . . . . . . . . . . . 6
Feature Point Detection & Optical Flow . . . . . . . . . . . . . . 7
Delaunay Triangulations . . . . . . . . . . . . . . . . . . . . . . . 7
Related Works . . . . . . . . . . . . . . . . . . . . . . . . . . . . . . . 8
III. Theoretical Framework 11
Shi-Tomasi Corner Detector Method . . . . . . . . . . . . . . . . . . . 11
Sub-Pixel Accurate Corner Locator Method . . . . . . . . . . . . . . . 12
Optical Flow . . . . . . . . . . . . . . . . . . . . . . . . . . . . . . . . 14
Collision Risk Estimation . . . . . . . . . . . . . . . . . . . . . . . . . 15
IV. User Experience 17
Starting the App . . . . . . . . . . . . . . . . . . . . . . . . . . . . . . 17
Running the App . . . . . . . . . . . . . . . . . . . . . . . . . . . . . . 19
Voice-Based Operation . . . . . . . . . . . . . . . . . . . . . . . . 19
Touch-Based Operation . . . . . . . . . . . . . . . . . . . . . . . . 21
Using the App . . . . . . . . . . . . . . . . . . . . . . . . . . . . . . . 21
Closing the App . . . . . . . . . . . . . . . . . . . . . . . . . . . . . . . 23
V. System Architecture 24
Main Function Modules . . . . . . . . . . . . . . . . . . . . . . . . . . 24
Delaunay Triangulation Modules . . . . . . . . . . . . . . . . . . . . . 26
VI. Implementation Details 30
Starting the App . . . . . . . . . . . . . . . . . . . . . . . . . . . . . . 30
v

Running the Object Detection and Collision Warning Processes . . . . 32
Stopping the App . . . . . . . . . . . . . . . . . . . . . . . . . . . . . . 34
VII. Experimentation and Results 37
Experimentation Test Format . . . . . . . . . . . . . . . . . . . . . . . 37
Experimental Setup . . . . . . . . . . . . . . . . . . . . . . . . . . . . . 40
Results and Analysis . . . . . . . . . . . . . . . . . . . . . . . . . . . . 40
Pre-Threshold Test Results . . . . . . . . . . . . . . . . . . . . . . 40
Single Object Tests . . . . . . . . . . . . . . . . . . . . . . 41
Result Analysis . . . . . . . . . . . . . . . . . . . . 42
No Object Tests . . . . . . . . . . . . . . . . . . . . . . . . 43
Result Analysis . . . . . . . . . . . . . . . . . . . . 44
Shadow Tests . . . . . . . . . . . . . . . . . . . . . . . . . 45
Result Analysis . . . . . . . . . . . . . . . . . . . . 46
Grass Tests . . . . . . . . . . . . . . . . . . . . . . . . . . 48
Result Analysis . . . . . . . . . . . . . . . . . . . . 48
Pre-Threshold Test Analysis . . . . . . . . . . . . . . . . . . . . . 49
Threshold Test Results . . . . . . . . . . . . . . . . . . . . . . . . 53
Single Object Tests . . . . . . . . . . . . . . . . . . . . . . 53
Result Analysis . . . . . . . . . . . . . . . . . . . . 54
No Object Tests . . . . . . . . . . . . . . . . . . . . . . . . 54
Result Analysis . . . . . . . . . . . . . . . . . . . . 55
Shadow Tests . . . . . . . . . . . . . . . . . . . . . . . . . 55
Result Analysis . . . . . . . . . . . . . . . . . . . . 56
Grass Tests . . . . . . . . . . . . . . . . . . . . . . . . . . 56
Result Analysis . . . . . . . . . . . . . . . . . . . . 56
Threshold Test Analysis . . . . . . . . . . . . . . . . . . . . . . . 57
VIII. Conclusion 59
Difficulties and Limitations . . . . . . . . . . . . . . . . . . . . . . . . 59
Outdoor Environment Difficulties . . . . . . . . . . . . . . . . . . 60
Hardware Limitations . . . . . . . . . . . . . . . . . . . . . . . . . 62
vi
Optical Flow Limitations . . . . . . . . . . . . . . . . . . . . . . . 63
Future Work . . . . . . . . . . . . . . . . . . . . . . . . . . . . . . . . 63
Closing Remarks . . . . . . . . . . . . . . . . . . . . . . . . . . . . . . 64
Bibliography 66
Appendices 70
A Walking Assistant Usability Evaluation Outline 71
Evaluation Goals and Objectives . . . . . . . . . . . . . . . . . . . . . 71
Methodology . . . . . . . . . . . . . . . . . . . . . . . . . . . . . . . . 71
Usability Evaluation Plan . . . . . . . . . . . . . . . . . . . . . . . . . 71
vii

LIST OF TABLESTable Page
1 Table of valid commands while choosing an input mode . . . . . . . . 18
2 Table of valid voice commands . . . . . . . . . . . . . . . . . . . . . . 20
3 Table of valid touch commands . . . . . . . . . . . . . . . . . . . . . 22
4 Results of the Pre-Threshold Single Object tests . . . . . . . . . . . . 41
5 Results of the Pre-Threshold No Object tests . . . . . . . . . . . . . 44
6 Results of the Pre-Threshold Shadow tests . . . . . . . . . . . . . . . 46
7 Results of the Pre-Threshold Grass tests . . . . . . . . . . . . . . . . 48
8 Overall results of the Pre-Threshold tests . . . . . . . . . . . . . . . . 50
9 Results of the Threshold Single Object tests . . . . . . . . . . . . . . 54
10 Results of the Threshold No Object tests . . . . . . . . . . . . . . . . 55
11 Results of the Threshold Shadow tests . . . . . . . . . . . . . . . . . 55
12 Results of the Threshold Grass tests . . . . . . . . . . . . . . . . . . 56
13 Overall results of the Threshold tests . . . . . . . . . . . . . . . . . . 57
viii

LIST OF FIGURESFigure Page
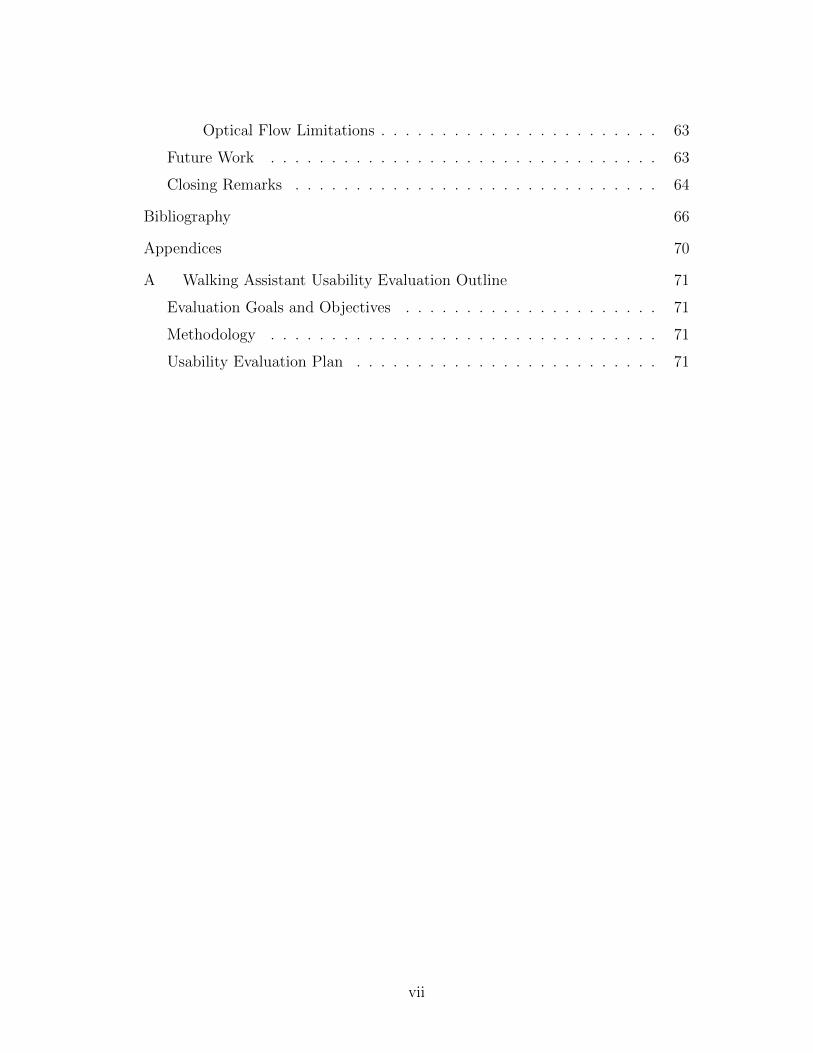
1 The UltraCane electronic mobility aid (Ltd 2012) . . . . . . . . . . . 2
2 The ‘K’ Sonar portable electronic mobility aid (of Education 2010) . 2
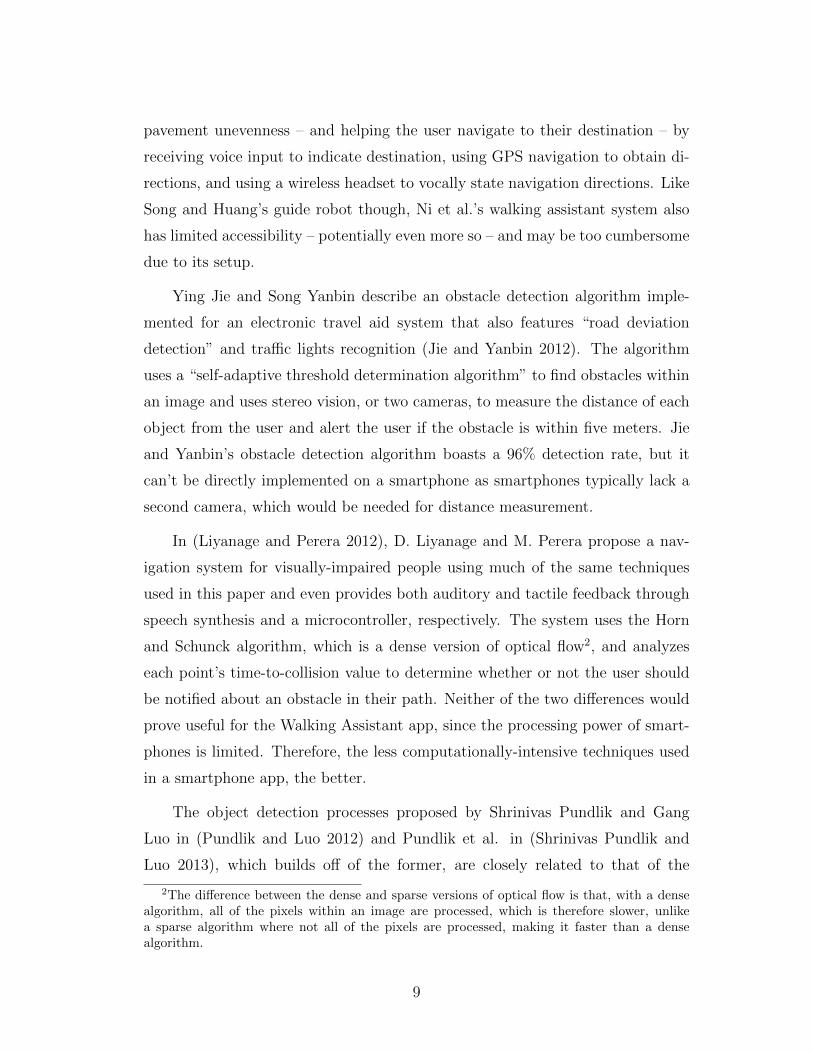
3 The LIGHBOT guide robot (Hanlon 2013b) . . . . . . . . . . . . . . 2
4 The iGlasses ultrasonice mobility aid (Amazon 2014) . . . . . . . . . 3
5 A Delaunay triangulation in the plane with circumcircles shown (Gjacquenot2013) . . . . . . . . . . . . . . . . . . . . . . . . . . . . . . . . . . . . 8
6 A flowchart displaying the entire system architecture of the WalkingAssistant . . . . . . . . . . . . . . . . . . . . . . . . . . . . . . . . . 25
7 A flowchart displaying the Main Function modules of the WalkingAssistant . . . . . . . . . . . . . . . . . . . . . . . . . . . . . . . . . 27
8 A flowchart displaying the Delaunay Triangulation modules of theWalking Assistant . . . . . . . . . . . . . . . . . . . . . . . . . . . . . 29
9 A flowchart displaying an overview of the Walking Assistant’s entireprocess . . . . . . . . . . . . . . . . . . . . . . . . . . . . . . . . . . . 31
10 A flowchart displaying an overview of the Walking Assistant’s objectdetection process . . . . . . . . . . . . . . . . . . . . . . . . . . . . . 35
11 A flowchart displaying an overview of the Walking Assistant’s collisionwarning process . . . . . . . . . . . . . . . . . . . . . . . . . . . . . . 36
12 Testing environments for each individual test . . . . . . . . . . . . . . 39
13 The Go Pro Harness and smartphone mount used for testing . . . . . 40
14 Feature point detection example for Waypoint tests . . . . . . . . . . 42
15 Feature point detection example for Fire Hydrant tests . . . . . . . . 43
16 Feature point detection example for Bike Locker tests . . . . . . . . . 43
17 Feature point detection example for Cobblestone tests . . . . . . . . . 45
18 Feature point detection example for Shadow Walk-Through tests . . . 47
19 Feature point detection example for Scattered Shadows tests . . . . . 47
20 Feature point detection example for Grass Only tests . . . . . . . . . 49
21 Scatter plot of Pre-Threshold CP, TTC pairs by test type . . . . . . 51
22 Distribution of true positive and false positive collision point valuesin the Pre-Threshold tests . . . . . . . . . . . . . . . . . . . . . . . . 52
ix

23 Distribution of true positive and false positive time-to-collision valuesin the Pre-Threshold tests . . . . . . . . . . . . . . . . . . . . . . . . 52
24 An example of how a shadow can hide a potential obstacle . . . . . . 61
x

I. Introduction
For visually-impaired people, the common method employed to navigate through
an outdoor environment is to use a white cane. Through the use of a white cane,
visually-impaired people can detect objects in their path by swinging their cane in
an arc and detecting objects based on if their cane hits something within the arc.
While the techniques associated with a white cane have gradually been refined
over the past couple of decades, they are not entirely without flaws. Specifically,
depending on the speed at which one walks and the length of the white cane
being used, a visually-impaired person may have only a small window of time to
react to the stimulus they receive when their white cane hits an object and avoid
the object.
Researchers have tried to improve upon how a visually-impaired person nav-
igates through their environment through the use of technology; some examples
of this include technologically-advanced white canes and guide robots. Techno-
logically advanced white canes mimic the functionality of a white cane, but, in
the case of the UltraCane (Figure 1), it uses ultrasonic waves to detect obstacles
either in front of or above the user (Ltd ).
Other variations on the white cane include the Sonar Traveller Cane, which
builds off of a standard white cane by adding sonar technology to detect low
hanging objects and determine the distance to an object (McGirr ). Instead of
building extra features into the cane itself, the ‘K’ Sonar (Figure 2) can clip onto
a white cane and can detect objects up to five meters away. As it is only an
attachment, the ‘K’ Sonar can also be used to search for objects around the user,
similar to the “way sighted people use a flashlight” (Zabonne ).
1
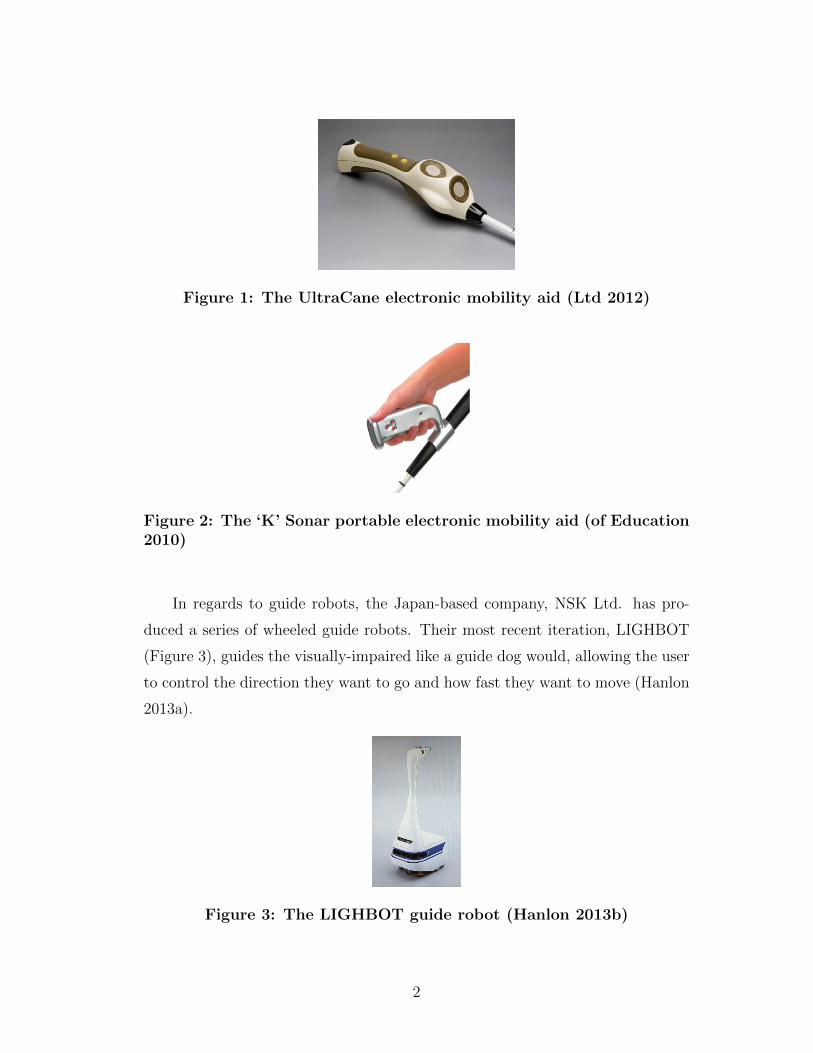
Figure 1: The UltraCane electronic mobility aid (Ltd 2012)
Figure 2: The ‘K’ Sonar portable electronic mobility aid (of Education2010)
In regards to guide robots, the Japan-based company, NSK Ltd. has pro-
duced a series of wheeled guide robots. Their most recent iteration, LIGHBOT
(Figure 3), guides the visually-impaired like a guide dog would, allowing the user
to control the direction they want to go and how fast they want to move (Hanlon
2013a).
Figure 3: The LIGHBOT guide robot (Hanlon 2013b)
2

Another example of assistive technology for visually-impaired users is the
iGlasses ultrasonic mobility aid (Figure 4), which are glasses that, like the Ultra-
Cane, uses ultrasonic waves and acts as a secondary mobility device, rather than
a primary one (AmbuTech 2014).
Figure 4: The iGlasses ultrasonice mobility aid (Amazon 2014)
The main theme throughout all of these examples is that the mentioned
equipment must be specially designed and thus, can be quite costly. Additionally,
the accessibility of these examples can also be hindered by size and ease of use.
To overcome obstacles presented by the assistive technology listed above,
this thesis looks to smartphones and their applications (apps) for several reasons.
First, smartphones are ubiquitous; according to an article from the website Busi-
ness Insider, by the end of 2013, “one out of 5 people in the world own a smart-
phone” (Heggestuen 2013). Secondly, the average smartphone is designed to fit in
a person’s pocket, so their size is typically small. Third, smartphone applications
can be specially designed for easy use and require less effort to build than design-
ing and constructing, for example, a guide robot. Fourth, smartphones have the
ability to recognize speech and can produce noise on cue. Lastly, smartphones
and their apps tends to be less expensive than specially designed equipment.
Additionally, it is standard for smartphones to come equipped with a camera,
which is a necessity when performing computer vision computations. Plus, the
processing power of smartphones are increasing with each year, increasing their
capability to carry out complex computations.
By creating a smartphone app, this thesis sets out to help visually-impaired
3

users better navigate an outdoor environment. Specifically, the object of this
thesis is to describe and evaluate the specification, design, and implementation
of an Android app that uses the camera on a smartphone to detect and inform
visually impaired users about obstacles in their path.
The app, further known as the Walking Assistant, is geared towards expand-
ing upon how a white cane is used, rather than replacing it altogether. The
Walking Assistant works by scanning the path the user is traveling through the
smartphone’s camera, looking for potential obstacles outside of the reach of the
user’s white cane. If an obstacle is identified and is determined to be moving
towards the user, the smartphone will alert the user by vibrating their phone.
Therefore, the visually-impaired user won’t have to rely solely on their white cane
to find obstacles in their path.
This thesis features nine chapters: Introduction, Background, Theoretical
Framework, Scenarios of System Use, Overall System Design, Technical Details,
Experimentation and Results, and Conclusion.
In Chapter 2, Background, the background of the Walking Assistant is dis-
cussed, covering employed computer vision techniques and related research. In
Chapter 3, Theoretical Framework, the theoretical framework of the Walking
Assistant is described. In Chapter 4, Scenarios of System Use, a step-by-step
walkthrough of how the Walking Assistant works from the user’s perspective is
given. In Chapter 5, Overall System Design, the control flow of the Walking
Assistant is described in a moderately technical manner. In Chapter 6, Techni-
cal Details, an in-depth technical description of the Walking Assistant is given,
describing and explaining the techniques and algorithms used. In Chapter 7,
Experimentation and Results, the experiments performed on the Walking Assis-
tant and the results of said experiments are described, followed by an analysis of
said results. Lastly, in Chapter 8, Conclusion, the following items are covered:
descriptions and analyses of difficulties and limitations associated with the app,
potential future work, and an overall conclusion.
4

II. Background
The Walking Assistant makes use of the Open Source Computer Vision Library,
OpenCV, which features “a comprehensive set of both classic and state-of-the-art
computer vision and machine learning algorithms,” while the Android operating
system1 is used to provide the interface between the user and the underlying
technology behind the app and smartphone (Itseez 2014).
Computer Vision
In general terms, the field of computer vision involves using computers to analyze
and obtain information from images, like humans do every day. As a human, one
can easily glean information about one’s surrounding environment using our sense
of sight, something which comes as first nature. Trying to program a computer to
do this is extremely challenging for plethora of reasons, but the field of computer
vision is dedicated to solving this problem.
Research in the field of computer vision started as far back as 1951 and one
of the earliest accomplishments was the creation of a program that could produce
“three-dimensional models of scenes consisting of polyhedral objects” (Eklundh
and Christensen 2001). Since then, research has expanded into areas such as
information extraction, pattern recognition, and “tracking and real-time analysis
of dynamic imagery” (Eklundh and Christensen 2001). Unfortunately, the world
has a dynamic and ever-changing nature, thus, all of the major achievements in
computer vision have struggled with being robust in dealing with all kinds of
1The Android operating system was chosen over iOS due to the amount of accessibility tothe underlying hardware Android allows, unlike iOS.
5

real-world data. For example, a computer may be able to detect a user’s hand
in a room that is brightly lit, but this task becomes much more difficult when
the user is in an outdoor environment where the amount of light can change over
time or due to the weather conditions.
The main push behind trying to achieve such a goal is that computers can
process information and make decisions much faster than humans can, thus, the
potential payoff of teaching a computer to gather information and data from
images is enormous due to its wide applicability. For example, computer vision
could be used to find a person of interest within a crowd or help a driver keep an
eye on his surroundings, areas where humans may lose attentiveness or can only
do so much.
OpenCV
The Open Source Computer Vision Library (OpenCV) is an open source library
that features implementations of various well-known algorithms for analyzing im-
ages and video. OpenCV was originally developed by a team from Intel with the
goal of creating “a library of [...] optimized and portable [computer vision] code”
that would help “advance [computer] vision research and disseminate [computer]
vision knowledge,” and since then has been downloaded over 2.5 million times
and features over 2,500 optimized algorithms (Culjak, Abram, Pribanic, Dzapo,
and Cifrek 2012). The app presented in this paper, the Walking Assistant, makes
use of the library’s image pre-processing, feature point detection, and optical flow
methods to detect obstacles in the user’s path.
Computer Vision and OpenCV Algorithms
Image Pre-Processing
Image pre-processing in computer vision involves editing or preparing an image
such that the following processing and analysis runs smoothly and produces viable
6

results. Specifically, this can include changing the size of the image, converting
the image from one color space to another, or “thresholding” an image such
that a group of pixels are painted white according to some set threshold and the
remaining pixels are painted black. Section VI. discusses the image pre-processing
techniques used within the context of the Walking Assistant.
Feature Point Detection & Optical Flow
One way to detect objects within an image is to find corners within an image
and mark them as feature points if the corner meets a set threshold. An object
can then be tracked in successive images through the use of optical flow and
the previous image’s feature points. Specifically, optical flow determines how
an object has moved within an image relative to the camera that captured the
image, by attempting to find the same corners that were marked as feature points
in the first image. Thus, the movement of an object can be determined based
on the movement of feature points from image to image. In its object detection
process, the Walking Assistant uses OpenCV’s goodFeaturesToTrack function to
gather feature points within an image and uses OpenCV’s calcOpticalFlowPyrLK
function to calculate the optical flow between two images. A deeper explanation
of how both functions work can be found in Sections III. and III., respectively.
Delaunay Triangulations
As a part of modeling the Walking Assistant’s collision warning process after
those proposed by Shrinivas Pundlik and Gang Luo and Pundlik et al, a two-
dimensional Delaunay triangulation is used to find the feature point neighbors
of each found feature point(Pundlik and Luo 2012; Shrinivas Pundlik and Luo
2013). According to Steven Fortune, a two-dimensional Delaunay triangulation
is constructed from a collection of Delaunay triangles, each of which is defined by
three feature points that all lie on the edge of an empty circumcircle, as shown in
Figure 5 (Fortune 1997). The choice to use a Delaunay triangulation stems from
how its resulting graph has applications for nearest neighbor problems and its
7

use in representing surface morphology in that it can help “capture the position
of linear features that play an important role in a surface” (Oudot ; Ersi ).
Figure 5: A Delaunay triangulation in the plane with circumcirclesshown (Gjacquenot 2013)
Related Works
In (Song and Huang 2001), Kai-Tai Song and Jui-Hsiang Huang describe a “novel
fast optical flow estimation algorithm” and an obstacle avoidance algorithm for
a laboratory-developed guide robot for the visually-impaired. The algorithm
uses the proposed optical flow algorithm, which “is fast and accurate enough
to be applied to real-time obstacle avoidance,” and calculates scene depth and
TTC to generate a safety distribution histogram, which is used to help the robot
determine in which direction to move at any given moment. Despite developing
a fast optical flow algorithm, as the robot is custom-designed, its accessibility is
more limited than a smartphone application.
Compared to Song and Huang’s work, Dejing Ni et al. present a much more
robust and more widely applicable walking assistant system for visually-impaired
people (Ni, Wang, Ding, Zhang, Song, and Wu 2013). Through the use of a
Kinect camera, ultrasonic sensors, GPS navigation, and a vibrotactile belt, the
system helps a visually-impaired user navigate through an outdoor environment
by altering users about uneven pavement and safe areas in their path – by using
a Kinect camera to determine the “safe direction,” ultrasonic sensors to deter-
mine pavement evenness, and a vibrotactile belt to indicate the safe direction and
8
pavement unevenness – and helping the user navigate to their destination – by
receiving voice input to indicate destination, using GPS navigation to obtain di-
rections, and using a wireless headset to vocally state navigation directions. Like
Song and Huang’s guide robot though, Ni et al.’s walking assistant system also
has limited accessibility – potentially even more so – and may be too cumbersome
due to its setup.
Ying Jie and Song Yanbin describe an obstacle detection algorithm imple-
mented for an electronic travel aid system that also features “road deviation
detection” and traffic lights recognition (Jie and Yanbin 2012). The algorithm
uses a “self-adaptive threshold determination algorithm” to find obstacles within
an image and uses stereo vision, or two cameras, to measure the distance of each
object from the user and alert the user if the obstacle is within five meters. Jie
and Yanbin’s obstacle detection algorithm boasts a 96% detection rate, but it
can’t be directly implemented on a smartphone as smartphones typically lack a
second camera, which would be needed for distance measurement.
In (Liyanage and Perera 2012), D. Liyanage and M. Perera propose a nav-
igation system for visually-impaired people using much of the same techniques
used in this paper and even provides both auditory and tactile feedback through
speech synthesis and a microcontroller, respectively. The system uses the Horn
and Schunck algorithm, which is a dense version of optical flow2, and analyzes
each point’s time-to-collision value to determine whether or not the user should
be notified about an obstacle in their path. Neither of the two differences would
prove useful for the Walking Assistant app, since the processing power of smart-
phones is limited. Therefore, the less computationally-intensive techniques used
in a smartphone app, the better.
The object detection processes proposed by Shrinivas Pundlik and Gang
Luo in (Pundlik and Luo 2012) and Pundlik et al. in (Shrinivas Pundlik and
Luo 2013), which builds off of the former, are closely related to that of the
2The difference between the dense and sparse versions of optical flow is that, with a densealgorithm, all of the pixels within an image are processed, which is therefore slower, unlikea sparse algorithm where not all of the pixels are processed, making it faster than a densealgorithm.
9

Walking Assistant system as it is based upon these two processes. Both of the
processes use “sparse image motion” either through sparse feature points (Pundlik
and Luo 2012) or sparse optical flow (Shrinivas Pundlik and Luo 2013). In
either case, the use of sparse image motion is more computationally efficient than
dense image motion, and is therefore better suited for use within a smartphone
application. The two processes differ in that Pundlik and Luo’s work uses a
fuzzy decision system to determine thresholds for local scale change and average
local motion and k-means clustering to group feature points likely that refer to a
single object, while Pundlik et al.’s work uses user-defined, tunable thresholds and
groups feature points using a Delaunay triangulation. Additionally, Pundlik et
al.’s work adds an external gyroscopic sensor to compensate for camera rotation
or bouncing that occurs while the person wearing the camera is walking.
10
III. Theoretical Framework
In order for the Walking Assistant to meet its proposed goal four different meth-
ods are required: the Shi-Tomasi corner detector method, the sub-pixel accurate
corner locator method, the Lucas-Kanade method, and the collision risk estima-
tion method used in Pundlik and Luo’s and Pundlik et al.’s work.
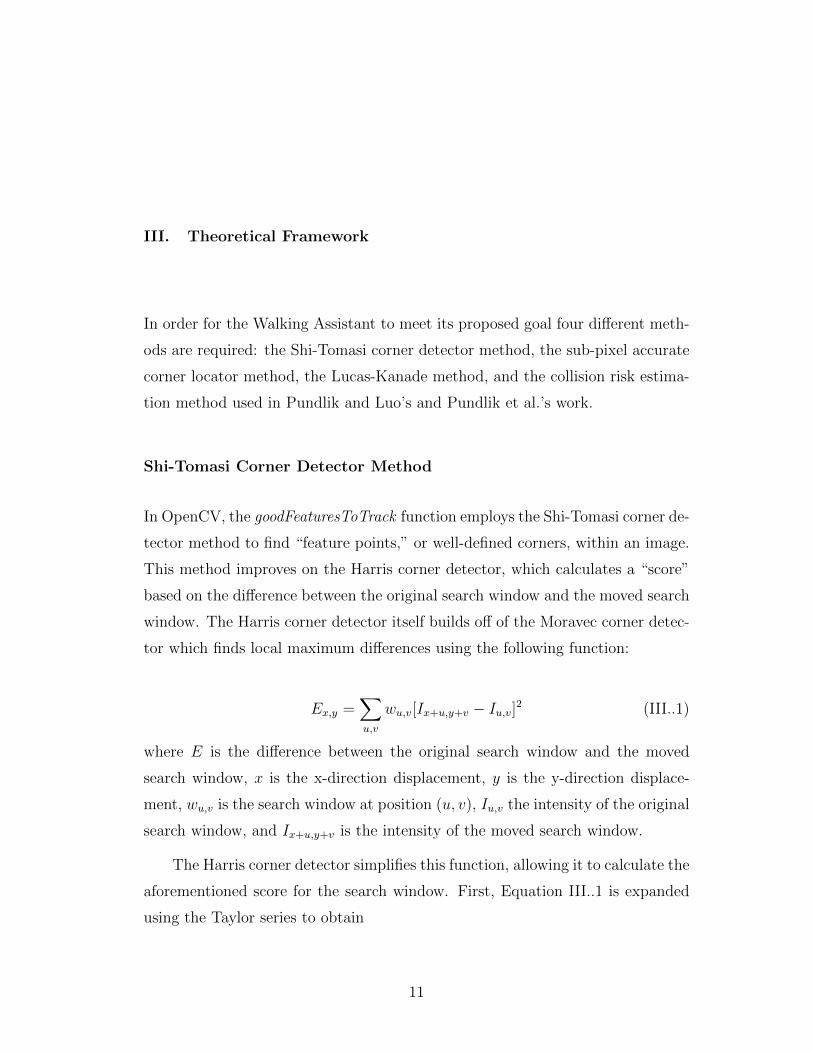
Shi-Tomasi Corner Detector Method
In OpenCV, the goodFeaturesToTrack function employs the Shi-Tomasi corner de-
tector method to find “feature points,” or well-defined corners, within an image.
This method improves on the Harris corner detector, which calculates a “score”
based on the difference between the original search window and the moved search
window. The Harris corner detector itself builds off of the Moravec corner detec-
tor which finds local maximum differences using the following function:
Ex,y =∑u,v
wu,v[Ix+u,y+v − Iu,v]2 (III..1)
where E is the difference between the original search window and the moved
search window, x is the x-direction displacement, y is the y-direction displace-
ment, wu,v is the search window at position (u, v), Iu,v the intensity of the original
search window, and Ix+u,y+v is the intensity of the moved search window.
The Harris corner detector simplifies this function, allowing it to calculate the
aforementioned score for the search window. First, Equation III..1 is expanded
using the Taylor series to obtain
11

Ex,y =∑u,v
wu,v[xX + yY +O(x2, y2)]2 (III..2)
where X = I ⊕ (−1, 0, 1) and Y = I ⊕ (−1, 0, 1). Equation III..2 can then be
written as
E(x, y) = Ax2 + 2Cxy +By2 (III..3)
where A = X2 ⊕ w, A = Y 2 ⊕ w, and A = (XY )⊕ w. Following this, Equation
III..3 is transformed into
E(x, y) = (x, y)M(x, y)T (III..4)
where M =
[A C
C B
].
Lastly, using the eigenvalues of M , or α and β, the following function is used
to calculate the search window’s score:
R = Det(M)− kTr(M)2 (III..5)
where Tr(M) = α + β = A+ B and Det(M) = αβ = AB − C2. If the resulting
score R exceeds a set threshold, the window is marked as a corner (Team d;
Harris and Stephens 1988). Instead of using the above function, the Shi-Tomasi
method uses
R = min(α, β) (III..6)
to calculate a pixel’s score, which is known to produce better results that the
Harris corner detector (Shi and Tomasi 1994; Team d).
Sub-Pixel Accurate Corner Locator Method
The feature points produced by goodFeaturesToTrack are then refined using the
OpenCV function cornerSubPix by finding accurate, sub-pixel corner locations of
12
each feature point. In order to obtain these locations, the position of each corner
is found by iteratively calculating the new corner position, q, that minimizes εi.
In using cornerSubPix, it first starts with the following equation:
εi = DITpi × (q − pi) (III..7)
where DITpi is an image gradient at one of the points pi within the neighborhood,
or search window, of q. Equation III..7 can then be converted into the following
system of equations:
∑i
(DIpi ×DITpi)−∑i
(DIpi ×DITpi × pi) (III..8)
where εi is set to zero and the gradients are summed within a neighborhood of q.
Equation III..8 be further reduced by substituting G for the first gradient term
and b for the second gradient term:
q = G−1 × b (III..9)
. Using this process, cornerSubPix iteratively “sets the center of the neighbor-
hood window” at the newly determined q until “the center stays within a set
threshold” (Team a).
Through the arguments passed to cornerSubPix, the following aspects of the
algorithm can be specified: half of the side length of q’s neighborhood, half of
the size of the “dead region in the middle of the search zone over which the
summation in [Equation III..8] is not done,” and the termination criteria for
when the function should stop iterating (Team a). For cornerSubPix, the Walking
Assistant specifies a 5 x 5 half-side-length – or a neighborhood of size 11 x 11
– and a -1 x -1 dead zone – or no dead zone. As for the termination criteria, a
maximum of twenty iterations and an accuracy of 0.03 are specified.
13

Optical Flow
While OpenCV features a variety of optical flow implementations, the calcOpti-
calFlowPyrLK function was used in the Walking Assistant. This function employs
the iterative Lucas-Kanade method to find a set of feature points within a second
image that correspond to the set of feature points found in a first image using
goodFeaturesToTrack.
Specifically, the Lucas-Kanade method is an image alignment algorithm that
“[moves], and possibly [deforms] a template to minimize the difference between
the template and an image” where the sum of the squared between the template,
or the first image, and the second image is minimized using
∑x
[I(W (x; p)− T (x)]2 (III..10)
. In Equation III..10, W (x; p) refers to the “parameterized set of allowed warps,”
where x is a pixel in the coordinate frame of template T and, in the case of optical
flow, p = (px, py)T is a vector of the x, y coordinate plane parameters. Lastly,
I(W (x; p)) is the sub-pixel location of x in I as W (x; p) takes x and maps it to
the sub-pixel location W (x; p) (Baker and Matthews 2004; Lucas and Kanade
1981).
As a part of OpenCV’s calcOpticalFlowPyrLK function, the Lucas-Kanade
method uses a 3 x 3 sub-region of the first image as the template and attempts
to find the “optical flow” vector p that produces the position of the sub-region
within the second image (Team c). As calcOpticalFlowPyrLK ’s documentation
notes, this process fails to find large motions, so Gaussian pyramids 1 are used,
which “consists of low-pass filtered, reduced density (i.e., downsampled) images of
the preceding level of the pyramid, where the base level is defined as the original
image” (Team c; Derpanis 2005).
Additionally, a specific variation of calcOpticalFlowPyrLK is employed, which
1The pyramid gets its name from the weighting function it uses to generate each level of thepyramid, in that the function closely approximates” the Gaussian smoothing function.
14

allows the user to specify size of the search window and the maximum number of
pyramid levels to be used for optical flow (Team b). For the Walking Assistant,
a 7 x 7 search window is used to search a maximum of 4 pyramid levels.
Collision Risk Estimation
The collision risk estimation method used in the Walking Assistant is based off
the processes used in the papers of Pundlik and Luo and Pundlik et al., which
involves breaking a set of feature points into neighborhoods using a Delaunay
triangulation and using collision point (CP) and time-to-collision (TTC) values
to determine collision risk (Pundlik and Luo 2012; Shrinivas Pundlik and Luo
2013).
After obtaining a second set of corresponding feature points from calcOpti-
calFlowPyrLK, a Delaunay triangulation is created and used to determine the
neighbors of each feature point in the triangulation. The number of neighbors
each feature point has is then reduced by removing any neighbors whose distance
from the feature point at root of the neighborhood exceeds a set distance thresh-
old. This reduction is based on the idea that the farther apart two feature points
are, the less likely it is they both refer to the same object.
With the “closest” neighbors of each feature point identified, the TTC and
CP values that make up the collision risk estimation are calculated on a local,
per-neighborhood basis. TTC is calculated by taking the inverse of the scale
change, or local expansion value, of each neighborhood. The local expansion
value is calculated using
ei =
∑pk,qk∈D(pi,qi)
(‖qi − qk‖ − ‖pi − pk‖)∑pk,qk∈D(pi,qi
‖pi − pk‖(III..11)
where pi is the ith feature point from the first set of feature points, qi is the
corresponding feature point in the second set of feature points, and D(pi, qi) is
the set of immediate feature point neighbors for (pi, qi) (Shrinivas Pundlik and
Luo 2013).
15

Rather than check the collision risk of each detected object, only the object,
or neighborhood, with the highest collision risk is considered as the user should be
alerted if there’s at least one object in their path. Additionally, by only analyzing
a single high-risk object, less work is required to determine if the user should be
notified which can make a difference when these calculations must occur quickly.
The object with the highest collision risk is determined to be the neighbor-
hood with the greatest aggregated CP. If the neighborhood’s aggregated CP and
local average TTC values are both within a set range, then the neighborhood
corresponds to an object that the user should be notified about.
16

IV. User Experience
This section describes how the Walking Assistant operates from the perspective
of the user. Specifically, this section explains how the user would start, run, and
stop the Walking Assistant.
Before continuing any further, it is important to note that the Walking Assis-
tant isn’t designed to replace the use of a white cane, but to act as an extension
of it. Thus, it is highly recommended that any and all users use the Walking
Assistant in conjunction with a white cane. Additionally, for best results, the
user should also use a Go Pro Camera harness with a camera mount to hold their
smartphone – with the camera facing outwards – when using the Walking Assis-
tant. The app can still be used if the user holds it at a 45◦ to the ground, but the
use of a Go Pro Camera harness is suggested. Before carrying out the following
instructions, it is assumed that the user is wearing their Go Pro Camera harness
with a phone mount and is ready to start navigating outdoors using their white
cane primarily.
Starting the App
Initially, the user will turn their smartphone on, navigate to the Walking Assistant
app, and launch it. As the Walking Assistant starts up, the app will vocally state
what the set input mode is. The input mode for the phone can be set to one of
three settings: voice, touch, and not set. Using the voice input mode, the user
can control the app using voice commands, while, for the touch input mode, the
17

Command Input Action Response
Choose voiceinput mode
Single tap,long tap
Sets inputmode to bevoice-based
“Voice input modechosen”
Choosetouch-basedinput mode
Two taps,long tap
Sets inputmode to betouch-based
“Touch input modechosen”
Help Three taps,long tap
Lists all of thevalid commands
“Valid commands in-clude: start, stop,end, close, cancel, andhelp. All are voice andtouch commands, ex-cept for cancel, whichis only a voice com-mand.”
Close Four taps,long tap
Closes the appli-cation
“Closing app”
Table 1: Table of valid commands while choosing an input mode
app is controlled using a series of taps and long taps1, where a series of short taps
refer to which command should be executed while a long tap confirms the user’s
command selection. The input mode can be “not set,” in that an input mode
has yet to be chosen.
Assuming this is the first time the app has been used by the user, he or she can
choose their desired input mode by inputting a single tap, followed by a long tap,
to choose the voice input mode or choose the touch input mode by inputting two
taps, followed by a long tap. Table 1 provides full descriptions of the commands
available while choosing an input mode. If, at some point, the user decides he or
she wants to change the input mode, it can be reset with a long tap while using
either the voice or touch input mode2. If the user accidentally taps the screen
too many times, whether they’re selecting an input mode or entering in a touch
command, the smartphone will detect this, reset the number to detected taps,
and state “invalid number of clicks detected” and “resetting number of clicks.”
1A long tap refers to the user holding their finger down on the screen for a second or untilthe smartphone responds by briefly vibrating.
2The input mode can only be reset while the object detection process isn’t running.
18

Running the App
After choosing an input mode, the user can now freely control the app based on
their chosen mode. The following two subsections will discuss how to operate the
app using the two input modes, voice-based or touch-based operation.
Voice-Based Operation
With the voice input mode chosen, the user can now control the app through
the use of voice commands, but before a voice command can be given, the Voice
Recognition API must first be started. The user can start this API by tapping
the screen once and the API will respond with a tone, indicating that it is ready
to receive a command from the user. After successfully receiving and recording
a command, the API will sound a confirmation tone and will take a moment to
determine which command the user has given . If the voice command is recognized
as a valid command, the smartphone will give the appropriate vocalized response;
otherwise, the smartphone will state that it did not recognize the command and
restart the Voice Recognition API.
The “start” voice command will start the object detection process and, once
the command is recognized, the Walking Assistant will respond by stating “start-
ing object detection in ten seconds.” By delaying the start of the object detection
process, it allows the user enough time to mount their smartphone in the Go Pro
Camera harness. Once the object detection process has been started, it can
be stopped by using either the “stop” or “end” voice commands. If the “end”
command is given, both the object detection process and the app itself will be
stopped, before which the smartphone will state “stopping object detection and
closing app.” The “stop” command operates almost exactly the same as the end
command, but it will only stop the object detection process, but not the app, and
cause the smartphone to state “stopping object detection.” If either the “stop” or
“end” command is given with the object detection process isn’t running, nothing
will happen besides the smartphone stating “object detection isn’t running.”
19

Command Action Response
Start Starts or restarts the ob-ject detection and collisionwarning processes after aten second delay
“Starting object detectionin ten seconds”
Stop Stops the object detectionand collision warning pro-cesses only if the object de-tection process is running
“Stopping object detection”
End Stops the object detectionand collision warning pro-cesses, and closes the appli-cation only if the object de-tection process is running
“Stopping object detectionand closing app”
Close Closes the application “Closing app”Cancel Stops the voice recognition
activity“Cancelling voice recogni-tion”
Help Lists all of the valid voicecommands
“Valid voice commands in-clude: start, stop, end,close, cancel, and help. Toreset input mode, inputlong tap.”
Unknowncommand
Restarts voice recognitionactivity
“Command not recognized.Please try again at thetone.”
Table 2: Table of valid voice commands
Other voice commands include the following: the “cancel” command, which
stops the Voice Recognition API and causes the smartphone to state “cancelling
voice recognition;” the “close” command, which closes the app and causes the
smartphone to state “closing app;” and the “help” command, which causes the
smartphone to vocally list all of the previously mentioned voice commands. Table
2 provides full descriptions of the commands available when the voice input mode
is chosen.
20

Touch-Based Operation
With the touch input mode chosen, the user can now control the app through
the use of touch commands. All touch commands are entered using a series of
taps and long taps, but what each combination of taps corresponds to depends on
whether or not the object detection process is running. Additionally, the “cancel”
command is not available while in touch input mode as it is a command specific
to touch input mode. Otherwise, the remaining commands operate the same way
and have the same vocal responses as their voice command counterparts.
Assuming that the object detection process currently isn’t running, the user
can enter either the “start” or the “close” touch commands. The user can give
the “start” command by tapping the screen once and following it with a long tap,
while the “close” command is given by tapping the screen twice and following
it with a long tap. Assuming now that the object detection process is running,
the “stop” and “end” touch commands can be entered. The “stop” command
is given by tapping the screen once and following it with a long tap, while the
“end” command is given by tapping the screen twice and following it with a long
tap. Regardless of whether the object detection process is running or not, the
“help” command can be given by tapping the screen three times and following
it with a long tap. Table 3 provides full descriptions of the commands available
when the touch input mode is chosen.
Using the App
Now that the user fully understands how to control the app, he or she can now
use it to better navigate through an outdoor environment. After starting the
object detection process and mounting his or her smartphone on their Go Pro
Camera harness, the user can now start walking as they normally do by swinging
their white cane in an arc in front of them to feel for any obstacles in their path.
The Walking Assistant will operate by detecting potential obstacles in front of
the user and determining if any of said obstacles will collide with the user. If such
21

Command Input Action Response
Start Single tap, longtap (valid onlyif object detectionprocess isn’t run-ning)
Starts or restartsthe object detec-tion and collisionwarning processesafter a ten seconddelay
“Starting object detectionin ten seconds”
Close Two taps, longtap (valid onlyif object detectionprocess isn’t run-ning)
Closes the appli-cation
“Closing app”
Stop Single tap, longtap (valid onlyif object detec-tion process isrunning)
Stops the objectdetection andcollision warningprocesses onlyif the objectdetection processis running
“Stopping object detection”
End Two taps, longtap (valid onlyif object detec-tion process isrunning)
Stops the objectdetection andcollision warningprocesses, andcloses the appli-cation only if theobject detectionprocess is running
“Stopping object detectionand closing app”
Help Three taps, longtap
Lists all of thevalid voice com-mands
“Valid voice commands in-clude: Start: one tap, longtap while object detectionisn’t running; Close: twotaps, long tap while ob-ject detection isn’t running;Stop: one tap, long tapwhile object detection isrunning; End: two taps,long tap while object de-tection is running; Help:three taps, long tap any-time; To reset input mode,input long tap”
Table 3: Table of valid touch commands
22
an obstacle is found, the smartphone will vibrate, alerting the user that there is
an obstacle on the ground in front of them. By giving an early warning about an
obstacle in their path, the user will know to move more cautiously by using their
white cane to feel for the obstacle, and giving them more time to react when they
encounter the detected obstacle.
Closing the App
Using voice or touch, the user can close the Walking Assistant in one of three
ways, either by giving the “end” command, giving the “close” command, or by
pressing their smartphone’s home button to exit out of the app.
23
V. System Architecture
This section details how all of the modules of the Walking Assistant app work
together and explains the purpose of each module. The entire app and its modules
can be broken into two main groups: modules that carry out the main functions
of the Walking Assistant and modules that create the Delaunay triangulation
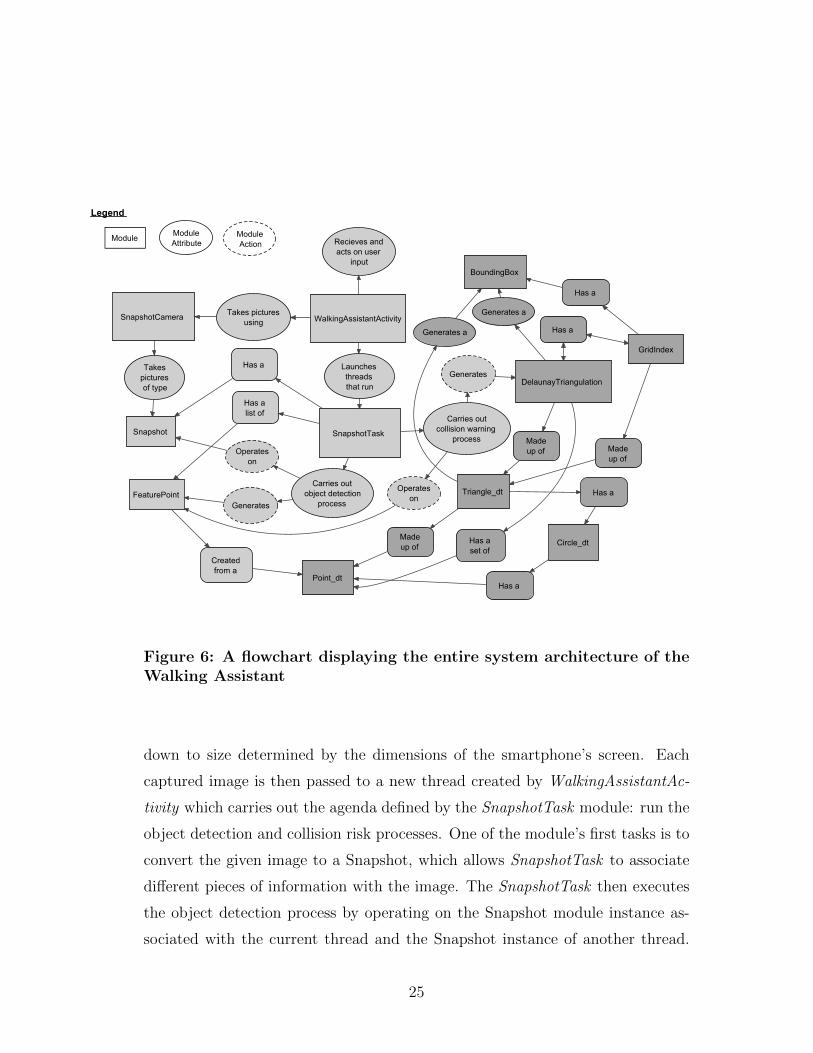
required for the collision warning process. For a full overview of the Walking
Assistant’s system design, refer to Figure 6.
Main Function Modules
The “Main Function” modules set up the app, interact with the user, and execute
the object detection and collision warning processes. The user interaction aspect
of the app is handled solely by the WalkingAssistantActivity module, which car-
ries out a variety of tasks. Its first task is to setup the entire app, preparing it to
receive and act on user input, by creating and allocating the necessary resources
to ensure the entire app runs smoothly. Its second task is to respond to received
input from the user. As described in Section IV., user input can in the form of ei-
ther touch or voice commands and the WalkingAssistantActivity will execute the
appropriate action for each command. Its third and last task is to start the object
detection and collision warning processes – when the specific command is given
–, which involves taking pictures with the smartphone’s camera and launching
threads for each captured image on which the two aforementioned process will
operate on.
To take pictures, WalkingAssistantActivity uses the SnapshotCamera mod-
ule whose only jobs are to capture an image every second and scale the image
24
WalkingAssistantActivity
DelaunayTriangulation
BoundingBox
Circle_dt
GridIndex
Point_dt
Triangle_dt
Recieves andacts on user
input
Launchesthreadsthat run
SnapshotCamera Takes picturesusing
Takespicturesof type
Snapshot SnapshotTask
Has a
Carries outobject detection
process
Carries outcollision warning
process
FeaturePointGenerates
Generates
Createdfrom a
Has alist of
Madeup of
Madeup of
Has a
Has a
Has a
Operateson
Operateson
Has aset of
Madeup of
Generates a
Generates a
Has a
Legend
Module ModuleAttribute
ModuleAction
Figure 6: A flowchart displaying the entire system architecture of theWalking Assistant
down to size determined by the dimensions of the smartphone’s screen. Each
captured image is then passed to a new thread created by WalkingAssistantAc-
tivity which carries out the agenda defined by the SnapshotTask module: run the
object detection and collision risk processes. One of the module’s first tasks is to
convert the given image to a Snapshot, which allows SnapshotTask to associate
different pieces of information with the image. The SnapshotTask then executes
the object detection process by operating on the Snapshot module instance as-
sociated with the current thread and the Snapshot instance of another thread.
25

During this process, potential obstacles that are found to be in both images are
detected and outlined using a collection of generated descriptive points, known as
feature points, defined by the FeaturePoint module. An instance of this module
holds references to the position of each feature point, as a Java Point object, its
corresponding feature point in the second image, a list of feature point neighbors,
and collision risk estimation values for the pair of feature points.
Once finished, the object detection process produces a collection of Feature-
Point instances, which SnapshotTask then passes to the collision warning process
as input. The collision warning process will break up the collection into groups
by creating and using a Delaunay triangulation1 to determine if an instance of a
FeaturePoint and its FeaturePoint neighbors refer to an object. For each Feature-
Point group, a local collision risk estimation is calculated as to whether or not
the object the group refers to will collide with the user within the near future.
If a large collision risk estimation is detected, the collision warning process will
warn the user about the object’s presence by vibrating their smartphone.
A flowchart for the Main Function modules can be seen in Figure 7.
Delaunay Triangulation Modules
When the SnapshotTask module creates a Delaunay triangulation, it does so
by using the Delaunay triangulation module set created by the members of the
Java Delaunay Triangulation project(?? ), which includes the following mod-
ules: DelaunayTriangulation, BoundingBox, GridIndex, Triangle dt, Circle dt,
and Point dt. Of the set, DelaunayTriangulation acts as the main module and
the remaining modules are all used to create and support a Delaunay triangula-
tion.
The creation process is started when the SnapshotTask module passes a col-
lection of FeaturePoint instances from the object detection process to the collision
warning process, which are then passed to the DelaunayTriangulation module.
1An in-depth description of a Delaunay triangulation and how they are created can be foundin the Section II..
26

WalkingAssistantActivity
Recieves andacts on user
input
Launchesthreadsthat run
SnapshotCamera Takes picturesusing
Takespicturesof type
Snapshot SnapshotTask
Has a
Carries outobject detection
process
Carries outcollision warning
process
FeaturePointGenerates
Has alist of
Operateson
Operateson
Legend
Module
ModuleAttribute
ModuleAction
Figure 7: A flowchart displaying the Main Function modules of theWalking Assistant
From these instances, the position of each “corresponding” feature point, in Point
form, is converted to an instance of the Point dt module. This module behaves
similarly to that of the Java Point class, but a Point dt instance can refer to
a point in either two-dimensional or three-dimensional space, and the module
features extra methods required to turn the Point dt instances into a Delaunay
triangulation.
The newly-converted Point dt instances are used to create a series of Trian-
gle dt instances, where each instance is defined by three Point dt instances and
27

a cirumcircle – a Circle dt instance defined by a Point dt center and a radius of
type double – whose edge all three points lie on. The grid of triangles created by
the collection of Triangle dt instances is what makes up a Delaunay triangula-
tion. As for the GridIndex module, its author, Aviad Segev, gives the following
description:
Grid Index is a simple spatial index for fast pointtriangle location.The idea is to divide a predefined geographic extent into equal sizedcell matrix (tiles). Every cell will be associated with a triangle whichlies inside. [Therefore], one can easily locate a triangle in close prox-imity of the required point by searching from the point’s cell triangle2.
The GridIndex module also contains an instance of the BoundingBox module,
which defines a bounding box for the entire geographic space covered by a specific
GridIndex instance. This bounding box is, in turn, defined by its lower left and
upper right corners, which are of type double. The DelaunayTriangulation can
also generate a bounding box, but instead of using an instance of the BoundingBox
module, it uses two Point dt instances to define the lower left and upper right
corners of the box.
The result of all of these modules working together is a Delaunay trian-
gulation, which the collision warning process can then use to determine which
neighbors a feature point has and calculate the collision risk estimation using
each feature point and its neighbors.
A flowchart for the Delaunay Triangulation modules can be seen in Figure 8.
2This quote is taken directly the creator’s comments within the source code.
28

DelaunayTriangulation
BoundingBox
Circle_dt
GridIndex
Point_dt
Triangle_dt
Madeup of
Madeup of
Has a
Has a
Has a
Has aset of
Madeup of
Generates aGenerates a
Has a
Legend
Module
ModuleAttribute
Figure 8: A flowchart displaying the Delaunay Triangulation modulesof the Walking Assistant
29

VI. Implementation Details
This section is broken into three parts: starting the Walking Assistant, running
object detection and collision warning process, and stopping the app. A full
overview of the process flow of the Walking Assistant app can be seen in Figure
9.
Starting the App
When the user launches the Walking Assistant, the app will carry out the neces-
sary setup to prepare for user input and to start the object detection and collision
warning processes. Once it has finished setting up, the app will await input from
the user. Initially, input from the user will come in the form of “taps” (i.e. tap-
ping the screen) and “long taps” (i.e. tapping the screen and holding down),
which are used to choose the preferred input mode, either voice or touch. If the
user would prefer to use voice commands, the user must tap the screen once and
then perform a long tap to confirm their choice to use the voice input mode.
Otherwise, if the user chooses to use the touch input mode, the user must tap
the screen twice, as opposed to once and follow it with a long tap. In either
scenario, the app will vocally state which input mode has been chosen. At this
point, the user can start issuing commands or, if they desire, change the chosen
input mode. All touch-based commands use a combination of taps and long taps
and a full list of touch-based commands are listed in Table 3. If an invalid input
combination is entered, the app will reset the tap count and verbally confirm the
action.
As for voice commands, Android’s SpeechRecognizer activity will listen for
30

Start
End
Start command given,app waits 5 seconds
Launcher thread starts
Image taken
Worker threadlaunched with
image
Image added to image pool
Are both imagesrequired for optical
flow available?
Start objectdetection process
Wait until notified thatother image is available YesNo
Thread isrestarted
Start collisionwarning process
Is there anobject in theuser's path?
Vibrate user'ssmartphone
End threadNo
Yes
Threads waiting on imagejust added to image pool
are restarted
Stop or endcommand is
given, orapp isclosed
Loops untilstopped by
user
LegendOn Main UI thead
On Launcher thread
On Worker thread
Note: A voice command can be given at anytime and will run on the Main UI thread
Figure 9: A flowchart displaying an overview of the Walking Assistant’sentire process
the command and make a guess as to what the user said. The results of the
SpeechRecognizer will be compared against a list of valid commands, as listed in
Table 2. If a match is found, the app will carry out the voice command’s action
and verbally state the command’s response through the use of the SpeechToText
class. If a match isn’t found, the app will carry out the action and verbally say
the response for the “unknown command” voice command. To start the app’s
object detection and collision warning processes, the user must give the “start”
31

command, which will first verbally state “starting object detection in ten sec-
onds” before waiting ten seconds1 before starting the object detection process.
Running the Object Detection and Collision Warning Processes
Once the ten seconds are up, the app will create a thread pool and start a new
thread, further known as the Launcher thread, to keep the following intensive
work off of the main UI thread. On the Launcher thread, every second, a picture
is taken and a new thread, further known as a Worker thread, from the thread
pool is launched to carry out the object detection and collision warning processes
using the recently-taken picture.
Upon being launched, a Worker thread will add their image to the pool of im-
ages2 available for optical flow calculations and will either pause itself or continue
on. Whether the thread pauses itself or not depends on if the chronologically-
next image3, which is required to calculate optical flow, is present within the
image pool. If the image can’t be found in the image pool, the Worker thread
will pause itself, through the use of the Object class’ wait method, and wait for
another Worker thread to notify it, through the use of the Object class’ notify
method, indicating that the image the former thread requires is now available.
Otherwise, the Worker thread will start the object detection process using its
own image and the chronologically-next image as input. A flowchart of the ob-
ject detection process can be seen in Figure 10.
The first step of the four-step object detection process consists of image
pre-processing, such as grayscale conversion and cropping. The two images are
first converted from the red-green-blue (RGB) color space to grayscale and then
cropped down to a smaller size. The two images are cropped horizontally , since
1The app pauses ten seconds before starting the object detection and collision warningprocesses to allow the user enough time to place their phone in their Go Pro Camera harnessin preparation for using the app.
2Since this image pool will be accessed by several different threads, synchronization is em-ployed to avoid memory consistency errors and thread interference(Corporation 2014).
3For example, if a picture is taken at time t = 1, the picture taken at time t = 2 is requiredto calculate optical flow.
32

the app should only detect objects directly in front of the users rather than
objects off to the side of the user. Additionally, cropping the two images reduces
the amount of work required to analyze each image, since less pixels must be
analyzed.
For the second step, a set of feature points are found within the first image
using the OpenCV function goodFeaturesToTrack. The locations of said feature
points are then refined in order to obtain accurate, sub-pixel positions for the
points using OpenCV’s cornerSubPix function.
The third step involves calculating the optical flow of the two pictures, by
determining how the feature points obtained from the first image have moved in
the second image through the use of OpenCV’s calcOpticalFlowPyrLK function.
For the set of feature points passed to calcOpticalFlowPyrLK, a corresponding
set of feature points are found within the second image and is passed back.
Status and error values are also returned, as calcOpticalFlowPyrLK can only
estimate the positions of the corresponding feature points or it may not find
corresponding points at all. The status and error values indicate, respectively,
whether a corresponding feature point has been found or not, and the value of
the error – the calculated minimum difference between the feature point’s sub-
region in the first image and the corresponding region in the second image – of
the corresponding point.
In the fourth step and final step of the object detection process, the amount
of feature point pairs are reduced by keeping pairs that were found to have a
corresponding point in the second image and have an error value less than that
of a set error threshold. The remaining pairs of feature points are then passed to
the collision detection process to determine if the user should be notified about
any of the detected objects, as defined by the feature point pairs, found within
the two images. A flowchart of the collision warning process can be seen in Figure
11.
After the object detection process has produced a set of feature point pairs,
the collision warning process breaks the pairs up into neighborhoods based on a
Delaunay triangulation created from feature points from the second image. For
33

each neighborhood, its CPs values are aggregated and the neighborhood with
the highest aggregated CP value is considered to be the object with the highest
collision risk. After calculating the local average TTC of the neighborhood, if
both of the aforementioned values fall within a predefined range, the Walking
Assistant has identified an object in the user’s path and notifies them by vibrating
their smartphone.
Stopping the App
The object detection and collision risk processes will run endlessly until the user
stops the app or the app is paused and destroyed by the user’s smartphone. The
user can stop the two processes at anytime by giving either the “stop” or “end”
command through the chosen input mode. Both of these commands stop the two
processes and the thread pool, and give a vocal confirmation corresponding to
the recognized command, but the end command will also close the app, unlike
the stop command.
34

Both images areconverted to
grayscale
Both imagesare croppedhorizontally
FP'sare found within
first image
The positionsof each FPare refined
Optical flow isused to find
correspondingFP's the in
second image
Keep the FP andits corresponding
FP in FP-f
Start
End
Is the FP validand does it not
exceed the errorthreshold?
For eachFP in FP-s
Throw away theFP and its
correspondingFP in FP-f
YesNo
Add kept pairsof FP's to a list
Two RGBimages
Input
List ofFP pairs
Output
Legend
FP - Feature point
FP-f - 1st set of feature points
FP-s - 2nd set of feature points
Figure 10: A flowchart displaying an overview of the Walking Assis-tant’s object detection process
35

A DTri iscreated from
FP-s
Start
End
List ofFP Pairs
Input
The immediate FPneighbors of each FPin FP-s are obtained
using the DTri
Legend
FP - Feature point
FP-f - 1st set of feature points
FP-s - 2nd set of feature points
DTri - Delaunay triangulation
CP - Collision point value
TTC - Time-to-collision value
Is the distancebetween the
neighbor and theroot FP less than thedistance threshold?
For each neighborof each FP in FP-s
Remove the neighborfrom the FP'sneigbor list
NoAdd the neighbor
to the FP'sneigbor list
Yes
The CP and TTCof each FP and itsneighborhood is
calculated
The FP with thegreatest aggregated
CP is determined
The TTC of thepreviously-determeind
FP is calculated
Does the FP'saggregated CP
and average TTCexceed theirrespective
thresholds?No
Vibratethe user's
smartphoneYes
Figure 11: A flowchart displaying an overview of the Walking Assis-tant’s collision warning process
36

VII. Experimentation and Results
The following sections describe the test format and setup of the experimentation
carried out using the Walking Assistant. Following this, the results of the tests
are then analyzed.
Experimentation Test Format
In order to test the Walking Assistant, two sets of tests were conducted. The
first set of tests is used to determine the thresholds that identify valid CP and
TTC values which correspond to a valid detection of an object. The second test
set involves testing the newly-set CP and TTC values.
Each set of tests consists of four different types of tests, which attempt to
cover the different situations the average user might encounter while using the
Walking Assistant.
The first test type, known as the Single Object tests, deals with detecting a
single obstacle in the user’s path and is broken up into three individual tests. The
first test places a fire hydrant in the user’s path (Fire Hydrant), the second uses
a map directory sign (Waypoint), while the third uses a row of closely-grouped
bicycle lockers (Bike Lockers).
The second test type, known as the Surface Type tests, deals with the differ-
ent ground surface types a user may walk on and doesn’t feature any obstacles;
this type is also broken up into three individual tests. The first test occurs on a
cobblestone path (Cobblestone), the second occurs on a typical sidewalk (Side-
walk), while the third occurs on an asphalt road (Asphalt).
37

The third test type, known as the Shadow tests, deals with the presence
of shadows in the user’s path and, like the previous test type, it is broken up
into three individual tests and doesn’t feature any obstacles. The first test deals
with if the user is running the Walking Assistant while the user is entirely within
a shadow (Full Shadow). The second test involves walking through a single,
relatively solid shadow (Shadow Walk-Through), while the third involves walking
through scattered shadows (Scattered Shadows).
The fourth and last test type, known as the Grass tests, deals with running
the Walking Assistant while the user is walking on grass and is made up of only
two tests. The first test involves detecting a fire hydrant on the grass (Grass
Obstacle), while the second test doesn’t involve detecting an obstacle (Grass
Only).
Each of the areas used for testing across the four test types can be seen in
Figure 12.
For each pair of images taken during each test, the object detection and
collision warning processes produces one of four possible outcomes, which include:
a true positive, when an object within the smartphone’s camera’s view is correctly
identified as an obstacle and the user is notified; a false positive, when the user
is notified and an obstacle isn’t within view or anything other than an obstacle
is incorrectly identified as one; a true negative, when the user isn’t notified and
an obstacle isn’t within view; and a false negative, when the user isn’t notified
and an obstacle is within view. Out of the four outcomes, the true positive, false
positive, false negative outcomes produce the most insightful information, so the
true negative rates will not be discussed as deeply as the other outcomes.
All of the tests were carried out on sunny days between the hours of 12 p.m.
and 5 p.m., so as to avoid sudden changes in lighting caused by clouds and to
minimize the length of the shadow cast by the tester due to the angle of the sun.
38

(a) Single Object Test #1 (b) Single Object Test #2 (c) Single Object Test #3
(d) No Object Test #1 (e) No Object Test #2 (f) No Object Test #3
(g) Shadow Test #1 (h) Shadow Test #2 (i) Shadow Test #3
(j) Grass Test #1 (k) Grass Test #2
Figure 12: Testing environments for each individual test
39

Experimental Setup
Each test was conducted using the Walking Assistant app on a Motorola Droid
4 smartphone, running on Android’s Jelly Bean version 4.1.2 operating system.
The smartphone itself was mounted on a modified smartphone mount attached to
a Go Pro Chest Harness1 worn by the tester, as shown in Figure 13. Additionally,
the mount allows the smartphone to be held at an angle, so, during the tests, it
was set to its maximum allowable angle to ensure that the smartphone is pointed
towards the ground.
Figure 13: The Go Pro Harness and smartphone mount used for testing
Results and Analysis
Pre-Threshold Test Results
As CP and TTC thresholds have yet to be determined, for all of the pre-threshold
tests, all positive CP and TTC values are seen as valid values. Thus, the user
will be notified about the presence of an object in their path if any of the feature
points and its neighbors have positive CP and TTC values.
1The smartphone mount had to modified since, in its current orientation, it lacks a clip tokeep the smartphone it holds from sliding out of the mount. This was accomplished using aclothes hanger, which was bent to wrap around the mount.
40

Test # CorrectID
IncorrectID
TruePositive
FalsePositive
FalseNegative
1 54.5% 45.5% 40.0% 33.3% 26.7%2 100.0% 0.0% 60.0% 0.0% 33.3%3 100.0% 0.0% 73.3% 0.0% 13.3%
Table 4: Results of the Pre-Threshold Single Object tests
Single Object Tests
Each Single Object test features a different obstacle, but initially, the obstacle
isn’t within the view of the smartphone’s camera. Thus, a percentage of the
images taken result in “true negatives user notifications”, where a user notification
doesn’t occur because an actual obstacle isn’t detected. This is unlike a false
positive user notification where a user notification occurs even though an obstacle
isn’t within the camera’s view.
For the Fire Hydrant tests, 54.5% of the user notifications – when the Walking
Assistant notifies the user about an obstacle in their path – were caused by true
positive outcomes2, but the fire hydrant went undetected 26.7% of the time. The
false positive rate for the tests was 33.3%, because the ground in front of the
user was falsely identified as an obstacle. For the Waypoint tests, 100% of the
user notifications resulted from true positive outcomes. In comparison to the Fire
Hydrant tests, the Waypoint tests had a higher amount of true positive outcomes
– 60% compared to 0% – but a higher amount of false negative outcomes – 33.3%
compared to 26.7%. The Bike Locker tests had the best true positive and false
negative rates, which were 73.3% and 13.3%, respectively. The results for all of
the Pre-Threshold Single Object tests can be seen in Table 4, where Test #1
refers to the Fire Hydrant tests, Test #2 refers to the Waypoint tests, and Test
#3 refers to the Bike Locker tests.
2In the context of Table 4, this is known as a “Correct ID”. An “Incorrect ID” is a usernotification that is caused by a false positive outcome.
41

Result Analysis
The Waypoint tests had a higher true positive outcome rate in comparison to
the Fire Hydrant tests because optical flow typically generated a higher number
of feature points clustered around the obstacle in the second test as opposed to
the first, which can be seen3 in Figures 14 and 15, respectively. Thus, in the
Waypoint tests, a feature point’s neighborhood tended to be larger thereby likely
generating larger CP and TTC values for a feature point and its neighborhood,
which the collision warning process would be more likely to pick up on.
Figure 14: Feature point detection example for Waypoint tests
As for the Bike Locker tests, it had the best true postive rate of the three Sin-
gle Object tests. The reason for this is the same as the reason why the Waypoint
tests had a higher true positive rate than the Fire Hydranttests: it consistently
found a large number of feature points clustered around the obstacle. Specifically,
goodFeaturesToTrack would find collections of feature points clustered along the
edge that segmented the ground from the bike lockers, as seen Figure 16.
3Detected feature points are denoted by black circles.
42

Figure 15: Feature point detection example for Fire Hydrant tests
Figure 16: Feature point detection example for Bike Locker tests
No Object Tests
For each of the No Object tests, as there are no obstacles present during these
tests, any user notifications given by the Walking Assistant are caused by false
positive outcomes. For the Cobblestone tests, false positive identifications oc-
curred 47.1% of the time, while the Sidewalk tests had a rate of 65.2% and the
Asphalt tests had a rate of 35.3%. The results for all of the Pre-Threshold No
43

Test # False Positive
1 47.1%2 65.2%3 35.3%
Table 5: Results of the Pre-Threshold No Object tests
Object tests can be seen in Table 54, where Test #1 refers to the Cobblestone
tests, Test #2 refers to the Sidewalk tests, and Test #3 refers to the Asphalt
tests.
Result Analysis
The false positive identification rate of the Cobblestone tests is directly caused
by the individual interlocking pieces that make up the cobblestone path. As the
surface isn’t made of large sections of concrete, the Walking Assistant finds a
larger amount of feature points within the cobblestone path as the interlocking
pieces of the path create a multitude of corners that goodFeaturesToTrack will
pick up on, which can be seen in Figure 17. Plus, the corners tend to look so
similar that optical flow may find corresponding feature points within the next
frame even though, upon further review, they don’t correspond to feature points
found in the previous frame.
Unlike the Cobblestone tests, the false positive identification rate of Sidewalk
tests isn’t caused by the detection of feature points on the surface of the sidewalk,
because, as previously mentioned, the average sidewalk is made up of large slabs
of feature-less concrete. Thus, sidewalk typically lacks the corners that goodFea-
turePointsToTrack would detect. Instead, the identification rate was caused by
feature points found not on the sidewalk, either in the road on the left or in the
dirt on the right. These areas were more likely to be detected as an obstacle due
to the large amount of feature points clustered within those areas.
For the Asphalt tests, its false positive identification rate is largely due to
4As there are no obstacles present in this set of tests, the false positive rate is the only dataproduced, therefore the other fields are not displayed.
44
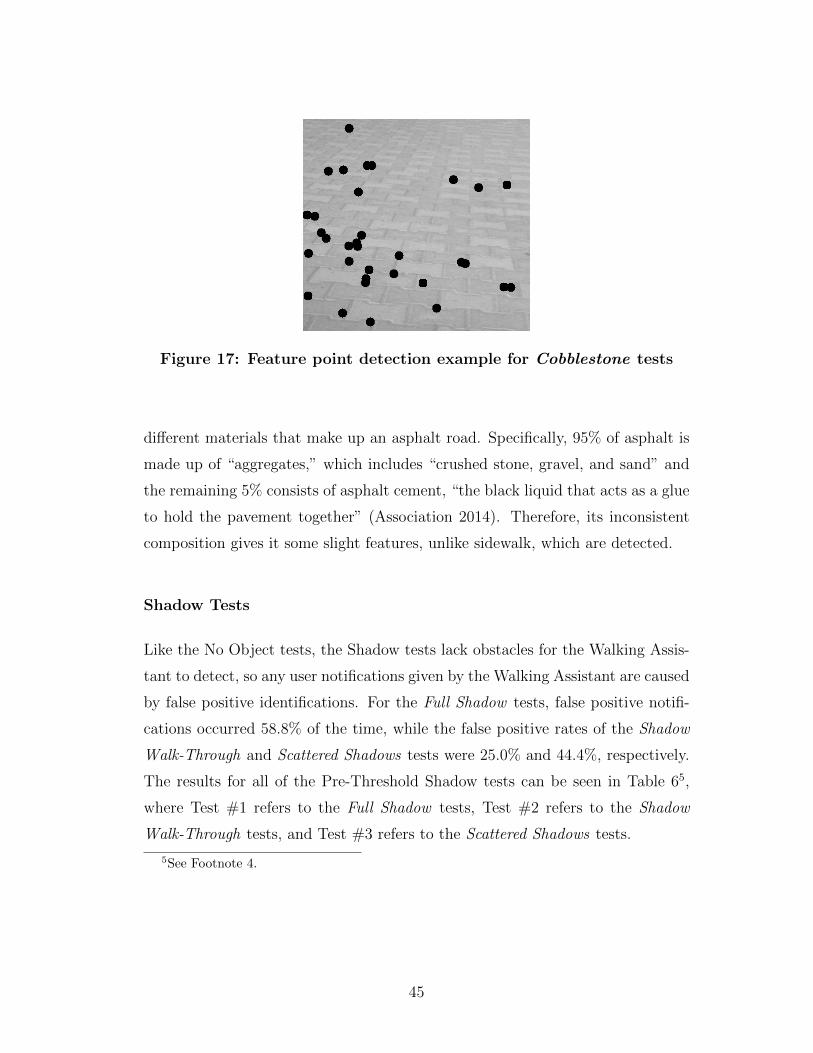
Figure 17: Feature point detection example for Cobblestone tests
different materials that make up an asphalt road. Specifically, 95% of asphalt is
made up of “aggregates,” which includes “crushed stone, gravel, and sand” and
the remaining 5% consists of asphalt cement, “the black liquid that acts as a glue
to hold the pavement together” (Association 2014). Therefore, its inconsistent
composition gives it some slight features, unlike sidewalk, which are detected.
Shadow Tests
Like the No Object tests, the Shadow tests lack obstacles for the Walking Assis-
tant to detect, so any user notifications given by the Walking Assistant are caused
by false positive identifications. For the Full Shadow tests, false positive notifi-
cations occurred 58.8% of the time, while the false positive rates of the Shadow
Walk-Through and Scattered Shadows tests were 25.0% and 44.4%, respectively.
The results for all of the Pre-Threshold Shadow tests can be seen in Table 65,
where Test #1 refers to the Full Shadow tests, Test #2 refers to the Shadow
Walk-Through tests, and Test #3 refers to the Scattered Shadows tests.
5See Footnote 4.
45
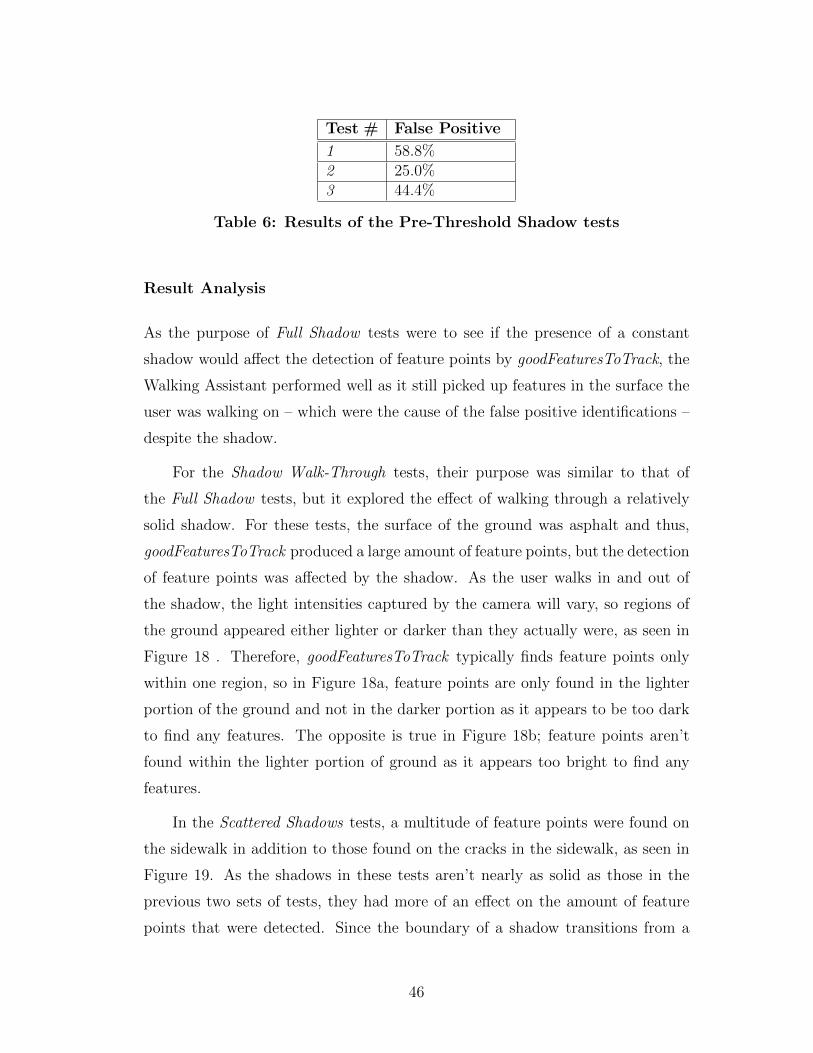
Test # False Positive
1 58.8%2 25.0%3 44.4%
Table 6: Results of the Pre-Threshold Shadow tests
Result Analysis
As the purpose of Full Shadow tests were to see if the presence of a constant
shadow would affect the detection of feature points by goodFeaturesToTrack, the
Walking Assistant performed well as it still picked up features in the surface the
user was walking on – which were the cause of the false positive identifications –
despite the shadow.
For the Shadow Walk-Through tests, their purpose was similar to that of
the Full Shadow tests, but it explored the effect of walking through a relatively
solid shadow. For these tests, the surface of the ground was asphalt and thus,
goodFeaturesToTrack produced a large amount of feature points, but the detection
of feature points was affected by the shadow. As the user walks in and out of
the shadow, the light intensities captured by the camera will vary, so regions of
the ground appeared either lighter or darker than they actually were, as seen in
Figure 18 . Therefore, goodFeaturesToTrack typically finds feature points only
within one region, so in Figure 18a, feature points are only found in the lighter
portion of the ground and not in the darker portion as it appears to be too dark
to find any features. The opposite is true in Figure 18b; feature points aren’t
found within the lighter portion of ground as it appears too bright to find any
features.
In the Scattered Shadows tests, a multitude of feature points were found on
the sidewalk in addition to those found on the cracks in the sidewalk, as seen in
Figure 19. As the shadows in these tests aren’t nearly as solid as those in the
previous two sets of tests, they had more of an effect on the amount of feature
points that were detected. Since the boundary of a shadow transitions from a
46
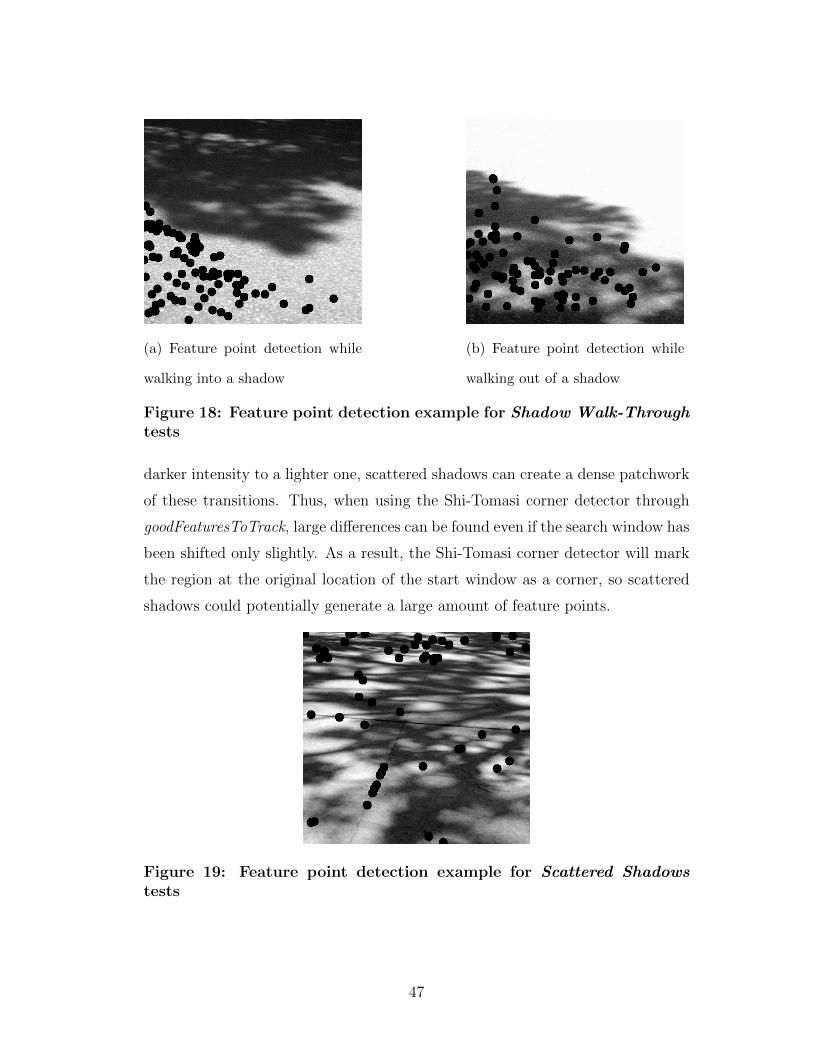
(a) Feature point detection while
walking into a shadow
(b) Feature point detection while
walking out of a shadow
Figure 18: Feature point detection example for Shadow Walk-Throughtests
darker intensity to a lighter one, scattered shadows can create a dense patchwork
of these transitions. Thus, when using the Shi-Tomasi corner detector through
goodFeaturesToTrack, large differences can be found even if the search window has
been shifted only slightly. As a result, the Shi-Tomasi corner detector will mark
the region at the original location of the start window as a corner, so scattered
shadows could potentially generate a large amount of feature points.
Figure 19: Feature point detection example for Scattered Shadowstests
47

Test # CorrectID
IncorrectID
TruePositive
FalsePositive
FalseNegative
1 22.2% 77.8% 13.3% 46.7% 33.3%2 N/A N/A N/A 52.6% N/A
Table 7: Results of the Pre-Threshold Grass tests
Grass Tests
The Grass tests differ from the previous sets of tests as it only features two
individual tests, one that features an obstacle – a fire hydrant – and one that
doesn’t feature any obstacles.
For the Grass Obstacle tests, 22.2% of the user notifications were cause by
true positive outcomes, while 77.8% were caused by false positive outcomes. Ad-
ditionally, the number of false positive outcomes (46.7%) exceeded the amount of
true positive (13.3%) and false negative (33.3%) outcomes. For the Grass Only
tests, a higher false positive rate of 52.6% was produced. The results for all of
the Pre-Threshold Grass tests can be seen in Table 76, where Test #1 refers to
the Grass Obstacle tests and Test #2 refers to the Grass Only tests.
Result Analysis
Regardless of the test, goodFeaturesToTrack consistently found a large amount
of feature points, which could be attributed to the grass itself. As grass is made
up of a multitude individual blades and each blade can cast a shadow and reflect
the light of the sun, this could create an illusion of there being a large collection
of corners on the grass due to the sudden changes from a darker intensity to a
lighter one. This occurrence can be best seen in Figure 20, which displays an
image captured during a Grass Only test. Due to the large amount of irrelevant
feature points found on the grass, the Grass Obstacle tests had a low true positive
rate and a high false positive rate. In the Grass Only tests, more false positive
outcomes were generated as the only feature points that could be analyzed by
6See Footnote 4 for an explanation regarding the ’N/A’ values for Test #2.
48

the collision warning process were those found on the grass, provided that optical
flow found a large enough amount of corresponding feature points.
Figure 20: Feature point detection example for Grass Only tests
Pre-Threshold Test Analysis
After reviewing all of the data obtained during the Pre-Threshold tests, it was
determined that for tests where an obstacle was present, the overall true positive
rate was 46.7%, while the overall false negative rate was 26.7% and the overall
false positive rate was only 20.0%. Additionally, the precision – the proportion of
true positives against all of the positive results (true positives and false positives)
– and sensitivity – the proportion of actual positives which are correctly identified
as such – for these tests were 70.0% and 63.6%, respectively. As for tests where
an obstacle wasn’t present, the overall false positive rate was 46.90%. For a full
view of the overall results of the Pre-Threshold tests, refer to Table 87.
As thresholds for valid CP and TTC values weren’t yet set during the Pre-
Threshold tests, the false positive rates for the two overall types of tests could
be potentially reduced once a set of thresholds are determined and implemented.
Unfortunately, choosing a set of CP and TTC thresholds will mostly likely not
7As tests that lack an obstacle focus on reporting the false positive rates, the results of the“No Object Present” test type follows their example by reporting only the false positive rate.
49

TestType
TruePositive
FalsePositive
TrueNegative
FalseNegative
Precision Sensitivity
ObjectPresent
46.7% 20.0% 6.6% 26.7% 70.0% 63.6%
NoObjectPresent
N/A 46.9% N/A N/A N/A N/A
Table 8: Overall results of the Pre-Threshold tests
improve the true positive and false negative rates because the implementation
of these thresholds will only further limit what is considered to be an obsta-
cle. Therefore, the true positive rate may decrease, while the false negative rate
increases, in the following Threshold tests.
After gathering together all of the CP, TTC pairs from each type of test,
scatter plots were generated, displaying the ranges of the true positive and false
positive CP, TTC pairs of each test, which can be seen in Figure 21. The majority
of true positive CP, TTC pairs in the Single Object (Figure 21a) and Grass
(Figure 21d) tests fall within a limited range, which could possibly define a target
region of CP and TTC values that identify obstacles. On the other hand, the
false positive CP, TTC pairs don’t group within a specific range and occasionally
fall within the range of true positive pairs. As for the false positive pairs in
the No Object tests (Figure 21b), they have a much wider spread than their
counterparts in the two aforementioned plots. The false positive CP, TTC pairs
in the Shadow tests (Figure 21c) mimic their counterparts in the Single Object
and Grass tests in that a collection of the pairs are grouped in the potential CP,
TTC pair obstacle-identification region.
To obtain a better representation of the proposed target region, normal dis-
tributions for the true positive and false positive CP and TTC values were calcu-
lated and can be seen in Figures 22 and 23, respectively. Due to the wide range of
false positive CP and TTC values, the normal distributions for these values don’t
necessarily create the ideal normal distribution. Therefore, to obtain a better
view of the true positive CP and TTC distributions, the entire range of the false
positive distributions isn’t shown. As previously mentioned, there is a lack of a
50
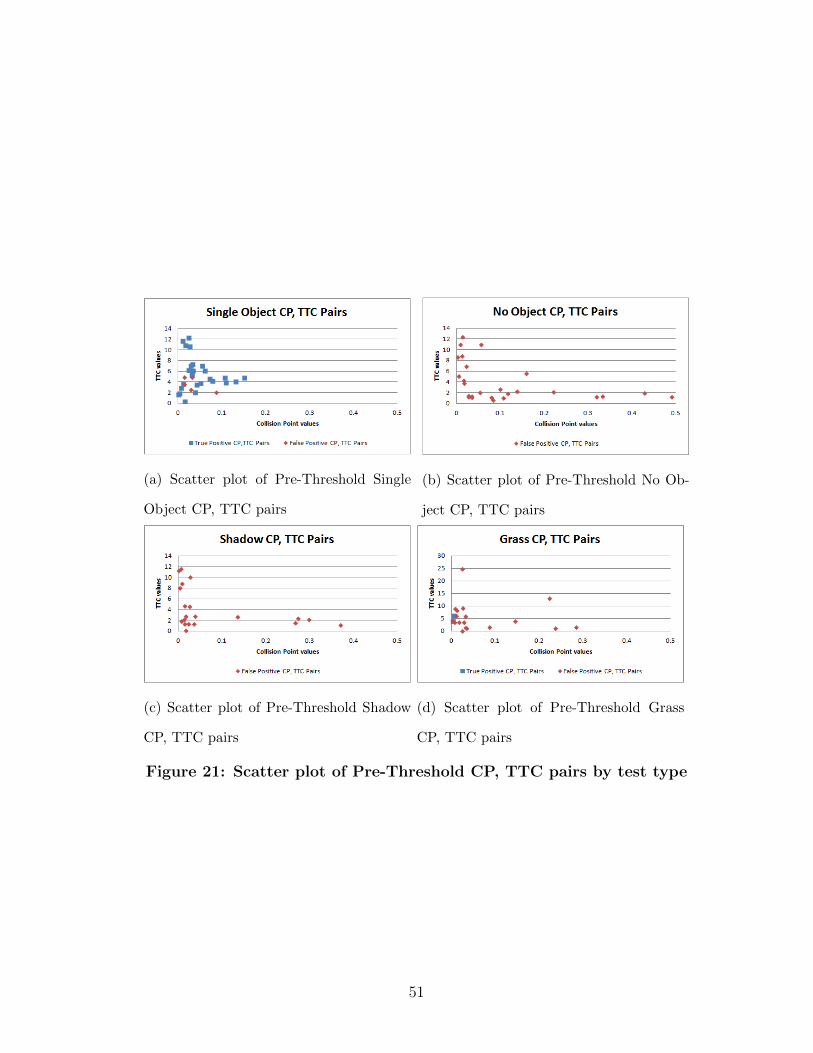
(a) Scatter plot of Pre-Threshold Single
Object CP, TTC pairs
(b) Scatter plot of Pre-Threshold No Ob-
ject CP, TTC pairs
(c) Scatter plot of Pre-Threshold Shadow
CP, TTC pairs
(d) Scatter plot of Pre-Threshold Grass
CP, TTC pairs
Figure 21: Scatter plot of Pre-Threshold CP, TTC pairs by test type
51

clear distinction as to what range of CP and TTC values refer to an oncoming
obstacle, considering the overlap between true positive and false positive values.
Figure 22: Distribution of true positive and false positive collisionpoint values in the Pre-Threshold tests
Figure 23: Distribution of true positive and false positive time-to-collision values in the Pre-Threshold tests
According to Figure 22, the only overlap between the two CP distributions
occurs at the upper end of the true positive distribution. Therefore, the upper CP
threshold will be set to the CP value at the intersection of the two distributions,
52

which is approximately 0.11. As for the lower CP threshold, it is based upon the
lower end of the true positive distribution, resulting in a value of 0, but according
to the data, this value is an outlier, so the next closest value of 0.003 is chosen.
As for the TTC distributions, its true positive and false positive distributions
in Figure 23 are similar to those in Figure 22. Thus, the upper and lower TTC
threshold values will be determined in the same manner. The upper TTC thresh-
old is chosen to be 11.0 as it is the closest value to the distribution intersection.
The lower threshold is initially chosen to be 0.3255, but, as with the initial lower
CP threshold, the value is an outlier, so the next closest value of 1.5 is chosen.
Now that the upper and lower thresholds for the CP and TTC values have
been determined, the threshold set will be employed during the following Thresh-
old tests, where 0.003 serves as lower CP threshold, 0.11 as the upper, 1.5 as the
lower TTC threshold, and 11.0 as the upper.
Threshold Test Results
With the CP and TTC thresholds chosen, the same set of tests carried out for
the Pre-Threshold tests will be repeated, and the user will now be notified only if
any of the feature points and its neighbors fall within the CP and TTC threshold
ranges.
Single Object Tests
For the Fire Hydrant tests, the percentage of the user notification caused by true
positive outcomes increased to 88.9% as a result of the number of true positives
increasing by over 20% to 61.5%. Additionally, the false positive rate dropped to
7.7%, while the false negative rate increased to 30.8%. For the Waypoint tests,
its true positive rate increased slightly to 66.7%, while its false negative rate
remained unchanged at 33.3%. The Bike Locker test outcome rates suffered the
biggest changes as its true positive rate plummeted to 0%, while its false positive
and false negative rates increased sharply from 0% to 38.9% and 13.3% to 61.1%,
53

Test # CorrectID
IncorrectID
TruePositive
FalsePositive
FalseNegative
1 88.9% 11.1% 61.5% 7.7% 30.8%2 100.0% 0.0% 66.7% 0.0% 33.3%3 0.0% 100.0% 0.0% 38.9% 61.1%
Table 9: Results of the Threshold Single Object tests
respectively. The results for all of the Threshold Single Object tests can be seen
in Table 9.
Result Analysis
As previously mentioned, it was expected that false positive rates would decrease
while false negative rates would increase, but this trend was only observed in the
results of the Fire Hydrant tests. As for the other two tests, the results of the
Waypoint tests are nearly identical to those before CP and TTC thresholds were
implemented, while the Bike Locker tests produced poor results in comparison
to its pre-threshold counterpart.
The poor results of the Bike Locker tests can be attributed to the changing
angle of the sun as its Pre-Threshold tests were carried out after 4 p.m. and its
Threshold tests were carried out around 2:30 p.m. After comparing the recorded
images from the Pre-Theshold and Threshold Bike Locker tests, it was discovered
that during the Threshold tests, the side of the bike lockers facing the camera
are in shadow, while the shadow wasn’t present during the Pre-Threshold tests.
Therefore, the presence of a shadow may have kept the bike lockers from being
detected during the Threshold tests, possibly hiding the corners that were found
during the Pre-Threshold tests.
No Object Tests
For the No Object tests, the false positive rates of each individual test decreased
by at least 9%. Of the three tests, the Cobblestone tests had the biggest change
54

Test # False Positive
1 10.0%2 32.0%3 26.3%
Table 10: Results of the Threshold No Object tests
Test # False Positive
1 5.0%2 14.2%3 10.5%
Table 11: Results of the Threshold Shadow tests
in its false positive rate, dropping to 10.0%, followed by the false positive rates of
the Sidewalk and Asphalt tests, which were 32.0% and 26.3%, respectively. The
results of the Threshold No Object tests can be seen in Table 108.
Result Analysis
The implementation of the CP and TTC thresholds had a clear effect on each
of the No Object tests as the newly-implemented thresholds helped filter out
CP, TTC pairs that may have been previously recognized as an obstacle by the
Walking Assistant.
Shadow Tests
Like the No Object tests before it, each of the Shadow tests produced lower false
positive rates. The Full Shadow test had a false positive rate of 5.0%, while the
Shadow Walk-Through tests had a rate of 14.3% and the Scattered Shadow tests
produced a rate of 10.5%. The results for all of the Threshold Shadow tests can
be seen in Table 119.
8See Footnote 49See Footnote 4
55

Test # CorrectID
IncorrectID
TruePositive
FalsePositive
FalseNegative
1 75.0% 25.0% 40.0% 13.3% 26.7%2 N/A N/A N/A 31.3% N/A
Table 12: Results of the Threshold Grass tests
Result Analysis
Much like the No Object tests, the false positive rates of the Shadow tests un-
derwent a change once the CP and TTC thresholds were implemented and its
effects were quite dramatic.
Grass Tests
When compared to its Pre-Threshold tests, the Grass Obstacle and Grass Only
tests each improved in different ways. As its true positive rate increased to 40.0%
and its false positive rate decreased to 13.30%, the Grass Obstacle tests featured
a rise how often it notified the user about a correctly-identified obstacle, from
22.2% to 75.0%. As for the Grass Only tests, its false positive rate dropped from
52.6% to 31.3%. The full results for the Threshold Grass tests can be seen in
Table 1210.
Result Analysis
While it may initially appear that the improved results of the Grass tests are due
to the implemented CP and TTC thresholds, the results may have been affected
by the time of day when the tests were carried out. The Pre-Threshold Grass
tests were carried out around 3 p.m., while the Threshold tests were carried out
closer to 1 p.m. Therefore, the shadows cast by the blades of grass during may
have been less prominent during the Threshold tests when the sun was overhead.
As a result, the smaller amount of “grass” feature points – in comparison to the
10See Footnote 4 for an explanation regarding the ’N/A’ values for Test #2.
56

TestType
TruePositive
FalsePositive
TrueNegative
FalseNegative
Precision Sensitivity
ObjectPresent
42.1% 15.0% 12.5% 30.4% 70.6% 50.0%
NoObjectPresent
N/A 18.5% N/A N/A N/A N/A
Table 13: Overall results of the Threshold tests
large amounts found during the Pre-Threshold tests – may have had a lesser effect
on skewing the results as feature points grouped in dense clusters had higher CP
and TTC values based on their neighborhood. This, in turn, might have allowed
the CP and TTC values of the feature points that referred to the fire hydrant in
the Grass Object test to stand out.
Threshold Test Analysis
Following the execution of all of the Threshold tests, the four outcome rates for
when an obstacle was and wasn’t present were calculated and are listed in Table
1311. It was calculated that, for tests where an obstacle was present, the overall
true positive rate decreased to 42.1%, the false positive rate decreased to 15.0%,
and the false negative rate increased to 30.4%. For tests when an obstacle wasn’t
present, it was found that the false positive rate fell to 18.5%. As for the precision
and sensitivity ratios, precision increased to 70.6%, while sensitivity dropped to
50.0%.
The overall outcome rates fall in line with the expectations described in
Section VII., where, after implementing the CP and TTC thresholds, the false
positive and true negative rates would improve – which they did by, respectively,
decreasing by 5% when an obstacle was present and decreasing by 28.4% when an
obstacle wasn’t present, and increasing by 5.9%. The improvement of the false
positive rate is also seen in the precision ratio as it increased slightly by 0.6%. It
was also expected that the false negative and true positive rates when an object
11See Footnote 7
57

was present would become worse, which was supported as the true positive rate
was reduced by 4.6% and the false negative rate rose by 3.7%. The worsening
of these two rates are also seen in the sensitivity ratio as it decreased – more so
than the precision ratio increased – by 13.6%.
Besides being affected by the newly-implemented thresholds, the changes in
outcome rates may have also been affected by the time of day when the Pre-
Threhsold and Threshold tests were carried out and, therefore, the angle of the
sun. As the angle of the sun can cause shadows to grow or recede, these changing
shadows can either hide object features – such as the edges of the bike lockers as
described in Section VII. – or create extra noise within an image in the form of
additional feature points – like those caused by scattered shadows or the shadows
of blades of grass as described, respectively, in Sections VII. and VII..
It’s important that the false positive rate is kept to a minimum for when a
user is notified, it serves as a cue to be aware of an upcoming object. Thus, a high
rate of false positives can cause the user to be constantly alerted and hindering
their journey to their destination. Plus, the low true positive rate of 42.1% means
that it simply doesn’t always identify the obstacle in every frame it is present
in. Considering the Threshold Fire Hydrant and Waypoint tests, the obstacle
was detected at least twice in all of the tests. Therefore, the user is still being
notified about the obstacle, but the obstacle isn’t constantly being detected in
every image captured, which is the primary cause of the low true positive rate.
58

VIII. Conclusion
Overall, the Walking Assistant is successful in that it can detect obstacles with
a degree of accuracy and can notify the user about said obstacle if the app
determines the obstacle will collide with the user. Thus, the app can help give
visually-impaired users peace of mind as they walk. However, the accuracy of the
Walking Assistant is limited by difficulties associated with outdoor environments,
limitations of the smartphone’s hardware, and limitations of optical flow. The
app can greatly benefit from some additional work that can improve both its
accuracy and usability.
In order for the user to recieve the biggest benefit from the app, it is recom-
mended that the Walking Assistant be run on a wide and relatively feature-less
surface such as sidewalk – thus, not on asphalt or grass – with, if possible, no
shadows covering it. Additionally, to keep the user’s shadow from interfering with
the app’s operation, the sun should be either overhead or in front of the user.
Difficulties and Limitations
As the Walking Assistant is based in the field of computer vision, a number of
potential difficulties can arise depending on which aspect of computer vision is
focused on. In this case, the Walking Assistant deals with gathering and analyzing
information in an image taken of an outdoor environment.
59

Outdoor Environment Difficulties
The Walking Assistant operates by gathering and analyzing information in an
image taken of an outdoor environment, which is much more difficult than an-
alyzing an indoor environment. Difficulties arise due to the number and range
of attributes present in outdoor environments and the challenges involved in
controlling them. In an indoor setting, one has to deal with significantly less
environmental attributes and can more easily control them. For example, one
doesn’t have to deal with the changing angle of the sun while indoors and can
easily adjust the amount of light within a room with the flick of a switch.
For the Walking Assistant, the biggest difficulties presented by an outdoor
environment include the variance in illumination and the type of surface the user
is walking on. While outdoors, the amount of illumination is determined by the
weather and essentially unconstrained, as there’s more light available on a sunny
day as opposed to a day with overcast skies. Additionally, the amount of light in
the environment can also be altered by the angle of the sun, causing the outdoor
environment to be lit either by direct or indirect sunlight.
The sun’s angle can also create shadows, which can skew results of the object
detection process. Shadows can either hide objects, like in Figure 24, that would
have normally been detected or create “false” objects, like in Figure 19.
Objects can be hidden if the locations of feature points have been covered in
shadows from one image to the next, thereby altering the pixel intensity at those
locations. As a result, feature points found in one image are not found in the
next as optical flow finds feature point locations in following images by looking for
regions with pixel intensities that match those found in the first image. Shadows
can create “false” objects in that objects are found by searching an image for
well-defined corners, which shadows can inadvertently create. Thus, a shadow
on the ground may appear as an object to the Walking Assistant app, which will
cause the app to alert the user despite the absence of an object.
Lastly, the type of surface the user is walking on while the Walking Assistant
is running can also skew the object detection results. As detailed in Sections VII.
60

(a) Before an object is hidden by a
shadow cast by the user
(b) After an object is hidden by a
shadow cast by the user
Figure 24: An example of how a shadow can hide a potential obstacle
and VII., some surface types can create noise due to surface’s composition. For
example, on a cobblestone path, as seen in Figure 17, the Walking Assistant may
determine the cracks between each stone to be a corner, creating an abundance of
extra feature points that the app must then analyze. This effect is more prevalent
if the user is walking on grass, as seen in Figure 20, as the blades of grass each
cast their own shadow, which, as mentioned earlier, will be considered a corner
and, thus, potentially part of an object.
In essence, the Walking Assistant lacks context; it doesn’t know the angle
of the sun or what type of surface the user is walking on. If the Walking Assis-
tant had some context about the environment the user was walking through, its
operation could be better tuned, increasing the accuracy of the object detection
process. This additional context could be obtained by either limiting the scope
of the app to a context or making use of extra, more sophisticated sensors to get
more information about the environment. Limiting the scope of the app though
would mean reducing its applicability, while using more sensors depends on what
is available on the user’s smartphone – which is discussed further in the following
section.
61

Hardware Limitations
The Walking Assistant is also limited by the smartphone hardware it is being run
on. As testing was conducted using a single smartphone – the Droid 4 – and a wide
variety of Android-based smartphones are available, it wasn’t deteremined exactly
which smartphones could execute the Walking Assistant. Yet, with smartphone
hardware becoming more and more powerful, newly-released smartphones should
be more than capable.
Another limitation that must be considered is how much energy the Walking
Assistant consumes. Due to the Walking Assistant’s continuous use of the smart-
phone’s camera and its computation-heavy nature, the app could quickly drain a
smartphone’s battery power. At the same time, the app’s energy consumption is
reduced as it doesn’t use the smartphone’s screen. Thus, the screen never needs
to be updated and can be set to the lowest screen brightness setting without
affecting a user’s interaction with the app.
A standard smartphone also limits the full potential of the Walking Assistant
as it lacks the sophisticated sensors used in other computer vision-based naviga-
tion systems, such as the Google’s driverless car. According to (Guizzo 2011),
Google’s driverless car can accurately drive itself through the use of following
sensors: a Velodyne 64-beam laser1, four radars, a camera, a GPS, an inertial
measurement unit, and a wheel encoder. Of the six types of sensors Google’s
driverless car uses, a smartphone typically only has two, a camera and a GPS,
but some have accelerometers, gyroscopes, and light sensors, which senses how
much light is within its immediate surroundings. The lack of sophisticated sensors
on a smartphone limits the amount of information it can gather from an envi-
ronment, thereby hindering its ability to accurately detect objects in the user’s
path.
1Google’s driverless car uses a Velodyne 64-beam laser to generate a detailed 3D map of theenvironment.
62

Optical Flow Limitations
Optical flow plays a key role within the Walking Assistant, as the app revolves
around determining if an object is moving towards the camera, so the limitations
of optical flow can drastically affect the app’s object detection accuracy. In
order to carry out its calculations, the optical flow algorithm must make a few
assumptions, one of which is: “the pixel intensities of an object do not change
between consecutive frames” (Team c). If this assumption isn’t met, an object,
whose pixel intensities have changed, could essentially appear to have disappeared
from view. For example, in the context of the Walking Assistant, if a box in the
user’s path is suddenly covered by a shadow, the app will no longer consider the
box to be a potential obstacle as its pixel color values have been darkened by the
shadow.
Additionally, optical flow operates by attempting to “minimize the differ-
ence” between regions in the first image and regions in the second image (Baker
and Matthews 2004). Thus, the corresponding feature points found in the second
image are estimations – hence the returned error values in calcOpticalFlowPyrLK
–, all of which can be wildly inaccurate. A threshold is used to filter out poten-
tially inaccurate feature points, but it is far from a catch-all, so some inaccurate
points may slip through and skew the results of the object detection process.
Future Work
To further increase the robustness of the Walking Assistant app, a number of
features could be implemented. First, a person’s acceleration could be measured
using a smartphone’s accelerometer and used to dynamically update the TTC
threshold accordingly. Alternatively, both the collision point and TTC threshold
could be updated using a fuzzy decision system presented in Pundlik and Luo’s
object detection process. Second, as the user will have their smartphone mounted
on their body through the Go Pro Chest Harness, image stabilization could be
applied to correct for the bouncing of the camera, using a gyroscopic sensor, like
63

in Pundlik et al.’s object detection process, or a fuzzy-based stabilization system
described in the work of Yi-Ying Shih et al. (Shih, Su, and Rudas 2012). Third,
a sidewalk mode could be added, which would be specifically tailored to detect
objects on sidewalks. This mode would make use of John Seng and Thomas
Norrie’s sidewalk identification algorithm and could possibly speed up the object
detection process by focusing on detecting objects on the sidewalk rather than
the entire image(Seng and Norrie 2008).
Besides adding more features to the Walking Assistant, extra testing could
also be carried out to improve its usability and measure its energy consump-
tion. In regards to app usability, conducting usability evaluations with visually-
impaired people could provide some valuable insight as to how the average user
might use the app and if any alterations are required to improve ease of interac-
tion. A brief outline of a proposed usability evaluation for the Walking Assistant
can be found in Appendix A. Gathering energy consumption measurements for
the Walking Assistant would also prove beneficial as the app could potentially
drain a smartphone’s battery. The app’s energy consumption is worth inves-
tigating as the app is intended to be run for longer periods of time than the
average app and can be computationally intensive, but doesn’t utilize the smart-
phone’s screen. Rajesh Palit et al’s and A. Abogharaf et al.’s work both present
a viable methodology for measuring an app’s energy consumption, where energy
consumption is measured in combination with various energy-consuming smart-
phone settings (Palit, Arya, Naik, and Singh 2011; Abogharaf, Palit, Naik, and
Singh 2012).
Closing Remarks
The proposed Walking Assistant app is an easy-to-use, accessible alternative
navigation aid since it doesn’t require any special or overly expensive equip-
ment besides an Android smartphone, a harness to hold the smartphone, and
the OpenCV library. The results of the suite of tests carried out The Walking
Assistant can also operate within a real-world environment with a fair amount of
64

accuracy, despite the difficulties of operating in a real-world context and the lim-
itations of the hardware and algorithms it uses. Its accuracy and usability can be
further refined through additional work, which could include implementing fuzzy
thresholding or holding usability evaluations.
65

Bibliography
jdt - java delaunay triangulation.
Abogharaf, A., R. Palit, K. Naik, and A. Singh (2012, June). A methodology
for energy performance testing of smartphone applications. In Automation
of Software Test (AST), 2012 7th International Workshop on, pp. 110–116.
Amazon (2014). Amazon.com: iglasses ultrasonic mobility aid- tinted lens:
Health & personal care.
AmbuTech (2014). Custom mobility canes and aids for the blind and visually
impaired.
Association, N. A. P. (2014). An asphalt plant in your community?
Baker, S. and I. Matthews (2004). Lucas-kanade 20 years on: A unifying frame-
work. International Journal of Computer Vision 56 (3), 221–255.
Corporation, O. (2014). Synchronization (the java tutorials - essential classes
- concurrency).
Culjak, I., D. Abram, T. Pribanic, H. Dzapo, and M. Cifrek (2012, May).
A brief introduction to opencv. In MIPRO, 2012 Proceedings of the 35th
International Convention, pp. 1725–1730.
Derpanis, K. G. (2005). The gaussian pyramid.
Eklundh, J.-O. and H. Christensen (2001). Computer vision: Past and future.
In R. Wilhelm (Ed.), Informatics, Volume 2000 of Lecture Notes in Com-
puter Science, pp. 328–340. Springer Berlin Heidelberg.
Ersi. Arcgis help 10.1 - what is a tin surface?
66

Fortune, S. (1997). Handbook of discrete and computational geometry. Chapter
Voronoi Diagrams and Delaunay Triangulations, pp. 377–388. Boca Raton,
FL, USA: CRC Press, Inc.
Gjacquenot (2013). Delaunay circumcircles vectorial.
Guizzo, E. (2011, Oct). How google’s self-driving car works.
http://spectrum.ieee.org/automaton/robotics/artificial-intelligence/how-
google-self-driving-car-works.
Hanlon, M. (2013a, November). The evolution of nsk’s guide robot for the
visually-impaired.
Hanlon, M. (2013b, November). The evolution of nsk’s guide robot for the
visually-impaired.
Harris, C. and M. Stephens (1988). A combined corner and edge detector. In
In Proc. of Fourth Alvey Vision Conference, pp. 147–151.
Heggestuen, J. (2013, December). Smartphone and tablet penetration.
Itseez (2014). About - opencv. http://opencv.org/about.html.
Jie, Y. and S. Yanbin (2012, Aug). Obstacle detection of a novel travel aid
for visual impaired people. In Intelligent Human-Machine Systems and Cy-
bernetics (IHMSC), 2012 4th International Conference on, Volume 2, pp.
362–364.
Liyanage, D. K. and M. U. S. Perera (2012, April). Optical flow based obstacle
avoidance for the visually impaired. In Business Engineering and Industrial
Applications Colloquium (BEIAC), 2012 IEEE, pp. 284–289.
Ltd, S. F. T. About the ultracane.
Ltd, S. F. T. (2012, January). Ultracane user guide v1.6.
Lucas, B. D. and T. Kanade (1981). An iterative image registration technique
with an application to stereo vision. In In IJCAI81, pp. 674–679.
McGirr, R. Sonar traveller cane - sonar cane for the blind.
Ni, D., L. Wang, Y. Ding, J. Zhang, A. Song, and J. Wu (2013, Dec). The
design and implementation of a walking assistant system with vibrotac-
67

tile indication and voice prompt for the visually impaired. In Robotics and
Biomimetics (ROBIO), 2013 IEEE International Conference on, pp. 2721–
2726.
of Education, C. D. (2010). Aph product detail - imods (ca department of
education).
Oudot, S. Delaunay triangulation.
Palit, R., R. Arya, K. Naik, and A. Singh (2011). Selection and execution of
user level test cases for energy cost evaluation of smartphones. In Proceed-
ings of the 6th International Workshop on Automation of Software Test,
AST ’11, New York, NY, USA, pp. 84–90. ACM.
Pundlik, S. and G. Luo (2012, May). Collision risk estimation from an uncali-
brated moving camera based on feature points tracking and clustering. In In
Proc. 2012 9th International Conference on Fuzzy Systems and Knowledge
Discovery, pp. 550–554.
Seng, J. S. and T. J. Norrie (2008, June). Sidewalk following using color his-
tograms. J. Comput. Sci. Coll. 23 (6), 172–180.
Shi, J. and C. Tomasi (1994). Good features to track.
Shih, Y.-Y., S.-F. Su, and I. Rudas (2012, June). Fuzzy based hand-shake
compensation for image stabilization. In System Science and Engineering
(ICSSE), 2012 International Conference on, pp. 40–44.
Shrinivas Pundlik, M. T. and G. Luo (2013, June). Collision detection for
visually impaired from a body-mounted camera. In In Proc. of 2013 IEEE
Conference on Computer Vision and Pattern Recognition Workshops, pp.
41–47.
Song, K.-T. and J.-H. Huang (2001). Fast optical flow estimation and its appli-
cation to real-time obstacle avoidance. In Robotics and Automation, 2001.
Proceedings 2001 ICRA. IEEE International Conference on, Volume 3, pp.
2891–2896 vol.3.
Team, O. D. Feature detection – opencv 2.4.9.0 documentation.
68

Team, O. D. Motion analysis and object tracking – opencv 2.4.9.0-dev docu-
mentation.
Team, O. D. Optical flow – opencv 3.0.0-dev documentation.
Team, O. D. Shi-tomasi corner detector & good features to track – opencv
3.0.0-dev documentation.
Zabonne. Zabonne - k sonar.
69

Appendices
70

A Walking Assistant Usability Evaluation Outline
Evaluation Goals and Objectives
The goal of the Walking Assistant is to better assist visually-impaired users in
navigating through an outdoor environment, so the app must be beneficial to the
user, rather than a burden, and must be easy to learn and control. The usability
evaluation is carried out to determine if the Walking Assistant app meets these
goals and, if not, how the usability of the app can be improved.
Methodology
Since the app revolves around assisting its users, which happens to be a unique
group of users, holding usability experiments with the targeted users as partici-
pants is of the utmost importance. As such, visually-impaired users, who make
use of white canes to navigate outdoors, will be sought out. The usability tests
will involve having the users use The Walking Assistant in conjunction with their
white cane to navigate outdoors, and collecting feedback and recommendations
based on their experience with my app.
Usability Evaluation Plan
For the participants, a potential source of volunteers could be the visually-
impaired members of the Central Coast Assistive Technology Center, but if no
volunteers are found there, blindfolded volunteers can be used as substitutes.
71

For the evaluation environment, the evaluations will be run on section of
sidewalk and, for best results, during a bright, sunny day.
For the evaluation itself, three different types of evaluations will be carried
out: one for the vocal command aspect of the app, another for the touch command
aspect, and one for the object detection and collision warning aspect. For the
vocal command aspect, the experimenter will describe how to start the voice
recognition in the app and the valid voice commands the user can give, and then
have the user try out the voice commands for themselves. For the touch command
aspect, the test will follow the same format as the previous vocal command tests,
but the user will instead use touch-based commands. For the object detection
and collision warning aspect, the experimenter will have the user walk back and
forth across the section of sidewalk, with each traversal serving as a different test.
These tests could include placing object directly in front of the user, to either
side of the user, or have no obstacles altogether. Control experiments will also
be held where the user doesn’t use the app at all and uses just their white cane
to navigate.
Following both of these evaluations, the experimenter will ask a series of
follow-up questions regarding ease of use and effectiveness, in addition to collect-
ing any general comments about the Walking Assistant.
72