
Walgreens Pharmacy Milwaukee Metro
24
Walgreens Pharmacy Milwaukee Metro • Relocation of a high sales volume store • Great corner with over 53,000 cars per day • “Main & Main” location with great retail trade area • West Bend is a relatively affluent suburb • Off the I-45, just 20 miles from Milwaukee • Important strategic location for Walgreens • Walgreens corporate guarantee (NYSE:WAG) • Investment grade credit (S&P A+; Moody’s Aa3) • New construction, 75 year NNN lease • Zero management responsibilities $5,700,000 6.50% CAP Rate Deerfield Partners John Giordani Art Griffith (415) 685-3035 team@deerfieldteam.com
Transcript of Walgreens Pharmacy Milwaukee Metro

Walgreens Pharmacy
Milwaukee Metro
• Relocationofahighsalesvolumestore
• Greatcornerwithover53,000carsperday
• “Main&Main”locationwithgreatretailtradearea
• WestBendisarelativelyaffluentsuburb
• OfftheI-45,just20milesfromMilwaukee
• ImportantstrategiclocationforWalgreens
• Walgreenscorporateguarantee(NYSE:WAG)
• Investmentgradecredit(S&PA+;Moody’sAa3)
• Newconstruction,75yearNNNlease
• Zeromanagementresponsibilities
$5,700,000
6.50%CAPRate
DeerfieldPartnersJohn GiordaniArt Griffith(415)[email protected]

Walgreens Pharmacy
West Bend, Wisconsin
DeerfieldPartnersJohn GiordaniArt Griffith(415)685-3035
Price
CAP
AnnualIncome
RentIncreases
Debt
$5,700,000
6.50%
$370,000
None
Buyertoobtainnewdebtatmarket.Pleasecalltodiscussoptions.
Investment Summary
Property Details
Lease Summary
About This Investment Opportunity
Address
City
State
ThisnewWalgreenssitsonthecornerofParadiseandMainwhichbenefitsfromtrafficcountsofover50,000carsperday.Thisintersectionisgenerallyconsideredtobelocatedat“MainandMain”inWestBend,arelativelyaffluentsuburblocatedjust20milesfromMilwaukee.Acrossthestreetisanewlyrede-velopedPick’nSavegrocerystore,thepremiersupermarketchaininWisconsinwith93stores.
WalgreensopeneditsfirststoreinWestBendover20yearsago.Basedontheveryhighsalesvolumeandprofitabilityatthatsinglestore,Walgreensdecidedtoopentwobrandnewstorestoservethemar-ket.ThefactthatWalgreensmadethestrategicdecisiontoopentwobrandnewstores,andnotjustonenewstore,indicatesthatWalgreensanticipatesstrongsalesvolumesatbothnewlocations.InitialreportsfromWalgreensindicatesalesvolumesareup30%fromthepreviouslocation.
1921SouthMainSt.
WestBend
Wisconsin
Walgreens(NYSE:WAG)
June28,2010
None
75years
Startinginyear26Tenantmayterminateleasewith12monthsnotice.
None.Leaseistrulytriple-net(NNN).Zerolandlordcostexposure.
2010
14,754squarefeet
2.4acres
YearBuilt
BldgSize
LotSize
Tenant
RentStartDate
RentIncreases
LeaseTerm
Options
LandlordResponsibilities

Walgreens Pharmacy
West Bend, Wisconsin
DeerfieldPartnersJohn GiordaniArt Griffith(415)685-3035
DemographicSummary
RegionalMap/AboutWestBend,Wisconsin
1 Mile 3 Mile 5 Mile
Population 5,675 27,524 44,994
Avg. HH Income $81,088 $74,732 $78,974
Locatedjust20milesfromMilwaukeeand100milesnorthofChicago,WestBendisaverystable,wellesta-bilshed,andrelativelyaffluentmidwesternsuburb.
TheCityofWestBendislocatedinWashingtonCounty,theheartoftheKettleMoraineinSoutheasternWiscon-sin.WestBendishometoover30,000peopleandislessthananhour’sdrivenorthofMilwaukee.WestBendisclosetonumerouslakesandtheareasurroundingWestBendisasportsperson’sparadise.WestBendof-fersresidentsandvisitorssmalltownliving,withconve-nientaccesstoenjoythefastpaceofthegreatermetro-politanareasofMilwaukeeandChicago.
Thisisagreatcommunitywithverylittleriffrafforcrime.

Walgreens Pharmacy
West Bend, Wisconsin
DeerfieldPartnersJohn GiordaniArt Griffith(415)685-3035
AerialofSiteandIntersection

Walgreens Pharmacy
West Bend, Wisconsin
DeerfieldPartnersJohn GiordaniArt Griffith(415)685-3035
StorePhotos

Walgreens Pharmacy
West Bend, Wisconsin
DeerfieldPartnersJohn GiordaniArt Griffith(415)685-3035
StorePhotos

Walgreens Pharmacy
West Bend, Wisconsin
DeerfieldPartnersJohn GiordaniArt Griffith(415)685-3035
StorePhotos

Walgreens Pharmacy
West Bend, Wisconsin
DeerfieldPartnersJohn GiordaniArt Griffith(415)685-3035
PhotosofSurroundingRetailers

Walgreens Pharmacy
West Bend, Wisconsin
DeerfieldPartnersJohn GiordaniArt Griffith(415)685-3035
PhotosofSurroundingRetailers

Walgreens Pharmacy
West Bend, Wisconsin
DeerfieldPartnersJohn GiordaniArt Griffith(415)685-3035
PhotosofSurroundingRetailers

Walgreens Pharmacy
West Bend, Wisconsin
DeerfieldPartnersJohn GiordaniArt Griffith(415)685-3035
PhotosofSurroundingRetailers

Walgreens Pharmacy
West Bend, Wisconsin
DeerfieldPartnersJohn GiordaniArt Griffith(415)685-3035
PhotosofSurroundingRetailers

Walgreens Pharmacy
West Bend, Wisconsin
DeerfieldPartnersJohn GiordaniArt Griffith(415)685-3035
SitePlan

Walgreens Pharmacy
West Bend, Wisconsin
DeerfieldPartnersJohn GiordaniArt Griffith(415)685-3035
AboutWalgreens
FinancialsinmillionsofUSD
Walgreensisthe#1pharmacyinAmericabyanymeasure.Foundedin1901,andtradedontheNewYorkStockExchange(NYSE:WAG),Walgreensoperates6,443storesin49states.Walgreensiswidelyregardedasthesafest,mostsecuresingle-tenantNNNleasedinvestmentpropertybecauseofitsstrongbalancesheetandmarketcapitalization.ForthefiscalyearendedAugust31,2008:• Saleswereover$59.03billion• Profitwasover$2.15billion• Networthwasover$12.86billion
IncomeStatementTotalRevenueGrossProfitOperatingIncomeNetIncome
63,335.0017,613.003,247.002,006.00
59,034.0016,643.003,441.002,157.00
53,762.0015,243.903,150.702,041.30
Annual2009 Annual2008 Annual2007
BalanceSheetTotalCurrentAssetsTotalAssetsTotalCurrentLiabilitiesTotalLiabilitiesTotalEquity
12,049.0025,142.006,769.0010,766.0014,376.00
10,433.0022,410.006,644.009,541.0012,869.00
9,510.5019,313.606,744.308,209.3011,104.30
CashFlowNetIncome/StatingLineCashfromOperatingActivitesCashfromInvestingActivitiesCashfromFinancialActivitiesNetChangeinCash
2,006.004,111.00-2,776.00309.00
1,644.00
2,157.003,039.00-2,818.00-33.00188.00
2,041.302,356.70-2,395.70-626.10-665.10

Walgreens Pharmacy
West Bend, Wisconsin
DeerfieldPartnersJohn GiordaniArt Griffith(415)685-3035
AboutWalgreens
Foundedin1901,Walgreensprovidesthemostconvenientaccesstoconsumergoodsandservices,andpharmacy,healthandwellnessservices,inAmerica.Thecompanyhasrecorded34consecutiveyearsofrecordsalesandearnings,atrackrecordmatchedbyonlyoneotherFortune500company.
Walgreensistakingstepstoensurethecompany’scontinuedsuccessinthefaceofaweakeningeconomy.Theyaretrans-formingintoamoreefficientandcustomer-focusedcompany,bothfordrugstorecustomersandforpatientsandpayorsseekingqualitypharmacy,healthandwellnessservicesthatareaccessibleandaffordable.
ManagingthroughdifficulteconomictimesWalgreensiscurrentlyconductingacompany-wideinitiativetoaligntheircosts,cultureandcapabilitiestotheirstrategyandtotherealitiesofthecurrenteconomicenvironment.Theyaretargetingapproximately$1billioninannualcostreductionsby2011throughmoreefficientprocesses,strategicsourcingandplanstoreducecorporateoverheadandworkthroughouttheirstores.
Inthepharmacy,theyareworkingtofillprescriptionsmoreefficiently.They’reintheearlystagesofrollingoutanewinitiativetotransform–andadvance–thepracticeofcommunitypharmacy.Currently,they’vefocusedontheirFloridastoreswherethey’vemovedtaskssuchasphonecalls,prescriptiondataentryandinsuranceverificationfromindividualstorestomoreefficientcentralprocessingfacilities.
AdjustingourorganicstoregrowthWalgreensremainsamongthefastestgrowingretailersinthecountry,evenwiththeirplannedslowdownoforganicgrowthfromthecurrent9percentratetoarateofbetween2.5and3percentby2011.Slowergrowthofferstwobigpositives:first,moretimetodeveloptheirmanagementranksandfocusonimprovingthecustomerexperience;andsecond,greaterflex-ibilitytoinvestinopportunitiesthatwillstrengthentheircoreretailbaseanddeliverattractivereturnstotheirshareholders.
GrowingourhealthclinicsandspecialtypharmacybusinessThey’regrowingtheirhealthclinicsandspecialtypharmacybusinesstocomplementtheirdrugstores.Theynowoperatemorethan680healthandwellnessclinicsintheirstoresandonemployerworksites.Sinceacquiringtwoworksitehealthcentercompanieslastspring,they’veintegratedtheseservicesintotheirnewHealthandWellnessdivision,whichplanstoexpandto800sitesbytheendoffiscal2009.Theirhealthcentersonornearemployercampusesofferdiverseservicesincludingprimaryandacutecare;wellness,pharmacyanddiseasemanagementservices;andhealthandfitnessprogram-ming.Employersrecognizethesignificantvalueandcostsavingsthesecenterscanprovide.
Boththeirretailhealthclinicsandworksitefacilitieswillpositionthemasoneofthenation’sforemostprovidersofhealthandwellnessservices.TheyarehighlycomplementarytotheirretailpharmaciesandincreaseawarenessoftheirWalgreensbrand.

Walgreens Pharmacy
West Bend, Wisconsin
DeerfieldPartnersJohn GiordaniArt Griffith(415)685-3035
Rankings&Ratings
FortunemagazineAmerica’sMostAdmiredCompaniespublishedMarch17,2008Walgreensrankedfifthamongfoodanddrugstoresandislistedforthe15thconsecutiveyear.
FortunemagazineGlobalMostAdmiredCompaniespublishedMarch17,2008WalgreensrankedseventhamongfoodanddrugstoresandNo.36amongthe50mostadmiredcompanies.
Fortunemagazine500LargestU.S.-BasedCompaniespublishedMay5,2008Walgreensranked40thoverallinrevenue,thirdamongfoodanddrugstores.
Fortunemagazine40BestStocksToRetireOnpublishedJune23,2008WalgreensmadethelistofrecommendedBargainGrowthstocks.
FortunemagazineGlobal500LargestCompaniespublishedJuly21,2008Walgreensranked125thoverallinrevenue.
ForbesPlatinum400ListpublishedJanuary12,2009WalgreensagainmadethislistofthebestperformingbigcompaniesintheUnitedStates
ForbesGlobal2000publishedApril21,2008Walgreensranked250thonthislistofthe2000largestpubliccompaniesworldwide.
Moody’sWalgreenscurrentratingisA2.
StandardandPoor’sWalgreenscurrentratingisA+.
Walgreens Pharmacy
West Bend, Wisconsin
DeerfieldPartnersJohn GiordaniArt Griffith(415)685-3035
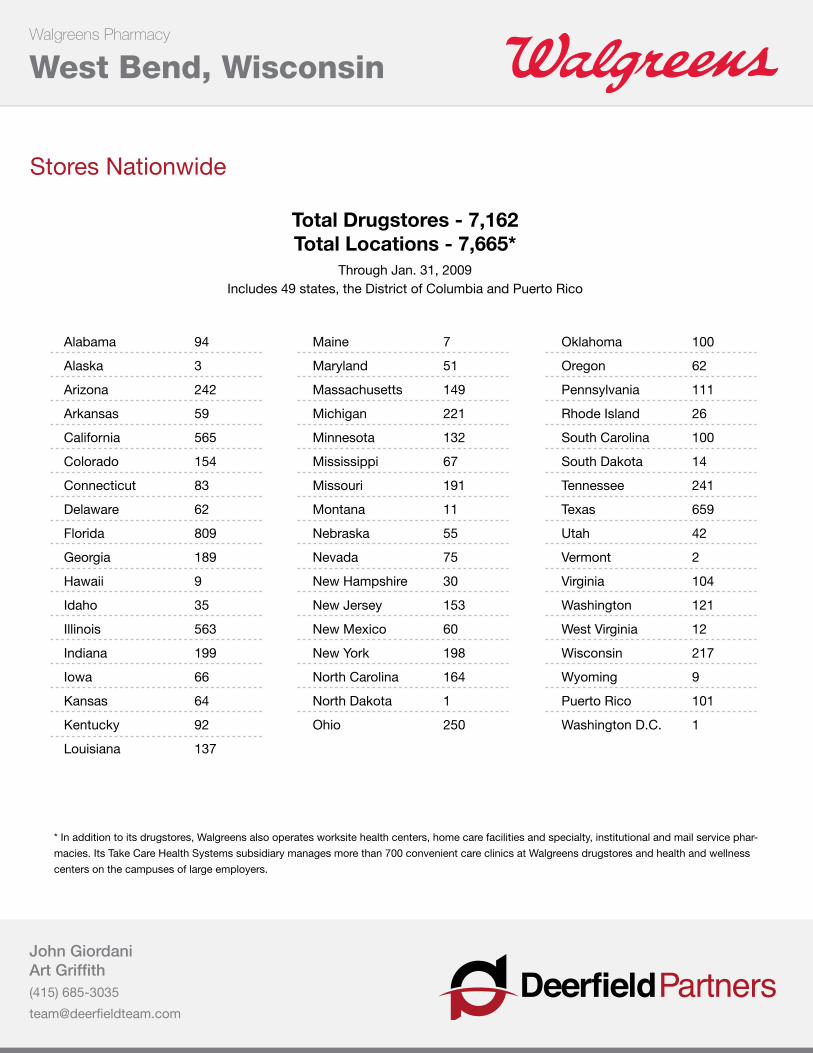
StoresNationwide
TotalDrugstores-7,162TotalLocations-7,665*
Through Jan. 31, 2009Includes 49 states, the District of Columbia and Puerto Rico
Alabama
Alaska
Arizona
Arkansas
California
Colorado
Connecticut
Delaware
Florida
Georgia
Hawaii
Idaho
Illinois
Indiana
Iowa
Kansas
Kentucky
Louisiana
94
3
242
59
565
154
83
62
809
189
9
35
563
199
66
64
92
137
Maine
Maryland
Massachusetts
Michigan
Minnesota
Mississippi
Missouri
Montana
Nebraska
Nevada
NewHampshire
NewJersey
NewMexico
NewYork
NorthCarolina
NorthDakota
Ohio
7
51
149
221
132
67
191
11
55
75
30
153
60
198
164
1
250
Oklahoma
Oregon
Pennsylvania
RhodeIsland
SouthCarolina
SouthDakota
Tennessee
Texas
Utah
Vermont
Virginia
Washington
WestVirginia
Wisconsin
Wyoming
PuertoRico
WashingtonD.C.
100
62
111
26
100
14
241
659
42
2
104
121
12
217
9
101
1
*Inadditiontoitsdrugstores,Walgreensalsooperatesworksitehealthcenters,homecarefacilitiesandspecialty,institutionalandmailservicephar-
macies.ItsTakeCareHealthSystemssubsidiarymanagesmorethan700convenientcareclinicsatWalgreensdrugstoresandhealthandwellness
centersonthecampusesoflargeemployers.

Walgreens Pharmacy
West Bend, Wisconsin
DeerfieldPartnersJohn GiordaniArt Griffith(415)685-3035
Sales&Earnings
Walgreenshasrecorded34consecutiveyearsofrecordsalesandearnings.
FiscalYearEndedAug.31
FiscalYear
FiscalYearEndedAug.31
200920082007200620052004
NewStoresAcquisitionsClosings
NetStoreOpeningsTotalStores
200920082007200620052004
SalesinBillions
20082009
EarningsPerShare
$63.3$59.0$53.8$47.4$42.2$37.5
60289129562
7,496
60842394937
6,934
$2.02$2.17$2.03$1.72$1.52$1.31
PercentIncrease
2007
PercentIncrease
7.3%9.8%13.4%12.3%12.5%14.3%
50112085536
5,997
-6.9%6.9%18.0%13.2%16.0%15.8%
EarningsinBillions
2006
$2.01$2.16$2.04$1.75$1.56$1.35
4759594476
5,461
PercentIncrease
2005 2004
-7.0%5.7%16.6%12.3%15.5%15.7%
436468372
4,985
4291482361
4,613

Walgreens Pharmacy
West Bend, Wisconsin
DeerfieldPartnersJohn GiordaniArt Griffith(415)685-3035
Demographics-1MileRadius
Demographic and Income Profile1921 S Main St, West Bend, WI 53095-5206 Prepared by John GiordaniDeerfield PartnersRing: 1 mile radius Latitude: 43.397197
Longitude: -88.18079
AreaStateUSA
Trends 2010-2015
Population Households Families Owner HHs Median HH Income
Annual
Rat
e (i
n p
erce
nt)
3
2.5
2
1.5
1
0.5
0
20102015
Population by Age
0-4 5-9 10-14 15-19 20-24 25-34 35-44 45-54 55-64 65-74 75-84 85+
Perc
ent
14131211109876
543210
2010 Household Income
$200K+5.4%
$150K - $199K3.8%
$100K - $149K14.2%
$75K - $99K17.1%
$50K - $74K21.4%
$35K - $49K15.5%
$25K - $34K10.7%
$15K - $24K4.8%
< $15K7.1%
2010 Population by Race
White Black Am. Ind. Asian Pacific Other Two+
Perc
ent
90
80
70
60
50
40
30
20
10
0
2010 Percent Hispanic Origin: 3.9%
June 24, 2011
©2010 Esri Page 2 of 6
Source: U.S. Bureau of the Census, 2000 Census of Population and Housing. Esri forecasts for 2010 and 2015.

Walgreens Pharmacy
West Bend, Wisconsin
DeerfieldPartnersJohn GiordaniArt Griffith(415)685-3035
Demographics-1MileRadius
Demographic and Income Profile1921 S Main St, West Bend, WI 53095-5206 Prepared by John GiordaniDeerfield PartnersRing: 1 mile radius Latitude: 43.397197
Longitude: -88.18079
Summary 2000 2010 2015Population 5,155 5,675 5,851Households 2,178 2,502 2,601Families 1,464 1,667 1,726Average Household Size 2.36 2.26 2.24Owner Occupied Housing Units 1,295 1,493 1,555Renter Occupied Housing Units 883 1,009 1,046Median Age 36.3 38.3 38.9
Trends: 2010 - 2015 Annual Rate Area State NationalPopulation 0.61% 0.47% 0.76%Households 0.78% 0.59% 0.78%Families 0.70% 0.51% 0.64%Owner HHs 0.82% 0.61% 0.82%Median Household Income 3.45% 2.55% 2.36%
2000 2010 2015 Households by Income Number Percent Number Percent Number Percent
<$15,000 189 8.7% 178 7.1% 140 5.4%$15,000 - $24,999 177 8.1% 120 4.8% 97 3.7%$25,000 - $34,999 325 14.9% 268 10.7% 194 7.5%$35,000 - $49,999 362 16.6% 389 15.5% 274 10.5%$50,000 - $74,999 591 27.0% 535 21.4% 579 22.3%$75,000 - $99,999 211 9.7% 427 17.1% 425 16.3%$100,000 - $149,999 187 8.6% 356 14.2% 556 21.4%$150,000 - $199,999 66 3.0% 94 3.8% 176 6.8%$200,000+ 77 3.5% 136 5.4% 161 6.2%
Median Household Income $51,197 $63,926 $75,723Average Household Income $63,376 $81,088 $93,603Per Capita Income $26,495 $34,974 $40,708
2000 2010 2015 Population by Age Number Percent Number Percent Number Percent
0 - 4 344 6.7% 388 6.8% 397 6.8%5 - 9 353 6.8% 372 6.6% 386 6.6%10 - 14 377 7.3% 363 6.4% 385 6.6%15 - 19 342 6.6% 348 6.1% 343 5.9%20 - 24 317 6.1% 328 5.8% 317 5.4%25 - 34 746 14.5% 764 13.5% 775 13.2%35 - 44 756 14.7% 810 14.3% 847 14.5%45 - 54 693 13.4% 790 13.9% 767 13.1%55 - 64 436 8.5% 677 11.9% 733 12.5%65 - 74 406 7.9% 388 6.8% 492 8.4%75 - 84 305 5.9% 301 5.3% 258 4.4%85+ 80 1.6% 145 2.6% 150 2.6%
2000 2010 2015 Race and Ethnicity Number Percent Number Percent Number Percent
White Alone 4,989 96.8% 5,341 94.1% 5,454 93.2%Black Alone 25 0.5% 85 1.5% 104 1.8%American Indian Alone 23 0.4% 30 0.5% 32 0.5%Asian Alone 34 0.7% 66 1.2% 80 1.4%Pacific Islander Alone 2 0.0% 2 0.0% 2 0.0%Some Other Race Alone 42 0.8% 80 1.4% 94 1.6%Two or More Races 40 0.8% 71 1.3% 85 1.5%Hispanic Origin (Any Race) 114 2.2% 220 3.9% 276 4.7%
Data Note: Income is expressed in current dollars
June 24, 2011
©2010 Esri Page 1 of 6
Source: U.S. Bureau of the Census, 2000 Census of Population and Housing. Esri forecasts for 2010 and 2015.

Walgreens Pharmacy
West Bend, Wisconsin
DeerfieldPartnersJohn GiordaniArt Griffith(415)685-3035
Demographics-3MileRadius
Demographic and Income Profile1921 S Main St, West Bend, WI 53095-5206 Prepared by John GiordaniDeerfield PartnersRing: 3 miles radius Latitude: 43.397197
Longitude: -88.18079
AreaStateUSA
Trends 2010-2015
Population Households Families Owner HHs Median HH Income
Annual
Rat
e (i
n p
erce
nt)
3
2.5
2
1.5
1
0.5
0
20102015
Population by Age
0-4 5-9 10-14 15-19 20-24 25-34 35-44 45-54 55-64 65-74 75-84 85+
Perc
ent
141312
1110987654
3210
2010 Household Income
$200K+3.0%
$150K - $199K3.0%
$100K - $149K16.8%
$75K - $99K17.2%
$50K - $74K22.3%
$35K - $49K14.8%
$25K - $34K8.9%
$15K - $24K7.7%
< $15K6.4%
2010 Population by Race
White Black Am. Ind. Asian Pacific Other Two+
Perc
ent
90
80
70
60
50
40
30
20
10
0
2010 Percent Hispanic Origin: 2.8%
June 24, 2011
©2010 Esri Page 4 of 6
Source: U.S. Bureau of the Census, 2000 Census of Population and Housing. Esri forecasts for 2010 and 2015.

Walgreens Pharmacy
West Bend, Wisconsin
DeerfieldPartnersJohn GiordaniArt Griffith(415)685-3035
Demographics-3MileRadius
Demographic and Income Profile1921 S Main St, West Bend, WI 53095-5206 Prepared by John GiordaniDeerfield PartnersRing: 3 miles radius Latitude: 43.397197
Longitude: -88.18079
Summary 2000 2010 2015Population 25,625 27,524 28,183Households 10,445 11,723 12,107Families 6,944 7,797 8,039Average Household Size 2.41 2.31 2.29Owner Occupied Housing Units 6,806 7,695 7,968Renter Occupied Housing Units 3,639 4,028 4,139Median Age 37.3 39.6 40.0
Trends: 2010 - 2015 Annual Rate Area State NationalPopulation 0.47% 0.47% 0.76%Households 0.65% 0.59% 0.78%Families 0.61% 0.51% 0.64%Owner HHs 0.70% 0.61% 0.82%Median Household Income 3.38% 2.55% 2.36%
2000 2010 2015 Households by Income Number Percent Number Percent Number Percent
<$15,000 906 8.7% 752 6.4% 568 4.7%$15,000 - $24,999 1,160 11.1% 897 7.7% 725 6.0%$25,000 - $34,999 1,423 13.6% 1,047 8.9% 759 6.3%$35,000 - $49,999 1,812 17.3% 1,731 14.8% 1,253 10.3%$50,000 - $74,999 2,745 26.3% 2,610 22.3% 2,810 23.2%$75,000 - $99,999 1,183 11.3% 2,019 17.2% 1,961 16.2%$100,000 - $149,999 827 7.9% 1,969 16.8% 3,008 24.8%$150,000 - $199,999 188 1.8% 350 3.0% 593 4.9%$200,000+ 203 1.9% 348 3.0% 431 3.6%
Median Household Income $49,218 $62,886 $74,246Average Household Income $57,990 $74,732 $86,077Per Capita Income $23,882 $31,979 $37,137
2000 2010 2015 Population by Age Number Percent Number Percent Number Percent
0 - 4 1,663 6.5% 1,796 6.5% 1,801 6.4%5 - 9 1,673 6.5% 1,738 6.3% 1,782 6.3%10 - 14 1,802 7.0% 1,712 6.2% 1,789 6.3%15 - 19 1,748 6.8% 1,629 5.9% 1,629 5.8%20 - 24 1,442 5.6% 1,543 5.6% 1,476 5.2%25 - 34 3,561 13.9% 3,638 13.2% 3,718 13.2%35 - 44 3,955 15.4% 3,775 13.7% 3,764 13.4%45 - 54 3,496 13.6% 3,978 14.5% 3,825 13.6%55 - 64 2,227 8.7% 3,341 12.1% 3,522 12.5%65 - 74 1,810 7.1% 1,972 7.2% 2,544 9.0%75 - 84 1,633 6.4% 1,461 5.3% 1,404 5.0%85+ 617 2.4% 940 3.4% 927 3.3%
2000 2010 2015 Race and Ethnicity Number Percent Number Percent Number Percent
White Alone 25,018 97.6% 26,372 95.8% 26,830 95.2%Black Alone 82 0.3% 256 0.9% 308 1.1%American Indian Alone 89 0.3% 116 0.4% 124 0.4%Asian Alone 122 0.5% 235 0.9% 284 1.0%Pacific Islander Alone 5 0.0% 4 0.0% 4 0.0%Some Other Race Alone 125 0.5% 236 0.9% 274 1.0%Two or More Races 185 0.7% 304 1.1% 359 1.3%Hispanic Origin (Any Race) 407 1.6% 783 2.8% 986 3.5%
Data Note: Income is expressed in current dollars
June 24, 2011
©2010 Esri Page 3 of 6
Source: U.S. Bureau of the Census, 2000 Census of Population and Housing. Esri forecasts for 2010 and 2015.

Walgreens Pharmacy
West Bend, Wisconsin
DeerfieldPartnersJohn GiordaniArt Griffith(415)685-3035
Demographics-5MileRadius
Demographic and Income Profile1921 S Main St, West Bend, WI 53095-5206 Prepared by John GiordaniDeerfield PartnersRing: 5 miles radius Latitude: 43.397197
Longitude: -88.18079
AreaStateUSA
Trends 2010-2015
Population Households Families Owner HHs Median HH Income
Annual
Rat
e (i
n p
erce
nt)
32.82.62.42.2
21.81.61.41.2
10.80.60.40.2
0
20102015
Population by Age
0-4 5-9 10-14 15-19 20-24 25-34 35-44 45-54 55-64 65-74 75-84 85+
Perc
ent
1514131211109876543210
2010 Household Income
$200K+3.0%
$150K - $199K3.7%
$100K - $149K19.0%
$75K - $99K18.3%
$50K - $74K23.3%
$35K - $49K13.4%
$25K - $34K7.8%
$15K - $24K6.2%
< $15K5.3%
2010 Population by Race
White Black Am. Ind. Asian Pacific Other Two+
Perc
ent
90
80
70
60
50
40
30
20
10
0
2010 Percent Hispanic Origin: 2.7%
June 24, 2011
©2010 Esri Page 6 of 6
Source: U.S. Bureau of the Census, 2000 Census of Population and Housing. Esri forecasts for 2010 and 2015.

Walgreens Pharmacy
West Bend, Wisconsin
DeerfieldPartnersJohn GiordaniArt Griffith(415)685-3035
Demographics-5MileRadius
Demographic and Income Profile1921 S Main St, West Bend, WI 53095-5206 Prepared by John GiordaniDeerfield PartnersRing: 5 miles radius Latitude: 43.397197
Longitude: -88.18079
Summary 2000 2010 2015Population 41,461 44,994 46,436Households 16,013 18,145 18,886Families 11,248 12,723 13,220Average Household Size 2.54 2.43 2.41Owner Occupied Housing Units 11,145 12,667 13,228Renter Occupied Housing Units 4,868 5,478 5,658Median Age 36.8 39.0 39.2
Trends: 2010 - 2015 Annual Rate Area State NationalPopulation 0.63% 0.47% 0.76%Households 0.80% 0.59% 0.78%Families 0.77% 0.51% 0.64%Owner HHs 0.87% 0.61% 0.82%Median Household Income 3.09% 2.55% 2.36%
2000 2010 2015 Households by Income Number Percent Number Percent Number Percent
<$15,000 1,156 7.2% 968 5.3% 717 3.8%$15,000 - $24,999 1,563 9.7% 1,126 6.2% 903 4.8%$25,000 - $34,999 1,947 12.1% 1,417 7.8% 1,014 5.4%$35,000 - $49,999 2,861 17.8% 2,429 13.4% 1,725 9.1%$50,000 - $74,999 4,441 27.7% 4,232 23.3% 4,452 23.6%$75,000 - $99,999 1,980 12.3% 3,323 18.3% 3,183 16.9%$100,000 - $149,999 1,517 9.5% 3,445 19.0% 5,152 27.3%$150,000 - $199,999 300 1.9% 665 3.7% 1,059 5.6%$200,000+ 287 1.8% 540 3.0% 681 3.6%
Median Household Income $52,201 $67,664 $78,773Average Household Income $60,893 $78,974 $90,288Per Capita Income $24,007 $32,126 $37,034
2000 2010 2015 Population by Age Number Percent Number Percent Number Percent
0 - 4 2,764 6.7% 3,039 6.8% 3,058 6.6%5 - 9 2,878 6.9% 2,961 6.6% 3,057 6.6%10 - 14 3,092 7.5% 2,913 6.5% 3,067 6.6%15 - 19 2,916 7.0% 2,736 6.1% 2,722 5.9%20 - 24 2,180 5.3% 2,417 5.4% 2,339 5.0%25 - 34 5,649 13.6% 6,001 13.3% 6,235 13.4%35 - 44 6,878 16.6% 6,252 13.9% 6,248 13.5%45 - 54 5,745 13.9% 6,796 15.1% 6,524 14.0%55 - 64 3,546 8.6% 5,393 12.0% 5,795 12.5%65 - 74 2,629 6.3% 3,060 6.8% 3,969 8.5%75 - 84 2,219 5.4% 2,076 4.6% 2,076 4.5%85+ 968 2.3% 1,350 3.0% 1,345 2.9%
2000 2010 2015 Race and Ethnicity Number Percent Number Percent Number Percent
White Alone 40,532 97.8% 43,249 96.1% 44,373 95.6%Black Alone 110 0.3% 344 0.8% 415 0.9%American Indian Alone 144 0.3% 187 0.4% 201 0.4%Asian Alone 172 0.4% 332 0.7% 405 0.9%Pacific Islander Alone 8 0.0% 8 0.0% 8 0.0%Some Other Race Alone 199 0.5% 377 0.8% 441 1.0%Two or More Races 296 0.7% 498 1.1% 594 1.3%Hispanic Origin (Any Race) 636 1.5% 1,237 2.7% 1,571 3.4%
Data Note: Income is expressed in current dollars
June 24, 2011
©2010 Esri Page 5 of 6
Source: U.S. Bureau of the Census, 2000 Census of Population and Housing. Esri forecasts for 2010 and 2015.