Walden University - oregon.gov · Walden University College of Social and Behavioral Sciences This...
306
Walden University College of Social and Behavioral Sciences This is to certify that the doctoral dissertation by Joseph Lucas has been found to be complete and satisfactory in all respects, and that any and all revisions required by the review committee have been made. Review Committee Dr. Matthew Jones, Committee Chairperson, Public Policy and Administration Faculty Dr. Randall Oberhoff, Committee Member, Public Policy and Administration Faculty Dr. Tanya Settles, University Reviewer, Public Policy and Administration Faculty Chief Academic Officer Eric Riedel, Ph.D. Walden University 2015
Transcript of Walden University - oregon.gov · Walden University College of Social and Behavioral Sciences This...

Walden University
College of Social and Behavioral Sciences
This is to certify that the doctoral dissertation by
Joseph Lucas
has been found to be complete and satisfactory in all respects, and that any and all revisions required by the review committee have been made.
Review Committee Dr. Matthew Jones, Committee Chairperson,
Public Policy and Administration Faculty
Dr. Randall Oberhoff, Committee Member, Public Policy and Administration Faculty
Dr. Tanya Settles, University Reviewer,
Public Policy and Administration Faculty
Chief Academic Officer Eric Riedel, Ph.D.
Walden University 2015

Abstract
The Deterrent Effect of Disciplinary Segregation on Prison Inmate Misconduct
by
Joseph William Lucas
JD, Willamette University College of Law, 2011
BS, University of Oregon, 2007
Dissertation Submitted in Partial Fulfillment
of the Requirements for the Degree of
Doctor of Philosophy
Public Policy and Administration
Walden University
October 2015

Abstract
Although a widely used practice, it was previously unknown whether disciplinary
segregation is actually effective at modifying prison behavior. This quantitative,
retrospective observational study tested deterrence theory and explored the effectiveness
of disciplinary segregation in deterring subsequent prison inmate misconduct among
those subjected to it (N = 228). It compared a cohort of male inmates incarcerated by the
Oregon Department of Corrections who had spent time in disciplinary segregation in
2011 and/or 2012 with a comparison cohort who had not spent any time in disciplinary
segregation. Three models were tested, each with the outcome variable operationalized
in a different way: overall total rule violations in 2013-2014, total major rule violations in
2013-2014, and total minor rule violations in 2013-2014. Multiple regression analysis
was used to control for the influence of age, time spent on current sentence, risk score,
prior major and minor rule violations, and time spent in disciplinary segregation. These
analyses revealed that for each model, disciplinary segregation was not a significant
predictor of subsequent prison inmate misconduct. The findings suggest that deterrence
theory does not explain the relation between the experience of disciplinary segregation
and subsequent prison misconduct among those subjected to it. The findings further
suggest that disciplinary segregation neither decreases nor increases subsequent prison
misconduct. These results indicate that disciplinary segregation should undergo a critical
evaluation by prison administrators, which could lead to the practice of disciplinary
segregation being exercised in a more judicious and informed manner, thus limiting its
potentially negative effects and contributing to positive social change.


The Deterrent Effect of Disciplinary Segregation on Prison Inmate Misconduct
by
Joseph William Lucas
JD, Willamette University College of Law, 2011
BS, University of Oregon, 2007
Dissertation Submitted in Partial Fulfillment
of the Requirements for the Degree of
Doctor of Philosophy
Public Policy and Administration
Walden University
October 2015

ProQuest Number:
All rights reserved
INFORMATION TO ALL USERSThe quality of this reproduction is dependent upon the quality of the copy submitted.
In the unlikely event that the author did not send a complete manuscriptand there are missing pages, these will be noted. Also, if material had to be removed,
a note will indicate the deletion.
ProQuest
Published by ProQuest LLC ( ). Copyright of the Dissertation is held by the Author.
All rights reserved.This work is protected against unauthorized copying under Title 17, United States Code
Microform Edition © ProQuest LLC.
ProQuest LLC.789 East Eisenhower Parkway
P.O. Box 1346Ann Arbor, MI 48106 - 1346
3732862
3732862
2015

Dedication
This dissertation is dedicated to the Oregon Correctional Officers and the inmates
they supervise.

Acknowledgments
I would like to acknowledge and thank my dissertation committee chairperson,
Dr. Matthew Jones, for all of his advice and mentorship that he provided to me
throughout this process. I greatly appreciate all of his help and guidance, especially with
regard to the methodological aspects of this dissertation. I would also like to thank Dr.
Randall Oberhoff, who served on my dissertation committee, and Dr. Tanya Settles, who
served as the University Research Reviewer for this dissertation, for their help on this
dissertation.
I am also truly grateful to my family and friends. I am especially thankful for my
wife, Brogan, for her constant love and support. I would also like to thank my children
for their love and the many study-breaks they insisted that I take. My parents, brothers
and sister have also been a constant source of love and support. I am especially thankful
for my brother, Dr. Michael Richard Lucas, with whom I was always able to talk to about
the many ideas and issues related to this study.
I am also thankful for my colleagues at the Harney County District Attorney’s
Office. They were very supportive and understanding throughout this Ph.D. program.

i
Table of Contents
List of Tables ..................................................................................................................... vi List of Figures .................................................................................................................... ix Chapter 1: Introduction to the Study ....................................................................................1
Introduction ....................................................................................................................1 Background ....................................................................................................................1 Problem Statement .........................................................................................................3 Purpose of the Study ......................................................................................................6 Research Questions and Hypotheses .............................................................................6 Theoretical Framework for the Study ............................................................................8 Nature of the Study ......................................................................................................10 Definitions....................................................................................................................12 Assumptions .................................................................................................................14 Scope and Delimitations ..............................................................................................16 Limitations ...................................................................................................................17 Significance..................................................................................................................19 Summary ......................................................................................................................20
Chapter 2: Literature Review .............................................................................................22 Introduction ..................................................................................................................22 Literature Search Strategy............................................................................................23 Theoretical Foundation ................................................................................................24
Deterrence Theory ................................................................................................ 25

ii
Alternative Theories of Criminal Behavior .......................................................... 57 Segregation ........................................................................................................... 62 Segregation and Deterrence .................................................................................. 71 Similarities and Differences Between Solitary Confinement and
Disciplinary Segregation ........................................................................... 75 Literature Review Related to Key Variables and Concepts .........................................76
Age and Prison Misconduct .................................................................................. 76 Length of Incarceration and Prison Misconduct ................................................... 79 LS/CMI Risk Score ............................................................................................... 81 Gender and Prison Misconduct ............................................................................. 91 Prior Prison Rule Violations and Subsequent Prison Misconduct ........................ 93 Prior Time Spent in Disciplinary Segregation and Subsequent Prison
Misconduct ................................................................................................ 99 Index Offense, Gang Affiliation, and Prison Misconduct .................................... 99 Variables related to Disciplinary Segregation .................................................... 100
Literature Review of Research Design ......................................................................101 Summary and Conclusions ........................................................................................108
Chapter 3: Research Method ............................................................................................110 Introduction ................................................................................................................110 Research Design and Rationale .................................................................................110 Variables ....................................................................................................................114 Methodology ..............................................................................................................117

iii
Population ........................................................................................................... 117 Sampling ............................................................................................................. 119 Data Collection ................................................................................................... 120 Data Screening and Cleaning .............................................................................. 121 Data Analysis ...................................................................................................... 125
Threats to Validity .....................................................................................................128 Ethical Procedures .....................................................................................................130 Summary ....................................................................................................................131
Chapter 4: Results ............................................................................................................132 Introduction ................................................................................................................132 Population and Sample ..............................................................................................134 Model Fit ....................................................................................................................138 Assumptions ...............................................................................................................139 Outliers .......................................................................................................................140 Normally Distributed Errors ......................................................................................142 Homogeneity of Variance ..........................................................................................143
Homoscedasticity and Overall Total Rule Violations ........................................ 144 Homoscedasticity and Total Major Rule Violations ........................................... 145 Homoscedasticity and Total Minor Rule Violations .......................................... 147
Linearity .....................................................................................................................149 Independence of Observations ...................................................................................149 Multicollinearity ........................................................................................................149

iv
Data Collection ..........................................................................................................155 Results. .......................................................................................................................156
Multiple Regression and Overall Total Rule Violations ..................................... 158 Multiple Regression and Total Major Rule Violations ....................................... 163 Multiple Regression and Total Minor Rule Violations....................................... 168
Summary ....................................................................................................................173 Chapter 5: Discussion, Conclusions, and Recommendations ..........................................175
Introduction ................................................................................................................175 Interpretation of Findings ..........................................................................................176
Alternative Criminal Behavior Theories ............................................................. 178 Limitations of the Study.............................................................................................180 Other Considerations .................................................................................................183 Recommendations ......................................................................................................184 Implications................................................................................................................185 Conclusion .................................................................................................................186
References ........................................................................................................................188 Appendix A: Tables of Frequencies and Percentages of Outliers within the Data ..........208 Appendix B: Normality Statistics Concerning Dependent/Outcome Variables ..............213 Appendix C: Results of Kolmogorov-Smirnov and Shapiro-Wilk Normality Tests .......221 Appendix D: Histograms Depicting the Dependent/Outcome Variables and the
Standardized Residuals ........................................................................................224

v
Appendix E: Normal Probability-Probability Plots of Regression Standardized
Residuals ..............................................................................................................230 Appendix F: Scatterplot and Partial Plots of Data With Outcome Variable Overall
Total Rule Violations in 2013-2014, Outliers Removed .....................................236 Appendix G: Scatterplot and Partial Plots of Data With Outcome Variable Overall
Total Rule Violations in 2013-2014, Full Data Set .............................................244 Appendix H: Scatterplot and Partial Plots of Data With Outcome Variable Total
Major Rule Violations in 2013-2014, Outliers Removed ....................................252 Appendix I: Scatterplot and Partial Plots of Data With Outcome Variable Total
Major Rule Violations in 2013-2014, Full Data Set ............................................260 Appendix J: Scatterplot and Partial Plots of Data With Outcome Variable Total
Minor Rule Violations in 2013-2014, Outliers Removed ....................................268 Appendix K: Scatterplot and Partial Plots of Data With Outcome Variable Total
Minor Rule Violations in 2013-2014, Full Data Set ............................................276

vi
List of Tables
Table 1. Descriptive Statistics for the Population ........................................................... 135 Table 2. Descriptive Statistics for the Population ........................................................... 136 Table 3. Descriptive Statistics for the Sample ................................................................ 137 Table 4. Descriptive Statistics for the Sample ................................................................ 138 Table 5. Deleted Outliers ................................................................................................ 142 Table 6. Collinearity Statistics for Model With Outcome Variable Overall Total Rule
Violations in 2013-2014 (Outliers Excluded From the Data Set) ........................... 150 Table 7. Collinearity Statistics for Model With Outcome Variable Overall Total Rule
Violations in 2013-2014 (Full Data Set) ................................................................. 151 Table 8. Collinearity Statistics for Model With Outcome Variable Total Major Rule
Violations in 2013-2014 (Outliers Excluded From the Data Set) ........................... 152 Table 9. Collinearity Statistics for Model With Outcome Variable Total Major Rule
Violations in 2013-2014 (Full Data Set) ................................................................. 153 Table 10. Collinearity Statistics for Model With Outcome Variable Total Minor Rule
Violations in 2013-2014 (Outliers Excluded From the Data Set) ........................... 154 Table 11. Collinearity Statistics for Model With Outcome Variable Total Minor Rule
Violations in 2013-2014 (Full Data Set) ................................................................. 155 Table 12. Linear Model of Predictors of Overall Total Rule Violations in 2013-2014
(Outliers Excluded From the Data Set) ................................................................... 160 Table 13. Linear Model of Predictors of Overall Total Rule Violations in 2013-2014 (Full
Data Set) .................................................................................................................. 162

vii
Table 14. Linear Model of Predictors of Total Major Rule Violations in 2013-2014
(Outliers Excluded From the Data Set) ................................................................... 165 Table 15. Linear Model of Predictors of Total Major Rule Violations in 2013-2014 (Full
Data Set) .................................................................................................................. 167 Table 16. Linear Model of Predictors of Total Minor Rule Violations in 2013-2014
(Outliers Excluded From the Data Set) ................................................................... 170 Table 17. Linear Model of Predictors of Total Minor Rule Violations in 2013-2014 (Full
Data Set) .................................................................................................................. 172 Table 18. Z-Scores: Outliers Within the Data on the Variable Age ............................... 208 Table 19. Z-Scores: Outliers Within the Data on the Variable Length of Time Spent on
Current Sentence ..................................................................................................... 208 Table 20. Z-Scores: Outliers Within the Data on the Variable LS/CMI Score .............. 209 Table 21. Z-Scores: Outliers Within the Data on the Variable Total Major Rule
Violations in 2011-2012 ......................................................................................... 209 Table 22. Z-Scores: Outliers Within the Data on the Variable Total Minor Rule
Violations in 2011-2012 ......................................................................................... 210 Table 23. Z-Scores: Outliers Within the Data on the Variable Days Spent in DSU During
2011-2012 ............................................................................................................... 210 Table 24. Z-Scores: Outliers Within the Data on the Variable Overall Total Rule
Violations in 2013-2014 ......................................................................................... 211 Table 25. Z-Scores: Outliers Within the Data on the Variable Total Major Rule
Violations in 2013-2014 ......................................................................................... 211

viii
Table 26. Z-Scores: Outliers Within the Data on the Variable Total Minor Rule
Violations in 2013-2014 ......................................................................................... 212 Table 27. Normality Diagnostics: Full Data Set, Divided by Cohort ............................. 213 Table 28. Normality Diagnostics: Data Set with Outliers Deleted, Divided by Cohort . 217 Table 29. Tests of Normality on the Data Set With Outliers Deleted ............................ 221 Table 30. Tests of Normality on the Full Data Set ......................................................... 222

ix
List of Figures
Figure 1. A histogram of the outcome variable of Overall Total Rule Violations in 2013-
2014, using the full data set. ...………………………………………………... 224
Figure 2. A histogram of the outcome variable of Total Major Rule Violations in 2013-
2014, using the full data set. ...………………………………………………... 225
Figure 3. A histogram of the outcome variable of Total Minor Rule Violations in 2013-
2014, using the full data set. ...………………………………………………... 226
Figure 4. A histogram of the outcome variable of Overall Total Rule Violations in 2013-
2014, using the data set with outliers removed. ..……………………………... 227
Figure 5. A histogram of the outcome variable of Total Major Rule Violations in 2013-
2014, using the data set with outliers removed. ………………………..……... 228
Figure 6. A histogram of the outcome variable of Total Minor Rule Violations in 2013-
2014, using the data set with outliers removed. ……………………………..... 229
Figure 7. A normal P-P plot of the regression standardized residual with the outcome
variable of Overall Total Rule Violations in 2013-2014, using the full data
set. ..….………………………………...…………………………………….... 230
Figure 8. A normal P-P plot of the regression standardized residual with the outcome
variable of Total Major Rule Violations in 2013-2014, using the full data set.
…...…………………………...………………………………………………... 231
Figure 9. A normal P-P plot of the regression standardized residual with the outcome
variable of Total Minor Rule Violations in 2013-2014, using the full data set.
………………...……………………...………………………………………... 232

x
Figure 10. A normal P-P plot of the regression standardized residual with the outcome
variable of Overall Total Rule Violations in 2013-2014, using the data set with
outliers removed. ..…………………..……………………………………….... 233
Figure 11. A normal P-P plot of the regression standardized residual with the outcome
variable of Total Major Rule Violations in 2013-2014, using the data set with
outliers removed. ...…...……………….............................................................. 234
Figure 12. A normal P-P plot of the regression standardized residual with the outcome
variable of Total Minor Rule Violations in 2013-2014, using the data set with
outliers removed. ...…...……………….............................................................. 235
Figure 13. A scatterplot with the outcome variable of Overall Total Rule Violations in
2013-2014, using the data set with outliers removed. ………………………... 236
Figure 14. A partial plot with the variables Overall Total Rule Violations in 2013-2014
and Cohort, using the data set with outliers removed. ………………………... 237
Figure 15. A partial plot with the variables Overall Total Rule Violations in 2013-2014
and Age, using the data set with outliers removed. …………………………... 238
Figure 16. A partial plot with the variables Overall Total Rule Violations in 2013-2014
and Length of Time Spent on Current Sentence, using the data set with outliers
removed. ………………………………………………………………………. 239
Figure 17. A partial plot with the variables Overall Total Rule Violations in 2013-2014
and LS/CMI Score, using the data set with outliers removed. .………….……. 240

xi
Figure 18. A partial plot with the variables Overall Total Rule Violations in 2013-2014
and Prior Major Rule Violations in 2011-2012, using the data set with outliers
removed. .………………………………………………………………….…... 241
Figure 19. A partial plot with the variables Overall Total Rule Violations in 2013-2014
and Prior Minor Rule Violations in 2011-2012, using the data set with outliers
removed. .…………………………………………………………………….... 242
Figure 20. A partial plot with the variables Overall Total Rule Violations in 2013-2014
and Length of Time Spent in Disciplinary Segregation in 2011-2012, using the
data set with outliers removed. ……………………………………………….. 243
Figure 21. A scatterplot with the outcome variable of Overall Total Rule Violations in
2013-2014, using the full data set. ………………………………………..…... 244
Figure 22. A partial plot with the variables Overall Total Rule Violations in 2013-2014
and Cohort, using the full data set. …………………………………….……... 245
Figure 23. A partial plot with the variables Overall Total Rule Violations in 2013-2014
and Age, using the full data set. ……………………………………..………... 246
Figure 24. A partial plot with the variables Overall Total Rule Violations in 2013-2014
and Length of Time Spent on Current Sentence, using the full data set. ……... 247
Figure 25. A partial plot with the variables Overall Total Rule Violations in 2013-2014
and LS/CMI Score, using the full data set. ………………………………….... 248
Figure 26. A partial plot with the variables Overall Total Rule Violations in 2013-2014
and Prior Major Rule Violations in 2011-2012, using the full data set. ……… 249

xii
Figure 27. A partial plot with the variables Overall Total Rule Violations in 2013-2014
and Prior Minor Rule Violations in 2011-2012, using the full data set. ……… 250
Figure 28. A partial plot with the variables Overall Total Rule Violations in 2013-2014
and Length of Time Spent in Disciplinary Segregation in 2011-2012, using the
full data set. …………………………………………………………………… 251
Figure 29. A scatterplot with the outcome variable of Total Major Rule Violations in
2013-2014, using the data set with outliers removed. .………………...……... 252
Figure 30. A partial plot with the variables Total Major Rule Violations in 2013-2014 and
Cohort, using the data set with outliers removed. ……………………...……... 253
Figure 31. A partial plot with the variables Total Major Rule Violations in 2013-2014 and
Age, using the data set with outliers removed. …………………...…………... 254
Figure 32. A partial plot with the variables Total Major Rule Violations in 2013-2014 and
Length of Time Spent on Current Sentence, using the data set with outliers
removed. ………………………………………………………………………. 255
Figure 33. A partial plot with the variables Total Major Rule Violations in 2013-2014 and
LS/CMI Score, using the data set with outliers removed. ……….……...……. 256
Figure 34. A partial plot with the variables Total Major Rule Violations in 2013-2014 and
Prior Major Rule Violations in 2011-2012, using the data set with outliers
removed. ……………………………………………………………………..... 257
Figure 35. A partial plot with the variables Total Major Rule Violations in 2013-2014 and
Prior Minor Rule Violations in 2011-2012, using the data set with outliers
removed. ……………………………………………………………………..... 258

xiii
Figure 36. A partial plot with the variables Overall Total Major Rule Violations in 2013-
2014 and Length of Time Spent in Disciplinary Segregation in 2011-2012, using
the data set with outliers removed. ……………………………………...……. 259
Figure 37. A scatterplot with the outcome variable of Total Major Rule Violations in
2013-2014, using the full data set. ………………………………………..…... 260
Figure 38. A partial plot with the variables Total Major Rule Violations in 2013-2014 and
Cohort, using the full data set. ………………………………………………... 261
Figure 39. A partial plot with the variables Total Major Rule Violations in 2013-2014 and
Age, using the full data set. ……………………………………….…………... 262
Figure 40. A partial plot with the variables Total Major Rule Violations in 2013-2014 and
Length of Time Spent on Current Sentence, using the full data set. ……...….. 263
Figure 41. A partial plot with the variables Total Major Rule Violations in 2013-2014 and
LS/CMI Score, using the full data set. ……………………………..…………. 264
Figure 42. A partial plot with the variables Total Major Rule Violations in 2013-2014 and
Prior Major Rule Violations in 2011-2012, using the full data set. ……...…… 265
Figure 43. A partial plot with the variables Total Major Rule Violations in 2013-2014 and
Prior Minor Rule Violations in 2011-2012, using the full data set. ……...…… 266
Figure 44. A partial plot with the variables Total Major Rule Violations in 2013-2014 and
Length of Time Spent in Disciplinary Segregation in 2011-2012, using the full
data set. ……………………………………………………………………..… 267
Figure 45. A scatterplot with the outcome variable of Total Minor Rule Violations in
2013-2014, using the data set with outliers removed. ………………………... 268

xiv
Figure 46. A partial plot with the variables Total Minor Rule Violations in 2013-2014
and Cohort, using the data set with outliers removed. ………………………... 269
Figure 47. A partial plot with the variables Total Minor Rule Violations in 2013-2014
and Age, using the data set with outliers removed. …………………………... 270
Figure 48. A partial plot with the variables Total Minor Rule Violations in 2013-2014
and Length of Time Spent on Current Sentence, using the data set with outliers
removed. ………………………………………………………………………. 271
Figure 49. A partial plot with the variables Total Minor Rule Violations in 2013-2014
and LS/CMI Score, using the data set with outliers removed. ……………..…. 272
Figure 50. A partial plot with the variables Total Minor Rule Violations in 2013-2014
and Prior Major Rule Violations in 2011-2012, using the data set with outliers
removed. ……………………………………………………………………..... 273
Figure 51. A partial plot with the variables Total Minor Rule Violations in 2013-2014
and Prior Minor Rule Violations in 2011-2012, using the data set with outliers
removed. ……………………………………………………………………..... 274
Figure 52. A partial plot with the variables Overall Total Minor Rule Violations in 2013-
2014 and Length of Time Spent in Disciplinary Segregation in 2011-2012, using
the data set with outliers removed. …..…………..………………...…………. 275
Figure 53. A scatterplot with the outcome variable of Total Minor Rule Violations in
2013-2014, using the full data set. ……………………………………..……... 276
Figure 54. A partial plot with the variables Total Minor Rule Violations in 2013-2014
and Cohort, using the full data set. ………………………………………….... 277

xv
Figure 55. A partial plot with the variables Total Minor Rule Violations in 2013-2014
and Age, using the full data set. …………………………..…………………... 278
Figure 56. A partial plot with the variables Total Minor Rule Violations in 2013-2014
and Length of Time Spent on Current Sentence, using the full data set. ……... 279
Figure 57. A partial plot with the variables Total Minor Rule Violations in 2013-2014
and LS/CMI Score, using the full data set. ………………………...…………. 280
Figure 58. A partial plot with the variables Total Minor Rule Violations in 2013-2014
and Prior Major Rule Violations in 2011-2012, using the full data set. ……… 281
Figure 59. A partial plot with the variables Total Minor Rule Violations in 2013-2014
and Prior Minor Rule Violations in 2011-2012, using the full data set. ……… 282
Figure 60. A partial plot with the variables Total Minor Rule Violations in 2013-2014
and Length of Time Spent in Disciplinary Segregation in 2011-2012, using the
full data set. …………………………………………………………………… 283

1
Chapter 1: Introduction to the Study
Introduction
Disciplinary segregation is a type of sanction employed by the Oregon
Department of Corrections (Oregon DOC) within its prison facilities. Inmates who are
officially found to have committed a prison rule violation may be removed from the
general inmate population and confined in a separate cellblock known as the Disciplinary
Segregation Unit (DSU; Or. Admin. R. 291-105-005 et seq.; Or. Admin. R. 291-011-
0005 et seq.). Solitary confinement has a demonstrated potential for causing serious
negative effects on inmates subjected to it (Arrigo and Bullock, 2008; Haney & Lynch,
1997; Haney, 2003; Pizarro & Stenius, 2004; Smith, 2006). The many similarities
between disciplinary segregation and solitary confinement suggest that negative
psychological and physiological effects may also accompany the experience of
disciplinary segregation.
The purpose of disciplinary segregation, at least in part, is to deter inmates from
engaging in prison misconduct (i.e., committing rule violations). However, it is currently
unknown whether this form of punitive segregation is actually effective at changing the
behavior of those inmates subjected to it. This study was designed to fill this gap in
knowledge in order to better inform this potentially harmful disciplinary practice.
Background
From 2011–2014, an average of 14,311 individuals were incarcerated each month
in the Oregon DOC system (Oregon DOC, n.d.a). Each month, some of these individuals
were further isolated in disciplinary segregation units. However, there is a lack of

2
previous research investigating whether or not this segregation and isolation practice is
effective at changing the behavior of those inmates and reducing their subsequent prison
rule violation rates. This study was designed to address this research gap, and was
guided by deterrence theory, which suggests that such a practice will successfully curb
prison misbehavior.
Applying Bales and Piquero’s (2012) rationale of incarceration to disciplinary
segregation: “According to deterrence theory, [the experience of disciplinary segregation]
should serve to remind offenders of the costs of punishment and should prevent them
from engaging in further [offending] upon release” from disciplinary segregation (p. 72).
Under deterrence theory, the goal of punishment is the prevention of future wrongdoing
(Zimring & Hawkins, 1973, p. 75). This goal is pursued by increasing the costs
associated with wrongdoing in order to outweigh the benefits associated with committing
the offense (Nagin, 2013; Paternoster, 2010; Zimring & Hawkins, 1973). Deterrence
theory assumes that most people who commit offenses are rational individuals that
calculate and weigh the costs and benefits of a course of conduct prior to taking action
(Nagin, 2013; Paternoster, 2010).
While faith remains strong in the overall deterrent effect of the criminal justice
system (e.g., Cook, 1980; Doob & Webster, 2003; Nagin, 1998), the marginal deterrent
benefits of specific programs and policies are often in doubt, and the results of the
research testing the deterrence hypothesis remains mixed. For example, Lynch’s (1999)
evaluation of the incarceration rates and crime rates in the United States failed to support
the deterrence hypothesis. However, such studies that attempt to examine deterrence

3
through the comparison of crime rates with incarceration rates typically suffer from
serious methodological flaws, such as failing to take into account possible changing
demographic factors that may mask any deterrent effect (Nagin, 1998; Nagin, 2013). In
addition, several studies have found a negative correlation between incarceration rates
and crime rates (i.e., when incarceration rates increase, crime rates decrease) (Nagin,
2013).
A review of the studies examining custodial versus noncustodial sanctions
suggests that incarceration and imprisonment may have a criminogenic effect rather than
a deterrent effect, although the findings only weakly support that hypothesis (Nagin,
Cullen, & Jonson, 2009). 20% to 30% of the crime drop that occurred during the 1990s
may be attributable to the increased use of incarceration, although this drop in the crime
rate could have been a mixture of both deterrence and incapacitation. Moreover, it is
unclear whether prison solitary confinement reduces inmate violence (Briggs, Sundt, &
Castellano, 2003) or reduces recidivism (Mears & Bales, 2009).
Problem Statement
Disciplinary segregation is a practice utilized by the Oregon DOC where inmates
are removed from the general inmate population and placed into lockdown within a
special cellblock. Ostensibly, its purpose is to modify prison behavior by deterring
inmates from committing prison rule violations. Deterrence theory suggests that
practices such as disciplinary segregation should be effective (Paternoster, 2010; Nagin,
2013; Zimring & Hawkins, 1973). However, it was not known prior to this study

4
whether the experience of disciplinary segregation in Oregon prisons was actually
effective in modifying behavior.
There is limited extant literature on disciplinary segregation in prisons, especially
concerning the use of disciplinary segregation by the Oregon DOC. There is much
research, however, on the topic of solitary confinement, which is very similar to
disciplinary segregation. Some of the characteristics that these two forms of prison
segregation have in common are:
the prisoners are isolated from the general prison population in a separate
cellblock,
held within their cells for 22-24 hours each day and only permitted one hour of
exercise,
placed in restraints when removed from their cells,
housed in cells that are continuously lit all day and night by artificial light, with
no prisoner control over how brightly their cells are lit, and
their exposure to physical and social stimulation is severely limited (Arrigo &
Bullock, 2008; Briggs, Sundt, & Castellano, 2003; J. Duncan, personal
communication, March 13, 2014; Haney & Lynch, 1997; Haney, 2003; Lippke,
2004; Pizarro & Stenius, 2004; Smith, 2006).
Previous research has linked the experience of solitary confinement with serious
physiological and psychological negative effects. Some of those negative consequences
include suicidal ideation, lethargy, rage, hallucinations, panic, cognitive dysfunction,
emotional breakdowns, aggression, anxiety, insomnia, paranoia, depression, “increases in

5
negative attitudes and affect,” self-mutilation, hypersensitivity, withdrawal, hopelessness,
and “loss of control” (Haney & Lynch, 1997, p. 530). Since disciplinary segregation and
solitary confinement are closely related practices, these research findings suggest that
subjecting inmates to disciplinary segregation might place them at risk of psychological
and physiological harm. This creates a clear need to review disciplinary segregation with
a critical eye, and determine whether or not the subjective experience of disciplinary
segregation deters prisoners from engaging in subsequent prison misbehavior.
On a general level, there is limited available information regarding the
effectiveness of prison segregation (including solitary confinement) on deterring
misbehavior. Extant research on prison segregation and deterrence does not provide
strong or conclusive evidence that prison segregation is or is not effective at deterring
misbehavior. On a more specific level, there is very little published research concerning
disciplinary segregation, especially as it is specifically used by the Oregon DOC. Arrigo
and Bullock (2008) noted this “absence of studies focused specifically on short-term
segregation for disciplinary and/or punitive purposes” (p. 638). This gap in the literature
includes a lack of direct research on whether disciplinary segregation is effective in
deterring misbehavior, which was the object of this study.
Research on solitary confinement suggests that disciplinary segregation may have
harmful effects on those subjected to it. Therefore, it is important to determine whether
its benefits outweigh its costs and the risks of harm (Zimring & Hawkins, 1973, pp. 56–
62). However, before attempting to calculate the benefits versus the costs, a fundamental

6
investigation was necessary to determine whether the practice of disciplinary segregation
is effective at deterring inmates from subsequent prison misconduct.
Purpose of the Study
A critical evaluation of disciplinary segregation includes asking whether the
experience of disciplinary segregation deters those subjected to it from subsequently
engaging in prison misconduct. From an empirical perspective, it was unknown whether
the experience of disciplinary segregation is an effective deterrent within the Oregon
prison system. This dissertation study was designed to address this gap in knowledge.
The purpose of this quantitative study was to examine the effectiveness of
disciplinary segregation in deterring prison inmate misconduct within the Oregon DOC
prison system. Specifically, the purpose of this retrospective observational study was to
test the theory of deterrence that relates disciplinary segregation to prison misconduct.
The participants were drawn from the Oregon DOC prison inmate population.
Research Questions and Hypotheses
The purpose of this study was to examine whether disciplinary segregation is
effective in deterring subsequent prison misbehavior among those inmates subjected to it,
especially with regard to inmates who spent time in disciplinary segregation from 2011–
2012 within the Oregon DOC system. Determining whether or not disciplinary
segregation had an effect on subsequent prison misconduct was intended to reveal
whether or not it is an effective deterrent. This study was also designed to determine if
disciplinary segregation had a criminogenic effect, rather than a deterrent effect, as this
had not previously been investigated. These observations led to the development of a

7
central research question (RQ1), and two sub-questions (RQ2, RQ3). Associated with
this line of inquiry are a central null hypothesis and a central alternative research
hypothesis (NH1, RH1), along with two secondary null hypotheses and two secondary
alternative research hypotheses (NH2, NH3 and RH2, RH3).
RQ1: Does deterrence theory explain the relationship between the experience of
disciplinary segregation and subsequent prison misconduct among inmates subjected to
it, after controlling for the effects of gender, age, length of time spent incarcerated on
current sentence, LS/CMI risk score, prior major rule violations in 2011-2012, prior
minor rule violations in 2011-2012, and length of time spent in disciplinary segregation
in 2011-2012?
RQ2: Does the experience of disciplinary segregation reduce subsequent prison
misconduct among inmates who are subjected to it, and if so, to what extent?
RQ3: Does the experience of disciplinary segregation have a criminogenic effect
on inmates who are subjected to it? In other words, does the experience of disciplinary
segregation lead to increases in prison misconduct?
NH1: There is no significant difference between the treatment cohort and the
comparison cohort on prison misconduct.
RH1: There is a difference between the treatment cohort and the comparison
cohort on prison misconduct.
NH2: The experience of disciplinary segregation does not significantly reduce
subsequent prison misconduct among inmates who are subjected to it.

8
RH2: The experience of disciplinary segregation reduces subsequent prison
misconduct among inmates who are subjected to it.
NH3: The experience of disciplinary segregation does not have a significant
criminogenic effect on inmates who are subjected to it. In other words, the experience of
disciplinary segregation does not lead to significant increases in prison misconduct.
RH3: The experience of disciplinary segregation has a criminogenic effect on
inmates who are subjected to it. In other words, the experience of disciplinary
segregation leads to increases in prison misconduct.
Theoretical Framework for the Study
The theoretical framework for this study was deterrence theory. The roots of
deterrence theory can be traced back to Cesare Beccaria (1764) and Jeremy Bentham
(1789). Since then, it has been further refined and modified by numerous scholars,
including Becker (1968) and Zimring and Hawkins (1973). Deterrence theory is founded
upon the assumption that those who commit crimes do so making a rational calculated
choice (Nagin, 2013; Paternoster, 2010). According to this theory, an individual will
refrain from engaging in criminal behavior if the perceived benefits are outweighed by
the perceived costs, and vice versa (Nagin, 2013; Paternoster, 2010; Zimring & Hawkins,
1973). Deterrence occurs when the threat of unpleasant consequences for certain
behavior causes individuals to refrain from engaging in that behavior (Zimring &
Hawkins, 1973, p. 71).
Deterrence theory holds that the prevention of crime is influenced by the severity,
certainty, and swiftness of punishment (Paternoster, 2010). Therefore, holding all other

9
variables constant, increases in the certainty, severity, and swiftness of punishment
should lead to increased crime prevention (Paternoster, 2010). Deterrence theory can be
further categorized into two different types: (1) general deterrence, and (2) specific
deterrence (Nagin, 2013; Paternoster, 2010). General deterrence refers to whether the
threat of punishment deters crime, whereas specific deterrence refers to whether the
experience of being subjected to punishment deters an individual from subsequent future
offending (Nagin, 2013; Paternoster, 2010).
Essentially, deterrence theory postulates that sanctions affect behavior, and that
increasing the severity, swiftness, or certainty of sanctions will reduce misconduct or
prevent individuals from engaging in misbehavior. Disciplinary segregation operates as a
sanction for prison misconduct. In addition, since the inmate is already incarcerated for
committing a crime or crimes, and disciplinary segregation is a more intense form of
incarceration (it can be viewed as a prison-within-the-prison), disciplinary segregation
therefore also functions as an increase in the severity of the punishment the inmate is
already experiencing.
Typically, deterrence theory is focused on criminal offending. Although prisoners
are not necessarily committing crimes, but rather are committing prison rule violations,
deterrence theory is still applicable to the disciplinary segregation context, since the same
basic principles – of individuals being threatened with and subjected to sanctions for
misbehavior – are still present. Bentham (1789) structured deterrence theory in fairly
broad terms, especially when he defined “offenses” as acts that “have a tendency to
produce mischief” (p. 178, n. 1), and alternatively defined an “offense” as “an act

10
prohibited” (p. 309). Therefore, disciplinary segregation is a vehicle through which
specific deterrence can be examined and tested. If disciplinary segregation has a specific
deterrent effect on inmates, such a result would support deterrence theory. In particular,
the findings of this study would have supported deterrence theory if the experience of
disciplinary segregation significantly negatively predicted prison misconduct. However,
there is some research that suggests that disciplinary segregation may have a
criminogenic or null effect on those subjected to it, instead of a deterrent effect (e.g.,
Barak-Glantz, 1983; Briggs, Sundt, & Castellano, 2003; Mears & Bales, 2009; Motiuk &
Blanchette, 2001).
Nature of the Study
This study employed a quantitative retrospective observational research design.
For this study two cohorts were formed, a treatment cohort and a comparison cohort.
Both cohorts were drawn from all of the inmates who were incarcerated from 2011
through 2014 within a facility (or facilities) with a medium-security component in the
Oregon DOC system. The treatment cohort was comprised of all the inmates who spent
any time in disciplinary segregation during the years 2011 through 2012. The
comparison cohort was comprised of all the inmates who, as of January 1, 2013, had not
spent any time in disciplinary segregation. Then the data were analyzed to see whether
cohort membership (treatment cohort or comparison cohort) significantly predicted
prison misconduct, controlling for the effects of certain extraneous predictor variables
that are related to prison misconduct. The data that were utilized in this study were the
Oregon DOC administrative and archival data on the study’s inmate participants. The

11
data analysis was accomplished with the multiple regression statistical method, using the
IBM Statistical Package for the Social Sciences (SPSS) computer software program.
Results of the multiple regression analyses indicating that membership in the treatment
cohort (i.e., those who experienced disciplinary segregation) significantly negatively
predicted prison misconduct would have provided support for deterrence theory.
Control/predictor variables were included in the application of the multiple
regression analyses in order to better isolate the effect of disciplinary segregation on
prison misconduct. These control/predictor variables were (1) age, (2) length of time
spent incarcerated on current sentence, (3) LS/CMI risk score, (4) prior major rule
violations in 2011-2012, (5) prior minor rule violations in 2011-2012, and (6) length of
time spent in disciplinary segregation in 2011-2012. Gender also served as a control
variable, in that all the participants were male. Most of these control variables were
chosen based upon research demonstrating that they are related to institutional offending.
As mentioned above, a quantitative retrospective observational research design
was chosen for this study. Such a design appeared to fit best with the research purpose
and the context in which this study was performed. The purpose of this study was to
empirically evaluate whether the experience of disciplinary segregation is effective at
deterring subsequent prison misconduct among those inmates subjected to it. Therefore,
the aim of the study was to generate findings that could be inferred to the general Oregon
prison population outside the specific sample developed for the study. A quantitative
study enables such a generalization (as opposed to a qualitative study) (Creswell, 2009).
Furthermore, a retrospective observational research design was chosen since random

12
selection was not a feasible option for this specific study, and since the study relied on
archival administrative data.
Definitions
Disciplinary Segregation: The isolation and segregation of an inmate, for
disciplinary purposes, from the main general inmate population and placement of that
inmate within a separate cellblock (disciplinary segregation unit) as punishment for a
prison rule violation.
Criminogenic: For the purposes of this study, the term “criminogenic,” when used
in the context of prison misconduct, should be understood to mean “tending to cause or
foster misconduct.” This is an adaptation of the traditional definition of criminogenic,
“tending to cause or foster criminal behavior” (Oxford English Dictionary online, 2014).
This is because not all prison misconduct necessarily constitutes “criminal behavior” in
the strict sense, but prison misconduct and criminal behavior do appear to be related. For
further discussion, see Camp and Gaes (2005, pp. 427–428).
Incapacitation Effect: This occurs when individuals who would have otherwise
committed offenses (e.g., crimes) are prevented from doing so by subjecting them to
incarceration (Donohue, 2009, p. 274; Paternoster, 2010, pp. 802–803; Raphael &
Ludwig, 2003, p. 254).
Multi-security facility: A facility that operates different levels of security, such as
one that operates with both a minimum-security component and a medium-security
component. It is also worth mentioning that there is only one maximum-security facility
within the Oregon State Corrections system, and it is housed within the Oregon State

13
Penitentiary (the Oregon State Penitentiary is a multi-security facility, with both a
medium-security component and a maximum-security component) (Oregon DOC, n.d.b).
The independent/predictor variable Cohort: This was defined along two levels:
(1) the treatment cohort, and (2) the comparison cohort. The treatment cohort was
comprised of the inmates who spent time in disciplinary segregation during the years
2011 and/or 2012 within the Oregon DOC system. The comparison cohort was
comprised of the inmates who, as of January 1, 2013, had not spent any time in
disciplinary segregation.
The dependent/outcome variable Prison Misconduct: This was defined as an
official finding of a rule violation(s) within the prison system. For this study, this
dependent/outcome variable was measured in three different ways: (1) overall total rule
violations in 2013-2014, (2) total major rule violations in 2013-2014, and (3) total minor
rule violations in 2013-2014.
The control/predictor variable Age: The inmates’ chronological (biological) age
as of January 1, 2011.
The control/predictor variable Length of Time Spent Incarcerated on Current
Sentence: The number of days, as of January 1, 2011, that the inmate had spent
incarcerated on the sentence the inmate was serving during the specific time period of the
study.
The control/predictor variable LS/CMI Risk Score: The inmate’s total score on
section 1 of the LS/CMI administered during the intake process.

14
The control/predictor variable Prior Major Rule Violations in 2011-2012: The
total number of rule violations (i.e., official findings of a rule violation) that were
classified at the “major” levels (i.e., rule violation levels 1-4) during the years 2011 and
2012.
The control/predictor variable Prior Minor Rule Violations in 2011-2012: The
total number of rule violations (i.e., official findings of a rule violation) that were
classified at the “minor” levels (i.e., rule violation levels 5-6) during the years 2011 and
2012.
The control/predictor variable Length of Time Spent in Disciplinary Segregation
in 2011-2012: The number of days that the inmate had spent in disciplinary segregation
in 2011-2012. In the data provided for this variable by the Oregon DOC, the parameters
for this data also included days consecutively spent in disciplinary segregation where at
least one of those days was within the treatment window (January 1, 2011 through
December 31, 2012). The number of days were calculated as the date the participant
moved out of disciplinary segregation (or December 31, 2012, whichever was earlier)
minus the date the participant moved into disciplinary segregation; plus any additional
days the participant spent in disciplinary segregation in 2011 or 2012.
The control variable gender: The inmate’s sex as categorized by the Oregon
DOC.
Assumptions
An important assumption contained within this study centers on the relationship
between prison misconduct and official findings of prison rule violations. It was assumed

15
that official findings of prison rule violations accurately represent the commission of
prison misconduct by the study participants during the timeframe of the study. However,
there are concerns that official findings of prison rule violations may not accurately
reflect actual prison misconduct (Light, 1990). For example, there is the chance that
some rule violations go unnoticed or do not result in the inmate being officially found in
violation of the prison rules. This would not be an issue if the relationship between the
prison misconduct rate and the rate of official findings of prison rule violations was
constant (Zimring & Hawkins, 1973, p. 327). Unfortunately, it cannot be determined
with certainty the relation between the two rates, or whether the relation between the two
rates is the same for both cohorts.
Using official findings of prison rule violations as a proxy for prison misconduct
is similar to using arrest or conviction rates (i.e., crime rates) as a proxy for criminal
behavior, which is a practice often used within the deterrence literature (e.g., Kovandzic
& Vieraitis, 2006; Lynch, 1999; Marvell & Moody, 1994). In addition, other studies
have also used official findings of prison rule violations as a measurement of prison
misconduct (e.g., Bonta & Motiuk, 1992; Gaes et al., 2002; Kroner & Mills, 2001).
Furthermore, Camp, Gaes, Langan, and Saylor (2003) observed that due to “the increased
surveillance of inmates in prison” (as opposed to individuals in the community), it should
be expected that the “data on prison misconduct [reflects] more accurately the universe of
prison behavior than arrest or conviction data do for street crimes” (p. 505). In addition,
measuring rule violations through the use of administrative data may be more reliable
than other methods, such as conducting a survey, as inmates may not accurately identify
16
and self-report their past rule violations. Also, ethical issues would accompany any
attempt to administer a survey to prison inmates, since prisoners are a “vulnerable”
population (Creswell, 2009, p. 89). For all of these reasons, it appears that using official
findings of prison rule violations was the most appropriate measure of prison misconduct
for this specific study.
Scope and Delimitations
A quantitative retrospective observational study was employed to evaluate the
effect of the experience of disciplinary segregation on prison misconduct among inmates
within the Oregon DOC prison system during the years 2013 and 2014. The study
analyzed two groups, a treatment cohort that had spent time in disciplinary segregation
during the years 2011 or 2012, and a comparison cohort that as of January 1, 2013, had
not spent any time in disciplinary segregation. The scope of the study was limited to only
those male inmates who were incarcerated in Oregon adult prison facilities with a
medium-security component during the years 2011 through 2014. Specifically, only
inmates who were incarcerated within such facilities from January 1, 2011, through
December 31, 2014, were included in the study. The data used in the study were limited
to archival data and official records held by the Oregon DOC. Due to differences in
correctional practices and procedures, the generalizability of the study is limited to the
Oregon correctional system, and particularly to the prison populations of those facilities
with a medium-security component within that system.
There is a significant gap in the literature concerning whether the practice of
disciplinary segregation is effective at deterring prison inmate misconduct. This study

17
addressed one aspect of that gap: whether the experience of disciplinary segregation
deters inmates from subsequent prison misconduct. Due to its design, the results of the
study do not address any possible general deterrent effect disciplinary segregation may
have; that is, the study did not address the issue of whether or not the practice of
disciplinary segregation deters prison misconduct regardless of whether the inmate has
directly experienced it.
Limitations
A common problem among observational studies centers on potential
pretreatment differences between the treatment cohort and the comparison cohort
(Rosenbaum, 1989, p. 1024). The two cohorts may have had pretreatment differences
that make them noncomparable groups, thus interfering with the ability to draw causal
inferences from the results (Rosenbaum, 1989, p. 1024). In particular, the internal
validity of the study may have been compromised by possible selection bias. Selection
bias can occur when the participants of a study have a predisposition toward a certain
outcome (Creswell, 2009, p. 163). Here, the inmates within the treatment cohort (i.e.,
those who spent time in disciplinary segregation in 2011 or 2012) may have been
predisposed to committing rule violations to a greater degree than those inmates in the
comparison cohort. Multiple regression analysis was used to analyze the data in order to
reduce the chance that any potential selection bias influenced the results. The multiple
regression analyses partialled out the effects of age, length of time spent incarcerated on
current sentence, LS/CMI risk score, prior major rule violations in 2011-2012, prior
minor rule violations in 2011-2012, and length of time spent in disciplinary segregation

18
in 2011-2012, thereby helping to isolate the specific effect the experience of disciplinary
segregation may have had on subsequent prison misconduct.
The use of multiple regression analysis limited the strength of the conclusions that
could be drawn from the results. For this study, the strongest conclusion that could
possibly have been drawn is that the experience of disciplinary segregation is (or is not)
significantly predictive of prison misconduct when the variables gender, age, length of
time incarcerated on current sentence, and LS/CMI risk score, prior major rule violations
in 2011-2012, prior minor rule violations in 2011-2012, and length of time spent in
disciplinary segregation in 2011-2012 are controlled (Warner, 2013, p. 556). If the
experience of disciplinary segregation had been found to significantly predict
misconduct, such a result would not have been “proof of causality” (Warner, 2013, p.
556; Tabachnick & Fidell, 2014, p. 158). Rather, it would have been evidence suggesting
“the possibility of causality” (Warner, 2013, p. 555). In other words, it would have been
evidence that would have suggested that the experience of disciplinary segregation might
have a causal relationship with prison misconduct.
This study was designed to isolate and evaluate the effect of disciplinary
segregation on offending within the Oregon prison system. However, it is difficult to
truly isolate the effect of deterrent measures, and variables that are unaccounted for could
have influenced the results of the study. For the multiple regression analysis to deliver an
accurate assessment of the predictive value of disciplinary segregation on prison
misconduct, the model must include all the necessary control variables in order to isolate
the effect on prison misconduct that is unique to disciplinary segregation (Warner, 2013,

19
pp. 547–610). Unfortunately, for this study it is unknown whether I have included all the
necessary control variables in the analyses – “in general, we can never be sure that we
have a correctly specified model” (Warner, 2013, p. 555). In essence, the results of the
data analysis are limited to the specific sample, data, timeframe, and variables used in the
study (Warner, 2013, p. 556). Therefore, the results of this study do not constitute
definitive and conclusive proof for any particular hypothesis or theory, and should be
interpreted cautiously. Although the study was designed to isolate and measure the
deterrent effect of disciplinary segregation, there is no doubt that a great many variables
can influence prison misconduct, and many of these variables may not have been
adequately controlled by the study’s design.
Significance
Decreased mental health and psychological functioning, along with negative
physiological effects, have been associated with the experience of prison solitary
confinement (Haney & Lynch, 1997; Haney, 2003; Pizarro & Stenius, 2004; Smith, 2006;
Arrigo & Bullock, 2008). The similarities that are shared between solitary confinement
and disciplinary segregation suggest that disciplinary segregation may place inmates at
risk of psychological and physiological harm. This risk of harm might be decreased
through the generation of more knowledge about disciplinary segregation. Establishing
an understanding of the effectiveness of disciplinary segregation as a deterrent technique
may better inform its application, and may also decrease the likelihood of unnecessarily
putting inmates at risk of psychological and physiological harm. If the findings of the

20
study fail to support the premise that disciplinary segregation is an effective deterrent, the
practice of disciplinary segregation may need to be reconsidered and critically evaluated.
For example, if the findings suggest that disciplinary segregation is not being
successfully employed as a deterrence tool, such a result would support a policy shift
away from the use of disciplinary segregation and towards an alternative correctional
strategy or practice. Furthermore, such a finding could stimulate those involved in
policymaking to move towards decreasing the use of disciplinary segregation, and/or
utilizing it in a more focused and precise fashion. Such policy modifications would
diminish the likelihood of placing a prisoner unnecessarily at risk of psychological and
physiological harm due to being subjected to disciplinary segregation.
Summary
The segregation of prisoners may have negative psychological and physiological
effects on those prisoners. Research has shown that solitary confinement can result in
lethargy, rage, hallucinations, insomnia, depression, hypersensitivity, anxiety, and
paranoia, among other negative consequences (Haney & Lynch, 1997, p. 530). The
similarities between solitary confinement and the Oregon DOC practice of disciplinary
segregation suggest that disciplinary segregation may also have negative psychological
and physiological consequences. Inmates are subjected to the risk of these negative
effects as discipline for prison rule violations. However, little is known about whether
the practice of disciplinary segregation actually reduces prison inmate misconduct among
those subjected to it. In fact, some research suggests that disciplinary segregation may
have a criminogenic or null effect rather than a deterrent effect. Increasing the

21
knowledge about the behavioral effect disciplinary segregation may have on those
subjected to it should help better inform the policies and practices regarding its use within
the Oregon DOC system.

22
Chapter 2: Literature Review
Introduction
There is limited extant research evaluating the effect of disciplinary segregation
on subsequent misconduct by prison inmates. This study was designed to address this
gap in the literature, and to examine the effectiveness of disciplinary segregation in
deterring prison inmate misconduct within the State of Oregon Department of
Corrections (Oregon DOC) prison system. This retrospective observational study was
specifically designed to test the theory of deterrence that relates disciplinary segregation
to prison misconduct.
A review of the extant literature demonstrates the relevance of this issue.
Research on deterrence theory has found moderate support for the deterrence hypothesis;
but it can be difficult to isolate and detect the deterrent effect of specific policies and
practices (Paternoster, 2010). Furthermore, some of the research has produced mixed
results and is hampered by methodological flaws (see Nagin, 2013; Paternoster, 2010).
With regard to prison segregation, the weight of the extant research indicates that it can
have negative psychological and physiological effects on inmates, although these effects
might only be associated with longer periods of isolation, and the research has focused
primarily on solitary confinement. The prior research that has been performed on prison
segregation in relation to deterrence is inconclusive thus far, so it is unclear whether
prison segregation has a deterrent effect on prison inmate misconduct.
This literature review begins with an exploration of deterrence theory, beginning
with its theoretical underpinnings. Next, after a general discussion of deterrence theory,

23
studies investigating deterrence theory are reviewed, followed by a survey of extant
research on prison segregation, beginning with a discussion of the potential effects prison
segregation can have on the inmates subjected to it. The next section explores the current
research on segregation with regard to its deterrent effect. This is then followed by a
review and discussion of the research on key variables that have been empirically shown
to be related to prison misconduct, as well as a review of literature related to the research
design.
Literature Search Strategy
The search for research literature related to deterrence, prison segregation, prison
misconduct, the key variables involved in the study, and the research design was pursued
primarily through two methods. First, I searched several Internet research databases
using various combinations of search terms, including but not limited to: deterrence,
prison, institution, misconduct, misbehavior, recidivism, offense, offender, inmate,
segregation, isolation, disciplinary segregation, administrative segregation, punitive
segregation, age, LS/CMI, gender, index offense, multiple regression, and observational
studies. The databases that were used included Academic Search Complete, ProQuest
Central, ProQuest Criminal Justice, LexisNexis Academic, PsychARTICLES, and
ProQuest Dissertations and Theses Full Text. In addition, I used the search engine
Google Scholar extensively. Second, scholarly articles that were discovered through the
use of the above methods were then used to find more articles, which were then used to
discover still other studies and reports. I specifically searched the text of the articles and
their bibliographies for other possibly relevant studies and reports. In addition, academic

24
textbooks were referenced for information regarding statistical analysis techniques,
methods, and processes such as multiple regression.
The literature search strategy that I employed cast an initially broad net to collect
an array of different resources, and then became more specific as the research further
clarified the issues relevant to the study. Some of the searches were conducted with no
specified timeframe limitation, whereas other searches focused on literature that was
published within the last five or six years in order to develop an understanding of the
current state of the research. The types of literature that were discovered and utilized
included peer-reviewed journal articles, government reports, and scholarly books.
Theoretical Foundation
There is a great amount of research concerning the individual topics of deterrence
and isolation/solitary confinement. Deterrence theory traces its beginnings back to
Beccaria’s On Crimes and Punishments (1764), after which the theory has been tested,
extrapolated upon, and refined. The literature on isolation and solitary confinement
typically focuses on the effects of solitary confinement on prisoners, and to a lesser
extent on the demographic characteristics of those inmates who spend time in solitary
confinement. The solitary confinement literature in the United States has also focused on
the legal implications of solitary confinement, such as its relationship to the Due Process
Clause as well as the Eighth Amendment’s prohibition against cruel and unusual
punishment (e.g., Cockrell, 2013; Haney & Lynch, 1997; Walton, 1997), but those legal
considerations are outside the scope of this current study.

25
Deterrence Theory
Philosophical underpinnings of deterrence theory. The seeds of deterrence
theory can be found within the ideas of Thomas Hobbes (1588–1679). Within the
philosophy of Hobbes, the rationale for the justification of punishment can be found
within his concept of the social contract. Under Hobbes’ social contract individuals
relinquished all of their rights (except the right of self-preservation) to the sovereign
(Hobbes, 1651, pp. 91–100, 111–115; Bagby, 2007, p. 36). The purpose of individuals
entering into this contract was to protect their interests and personal security (Hobbes,
1651, p. 92). This contract (i.e., the agreement to relinquish their rights) occurred among
the people with each other – the sovereign was not a party to the contract (Hobbes, 1651,
p. 214; Bagby, 2007, pp. 59–60). In other words, the individuals were agreeing among
themselves to give up their rights to the sovereign (Hobbes, 1651, pp. 91–100, 111–115,
214; Bagby, 2007, p. 59). Hence, the punishment meted out by the sovereign for
transgressions is justified because: (1) the sovereign has the power to punish because “he
that transferreth any Right, transferreth the Means of enjoying it, as farre as lyeth in his
power” (Hobbes, 1651, p. 97), and (2) if that exercise of power happens to be directed at
a specific individual, the sovereign is not violating the purpose of the contract (personal
security) because he was not a party to the contract. For Hobbes, the sovereign’s power
to punish was technically unrestrained and, regardless of the cruelty of the punishment,
the exercise of that punishment would not conflict with the rights of the individual being
punished because the sovereign was not a party to the original social contract (Bagby,
2007). In the same vein, although individuals did not give up their right to self-
26
preservation, the sovereign could still take their life because the sovereign was not bound
by the social contract; he was just the recipient of the powers relinquished by the social
contract (Bagby, 2007).
For the most part, Beccaria (1764) essentially accepted and adopted Hobbes
explication of the elements of the social contract. However, Beccaria departed from
Hobbes’ teachings in an important way. For Beccaria, the rationale and purpose of law
and the justification of punishment lay in utilitarianism: the greatest good for the greatest
number. Beccaria claimed that this principle derived directly from the social contract:
“Each individual is indeed bound to society, but society is, in turn, bound to each
individual by a contract which, of its very nature, places both parties under obligation.
This obligation . . . signifies only that it is in the interests of all that the pacts
advantageous to the greatest number be observed [emphasis added]” (p. 15, n. 1).
Beccaria believed that every punishment, other than the death penalty, could be justified
through this utilitarian principle (Beccaria, 1764; Shuster, 2010, p. 63).
However, Shuster (2010) argued, “Beccaria mistakenly [emphasis added] believed
that the principle of the greatest happiness of the greatest number could be derived from
the social contract” (p. 62). Shuster went on to state that, “Beccaria’s argument rests on a
non-sequitur. Contrary to his claim, it is not in the interest of all to observe agreements
beneficial to the greatest number, and so the principle of the greatest happiness of the
greatest number does not follow from the social contract” (p. 63). However, if Postema’s
(2006) interpretation of Bentham’s utilitarianism also explains Beccaria’s concept of the
utilitarian principle, then Shuster’s critique is misplaced. If Beccaria believed that the

27
greatest good was actually the “greatest good held in common [emphasis added]” by
society (as proposed by Postema, 2006, with regard to Bentham), then the utilitarian
principle and its justification for punishment could derive from the social contract. This
is because it is in the interest of all to observe agreements that promote the greatest good,
when that “greatest good” is defined as good that is held in common. For example, it is a
good held in common by all men, including thieves, that in general those who steal are
required to pay restitution. Although paying restitution in a specific situation may not be
in the offender’s specific personal interest, his interest in not paying the restitution is not
one that is simultaneously held in common by all men.
This social contract can be seen as the font from which the sovereign obtains her
authority to punish. But how should the sovereign punish and to what end? According to
Hobbes, punishment should be forward-looking and aimed at encouraging obedience of
the law (Hobbes, 1651, pp. 201–245; Shuster, 2010, p. 46). Hobbes defines punishment
as an “evill” [sic] “inflicted” on someone who has broken the law, “to the end that the
will of men may thereby the better be disposed to obedience” (Hobbes, 1651, p. 214).
Given Hobbes’ use of the term “evill” elsewhere, it is clear that he uses the term “evill”
to denote something he considers bad that should be avoided (e.g., Hobbes, 1651, p. 231).
Later on, the deterrence theorists Beccaria (1764) and Bentham (1789) also define
punishment as an “evil” to be avoided (Beccaria, 1764, p. 43; Bentham, 1789, p. 171).
Hobbes went on to explain that “revenge” is not the purpose of punishment (Hobbes,
1651, pp. 214–215). Rather, the purpose of punishment is to “dispos[e] of the
Delinquent, or (by his example) other men, to obey the Lawes” [sic] (Hobbes, 1651, p.

28
215). In fact, Hobbes makes it clear that punishment should only be concerned with
“some future good” (p. 219), and therefore retribution was not an acceptable purpose of
punishment for Hobbes. Hobbes’ forward-looking prescription for punishment could
encompass both the concepts of deterrence and rehabilitation (Shuster, 2010), but without
a doubt it is certainly aimed at crime prevention.
This idea that the primary and ultimate aim of punishment should be forward-
looking (i.e., crime prevention) was further developed into deterrence theory, first by
Beccaria (1764) and then by Bentham (1789). Hobbes’ teachings are also connected to
Bentham’s rational choice theory. This theory holds that individuals, prior to acting, will
weigh the costs and benefits of a course of action, and then choose to act when the
benefits outweigh the costs (Bentham, 1789). The beginning of this idea can be found in
Hobbes’ seventh law of nature, in which he taught that the harm caused by the
punishment must outweigh the benefit to be gained by the unlawful activity (Hobbes,
1651, p. 215).
In summary, the foundational basis of deterrence theory lies in the social contract.
The idea of the social contract is that of people joining together and giving up some of
their freedom in return for stability and protection. This idea, in effect, stands as a proxy
for civil society; it is a way of explaining and defending the idea of a civil society.
Furthermore, according to Beccaria, the principle of utilitarianism, “the greatest good for
the greatest number of people,” is also drawn from the social contract and is related to
deterrence theory. In essence, deterrence theory is a methodology designed to fulfill the
utilitarian principle and protect and promote civil society.
29
Deterrence theory. Cesare Beccaria began his foray into criminology from a
utilitarian perspective, announcing that the aim of law should be the promotion of “the
greatest happiness shared by the greatest number” (Beccaria, 1764, p. 8). As discussed
above, these laws (and the utilitarian principle) derive from the social contract (Beccaria,
1764, pp. 10–13, 60–61). Beccaria argued that the “sole purpose” of punishment should
be the prevention of future offending, that is, “to deter other men, by fear, from
committing a similar crime” (Beccaria, 1764, p. 35). In that vein, he felt that punishment
for the purposes of retribution or restitution was inappropriate.
The purpose of punishment is neither to torture and afflict a sensitive being, nor to
undo a crime already committed . . . . The purpose can only be to prevent the
criminal from inflicting new injuries on its citizens and to deter others from
similar acts. (Beccaria, 1764, p. 42)
Beccaria (1764) taught that punishment itself was “evil” (albeit a necessary evil),
and therefore the evil inflicted by punishment should only be so great as to outweigh the
benefits associated with committing the offense; anything above and beyond what is
necessary for the prevention of offending “is superfluous and for that reason tyrannical”
(p. 43). For example, he argued “punishments that exceed what is necessary for
protection of the deposit of public security are by their very nature unjust” (Beccaria,
1764, p. 13). Beccaria recognized as well that “it is better to prevent crimes than to
punish them” (p. 93). Furthermore, punishment should be proportionate to both the harm
caused by the offense and the attractiveness of the offense; greater punishment for more
harmful crimes, less punishment for less harmful crimes (Beccaria, 1764, pp. 62–63, 42,

30
47–48, 57). Beccaria also articulated the idea that punishment for crime is most effective
at preventing future offending when it is certain, severe, and prompt.
Bentham (1789) expounded upon the work of Beccaria. Bentham (1789) began
by adopting Beccaria’s theory that the ultimate aim of government is to promote the
greatest good for the greatest number of people (pp. 1, 70, 170). “The greatest happiness
of all those whose interest is in question, as being the right and proper, and only right and
proper and universally desirable, end of human action . . . and in particular in that of a
functionary or set of functionaries exercising the powers of Government” (Bentham,
1789, p. 1, n.1). He calls this concept “the principle of utility” (Bentham, 1789, p. 1). It
could be argued that under this principle the punishment of an innocent person, or the
infliction of a punishment that is grossly disproportionate to the offense, would be
acceptable as long as the good realized by the public outweighed the sacrificial cost
suffered by the individual subjected to the punishment (Blumenson, 2012, p. 1542; see
also Zimring & Hawkins, 1973, p. 35). Possible examples include imprisoning an
innocent person or executing a pickpocket live on television. However, Bentham’s theory
of utilitarianism would not approve of such methods. Bentham’s version of utilitarianism
does not call for “heroic sacrifice” (Postema, 2010, p. 125). Rather, Bentham’s utilitarian
theory could be summarized as: The interests that are held in common by the people
should be realized to the greatest extent possible (Postema, 2006, pp. 110–122).
Bentham (1789) argued that punishment is itself an evil that should only be
pursued for the sake of deterring future wrongdoing.

31
The general object which all laws have, or ought to have, in common, is . . . to
exclude mischief. But all punishment is mischief: all punishment in itself is evil.
Upon the principle of utility, if it ought at all to be admitted, it ought only to be
admitted in as far as it promises to exclude some greater evil. (Bentham, 1789, p.
171)
Furthermore, Bentham specifically holds that punishment should never go beyond what is
necessary for deterrence purposes (p. 182). In contrast to Beccaria, Bentham
acknowledges that punishment may not just only serve the ends of deterrence but also
retribution; however, just like Beccaria, Bentham makes it clear that “no punishment
ought to be allotted merely [for the] purpose” of retribution (Bentham, 1789, p. 171, n.
1). In contrast, Immanuel Kant taught that retribution should be the primary aim of
punishment (Kant, 1796; Shuster, 2010). For example, Kant proposed that a murderer
should still be executed, for retributive purposes, even if a society is disbanding and its
members will never see each other again (Kant, 1796, p. 198; see also Zimring &
Hawkins, 1973, p. 16; Shuster, 2010). It is clear that both Beccaria and Bentham would
disagree with Kant’s proposition.
Bentham also goes into more detail on the difference between general deterrence
and specific deterrence (Bentham, 1789, pp. 170–171; cf. Beccaria, 1764, pp. 42, 35).
Bentham explains that the punishment of the offender works to prevent that individual
from future offending through “reformation” and “disablement”, whereas punishment of
the offender works to prevent others from offending by “way of example” (Bentham,
1789, pp. 170–171, n. 1). Furthermore, for criminal justice policies to be successful,

32
Bentham clearly states that the costs associated with offending must outweigh the
benefits associated with offending. “The value of punishment must not be less in any
case than what is sufficient to outweigh that of the profit of the offence” [sic] (Bentham,
1789, pp. 179–180, citing Beccaria, 1764). Moreover, Bentham adds substance to
Beccaria’s assumption that individuals weigh the costs and benefits of their actions. In
particular, he specifically argues that almost all individuals do in fact “calculate”, at least
to some degree, the potential pains and pleasure associated with their actions, going so far
as to state: “I would not say, that even a madman does not calculate” (Bentham, 1789, pp.
187–188).
Of great importance is the fact that Bentham (1789) clarified and explored the
proposition that people act in their own self-interest, in that people are motivated by pain
and pleasure (i.e., costs and benefits), and operate with the goal of increasing their utility
(i.e., benefits) (Paternoster, 2010, p. 770; e.g., Bentham, 1789, pp. 1, 31). This
development served to transform Bentham’s work into a theory of criminal behavior
(Paternoster, 2010, pp. 770–772). This is in contrast to Beccaria’s work, which
resembled more of a set of guidelines and principles rather than a theory of criminal
behavior (Paternoster, 2010, pp. 770–772).
Within Bentham’s (1789) work can also be found the idea of perception, a
principle which holds that it is an individual’s perception of the certainty, severity, and
swiftness of punishment that is important (pp. 33, 71, 183, 192), rather than the actual or
objective certainty, severity, and swiftness inherent in the punishment. Although the

33
implication of the importance of perception can be found in Bentham’s work, it was later
developed more fully by other scholars (Paternoster, 2010, pp. 772, 780).
The economist Gary Becker (1968) contributed to the development of deterrence
theory by drafting the first modern formal model of deterrence theory (Chalfin &
McCrary, 2014, p. 3; Nagin, 2013, p. 207). Up until that point, research on criminal
offending focused on pathology and psychology in order to understand why individuals
committed crimes (Paternoster, 2010, pp. 772–773, 778). In contrast, Becker explained
criminal offending through the concepts of utility and rational choice (Paternoster, 2010,
p. 778). Becker argued that
[A] person commits an offense if the expected utility to him exceeds the utility he
could get by using his time and other resources at other activities. Some persons
become "criminals," therefore, not because their basic motivation differs from that
of other persons, but because their benefits and costs differ. (Becker, 1968, p.
176)
For example, Chalfin and McCrary (2014) provide the following Becker-based formula,
in which an individual will choose to commit a crime when the following condition is
present:
(1 – p)Uc1 + Uc2 > Unc
(p. 3). Here, p represents the probability of being apprehended for committing the
offense, Uc1 represents the expected utility if the individual is caught and punished, Uc2
represents the expected utility if the individual is not apprehended, and Unc represents the

34
expected utility if the individual abstains from offending (Chalfin & McCrary, 2014, p.
3). These expected utilities can be manipulated by increasing the severity and/or
certainty of apprehension and punishment, although they can also be influenced by
sources outside of the criminal justice system (e.g., the economy) (Becker, 1968, p. 177;
Chalfin & McCrary, 2014, pp. 3–4, 7). Becker also pointed out that the social costs of
efforts at increased deterrence should be evaluated in light of the expected benefits (p.
180). This is because at times the increased deterrence may not be justifiable in
economic terms with respect to its expected costs and benefits (Becker, 1968, p. 180).
Zimring and Hawkins (1973) embarked on a refinement of deterrence theory with
a global analysis of its morality. They subsequently developed a set of “principles that
need to be observed if deterrence is to be morally tolerable” (p. 50). They described
these principles as follows:
Three [principles] are of paramount importance: the retributive limit or the
principle of just deserts, the principle that the offender’s suffering should be
regarded as a cost, and the principle that action in ignorance [of the efficacy of
punishment] imposes a moral obligation to do research [on punishment]. Also of
major importance, although infrequently at issue, is the fair notice principle in
relation to offenders punished beyond the maximum authorized at the time they
committed their offenses. Still important, but at a lower level, are the principle of
equality and the principle of fair notice when unusual but authorized sentences are
imposed. (Zimring & Hawkins, 1973, p. 50)

35
The first principle stems from the idea that a strict application of deterrence
theory could result in unfair treatment (“purely reformatory or deterrent theories lack
what are essential safeguards against inhumanity and the infringement of human rights”)
(Zimring & Hawkins, 1973, p. 35). In light of this issue, Zimring and Hawkins (1973)
adopted what could be labeled as a more “modern” approach to deterrence theory,
holding that the principle of retribution should set the “upper limit to the range within
which penalties may be selected on utilitarian grounds” (Zimring & Hawkins, 1973, p.
35, 39). As touched upon earlier, Bentham would arguably have supported this version
of deterrence theory (Postema, 2006), although perhaps for different ulterior reasons than
for the sake of pure justice or fairness. This is because the imprisonment of an innocent
individual or the grossly disproportionate punishment of an individual are not interests
‘held in common by the people.’ In particular, it would not be in the universal interest of
the people in general to punish an innocent person or subject someone to a grossly
disproportionate punishment, because, for example, it would reduce the public’s trust in
the criminal justice system, which would in turn lead to a reduction in society’s respect
for the rule of law and increase disobedience to the law. In other words, it could lead to a
breakdown of civil society. Therefore, such unfair solutions would be outside the realm
of Bentham’s concept of utilitarianism and deterrence theory, as well as outside the realm
of the version of deterrence theory espoused by Zimring and Hawkins (1973).
The second principle, that the suffering of the offender should be considered a
cost, stems from the idea that the offender is a member of the public and her interests
should be given due consideration (Zimring & Hawkins, 1973, pp. 42–43). Zimring and

36
Hawkins (1973) reference both Kant and Bentham as supporting this concept (p. 42).
Bentham, as noted by Zimring and Hawkins, even specifically stated that the offender
still remains “a member of the community,” and “that there is just as much reason for
consulting [the offender’s] interest as that of any other. His welfare is proportionately the
welfare of the community – his suffering the suffering of the community” (Zimring &
Hawkins, 1973, p. 42, citing and quoting Bentham, 1843, p. 398).
Shifting to the concepts of specific deterrence and general deterrence, Zimring
and Hawkins (1973) argued that such a taxonomy produces a false dichotomy (pp. 72–73,
224–226). They argued that the actual punishment of individuals is not a different type
of deterrence but rather a “special effort to make individuals more sensitive to general
deterrence” (p. 73). However, regardless of whether or not specific deterrence and
general deterrence are truly separate concepts, I believe that the term specific deterrence
can be useful in delineating between the effect of punishment on the individual person
subjected to it, in contrast to the general deterrent effect on society of threats and the
punishment of an individual member.
The thought process of evaluating the costs associated with offending in light of
the benefits associated with offending can be thought of as “simple deterrence” (Zimring
& Hawkins, 1973, pp. 75–75). Zimring and Hawkins (1973) argued that the basic
psychology underlying “the notion of simple deterrence subscribed to by the classical
theorists” (e.g., Bentham and Beccaria) “has long been considered inadequate” (p. 96).
Zimring and Hawkins recognized the complex psychology that can be involved in
criminal behavior decision-making (p. 89), and therefore attempted to expand deterrence

37
theory beyond just “simple deterrence” by including within the deterrence theory
framework consideration of all of the effects of punishment and the criminal justice
system on offending (p. 77). Beyond the simple calculus of a cost-benefit analysis, they
included the effect of threats and punishments on preventing offending through their
ability to: (1) provide an additional incentive to those tempted to offend, (2) increase
respect for the law, (3) help establish among members of society the “habit” of following
the law, and (4) provide a source of moral education for society by teaching right and
wrong (Zimring & Hawkins, 1973, pp. 77–89).
Principles of deterrence theory. There are five primary principles of deterrence
theory that are particularly relevant to this study. First, the purpose of punishment is the
prevention of future misconduct. The purpose of punishment is not retribution or making
the victim whole. Second, punishment should be limited to only that which is necessary
to fulfill its purpose of preventing future wrongdoing. Moreover, modern deterrence
theory holds in addition that the just desert associated with the offense should act as the
upper limit to the punishment administered. Third, people act in their own self-interest,
seeking to increase their utility or benefits. In addition, people act rationally, and weigh
the costs and benefits of their actions. When the perceived costs of an offense outweigh
its perceived benefits, then the typical individual will refrain from committing the
offense. Fourth, sanctions and the threat of sanctions can alter behavior. Fifth, the
certainty, severity, and swiftness of punishment can influence whether individuals engage
in misconduct (especially by altering their cost-benefit calculus).

38
Incarceration and crime. There are many studies concerned with the
relationship between incarceration and crime, and the following are particularly
illustrative of this line of research. First, Lynch (1999) investigated whether
imprisonment deterred crime. Lynch analyzed the trends in U.S. imprisonment rates in
relation to crime rate trends. Lynch found that from 1972 to 1993, the rate of
incarceration continuously increased each year (a 265% increase), while the crime rate
also increased (a 32% increase). Lynch conducted statistical analyses on the crime rate
and incarceration data, and was unable to reveal results supporting the hypothesis that
imprisonment deters crime. Similarly, Kovandzic and Vieraitis (2006) studied the
relationship between the imprisonment rate in Florida and Florida’s crime rate for the
years 1980 to 2000. Florida was an ideal choice because of the fact that its crime rate and
imprisonment rate were very similar to the national crime rate and imprisonment rate
(Kovandzic & Vieraitis, 2006, p. 220). Similar to Lynch’s conclusions, Kovandzic and
Vieraitis indicated there was “little or no significant relationship” between Florida’s
crime rate and Florida’s incarceration rate (Kovandzic & Vieraitis, 2006, p. 227).
Likewise, DeFina and Arvanites (2002) also did not find a statistically significant
relationship between imprisonment and crime (p. 649).
Levitt (1996) did find that incarceration might reduce crime, although the possible
deterrent effect of prison is not delineated from prison’s incapacitation effect. Levitt
studied the results of prison overcrowding litigation, in order to avoid the problem of
simultaneity confounding the analysis. Simultaneity refers to the fact that incarceration
and the crime rate “can mutually affect each other” (Paternoster, 2010, p. 800). Studies
39
that attempt to determine the effect of incarceration on the crime rate often fail to account
for the effect the crime rate has on the incarceration rate, since rising crime can lead to
rising incarceration (Nagin, 2013, p. 221). Levitt’s (1996) analysis found that
“incarcerating one additional prisoner reduces the number of crimes by approximately
fifteen per year” (p. 348). This is in keeping with the estimates of others such as Marvell
and Moody (1994) (see also Donohue, 2009). Marvell and Moody analyzed the annual
crime rate data from several studies and the Uniform Crime Reports, and found that the
data suggested that the imprisonment of each additional offender prevented 16–25 crimes
(pp. 118, 136). Levitt (2004) concluded that about one-third of the decrease in the crime
rate that occurred from 1990–2000 could be attributed to the increased use of
incarceration (pp. 178–179).
Donohue (2009) reviewed six studies that found a statistically significant negative
relationship between the incarceration rate and the crime rate after analyzing aggregate
crime rates in relation to incarceration rates (included in those six studies were Marvel
and Moody and Levitt (1996)). However, Durlauf and Nagin (2011) argued that those six
“studies are not informative about the presence (or absence) of a causal mechanism that
links imprisonment policy to crime” (p. 50). Durlauf and Nagin (2011) also issued a
detailed critique directly calling into question the findings of the Marvell and Moody
(1994) study, focusing on the design of the study and the interpretation of the results.
Research that attempts to study the relationship between incarceration and the
crime rate is susceptible to several methodological flaws. For example, although Lynch’s
(1999) examination provides a useful overall analysis of crime and imprisonment rates

40
and their interaction, it fails to take into account or control for other variables that may be
influencing the crime rate. In other words, it is possible that the deterrent effect of
incarceration is being masked by countervailing forces that are causing the crime rate to
go up in spite of prison’s deterrent effect. For example, perhaps gang culture, the
changing demographics of the population (e.g., an increased percentage of young males
in the population) (Nagin, 1998), a reduction in economic opportunities, or other factors
may be fueling the increase in crime and overwhelming the deterrent effect of
imprisonment. Therefore, Lynch’s conclusion and the study’s results are informative, but
should be viewed with caution.
Paternoster (2010) argued that the research of Levitt (1996, 2004) and others
concerning incarceration vis-à-vis the crime rate should be regarded with caution. First,
Paternoster observed that “there is a general consensus that the decline in crime is, at
least in part, due to more and longer prison sentences, with most of the controversy being
over how much an effect imprisonment had” (p. 801). This shows that Paternoster
recognized that the research does indicate that increasing the rate of incarceration can, “to
some degree,” have an inverse effect on the crime rate (p. 802). However, Paternoster
noted that it is not clear to what extent deterrence is responsible for the lowering of the
crime rate and to what degree incapacitation is responsible for the lowering of the crime
rate (pp. 802–803). Furthermore, Canada also experienced a decline in the crime rate
during the same time period as the U.S., but Canada’s crime drop was accompanied by a
decline in incarceration (Paternoster, 2010, p. 803). Moreover, attributing the U.S. crime
drop of the 1990s to increased incarceration is at odds with the trend of the 1980s, where

41
increased incarceration was accompanied by an increasing crime rate (Paternoster, 2010,
p. 803; Blumstein, 2006, p. 31). Levitt (2004) argued that this inconsistency was partly
caused by the fact that rising youth crime during that time (“due in part to the crack
epidemic”) masked the “steadily falling” adult crime rate (p. 179, n. 7; see also
Blumstein, 2006). Among the other potential causes for the drop in the crime rate could
have been changing police practices or changing demographics (Levitt, 2004, p. 163).
Nagin (2013) also adds his own critique of the incarceration rate/crime rate
literature. Just like Paternoster (2010), Nagin noted that such studies are of limited use
with respect to deterrence research, since, among other flaws, the deterrent effect of
incarceration is often not separated from the incapacitation effect (p. 220). Nagin (2013)
also highlighted the fact that the incarceration rate is not directly related to deterrence,
and the incarceration rate/crime rate literature fails to analyze the relationship between
the incarceration rate and the principles of deterrence (p. 225; see also Durlauf & Nagin,
2011, p. 53). Hence, the studies fail to link the variable incarceration rate with the
deterrence hypothesis.
Nagin, Cullen, and Jonson (2009) analyzed the relationship between incarceration
and crime from a different angle than other researchers such as Kovandzic and Vieraitis
(2006), Marvell and Moody (1994), Levitt (1996, 2004), and Lynch (1999). Rather than
focusing on imprisonment and the crime rate, they instead examined the effectiveness of
incarceration at preventing reoffending by reviewing studies that compared the effects of
custodial sanctions versus noncustodial sanctions (Nagin, Cullen, & Jonson, 2009). The
authors found that the experimental and quasi-experimental studies indicated that

42
incarceration had a criminogenic effect (as opposed to a deterrent effect), although the
evidence was weak and there were only six studies in this category (Nagin, Cullen, &
Jonson, 2009). The eleven matching studies provided stronger evidence of a
criminogenic effect, although the effect overall was not statistically significant (Nagin,
Cullen, & Jonson, 2009). The overall results of the regression studies also indicated that
incarceration had a criminogenic effect (there were 22 studies in this category) (Nagin,
Cullen, & Jonson, 2009). Nagin, Cullen, and Jonson (2009) concluded that the effect of
incarceration on reoffending is uncertain; in their words, “as imprisonment is used in
contemporary democratic societies, the scientific jury is still out on its effect on
reoffending” (p. 178). From these findings it can be inferred that disciplinary segregation
may possibly have a criminogenic effect, as opposed to a deterrent effect. In addition,
these findings suggest that disciplinary segregation may increase prison misconduct
instead of deter it.
Bales and Piquero (2012), after adopting the framework set out by Nagin, Cullen,
and Jonson (2009), performed a study comparing the effects of custodial sanctions versus
noncustodial sanctions within the Florida correctional system. In order to compare the
two types of sanctions, the researchers analyzed the recidivism data of two cohorts: those
who were sentenced to prison (the treatment cohort), versus those who were assigned to a
prison diversion program (the comparison cohort) (Bales & Piquero, 2012, pp. 73, 75).
Other studies investigating the effects of custodial sanctions versus noncustodial
sanctions have used various research design methods in order to account for possible
selection bias (Bales & Piquero, 2012). In order to examine whether those different

43
research methods produced different results, Bales and Piquero analyzed their data using
three separate methods: (1) precision/exact matching, (2) binary logistic regression, and
(3) propensity score matching (Bales & Piquero, 2012). Each of the three design
methods revealed that those who were sentenced to prison were significantly more likely
to reoffend than those who were sentenced to the community prison-diversion program
(Bales & Piquero, 2012, pp. 88, 91, 95). Although the three research design methods
each provided slightly different results, it was unclear which method was “superior”,
since “they are all different ways of getting at the issue” (Bales & Piquero, 2012, p. 98).
Sentence severity. According to classical deterrence theory, the severity of the
punishment can influence its deterrent effect. In other words, the deterrence hypothesis
holds that increasing the severity of a punishment should prevent some individuals from
committing an offense. So far, the research on the deterrent effect of the severity of
punishment has returned mixed results and only weakly supports this prong of deterrence
theory.
A study by Weisburd, Einat, and Kowalski (2008) showed that the threat of
incarceration had a noticeable effect on probationers paying their court-ordered financial
obligations. The researchers studied a group of probationers in New Jersey within a
system where probationers were previously “seldom” threatened with a violation of
probation solely for noncompliance with their financial obligations (Weisburd, Einat, &
Kowalski, 2008, pp. 14, 17). The experiment compared three groups of probationers who
were delinquent on their court-ordered financial obligations: (1) those who were kept on
just regular probation (i.e., the control group), (2) those who were threatened with being

44
served a violation of a probation, and who were also given community service and placed
on intensive probation, (3) those who were only threatened with being served a violation
of probation (Weisburd, Einat, & Kowalski, 2008). The threat of being served with a
probation violation carried with it the possibility of being incarcerated as punishment for
the probation violation, and therefore served essentially as a threat of possible
incarceration (Weisburd, Einat, & Kowalski, 2008, pp. 11, 28). The group that was
threatened with possible incarceration and was assigned community service and intensive
supervision “were significantly more likely to pay their [court-ordered] financial
obligations” than those assigned to the regular probation group (Weisburd, Einat, &
Kowalski, 2008, p. 12). However, the group that was only threatened with incarceration
had similar positive results (Weisburd, Einat, & Kowalski, 2008, p. 12). These findings
indicated that it was the threat of possible incarceration that had the primary effect of
encouraging the compliance of the probationers. These results therefore suggest that the
severity of punishment (possible incarceration versus regular probation processes) may
indeed successfully influence behavior within the criminal justice system. This is
because it appears that the more severe sanction had the primary effect; in that the
primary effect seemed to derive from the possibility of incarceration rather than from the
community service sanction or the intensive supervision (it should be noted that intensive
supervision can be seen as both a sanction and as a rehabilitative measure) (Weisburd,
Einat, & Kowalski, 2008).
Helland and Tabarrok (2007) analyzed the effect of California’s three-strikes
legislation. The three-strikes legislation required the imprisonment of those convicted of

45
a ‘third strike’ to be sentenced to 25 years to life, and mandated that they would not be
eligible for release until they had spent at least 20 years in prison (Helland & Tabarrok,
2007, pp. 309–310). A violent or serious felony was required to constitute the ‘first
strike’ (Helland & Tabarrok, 2007, p. 309). A conviction for a subsequent felony
qualified as the second strike, and another subsequent felony conviction qualified as the
third strike (Helland & Tabarrok, 2007, p. 309). The sentence for the third strike
conviction was drastically more severe than the sentence mandated for a second strike.
The second strike conviction resulted in a doubling of the sentence, 80% of which must
be served prior to release (Helland & Tabarrok, 2007, p. 309). On average, individuals
served sentences of about 43 months in prison for a second strike conviction; as opposed
to the mandatory 240 months prison minimum to be served upon a third strike conviction
(Helland & Tabarrok, 2007, p. 319). Helland and Tabarrok compared the arrest histories
of two cohorts: (1) those inmates who had been released from prison with two strikeable
convictions, and (2) those inmates who had undergone some form of adjudication (e.g.,
trial or an entry of a guilty plea) twice in which a strikeable offense was involved, but
who only had one strikeable offense conviction (e.g., at one of the adjudications, the
defendant pled guilty to a nonstrikeable offense and the strikeable offense was dismissed
pursuant to the plea negotiations) (Helland & Tabarrok, 2007, pp. 310, 312). The
analysis performed by Helland and Tabarrok revealed that the California three-strikes
legislation resulted in the deterrence of about 31,000 crimes per year (p. 327).
Furthermore, the researchers found that the increase in the severity of the third-strike
sentence “significantly reduces felony arrests among the class of criminals with two

46
strikes by 17 to 20 percent” (Helland & Tabarrok, 2007, p. 328). These results support
the deterrence theory hypothesis that the severity of punishment can function as a tool for
preventing crime.
However, Helland and Tabarrok’s (2007) generation of the comparison cohort is
susceptible to criticism. They claimed that their generation of the comparison cohort was
based upon the “fortuitous randomization of trial” (Helland & Tabarrok, 2007, p. 312).
Granted, there is doubtless some randomness involved, but it should also be noted that
the judges and prosecutors involved in the cases might have been taking into account
their own professional opinion as to whether the defendant would recidivate. Their
judgment of the chances of the defendant recidivating likely influenced whether the
defendant ended up being convicted of a strikeable offense. The reality of the sentence
associated with a second strike conviction and a third strike conviction could very well
have had a large impact on the judges’ and prosecutors’ decisions with regard to the
resolution of many of the cases in which the defendant was facing a possible conviction
for a second or third strikeable offense. The judges and prosecutors may have purposely
moved many of those individuals whom they thought had less of a chance to recidivate
out of the second-strike position and instead resolved the case with a conviction for a
nonstrikeable offense. This means that the comparison group might have been naturally
less inclined to offend than the group comprised of those individuals with two strikeable
offenses.
Raphael and Ludwig (2003) also examined the effectiveness of sentence
enhancements with their study that focused on gun crimes. Richmond, Virginia, in

47
cooperation with the Federal government, instituted “Project Exile,” which effectively
increased the penalty for the illegal possession of guns (Raphael & Ludwig, 2003). The
researchers measured the effectiveness of the program by looking at the homicide rate of
Richmond and comparing it with other cities (Raphael & Ludwig, 2003). They also
compared the adult arrest rates with juvenile arrest rates, both for Richmond and for other
cities (Raphael & Ludwig, 2003). The juvenile arrest rates served as a comparison group,
since the sentence enhancement policy of Project Exile was generally not applicable to
them (Raphael & Ludwig, 2003). Using regression analysis, the researchers determined
that the sentence severity enhancement policy of Project Exile exhibited no discernable
deterrent effect (Raphael & Ludwig, 2003, p. 274).
Drago, Galbiati, and Vertova (2009) took advantage of a unique Italian law to
study the effects of sentence severity on recidivism. The Italian parliament enacted the
Collective Clemency Bill in July of 2006, which suspended the last three years of
inmates’ sentences if those inmates met certain criteria (Drago, Galbiati, & Vertova,
2009, pp. 258, 265). The Bill only applied to those inmates whose sentences were based
on crimes committed prior to May 2, 2006 (Drago, Galbiati, & Vertova, 2009, p. 258).
The law provided that those inmates who re-offended within five years of their release
would have to serve the remainder of their sentence that had been suspended, in addition
to the sentence given for their new crime (Drago, Galbiati, & Vertova, 2009, p. 258). So,
an inmate who committed a new crime and whose sentence had previously been
shortened by one month due to the Clemency law would have to serve the sentence for
the new crime plus an additional month in prison (Drago, Galbiati, & Vertova, 2009, p.

48
258). Likewise, an individual who had received two years or three years suspended
would have to serve two or three years (respectively) of additional time in prison if they
were convicted and sentenced for a new crime within five years following their initial
release (Drago, Galbiati, & Vertova, 2009, p. 258). To varying degrees, the suspension
of the sentence effectively increased the potential severity of punishment awaiting the
inmate upon the commission of a new crime. The researchers studied the data on the
inmates who had been released between August 1, 2006, and February 28, 2007 (seven
months) (Drago, Galbiati, & Vertova, 2009, p. 259). Their analysis of the recidivism data
showed that a suspension of one month of prison “significantly reduces their propensity
to recommit a crime” (Drago, Galbiati, & Vertova, 2009, p. 259). Therefore, their results
indicated that increasing the expected punishment by one month of incarceration
decreases the probability that individuals will commit a crime (Drago, Galbiati, &
Vertova, 2009, p. 278).
Nagin and Pogarsky (2001) studied the deterrent effect of the severity of
punishment through the lens of individuals’ perceptions of severity, certainty, and
swiftness of punishment. They administered a survey to college students that was based
on a potential drunk-driving scenario (Nagin & Pogarsky, 2001, pp. 874–875). The
students were asked to estimate their chances for getting caught, in order to measure the
effect of the “certainty” of punishment (Nagin & Pogarsky, 2001, p. 875). Then the
students were randomly assigned a length of suspension of driving privileges, ranging
from 3 months to 15 months, in order to measure the effects of the “severity” of
punishment (Nagin & Pogarsky, 2001, p. 875). In order to measure the effects of the

49
“celerity” of punishment, the students were randomly assigned a time when the
suspension would take effect (in 6 months to 18 months) (Nagin & Pogarsky, 2001, p.
875). Then, the students were asked how likely they would have driven home (which
measured their likelihood of offending) (Nagin & Pogarsky, 2001, p. 875). Nagin and
Pogarsky found that both the certainty and severity of punishment had a statistically
significant negative effect on the students’ likelihood of offending, but their results did
not support the idea that the swiftness of punishment has a preventative impact on
offending (pp. 877–879). Further statistical analysis revealed that the results provided far
stronger support for the certainty of punishment than they did for the severity of
punishment (pp. 883–884).
Doob and Webster (2003) examined whether “harsher sentences deter” crime (p.
146). Starting out, the authors set out four critiques of the studies that suggest that
harsher sentences do function as a deterrent to criminal behavior (Doob & Webster,
2003). First, they argued that such studies that utilize crime rates suffer from the
difficulty of isolating the deterrent effect from other variables (e.g., incapacitation) (Doob
& Webster, 2003, pp. 156–157). Secondly, they argued that such studies that utilize as a
measure of deterrence ‘decreases in incarceration rates’ are flawed, since a decrease in
incarceration rates could be due to other variables (e.g., decreases in conviction rates)
(Doob & Webster, 2003, p. 160). Third, they argued that the results of perceptual
deterrence surveys are not necessarily generalizable to the effects of actual criminal
justice policies (Doob & Webster, 2003, p. 163). Fourth, they argued that some of the
studies utilize questionable data selection processes (Doob & Webster, 2003, p. 164).

50
Next, Doob and Webster (2003) highlighted studies examining the deterrent
effects of harsher sentences that produced inconclusive results. Then, the authors
outlined the studies that supported their “null hypothesis” that harsher sentences do not
result in a significant deterrent effect. These studies that reported no significant deterrent
effects, coupled with some perceptual deterrence studies, provided support for the
authors’ premise (Doob & Webster, 2003). The perceptual deterrence studies highlighted
by Doob and Webster (2003) primarily consisted of studies that interviewed inmates after
they had committed crimes, and examined their thought-process associated with their
criminal behavior (Doob & Webster, 2003). These studies revealed a lack of cost-benefit
analysis on the part of the criminals prior to the commission of their crimes (Doob &
Webster, 2003, p. 183). Because there is no “conclusive evidence” supporting the
argument that harsher sentences deter crime, Doob and Webster argued that therefore the
premise that harsher sentences do not deter crime should be adopted (Doob & Webster,
2003, pp. 187–191).
Statistical findings of modern deterrence research. Dölling, Entorf, Hermann,
and Rupp (2009) performed a meta-analysis on the existing deterrence research. This
meta-analysis was based on 700 deterrence studies (Dölling, Entorf, Hermann, and Rupp,
2009, p. 203). The authors converted the different effect estimates within the various
studies to t-values, in order to enhance the comparability of the studies (Dölling et al.,
2009, p. 203). For 50.5% of the studies, the deterrent effect estimate was not significant
(Dölling et al., 2009, p. 204). However, 41.7% of the deterrent effect estimates were
significant and supported the deterrence theory hypothesis, while 7.8% of the deterrent

51
effect estimates did not support the deterrent hypothesis but were also significant
(Dölling et al., 2009, p. 204). Overall, these results suggest that there is “moderate”
support for the deterrent hypothesis (Dölling et al., 2009, p. 204). The studies indicated
that the certainty of punishment has a greater effect than the severity of punishment
(Dölling et al., 2009, pp. 210, 216, 222). It should also be noted that the methodological
rigor of the studies varied a great deal (Dölling et al., 2009, p. 208).
A further careful analysis of the studies involved in the meta-analysis creates a
more nuanced picture of the research. Dölling et al. (2009) found that studies that utilize
criminal statistics generally support deterrence theory, whereas studies that focus on
capital punishment generally reject the deterrence hypothesis (p. 206). Within the studies
utilizing criminal statistics, the deterrent hypothesis was more frequently supported with
regard to property crimes than it was with regard to violent crimes (Dölling et al., 2009,
p. 210). Overall, the authors discovered that deterrent effects are more pervasive for
property and administrative-type offenses, as opposed to serious and violent crimes
(Dölling et al., 2009, pp. 201, 215, 223). Similar to the criminal statistics studies, the
survey-based studies showed that “the size of the deterrent effect is at least partly
dependent on the seriousness of the offense” (Dölling et al., 2009, p. 219).
Review and analysis of deterrence theory and research. Paternoster (2010)
evaluated the deterrent research concerning (1) policing and deterrence, (2) imprisonment
and deterrence, (3) the objective realities of punishment and the subjective perception of
punishment, and (4) the relationship between the subjective perception of punishment and
crime. Paternoster found the research concerning the deterrent effect of policing

52
inconclusive (p. 795). Paternoster noted that the results suggest that policing policies
(such as increasing the number of police) can exert a deterrent effect to some degree, but
the size of the deterrent effect is unclear (p. 795). This is especially due to the lack of
control over possible intervening variables and an inability to strictly isolate the effect of
the policing strategy under investigation within the research studies (Paternoster, 2010, p.
795). The research reviewed by Paternoster regarding the objective reality of punishment
and the subjective perception of punishment suggested that people’s perceptions of the
punishment associated with crime are not related or only weakly related to the actual real
punishment associated with crime, but that people do update their perceptions based on
experience (pp. 804–810). The literature examining the relationship between the
subjective perception of punishment and crime suggests that the perceived certainty of
punishment has a “modest” deterrent effect (Paternoster, 2010, p. 817). However,
evidence is lacking to show a deterrent effect produced by the perceived severity or
celerity of punishment (Paternoster, 2010, p. 817).
Nagin (1998, 2013) also evaluated the present state of deterrence research. Since
Nagin’s 1998 conclusions are similar to his more recent 2013 findings, I will just focus
on his most recent review. Nagin (2013) first reviewed the deterrence literature up to the
1990s. Nagin divided this literature into (1) experimental and quasi-experimental studies,
(2) aggregate studies, and (3) perceptual deterrence studies (p. 213). With regard to the
experimental and quasi-experimental studies, Nagin surmised that this literature suggests
that the certainty of punishment is a more important deterrent factor than the severity of
punishment (Nagin, 2013, p. 214–216). Furthermore, the deterrent effects of

53
interventions tend to fade as time goes by (Nagin, 2013, pp. 214–216). The aggregate
studies generally took the form of comparing and correlating, within and across
jurisdictions, the (1) crime rates, with (2) the reported crimes, with (3) the imprisonment
ratios, with (4) the mean time served (Nagin, 2013, p. 216). Although a significant
negative correlation was typically “found between the crime rate and the certainty of
imprisonment ratio”, the studies suffered from serious methodological flaws (Nagin,
2013, p. 216). Nagin also briefly discussed the literature concerning “the deterrent effect
of capital punishment,” but made the determination that the findings from this area of
research are inconclusive (Nagin, 2013, pp. 217–220). The post-1990s aggregate studies,
although generally methodologically different from the pre-1990s aggregate studies (the
post-1990s studies were generally longitudinal studies, as opposed to cross-section
studies), again typically found a negative correlation between crime rates and
imprisonment rates (Nagin, 2013, p. 220). However, just like the pre-1990s studies, these
post-1990s studies suffer from serious methodological flaws (Nagin, 2013).
Nagin (2013) analyzed both the pre- and post-1990s perceptual deterrence
literature together. These studies consistently found a negative association between the
perceived sanction certainty and risk of offending, but the results regarding the perceived
severity of punishment were less consistent (Nagin, 2013, p. 244). These studies have
also found that informal sanctions (as opposed to formal sanctions, for example, arrest
and imprisonment), such as loss of respect in the community, can play an important role
in criminal deterrence (Nagin, 2013, p. 244). It has also been found that the perception of

54
potential formal sanction severity seems to be more accurate among those who have a
stronger association with criminal activity (Nagin, 2013, p. 250).
Nagin (2013) identified two important policy implications for his research on
deterrence. First, Nagin noted that mandatory minimum sentences cannot be justified by
deterrence theory (although incapacitation theory or retribution may justify them) (pp.
199, 252–253). Second, the effectiveness of the criminal justice system may be improved
by changing the focus from “corrections” to instead increasing the perceived risk of
apprehension through policing methods (Nagin, 2013, p. 253).
The deterrent effect of the criminal justice system. Overall, it should also be
noted that despite the lukewarm evidentiary support for the efficacy of deterrence theory
found among the studies evaluating specific criminal justice tactics, practices, and
policies, researchers often still retain their overall confidence in the general deterrent
effect of the criminal justice system. Cook (1980) stated that his "assessment is that the
criminal justice system, ineffective as it may seem in many areas, has an overall crime
deterrent effect of great magnitude” (Cook, 1980, p. 213, cited by Nagin, 1998, p. 2).
Nagin (1998) reached a similar determination: “my review leads me to conclude that the
evidence for a substantial deterrent is much firmer than it was fifteen years ago. I now
concur with Cook's more emphatic conclusion that the collective actions of the criminal
justice system exert a very substantial deterrent effect” (p. 3). Even Doob and Webster
(2003), although critical of the idea that harsher sentences deter crime, nevertheless
included the caveat: “we agree with Nagin (1998), who concludes that substantial
evidence exists that the overall system deters crime” (p. 144). Paternoster (2010) noted

55
that the challenge lies not in determining whether the criminal justice system overall has
a deterrent effect, but in determining whether and to what extent “relative or marginal
deterrent effects” exist (p. 766).
Deterrence theory and the present study. Deterrence theory holds that
sanctions can affect behavior, and increasing the severity, swiftness, or certainty of
sanctions can reduce and prevent misconduct. Since disciplinary segregation operates as
a sanction for prison misconduct, then the experience of disciplinary segregation should
alter and reduce the offender’s subsequent behavior. Hypothetically, after experiencing
disciplinary segregation the offender’s perception of the threat of punishment for prison
rule violations would be updated in that the threat would seem more realistic and
applicable to his own personal situation, and the offender would subsequently modify his
behavior to avoid the threatened punishment. As mentioned previously, “according to
deterrence theory, [the experience of disciplinary segregation] should serve to remind
offenders of the costs of punishment and should prevent them from engaging in further
[offending] upon release” from disciplinary segregation (Bales & Piquero, 2012, p. 72)
(to be clear, Bales and Piquero were referring to incarceration, and I have altered their
statement to instead refer to disciplinary segregation). As noted above, typically
deterrence theory is focused on criminal offending. Although prisoners are not
necessarily committing crimes, but rather are committing prison rule violations,
deterrence theory is still applicable to the disciplinary segregation context, since the same
basic principles are still present (individuals are being threatened with, and subjected to,
sanctions for misbehavior). Bentham (1789) himself defined deterrence in very broad

56
terms (referring to “offenses” as acts that “have a tendency to produce mischief” (p. 178,
n. 1), and simply as acts that are prohibited (p. 309)). Evaluating the effect of
disciplinary segregation on prison misconduct is an approach that can be used to test the
theory of specific deterrence. Evidence that disciplinary segregation reduces subsequent
prison misbehavior would support the deterrence hypothesis. Specifically with regard to
this study, the results will support deterrence theory if the experience of disciplinary
segregation is a significant negative predictor of subsequent prison misconduct.
This study’s three core research questions were directly related to deterrence
theory:
RQ1: Does deterrence theory explain the relationship between the experience of
disciplinary segregation and subsequent prison misconduct among inmates subjected to
it, after controlling for the effects of gender, age, length of time spent incarcerated on
current sentence, LS/CMI risk score, prior major rule violations in 2011-2012, prior
minor rule violations in 2011-2012, and length of time spent in disciplinary segregation
in 2011-2012?
RQ2: Does the experience of disciplinary segregation reduce subsequent prison
misconduct among inmates who are subjected to it, and if so, to what extent?
RQ3: Does the experience of disciplinary segregation have a criminogenic effect
on inmates who are subjected to it?
The primary research question, RQ1, applied the theory of deterrence to a specific
situation and asked if deterrence theory was a viable explanation in that context, given
the circumstances. The secondary research questions, RQ2 and RQ3, asked if the

57
experience of disciplinary segregation had an effect on subsequent inmate conduct, and if
so in what direction (increase in misconduct or decrease in misconduct?). These
secondary research questions served the purpose of defining how deterrence theory will
be tested and measured in this study. RQ2 asked whether the experience of disciplinary
segregation had a deterrent effect on subsequent prison misconduct, that is, whether
deterrence theory is a viable theory in this context. RQ3 asked whether the experience of
disciplinary segregation is not a viable theory, in that if the answer to RQ3 was “yes,”
then deterrence theory would not explain the relationship between the experience of
disciplinary segregation and subsequent prison misconduct.
Alternative Theories of Criminal Behavior
Although this study was designed to specifically test deterrence theory, there are
other theories of criminal behavior that may explain the relationship between the
experience of disciplinary segregation and subsequent prison misconduct. Alternatively,
another theory or a combination of theories may explain the results of the data analysis –
without necessarily explaining the relationship, if any, between disciplinary segregation
and prison misconduct. Such other possible theories of criminal behavior apart from
deterrence theory include social learning theory, self-control theory, social-control
theory, strain theories, and biosocial theories.
Social learning theory posits that criminal behavior is something that is learned
(Akers & Jennings, 2009; Brauer & Bolen, 2015). Social learning theory assumes that
people are not naturally inclined either toward law-abiding behavior or criminal behavior;
rather, what matters is the balance of the competing influences of conformity versus

58
criminality (Schreck & Hirschi, 2009, p. 309). It is the direction in which that scale tips
that leads to whether or not a criminal act is committed by an individual (Schreck &
Hirschi, 2009, p. 309). Social learning theory, as conceived by Akers (e.g., 1985, 1998)
encompasses four central concepts/variables (Akers & Jennings, 2009, p. 325). First,
when a preponderance of an individual’s associates (e.g., family and friends) display
attitudes and behaviors that favor criminal behavior, then the likelihood that the
individual will then herself engage in criminal behavior increases (i.e., “differential
association”) (Akers & Jennings, 2009, pp. 325, 328). The second concept is that of
“differential reinforcement,” which holds that the rewards and punishments (for criminal
and conforming behavior) that an individual has experienced in the past and anticipates in
the future affect the likelihood of criminal behavior (Akers & Jennings, 2009, pp. 326–
327; Vaske, 2015, p. 126). Third, individuals may model their criminal or conforming
behavior in imitation of the behavior of others that they have observed (Akers &
Jennings, 2009, pp. 327). Lastly, social learning theory recognizes that an individual’s
attitudes and beliefs towards certain behaviors will also influence the likelihood that the
individual will engage in criminal behavior (Akers & Jennings, 2009, p. 326).
Self-control theory, as conceptualized by Gottfredson and Hirschi (1990), holds
that low self-control is the underlying cause of deviant/criminal behavior (Pratt &
Cooper, 2009, p. 289; Burt, 2015). Self-control theory was built on the foundations of
classical theories of crime (i.e., people act in their own self-interest), and positivism
(different individuals have different propensities to commit criminal acts) (Pratt &
Cooper, 2009, p. 290). According to self-control theory as originally conceived, an

59
individual’s level of self-control is for the most part fully formed by ages 8-10, and then
subsequently stable throughout the rest of a person’s life (Burt, 2015, pp. 149–150; Pratt
& Cooper, 2009, pp. 289–290). In addition, the default nature is for people to have low
self-control; self-control is something that must be developed as a child (Burt, 2015, pp.
148–149; Pratt & Cooper, 2009, pp. 289–290). Self-control can be defined as “the basic
capacity to regulate one’s thoughts, emotions, and behaviors in the face of external
demands” (DeLisi, 2015, p. 172). Self-control theory is especially concerned with the
“time perspective” individuals incorporate into their cost-benefit calculation when
considering criminal activity (Burt, 2015, p. 147). Individuals who consider the long-
term consequences of their actions will be less likely to commit crime and exercise higher
self-control, whereas individuals with a more short-term perspective will be more likely
to commit crime and exhibit low self-control (Burt, 2015, p. 147). There is empirical
support for the contention that low self-control can effectively predict criminal behavior,
but research also suggests that it is not the only underlying cause of criminal behavior
(Pratt & Cooper, 2009; Burt, 2015).
Unlike self-control theory, social control theory focuses on the social bond
between an individual and society (Schroeder, 2015). The overarching principle of social
control theory maintains that the likelihood of deviant/criminal behavior increases when
the strength of an individual’s bond to society decreases (Boisvert, 2015, p. 236; Schreck
& Hirschi, 2009, p. 305). Social control theory assumes individuals act in their own self-
interest, and criminal behavior can therefore be natural (Schreck & Hirschi, 2009, pp.
307, 309). This is in contrast to social learning theory, which assumes that criminal

60
behavior is learned, rather than naturally occurring (Schreck & Hirschi, 2009, p. 309).
Furthermore, unlike deterrence theory, social control theory holds that the criminal
justice system and formal legal sanctions do not affect the behavior of potential offenders
(Schreck & Hirschi, 2009, p. 311). Schreck and Hirschi (2009) explained: “The criminal
justice system receives people after they have committed offenses, but it has little or no
influence on their prior or subsequent behavior” (p. 311).
In social control theory, there are four elements that make up the individual’s
“bond” to society: (1) attachment, (2) commitment, (3) involvement, and (4) belief
(Schreck & Hirschi, 2009, p. 305; Schroeder, 2015, pp. 223–224). “Attachment” refers
to one’s level of sensitivity to the opinions other people might have of her (Schreck &
Hirschi, 2009, p. 305). The greater an individual cares about what others might think of
her, then the less likely it is that the individual will engage in criminal behavior (Schreck
& Hirschi, 2009, pp. 305–306). This is because there is a general consensus among
society that criminal behavior (e.g., “theft, robbery, murder”) is wrong and should not be
engaged in (Schreck & Hirschi, 2009, p. 307). “Commitment” refers to one’s stake in
conformity (Schreck & Hirschi, 2009, p. 306). As Schreck and Hirschi (2009) explained,
“the more he or she has to lose, the greater the costs of the crime and the less likely it is
to be committed” (p. 306). “Involvement” refers to the level of an individual’s
involvement in noncriminal activities (Schreck & Hirschi, 2009, p. 306). Individuals
with higher levels of involvement in conformist activities should be less likely to engage
in criminal behavior (Schreck & Hirschi, 2009, p. 306). This is in part because the time
taken up by their conformist activities should reduce their opportunities to engage in

61
criminal behavior (Schreck & Hirschi, 2009, p. 306). “Beliefs” refers to the idea that
personal beliefs are not the direct causes of criminal behavior, in that people are not
engaging in criminal behavior in order to “liv[e] up to their beliefs” (Schreck & Hirschi,
2009, p. 307).
Strain theories are based upon the idea “that certain strains or stressors increase
the likelihood of crime” (Agnew, 2009, p. 332; see also Morris, Carriaga, Diamond,
Piquero, & Piquero, 2012). Not all stressors are “conducive to crime,” and certain
stressors are more conducive to crime than others (Agnew, 2009, p. 333; Agnew, 2015).
Strain theories assume that individuals are naturally inclined to engage in conformist
behavior, but that certain stressors push individuals into committing criminal acts
(Schreck & Hirschi, 2009, p. 309). One specific strain theory, Agnew’s (2006) General
Strain Theory (GST), highlights several specific types of strain that are conducive to
crime, including parental rejection, harsh/excessive/unfair discipline, child abuse and
neglect, unemployment, discrimination, homelessness, and failure to achieve certain
goals (Agnew, 2009, p. 333; Agnew, 2015, pp. 189–190). GST also attempts to answer
why certain types of stressors increase the likelihood of an individual engaging in
criminal behavior (Agnew, 2009, p. 334). For example, certain stressors may increase
the likelihood of criminality by decreasing one’s bond with society (re: social control
theory), such as the stressor of parental rejection (Agnew, 2009, p. 334). Stressors can
lead to negative emotions such as anger (which could then lead to a desire for revenge),
or frustration, fear, or depression (which could then lead to illicit drug use in an attempt
to feel better) (Agnew, 2009, p. 334). In addition, certain stressors can lead individuals to

62
associate with people who foster and/or reinforce pro-criminal attitudes (re: social
learning theory) (Agnew, 2009, p. 334).
There is also the biosocial perspective of criminal behavior (Crews, 2009, p. 198).
The biosocial perspective attempts to integrate sociological theories with biological
theories (Crews, 2009, p. 198). The biosocial perspective holds that there are “biological
risk factors” that may predispose individuals to criminal or noncriminal behavior; but at
the same time it recognizes that the individual’s environment and social atmosphere also
play a key role in whether the individual engages criminal behavior (Boisvert, 2015, p.
237; Crews, 2009, pp. 195, 198). An individual’s biological predisposition toward
criminality could be due to certain physical traits, genes, hormones, neurotransmitters,
and types of brain structural characteristics (Crews, 2009).
Segregation
A number of researchers have undertaken the task of evaluating the evidence as to
whether or not solitary confinement causes negative psychological and/or physiological
harm to those subjected to it. Some of the research that has been produced evaluating the
effects of solitary confinement includes Haney and Lynch (1997), Haney (2003), Pizarro
& Stenius (2004), Smith (2006), and Arrigo and Bullock (2008). Zinger, Wichmann, and
Andrews (2001) also evaluated the psychological effects of prisoner segregation, but
specifically studied administrative segregation in Canada. Miller (1994) and Miller and
Young (1997) specifically examined whether the experience of disciplinary segregation
increased levels of distress among inmates. Lippke (2004) provides an informative

63
scholarly argument against the use supermaximum confinement, which is a type of
prisoner segregation practice.
The effects of solitary confinement on prisoners subjected to it. Haney and
Lynch (1997) reviewed the extant literature on solitary confinement, which included
research on sensory deprivation, social isolation, seclusion, torture, direct studies on
solitary confinement, and studies that evaluated the secondary effects of solitary
confinement. Their review of the research revealed that solitary confinement can have
many detrimental effects on inmates. Haney and Lynch (1997) summarized their
comprehensive review in the following manner:
Direct studies of the effects of prison isolation have documented a wide range of
harmful psychological effects, including increases in negative attitudes and affect,
insomnia, anxiety, panic, withdrawal, hypersensitivity, ruminations, cognitive
dysfunction, hallucinations, loss of control, aggression, rage, paranoia,
hopelessness, lethargy, depression, emotional breakdowns, self-mutilation, and
suicidal impulses. Among the correlation studies of the relationship between
housing type and various incident reports, self-mutilation is prevalent in isolated
housing, as is deterioration of mental and physical health, other-directed violence,
such as stabbings, attacks on staff, and property destruction, and collective
violence. (Haney & Lynch, 1997, p. 530)
In addition, the authors added that “there is not a single study of solitary confinement
wherein non-voluntary confinement that lasted for longer than 10 days failed to result in
negative psychological effects” (Haney & Lynch, 1997, p. 531). Six years later, Haney

64
(2003) reprised this review of the literature and arrived at similar, although stronger and
more forceful, conclusions. Haney (2003) described the negative psychological effects as
being “unequivocally documented” and “extremely well documented”, and the evidence
supporting the findings relating to its negative effects as “robust” (p. 131) and
“overwhelming” (p. 149).
Haney (2003) also compared and contrasted the prevalence rates of psychological
indices and “symptoms of psychological trauma” in prisoners at the Pelican Bay
supermax penitentiary in California against non-incarcerated individuals. Over 50% of
the supermax prisoners experienced most of the “psychological effects” and symptoms of
psychological trauma that were studied (e.g., lethargy, heart palpitations, headaches,
irrational anger, chronic depression), as opposed to the 20% prevalence rate among
nonincarcerated individuals (Haney, 2003, pp. 135–136).
Pizzaro and Stenius (2004) analyzed the research on the effects of supermax
prisons on inmates (supermax prisons are a type of solitary confinement). Their
examination revealed that much of the research is flawed or methodologically weak
(Pizzaro & Stenius, 2004). Similar to Haney and Lynch (1997) and Haney (2003),
Pizarro and Stenius (2004) also found that the evidence shows that solitary confinement
likely causes psychological harm to inmates, but their conclusion is much more guarded.
They stated that overall “the research suggests that solitary confinement has a detrimental
impact on individuals’ mental health, although the extent and specific nature of this
impact are unclear” (Pizzaro & Stenius, 2004, p. 257).

65
Smith (2006) also reviewed the relevant research related to solitary confinement.
Smith discovered that the sensory deprivation and perceptual deprivation studies
(primarily performed during the 1950s and 1960s) generally found that “isolating people
and severely restricting sensory stimulation”, even for short periods of time (“hours or
days”), can produce negative effects, such as “hallucinations, confusion, lethargy,
anxiety, panic, time distortions, impaired memory, and psychotic behavior” (pp. 470–
471). Smith further observed that the “vast majority” of modern research on solitary
confinement in prisons “report substantial health effects” (p. 471), and described the
current state of solitary confinement research as “a massive body of data documenting
serious adverse health effects” (p. 475).
Unlike Haney (2003), who stated that he had not found a single solitary
confinement study “that failed to result in negative psychological effects” (p. 132), Smith
(2006) did note that there are two solitary confinement studies, but only two, that have
not “conclude[d] that there were substantial negative health effects” related to solitary
confinement (p. 472). These two studies are Suedfeld et al., 1982, and Zinger and
Wichmann (1999). Haney and Lynch (1997) and Haney (2003) also cited the Suedfeld et
al. (1982) study, but not the Zinger and Wichmann (1999) study. However, the
evidentiary support offered by these two studies for the premise that solitary confinement
may not result in negative harm to inmates is questionable. Zinger and Wichmann (1999)
had a very high attrition rate, with only 10 prisoners completing the entire full length of
the study in nonvoluntary administrative segregation (Smith, 2006, p. 472). Suedfeld et
al. (1982) did in fact report inmates as suffering from negative health effects, but did not

66
assign such effects as directly attributable to solitary confinement (Smith, 2006, p. 472–
473), which appears why Haney and Lynch (1997) did not classify the Suedfeld et al.
(1982) study as research that ‘failed to result in negative psychological effects’ (Haney &
Lynch, 1997, p. 520).
Although the conditions of solitary confinement can differ to a great degree, there
are “a similar range of symptoms” that are suffered by “a significant percentage” of
inmates that are placed in solitary confinement (Smith, 2006, p. 488). These symptoms
include physiological negative effects, such as “severe headaches,” “heart palpitations,”
“oversensitivity to stimuli,” “pains in the abdomen,” as well as pain in the back, neck,
and chest, “weight loss,” and digestion problems (Smith, 2006, pp. 488–490). Other
physiological and mental health effects include memory loss, decreased ability to
concentrate, confusion, hallucinations, hearing voices, depression, anxiety, lethargy, and
self-mutilation (Smith, 2006, pp. 490–493). These symptoms often recede upon the
termination of solitary confinement, although some inmates continue to experience
negative effects after being released from solitary confinement (Smith, 2006, 498).
Arrigo and Bullock (2008) also reviewed the evidence concerning the
psychological effects of solitary confinement on inmates, and arrived at a conclusion
similar to the ones drawn by Haney (2003), Haney and Lynch (1997), and Smith (2006):
that the weight of the evidence shows that solitary confinement does have “damaging
psychological consequences” for inmates (Arrigo & Bullock, 2008, p. 627). However,
Arrigo and Bullock (2008) only apply this conclusion to “long term” solitary
confinement, and note that it has not been “conclusively” demonstrated that short-term
67
solitary confinement is also accompanied by negative effects (Arrigo & Bullock, 2008, p.
627). This is in part due to the lack of research on short-term disciplinary or punitive
segregation. Arrigo and Bullock explained:
Much of the isolation research examining the psychological consequences of
short-term segregation emphasizes administrative confinement only. The absence
of studies focused specifically on short-term segregation for disciplinary and/or
punitive purposes represents a serious deficiency in the literature and a significant
limitation to the present inquiry. (p. 638)
In addition, studies purporting to show that solitary confinement is not harmful are “not
representative of the conditions of secure isolation in U.S. correctional facilities” (Arrigo
& Bullock, 2008, pp. 631–632).
The effects of administrative segregation on prisoners subjected to it. Zinger,
Wichmann, and Andrews (2001) investigated whether the experience of Canadian
administrative segregation had a negative effect on inmates’ psychological functioning.
Some of the participants had been placed voluntarily in administrative segregation, while
some had been placed involuntarily in administrative segregation (Zinger, Wichmann, &
Andrews, 2001, p. 60). The comparison group consisted of inmates drawn from the
general inmate population (Zinger, Wichmann, & Andrews, 2001, p. 60). The inmates
participated in an initial examination that consisted of a psychological assessment and a
structured interview (Zinger, Wichmann, & Andrews, 2001, 60). After the initial
evaluations, this process was repeated 30 days later, and then again 60 days later (Zinger,
Wichmann, & Andrews, 2001, p. 60). Overall, the results revealed that the segregated
68
inmates suffered from “poorer mental health and psychological functioning” (Zinger,
Wichmann, & Andrews, 2001, p. 48). However, the study also revealed that their mental
health and psychological functioning did not “significantly deteriorate” during the time
they spent in administrative segregation (Zinger, Wichmann, & Andrews, 2001, p. 48).
Out of the 83 segregated inmates and 53 nonsegregated inmates that comprised the
original two cohorts, full complete 60-day data were only gathered on 23 segregated
inmates and 37 nonsegregated inmates, due to attrition (Zinger, Wichmann, & Andrews,
2001, p. 63). The authors noted that their study might not be generalizable to the United
States prison population, due in part to the fact that U.S. prison conditions may be harsher
than Canadian prison conditions (Zinger, Wichmann, & Andrews, 2001, p. 73).
The study by Zinger et al. (2001) is not without its critics. Jackson (2001) pointed
out that there are “important quantitative problems with the research methodology” (p.
112). These include the small sample size and the lack of differentiation between those
prisoners that voluntarily underwent segregation from those prisoners that were
involuntarily subjected to segregation (Jackson, 2001, p. 112). Furthermore, Jackson
argued that the Zinger et al. study failed to take into account the possible long-term
effects of segregation (p. 112). In addition, Jackson pointed out that some of the possible
effects of segregation are elusive to capture without spending a serious amount of time
with the inmate(s).
The effect of disciplinary segregation on levels of distress. Miller (1994) and
Miller and Young (1997) examined the effect prison segregation had on inmates’ level of
distress. The authors studied 30 inmates from a medium-security federal correctional

69
facility in Kentucky (Miller, 1994, p. 44; Miller & Young, 1997, p. 87–88). The
participants were drawn from three different housing categories and matched according
to age and race: 10 from the general prison population, 10 from administrative
segregation, and 10 from disciplinary segregation (Miller, 1994, p. 44; Miller & Young,
1997, p. 88). The disciplinary segregation inmates were housed in single-person cells,
whereas the inmates in administrative segregation often had a cellmate (Miller, 1994, p.
43). For the period under study, the average length of time spent in administrative
segregation was 62 days, whereas the average length of stay in disciplinary segregation
was 57 days (average length of stay in disciplinary segregation for the month prior to the
period under study was 26 days) (Miller, 1994, p. 43).
Miller (1994) found that increasing the level of restriction among inmates resulted
in increasing levels of distress (i.e., disciplinary segregation inmates experienced higher
levels of general distress than administrative segregation inmates) (pp. 46–48). Miller
and Young (1997) found that when compared with inmates from the general population,
the disciplinary segregation inmates reported significantly higher interpersonal sensitivity
(e.g., “more feelings of personal inadequacy, inferiority and marked discomfort during
interpersonal interactions”), significantly higher hostility (e.g., “more thoughts, feelings
or actions of anger”), and significantly higher obsessive-compulsive symptoms (e.g.,
“unremitting and irresistible impulses”) (Miller & Young, 1997, pp. 89–90).
Furthermore, when compared to the administrative segregation inmates, the inmates
housed in disciplinary segregation reported significantly higher hostility (Miller &
Young, 1997, p. 90). The findings of Miller and Young (1997) are in line with the

70
previous findings of Miller (1994). The findings of these two studies suggest that
disciplinary segregation may increase the level of distress felt by those inmates subjected
to it, and therefore negatively impact their psychological functioning.
Scholarly arguments against supermax. Lippke (2004) advocated against the
use of supermax confinement. Lippke pointed out that one of the purported purposes of
supermax incarceration is to reduce crime, either through incapacitation, or deterrence, or
both (Lippke, 2004, p. 112). However, supermax inmates “seem like poor candidates for
deterrence”, since the threat of maximum-security incarceration did not previously
prevent them from engaging in criminal behavior (Lippke, 2004, p. 112). In addition, the
evidence supporting the idea that increasing the severity of sanctions results in a deterrent
effect is weak (Lippke, 2004, p. 112). Moreover, the prevalence of mental illness and
low mental functioning further reduces the possible deterrent effect of solitary
confinement. Many inmates suffer from mental illness or “are of substandard or low
intelligence” (Lippke, 2004, p. 119). Smith (2006) mentioned that “up to 20% of all
prisoners [may be] ‘seriously mentally ill’ ” (p. 453), and the rate is even higher for
“disruptive prisoners” (p. 454). Such mentally ill inmates and those with low intelligence
often act irrationally and are therefore not good candidates for deterrence (Lippke, 2004,
p. 119). Lippke argued that the costs associated with supermax confinement (both the
monetary costs and the negative impacts it has on inmates) outweigh any marginal
benefits that may be achieved through its use.

71
Segregation and Deterrence
Barak-Glantz (1983) performed one of the first modern studies directly
investigating solitary confinement. Data were gathered on prisoners from the Washington
State Penitentiary (Walla Walla, Washington) who spent time in solitary confinement,
delineated into four groups categorized by year (1966, 1971, 1973, and 1975), which was
compared with data gathered on prisoners who had been discharged from the Washington
State Penitentiary during those same four years (Barak-Glantz, 1983, pp. 30–31). Barak-
Glantz found that solitary confinement had only a “minimal” deterrent effect on inmates
(p. 36). Unfortunately, Barak-Glantz does not clearly explain the process or basis for
reaching that conclusion.
Briggs, Sundt, and Castellano (2003) tested whether supermax prisons reduced
“inmate-on-inmate violence”, and whether supermax prisons reduced “inmate-on-staff
violence” (p. 1350). Using a time series design coupled with a regression analysis
(Briggs et al., 2003, p. 1350), the authors studied violence within the prison systems of
“Arizona, Illinois, Minnesota, and Utah” (Briggs et al., 2003, p. 1351); with Arizona,
Illinois, and Minnesota functioning as the experimental sites, and Utah functioning as the
comparison site (Briggs et al., 2003, pp. 1353–1357, 1365). An analysis of their results
revealed that the supermax prisons did not reduce inmate-on-inmate violence (Briggs et
al., 2003, pp. 1341, 1365). However, their analysis of the impact of the supermax prisons
concerning inmate-on-staff violence revealed “inconsistent” results (Briggs et al., 2003,
p. 1365). It was determined that the opening of two of the four supermax facilities had
no impact on inmate-on-staff violence (Briggs et al., 2003, p. 1365). The opening of one

72
of the four supermax facilities resulted in a decrease of inmate-on-staff violence (Briggs
et al., 2003, p. 1365). Lastly, the opening of one of the four supermax facilities resulted
in a “temporary increase” of inmate-on-staff violence (Briggs et al., 2003, p. 1365).
Briggs et al. concluded that their “findings, on the whole, are not consistent with either
incapacitation or deterrence theory” (p. 1367). The results concerning the Illinois
supermax were further confirmed by the same authors in Sundt, Castellano, and Briggs
(2008).
Mears and Bales (2009) tested two competing hypotheses: (1) supermax
incarceration decreases recidivism, versus (2) supermax incarceration increases
recidivism. For this study, Mears and Bales used data on inmates who had been released
from supermax from 1996 to 2001, with a three-year follow-up period to measure their
recidivism (p. 1141). These data were then compared to the data on nonsupermax
inmates who had been matched using propensity score analysis (Mears & Bales, 2009, p.
1141). For this study, recidivism was defined as a new felony conviction occurring
within the three-year follow-up period (Mears & Bales, 2009, p. 1142). Although, prior
to matching, the supermax inmates recidivated at a much higher rate (58.8% versus
46.6%), the matching analysis presents a different picture (Mears & Bales, 2009, pp.
1149–1150). After matching the two groups using propensity scoring, the supermax
inmate recidivism rate was only slightly higher than that of the nonsupermax inmates
(58.8% versus 57.6%) (Mears & Bales, 2009, p. 1150, Table 2). Upon the division of
recidivism into crime categories (any recidivism, violent recidivism, property recidivism,
drug recidivism, and “other” recidivism), the picture became even clearer (Mears &

73
Bales, 2009, p. 1150). Within the five categories, the only statistically significant
difference was among violent recidivism, with the supermax inmates’ recidivism rate
being 3.7% higher (the difference between the supermax inmates and the nonsupermax
inmates on violent recidivism, prior to matching, was 13.3%) (Mears & Bales, 2009, pp.
1150–1151).
Mears and Bales (2009) also analyzed whether the length of time inmates spent
incarcerated in a supermax institution affected their recidivism rate, but did not find
evidence indicating any effect of sentence length on recidivism (p. 1151). Mears and
Bales also evaluated whether the recency of an inmate's stay in supermax incarceration,
relative to being released, affected their recidivism rate (pp. 1152–1153). Again, the data
did not indicate that the recency of supermax confinement in relation to the inmates’
release influenced their recidivism rate (Mears & Bales, 2009, p. 1152).
Motiuk and Blanchette (2001) compared the characteristics of those inmates who
had been in administrative segregation (both voluntarily and involuntarily) in Canada’s
federal prison system against a group of randomly drawn nonsegregated inmates from
Canada’s general prison population. Significance tests showed that there were very few
differences between the voluntarily segregated inmates (54.8% of the treatment group)
and the nonvoluntarily segregated inmates (45.2% of the treatment group) (Motiuk &
Blanchette, 2001, p. 134). Specifically, the two types of segregated inmates did not
significantly differ with regards to age (Motiuk & Blanchette, 2001, p. 136), criminal
history (except for sex offenses and prior adult incarcerations) (Motiuk & Blanchette,
1997, p. 6), “risk/need levels at admission” (Motiuk & Blanchette, 1997, p. 8), risk of

74
recidivism (Motiuk & Blanchette, 1997, p. 10), security classification (Motiuk &
Blanchette, 1997, p. 11), and criminogenic needs (Motiuk & Blanchette, 1997, p. 13).
Motiuk and Blanchette (2001) compared the “prison release outcomes” of these
segregated and nonsegregated prisoners, and found that the segregated prisoners were
“significantly more likely than non-segregated offenders to have been returned to federal
custody for any reason and with a new offence while on conditional release” (p. 137).
The authors then compared subgroups of segregated and nonsegregated criminals. First,
the authors compared the subgroups of segregated and nonsegregated criminals based
upon their prior criminal history, dividing the inmates into three subgroups: (1) those who
had previous youth court involvement, (2) those who had previous adult court
involvement, and (3) those who had previously experienced segregation (Motiuk &
Blanchette, 2001, p. 138). They found that “among all three criminal history background
variables . . . segregated offenders were more likely to have been returned to federal
custody and with a new offence post-release” (Motiuk & Blanchette, 2001, p. 138).
Second, Motiuk and Blanchette divided the inmates up into subgroups based upon their
Statistical Information on Recidivism – Revised1 (SIR-R1) score (Motiuk & Blanchette,
2001, p. 139). The SIR-R1 is designed to estimate the likelihood that an offender “will
re-offend within three years after release” (Motiuk & Blanchette, 2001, p. 139). The
segregated and nonsegregated groups were subdivided into risk-level groups and then
compared against each other (Motiuk & Blanchette, 2001, p. 139). The five risk-level
groups were: very poor, poor, fair, good, and very good (Motiuk & Blanchette, 2001, p.
139). “Among all five SRI-R1 release risk groupings . . . segregated offenders were more

75
likely to have been returned to federal custody and with a new offence post release”
(Motiuk & Blanchette, 2001, p. 140). All of these results indicating the higher re-offense
rate of the segregated inmates post-release suggest that Canada’s administrative
segregation does not have a deterrent effect on its inmates (with regard to post-release
offending).
Similarities and Differences Between Solitary Confinement and Disciplinary
Segregation
Solitary confinement and disciplinary segregation have many characteristics in
common. Some of these characteristics are:
the prisoners are isolated from the general prison population in a separate
cellblock,
held within their cells for 22-24 hours each day and only permitted one hour of
exercise,
placed in restraints when removed from their cells,
housed in cells that are continuously lit all day and night by artificial light, with
no prisoner control over how brightly their cells are lit, and
their exposure to physical and social stimulation is severely limited (Arrigo &
Bullock, 2008; Briggs, Sundt, & Castellano, 2003; J. Duncan, personal
communication, March 13, 2014; Haney & Lynch, 1997; Haney, 2003; Lippke,
2004; Pizarro & Stenius, 2004; Smith, 2006).
The primary differences between solitary confinement and disciplinary
segregation (as used within the Oregon DOC system) appear to be:

76
the offenders serve their punishment in a two-person cell (and sometimes have
a cellmate, depending on the housing situation), whereas in solitary
confinement they are housed in one-person cells (J. Duncan, personal
communication, March 13, 2014), and
the length of stay in disciplinary segregation is shorter, with the maximum
length being six months (Or. Admin. R. 295-105-0066(10)).
Literature Review Related to Key Variables and Concepts
Certain characteristics and factors have been found to be associated with
offending. Moreover, certain characteristics and factors have been found to be associated
with those inmates who engage in institutional misbehavior and disruption. Some of
these factors include age, length of time incarcerated, LS/CMI risk score, and gender.
For this study, these factors can be used to statistically control for possible naturally
occurring differences between the treatment cohort and the comparison cohort (i.e.,
selection bias).
Age and Prison Misconduct
Strong support can be found in the extant literature with regard to age being a
predictor of offending (e.g., Farrington, 1986; Gendreau, Goggin, & Law, 1996; Hirschi
& Gottfredson, 1983; Nagin & Land, 1993; Sweeten, Piquero, & Steinberg, 2013),
including support for age as a predictor of institutional misconduct (Alexander & Austin,
1992, p. 76; Celinska & Sung, 2014, p. 228; Cunningham & Reidy, 1998, pp. 84–85;
Cunningham, Sorensen, & Reidy, 2005, p. 44; Flanagan, 1980, pp. 360–361; Flanagan,
1983, pp. 33–34, 36; Gendreau, Goggin, & Law, 1997, para. 19; Jiang & Winfree, 2006,

77
p. 45; McCorkle, 1995, p. 59; Sorensen & Wrinkle, 1996, pp. 547–549; Toch & Adams,
2002, p. 53–61). Toch and Adams (1989, 2002) evaluated the prison adjustment of
inmates within the New York State prison system, with their sampling frame consisting
of those who had been released between July 30, 1982, and September 1, 1983 (n =
10,534) (Toch & Adams, 2002, pp. 38–39). The data revealed that younger inmates were
more likely to engage in prison misconduct, even when controlling for length of time
served (Toch & Adams, 2002, pp. 57–61). In addition, age at prison entry was also a
significant predictor of misconduct (p = .000) (Toch & Adams, 2002, p. 54, table 3.1).
Flanagan (1980) studied the patterns of prison misconduct among long-term and short-
term inmates who had been released from custody in a Northeastern state during the years
1973 to 1976 (n = 1,466) (p. 359). The study’s data showed that age exhibited an
important influence on prison misconduct, with older inmates having “far lower
misconduct rates” (Flanagan, 1980, pp. 360–361), which confirmed prior research
findings (Flanagan, 1980, p. 359). A subsequent investigation of data gathered from the
same sample population revealed that age was a statistically significant predictor of
prison misconduct ( = .32, p < .001) (Flanagan, 1983, p. 33–34). McCorkle’s (1995)
research focused on institutional misconduct among male and female inmates while
taking into account the inmates’ mental health status, using Bureau of Justice Statistics
data from several states. McCorkle’s data showed that age was a statistically significant
predictor of prison misconduct (pp. 58–59). Sorensen and Wrinkle (1996) studied the
disciplinary infraction rates of inmates who had been sentenced to life-without-parole, to
death, and to life-with-parole. The authors discovered that even among these inmates,

78
age was significantly related to their infraction rate (Sorensen & Wrinkle, 1996, p. 547).
Gendreau, Goggin, and Law (1997) conducted a meta-analysis using 39 studies on prison
misconduct (para. 1). Their analysis of data from 12,088 subjects indicated that age was a
“significant predictor” of prison misconduct (Gendreau, Goggin, & Law, 1997, para. 19).
Cunningham, Sorensen, and Reidy (2005) assessed different variables related to violent
prison misconduct in their study of 2,505 Missouri inmates, with the data covering an 11-
year span (1991 to 2002). The authors, consistent with prior research, found that age was
a significant predictor of violent misconduct, with younger inmates being more at risk of
engaging in prison violence than older inmates (Cunningham, Sorensen, & Reidy, 2005,
pp. 44–45). In their evaluation of the differences between male and female inmate prison
adjustment, Jiang and Winfree (2006) found that for both genders, age was inversely
related to inmates’ rule violation rate (younger inmates engaged in misconduct at a higher
rate than older inmates) (pp. 45–46). Similarly, in another gender-focused study on
prison adjustment, Celinska and Sung (2014) also found that age was negatively related
to prison misconduct among both male and female inmates (p. 228).
Haun (2007) studied the static and dynamic predictors of institutional misconduct
for inmates housed within the Oregon DOC prison system (n = 17,054). Haun found that
among Oregon inmates, age was significantly correlated with the overall yearly
disciplinary infraction rate (r = .157, p < .001) (p. 152). This pattern held constant across
all infraction categories. Haun reported that “as age increased, yearly rates of physically
aggressive/violent (r = −.132, p < .001), verbally aggressive/defiant (r = −.129, p < .001),
and nonaggressive/nonviolent infractions (r = −.112, p < .001) decreased” (p. 152). After

79
controlling for the length of time served using hierarchical binary logistic regression
analysis, Haun’s results showed that age was still a significant predictor of prison
misconduct (b = .037, Wald = 747.76, p < .001) (p. 219).
Length of Incarceration and Prison Misconduct
The length of time an inmate has spent on her present sentence can serve as a
predictor of institutional misconduct (Cunningham, Sorensen, & Reidy, 2005, p. 47;
Gover, Perez, & Jennings, 2008, pp. 389–390; Haun, 2007, p. 159; Reidy, Cunningham,
& Sorensen, 2001, pp. 71–73; Sorensen & Wrinkle, 1996, pp. 547, 549; Toch, Adams, &
Grant, 1989, pp. 14–22; Toch & Adams, 2002, pp. 55–61; Zamble, 1992, p. 419; but see
Flanagan, 1980, p. 363; Harer & Langan, 2001, p. 521). Zamble (1992) evaluated the
prison adjustment of 25 Canadian inmates (p. 411). He found that the number of prison
disciplinary infraction convictions “was significantly lower in the last period” of the
inmates’ incarceration term than it was “at the beginning of the term” (Zamble, 1992, p.
419). Sorensen and Wrinkle (1996) studied the prison disciplinary infraction rates for
three different categories of Missouri inmates: those who were serving life-without-
parole sentences, those who had been sentenced to death, and those who were serving
life-with-parole sentences (pp. 542–544). Their data spanned the time period of 1977 to
1992 (Sorensen & Wrinkle, 1996, p. 545). The authors found that time served was a
significant predictor of “overall rates of infractions,” and that the type of sentence the
inmate was serving was not a significant predictor of institutional infractions (Sorensen &
Wrinkle, 1996, p. 547). Similar to Zamble’s (1992) data, the data of Sorensen and
Wrinkle (1996) suggested that disciplinary infractions rise “during the initial period of

80
confinement but then [begin] to decline” (p. 549). Toch and Adams’s (1989, 2002)
evaluation of prison adjustment among New York inmates also investigated patterns of
inmate misconduct over the length of the prison term. The authors found that
disciplinary infraction rates are typically subject to a sharp rise in the beginning of
inmates’ sentences, which is then followed by a decline in disciplinary infractions (Toch
& Adams, 2002, pp. 55–57). Of note, “the rate of decline is related to the length of the
sentence, with short-term inmates showing the steepest drop and long-term inmates
displaying the most gradual decline” (Toch & Adams, 2002, p. 57). This pattern is
generally characteristic of the younger inmates, whereas the disciplinary infraction rate of
the older inmates was “relatively flat” over time (Toch & Adams, 2002, p. 57).
Since age has consistently been found to be a significant predictor of disciplinary
infractions, Toch and Adams (2002) also investigated whether the predictability of the
variable time served was simply due to inmates getting older as their length of time
served increased (pp. 59–61). They measured the misconduct rates of “age-equivalent
groups at various points in the prison term” and found that misconduct rates were still
typically “lower at the end of prison sentences than at the beginning” (Toch & Adams,
2002, p. 59). Their data showed that age was a stronger predictor of institutional
misconduct than length of time served (Toch & Adams, 2002, p. 60). Nevertheless, their
data also indicated that time served was an independent predictor of institutional
misconduct apart from age (Toch & Adams, 2002, pp. 59–61).
More recently, Gover, Perez, and Jennings (2008) tested the “importation” theory
of prison adjustment as well as the “deprivation” theory of prison adjustment, using data

81
gathered on “a cross-sectional sample of 247 inmates confined to” prison facilities within
an unnamed southeastern state (pp. 387, 382). Measuring the level of institutional
misconduct was a part of their investigation (Gover, Perez, & Jennings, 2008). They
found that for the male inmates (n = 188), “every one standard deviation increase in
current length of stay significantly increased the mean number of infractions committed
by men by 275%”; whereas “a 1 standard deviation increase in length of stay was
associated with a 655% increase in the mean number of institutional infractions” for the
female inmates (Gover, Perez, & Jennings, 2008, pp. 389–391).
Haun’s (2007) study on Oregon inmates revealed that the length of time served by
an inmate on his or her current sentence term was a statistically significant predictor of
prison misconduct (p. 159). The evidence showed that “significant negative associations
with the number of days incarcerated were found across each infraction category, such
that as the number of days of incarceration increased, the yearly rate of infraction
decreased” (Haun, 2007, p. 159).
LS/CMI Risk Score
The Level of Service / Case Management Inventory (LS/CMI) is a risk
assessment tool that is administered to Oregon inmates during the initial intake process
(J. Hanson, personal communication, February 20, 2015). The LS/CMI is part of a
family of risk assessment instruments known collectively as the Level of Service (LS)
scales, with the LS/CMI being the most recently developed instrument (Olver, Stockdale,
& Wormith, 2014, pp. 156–157). The LS scales are the “most frequently used risk
assessment tools” in the world (Olver et al., 2014, p. 156). The LS scales are based upon

82
the risk-need-responsivity (RNR) framework, which is itself based upon “general
personality and cognitive social learning theory” (Olver et al., 2014, p. 157; Andrews,
Bonta, & Wormith, 2004, p. 1; Andrews & Bonta, 2010, p. 46; Andrews et al., 2012, p.
115). Three primary principles make up the RNR model: (1) Risk principle: Higher risk
offenders should be targeted with higher intensive services (and lower risk offenders
should not be targeted with high intensive services), (2) Need principle: Focus on
dynamic risk factors (“criminogenic needs”) in treatment, (3) Responsivity principle:
tailor the intervention delivery in a manner that is compatible with the client’s learning
ability (Andrews & Bonta, 2010, pp. 44–45; Jung, Daniels, Friesen, & Ledi, 2012, p.
602). The LS scales incorporate the “central eight” risk factors (Olver et al., 2014, p.
156), which have been empirically shown to predict criminal behavior (Andrews et al.,
2012, p. 116; Andrews & Bonta, 2010; Gendreau, Little, & Goggin, 1996). These eight
risk factors are further divided into the “big four” and the “modest four,” with the “big
four” having been found to be stronger predictors of criminal recidivism than the “modest
four” (Andrews et al., 2012, p. 116; Andrews & Bonta, 2010, p. 46; Andrews et al., 2004,
p. 1). The factors comprising the “big four” are: (1) antisocial cognition (e.g., antisocial
attitudes and beliefs), (2) antisocial associates, (3) a history of antisocial behavior
(criminal behavior), and (4) antisocial personality pattern (Andrews et al., 2004, p. 1;
Andrews et al., 2012, p. 116). The factors comprising the “modest four” are: (1)
family/marital, (2) school/work, (3) leisure/recreation, and (4) substance abuse (Andrews
et al., 2004, p. 1).

83
The original LS scale was the Level of Service Inventory (LSI; Andrews, 1982),
which was then followed by the Youth Level of Service Inventory (YLSI; Andrews,
Robinson, & Hoge, 1984). The LSI was improved upon with the release of its second
edition, the Level of Service Inventory - Revised (LSI-R; Andrews & Bonta, 1995).
Further refinement led to the Level of Service Inventory - Ontario Revision (LSI-OR;
Andrews, Bonta, & Wormith, 1995). The LSI-OR then became the Level of Service /
Case Management System (LS/CMI; Andrews et al., 2004) – the LSI-OR “served as the
pilot version of the LS/CMI” (Olver et al., 2014, p. 157), and the two versions “are
virtually identical in their construction” (Andrews et al., 2004, p. 3). The LSI-R is only
comprised of one section containing 54 items (Andrews et al., 2004, p. 3). The risk score
is calculated by adding up all of the items that apply to the offender (Andrews et al.,
2004, p. 3). In contrast, the LS/CMI is comprised of 11 sections, but the numerical risk
score is generated only from Section 1 (Andrews et al., 2004, p. 3). The other remaining
sections are related to additional factors that may be taken into account when considering
the offenders’ classification (e.g., overriding the risk classification of the inmate – which
initially is based on the offender’s numerical risk score taken from Section 1), and case
management issues (Andrews et al., 2004). The LSI-R essentially serves as Section 1 of
the LS/CMI, although a few changes were made in order to improve the scale (Andrews
et al., 2004). The LSI-R’s 54 items were grouped into 10 subcomponents, whereas the
items that comprise Section 1 of the LS/CMI have been reduced to 43 and they are
grouped into only 8 subcomponents (Andrews et al., 2004, p. 3). The purpose of this
change was to more closely focus and align the scale with the “central eight” risk factors

84
that research has shown to be predictive of offending (Andrews et al., 2004, p. 3). In
order to accomplish this refinement, the LSI-R’s “financial” section and the
“accommodation” section were removed, along with the removal of 11 individual items
(Andrews et al., 2004, p. 3). There is a high correlation between the LSI-R and the
LS/CMI (Andrews et al., 2004, p. 5). For example, Andrews, Bonta, and Wormith
(2004) report that Rowe’s (1999) data revealed a correlation of .96 between the two
scales, and their own research revealed that among U.S. inmates the correlation between
the two scales was .97 (Andrews et al., 2004, pp. 5–6).
Research has shown that the LS/CMI is a reliable and valid predictor of
offending. Reliability refers to whether the technique or test yields consistent results if
administered many times (Field, 2013, p. 12). Validity refers to whether the technique or
test truly measures and predicts what it is intended to measure or predict (Field, 2013, p.
12). Andrews et al. (2004) reported the Cronbach’s alpha statistic (Cronbach, 1952) for
the LS/CMI across several studies and sample populations. The Cronbach’s alpha for the
LS/CMI’s total score ranged overall from .88 to .91 across these studies (Andrews et al.,
2004, p. 108, table 5.1). Specifically with regard to the three studies that included male
inmate populations, the Cronbach’s alpha was .89, .91, and .87 (Andrews et al., 2004, p.
108, table 5.1). These results provide strong evidence of the internal consistency of the
LS/CMI, thereby indicating that the LS/CMI is a reliable instrument (Andrews et al.,
2004, p. 107).
The “validity” of a scale “refers to the degree of evidence to support the
interpretations and uses proposed for the instrument” (Andrews et al., 2004, p. 117). One

85
of the main purposes of the LS/CMI is to predict offending (Andrews et al., 2004).
Andrews et al. (2004) reported that the predictive accuracy of the LS/CMI in predicting
general recidivism is strong (r = .41; AUC = .739), and it is also strong with regard to
predicting violent recidivism (r = .29; AUC = .666) (Andrews, Bonta, & Wormith, 2006,
pp. 13, 15; Jung, Daniels, Friesen, & Ledi, 2012, p. 605; Andrews et al., 2004, pp. 117–
121). In relation to the other LS scales, Olver et al.’s (2014) meta-analysis indicated that
the LS/CMI has the largest effect size for general recidivism (r = .42, p < .001, random
effects; r = .44, p < .001, fixed effects) (p. 168, table 12). This data thus shows that the
LS/CMI is a superior predictor of general recidivism than its predecessors the LSI (r
= .32, p < .001, random effects; r = .32, p < .001, fixed effects) and the LSI-R (r = .25, p
< .001, random effects; r = .24, p < .001, fixed effects) (Olver et al., 2014, p. 168, table
12). The LS/CMI has also been demonstrated to have good construct validity (Jung et al.,
2012). This is shown in part by the concurrent validity of the LS/CMI (Trochim, 2006),
as indicated by the strong correlation between the LSI-R and the LS/CMI (mentioned
above; Andrews et al., 2004). In addition, the research by Jung et al. (2012) showed
“moderate to strong” concurrent validity for six of the LS/CMI subscales. Specifically,
moderate to strong correlations were found between subscales of the Personality
Assessment Inventory (PAI; Morey, 2007) and the Minnesota Multiphasic Personality
Inventory-2 (MMPI2; Butcher, Dahlstrom, Graham, Tellegen, & Kaemmer, 1989) and
other measures, with the LS/CMI subscales of criminal history, family/marital,
companions, alcohol/drug problem, attitudes/orientation, and antisocial pattern (Jung et
al., 2012).

86
There appears to be a lack of studies testing the predictive validity of the LS/CMI
with regard to its accuracy in predicting institutional misconduct among male inmates.
However, several studies have evaluated the predictive validity of its predecessors the
LSI and the LSI-R in predicting institutional misconduct, and Stewart (2011) studied the
predictive validity of the LS/CMI in predicting prison misconduct among female inmates.
Stewart’s analysis of 101 female Canadian federal inmates found that the LS/CMI was
indeed statistically significantly correlated with prison misconduct (r = .502, AUC
= .798, p < .01) (pp. 63–64, tables 20–21). The field of research on the prior LS scales,
especially the research pertaining to the LSI-R, along with Stewart’s study on Canadian
female inmates, all suggest that the LS/CMI Section 1 risk score is a good predictor of
institutional misconduct.
LSI and institutional misconduct. Bonta and Motiuk (1987) conducted two
studies that evaluated the relationship between the LSI score of inmates and their
misconduct rate. For the first study, they found that the inmates with an LSI score of 14
or less, out of 58 items (i.e., the low-scoring inmates), committed fewer institutional
misconducts (F = 7.60 (1, 89), p < .01) (Bonta & Motiuk, 1987, p. 309). With the second
study, the data again showed that the LSI score was related to institutional misconduct (r
= .19, p < .05) (Bonta & Motiuk, 1987, p. 316). Bonta (1989) again studied the LSI, this
time in relation to prison misconducts among Native and non-Native Canadian jail
inmates (n = 126) (p. 52). He found correlations of .26 (Native inmates) and .31 (non-
Native inmates) between LSI score and prison misconduct (Bonta, 1989, p. 56, table 2).
Next, in a study focused on the LSI and halfway-house placement, Bonta and Motiuk’s

87
(1990) data revealed that inmates with a low LSI score (14 and below) committed fewer
misconducts, fewer assaults, and had fewer disciplinary reports of any kind, when
compared to inmates with an LSI score above 14 (p. 503, table 2). In an extensive study
of 510 Canadian inmates, Motiuk (1991) found that the correlation between the inmates’
LSI score and prison misconduct was .26 (p < .001) (Motiuk, 1991, p. 152, table 21). For
assaults, the LSI score correlation was .18 (p < .01) (Motiuk, 1991, p. 152, table 21).
Controlling for the number of days inmates were incarcerated, the research by Bonta and
Motiuk (1992) on over 400 inmates revealed that the LSI was still a significant predictor
of prison “occurrences” (i.e., behavior that results in a less formal misconduct process
than official “misconducts”; r = .10, p < .05), prison misconducts (r = .10, p < .01), and
prison assaults (r = .08, p < .05) (pp. 346–347).
LSI-R and institutional misconduct. Gendreau, Goggin, and Law (1997)
conducted a meta-analysis on 39 studies in order to study predictors of prison misconduct
(para. 1). In addition to looking at various variables such as age, criminal history, and
race, the authors also evaluated the predictive ability of some actuarial measures. The
actuarial measures were divided into categories that included the: (1) Minnesota
Multiphasic Personality Inventory (MMPI; Hathaway & McKinley, 1943), (2) non-
MMPI measures of antisocial personality, (3) LSI-R, and (4) “other risk measures”
(Gendreau, Goggin, & Law, 1997, para. 25). Following the method described by
Gendreau et al. (1997) in interpreting the data (para. 19), their results concerning the LSI-
R data were: The meta-analysis data showed that across the 39 studies sampled, a
quantitative relationship between the LSI-R as a predictor and the criterion (i.e.,

88
misconducts) was reported on 10 occasions involving a total of 2,252 subjects (Gendreau
et al., 1997, table 1). The associated mean Pearson’s r for the LSI-R with the outcome
was .23 (SD = .11), and z+, the weighted estimation of Pearson’s r for the LSI-R with the
outcome, was .22 (Gendreau et al., 1997, table 1). Application of Hedges and Olkin’s
(1985) method for testing the significance of the mean z+ values confirmed the LSI-R as
a significant predictor of misconducts (Gendreau et al., 1997, table 1).
A one-way analysis of variance (ANOVA) was performed on the data, which
revealed “that there was a significant difference across the actuarial measures F(3, 65) =
7.32, p < .05” (Gendreau et al., 1997, para. 26). Further analysis “found that the LSI-R
was a significantly better predictor of the criterion [i.e., misconducts] than were the other
three” (Gendreau et al., 1997, para. 26). Moreover, the data revealed that the LSI-R was
superior to the other predictor domains. When compared to the other predictor domains
of MMPI, “other risk measures,” and non-MMPI, the LSI-R produced higher correlations
82% of the time, 74% of the time, and 86% of the time, respectively (Gendreau et al.,
1997, para. 27).
Kroner and Mills (2001) compared the predictive accuracy of five risk appraisal
instruments with regard to prison misconducts. The five instruments were the LSI-R, the
Psychopathy Checklist-Revised (PCL-R; Hare, 1991), the HCR-20 (Webster, Eaves,
Douglas, & Wintrup, 1995), the Violence Risk Appraisal Guide (VRAG; Harris, Rice, &
Quinsey, 1993), and the Lifestyle Criminality Screening Form (LCSF; Walters, White, &
Denney, 1991). A total of 97 male inmates were involved in the study, and the predictive
accuracy of the instruments was evaluated using correlations and receiver operating

89
characteristics (ROCs) (Kroner & Mills, 2001, pp. 476, 479). For the LSI-R, the data
revealed correlations of .27 (AUC = .663) and .20 (AUC = .609) for minor misconducts
and major misconducts, respectively (Kroner & Mills, 2001, p. 482, table 3). Although
the VRAG was the strongest predictor of both major and minor misconducts, there were
no statistically significant differences between the risk scales’ correlations for either type
of misconduct (Kroner & Mills, 2001, p. 481).
Swoboda (2006) used regression analysis to determine the predictive accuracy of
the LSI-R in predicting prison misconduct (p. 52). Swoboda’s sample consisted of 129
male inmates at a Pennsylvania prison (pp. 45, 47–48). Swoboda’s analysis revealed that
the LSI-R total score validly predicted prison misconducts to a statistically significant
degree (r = .21, p < .001). Swoboda further found that the LSI-R individual scales of
Criminal History (r = .12, p < .05), Financial (r = .13, p < .05), Accommodation (r = .15,
p < .05), Companions (r = .15, p < .05), and Emotional/Personal (r = .22, p < .001) were
each significantly correlated with prison misconduct (pp. 61, 63).
Campbell, French, and Gendreau (2009) conducted a meta-analysis using 88
studies reporting 76 effect sizes related to institutional violence (p. 572). One of their
purposes in conducting the meta-analysis was to evaluate and compare the predictive
accuracy of several different risk assessment measures in predicting violent prison
misconduct (Campbell, French, & Gendreau, 2009, pp. 571, 572). The risk assessments
were divided into six categories, one of which was the LSI/LSI-R category (Campbell et
al., 2009, p. 575, table 1). From the 76 studies, there were six effect sizes related to the
LSI or the LSI-R, with a total 650 participants (Campbell et al., 2009, p. 575, table 1).

90
The authors found that LSI/LSI-R category to be moderately predictive of institutional
violence (Z+ = .24) (Campbell et al., 2009, pp. 575, 581).
Olver, Stockdale, and Wormith (2014) conducted a meta-analysis on the various
Level of Service scales, including the LSI, the LSI-R, and the LS/CMI. Their overall
evaluation included a total of 128 studies and 137,931 participants, and considered
several different outcome measures (e.g., recidivism, institutional misconduct,
reincarceration) (p. 160). With regard to general recidivism, the LS/CMI had the largest
effect size overall (rw = .44, p < .001, fixed effects; rw = .42, p < .001, random effects)
when compared to the other LS scales (Olver et al., 2014, p. 168, table 12), thus
indicating that it was the strongest predictor of general recidivism. In addition, the meta-
analysis further revealed that the LS scales significantly predicted prison misconduct.
Across 16 samples and 3,834 inmates, the data showed that the LS scales significantly
predicted any institutional misconduct (rw = .21, p < .05, fixed effects; rw = .24, p < .05,
random effects), whereas across 15 samples and 3,474 inmates, the data also showed that
the LS scales significantly predicted serious institutional misconduct (rw = .20, p < .001,
fixed effects; rw = .21, p < .001, random effects) (Olver et al., 2014, p. 162, table 3).
These results are quite robust concerning the LS scales’ predictive validity of prison
misconduct. In order for these effect sizes to become nonsignificant a large number of
studies with null findings would need to be generated (M. Olver, personal
communication, December 6, 2014). In fact, “fail safe N analyses demonstrated that 750
missing studies with null findings would be required to reduce the general misconduct
prediction effect size to nonsignificance, and 451 missing studies with null findings

91
would be required to do the same for the serious misconduct effect size” (M. Olver,
personal communication, August 14, 2015).
LS/CMI and the Oregon DOC. Beginning in 2007, the LS/CMI was
administered to all incoming prison inmates who had scored as medium risk or high risk
on the Automated Criminal Risk Score (ACRS) (J. Hanson, personal communication,
February 20, 2015). The ACRS is an internal static risk tool developed and used by the
Oregon DOC (J. Hanson, personal communication, July 20, 2015). Beginning in 2011,
the LS/CMI is now administered to all incoming prison inmates (J. Hanson, personal
communication, February 20, 2015).
Gender and Prison Misconduct
The rate of institutional misconduct can differ between male and female inmates
(Celinska & Sung, 2014, p. 227; Craddock, 1996, para. 19; Harer & Langan, 2001, pp.
521–523; Haun, 2007, pp. 150–152, 218; but see, Gover, Perez, & Jennings, 2008, p.
388; Jiang & Winfree, 2006, p. 43). In addition, male inmates and female inmates may
adjust differently to prison life (Warren, Hurt, Loper, & Chauhan, 2004; Jiang &
Winfree, 2006).
Craddock (1996) compared and contrasted the violation rate of North Carolina
female (n = 1315) and male (n = 3551) prison inmates. She found that male inmates
typically committed more rule violations than female inmates (Craddock, 1996, para. 19).
Approximately one-half of the male inmates had committed at least one rule violation,
compared to approximately one-third of the female inmates (Craddock, 1996, para. 19).
In addition, “the median number of infractions was 3 for men and 2 for women”

92
(Craddock, 1996, para. 19). Similarly, Harer and Langan (2001) found in their study that
the prison violence misconduct rate was greater for male inmates than female inmates.
Their data revealed that “the average female rate for violence-related misconduct [was]
54.4% of the average male rate” (Harer & Langan, 2001, p. 521). In addition, “the mean
female rate for serious violence [was] only 8.14% of the mean male rate” (Harer &
Langan, 2001, p. 521). Using Bureau of Justice Statistics data from a large multi-state
survey, Celinska and Sung (2014) found in their study that, when other variables were
held constant, “being female reduced the likelihood of engaging in [prison] rule-breaking
by 24.8%” (p. 227). Their results revealed “that the prevalence rate of infractions among
female inmates was 38.3% as compared with the male rate of 47.6% (p < .001)”
(Celinska & Sung, 2014, p. 227). Furthermore, the evidence showed that “women
prisoners were not only less likely to break rules but also did so less frequently than men”
(Celinska & Sung, 2014, p. 227).
Haun’s (2007) study of Oregon prison inmates also found that gender was a
significant predictor of prison misconduct, with total yearly misconduct rates
significantly higher for male inmates than female inmates (p. 150). Among the different
misconduct categories, the rates were significantly higher among male inmates for
physically aggressive/violent infractions and nonaggressive/defiant infractions; but there
was no significant difference between male and female inmates on their rate of verbally
aggressive/defiant infractions (Haun, 2007, p. 150). A hierarchical binary logistic
regression analysis that controlled for the effect of time served confirmed that gender was
a significant predictor for each of the misconduct categories (p. 218).

93
Prior Prison Rule Violations and Subsequent Prison Misconduct
Earlier research has demonstrated that prior prison rule violations can be a
predictor of subsequent prison misconduct. Some of this research has directly indicated
that prior prison misconduct can predict subsequent misconduct (Camp, Gaes, Langan, &
Saylor, 2003; Drury & DeLisi, 2010; Gendreau, Goggin, & Law, 1997). Other research
provides indirect support that prior prison misconduct can predict future misconduct. For
example, there is research that indicates that prior prison violence can predict subsequent
prison misconduct (Cunningham & Sorensen, 2007). In addition, there is research that
indicates that prior violence can predict future violence (Bonta, Hanson, & Law, 1998;
Durose, Cooper, & Snyder, 2014; Sorensen & Pilgrim, 2000), and that prior criminal
history can predict subsequent criminal offending (Bonta et al., 1998; Drury & DeLisi,
2010, p. 332; Durose et al., 2014; Gendreau, Little, & Goggin, 1996; Loza, 2003, p. 182).
The proposition that prior prison misconduct predicts future prison misconduct fits within
the popular notion that “the best predictor of future behavior is past behavior” (e.g.,
Mischel, 1973, pp. 261–263; Cunningham & Reidy, 1999, p. 32; Ouellette & Wood,
1998; Walters, 1992, pp. 85, 96, 105). It should be noted that the Oregon DOC required
that this control variable be added in order to obtain its approval of the study, and its
approval was necessary in order to gain access to the data.
Prior prison misconduct and subsequent misconduct. Gendreau, Goggin, and
Law’s (1997) meta-analysis found past prison adjustment to be “the single best personal
domain predictor of [prison] misconducts (r = .21)” (para. 34), surpassing other personal
domain predictors such as age, antisocial attitudes and behavior, prior criminal record,

94
education, and marital status (Table 1). Camp, Gaes, Langan, and Saylor (2003)
conducted a study involving more than 120,000 federal inmates, in which they produced
14 multivariate models in order to study the effect of prisons on inmate misconduct.
Consistent across all 14 multivariate models, the authors found prior incidents of
misconduct to be a significant predictor of subsequent misconduct, and it was the
strongest predictor among the individual demographic variables studied, even
outperforming the variable age (pp. 515–516). This was true “regardless of how
misconduct was categorized” (e.g., “prior any misconduct,” “prior violent misconduct,”
“prior drug misconduct”) (Camp et al., 2003, pp. 515–516). The “effect” of the variable
was positive, in that “individuals with higher counts of prior misconduct were more likely
to be involved in a current instance of misconduct” (Camp et al., 2003, pp. 515–516).
Drury and DeLisi (2010) drew a random sample of 1,005 (males, n = 831;
females, n = 174) participants from the 26,869 inmates incarcerated with the Arizona
Department of Corrections in 2001. The purpose of the study was to examine the
relationship between prison misconduct that occurred during prior prison terms and
prison misconduct that occurred in a subsequent prison term (Drury & DeLisi, 2010, pp.
331–333, 336). Drury and DeLisi found “that prior adjustment denoted a strong
significant effect across all models in explaining institutional misconduct for both male
and female inmates and for both violence and nonviolence types of misconduct” (p. 334).
With regard to the total sample (males and females combined), their findings revealed
that the inmates who had engaged in misconduct in a prior prison term were significantly
more likely to commit minor prison violations (estimate = .601, z = 8.33, p < .01), and

95
significantly more likely to commit major prison violations (estimate = .643, z = 6.24, p
< .01) (Drury & DeLisi, 2010, pp. 339–340). When the analysis was limited to only the
male inmates in the sample (n = 831) it produced similar results. Their findings with
regard to the male-only sample revealed that the inmates who had engaged in misconduct
in a prior prison term were significantly more likely to commit minor prison violations
(estimate = .593, z = 8.16, p < .01), and significantly more likely to commit major prison
violations (estimate = .626, z = 5.99, p < .01) (Drury & DeLisi, 2010, pp. 340–342).
Prior prison violence and subsequent misconduct. Cunningham and Sorensen
(2007) performed a logistic regression analysis on retrospective data concerning 24,514
Florida Department of Corrections inmates who were incarcerated during the year of
2003 (pp. 241, 243). Their analysis revealed that prior prison violence significantly
predicted future prison misconduct across all categories of misconduct. The findings
showed that prior prison violence was a significant predictor of (1) total prison violations,
(2) misconducts of potential violence, (3) all assaults, (4) assaults with injuries, and (5)
assaults with serious injuries (Cunningham & Sorensen, 2007, p. 249, Table 5). In fact,
“those who had a prior record of committing violent acts in prison were more than twice
as likely to commit a violent act in the institution” (Cunningham & Sorensen, 2007, p.
248).
Prior violence and subsequent violence. Sorensen and Pilgrim (2000) examined
incarcerated murderers in Texas, and found that previous acts of violence to be a
significant predictor of prison violence (p. 1264). Their results showed that, with regard
to the incarcerated murderers, those with “an additional previously attempted murder or
96
assault” were 4.0 percentage points more likely to commit a violent act in prison
(Sorensen & Pilgrim, 2000, pp. 1264–1266). Bonta, Hanson, and Law’s (1998) meta-
analysis on mentally disordered inmates found that a history of violence was a significant
predictor of violent recidivism (mean effect size, Zr = .16) (pp. 132–133). Durose,
Cooper, and Snyder (2014) studied the recidivism of 404,638 U.S. state prisoners
released in 2005. Within that sample, of those who had been incarcerated for a violent
offense, 33.1% were arrested for another violent offense within 5 years of being released
(Durose et al., 2014, p. 9).
It should also be noted that the ability of past violence to predict future violence
depends on similar factors being present. As Cunningham and Reidy (2002) explained,
“prison is a profoundly different context than the community. It cannot be assumed that
factors associated with violence in the community will be predictive in a markedly
different context” (p. 525). Violence in the community is not necessarily predictive of
violence in prison (Cunningham & Reidy, 2002, p. 528).
Prior criminal history and subsequent criminal behavior. Research indicating
that prior criminal history predicts subsequent criminal conduct further supports, albeit
indirectly, the idea that prior prison rule violations predict subsequent rule violations.
Camp and Gaes (2005) explained:
In short, although the jury is still out, there appears to be solid support for the
notion that inmate misconduct in prison and criminal behavior on the street arise
from similar propensities among individuals. Indeed, the very idea of criminal

97
trajectories suggests continuity in behavior over time even though settings and
institutions may change. (p. 428)
Gendreau, Goggin, and Law (1996) conducted a meta-analysis of 131 studies on
recidivism. Across the 131 studies sampled, a quantitative relationship between the
predictor “criminal history” and recidivism was reported on 164 occasions and involved a
total of 123,940 subjects (Gendreau et al., 1996, pp. 582–583). The associated mean
Pearson r for “criminal history” with outcome was .18 (S.D. = .13) (Gendreau et al.,
1996, pp. 582–583). Application of Hedges and Olkin’s (1985) method for testing the
significance of the mean z+ values confirmed “criminal history” as a significant predictor
of recidivism (Gendreau et al., 1996, pp. 582–583). “Criminal history” was a broad
category, defined as “adult-prior arrest, probation, jail, conviction, incarceration, [and]
prison misconducts” (Gendreau et al., 1996, p. 597).
Similarly, Bonta et al. (1998) conducted a meta-analysis focused on mentally
disordered offenders. In analyzing the results of 22 studies examining criminal history
and recidivism involving a total of 4,312 participants, Bonta et al. found criminal history
to be significantly correlated with recidivism among mentally disordered offenders (p.
129, Table 4).
A recent Bureau of Justice Statistics study affirmed the relationship between prior
criminal history and recidivism. Data gathered on “404,638 state prisoners released in
2005 from 30 states” revealed that 67.8% were arrested within 3 years of being released
(Durose et al., 2014, p. 1). Within 5 years of being released, 76.6% had been arrested
(Durose et al., 2014, p. 1). Durose et al. (2014) also measured recidivism as a conviction

98
for a new crime (as opposed to just an arrest) (p. 14). The data gathered from the 29
states that had such information showed that 45.2% of the released prisoners were
convicted of a new crime within 3 years of being released, and over half (55.4%) were
convicted of a new crime within 5 years of being released (Durose et al., 2014, p. 15,
Table 16).
Furthermore, the results demonstrated that increases in an inmate’s criminal
history negatively predicted recidivism (Durose et al., 2014, p. 10). Durose et al. (2014)
reported that “a year after release from prison, about a quarter (26.4%) of released
inmates with 4 or fewer arrests in their prior criminal record had been arrested, compared
to over half (56.1%) of released inmates who had 10 or more prior arrests” (p. 10). This
trend held over time. Within five years of release from prison, 60.8% of the released
inmates who had 4 or fewer arrests in their prior criminal record had been arrested,
whereas 86.5% of released inmates who had 10 or more prior arrests (Durose et al., 2014,
p. 10). In addition, this trend held across offense categories as well (e.g., violent
offenders with a more extensive criminal history were more likely be arrested than those
violent offenders with a less extensive criminal history) (Durose et al., 2014, p. 10).
LS/CMI and prior misconduct. It should be noted that the LS/CMI also includes
a criminal history component, which takes into account both prior criminal convictions,
and prior institutional misconduct or behavior reports (Andrews, Bonta, & Wormith,
2004, pp. 12–13). In addition, it should be further noted that since the LS/CMI is
administered to Oregon prison inmates during intake (i.e., upon their initial admission
into the prison system for their current sentence), for the purposes of this study the
99
control variables LS/CMI risk score and prior prison misconduct would not be measuring
the same thing. The LS/CMI risk score control variable would be taking into account
prior misconduct that occurred during a prior sentence, whereas the prior prison
misconduct control variable would be taking into account only previous misconduct that
occurred during the present sentence that the defendant was serving (i.e., the present
sentence associated with the inmate’s incarceration during the years 2011–2014).
Prior Time Spent in Disciplinary Segregation and Subsequent Prison Misconduct
There appears to be a lack of research studies that demonstrate that prior time
spent in disciplinary segregation is predictive of subsequent prison misconduct.
Therefore, it appears that there is very little scientific support for such a proposition.
However, the addition of this variable may contribute to a deeper understanding of the
effect prior disciplinary segregation may have on subsequent prison misconduct. It
should be noted that the Oregon DOC required that this control variable be added in order
to obtain its approval of the study, and its approval was necessary in order to gain access
to the data.
Index Offense, Gang Affiliation, and Prison Misconduct
In addition to age, length of incarceration, and gender, Haun (2007) also found
that index offense (pp. 156–157, 223) and gang affiliation (pp. 160–161, 222) were
significant predictors of misconduct within the Oregon correctional system. The
literature also suggests that an inmate’s “index offense” (i.e., the most serious crime that
provides the basis for the defendant’s current prison sentence, Haun, 2007, p. 37) may
serve as a predictor of offending (Cunningham, Sorensen, & Reidy, 2005, p. 44;

100
Flanagan, 1983, p. 34; Toch & Adams, 2002, p. 54). However, the evidence supporting
an inmates’ index offense as a predictor of institutional misconduct is relatively weak.
Furthermore, the extant literature reveals that gang affiliation may also predict
institutional misconduct (Fischer, 2001, pp. ii, v; Gaes et al., 2002, pp. 370, 373, 381).
However, gang affiliation cannot be included as a key variable in this study since the
Oregon DOC no longer keeps data on inmate gang affiliation.
Variables related to Disciplinary Segregation
Coid et al. (2003) examined the characteristics of inmates who spent time in
disciplinary segregation in the England and Wales prison system. Although their study
was done in England and Wales instead of the United States, thus limiting its
generalizability, it still offers insight into the factors associated with prisoners who
engage in institutional misbehavior. Consistent with prior research, Coid et al. found that
the prisoners that had experienced disciplinary segregation, in contrast to those inmates
who did not report having been subjected to disciplinary segregation, were generally
younger and had a previous conviction for certain types of crimes. Coid et al. also
discovered that those reporting having been subjected to disciplinary segregation were
“more likely to have spent a year or longer in prison at the time of the interview” (p.
302). This was inconsistent with prior research that had indicated that the length of the
sentence being served was inversely related to the commission of institutional infractions
(Coid et al., 2003, p. 299). However, this difference may have had something to do with
how the concept was operationalized and measured, since “1 year + in prison” (p. 303,
Table 1) does not necessarily exclude the possibility that length of time incarcerated was

101
still inversely related to spending time in disciplinary segregation. In addition, their
research found that inmates who experienced disciplinary segregation were not more
likely to suffer from “severe mental illness”, although they did find that “segregated
men . . . were more likely to have a personality disorder” (Coid et al., 2003, p. 310).
Literature Review of Research Design
The purpose of this study was to examine the effect of disciplinary segregation on
subsequent prison behavior among those subjected to it. Specifically, the aim of the
study was to examine whether disciplinary segregation is effective in deterring
subsequent prison misconduct among those inmates subjected to it. In addition, the study
sought to examine, in the alternative, whether disciplinary segregation has a criminogenic
effect on the subsequent behavior of those subjected to it, or whether disciplinary
segregation has a null effect on the behavior of those subjected to it.
The ideal research design for exploring these issues would be a true experiment,
where individuals are randomly assigned to a treatment group and control group (Nagin,
Cullen, & Jonson, 2009, p. 131; Zimring & Hawkins, 1973, p. 253). For this study, such
a design could take the form of drawing its sample from a population of offenders who,
during a certain time period, were found to be in violation of the prison rules and subject
to disciplinary segregation as punishment for the commission of that rule violation.
Those individuals could then be randomly assigned disciplinary segregation punishment.
The subsequent misconduct rate of the two groups could then be compared and
contrasted. Unfortunately, such a design cannot be employed in the present study, due to

102
ethical and operational considerations. Instead, this study used archival and
administrative data from the past. The use of such data calls for an observational study.
The fact that a true experiment with random assignment is not feasible for this
study is fairly typical in criminal justice research (Zimring & Hawkins, 1973, pp. 249–
250). Zimring and Hawking (1973) averred, “ordinarily, a controlled experiment is
beyond the reach of a criminologist seeking to investigate punishment policy, because he
is unable to randomly assign regimes of punishment between individuals in the same
jurisdiction” (pp. 253–254). The authors opined that “in all but a few instances it will not
be possible” to form treatment and control groups of randomly assigned individuals, and
then alter between the groups the threat and punishment for misconduct (Zimring &
Hawkins, 1973, p. 294). Zimring and Hawkins further asserted, “it is difficult to
conceive of an acceptable experiment in which, after random assignment, the severity of
sanctions threatened for a violation of a particular criminal law was varied between the
two groups” (p. 294). Although they were discussing punishment and crime, the same
logic holds true for punishment and prison rule violations.
When a true experiment is not feasible, as in this case, then the resulting study
should aim to emulate the design features of a true experiment (Rosenbaum, 2010, p. 4;
Nagin, Cullen, & Jonson, 2009). One type of research design that can be employed when
using nonexperimental data (i.e., randomization will not be employed) is an observational
study (Nagin, Cullen, & Jonson, 2009, p. 132; Mann, 2003, p. 59; Rosenbaum, 1989, p.
1024). In an observational study a researcher does not implement an intervention;
instead, the researcher “simply observes” (Mann, 2003, p. 54). In this case, the

103
“observation” was the collection, collation, and analysis of the archival and
administrative data held by the Oregon DOC. Specifically, the data that were available
for this study called for a “retrospective” observational study, since the data had already
been gathered prior to this study taking place (Mann, 2003, p. 55).
The intent of this study, and many other criminal justice and deterrence studies,
was to investigate the impact of punishment on those subjected to it (Nagin, Cullen, &
Jonson, 2009, p. 131). That is, the intent of the study was to discover the difference
between the behavior of the individuals after being subjected to the treatment in
comparison with their behavior had they not been subjected to the treatment (i.e., the
“counterfactual”) (Nagin, Cullen, & Jonson, 2009, p. 131). One way to perform this
investigation and generate data from which an inference can be made is to compare two
groups, with one comprised of individuals subjected to the treatment, and one comprised
of those not subjected to the treatment (Nagin, Cullen, & Jonson, 2009, p. 131). Such a
design must account for the fact that the random assignment process applied in true
experiments will not be serving to isolate the effect of the treatment variable and control
for bias (Nagin, Cullen, & Jonson, 2009, p. 135). Therefore, criminal justice researchers
performing an observational study often utilize regression analysis to control for
variables that may bias the results (Bales & Piquero, 2012, p. 80; Nagin, Cullen, &
Jonson, 2009, pp. 133, 138). Regression analysis is a statistical tool that can measure the
influence of variables other than the treatment variable in order to better isolate and
partial-out the effect of the treatment variable. These control variables should be selected
based upon evidence showing them to be “strongly related” to the outcome variable (i.e.,

104
prison rule violations) (Nagin, Cullen, & Jonson, 2009, p. 136) and the treatment variable
(i.e., selection into the treatment or comparison cohort) (Steiner, Cook, Shadish, & Clark,
2010, pp. 250, 262).
The selection of the covariates may very well be more important in obtaining
results that more closely resemble a true experiment than the selection of the data
analysis technique. Furthermore, different data analysis techniques, although utilizing
divergent approaches and tactics, may yield quite similar results. Steiner, Cook, Shadish,
and Clark (2010) conducted a within-study comparison of a randomized experiment and a
quasi-experiment. The quasi-experimental data were analyzed using propensity score
analysis methods and analysis of covariance (ANCOVA) (Steiner, Cook, Shadish, &
Clark, 2010, p. 254). In their study, the researchers found that “the choice of covariates
has a much stronger impact on bias reduction than the choice of a specific adjustment
method” (Steiner, Cook, Shadish, & Clark, 2010, p. 256). None of the data analysis
methods appeared to be superior to the others, but the selection of covariates did appear
to impact the results in an important way (Steiner, Cook, Shadish, & Clark, 2010, pp.
256–258). The study also revealed that more covariates do not necessarily improve the
accuracy of the results – the addition of some covariates can actually increase bias
(Steiner, Cook, Shadish, & Clark, 2010, p. 258). Therefore, the covariates should be
selected in a critical manner based upon their correlation with the treatment and outcome
variables (Steiner, Cook, Shadish, & Clark, 2010; see also Warner, 2013, Chapter 14;
Field, 2013, p. 321). Using the same data, the researchers also found that analyzing the
data either through ordinary linear regression or through propensity score methods

105
yielded similar results (Steiner, Cook, Shadish, & Clark, 2010, pp. 1339, 1342), and both
types of data analysis techniques substantially reduced selection bias (Steiner, Cook,
Shadish, & Clark, 2010, pp. 1339, 1341). Bales and Piquero (2012) arrived at a similar
result. Bales and Piquero assessed the effect of imprisonment on reoffending using three
data analysis techniques: logistic regression, precision matching, and propensity score
matching (p. 73). Each of the techniques indicated that imprisonment had a criminogenic
effect, when compared to noncustodial alternatives (Bales & Piquero, 2012, p. 98). The
authors opined that they were “hesitant to say which method is superior, as they are all
different ways of getting at the issue” (p. 98). This sentiment was echoed by Schafer and
Kang (2008) when they stated “ANCOVA, regression, and propensity scores share a
common goal: to eliminate biases due to confounding. However, they attack the problem
from different sides” (pp. 280–281). They went on to explain, “ANCOVA and regression
model relationships between confounders and the outcome, whereas propensity scores
model relationships between the confounders and treatment status” (Schafer & Kang,
2008, p. 280).
Multiple regression is a data analysis technique in which an outcome is predicted
by a model containing two or more predictor variables (Field, 2013, p. 880; Warner,
2013, pp. 547–610). Multiple regression using k predictor variables is expressed as:
Ŷ = b0 + b1X1 + b2X2 + . . . + bkXk
(Warner, 2013, p. 547). In the present study, the equation becomes:
Ŷ = b0 + b1X1 + b2X2 + b3X3 + b4X4+ b5X5+ b6X6+ b7X7

106
Here, Y represents the dependent/outcome variable prison misconduct, X1 represents the
independent/predictor variable cohort (which will be dummy coded, with 1 = treatment
cohort, and 0 = comparison cohort), X2 represents the control/predictor variable age, X3
represents the control/predictor variable length of time spent incarcerated on current
sentence, X4 represents the control/predictor variable LS/CMI risk score, X5 represents the
control/predictor variable prior major rule violations in 2011-2012, X6 represents the
control/predictor variable prior minor rule violations in 2011-2012, and X7 represents the
control/predictor variable length of time spent in disciplinary segregation in 2011-2012.
The b1 slope represents the predicted change in Y for a one-unit change in cohort
membership (X1), controlling for age (X2), length of time spent incarcerated (X3), LS/CMI
risk score (X4), prior major rule violations in 2011-2012 (X5), prior minor rule violations
in 2011-2012 (X6), and length of time spent in disciplinary segregation in 2011-2012 (X7)
(Warner, 2013, p. 547).
Multiple regression can be used to assess the ability of a variable to predict the
outcome, while at the same time controlling for other variables (Warner, 2013, p. 548).
In other words, multiple regression can be used to partial-out the predictive ability of a
variable of interest while excluding the influence of other observed variables (Warner,
2013, Chapter 14). Therefore, multiple regression is a statistical technique that can be
utilized to isolate and better understand the impact of a treatment variable while
simultaneously controlling for other extraneous variables (Warner, 2013, pp. 547–610).
Discovering that a treatment variable is a significant predictor of the outcome while

107
controlling for other variables can suggest that the treatment variable may have a
relationship with the outcome, although the inference is a limited one (Warner, 2013, p.
556).
There are three different types of multiple regression: (1) standard or
simultaneous regression, (2) sequential or hierarchical regression, and (3) statistical
regression (Field, 2013, pp. 321–322; Warner, 2013, p. 559). Their differences center on
how the variables are entered into the model (Field, 2013, p. 321). In the standard or
simultaneous regression method, each of the predictor variables is entered at the same
time (Field, 2013, p. 322; Warner, 2013, p. 559). Of the three methods, simultaneous
regression is often the preferred method, although hierarchical regression may be
preferable in specific circumstances (Field, 2013, pp. 322–324; Warner, 2013, pp. 560–
564). The advantage of simultaneous regression is that when compared to the other two
methods it is the simplest method, it typically provides a more conservative estimate of
the impact of each predictor variable, and the variance explained by each predictor
variable is unique to that specific predictor variable (i.e., the variance attributed to one
predictor variable will not overlap with the variances attributed to other predictor
variables) (Warner, 2013, pp. 560–561). In contrast, the variance attributed to a predictor
variable as a result of hierarchical or statistical regression may be the result of an
arbitrary process; due to how the variables were entered into the model, the variance
attributed to the X1 predictor variable might also be explained by the X2 predictor
variable, and hence such variance would not be unique to the X1 predictor variable
(Warner, 2013, p. 561).

108
The timeframe for the study spans 48 months. The first 24 months (the years
2011–2012) were for categorization purposes, in that the participants were selected for
either the treatment cohort or the comparison cohort based upon their behavior during
those two years. The next 24 months (the years 2013–2014) comprised the follow-up
period, from which the rule violation rate of the two cohorts was compared and
contrasted in order to test the hypotheses. Walters (2007) explained that “prior
experience suggest[s]” that when examining institutional (i.e., prison) adjustment, “a 2-
year follow-up offers the best balance in terms of maximizing the number of IRs
[institutional reports, e.g., rule violation convictions] available for analysis while
minimizing the number of participants lost to analysis because of release” (p. 73).
Summary and Conclusions
The research on deterrence theory indicates that it still remains a viable criminal
justice theory, but the evidence supporting it is moderate at best. Furthermore, the
research suggests, for the purposes of deterrence, that the certainty of punishment may be
more important than the severity of punishment or the swiftness of punishment. The
weight of the extant research on prison isolation and segregation indicates that it can have
negative psychological and physiological effects on inmates, although these effects might
only be associated with longer periods of isolation. However, inmates who experience
disciplinary segregation may be at risk of suffering from those negative consequences.
The research that has been performed regarding prison segregation and its relationship
with deterrence appears inconclusive thus far and has not directly examined the deterrent
effect of disciplinary segregation, so it is unclear whether the experience of prison

109
segregation (especially disciplinary segregation) has a deterrent effect on inmate prison
misconduct. The empirical research on variables associated with prison misconduct has
revealed that age, gender, and length of time incarcerated on current sentence are strong
predictors of prison misconduct. In addition, the research on the LS scales indicates that
the LS/CMI section 1 total score should serve as a useful predictor of prison misconduct
as well. Furthermore, research suggests that prior prison rule violations may also be a
useful predictor of subsequent prison inmate misconduct.
The present study intended to fill the current gap in the literature by investigating
whether the practice of disciplinary segregation in the Oregon DOC system has a
deterrent, criminogenic, or null effect on those subjected to it. It attempted to do so by
evaluating the prison misconduct rates of two cohorts. The first cohort was comprised of
inmates who spent time in disciplinary segregation during the years 2011 or 2012. The
second cohort was comprised of those inmates who, as of January 1, 2013, had not spent
any time in disciplinary segregation. Then, the prison misconduct data of the two cohorts
were examined for the years 2013 and 2014. This was accomplished through the use of
multiple regression, controlling for the effects of the key variables gender, age, length of
time spent incarcerated on current sentence, LS/CMI risk score, prior major rule
violations in 2011-2012, prior minor rule violations in 2011-2012, and length of time
spent in disciplinary segregation in 2011-2012.

110
Chapter 3: Research Method
Introduction
The purpose of this quantitative retrospective observational study was to examine
the effectiveness of disciplinary segregation in deterring prison misconduct on those
subjected to it within the Oregon DOC system. The prison rule violation rates of two
cohorts were compared using multiple regression analysis. The treatment cohort was
comprised of prison inmates who had spent time in disciplinary segregation during the
years 2011–2012. The comparison cohort was comprised of prison inmates who had not,
as of January 1, 2013, spent any time in disciplinary segregation. Control variables were
used to help isolate the effect of the experience of disciplinary segregation on prison
inmate misconduct. Three models were tested using multiple regression analysis, each
with the outcome variable operationalized in a different way: overall total rule violations
in 2013-2014, total major rule violations in 2013-2014, and total minor rule violations in
2013-2014.
Research Design and Rationale
The primary research question that this study was designed to address was
whether or not deterrence theory explains the relationship between disciplinary
segregation and prison misconduct among inmates. The study was additionally designed
to address whether or not disciplinary segregation has a criminogenic effect on inmates
who are subjected to it, and alternatively whether disciplinary segregation has no
significant effect on inmates who are subjected to it. The ideal method for investigating
such questions is a true randomized experiment (Nagin, Cullen, & Jonson, 2009, p. 131;

111
Zimring & Hawkins, 1973, p. 253). However, in this study randomly assigning
participants to treatment and control groups would have raised ethical concerns, and was
not feasible for this specific study. Instead, this study relied on administrative and
archival (i.e., secondary) data. Therefore, I selected a retrospective observational study
using multiple regression analysis to address the research questions.
A retrospective observational study was especially appropriate for this
dissertation because random selection was not feasible and prisoners are considered a
vulnerable population. A retrospective observational study is a method that can be used
to compare two preformed groups, where the formation of the groups is not amenable to
randomization (Rudestam & Newton, 2007, p. 28; Nagin, Cullen, & Jonson, 2009;
Rosenbaum, 1989). Random assignment, if utilized for this study, could have possibly
been structured in two ways: (1) randomly assigning inmates to disciplinary segregation
without requiring a justification, simply to give the inmates a “taste” of what they could
be subjected to if they committed a rule violation, or (2) subsequent to being found guilty
of committing a prison rule violation, and pursuant to a finding that their rule violation
merited punishment in the form of disciplinary segregation, the inmate would then be
randomly assigned disciplinary segregation as punishment. Both of these forms of
random selection would result in unfair treatment of the inmates, and such treatment may
be unethical. Furthermore, such a random selection process could violate the rights of the
inmates. The use of a retrospective observational study avoided these ethical dilemmas
and potential infringements upon the rights of the inmates.

112
Inmates are members of a vulnerable population (Creswell, 2009, p. 89). The
study of vulnerable populations is accompanied by heightened ethical concerns, such as
whether any actual or perceived coercion may affect the individuals’ consent to
participate in the study (Creswell, 2009, p. 89; Frankfort-Nachmias & Nachmias, 2008,
pp. 72–76). Ethical concerns associated with vulnerable populations can pose a barrier to
obtaining approval for a study. Since a retrospective observational study such as this one
is limited to collecting archival and administrative data, it avoids and minimizes many of
the ethical concerns that would be associated with other different types of studies done in
the same context. For example, studies that employ the administration of surveys to the
prisoners, or those that involve interviewing the prisoners, would be accompanied by
stronger ethical concerns than those that accompany the use of administrative and
archival data.
The use of a retrospective observational study enabled this research to be
performed without having to utilize a random selection process when generating the
sample and placing the participants into the treatment and comparison cohorts. For this
study, two cohorts were formed, a treatment cohort and a comparison cohort. Both
cohorts were limited to those who were incarcerated as of January 1, 2011, and who
remained incarcerated through December 31, 2014. In addition, the participants were
limited to those who were continuously incarcerated (during that time period) at a facility
(or facilities) that had at least a medium-security component. That is, inmates who spent
any time incarcerated in a minimum-security-only facility during 2011 through 2014
were excluded from the study. The treatment cohort was comprised of all those inmates

113
who spent time in disciplinary segregation during the years 2011 and/or 2012. The
inmates comprising the comparison cohort were drawn from those inmates who, as of
January 1, 2013, had not spent any time in disciplinary segregation. Then, the data were
analyzed using multiple regression in order to determine whether the experience of
disciplinary segregation significantly predicted subsequent prison misconduct for the
years 2013 and 2014.
A retrospective observational study using multiple regression analyses provided
an avenue through which archival and administrative data were analyzed and controlled
for in a manner that addressed the research questions. After generating these two cohorts,
I used multiple regression analyses to examine the predictive ability of the experience of
disciplinary segregation with regard to prison misconduct for 2013 and 2014.
Specifically, standard/simultaneous multiple regression was employed. This is because,
of the three methods of multiple regression (standard/simultaneous regression,
sequential/hierarchical regression, and statistical regression) the standard/simultaneous
regression method is the simplest, it typically supplies a more conservative estimate of
the impact of each predictor variable, and the variance attributed to each predictor
variable will not overlap with the variances of the other predictor variables (Warner,
2013, pp. 560–561). The multiple regression analysis method was used to control for the
influence of key variables on the rule violation rate. Controlling for key variables helped
isolate the unique influence of disciplinary segregation on the behavior of the prisoners.
These key control variables used in the multiple regression analyses were: age, length of
time incarcerated on current sentence, LS/CMI risk score, prior major rule violations in

114
2011-2012, prior minor rule violations in 2011-2012, and time spent in disciplinary
segregation in 2011-2012. In addition, gender served as another control variable, in that
only males were selected as participants in this study. These control variables were
chosen based upon prior research indicating that they are related to prison misconduct. In
essence, controlling for these variables using multiple regression analyses enhanced the
comparability of the two cohorts.
Variables
Several variables were involved in this study. In general, the dependent/outcome
variable was prison misconduct, the independent/predictor variable was cohort (i.e., the
grouping variable), the control/predictor variables were age, length of time served on
current sentence, LS/CMI risk score, prior prison misconduct in 2011-2012, and length of
time spent in disciplinary segregation in 2011-2012. In addition, gender also served as a
control variable. The specific definitions and the operationalization of each of these
variables are described below.
The dependent/outcome variable for this study was prison misconduct, defined as
an official finding by the prison authorities of an inmate rule violation in 2013-2014.
This could be operationalized in several different ways. First, it could be defined as the
overall total of official findings of rule violations in 2013-2014. It could also be further
broken down into the six different levels of rule violations. Additionally, it could also be
defined as total official findings of major rule violations (levels 1-4), and as total official
findings of minor rule violations (levels 5 and 6). These different measurement
definitions would contribute to developing both a broad overview of the relationship

115
between the experience of disciplinary segregation and prison misconduct, and to a
deeper and more detailed understanding of that relationship, but these methods of
measurement also come with drawbacks. Running multiple significance tests requires
lowering the level of significance set for each of the individual models (Warner, 2013,
pp. 89–99, 101, 565). One method of finding the appropriate level of significance for
individual models is the Bonferroni correction method. The equation for the Bonferroni
correction method is:
PC = EW /k
where EW is the -level for the whole study (here, = .05), “and k is the number of
significance tests performed in the entire [] study” (Warner, 2013, pp. 89–99, 101, 565).
Applying this method reveals that it is important to limit the number of significance tests
within the study, in order that the level of significance set for each individual model is
not set so low as to make the study highly susceptible to rejecting the null hypothesis
even when the null hypothesis is incorrect (Type II error; Warner, 2013, p. 1122). For
example, if six significance tests were run (one for each of the six rule-violation-level
outcome variables), then the significance level for each model should be set at .008 using
the Bonferroni correction, in order to keep the overall experiment-wise significance level
at the standard .05 -level (Field, 2013, pp. 67, 70, 870; Warner, 2013, pp. 89, 92, 98–
99). However, if three significance tests were run, then the significance level for each
model should be set at .017 using the Bonferroni correction. The appropriate resolution
appears to be a compromise where a limited number of models are employed. Therefore,
116
for this study, three models were employed, each using a different definition for the
outcome variable prison misconduct: (1) overall total rule violation findings in 2013-
2014, (2) total major rule violation findings in 2013-2014, and (3) total minor rule
violation findings in 2013-2014.
Cohort was a dummied variable, with 1 = treatment cohort, and 0 = the
comparison cohort. Age was a continuous variable measured as the participants’
chronological (biological) age in years as of January 1, 2011. Length of time spent
incarcerated on current sentence was a continuous variable, measured by the number of
days the participant had spent incarcerated on the current sentence as of January 1, 2011.
LS/CMI risk score was a continuous variable, and measured as the participant’s
numerical total score from section 1 of the LS/CMI. Gender also served as a control
variable, in that the sample was limited to only male participants.
Length of time spent in disciplinary segregation during 2011-2012 was a
continuous variable and was measured as the number of days the participant spent in
disciplinary segregation in 2011 through 2012. In addition, the data provided by the
Oregon DOC on this variable included within its parameters all the days the participant
continuously spent in disciplinary segregation, as long as one of those days was within
the treatment window (the treatment window being January 1, 2011, through December
31, 2012). In such an instance, the days would be counted from the date the participant
moved out of disciplinary segregation (or December 31, 2012) minus the date the
participant moved into disciplinary segregation; plus any other additional days spent by
the participant in disciplinary segregation in 2011 and 2012. If a participant was in

117
disciplinary segregation in 2011 and/or 2012, and did not move out of disciplinary
segregation until January 1, 2013 or later, those days after December 31, 2012 were not
counted; in other words, December 31, 2012, was the stop-date for counting the number
of days the participant spent in disciplinary segregation.
Prior rule violations was a continuous variable and could have been
operationalized several different ways. Prior rule violations could be operationalized by
creating a separate control variable for each level of rule violation (six levels total). Prior
rule violations could also be collapsed from those six levels/variables into two variables:
one variable for major rule violations (levels 1 through 4), and one variable for minor rule
violations (levels 5 and 6). Model fit was used to determine which operationalization to
apply in this study.
Methodology
Population
The population for the study is the group of individuals that the study is aimed at
investigating, and to which the results of the study will be generalized (Trochim, 2006).
For this study, the population can be described along three different levels. First, on a
broad level, the population for the study was the United States prison population. On a
more narrow level, the population for the study was the Oregon prison population. More
specifically, the population for this study consisted of all the male prisoners that were
housed within the Oregon DOC’s prison facilities during the years 2011 through 2014,
and who were incarcerated throughout that whole time in a facility or facilities that had a

118
medium-security component. This was also the specific sampling frame from which the
sample was drawn, per Trochim (2006).
Only male inmates were used for this study, in part because the Oregon DOC had
a significantly larger proportion of male inmates than female inmates incarcerated during
the period of study, and because gender can serve as a predictor of prison misconduct
(Celinska & Sung, 2014, p. 227; Craddock, 1996, para. 19; Harer & Langan, 2001, pp.
521–523; Haun, 2007, pp. 150–152, 218). The average total combined monthly male
prison population for the five Oregon DOC prison facilities used in this study, for the
years 2011 through 2014, was approximately 9,164 total inmates (Oregon DOC, n.d.a).
The average monthly Oregon DOC female prison population during those years was only
approximately 1,192 inmates (Oregon DOC, n.d.a). Since gender can serve as a predictor
of prison misconduct, the influence of gender on prison misconduct should be partialed-
out from the influence of disciplinary segregation. Also, female inmates are not housed
within the five prison facilities that will be used in this study. There is only one female
facility with a medium-security component (Coffee Creek Correctional Facility), and its
male population is very small; its average monthly male population for the years 2012
through 2014 was between approximately zero to three inmates (Oregon DOC, n.d.a).
The average monthly female population for that facility for the years 2011 through 2014
was approximately only 655 inmates (Oregon DOC, n.d.a).
The five prison facilities from which the two cohorts were drawn were the Oregon
State Penitentiary (OSP), the Eastern Oregon Correctional Institute (EOCI), the Oregon
State Correctional Institute (OSCI), the Snake River Correctional Institute (SRCI), and

119
the Two Rivers Correctional Institute (TRCI). These facilities were selected because
they were either a medium-security facility, or a multi-security facility with a medium-
security component (Oregon DOC, n.d.b). Inmates who spent time during the study
period in a strictly minimum-security facility or facilities (i.e., those facilities that did not
also have a medium-security component) were excluded from the study. This is because
the disciplinary segregation unit at a strictly minimum-security prison facility is
structurally different from a disciplinary segregation unit at a medium-security or multi-
security facility. At a minimum-security facility, the disciplinary segregation unit
resembles more of a holding cell unit, with only a few cells and the inmates generally do
not serve significant amounts of time in disciplinary segregation. When longer
disciplinary segregation punishments are imposed, the inmates are sent to serve the
punishment at a facility with a higher-rated level of security (i.e., a medium or multi-
security facility).
Sampling
For this study, the sample selection process utilized a purposive sampling
strategy. Purposive sampling entails selecting the sampling units with the intent to fulfill
a specific purpose (Trochim, 2006). Here, the intent of the sampling process was to
generate two cohorts that were representative of the population and which could be
studied in order to better understand the effect of the experience of disciplinary
segregation on inmate behavior within the Oregon prison system. In order to achieve this
purpose, the participants were drawn from the Oregon DOC prison populations of those
facilities with a medium-security component. The participants were limited to those who

120
were incarcerated as of January 1, 2011, and who remained incarcerated through
December 31, 2014. From this sampling frame, two cohorts were formed. Specifically,
the treatment cohort was comprised of all of those inmates who spent time in disciplinary
segregation during the years 2011 and 2012. The comparison cohort was comprised of
all of those inmates who had not, as of January 1, 2013, spent any time in disciplinary
segregation. This could also be considered a “convenience” sample (Frankfort-Nachmias
& Nachmias, 2008, p. 168), since the sampling frame was selected in part based upon its
availability.
Data Collection
The data that were used in this study was archival and administrative data held by
the Oregon DOC. The study underwent an application and approval process with the
Oregon DOC, and official approval for the study was received. Once the Oregon DOC
and the Walden University Institutional Review Board (IRB) approved the study, data
were then gathered on all the Oregon DOC inmates who were incarcerated from January
1, 2011, through December 31, 2014 in a facility or facilities with a medium-security
component. In particular, data regarding the inmates’ gender, age, length of time spent
incarcerated on current sentence, LS/CMI section 1 risk score, prison misconduct history
in 2011-2012, and their disciplinary segregation history were gathered. The Oregon
DOC Research and Evaluation Unit helped me collect and organize the necessary data.
The Research and Evaluation Unit developed and ran computer codes that were then
deployed to collect the data (J. Duncan, personal communication, January 28, 2015).
After compiling the data, the Research and Evaluation Unit then delivered it to me in a

121
Microsoft Excel spreadsheet format, which I then uploaded into the SPSS computer
program.
Data Screening and Cleaning
Prior to using statistical analysis techniques to examine the data, steps were taken
in SPSS to screen and clean the data. First, the data were examined for any missing
values. Cases with missing data were dealt with using listwise deletion (Field, 2013, pp.
187, 332; Tabachnick & Fidell, 2014, pp. 97, 105, 160; Warner, 2013, p. 134). Second,
frequency tables were used to get an overview of the data and determine the number of
participants in the treatment and comparison cohorts (Warner, 2013, p. 135). Third,
histograms depicting each of the variables were generated in order to check for outliers
and assess whether the assumption of normally distributed errors had been violated
(Field, 2013, pp. 176–179, 311, 349; Warner, 2013, pp. 142–147, 573).
After examining the histograms, additional steps were taken to check for outliers.
The next step was to generate boxplots that were used to examine the data for outliers
(Field, 2013, pp. 176–178; Warner, 2013, pp. 153–156). This was followed by an
additional step in which standardized residuals (z- scores) were generated and examined
(Field, 2013, pp. 179–180, 304–306). In a sample where the data are normally
distributed, no more than 5% of the z-scores should be greater than the absolute value of
1.96 (i.e., “potential outliers”), no more than 1% of the z-scores should be greater than the
absolute value of 2.58 (“probable outliers”), and no more than 0.1% of the z-scores
should be greater than the absolute value of 3.29 (i.e., “extreme outliers”) (Field, 2013,
pp. 179–180, 306; Tabachnick & Fidell, 2014, pp. 105–107). These steps identified any

122
outliers, and such values were then deleted. Where more than 0.1% of the cases had a z-
score with an absolute value greater than 3.29, then those values were deleted, beginning
with the most extreme, until only 0.1% of the z-scores had an absolute value greater than
3.29 (Field, 2013, p. 306; Warner, 2013, p. 153). Where more than 1% of the cases had a
z-score with an absolute value greater than 2.58, then those values were deleted, until
only 1% of the z-scores had an absolute value greater than 2.58 (Field, 2013, p. 306;
Warner, 2013, p. 153). Where more than 5% of the cases had a z-score with an absolute
value greater than 1.96, then those values were deleted, until only 5% of the z-scores had
an absolute value greater than 1.96 (Field, 2013, p. 306; Warner, 2013, p. 153). Since
outliers were detected, the multiple regression analyses were run twice; once with the
outlier cases deleted, and once with the outlier cases included (Warner, 2013, pp. 156–
157). This was done in order to facilitate a transparent analysis of the data and develop a
better understanding of the effect of the outliers, if any, on the analysis (Warner, 2013,
pp. 156–157).
Next, the assumption of normally distributed errors was further assessed in
addition to the examination of the initial histograms. The data were divided into two
groups, where the data pertaining to the treatment cohort were delineated from the data
pertaining to the comparison cohort (Field, 2013, pp. 188–189). A descriptive statistics
table was then generated, which provided values that described the skewness and kurtosis
of the data (Field, 2013, pp. 181–188; Warner, 2013, pp. 150–153). In addition, the data
were examined using the Shapiro-Wilk test and the Kolmogorov-Smirnov test, which if
significant ( = .05) would indicate that the sample is not normally distributed (Field,

123
2013, pp. 184–185, 191). Most importantly to the determination of whether errors were
normally distributed, histograms depicting the dependent/outcome variables and the
standardized residuals were evaluated, and normal probability-probability plots were
inspected as well (Field, 2013, pp. 179–182, 311, 329–331, 348–351; Williams, Grajales,
& Kurkiewicz, 2013). Since these examinations indicated that the assumption of
normality was violated, the bootstrapping method was used in the multiple regression
analyses in order to correct for the violation (Field, 2013, pp. 198–200, 311, 350–352).
Multiple regression also assumes homogeneity of variances (homoscedasticity)
when comparing the means of quantitative variables across groups (Field, 2013, pp. 172–
176, 311; Warner, 2013, pp. 163–164, 573). First, the data were checked for
homoscedasticity through the use of scatterplots that depicted the standardized predicted
values and the standardized residuals (Field, 2013, pp. 192–193, 330; Warner, 2013, p.
573). A scatterplot will indicate heteroscedasticity if the values form the shape of a
funnel (Field, 2013, pp. 192, 348–349). In addition, the Levene’s test ( = .05) was used
to further determine whether the assumption had been violated (Field, 2013, pp. 193–195;
Warner, 2013, pp. 163–164). Since the assumption was violated, the bootstrapping
method was used in the multiple regression analyses in order to correct for the violation
(Field, 2013, pp. 198–202, 350–352).
Multiple regression also requires linearity, in that the outcome variable should be
linearly related to the predictor variables (Field, 2013, pp. 167–168, 192; Warner, 2013,
p. 573). Checking the data for linear relations was done by using the same scatterplots
used to check for homoscedasticity (Field, 2013, pp. 192, 326; Warner, 2013, p. 573). A

124
scatterplot will indicate that the assumption of linearity has been violated if the values
form the shape of a curve (Field, 2013, p. 192; Warner, 2013, pp. 168–172). If the
assumption of linearity had been violated, then nonparametric tests would have been used
to evaluate the data instead of multiple regression analysis. The nonparametric tests that
would have been used were the Mann-Whitney test and the Wilcoxon’s rank-sum test
(Field, 2013, pp. 219, 228; Mann & Whitney, 1947; Wilcoxon, 1945).
Independence of observations is another assumption underlying the multiple
regression analysis (Field, 2013, pp. 176, 311; Warner, 2013, pp. 163, 573). The data
were examined for a violation of this assumption using the Durbin-Watson test (Field,
2013, pp. 176, 311, 329, 337; Durbin & Watson, 1951; Tabachnick & Fidell, 2014, p.
164).
Multicollinearity is another issue that must be addressed. Strong collinearity
(correlation) between two or more of the predictor variables can interfere with the
analysis (Field, 2013, pp. 312, 324). The variance inflation factor (VIF) and the tolerance
statistic were used to assess multicollinearity (Field, 2013, pp. 325, 329, 342). If a VIF
value is greater than 10, and/or a tolerance statistic is less than 0.2, it is likely that the
multicollinearity assumption has been violated (Field, 2013, pp. 325, 342, 795). If there
had been strong collinearity between two or more predictor variables, then one of the
variables would have been removed from the study, or principal component analysis
(PCA) would have been used to combine those highly-correlated variables into one
predictor variable (Field, 2013, pp. 343, 666, 674, 797).

125
Data Analysis
After the data had gone through the screening and cleaning process, the data were
analyzed with a statistical analysis technique using SPSS. Since the data met the
necessary assumptions, multiple regression analysis was the statistical technique used to
examine the data. Specifically, the standard/simultaneous regression method with
bootstrapping was employed to analyze the data.
The multiple regression analyses were performed with the purpose of analyzing
the ability of the independent/predictor variable cohort (the grouping variable dividing
the participants into the treatment and comparison cohorts) to predict prison misconduct.
The aim of this analysis was to investigate the following three research questions and
three null hypotheses:
RQ1: Does deterrence theory explain the relationship between the experience of
disciplinary segregation and subsequent prison misconduct among inmates, after
controlling for the effects of gender, age, length of time spent incarcerated on current
sentence, LS/CMI risk score, prior major rule violations in 2011-2012, prior minor rule
violations in 2011-2012, and time spent in disciplinary segregation in 2011-2012?
RQ2: Does the experience of disciplinary segregation reduce subsequent prison
misconduct among inmates who are subjected to it, and if so, to what extent?
RQ3: Does the experience of disciplinary segregation have a criminogenic effect on
inmates who are subjected to it?
NH1: There is no significant difference between the treatment cohort and the comparison
cohort on prison misconduct.
126
NH2: The experience of disciplinary segregation does not significantly reduce
subsequent prison misconduct among inmates who are subjected to it.
NH3: The experience of disciplinary segregation does not have a significant
criminogenic effect on inmates who are subjected to it.
In essence, each of these hypotheses asks whether the experience of disciplinary
segregation significantly predicts whether an inmate will engage in prison misconduct.
Since multiple regression analysis examines the predictive ability of a variable, the three
null hypotheses must be transformed into hypotheses that use that language of prediction.
Therefore, the multiple regression analyses directly tested the following null hypotheses:
NH1: The independent/predictor variable cohort does not significantly predict prison
misconduct.
NH2: The level of the independent/predictor variable cohort that indicates membership
in the cohort comprised of those who have spent time in disciplinary segregation (the
treatment cohort) does not significantly negatively predict prison misconduct.
NH3: The level of the independent/predictor variable cohort that indicates membership
in the cohort comprised of those who have spent time in disciplinary segregation (the
treatment cohort) does not significantly positively predict prison misconduct.
For this study, three models were employed, each using a different definition for
the outcome variable prison misconduct: (1) overall total rule violation findings in 2013-
2014, (2) total major rule violation findings in 2013-2014, and (3) total minor rule
violation findings in 2013-2014. For each of these models, a specific -level was not
preset; rather, exact p values are reported, and the results were to be discussed in terms of

127
whether they were significant at the .05 -level, and additionally whether they were
significant at the .017 -level, and then additionally whether they were significant at
the .008 -level. These alpha-levels were obtained using the Bonferroni correction
method explained earlier in this chapter. The .017 -level was based on the fact that
three total models were used in this study. The .008 -level was based on the fact that
six total multiple regression analyses were run, each model being run twice (i.e., once
with the outliers excluded and then once with the full data set). Where p < .05, the results
were described simply as nonsignificant, without the additional discussion that the results
were also clearly not significant at the even lower levels of .017 and .008.
If the independent/predictor variable cohort is significantly predictive of prison
misconduct, then NH1 should be rejected. If cohort is significantly predictive of prison
misconduct and its slope is negative, this would indicate that higher scores on cohort (i.e.,
being in the treatment cohort) predicted lower rates of misconduct – and therefore NH1
and NH2 should be rejected (Field, 2013, pp. 319, 338; Warner, 2013, pp. 567–568, 578).
If cohort is significantly predictive of prison misconduct and its slope is positive, this
would indicate that higher scores on cohort (i.e., being in the treatment cohort) predicted
higher rates of prison misconduct – and therefore NH1 and NH3 should be rejected
(Field, 2013, pp. 319, 338; Warner, 2013, pp. 567–568, 578). If the
independent/predictor variable cohort is not significantly predictive of prison misconduct
(either negatively or positively), then none of the null hypotheses should be rejected.
Limiting the participants to males and excluding females helped control for the
effects of gender on prison misconduct. Furthermore, limiting the participants to only

128
those inmates incarcerated in a facility with a medium-security component helped control
for and exclude the possible effects of being incarcerated in a minimum-security facility
where the disciplinary segregation unit is qualitatively different than the disciplinary
segregation units in facilities with a medium-security component. The multiple
regression analyses helped control for the effects of age, length of time spent incarcerated
on current sentence, LS/CMI risk score, and prior rule violation history, since prior
research indicates that these variables can influence prison misconduct. In addition, the
multiple regression analysis also included the control/predictor variable length of time
spent in disciplinary segregation in 2011-2012. All of these measures helped increase the
comparability of the two cohorts and isolate the effect of the experience of disciplinary
segregation on subsequent prison inmate misconduct.
Threats to Validity
There were several apparent threats to the study’s validity, particularly threats to
its internal validity and external validity. First, the internal validity of the study was
threatened by a possible selection bias. Internal validity refers to the ability to draw a
causal connection between two or more variables based upon the results of the study
(Creswell, 2009, p. 162; Warner, 2013, pp. 16–20, 1093). Selection bias occurs when
members of a group have a predisposition towards a certain outcome (Creswell, 2009, p.
163). Selection bias is a common issue in retrospective observational studies (e.g.,
Campbell & Stanley, 1963, p. 12). Here, the cohort that was comprised of inmates who
had previously spent time in disciplinary segregation may have been more predisposed to
committing rule violations, whereas the cohort that was comprised inmates who, as of

129
January 1, 2013, had not been sent to disciplinary segregation may have been more
predisposed to not committing prison rule violations. Either of these circumstances
would compromise the accuracy of any inferences that could be drawn from the results.
In order to reduce the chance of selection bias interfering with the study, the statistical
technique of multiple regression analysis was used to partial out the impact of certain
variables that research has shown to influence prison misconduct. These measures
should have increased the comparability of the two cohorts, helped isolate the effect of
the experience of disciplinary segregation, and reduced the threat to internal validity
posed by selection bias.
External validity refers to the ability of the results of the study to be generalized
to a broader group or environment beyond the study’s specific sample and circumstances
(Creswell, 2009, p. 162; Warner, 2013, pp. 17–20, 1086). Since this study utilized
administrative/archival data, as opposed to being conducted in a tightly controlled
laboratory setting, the external validity of the study should be relatively strong.
However, the sample selection process may have resulted in reducing the external
validity of the study. That is, limiting the sample to only those inmates incarcerated
throughout the entire study period (2011 through 2014) within a facility containing a
medium-security component may have decreased the representativeness of the sample
with regard to the whole Oregon prison population. However, keeping that limitation on
the sample in place was important for other reasons, including issues related internal
validity and allotting a timeframe long enough to collect enough data to compile
meaningful results.

130
Ethical Procedures
It is important to ensure that the expected benefits of a study outweigh any
potential risks, particularly risks to human participants. It is also important that any
potential risks are minimized. To that end, this study went through Walden University’s
IRB process, and no data collection occurred until after this study had received official
IRB approval. The IRB approval number for this study was 04-20-15-0366739. Prior to
receiving IRB approval, the study also underwent a formal application process with the
Oregon DOC, after which the Oregon DOC granted official approval to gather the data
and perform the study.
This study used de-identified archival/administrative data from the years 2011
through 2014 provided by the Oregon DOC. The data were anonymous, in that the data
set that I received from the Oregon DOC did not contain any of the participants’ personal
identifying information, other than the information directly related to the variables that
were being studied (e.g., age, gender, prison misconduct). In addition, measures were
taken to keep the data secure. These measures included storing the data on a single
password-protected personal computer and an external hard drive. The external hard
drive was kept in a locked fire-resistant safe, except for the times when it was briefly
removed to back-up the computer. The safe and the computer remained in a limited-
access home office, and only I had access to the computer and the safe. After the study
had been completed, the data were deleted from the computer, but the data remains stored
on the external hard drive locked in the safe. The data set will not be shared with anyone
unless the Oregon DOC grants specific consent.

131
Summary
This study utilized a quantitative retrospective observational research design.
First, archival and administrative data were collected with the help of the Oregon DOC.
Then, using SPSS, the data were screened and cleaned. Next, multiple regression
analysis was used to analyze the data, in order to determine whether the experience of
disciplinary segregation significantly predicted subsequent prison misconduct, and if so
then whether it significantly negatively or positively predicted prison misconduct. The
intent of this examination was to help reveal the effect that the experience of disciplinary
segregation may have on subsequent prison inmate misconduct.

132
Chapter 4: Results
Introduction
The purpose of this quantitative study was to examine the effectiveness of
disciplinary segregation in deterring prison inmate misconduct within the Oregon DOC
prison system. This retrospective observational study was specifically designed to test the
theory of deterrence that relates disciplinary segregation to prison misconduct. The
following three research questions were addressed by this study:
RQ1: Does deterrence theory explain the relationship between the experience of
disciplinary segregation and subsequent prison misconduct among inmates, after
controlling for the effects of gender, age, length of time spent incarcerated on current
sentence, LS/CMI risk score, prior major rule violations in 2011-2012, prior minor rule
violations in 2011-2012, and length of time spent in disciplinary segregation in 2011-
2012?
RQ2: Does the experience of disciplinary segregation reduce subsequent prison
misconduct among inmates who are subjected to it, and if so, to what extent?
RQ3: Does the experience of disciplinary segregation have a criminogenic effect
on inmates who are subjected to it?
In order to address these questions, multiple regression analyses were used to test
the following null hypotheses:
NH1: The independent/predictor variable cohort does not significantly predict
prison misconduct.

133
NH2: The level of the independent/predictor variable cohort that indicates
membership in the cohort comprised of those who have spent time in disciplinary
segregation (the treatment cohort) does not significantly negatively predict prison
misconduct.
NH3: The level of the independent/predictor variable cohort that indicates
membership in the cohort comprised of those who have spent time in disciplinary
segregation (the treatment cohort) does not significantly positively predict prison
misconduct.
Three separate analyses were performed. The primary analysis featured overall
total rule violations as the dependent/outcome variable. Then, two more analyses were
performed in order to develop a more refined understanding of the effect of disciplinary
segregation on subsequent prison misconduct. The second analysis featured total major
rule violations as the outcome variable. The third analysis featured total minor rule
violations as the outcome variable.
This chapter begins with a brief description of the characteristics of the sample.
Then, two different models are examined with regard to the control/predictor variable
prior prison misconduct in 2011-2012, in order to determine which was the most
appropriate to apply in this study. This is followed by a discussion of the data in relation
to the necessary assumptions. Lastly, the results of the multiple regression analyses are
reported.

134
Population and Sample
The population for the study consisted of 3,375 inmates that had been
incarcerated from January 1, 2011 through December 31, 2014 in an Oregon DOC
facility or facilities that had a medium-security component. The descriptive statistics for
this population are set out in Tables 1 and 2; of the 3,375 participants, one individual was
excluded from the study due to missing data on a few key variables, and 1,263 were
excluded from the study due to meeting neither the comparison cohort criteria nor the
treatment cohort criteria. These 1,263 individuals had spent time in disciplinary
segregation at some point prior to January 1, 2011 (thus excluding them from the
comparison cohort) and did not serve any time in disciplinary segregation during the
years 2011 or 2012 (thus excluding them from the treatment cohort). Of the remaining
2,111 participants, 853 qualified for the comparison cohort and 1,258 qualified for the
treatment cohort. However, of those 2,111 participants, only 228 had scores on the
LS/CMI. These 228 participants comprised the final sample used for the study. The
descriptive statistics for this sample are contained in Tables 3 and 4.

135
Table 1 Descriptive Statistics for the Population
Age
Length of Time Spent on Current
Sentence LS/CMI Score
Length of Time Spent in DSU in
2011-2012
n Valid 3374 3374 307 3374
n Missing 1 1 3068 1
M 41.646 2558.406 24.023 43.996
Mdn 41.000 1760.500 24.000 0.000
SD 12.5468 2487.6625 7.6741 119.1519
Minimum 18.0 4.0 6.0 0.0
Maximum 81.0 14165.0 40.0 2421.0

136
Table 2 Descriptive Statistics for the Population
Total Major
Rule Violations in 2011-2012
Total Minor Rule
Violations in 2011-2012
Overall Total Rule Violations in 2013-
2014
Total Major Rule
Violations in 2013-2014
Total Minor Rule
Violations in 2013-2014
n Valid 3375 3375 3375 3375 3375
n Missing 0 0 0 0 0
M 1.9446 0.2770 1.677 1.4607 0.2160
Mdn 0.0000 0.0000 0.000 0.0000 0.0000
SD 4.52028 0.94483 4.7312 4.36096 0.70386
Minimum 0.00 0.00 0.0 0.00 0.00
Maximum 58.00 19.00 116.0 111.00 9.00

137
Table 3 Descriptive Statistics for the Sample
Age
Length of Time Spent on Current
Sentence LS/CMI Score
Length of Time Spent in DSU in
2011-2012
n Valid 228 228 228 228
n Missing 0 0 0 0
M 33.588 1120.496 24.877 130.939
Mdn 31.000 590.500 25.000 89.500
SD 10.2916 1334.8228 7.6580 143.4899
Minimum 18.0 46.0 6.0 0.0
Maximum 66.0 7270.0 40.0 806.0

138
Table 4 Descriptive Statistics for the Sample
Total Major
Rule Violations in 2011-2012
Total Minor Rule
Violations in 2011-2012
Overall Total Rule Violations in 2013-
2014
Total Major Rule
Violations in 2013-2014
Total Minor Rule
Violations in 2013-2014
n Valid 228 228 228 228 228
n Missing 0 0 0 0 0
M 6.5658 0.9649 5.193 4.5132 0.6798
Mdn 5.0000 0.0000 2.000 2.0000 0.0000
SD 7.05361 1.81005 7.9585 7.18079 1.37252
Minimum 0.00 0.00 0.0 0.00 0.00
Maximum 43.00 13.00 49.0 47.00 8.00
Model Fit
Assessment of the model fit was necessary in order to determine the appropriate
method of controlling for prior rule violations and determining the best way to
operationalize prior prison misconduct. I focused on two options for operationalizing
prior prison misconduct. There were six different rule violation levels (levels of
seriousness), with levels 1-4 being categorized as “major” violations, and levels 5-6 being
categorized as “minor” violations (Or. Admin. R. 291-105-005 et seq., exhibit 1, exhibit
2). Therefore, the prior rule violations could be applied as two control/predictor variables,
with one variable being prior major violations in 2011-2012, and the other being prior

139
minor rule violations in 2011-2012. However, the prior rule violations could also have
been applied with further specificity by being operationalized as six different
control/predictor variables, with one control/predictor variable for each level of
misconduct.
I ran regression analyses on the data in order to decide which version of
operationalization to use. The specific data used for this analysis utilized the overall total
rule violations in 2013-2014 as the outcome variable, with no data points deleted (i.e.,
outliers were not deleted). When including the six different rule violation level predictor
variables (for a total of 11 predictors) in the model, the adjusted R2 = .449, F = 17.821, p
< .001. When those six rule violation level predictor variables were collapsed into just
two variables, (one for major violations, one for minor violations, for a total of seven
predictors), the adjusted R2 = .455, F = 28.059, p < .001. Since the adjusted R2 for the
seven-predictor model was higher than the adjusted R2 for the 11-predictor model, it
appeared that the seven-predictor model was a better “fit.” Therefore, the prior rule
violations were operationalized as two predictor variables: prior major misconducts in
2011-2012 and prior minor misconducts in 2011-2012.
Assumptions
As outlined in Chapter 3, I examined the study data to determine whether any of
the necessary assumptions were violated and to see if any remedies or alterations to the
data analysis process were necessary. First, the data were examined for outliers. Then,
the assumption of normally distributed errors was assessed. Next, the assumption of

140
homogeneity of variances was tested, which was then followed by an examination of the
data for linearity. Independence of observations and multicollinearity were also assessed.
Outliers
The data were first examined for outliers. This was done through a review of the
histograms and boxplots of each of the different variables, as well as the generation of
standardized z scores. When examining the data for outliers, (1) no more than 5% of the
z scores should be greater than the absolute value of 1.96, (2) no more than 1% of the z
scores should be greater than the absolute value of 2.58, and (3) no more than 0.1% of the
z scores should be greater than the absolute value of 3.29 (Field, 2013, p. 306). Applying
these rules to the data within each of the variables meant that, since there were a total of
228 participants:
1. no more than eleven of the z scores should be greater than the absolute value of
1.96,
2. no more than two of the z scores should be greater than the absolute value of 2.58,
and
3. zero of the z scores should be greater than the absolute value of 3.29.
Data points whose equivalent z scores were outside the necessary range were deleted.
Frequency tables depicting the number and percentages of extreme outliers, probable
outliers, and potential outliers within the data set are contained in Appendix A. When
there were multiple data points outside the necessary range, data points were chosen for
deletion based upon whether the case would be removed anyway from the analysis (e.g.,
the case was an extreme outlier for another variable), otherwise the highest score would

141
be deleted first. The purpose of this method was to limit the number of participants that
would be eliminated from the study due to outliers.
For example, the variable length of time spent in disciplinary segregation during
2011-2012 had three extreme outliers, and each of these data points were deleted (which
later resulted in those participants being deleted when listwise deletion was used during
the multiple regression analyses). The variable prior major rule violations in 2011-2012
had three “probable” outliers. Of these three probable outliers (participants #138, #89,
#226), one had to be deleted in order for the data to be within the necessary range. Since
participant #138 was already going to be removed from the data set due to having an
extreme outlier on the other variable length of time spent in disciplinary segregation in
2011-2012, his outlier data point for prior major rule violations in 2011-2012 was chosen
as the one to be deleted.

142
Table 5 Deleted Outliers
Predictor Variable Total Extreme Outliers Deleted
Total Probable Outliers Deleted
Age 0 0
Length of time spent on current sentence
5 2
LS/CMI score 0 0
Length of time spent in DSU in 2011-2012
3 1
2011-2012 total major rule violations 2 1
2011-2012 total minor rule violations 4 0
2013-2014 overall total rule violations 7 0
2013-2014 total major rule violations 7 0
2013-2014 total minor rule violations 5 0
The process of screening for outliers revealed that there were outliers within the
data, and some of these outliers were deleted from the data set (as described above).
Because of this, the multiple regression analysis was run twice with each of the three
models (one model for each of the three different outcome variables): once with the
outliers included, and once with the outliers excluded. This was done in order to
understand any effect the outliers may have had on the analysis, and to facilitate a
transparent assessment of the data (Warner, 2013, pp. 156–157).
Normally Distributed Errors
First, I examined histograms of the variables to see whether the scores were
normally distributed. Then the data were delineated between the comparison cohort and

143
the treatment cohort. Descriptive statistics were then generated and examined to further
examine whether the data was normally distributed. The descriptive statistics concerning
the dependent/outcome variables are depicted in Appendix B. Then, continuing on with
the examination of the distribution shape of the scores on the variables, and with the data
still split by cohort, the Shapiro-Wilk test and the Kolmogorov-Smirnov test were applied
to the variables. The results of these two tests are set out in Appendix C.
Most importantly in the assessment of the assumption of normally distributed
errors, histograms depicting the dependent/outcome variables and the standardized
residuals were evaluated, and normal probability-probability plots were inspected. These
histograms are set out in Appendix D, and the normal probability-probability plots are set
out in Appendix E. The information revealed by these different examinations suggested
that the data violated the assumption of normal distribution of errors. Therefore, the
bootstrapping procedure was utilized in the multiple regression analyses because of the
appearance of nonnormally distributed errors. It should also be noted that regardless of
whether the assumption of normally distributed errors was violated or not, the
bootstrapping method would have still needed to be employed in order to deal with the
violation of the assumption of homogeneity of variances.
Homogeneity of Variance
The assumption of homogeneity of variances was checked in three different
phases. First, this assumption was evaluated using the outcome variable overall total rule
violations in 2013-2014. Second, this assumption was checked using the outcome
variable total major rule violations in 2013-2014. Thirdly, this assumption was checked

144
using the outcome variable total minor rule violations in 2013-2014. Within each of
these three phases, the assumption was checked with the outliers removed from the data
set, and then again using the complete data set without the outliers removed.
Homoscedasticity and Overall Total Rule Violations
Homoscedasticity and overall total rule violations with outliers removed.
First, a scatterplot generated from the data set with the outliers removed and depicting the
standardized predicted values (x axis) and standardized residuals (y axis) for the outcome
variable overall total rule violations in 203-2014 was examined (Field, 2013, p. 330).
This scatterplot showed some clustering of the data. Partial plots were also examined,
several of which also showed some clustering of the data, especially with the partial plots
relating to the variables length of time spent on current sentence, length of time spent in
disciplinary segregation during 2011-2012, total major rule violations in 2011-2012, and
total minor rule violations in 2011-2012. Next, a Levene’s test was conducted using the
outcome variable overall total rule violations in 2013-2014, and cohort (i.e., the grouping
variable) as the factor variable. This Levene’s test (using the median scores) revealed
unequal variances, F(1, 219) = 34.158, p < .001. The information from the scatterplot,
partial plots, and the Levene’s test indicated that the assumption of homogeneity of
variances had been violated. Therefore, the bootstrapping method was used with this
data set. The scatterplots and partial plots used for these analyses can be found in
Appendix F.
Homoscedasticity and overall total rule violations with full data set. The
results from the following exercise were very similar with the results from the previous

145
exercise using the data set that excluded outliers. First, a scatterplot generated from the
full data set and depicting the standardized predicted values (x axis) and standardized
residuals (y axis) for the outcome variable overall total rule violations in 2013-2014 was
examined (Field, 2013, p. 330). This scatterplot showed some clustering of the data.
Partial plots were also examined, several of which also showed some clustering of the
data, especially with the partial plots relating to the variables length of time spent on
current sentence, length of time spent in disciplinary segregation during 2011-2012, total
major rule violations in 2011-2012, and total minor rule violations in 2011-2012. Next,
a Levene’s test was conducted using the outcome variable overall total rule violations in
2013-2014, and cohort as the factor variable. This Levene’s test (using the median
scores) revealed unequal variances, F(1, 226) = 19.316, p < .001. The information from
the scatterplot, partial plots, and the Levene’s test indicated that the assumption of
homogeneity of variances had been violated. Therefore, the bootstrapping method was
used with this data set. The scatterplots and partial plots used for these analyses can be
found in Appendix G.
Homoscedasticity and Total Major Rule Violations
Homoscedasticity and total major rule violations with outliers removed. First,
a scatterplot generated from the data set with the outliers removed and depicting the
standardized predicted values (x axis) and standardized residuals (y axis) for the outcome
variable total major rule violations in 2013-2014 was examined (Field, 2013, p. 330).
This scatterplot showed some clustering of the data. Partial plots were also examined,
several of which also showed some clustering of the data, especially with the partial plots

146
relating to the variables length of time spent on current sentence, length of time spent in
disciplinary segregation during 2011-2012, total major rule violations in 2011-2012, and
total minor rule violations in 2011-2012. Next, a Levene’s test was conducted using the
outcome variable total major rule violations in 2013-2014, and cohort as the factor
variable. This Levene’s test (using the median scores) revealed unequal variances, F(1,
219) = 41.579, p < .001. The information from the scatterplot, partial plots, and the
Levene’s test indicated that the assumption of homogeneity of variances had been
violated. Therefore, the bootstrapping method was used with this data set. The
scatterplots and partial plots used for these analyses can be found in Appendix H.
Homoscedasticity and total major rule violations with full data set. The
results from the following exercise were very similar with the results from the previous
exercise using the data set that excluded outliers. First, a scatterplot generated from the
full data set and depicting the standardized predicted values (x axis) and standardized
residuals (y axis) for the outcome variable overall total rule violations in 2013-2014 was
examined (Field, 2013, p. 330). This scatterplot showed clustering of the data. Partial
plots were also examined, several of which also showed some clustering of the data. The
partial plots relating to the variables cohort, age, and LS/CMI risk score showed some
clustering. The partial plots relating to the variables length of time spent on current
sentence, length of time spent in disciplinary segregation during 2011-2012, total major
rule violations in 2011-2012, and total minor rule violations in 2011-2012 showed a
more clearly defined pattern of clustering. Next, a Levene’s test was conducted using the
outcome variable total major rule violations in 2013-2014, and cohort as the factor
147
variable. This Levene’s test (using the median scores) revealed unequal variances, F(1,
226) = 18.161, p < .001. The information from the scatterplot, partial plots, and the
Levene’s test indicated that the assumption of homogeneity of variances had been
violated. Therefore, the bootstrapping method was used with this data set. The
scatterplots and partial plots used for these analyses can be found in Appendix I.
Homoscedasticity and Total Minor Rule Violations
Homoscedasticity and total minor rule violations with outliers removed. First,
a scatterplot generated from the data set with the outliers removed and depicting the
standardized predicted values (x axis) and standardized residuals (y axis) for the outcome
variable total minor rule violations in 2013-2014 was examined (Field, 2013, p. 330).
This scatterplot showed some clustering of the data. Partial plots were also examined,
several of which also showed some clustering of the data. The partial plots relating to the
variables cohort and age showed some clustering. The partial plots relating to the
variables length of time spent on current sentence, length of time spent in disciplinary
segregation during 2011-2012, total major rule violations in 2011-2012, and total minor
rule violations in 2011-2012 showed a more clearly defined pattern of clustering. Next,
a Levene’s test was conducted using the outcome variable total minor rule violations in
2013-2014, and cohort as the factor variable. This Levene’s test (using the median
scores) revealed unequal variances, F(1, 221) = 10.885, p = .001. The information from
the scatterplot, partial plots, and the Levene’s test indicated that the assumption of
homogeneity of variances had been violated. Therefore, the bootstrapping method was

148
used with this data set. The scatterplots and partial plots used for these analyses can be
found in Appendix J.
Homoscedasticity and total minor rule violations with full data set. The
results from the following exercise were very similar with the results from the previous
exercise using the data set that excluded outliers. First, a scatterplot generated from the
full data set and depicting the standardized predicted values (x axis) and standardized
residuals (y axis) for the outcome variable total minor rule violations in 2013-2014 was
examined (Field, 2013, p. 330). This scatterplot showed clustering of the data. Partial
plots were also examined, several of which also showed some clustering of the data. The
partial plots relating to the variables cohort, age, and LS/CMI risk score showed some
clustering. The partial plots relating to the variables length of time spent on current
sentence, length of time spent in disciplinary segregation in 2011-2012, total major rule
violations in 2011-2012, and total minor rule violations in 2011-2012 showed a more
clearly defined pattern of clustering. Next, a Levene’s test was conducted using the
outcome variable total minor rule violations in 2013-2014, and cohort as the factor
variable. This Levene’s test (using the median scores) revealed unequal variances, F(1,
226) = 9.526, p = .002. The information from the scatterplot, partial plots, and the
Levene’s test indicated that the assumption of homogeneity of variances had been
violated. Therefore, the bootstrapping method was used with this data set. The
scatterplots and partial plots used for these analyses can be found in Appendix K.

149
Linearity
The same scatterplots and partial plots used to check for homoscedasticity were
also used to check the assumption of linearity for each of the three models (both with and
without outliers included). In viewing these graphs, it did not appear that the assumption
of linearity had been violated. The scatterplots and partial plots used for these analyses
can be found in Appendices B–G.
Independence of Observations
The Durbin-Watson test was conducted on each of the three models (with and
without outliers) to determine whether the assumption of independence of errors was
violated. For the primary model with the outcome variable overall total rule violations in
2013-2014, the Durbin-Watson statistic = 1.974 (outliers excluded), and 1.997 (full data
set). For the model with the outcome variable total major rule violations in 2013-2014,
the Durbin-Watson statistic = 1.994 (outliers excluded), and 2.016 (full data set). For the
model with the outcome variable total minor rule violations in 2013-2014, the Durbin-
Watson statistic = 1.718 (outliers excluded), and 1.905 (full data set). Since these values
are so close to 2.0, it appears that the assumption of independence of observations was
not violated.
Multicollinearity
Each of the models was examined to check for whether the assumption of
multicollinearity was violated. Tables 6–11 depict the collinearity diagnostics for the
different models. The collinearity diagnostics seen in Tables 6–11 indicated that the
assumption of multicollinearity was not violated.
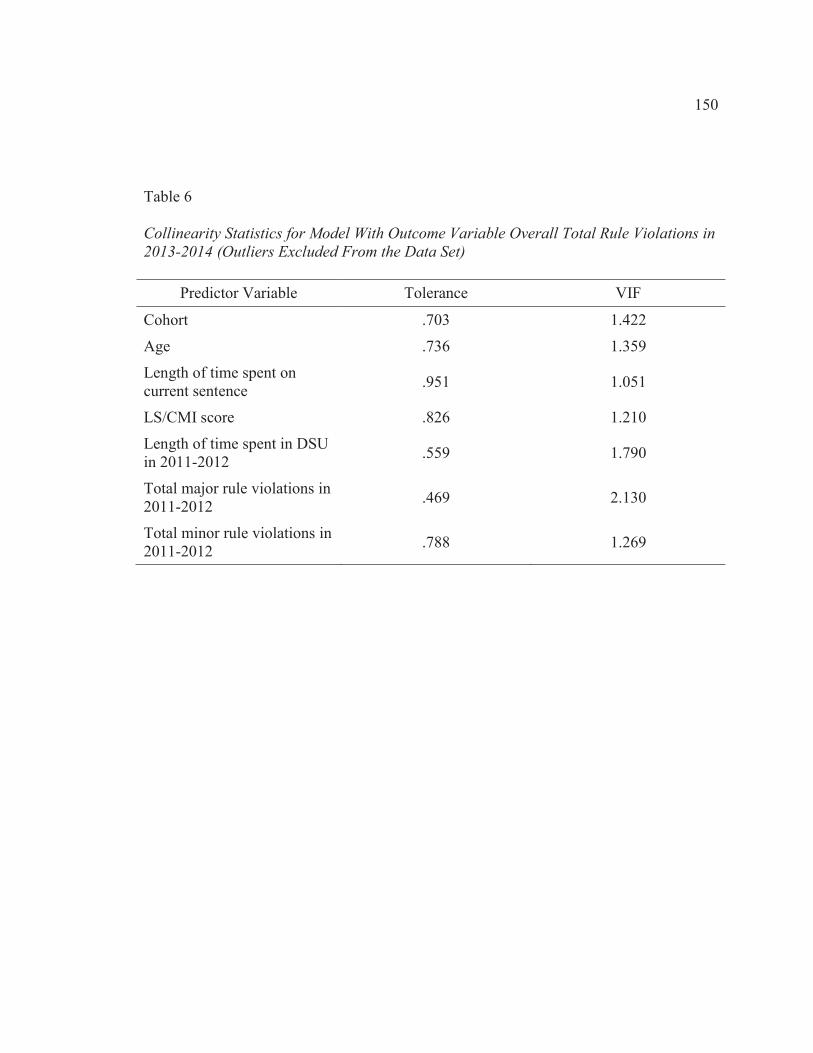
150
Table 6 Collinearity Statistics for Model With Outcome Variable Overall Total Rule Violations in 2013-2014 (Outliers Excluded From the Data Set)
Predictor Variable Tolerance VIF
Cohort .703 1.422
Age .736 1.359
Length of time spent on current sentence .951 1.051
LS/CMI score .826 1.210
Length of time spent in DSU in 2011-2012 .559 1.790
Total major rule violations in 2011-2012 .469 2.130
Total minor rule violations in 2011-2012 .788 1.269

151
Table 7 Collinearity Statistics for Model With Outcome Variable Overall Total Rule Violations in 2013-2014 (Full Data Set)
Predictor Variable Tolerance VIF
Cohort .731 1.367
Age .713 1.403
Length of time spent on current sentence .917 1.090
LS/CMI score .811 1.234
Length of time spent in DSU in 2011-2012 .595 1.681
Total major rule violations in 2011-2012 .432 2.315
Total minor rule violations in 2011-2012 .704 1.421

152
Table 8 Collinearity Statistics for Model With Outcome Variable Total Major Rule Violations in 2013-2014 (Outliers Excluded From the Data Set)
Predictor Variable Tolerance VIF
Cohort .703 1.422
Age .736 1.359
Length of time spent on current sentence .951 1.051
LS/CMI score .826 1.210
Length of time spent in DSU in 2011-2012 .559 1.790
Total major rule violations in 2011-2012 .469 2.130
Total minor rule violations in 2011-2012 .788 1.269

153
Table 9 Collinearity Statistics for Model With Outcome Variable Total Major Rule Violations in 2013-2014 (Full Data Set)
Predictor Variable Tolerance VIF
Cohort .731 1.367
Age .713 1.403
Length of time spent on current sentence .917 1.090
LS/CMI score .811 1.234
Length of time spent in DSU in 2011-2012 .595 1.681
Total major rule violations in 2011-2012 .432 2.315
Total minor rule violations in 2011-2012 .704 1.421
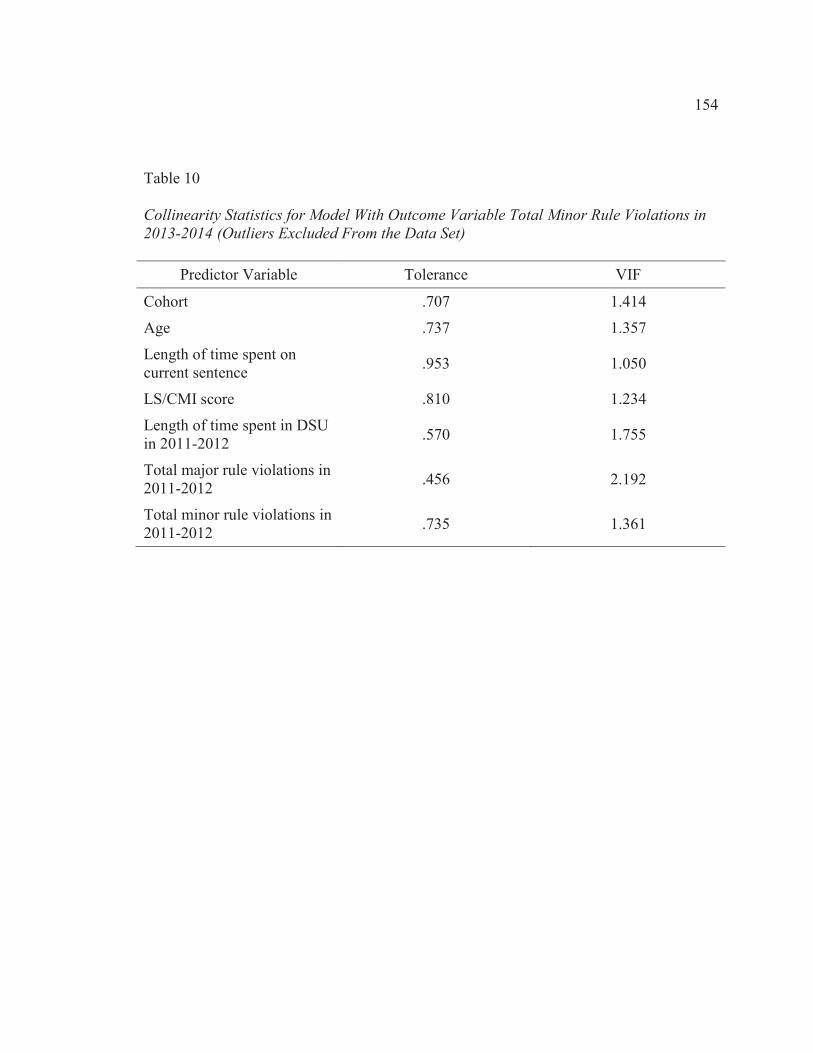
154
Table 10 Collinearity Statistics for Model With Outcome Variable Total Minor Rule Violations in 2013-2014 (Outliers Excluded From the Data Set)
Predictor Variable Tolerance VIF
Cohort .707 1.414
Age .737 1.357
Length of time spent on current sentence .953 1.050
LS/CMI score .810 1.234
Length of time spent in DSU in 2011-2012 .570 1.755
Total major rule violations in 2011-2012 .456 2.192
Total minor rule violations in 2011-2012 .735 1.361

155
Table 11 Collinearity Statistics for Model With Outcome Variable Total Minor Rule Violations in 2013-2014 (Full Data Set)
Predictor Variable Tolerance VIF
Cohort .731 1.367
Age .713 1.403
Length of time spent on current sentence .917 1.090
LS/CMI score .811 1.234
Length of time spent in DSU in 2011-2012 .595 1.681
Total major rule violations in 2011-2012 .432 2.315
Total minor rule violations in 2011-2012 .704 1.421
Data Collection
The data that were used in this study were archival and administrative data held
by the Oregon DOC. Data were gathered on all the Oregon DOC inmates who were
incarcerated from January 1, 2011, through December 31, 2014 in a facility or facilities
with a medium-security component. In particular, data regarding the inmates’ gender,
age, length of time spent incarcerated on current sentence, LS/CMI section 1 risk score,
prison misconduct history in 2011-2012, and their disciplinary segregation history were
gathered. The Oregon DOC Research and Evaluation Unit helped me collect and
organize the necessary data. The Research and Evaluation Unit developed and ran
computer codes that were then deployed to collect the data (J. Duncan, personal

156
communication, January 28, 2015). After compiling the data, the Research and
Evaluation Unit then delivered it to me in a Microsoft Excel spreadsheet format in July of
2015. I then uploaded the data into the SPSS computer program.
Results.
A multiple regression analysis was run on each of the three models. The primary
model that operationalized the dependent/outcome variable prison misconduct as the
overall total rule violations in 2013-2014 was analyzed first. The multiple regression
analysis was run twice using this model: once with the outliers removed from the data set,
and then a second time with the full data set (i.e., no outliers removed). This was done in
order to develop a fuller picture of the effect of disciplinary segregation on subsequent
prison misconduct and to facilitate a transparent analysis of the data. This same process
was then applied to the second model, which operationalized the dependent/outcome
variable prison misconduct as the total major rule violations in 2013-2014; and then again
with the third model that operationalized the dependent/outcome variable prison
misconduct as the total minor rule violations in 2013-2014. Multiple regression analysis
with bootstrapping using bias corrected and accelerated confidence intervals was used on
each of the models to deal with the violations of the assumptions of normality and
homogeneity of variances (Field, 2013, pp. 198–200, 350–352; Warner, 2013, pp. 657–
662).
Steps were carried out to discover the global effect size and the power of each of
the models. In addition, the local effect size for the independent/predictor variable cohort

157
was determined for each of the models. The global effect size was computed using the
Cohen’s f 2 statistic. The equation for that statistic is:
f 2 = (R2) / (1 R2)
(Selya, Rose, Dierker, Hedeker, & Mermelstein, 2012, p. 2; G*Power 3.1 Manual, 2014,
pp. 34–35; Cohen, 1988). In calculating this global effect size, the adjusted R2 value was
used. After determining the global effect size, the appropriate values were then inputted
into the G*Power application (version 3.1) (effect size f 2, -level, sample size, and
number of predictors) and a posthoc power analysis was conducted (Faul, Erdfelder,
Lang, & Buchner, 2007; Faul, Erdfelder, Buchner, & Lang, 2009). Because multiple
significance tests were performed, the -level was set at 0.008 using the Bonferroni
corrected method, in order to obtain a conservative power estimate. The equation for the
Bonferroni corrected method is:
PC = EW /k
where EW is the -level for the whole study (here, = .05), “and k is the number of
significance tests performed in the entire [] study” (Warner, 2013, pp. 89–99, 101, 565).
Here, there were three models tested, and each model was tested once with outliers
removed and then once without the outliers removed, for a total of six multiple regression
analyses.
For each of the analyses, the local effect size of the predictor cohort was also
calculated (sr2). This was calculated by squaring the part correlation associated with that
specific variable (Warner, 2013, pp. 569, 579).

158
Multiple Regression and Overall Total Rule Violations
Multiple regression and overall total rule violations with outliers removed.
The number of overall total rule violations in 2013-2014 were predicted from the
following variables: cohort (coded 0 = comparison cohort, 1 = treatment cohort), age,
length of time spent on current sentence, LS/CMI risk score, total major rule violations in
2011-2012, total minor rule violations in 2011-2012, and length of time spent in
disciplinary segregation during 2011-2012. The total N for this sample was 228; 21
outlier cases were removed and, therefore, for this analysis, N = 207.
Standard multiple regression was performed; that is, all predictor variables were
entered in one step. Results for this standard multiple regression are summarized in
Table 12. The overall regression, including all seven predictors, was statistically
significant, R = 0.646, R2 = 0.417, adjusted R2 = 0.397, F(7, 199) = 20.365, p < .001. The
positive slope (b = 0.720) for cohort indicated that higher scores on cohort (i.e., being in
the treatment cohort) predicted higher numbers of overall total rule violations; however,
since the bootstrap confidence interval included zero ( 0.249, 1.647), this “positive”
predictive relationship between disciplinary segregation and overall total rule violations
may not be genuine. More importantly, the predictive relation of cohort to overall total
rule violations was not significant, p = .156. The results of this model indicated that
disciplinary segregation is not a significant predictor of subsequent misconduct. This
result therefore suggests that the experience of disciplinary segregation does not affect
subsequent overall prison misconduct. In other words, this result suggests that

159
disciplinary segregation neither decreases nor increases subsequent overall prison
misconduct among those inmates subjected to it (i.e., it has a null effect).
The global effect size for this model was f 2 = 0.658. An analysis of the model
using the G*Power application revealed that the power for this test was about 1.000.
The local effect size of the independent/predictor variable cohort was also
calculated. For this model, the proportion of variance uniquely explained by the
predictor cohort was sr2 = .002.

160
Table 12 Linear Model of Predictors of Overall Total Rule Violations in 2013-2014 (Outliers Excluded From the Data Set)
b SE B β p Part Correlation
Constant 1.226 ( 0.830, 3.150) 1.176 p = .309
Cohort 0.720 ( 0.249, 1.647) 0.502 .054 p = .156 .046
Age 0.059 ( 0.109, 0.001) 0.028 .119 p = .039 .102
Length of time spent on current sentence
7.376E-005 (0.000, 0.001) 0.000 .015 p = .752 .015
LS/CMI score 0.066 ( 0.011, 0.150) 0.038 .098 p = .092 .089
Days spent in DSU in 2011-2012
0.001 ( 0.009, 0.007)
0.004 .027 p = .783 .020
Total major rule violations in 2011-2012
0.363 (0.181, 0.549) 0.095 .416 p < .001 .285
Total minor rule violations in 2011-2012
0.832 (0.234, 1.424) 0.290 .207 p = .003 .184
Note. 95% bias corrected and accelerated confidence intervals reported in parentheses; Confidence intervals and standard errors based on 2000 bootstrap samples.
Multiple regression and overall total rule violations with full data set. The
number of overall total rule violations in 2013-2014 were predicted from the following
variables: cohort (coded 0 = comparison cohort, 1 = treatment cohort), age, length of time
spent on current sentence, LS/CMI risk score, total major rule violations in 2011-2012,
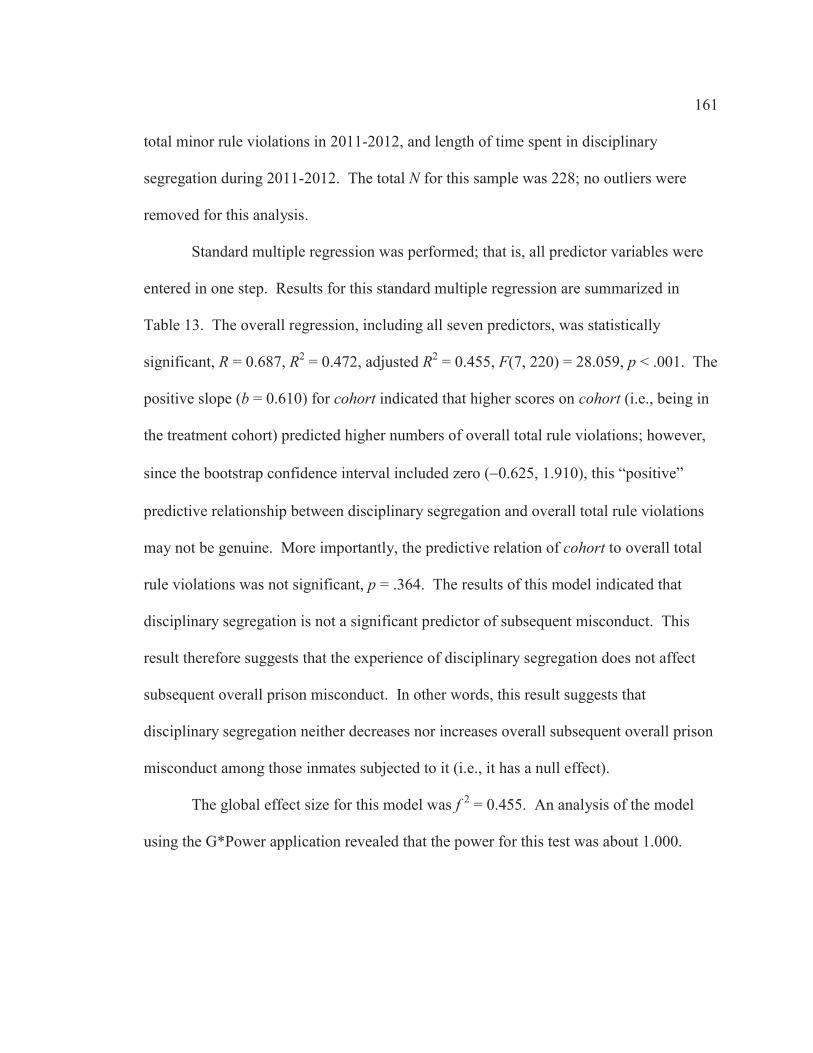
161
total minor rule violations in 2011-2012, and length of time spent in disciplinary
segregation during 2011-2012. The total N for this sample was 228; no outliers were
removed for this analysis.
Standard multiple regression was performed; that is, all predictor variables were
entered in one step. Results for this standard multiple regression are summarized in
Table 13. The overall regression, including all seven predictors, was statistically
significant, R = 0.687, R2 = 0.472, adjusted R2 = 0.455, F(7, 220) = 28.059, p < .001. The
positive slope (b = 0.610) for cohort indicated that higher scores on cohort (i.e., being in
the treatment cohort) predicted higher numbers of overall total rule violations; however,
since the bootstrap confidence interval included zero ( 0.625, 1.910), this “positive”
predictive relationship between disciplinary segregation and overall total rule violations
may not be genuine. More importantly, the predictive relation of cohort to overall total
rule violations was not significant, p = .364. The results of this model indicated that
disciplinary segregation is not a significant predictor of subsequent misconduct. This
result therefore suggests that the experience of disciplinary segregation does not affect
subsequent overall prison misconduct. In other words, this result suggests that
disciplinary segregation neither decreases nor increases overall subsequent overall prison
misconduct among those inmates subjected to it (i.e., it has a null effect).
The global effect size for this model was f 2 = 0.455. An analysis of the model
using the G*Power application revealed that the power for this test was about 1.000.

162
The local effect size of the independent/predictor variable cohort was also
calculated. For this model, the proportion of variance uniquely explained by the
predictor cohort was sr2 = 5.76E-4.
Table 13 Linear Model of Predictors of Overall Total Rule Violations in 2013-2014 (Full Data Set)
b SE B β p Part Correlation
Constant 2.217 ( 8.137, 2.507)
2.508 p = .405
Cohort 0.610 ( 0.625, 1.910) 0.672 .028 p = .364 .024
Age 0.014 ( 0.094, 0.073) 0.045 .018 p = .757 .015
Length of time spent on current sentence
0.000 ( 0.001, 0.001) 0.000 .024 p = .744 .023
LS/CMI score 0.136 (0.036, 0.252) 0.053 .131 p = .017 .118
Days spent in DSU in 2011-2012
0.008 ( 0.019, 0.001)
0.005 .139 p = .109 .107
Total major rule violations in 2011-2012
0.566 (0.304, 0.871) 0.139 .502 p = .001 .330
Total minor rule violations in 2011-2012
1.157 (0.585, 1.743) 0.314 .263 p = .002 .221
Note. 95% bias corrected and accelerated confidence intervals reported in parentheses; Confidence intervals and standard errors based on 2000 bootstrap samples.

163
Multiple Regression and Total Major Rule Violations
Multiple regression and total major rule violations with outliers removed.
The number of total major rule violations in 2013-2014 were predicted from the
following variables: cohort (coded 0 = comparison cohort, 1 = treatment cohort), age,
length of time spent on current sentence, LS/CMI risk score, total major rule violations in
2011-2012, total minor rule violations in 2011-2012, and length of time spent in
disciplinary segregation during 2011-2012. The total N for this sample was 228; 21
outlier cases were removed and, therefore, for this analysis, N = 207.
Standard multiple regression was performed; that is, all predictor variables were
entered in one step. Results for this standard multiple regression are summarized in
Table 14. The overall regression, including all seven predictors, was statistically
significant, R = 0.632, R2 = 0.400, adjusted R2 = 0.379, F(7, 199) = 18.939, p < .001. The
positive slope (b = 0.499) for cohort indicated that higher scores on cohort (i.e., being in
the treatment cohort) predicted higher numbers of overall total rule violations; however,
since the bootstrap confidence interval included zero ( 0.423, 1.390), this “positive”
predictive relationship between disciplinary segregation and total major rule violations
may not be genuine. More importantly, the predictive relation of cohort to total major
rule violations was not significant, p = .279. The results of this model indicate that
disciplinary segregation is not a significant predictor of subsequent major misconduct.
This result therefore suggests that the experience of disciplinary segregation does not
affect subsequent major-level prison misconduct. In other words, this result suggests that

164
disciplinary segregation neither decreases nor increases subsequent major-level prison
misconduct among those inmates subjected to it (i.e., it has a null effect).
The global effect size for this model was f 2 = 0.379. An analysis of the model
using the G*Power application revealed that the power for this test was about 1.000.
The local effect size of the independent/predictor variable cohort was also
calculated. For this model, the proportion of variance uniquely explained by the
predictor cohort was sr2 = .001.

165
Table 14 Linear Model of Predictors of Total Major Rule Violations in 2013-2014 (Outliers Excluded From the Data Set)
b SE B β p Part Correlation
Constant 1.585 ( 0.423, 3.389) 1.095 p = .153
Cohort 0.499 ( 0.423, 1.390) 0.461 .043 p = .279 .036
Age 0.063 ( 0.111, 0.005) 0.026 .143 p = .018 .122
Length of time spent on current sentence
0.000 (0.000, 0.001) 0.000 .028 p = .559 .027
LS/CMI score 0.051 ( 0.018, 0.128) 0.036 .086 p = .160 .078
Days spent in DSU in 2011-2012
4.045E-005 ( 0.006, 0.007) 0.003 .001 p = .990 .001
Total major rule violations 2011-2012
0.315 (0.163, 0.466) 0.083 .407 p < .001 .279
Total minor rule violations in 2011-2012
0.611 (0.056, 1.190) 0.265 .172 p = .020 .152
Note. 95% bias corrected and accelerated confidence intervals reported in parentheses; Confidence intervals and standard errors based on 2000 bootstrap samples.
Multiple regression and total major rule violations with full data set. The
number of total major rule violations in 2013-2014 were predicted from the following
variables: cohort (coded 0 = comparison cohort, 1 = treatment cohort), age, length of time
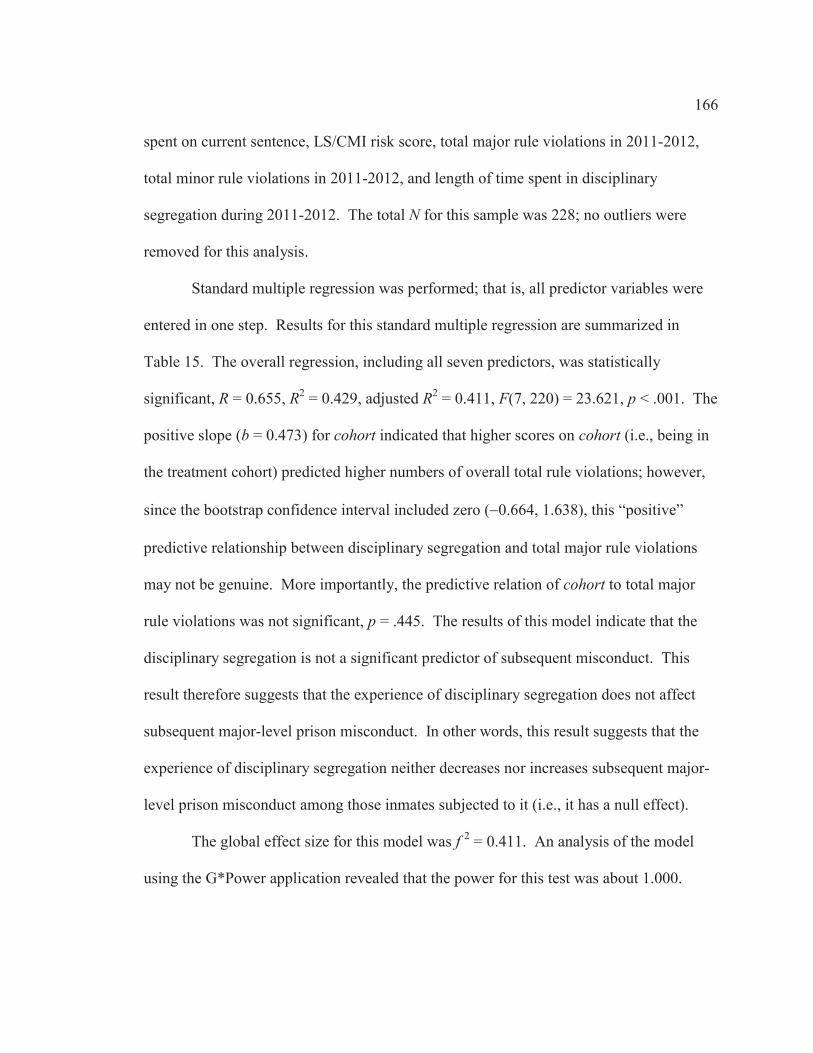
166
spent on current sentence, LS/CMI risk score, total major rule violations in 2011-2012,
total minor rule violations in 2011-2012, and length of time spent in disciplinary
segregation during 2011-2012. The total N for this sample was 228; no outliers were
removed for this analysis.
Standard multiple regression was performed; that is, all predictor variables were
entered in one step. Results for this standard multiple regression are summarized in
Table 15. The overall regression, including all seven predictors, was statistically
significant, R = 0.655, R2 = 0.429, adjusted R2 = 0.411, F(7, 220) = 23.621, p < .001. The
positive slope (b = 0.473) for cohort indicated that higher scores on cohort (i.e., being in
the treatment cohort) predicted higher numbers of overall total rule violations; however,
since the bootstrap confidence interval included zero ( 0.664, 1.638), this “positive”
predictive relationship between disciplinary segregation and total major rule violations
may not be genuine. More importantly, the predictive relation of cohort to total major
rule violations was not significant, p = .445. The results of this model indicate that the
disciplinary segregation is not a significant predictor of subsequent misconduct. This
result therefore suggests that the experience of disciplinary segregation does not affect
subsequent major-level prison misconduct. In other words, this result suggests that the
experience of disciplinary segregation neither decreases nor increases subsequent major-
level prison misconduct among those inmates subjected to it (i.e., it has a null effect).
The global effect size for this model was f 2 = 0.411. An analysis of the model
using the G*Power application revealed that the power for this test was about 1.000.

167
The local effect size of the independent/predictor variable cohort was also
calculated. For this model, the proportion of variance uniquely explained by the
predictor cohort was sr2 = 4.41E-4.
Table 15 Linear Model of Predictors of Total Major Rule Violations in 2013-2014 (Full Data Set)
b SE B β p Part Correlation
Constant 1.746 ( 7.535, 2.675)
2.425 p = .497
Cohort 0.473 ( 0.664, 1.638) 0.626 .024 p = .445 .021
Age 0.019 ( 0.098, 0.065) 0.043 .027 p = .662 .023
Length of time spent on current sentence
0.000 (0.000, 0.001) 0.000 .036 p = .659 .034
LS/CMI score 0.119 (0.025, 0.230) 0.051 .127 p = .025 .114
Days spent in DSU in 2011-2012
0.007 ( 0.017, 0.001) 0.005 .130 p = .155 .100
Total major rule violations in 2011-2012
0.513 (0.273, 0.800) 0.129 .504 p = .001 .331
Total minor rule violations in 2011-2012
0.847 (0.321, 1.433) 0.300 .213 p = .007 .179
Note. 95% bias corrected and accelerated confidence intervals reported in parentheses; Confidence intervals and standard errors based on 2000 bootstrap samples.

168
Multiple Regression and Total Minor Rule Violations
Multiple regression and total minor rule violations with outliers removed.
The number of total minor rule violations in 2013-2014 were predicted from the
following variables: cohort (coded 0 = comparison cohort, 1 = treatment cohort), age,
length of time spent on current sentence, LS/CMI risk score, total major rule violations in
2011-2012, total minor rule violations in 2011-2012, and length of time spent in
disciplinary segregation during 2011-2012. The total N for this sample was 228; 19
outlier cases were removed and, therefore, for this analysis, N = 209.
Standard multiple regression was performed; that is, all predictor variables were
entered in one step. Results for this standard multiple regression are summarized in
Table 16. The overall regression, including all seven predictors, was statistically
significant, R = 0.505, R2 = 0.255, adjusted R2 = 0.229, F(7, 201) = 9.847, p < .001. The
positive slope (b = 0.138) for cohort indicated that higher scores on cohort (i.e., being in
the treatment cohort) predicted higher numbers of overall total rule violations; however,
since the bootstrap confidence interval included zero ( 0.102, 0.366), this “positive”
predictive relationship between disciplinary segregation and total minor rule violations
may not be genuine. More importantly, the predictive relation of cohort to total minor
rule violations was not significant, p = .246. The results of this model indicate that
disciplinary segregation is not a significant predictor of subsequent misconduct. This
result therefore suggests that the experience of disciplinary segregation does not affect
subsequent minor-level prison misconduct. In other words, this result suggests that the

169
experience of disciplinary segregation neither increases nor decreases subsequent minor-
level prison misconduct among those inmates subjected to it (i.e., it has a null effect).
The global effect size for this model was f 2 = 0.229. An analysis of the model
using the G*Power application revealed that the power for this test was about 0.9999.
The local effect size of the independent/predictor cohort was also calculated. For
this model, the proportion of variance uniquely explained by the predictor cohort was sr2
= .002.
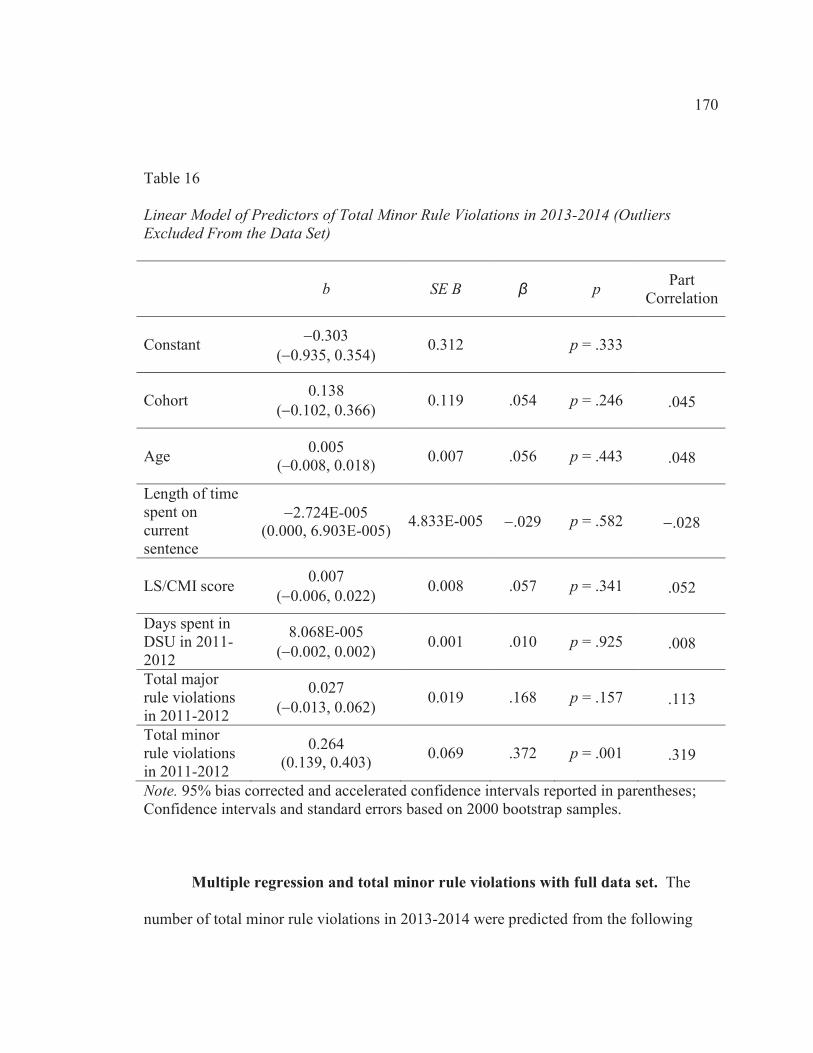
170
Table 16 Linear Model of Predictors of Total Minor Rule Violations in 2013-2014 (Outliers Excluded From the Data Set)
b SE B β p Part Correlation
Constant 0.303 ( 0.935, 0.354)
0.312 p = .333
Cohort 0.138 ( 0.102, 0.366) 0.119 .054 p = .246 .045
Age 0.005 (–0.008, 0.018) 0.007 .056 p = .443 .048
Length of time spent on current sentence
2.724E-005 (0.000, 6.903E-005) 4.833E-005 .029 p = .582 .028
LS/CMI score 0.007 ( 0.006, 0.022) 0.008 .057 p = .341 .052
Days spent in DSU in 2011-2012
8.068E-005 ( 0.002, 0.002) 0.001 .010 p = .925 .008
Total major rule violations in 2011-2012
0.027 ( 0.013, 0.062) 0.019 .168 p = .157 .113
Total minor rule violations in 2011-2012
0.264 (0.139, 0.403) 0.069 .372 p = .001 .319
Note. 95% bias corrected and accelerated confidence intervals reported in parentheses; Confidence intervals and standard errors based on 2000 bootstrap samples.
Multiple regression and total minor rule violations with full data set. The
number of total minor rule violations in 2013-2014 were predicted from the following

171
variables: cohort (coded 0 = comparison cohort, 1 = treatment cohort), age, length of time
spent on current sentence, LS/CMI risk score, total major rule violations in 2011-2012,
total minor rule violations in 2011-2012, and length of time spent in disciplinary
segregation during 2011-2012. The total N for this sample was 228; no outliers were
removed for this analysis.
Standard multiple regression was performed; that is, all predictor variables were
entered in one step. Results for this standard multiple regression are summarized in
Table 17. The overall regression, including all seven predictors, was statistically
significant, R = 0.591, R2 = 0.349, adjusted R2 = 0.328, F(7, 220) = 16.843, p < .001. The
positive slope (b = 0.137) for cohort indicated that higher scores on cohort (i.e., being in
the treatment cohort) predicted higher numbers of overall total rule violations; however,
since the bootstrap confidence interval included zero ( 0.104, 0.440), this “positive”
predictive relationship between disciplinary segregation and total minor rule violations
may not be genuine. More importantly, the predictive relation of cohort to total minor
rule violations was not significant, p = .314. The results of this model indicate that
disciplinary segregation is not a significant predictor of subsequent misconduct. This
result therefore suggests that the experience of disciplinary segregation does not affect
subsequent minor-level prison misconduct. In other words, this result suggests that the
experience of disciplinary segregation neither increases nor decreases subsequent minor-
level prison misconduct among those inmates subjected to it (i.e., it has a null effect).
The global effect size for this model was f 2 = 0.328. An analysis of the model
using the G*Power application revealed that the power for this test was about 1.000.

172
The local effect size of the independent/predictor variable cohort was also
calculated. For this model, the proportion of variance uniquely explained by the
predictor cohort was sr2 = .001.
Table 17 Linear Model of Predictors of Total Minor Rule Violations in 2013-2014 (Full Data Set)
b SE B β p Part Correlation
Constant 0.471 ( 1.099, 0.156)
0.296 p = .113
Cohort 0.137 ( 0.104, 0.440) 0.137 .037 p = .314 .032
Age 0.005 ( 0.008, 0.017) 0.007 .039 p = .439 .033
Length of time spent on current sentence
4.642E-005 (0.000, 3.250E-005) 4.134E-005 .045 p = .251 .043
LS/CMI score 0.017 (0.001, 0.036) 0.010 .096 p = .082 .086
Days spent in DSU in 2011-2012
0.001 (–0.003, 0.000) 0.001 .127 p = .159 .098
Total major rule violations in 2011-2012
0.053 (0.011, 0.102) 0.023 .271 p = .018 .178
Total minor rule violations in 2011-2012
0.310 (0.182, 0.416) 0.067 .409 p < .001 .343
Note. 95% bias corrected and accelerated confidence intervals reported in parentheses; Confidence intervals and standard errors based on 2000 bootstrap samples.

173
Summary
For each of the models, the variable cohort did not significantly predict
subsequent prison misconduct. This was the case for each of the models regardless of
whether outliers were included in the data set or excluded from the data set. Specifically,
the variable cohort did not significantly predict overall total rule violations, nor did it
significantly predict total major rule violations, nor did it significantly predict total minor
rule violations.
These results can be analyzed in light of the following research questions and null
hypotheses that were addressed in this study:
RQ1: Does deterrence theory explain the relationship between the experience of
disciplinary segregation and subsequent prison misconduct among inmates, after
controlling for the effects of gender, age, length of time spent incarcerated on current
sentence, LS/CMI risk score, prior major rule violations in 2011-2012, prior minor rule
violations in 2011-2012, and length of time spent in disciplinary segregation in 2011-
2012?
The results suggest that deterrence theory does not explain the relationship
between the experience of disciplinary segregation and subsequent prison
misconduct among inmates.
RQ2: Does the experience of disciplinary segregation reduce subsequent prison
misconduct among inmates who are subjected to it, and if so, to what extent?
The results suggest that the experience of disciplinary segregation does not reduce
subsequent prison misconduct among those inmates subjected to it.
174
RQ3: Does the experience of disciplinary segregation have a criminogenic effect on
inmates who are subjected to it?
The results suggest that the experience of disciplinary segregation does not
increase subsequent prison misconduct among those inmates subjected to it.
NH1: The independent/predictor variable cohort does not significantly predict prison
misconduct.
The results indicate that this hypothesis should not be rejected. The variable
cohort did not significantly predict prison misconduct.
NH2: The level of the independent/predictor variable cohort that indicates membership
in the cohort comprised of those who have spent time in disciplinary segregation (the
treatment cohort) does not significantly negatively predict prison misconduct.
The results indicate that this hypothesis should not be rejected. The variable
cohort did not significantly negatively predict prison misconduct.
NH3: The level of the independent/predictor variable cohort that indicates membership
in the cohort comprised of those who have spent time in disciplinary segregation (the
treatment cohort) does not significantly positively predict prison misconduct.
The results indicate that this hypothesis should not be rejected. The variable
cohort did not significantly positively predict prison misconduct.

175
Chapter 5: Discussion, Conclusions, and Recommendations
Introduction
The purpose of this quantitative study was to examine the effectiveness of
disciplinary segregation in deterring prison inmate misconduct within the Oregon DOC
prison system. Specifically, the purpose of this retrospective observational study was to
test the theory of deterrence that relates disciplinary segregation to prison misconduct.
The results of the multiple regression analyses for this study showed that the
variable cohort did not significantly predict prison misconduct. The results suggested
that the experience of disciplinary segregation does not decrease or increase subsequent
prison misconduct among those inmates subjected to it in a statistically significant
manner, showing that it has a null effect. This result was consistent throughout the
testing of the different models.
In general, the study results were not statistically significant. The primary model
operationalized the outcome variable as overall total prison rule violations in 2013-2014,
and the analyses revealed that the variable cohort did not significantly predict prison
misconduct. This was the result regardless of whether outliers were excluded or included
within the data set. The model that operationalized the outcome variable as total major
rule violations in 2013-2014 also found that the variable cohort did not significantly
predict prison misconduct, regardless of whether outliers were included in the data or
excluded from the data. The model that operationalized the outcome variable as total
minor rule violations in 2013-2014 also found that the variable cohort did not
significantly predict prison misconduct, regardless of whether outliers were included or
176
excluded from the data set. All of these results suggest that the experience of disciplinary
segregation does not significantly affect subsequent prison misconduct among those
inmates subjected to it. Put another way: These results suggest that the experience of
disciplinary segregation does not significantly increase or decrease subsequent prison
misconduct among those inmates subjected to it.
Interpretation of Findings
The results of this study suggest that deterrence theory does not explain the
relationship between the experience of disciplinary segregation and subsequent prison
misconduct among those inmates subjected to it. In essence, the findings of this study do
not support the deterrence hypothesis. Just as Lynch (1999), Kovandzic and Vieraitis
(2006), and DeFina and Arvanites (2002) found “little or no significant relationship”
(Kovandzic & Vieraitis, 2002, p. 227) between incarceration rates and crime rates, this
study similarly found no significant relationship between the experience of disciplinary
segregation and subsequent prison misconduct among those subjected to it. This is in
contrast to other studies such as Levitt (1996, 2004) and Marvell and Moody (1994), who
found a negative relationship between the incarceration rate and the crime rate (e.g., an
increase in the incarceration rate decreased the crime rate).
The findings of Nagin, Cullen, and Jonson (2009) and Bales and Piquero (2012)
indicated that custodial sanctions (e.g., incarceration) may have a criminogenic effect
when compared to noncustodial sanctions. In contrast, the results of this present study did
not indicate that the experience of disciplinary segregation had a criminogenic effect on
subsequent behavior. Dölling, Entorf, Hermann, and Rupp’s (2009) meta-analysis of 700

177
deterrence studies found that for 50.5% of those studies, the deterrent effect estimate was
not significant, whereas for 41.7% of the studies the deterrent effect estimate was
significant and supported the deterrence hypothesis, and for 7.8% of the studies the
deterrent effect estimate was significant and did not support the deterrence hypothesis.
Similarly to those studies in the 50.5% category in which the deterrent effect estimate
was not significant, here in this study the effect of the experience of disciplinary
segregation on subsequent prison misconduct was also not significant. Dölling, Entorf,
Hermann, and Rupp’s meta-analysis also revealed that deterrent effects are more
pervasive for property and administrative-type offenses, as opposed to serious and violent
crimes. This suggests that even if the experience of disciplinary segregation does not
decrease subsequent major rule violations, it may however decrease subsequent minor
rule violations. However, the results of this dissertation study suggested that the
experience of disciplinary segregation does not actually decrease minor rule violations to
a significant extent.
The results of this present study are generally aligned with some of the previous
research on segregation and its relationship with deterrence. Barak-Glantz (1983) found
that solitary confinement had only a “minimal” deterrent effect on inmates (p. 36). The
overall results of the Briggs, Sundt, and Castellano (2003) study on whether supermax
prisons reduced prison violence did not support the deterrence hypothesis. The research
by Mears and Bales (2009) indicated that supermax incarceration did not reduce
recidivism. In addition, the results of the study by Motiuk and Blanchette (2001) on
Canadian segregation and recidivism also did not support the deterrence theory (in fact,

178
their results suggested that segregation may have a criminogenic effect on subsequent
offending). The results of these studies did not support the deterrence hypothesis in the
segregation context. Similarly, the present study also failed to reveal evidence supporting
the hypothesis that segregation has a deterrent effect on those subjected to it. Overall, the
results of this study on segregation and prison inmate misconduct did not support the
deterrence hypothesis, just as the findings of several other types of studies, including
some focused on incarceration and crime, custodial sanctions, and segregation and
recidivism, also did not support the deterrence hypothesis.
Alternative Criminal Behavior Theories
This study was specifically designed to explore whether deterrence theory
explained the relation between the experience of disciplinary segregation and subsequent
misconduct among those subjected to it. It was not designed to test other criminal
behavior theories. However, since the findings of this study suggest that deterrence
theory does not explain the relation between the experience of disciplinary segregation
and subsequent prison misconduct, another different criminal behavior theory or theories
may instead explain these results. A brief discussion of some of these other theories of
criminal behavior that could potentially explain the results of this study is provided as an
aid to future research.
Disciplinary segregation may have a null effect due to certain influencing factors,
or alternatively its deterrent effect might be masked by other stronger influencing factors.
Some of these potential factors influencing the subsequent behavior of inmates after
spending time in disciplinary segregation may be explained by social learning theory.

179
Social learning theory holds that an individual may engage in criminal behavior due to
receiving rewards for engaging in criminal behavior, acting in imitation of others, and/or
acting in accordance with a certain beliefs or attitudes that they hold (Akers & Jennings,
2009). In the disciplinary segregation/prison misconduct context, disciplinary
segregation may not have an effect on subsequent misconduct because inmates are acting
pursuant to an overriding anti-institutional attitude. Another possibility under social
learning theory is that the inmate is acting in imitation of another when committing rule
violations. Or, the inmate may have received some reward (e.g., recognition and esteem)
in the past for committing rule violations and/or spending time in disciplinary
segregation.
Other theories offer alternate explanations. Under self-control theory, subsequent
prison misconduct following disciplinary segregation may simply be due to an inmate’s
lack of self-control (Gottfredson & Hirschi, 1990; Pratt & Cooper, 2009). Under social-
control theory, subsequent behavior following disciplinary segregation may be primarily
influenced by the strength of the social bond between the inmate and society, and a weak
bond with society may lead to subsequent misconduct (Schreck & Hirschi, 2009). Under
strain theory, subsequent behavior following disciplinary segregation may be primarily
influenced by the presence or nonpresence of certain stressors, and therefore subsequent
prison misconduct may be due to certain stressors being present in an inmate’s life
(Agnew, 2009). Defiance theory could also explain subsequent behavior following
disciplinary segregation, especially if the inmate viewed the punishment as unfair (Bales
& Piquero, 2012, p. 72, n. 1; Bouffard & Piquero, 2010; Sherman, 1993). Furthermore,

180
under the biosocial perspective, the subsequent behavior of an inmate following spending
time in disciplinary segregation may be due to a biological predisposition towards certain
behavior, or may be due to a combination of biological predisposition and other
sociological and environmental factors (Boisvert, 2015; Crews, 2009). These are just
some of the theories that could potentially explain the results of this study.
Limitations of the Study
The conclusions that may be drawn from this present study are circumscribed by
several limitations. These limitations include possible selection bias, the design of the
study, and the possible influence of external variables. Selection bias refers to a situation
where two cohorts have pretreatment differences that result in them being noncomparable
groups (e.g., comparing apples to oranges) (Rosenbaum, 1989, p. 1024). Here, selection
bias may have been present within this study in that the treatment group may have been
more naturally predisposed to committing rule violations than the comparison group.
The study attempted to reduce the effect selection bias may have had on the results by
using multiple regression analysis to control for other factors that have been found to be
related to prison misconduct, such as age, LS/CMI risk score, prior prison misconduct,
and length of time spent on current sentence.
The design of the study is also an issue. The study utilized multiple regression
analyses, which limits the conclusions that can be drawn from the results of the study.
Results from multiple regression analyses do not provide “proof of causality” (Warner,
2013, p. 556). Instead, the results can only suggest the possibility of causality. In other
words, the strength of the inferences that may be drawn from the findings is limited.

181
Another limitation with regard to the design of the study was the sample. There were 37
participants in the comparison cohort and 191 in the treatment cohort. Perhaps the results
of the analyses would have been different if the two cohorts were more balanced in terms
of the number of participants in each cohort.
Another design issue may be the choice of the control/predictor variables that
were included in the study. Only major rule violations may be punished by disciplinary
segregation, minor rule violations by themselves and unaccompanied by major rule
violations may not be punished by disciplinary segregation (Or. Admin. R. 291-105-005
et seq.). Given this fact, the control/predictor variable prior major rule violations in
2011-2012 and the independent/predictor variable cohort may have been targeting the
same phenomenon. This is because each of the participants in the treatment cohort was
placed in that cohort because they had spent time in disciplinary segregation in 2011-
2012, as punishment for a major rule violation within that same timeframe. However, in
response to this critique, it should be noted that not all major rule violations are punished
by disciplinary segregation. The choice of disciplinary segregation as punishment is
based upon the severity of the rule violation and the inmate’s prior misconduct history,
among other considerations (Or. Admin. R. 291-105-005 et seq.).
The inclusion of the variable length of time spent in disciplinary segregation in
2011-2012 may also be a weakness in the study. This is because it could be argued that
there is no research or theoretical basis upon which to justify its inclusion (Field, 2013, p.
321; Warner, 2013, p. 548). Furthermore, with regard to the selection of variables, of the
seven predictor variables used in the study, only a few significantly predicted the prison

182
misconduct outcome variable. Out of the six multiple regression analyses, only age,
LS/CMI risk score, total major rule violations in 2011-2012, and total minor rule
violations in 2011-2012 sometimes significantly predicted the prison misconduct
outcome variable. Age significantly predicted overall total rule violations in 2013-2014
(outliers deleted) at the .05 -level (p = .039), and total major rule violations in 2013-
2014 (outliers deleted) at the .05 -level (p = .018). LS/CMI risk score significantly
predicted overall total rule violations in 2013-2014 (full data set) at the .017 -level (p
= .017), and total major rule violations in 2013-2014 (outliers deleted) at the .05 -level
(p = .025). Total major rule violations in 2011-2012 significantly predicted the prison
misconduct outcome variable at the p < .008 -level for each of the multiple regression
analyses except for total minor rule violations in 2013-2014 (outliers deleted) and total
minor rule violations in 2013-2014 (full data set). Total major rule violations in 2011-
2012 did not significantly predict total minor rule violations in 2013-2014 (outliers
deleted), but did significantly predict total minor rule violations in 2013-2014 (full data
set) at the .05 -level (p < .018). For each of the six multiple regression analyses, total
minor rule violations in 2011-2012 significantly predicted the prison misconduct outcome
variable at the p < .008 -level; except for the outcome variable total major rule
violations in 2013-2014 (outliers deleted), although it significantly predicted that
outcome variable at the .05 -level (p = .020).
Another limitation is that external variables not accounted for within the study
may have influenced the results. The aim of the design of the study was to control for
183
variables that may influence prison misconduct and isolate the effect the experience of
disciplinary segregation may have had on subsequent misconduct. However, there may
be variables that influenced the results that were not included in the study. In essence,
the design of the study may have failed to isolate the effect, if any, of the experience of
disciplinary segregation on subsequent misconduct.
It should also be noted that it appears that this might be the first study to directly
examine whether the experience of disciplinary segregation affects subsequent prison
inmate misconduct. The findings and results should be interpreted within that context.
More research is needed in order to develop a full and accurate assessment of the effect
that the experience of disciplinary segregation may have on subsequent prison inmate
misconduct.
Other Considerations
Regardless of whether or not the experience of disciplinary segregation is
effective at reducing the subsequent misconduct among those subjected to it, it may serve
other beneficial purposes that should be kept in mind. For example, disciplinary
segregation could serve the purposes of retribution and just deserts. Furthermore, and
perhaps more importantly, the institution of disciplinary segregation may serve as a
general deterrent to other prisoners, and may prevent them from engaging in prison
misconduct (or at least limit their misconduct). Disciplinary segregation could
hypothetically have both a deterrent effect on the general population, and a criminogenic
effect on those directly subjected to it; the two possible results are not mutually exclusive
(Nagin, Cullen, & Jonson, 2009, p. 132). Even if later studies show that the experience

184
of disciplinary segregation may increase subsequent prison inmate misconduct, a fair
evaluation of disciplinary segregation should involve an analysis of both the potential
costs (e.g., a criminogenic effect on those subjected to it), with the potential benefit (e.g.,
a general deterrent effect on the general inmate population). Zimring and Hawkins
(1973) point out that “some methods of punishment . . . may themselves be criminogenic.
Insofar as this is the case the preventive effect of punishment on other potential offenders
has to be weighed against the possible criminogenic effect on the offender” (p. 43). In
addition, the potential benefits of disciplinary segregation are not necessarily limited to
behavior modification. Disciplinary segregation might be used to remove a dangerous or
troublesome inmate from the general inmate population in order to promote the well-
being and safety of the inmate population and correctional staff, as well as facilitate the
smooth operation of the institution. Arguably, these benefits could also be achieved
through the use of administrative segregation, but nonetheless such benefits may be
realized through the practice of disciplinary segregation as well.
Recommendations
More research should be performed in order to develop a full and accurate picture
of the effect of disciplinary segregation on prison misconduct. It is especially important
to understand whether disciplinary segregation has a general deterrent effect. To that
end, two similar prisons could be examined, one that practices disciplinary segregation
and one that does not, and then the prison rule violation rates of the two prisons could be
compared and contrasted. This could also take the form of a longitudinal study, where a
single prison’s rule violation rates for multiple years are compared; for example, where

185
the rule violation rate of a past year when disciplinary segregation was practiced is
compared to the rule violation rate of a year when disciplinary segregation was not
practiced.
Another potential avenue for future research is that of obtaining information on
disciplinary segregation directly from the inmates themselves. This could take the form
of administering surveys to the inmates, or even conducting interviews. The information
could be gathered from both the general inmate population, as well as from inmates who
were recently released from disciplinary segregation. The inmates who had spent time in
disciplinary segregation could be asked how they felt their experience will affect their
subsequent behavior, and the general population inmates could be asked how they felt the
possibility of being sent to disciplinary segregation impacted their behavior.
It is further recommended that this research be replicated in other jurisdictions.
For example, similar studies could be carried out in other states, or within the United
States Federal system, or in other countries such as Canada. In addition, in a few years a
follow-up study could be conducted again on the Oregon prison system, which could
yield a larger sample size since the LS/CMI began to be administered to all incoming
inmates beginning in 2011. Given the results of the current study, it is possible that these
future studies may reveal that the use of disciplinary segregation solely for the purpose of
subsequent behavioral modification may not be justified.
Implications
The results of this study suggest that the experience of disciplinary segregation
does not reduce subsequent prison misconduct among those inmates subjected to it.

186
Given these findings, especially in light of the possibility that the experience of
disciplinary segregation may place inmates at risk of physiological and psychological
harm, it would be prudent to critically evaluate the practice of disciplinary segregation
within the Oregon DOC system and elsewhere. Such a critical evaluation should take
into account: (1) the findings of this study, which indicate that the experience of
disciplinary segregation does not effect the subsequent behavior of those subjected to it,
(2) the practice of disciplinary segregation may place those inmates subjected to it at risk
of negative psychological and physiological effects, (3) the other potential costs
associated with the practice of disciplinary segregation (e.g., monetary costs), (4) the
potential benefits of disciplinary segregation (e.g., a potential general deterrent effect).
Such a cost-benefit analysis could lead to positive social change, in that it could lead to
the practice of disciplinary segregation being exercised in a more judicious and informed
manner, and thereby reduce the possibility of unnecessarily placing inmates at risk of
psychological and physiological harm.
Conclusion
The purpose of this quantitative study was to examine the effectiveness of
disciplinary segregation in deterring prison inmate misconduct within the Oregon DOC
prison system. Specifically, the purpose of this retrospective observational study was to
test the theory of deterrence that relates disciplinary segregation to prison misconduct.
The findings of this study suggest that the experience of disciplinary segregation does not
significantly affect subsequent prison inmate misconduct. These findings were consistent
regardless of whether the outcome variable was overall total prison rule violations, or

187
total major rule violations, or total minor rule violations, and regardless of whether
outliers were included or excluded from the data set. In addition, the results suggested
that deterrence theory does not explain the relationship between the experience of
disciplinary segregation and subsequent prison inmate misconduct. Since the findings
suggest that the experience of disciplinary segregation does not decrease prison
misconduct, a critical evaluation of the practice of disciplinary segregation would be
prudent to undertake.

188
References
Agnew, R. S. (2009). Strain theories. In J. Miller (Ed.), 21st Century Criminology: A
Reference Handbook. (pp. 332–340). Thousand Oaks, CA: SAGE Publications,
Inc. doi: 10.4135/9781412971997.n38
Agnew, R. (2015). The role of the social environment in General Strain Theory. In K. M.
Beaver, J. C. Barnes, & B. B. Boutwell (Eds.), The Nurture Versus Biosocial
Debate in Criminology. (pp. 184–198). Thousand Oaks, CA: SAGE Publications,
Inc.
Akers, R. L. (1985). Deviant behavior: A social learning approach (3rd ed.). Belmont,
CA: Wadsworth.
Akers, R. L. (1998). Social learning and social structure: A general theory of crime and
deviance. Boston: Northeastern University Press.
Akers, R. L., & Jennings, W. (2009). Social learning theory. In J. Miller (Ed.), 21st
Century Criminology: A Reference Handbook. (pp. 323–332). Thousand Oaks,
CA: SAGE Publications, Inc. doi: 10.4135/9781412971997.n37
Alexander, J., & Austin, J. (1992). Handbook for Evaluating Objective Prison
Classification Systems. Washington, DC: U.S. Department of Justice.
Andrews, D. A. (1982). The Level of Supervision Inventory (LSI): Report on the
assessment and evaluation project. Toronto, Canada: Ministry of Correctional
Services.
Andrews, D. A., Robinson, D., & Hoge, R. D. (1984). Manual for the Youth Level of
Service Inventory. Ottawa, Ontario, Canada: Department of Psychology, Carlton

189
University.
Andrews, D. A., & Bonta, J. (1995). The Level of Service Inventory – Revised: User’s
manual. Toronto, Canada: Multi-Health Systems.
Andrews, D. A., Bonta, J., Wormith, J. S. (1995). The Level of Service Inventory –
Ontario Revision (LSI-OR): Interview and scoring guide. Toronto, Canada:
Ontario Ministry of the Solicitor General and Correctional Services.
Andrews, D. A., Bonta, J., & Wormith, J. S. (2004). The Level of Service/Case
Management Inventory (LS/CMI). Toronto, Canada: Multi-Health Systems.
Andrews, D. A., Bonta, J., & Wormith, J. S. (2006). The recent past and near future of
risk and/or need assessment. Crime and Delinquency, 52(1), 7–27. doi:
10.1177/0011128705281756
Andrews, D.A., & Bonta, J. (2010). Rehabilitating criminal justice policy and practice.
Psychology, Public Policy, and Law, 16, 39–55.
Andrews, D.A., Guzzo, L., Raynor, P., Rowe, R.C., Rettinger, L.J., Brews, A., &
Wormith, J.S. (2012). Are the major risk/need factors predictive of both female
and male reoffending? A test with the eight domains of the Level of Service/Case
Management Inventory. International Journal of Offender Therapy and
Comparative Criminology, 56, 113-133. doi: 10.1177/0306624X10395716
Arrigo, B. A., & Bullock, J. (2008). The psychological effects of solitary confinement on
prisoners in supermax units. International Journal Of Offender Therapy and
Comparative Criminology, 52(6), 622-640.
Bales, W. D., & Piquero, A. R. (2012). Assessing the impact of imprisonment on

190
recidivism. Journal of Experimental Criminology, 8(1), 71–101.
Bagby, L. M. J. (2007). Hobbes’ Leviathan. New York, NY: Continuum International
Publishing Group.
Barak–Glantz, I. L. (1983). Who’s in the “hole”? Criminal Justice Review, 8, 29–37.
Beccaria, C. (1764). On Crimes and Punishment (Henry Paolucci trans., MacMillan,
1986).
Becker, G. S. (1968). Crime and punishment: An economic approach. Journal of
Political Economy, 76(2), 169–217.
Bentham, J. (1789). The Principles of Morals and Legislation (Prometheus Books, 1988).
Blumenson, E. (2012). Retributivism. In W. Miller (Ed.), The social history of crime and
punishment in America: An encyclopedia. (pp. 1542-1547). Thousand Oaks, CA:
SAGE Publications, Inc. doi: 10.4135/9781452218427.n587
Blumstein, A. (2006). The crime drop in America: An exploration of some recent crime
trends. Journal of Scandinavian Studies in Criminology and Crime Prevention, 7,
17–35. doi: 10.1080/14043850601037938
Boisvert, D. (2015). A biosocial view of social bond theory. In K. M. Beaver, J. C.
Barnes, & B. B. Boutwell (Eds.), The Nurture Versus Biosocial Debate in
Criminology. (pp. 236–251). Thousand Oaks, CA: SAGE Publications, Inc.
Bonta, J. (1989). Native inmates: Institutional responses, risks, and needs. Canadian
Journal of Criminology, 31, 49–62.
Bonta, J., Law, M., & Hanson, K. (1998). The prediction of criminal and violent
recidivism among mentally disordered offenders: A meta-analysis. Psychological

191
Bulletin, 123(2), 123–142. doi:10.1037/0033-2909.123.2.123
Bonta, J. & Motiuk, L L. (1987). The diversion of incarcerated offenders to correctional
halfway houses. Journal of Research in Crime and Delinquency, 24(4), 302–323.
doi: 10.1177/0022427887024004006
Bonta, J., & Motiuk, L. L. (1990). Classification to halfway houses: A quasi-
experimental evaluation. Criminology, 28(3), 497–506.
Bonta, J., & Motiuk, L. L. (1992). Inmate classification. Journal of Criminal Justice, 20,
343–353.
Bouffard, L. A., & Piquero, N. L. (2010). Defiance theory and life course explanations of
persistent offending. Crime and Delinquency, 56(2), 227–252.
Brauer, J. R., & Bolen, J. D. (2015). Learning theories of crime. In K. M. Beaver, J. C.
Barnes, & B. B. Boutwell (Eds.), The Nurture Versus Biosocial Debate in
Criminology. (pp. 110–124). Thousand Oaks, CA: SAGE Publications, Inc.
Briggs, C. S., Sundt, J. L., & Castellano, T. C. (2003). The effect of supermaximum
security prisons on aggregate levels of institutional violence. Criminology, 41(4),
1341–1376.
Burt, C. H. (2015). Self-control and crime. In K. M. Beaver, J. C. Barnes, & B. B.
Boutwell (Eds.), The Nurture Versus Biosocial Debate in Criminology. (pp. 143–
171). Thousand Oaks, CA: SAGE Publications, Inc.
Butcher, J.N., Dahlstrom, W.G., Graham, J.R., Tellegen, A., & Kaemmer, B. (1989).
Minnesota Multiphasic Personality Inventory (MMPI-2) manual for
administration and scoring. Minneapolis, MN: University of Minnesota Press.

192
Camp, S. D., & Gaes, G. G. (2005). Criminogenic effects of the prison environment on
inmate behavior: Some experimental evidence. Crime and Delinquency, 51(3),
425–442. doi: 10.1177/0011128704271471
Camp, S. D., Gaes, G. G., Langan, N. P., & Saylor, W. G. (2003). The influence of
prisons on inmate misconduct: A multilevel investigation. Justice Quarterly,
20(3), 501–533. doi: 10.1080/07418820300095601
Campbell, D. T., & Stanley, J. C. (1963). Experimental and Quasi-Experimental Designs
for Research. Boston, MA: Houghton Mifflin.
Campbell, M. A., French, S., & Gendreau, P. (2009). The prediction of violence in adult
offenders: A meta-analytic comparison of instruments and methods of assessment.
Criminal Justice and Behavior, 36(6), 567–590. doi: 10.1177/0093854809333610
Celinska, K., & Sung, H. (2014). Gender differences in the determinants of prison rule
violations. The Prison Journal, 94(2), 220–241. doi: 10.1177/0032885514524882
Chalfin, A., & McCrary, J. (2014). Criminal Deterrence: A Review of the Literature.
Retrieved on 11/22/2014 from
eml.berkeley.edu/~jmccrary/chalfin_mccrary2014.pdf
Cockrell, J. F. (2013). Solitary confinement: The law today and the way forward. Law
and Psychology Review, 37, 211–227.
Cohen, J. (1988). Statistical power analysis for the behavioral sciences. Hillsdale, New
Jersey: Lawrence Erlbaum Associates.
Coid, J., Petruckevitch, A., Bebbington, P., Jenkins, R., Brugha, T., Lewis, G., & ...
Singleton, N. (2003). Psychiatric morbidity in prisoners and solitary cellular

193
confinement, I: disciplinary segregation. Journal of Forensic Psychiatry and
Psychology, 14(2), 298–319.
Cook, P. (1980). Research in criminal deterrence: Laying the groundwork for the second
decade. In N. Morris and M. Tonry (Eds.), Crime and Justice: An Annual Review
of Research, vol. 2. Chicago, Ill: University of Chicago Press.
Craddock, A. (1996). A comparative study of male and female prison misconduct careers.
The Prison Journal, 76(1), 60–80.
Crews, A. D. (2009). Biological theory. In J. Miller (Ed.), 21st Century Criminology: A
Reference Handbook. (pp. 184–201). Thousand Oaks, CA: SAGE Publications,
Inc. doi: 10.4135/9781412971997.n22
Creswell, J. (2009). Research design: Qualitative, quantitative, and mixed methods
approaches (Laureate Education, Inc., custom ed.). Thousand Oaks, CA: SAGE
Publications.
Cronbach, L. J. (1952). Coefficient alpha and internal structure of tests. Psychometricka,
16, 297–334.
Cunningham, M. D., & Reidy, T. J. (1998). Integrating base rate data in violence risk
assessments at capital sentencing. Behavioral Science and the Law, 16, 71–95.
Cunningham, M. D., & Reidy, T. J. (1999). Don’t confuse me with the facts: Common
errors in violence risk assessment at capital sentencing. Criminal Justice and
Behavior, 26, 20–43.
Cunningham, M. D., & Reidy, T. J. (2002). Violence risk assessment at federal capital
sentencing: Individualization, generalization, relevance, and scientific standards.
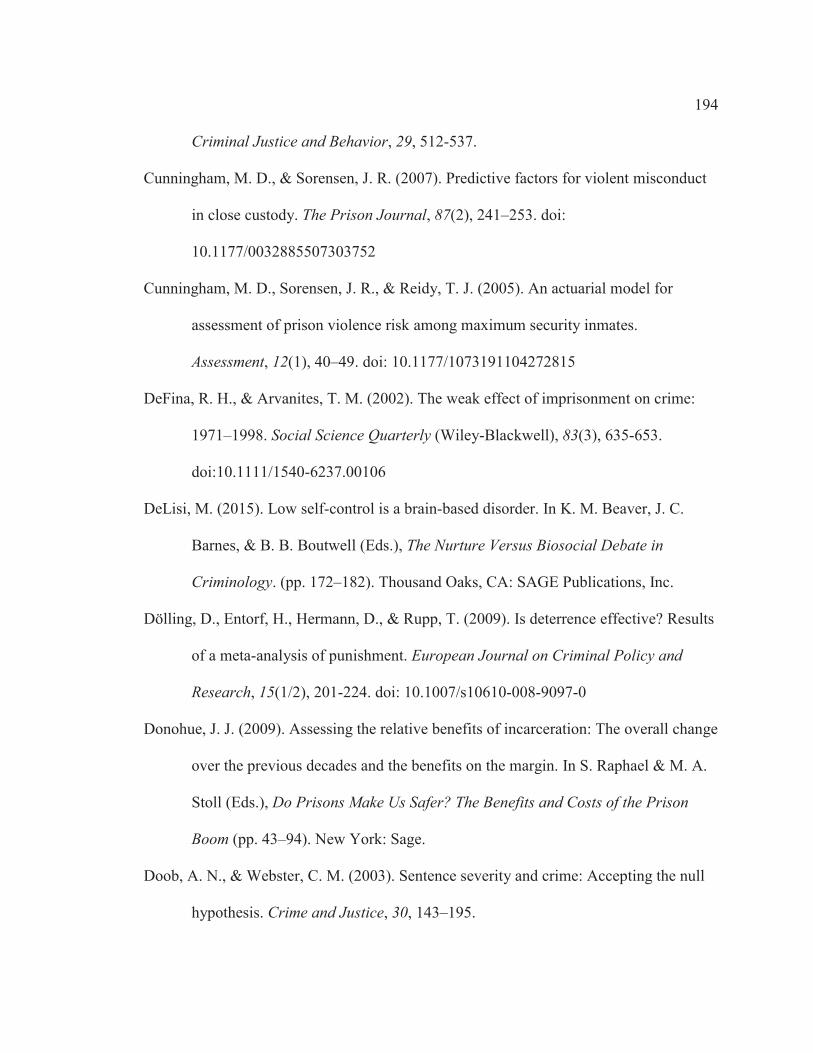
194
Criminal Justice and Behavior, 29, 512-537.
Cunningham, M. D., & Sorensen, J. R. (2007). Predictive factors for violent misconduct
in close custody. The Prison Journal, 87(2), 241–253. doi:
10.1177/0032885507303752
Cunningham, M. D., Sorensen, J. R., & Reidy, T. J. (2005). An actuarial model for
assessment of prison violence risk among maximum security inmates.
Assessment, 12(1), 40–49. doi: 10.1177/1073191104272815
DeFina, R. H., & Arvanites, T. M. (2002). The weak effect of imprisonment on crime:
1971–1998. Social Science Quarterly (Wiley-Blackwell), 83(3), 635-653.
doi:10.1111/1540-6237.00106
DeLisi, M. (2015). Low self-control is a brain-based disorder. In K. M. Beaver, J. C.
Barnes, & B. B. Boutwell (Eds.), The Nurture Versus Biosocial Debate in
Criminology. (pp. 172–182). Thousand Oaks, CA: SAGE Publications, Inc.
Dölling, D., Entorf, H., Hermann, D., & Rupp, T. (2009). Is deterrence effective? Results
of a meta-analysis of punishment. European Journal on Criminal Policy and
Research, 15(1/2), 201-224. doi: 10.1007/s10610-008-9097-0
Donohue, J. J. (2009). Assessing the relative benefits of incarceration: The overall change
over the previous decades and the benefits on the margin. In S. Raphael & M. A.
Stoll (Eds.), Do Prisons Make Us Safer? The Benefits and Costs of the Prison
Boom (pp. 43–94). New York: Sage.
Doob, A. N., & Webster, C. M. (2003). Sentence severity and crime: Accepting the null
hypothesis. Crime and Justice, 30, 143–195.

195
Drago, F., Galbiati, R., & Vertova, P. (2009). The deterrent effects of prison: Evidence
from a Natural Experiment, Journal of Political Economy, 117(2), 257–280. doi:
10.1086/599286
Drury, A. J., & DeLisi, M. (2010). The past is prologue: Prior adjustment to prison and
institutional misconduct. The Prison Journal, 90(3), 331–352. doi:
10.1177/0032885510375676
Durbin, J., & Watson, G. S. (1951). Testing for serial correlation in least squares
regression, II. Biometricka, 30, 159–178.
Durlauf S. N., & Nagin, D. S. (2011). The deterrent effect of imprisonment. In P. J.
Cook, J. Ludwig, and J. McCrary (Eds.), Controlling Crime: Strategies and
Tradeoffs. Chicago, Ill: University of Chicago Press.
Durose, M. R., Cooper, A. D., & Snyder, H. N. (2014). Recidivism of Prisoners Released
in 30 States in 2005: Patterns from 2005 to 2010. Washington, DC: Bureau of
Justice Statistics, U.S. Department of Justice.
Farrington, D. P. (1986). Age and crime. Crime and Justice, 7, 189–250.
Faul, F., Erdfelder, E., Lang, A.-G., & Buchner, A. (2007). G*Power 3: A flexible
statistical power analysis program for the social, behavioral, and biomedical
sciences. Behavior Research Methods, 39(2), 175-191.
Faul, F., Erdfelder, E., Buchner, A., & Lang, A.-G. (2009). Statistical power analysis
using G*Power 3.1: Tests for correlation and regression analyses. Behavior
Research Methods, 41(4), 1149-1160.
Frankfort-Nachmias, C., & Nachmias, D. (2008). Research methods in the social sciences

196
(7th ed.). New York, NY: Worth Publishers.
Field, A. (2013). Discovering Statistics Using IBM SPSS Statistics (4th ed.). London:
SAGE Publications.
Fischer, D. R. (2001). Arizona Department of Corrections: Security threat group (STG)
program evaluation, final report. Rockville, MD: National Institute of Justice.
Flanagan, T. J. (1980). Time served and institutional misconduct: Patterns of involvement
in disciplinary infractions among long-term and short-term inmates. Journal of
Criminal Justice, 8, 357–367.
Flanagan, T. J. (1983). Correlates of institutional misconduct among state prisoners: A
research note. Criminology, 21(1), 29-39.
G*Power 3.1 Manual (January 31, 2014). retrieved on 08/05/2015 from
http://www.gpower.hhu.de/en.html
Gaes, G. G., Wallace, S., Gilman, E., Klein-Saffran, J., & Suppa, S. (2002). The
influence of prison gang affiliation on violence and other prison misconduct. The
Prison Journal, 82(3), 359–385.
Gendreau, P., Little, T., & Goggin, C. (1996). A Meta-analysis of the predictors of adult
offender recidivism: What works! Criminology, 34(4), 575–607.
Gendreau, P., Goggin, C. E., & Law, M. A. (1997). Predicting prison misconducts.
Criminal Justice and Behavior, 24(4), 414–431.
Green, S.B., & Salkind, N.J. (2014). Using SPSS for Windows and Macintosh: Analyzing
and understanding data (7th ed.). Upper Saddle River, NJ: Pearson Education.
Gottfredson, M. R., & Hirschi, T. (1990). A general theory of crime. Stanford, CA:

197
Stanford University Press.
Gover, A. R., Pérez, D. M., Jennings, W. G. (2008). Gender differences in factors
contributing to institutional misconduct. The Prison Journal, 88(3), 378–403. doi:
10.1177/0032885508322453
Haney, C. (2003). Mental health issues in long-term solitary and “supermax”
confinement. Crime and Delinquency, 49(1), 124–156.
Haney, C., & Lynch, M. (1997). Regulating Prisons of the future: A psychological
analysis of supermax and solitary confinement. Review of Law and Social
Change, 23, 477–570.
Hare, R. D. (1991). The Hare Psychopathy Checklist-Revised (manual). Toronto, Canada:
Multi-Health Systems.
Harer, M. D., & Langan, N. P. (2001). Gender differences in predictors of prison
violence: Assessing the predictive validity of a risk classification system. Crime
and Delinquency, 47(4), 513–536.
Harris, G. T., Rice, M. E., & Quinsey, V. L. (1993). Violent recidivism of mentally
disordered offenders: The development of a statistical prediction instrument.
Criminal Justice and Behavior, 20, 315-335.
Hathaway, S. R., & McKinley, J. C. (1943). Manual for the Minnesota Multiphasic
Personality Inventory. New York: Psychological Corporation.
Haun, J. (2007). Static and Dynamic Predictors of Institutional Misconduct and Violence
Among Incarcerated Adult Offenders (Doctoral dissertation, Pacific University).
Retrieved on 11/01/2014 from

198
http://www.oregon.gov/doc/RESRCH/docs/jeffhaundissertation.pdf
Hedges, L. W., & Olkin, I. (1985). Statistical Methods for Meta-Analysis. San Diego,
CA: Academic Press.
Helland, E., & Tabarrok, A. (2007). Do three strikes deter? A nonparametric estimation.
The Journal of Human Resources, 42(2), 309–330.
Hirschi, T., & Gottfredson, M. (1983). Age and the explanation of crime. American
Journal of Sociology, 89(3), 552-584.
Hobbes, T. (1651). Leviathan. R. Tuck (Ed.), Revised Student Edition (2012). New York:
Cambridge University Press.
Jackson, M. (2001). The psychological effects of administrative segregation. Canadian
Journal of Criminology, 43(1), 109-116.
Jiang, S., & Winfree Jr., L. T. (2006). Social support, gender, and inmate adjustment to
prison life: Insights from a national sample. The Prison Journal, 86(1), 32–55.
doi: 10.1177/0032885505283876
Jung, S., Daniels, M. K., Friesen, M., & Ledi, D. (2012). An examination of convergent
constructs among Level of Service measures and other measures. Journal of
Forensic Psychiatry and Psychology, 23(5-6), 601-619.
Kant, I. (1796). The Philosophy of Law: An Exposition of the Fundamental Principles of
Jurisprudence as the Science of Right, trans. W. Hastie (Edinburgh: Clark, 1887).
Retrieved 10/19/2014 from http://oll.libertyfund.org/titles/359
Kovandzic, T. V., & Vieraitis, L. M. (2006). The effect of county-level prison population
growth on crime rates. Criminology and Public Policy, 5(2), 213–244.

199
doi:10.1111/j.1745-9133.2006.00375.x
Kroner, D.G., & Mills, J.F. (2001). The accuracy of five risk appraisal instruments in
predicting institutional misconduct and new convictions. Criminal Justice and
Behavior, 28(4), 471–489. doi: 10.1177/009385480102800405
Levitt, S. D. (1996). The effect of prison population size on crime rates: Evidence from
prison overcrowding litigation. The Quarterly Journal of Economics, 111(2),
319–351.
Levitt, S. D. (2004). Understanding why crime fell in the 1990s: Four factors that explain
the decline and six factors that do not. The Journal of Economic Perspectives,
18(1), 163–190.
Light, S. C. (1990). Measurement error in official statistics: Prison rule infraction data.
Federal Probation, 54, 63–68.
Lippke, R. L. (2004). Against Supermax. Journal of Applied Psychology, 21(2), 109–124.
Loza, W. (2003). Predicting violent and nonviolent recidivism of incarcerated male
offenders. Aggression and Violent Behavior, 8, 175–203.
Lynch, M. J. (1999). Beating a dead horse: Is there any basic empirical evidence for the
deterrent effect of imprisonment? Crime, Law and Social Change, 31(4), 347-362.
Mann, C. J. (2003). Observational research methods. Research design II: cohort, cross
sectional, and case-control studies. Emergency Medicine Journal, 20(1), 54-60.
Mann, H. B., & Whitney, D. R. (1947). On a test of whether one of two random variables
is stochastically larger than the other. Annals of Mathematical Sciences, 18, 50–
60.

200
Marvell, T. B., & Moody Jr., C. E. (1994). Prison population growth and crime reduction.
Journal Of Quantitative Criminology, 10(2), 109-140.
McCorkle, R. C. (1995). Gender, psychopathology, and institutional behavior: A
comparison of male and female mentally ill prison inmates. Journal of Criminal
Justice, 23(1), 53–61.
Mears, D. P., & Bales, W. D. (2009). Supermax incarceration and recidivism.
Criminology, 47(4), 1131–1166.
Mischel, W. (1973). Toward a cognitive social learning reconceptualization of
personality. Psychological Review, 80(4), 252–283.
Miller, H. A. (1994). Reexamining psychological distress in the current conditions of
segregation. Journal of Correctional Health Care, 1(1), 39–53.
Miller, H. A., & Young, G. R. (1997). Prison segregation: administrative detention
remedy or mental health problem? Criminal Behaviour and Mental Health, 7(1),
85–94.
Morey, L.C. (2007). Personality Assessment Inventory: Professional manual (2nd ed.).
Tampa, FL: Psychological Assessment Resources.
Morris, R. G., Carriaga, M. L., Diamond, B., Piquero, N. L., & Piquero, A. R. (2012).
Does prison strain lead to prison misbehavior? An application of general strain
theory to inmate misconduct. Journal of Criminal Justice, 40, 194–201.
doi:10.1016/j.jcrimjus.2011.12.001
Motiuk, L. L. (1991). Antecedents and consequences of prison adjustment: A systematic
assessment and reassessment approach (Order No. NN75971). Available from

201
ProQuest Dissertations and Theses Full Text.
Motiuk, L. L., & Blanchette, K. (2001). Characteristics of administratively segregated
offenders in federal corrections. Canadian Journal of Criminology, 43(1), 131–
143.
Motiuk, L. L., & Blanchette, K. (1997). Case Characteristics of Segregated Offenders in
Federal Corrections. Research Report R-57. Ottawa: Correctional Service
Canada. Retrieved on 11/15/2014 from http://www.csc-
scc.gc.ca/research/005008-2000-eng.shtml
Nagin, D. S. (2013). Deterrence in the twenty-first century. Crime and Justice, 42(1),
199–263. doi: 10.1086/670398
Nagin, D.S. (1998). Criminal deterrence research at the outset of the twenty-first century.
Crime and Justice, 23, 1–42.
Nagin, D. S., Cullen, F. T., & Jonson, C. L. (2009). Imprisonment and reoffending.
Crime and Justice, 38(1), 115–200.
Nagin, D. S., & Land, K. C. (1993). Age, criminal careers, and population heterogeneity:
Specification and estimation of a nonparametric, mixed poisson model,
Criminology, 31(3), 327 –362.
Nagin, D. S., & Pogarsky, G. (2001). Integrating celerity, impulsivity, and extralegal
sanction threats into a model of general deterrence: Theory and evidence.
Criminology, 39(4), 865–891.
Olver, M. E., Stockdale, K. C., & Wormith, J. S. (2014). Thirty years of research on the
Level of Service scales: A meta-analytic examination of predictive accuracy and

202
sources of variability. Psychological Assessment, 26(1), 156–176. doi:
10.1037/a0035080
Ouellette, J. A., & Wood, W. (1998). Habit and intention in everyday life: The multiple
processes by which past behavior predicts future behavior. Psychological
Bulletin, 124(1), 54–74.
Or. Admin. R. 291-011-0005 et seq. (2014).
Or. Admin. R. 291-105-005 et seq. (2014).
Oregon DOC (n.d.a). DOC Research and Statistics. Retrieved from
http://www.oregon.gov/doc/RESRCH/pages/inmate_population.aspx#Prison_Pop
ulation_Trends
Oregon DOC (n.d.b). DOC Operations Division. Retrieved on 01/24/2014 from
http://www.oregon.gov/DOC/OPS/pages/index.aspx
Paternoster, R. (2010). How much do we really know about criminal deterrence? Journal
of Criminal Law and Criminology, 100(3), 765-823.
Pizarro, J., & Stenius, J. M. K. (2004). Supermax prisons: Their rise, current practices,
and effect on inmates. The Prison Journal, 84(2), 248–264.
Postema, G. J. (2006). Interests, universal and particular: Bentham's utilitarian theory of
value. Utilitas, 18(2), 109-133. doi:10.1017/S0953820806001889
Pratt, T. C., & Cooper, J. A. (2009). Self-Control theory. In J. Miller (Ed.), 21st Century
Criminology: A Reference Handbook. (pp. 288–296). Thousand Oaks, CA: SAGE
Publications, Inc. doi: 10.4135/9781412971997.n33
Raphael, S., & Ludwig, J. (2003). Prison sentence enhancements: The case of project

203
exile. In Jens Ludwig and Philip J. Cook (Eds.), Evaluating Gun Policy: Effects
on Crime and Violence (pp. 251–286). Washington, DC: Brookings Institution
Press. Retrieved on 11/20/2014 from
http://www18.georgetown.edu/data/people/ludwigj/publication-18248.pdf
Reidy, T. J., Cunningham, M. D., & Sorensen, J. R. (2001). From death to life: Prison
behavior of former death row inmates in Indiana. Criminal Justice and Behavior,
28(1), 62–82.
Rosenbaum, P. R. (1989). Optimal matching for observational studies. Journal of the
American Statistical Association, 84(408), 1024–1032. doi: 10.2307/2290079
Rowe, R. C. (1999). The prediction of recidivism in a parole sample: An examination of
two version of the Level of Service Inventory. Unpublished report. Ottowa,
Canada: Carleton University
Rudestam, K. E., & Newton, R. R. (2007). Surviving Your Dissertation: A
Comprehensive Guide to Content and Process (3rd ed.). Thousand Oaks, CA:
SAGE Publications.
Schreck, C. J., & Hirschi, T. (2009). Social control theory. In J. Miller (Ed.), 21st
Century Criminology: A Reference Handbook. (pp. 323–332). Thousand Oaks,
CA: SAGE Publications, Inc. doi: 10.4135/9781412971997.n35
Schroeder, R. (2015). Social bonding and crime. In K. M. Beaver, J. C. Barnes, & B. B.
Boutwell (Eds.), The Nurture Versus Biosocial Debate in Criminology. (pp. 218–
235). Thousand Oaks, CA: SAGE Publications, Inc.
Selya, A.S., Rose, J. S., Dierker, L. C., Hedeker, D., & Mermelstein, R. J. (2012). A

204
practical guide to calculating Cohen’s , a measure of local effect size, from PROC
MIXED, Frontiers in Psychology, 3(111), 1–6, doi:10.3389/fpsyg.2012.00111
Shepherd, J. M. (2002). Fear of the first strike: The full deterrent effect of California's
two- and three-strikes legislation. Journal of Legal Studies, 31(1), 159–201.
Sherman, L. W. (1993). Defiance, deterrence and irrelevance: A theory of the criminal
sanction. Journal of Research in Crime and Delinquency, 30, 445–473.
Shuster, A. (2010). Ancient and modern approaches to the question of punishment:
Hobbes, Kant, and Plato (Unpublished doctoral dissertation). The University of
Texas at Austin, Austin, Texas. Retrieved on 10/19/2014 from
http://repositories.lib.utexas.edu/handle/2152/ETD-UT-2010-08-1775
Smith, P. S. (2006). The effects of solitary confinement on prison inmates: A brief history
and review of the literature. Crime and Justice, 34, 441–528.
Sorensen, J. R., & Pilgrim, R. L. (2000). An actuarial risk assessment of violence posed
by capital murder defendants. The Journal of Criminal Law and Criminology,
90(4), 1251–1270.
Sorensen, J. R. & Wrinkle, R. D. (1996). No hope for parole: Disciplinary infractions
among death-sentenced and life-without-parole inmates. Criminal Justice and
Behavior, 23(4), 542–552.
Steiner, P. M., Cook, T. D., Shadish, W. R., & Clark, M. H. (2010). The importance of
covariate selection in controlling for selection bias in observational studies.
Psychological Methods, 15(3), 250–267. doi: 10.1037/a0018719
Stewart, C. A. (2011). Risk Assessment of Federal Female Offenders (Unpublished

205
doctoral dissertation). University of Saskatchewan, Saskatoon, Canada. (Order
No. NR92277). Available from ProQuest Dissertations and Theses Global.
(1315012992). Retrieved from
http://search.proquest.com/docview/1315012992?accountid=14872
Suedfeld, P., Ramirez, C., Deaton, J., & Baker-Brown, G. (1982). Reactions and
attributes of prisoners in solitary confinement, Criminal Justice and Behaviour, 9,
303–340.
Sundt, J. L., Castellano, T. C., & Briggs, C. S. (2008). The sociopolitical context of
prison violence and its control: A case study of supermax and its effect in Illinois.
The Prison Journal, 88(1), 94–122. doi:10.1177/0032885507310994
Sweeten, G., Piquero, A., & Steinberg, L. (2013). Age and the explanation of crime,
revisited. Journal of Youth and Adolescence, 42(6), 921-938. doi:10.1007/s10964-
013-9926-4
Swoboda, D. G. (2006). Predicting misconducts among young adult male inmates using
the Level of Service Inventory-Revised and the Personality Assessment Inventory
(Order No. 3206657). Available from ProQuest Dissertations and Theses Full
Text.
Tabachnick, B. G., & Fidell, L. S. (2014). Using Multivariate Statistics (6th ed.). Essex,
England: Pearson Education Limited
Toch, H., Adams, K. G., & Grant, J. D. (1989). Coping: Maladaptation in Prisons. New
Brunswick, N.J.: Transaction Press
Toch, H., & Adams, K. G. (2002). Acting Out: Maladaptive Behavior in Confinement.

206
Washington, D.C.: American Psychological Association.
Trochim, W. M. (2006). The Research Methods Knowledge Base: Nonprobability
Sampling (2nd ed.). Retrieved on 08/09/2014 from
http://www.socialresearchmethods.net/kb/ (version current as of October 20,
2006).
Vaske, J. (2015). The integration of biological and genetic factors into social learning
theory. In K. M. Beaver, J. C. Barnes, & B. B. Boutwell (Eds.), The Nurture
Versus Biosocial Debate in Criminology. (pp. 125–141). Thousand Oaks, CA:
SAGE Publications, Inc.
Walters, G. D. (1992). Foundations of Criminal Science: The Use of Knowledge (Vol. 2).
New York: Greenwood Publishing Group, Inc.
Walters, G. D. (2007). Predicting institutional adjustment with the psychological
inventory of criminal thinking styles composite scales: replication and extension.
Legal and Criminological Psychology, 12, 69-81. doi:10.1348/135532505X83587
Walters, G. D., White, T. W., & Denney, D. (1991). The Lifestyle Criminality Screening
Form: Preliminary data. Criminal Justice and Behavior, 18, 406-418.
Walton, B. B. (1997). The Eighth Amendment and psychological implications of solitary
confinement. Law and Psychology, 21, 271–288.
Warner, R. M. (2013). Applied Statistics: From bivariate through multivariate
techniques. Thousand Oaks, CA: SAGE Publications
Warren, J. I., Hurt, S., Loper, A. B., & Chauhan, P. (2004). Exploring prison adjustment
among female inmates: Issues of measurement and prediction. Criminal Justice

207
and Behavior, 31(5), 624–645. doi: 10.1177/0093854804267096
Webster, C. D., Eaves, D., Douglas, K. S., & Wintrup, A. (1995). The HCR-20 scheme:
The assessment of dangerousness and risk. Vancouver, Canada: Simon Fraser
University and British Columbia Forensic Psychiatric Services Commission.
Weisburd, D., Einat, T., & Kowalski, M. (2008). The miracle of the cells: An
experimental study of interventions to increase payment of court-ordered financial
obligations. Criminology and Public Policy, 7(1), 9–36. doi:10.1111/j.1745-
9133.2008.00487.x
Williams, M. N., Grajales, C. A. G., & Kurkiewicz, D. (2013). Assumptions of multiple
regression: Correcting two misconceptions. Practical Assessment Research and
Evaluation, 18(11), 1-14.
Wilcoxon, F. (1945). Individual comparisons by ranking methods. Biometrics, 1, 80–83.
Zamble, E. (1992). Behavior and adaptation in long-term prison inmates: Descriptive
longitudinal results. Criminal Justice and Behavior, 19(4), 409–425.
Zimring, F. E., & Hawkins, G. J. (1973). Deterrence: The Legal Threat in Crime Control.
Chicago, IL: University of Chicago Press.
Zinger, I., & Wichmann, C. (1999). The Psychological Effects of 60 Days in
Administrative Segregation. Ottawa: Correctional Services of Canada, Research
Branch.
Zinger, I., Wichmann, C., & Andrews, D. A. (2001). The psychological effects of 60 days
in administrative segregation. Canadian Journal Of Criminology, 43(1), 47-83.

208
Appendix A: Tables of Frequencies and Percentages of Outliers within the Data
Table 18
Z-Scores: Outliers Within the Data on the Variable Age
Frequency Percent Valid
Percent Cumulative
Percent
Valid
Probable Outliers (z > 2.58)
2 .9 .9 .9
Potential Outliers (z > 1.96) 11 4.8 4.8 5.7
Normal range 215 94.3 94.3 100.0 Total 228 100.0 100.0
Table 19
Z-Scores: Outliers Within the Data on the Variable Length of Time Spent on Current Sentence
Frequency Percent Valid Percent
Cumulative Percent
Valid
Extreme Outliers (z > 3.29)
5 2.2 2.2 2.2
1.95644 1 .4 .4 2.6 Probable Outliers (z > 2.58)
4 1.8 1.8 4.4
Potential Outliers (z > 1.96)
6 2.6 2.6 7.0
Normal range 212 93.0 93.0 100.0 Total 228 100.0 100.0

209
Table 20
Z-Scores: Outliers Within the Data on the Variable LS/CMI Score
Frequency Percent Valid
Percent Cumulative
Percent
Valid
Potential Outliers (z > 1.96)
9 3.9 3.9 3.9
Normal range 219 96.1 96.1 100.0 Total 228 100.0 100.0
Table 21
Z-Scores: Outliers Within the Data on the Variable Total Major Rule Violations in 2011-2012
Frequency Percent Valid Percent
Cumulative Percent
Valid
Extreme Outliers (z > 3.29)
2 .9 .9 .9
Probable Outliers (z > 2.58)
3 1.3 1.3 2.2
Potential Outliers (z > 1.96) 8 3.5 3.5 5.7
Normal range 215 94.3 94.3 100.0 Total 228 100.0 100.0

210
Table 22
Z-Scores: Outliers Within the Data on the Variable Total Minor Rule Violations in 2011-2012
Frequency Percent Valid
Percent Cumulative
Percent
Valid
Extreme Outliers (z > 3.29) 4 1.8 1.8 1.8
Probable Outliers (z > 2.58) 2 .9 .9 2.6
Potential Outliers (z > 1.96)
8 3.5 3.5 6.1
Normal range 214 93.9 93.9 100.0 Total 228 100.0 100.0
Table 23
Z-Scores: Outliers Within the Data on the Variable Days Spent in DSU During 2011-2012
Frequency Percent Valid
Percent Cumulative
Percent
Valid
Extreme Outliers (z > 3.29)
3 1.3 1.3 1.3
1.95179 1 .4 .4 1.8 Probable Outliers (z > 2.58)
3 1.3 1.3 3.1
Potential Outliers (z > 1.96) 2 .9 .9 3.9
Normal range 219 96.1 96.1 100.0 Total 228 100.0 100.0

211
Table 24
Z-Scores: Outliers Within the Data on the Variable Overall Total Rule Violations in 2013-2014
Frequency Percent Valid
Percent Cumulative
Percent
Valid
Extreme Outliers (z > 3.29) 7 3.1 3.1 3.1
Probable Outliers (z > 2.58)
1 .4 .4 3.5
Potential Outliers (z > 1.96)
1 .4 .4 3.9
Normal range 219 96.1 96.1 100.0 Total 228 100.0 100.0
Table 25
Z-Scores: Outliers Within the Data on the Variable Total Major Rule Violations in 2013-2014
Frequency Percent Valid
Percent Cumulative
Percent
Valid
Extreme Outliers (z > 3.29) 7 3.1 3.1 3.1
Potential Outliers (z > 1.96)
1 .4 .4 3.5
Normal range 220 96.5 96.5 100.0 Total 228 100.0 100.0

212
Table 26
Z-Scores: Outliers Within the Data on the Variable Total Minor Rule Violations in 2013-2014
Frequency Percent Valid
Percent Cumulative
Percent
Valid
Extreme Outliers (z > 3.29)
5 2.2 2.2 2.2
Probable Outliers (z > 2.58)
1 .4 .4 2.6
Potential Outliers (z > 1.96)
6 2.6 2.6 5.3
Normal range 216 94.7 94.7 100.0 Total 228 100.0 100.0

213
Appendix B: Normality Statistics Concerning Dependent/Outcome Variables
Table 27 Normality Diagnostics: Full Data Set, Divided by Cohort OUTCOME VARIABLE
COHORT Statistic Std. Error
Overall Total Rule Violations in 2013–2014
comparison cohort
Mean .162 .0823 95% Confidence Interval for Mean
Lower Bound -.005
Upper Bound .329
5% Trimmed Mean .069
Median .000
Variance .251
Std. Deviation .5008
Minimum .0
Maximum 2.0
Range 2.0
Interquartile Range .0
Skewness 3.146 .388 Kurtosis 9.169 .759
treatment cohort
Mean 6.168 .6043 95% Confidence Interval for Mean
Lower Bound 4.976
Upper Bound 7.359

214
5% Trimmed Mean 4.916
Median 4.000
Variance 69.740
Std. Deviation 8.3511
Minimum .0
Maximum 49.0
Range 49.0
Interquartile Range 7.0
Skewness 2.611 .176 Kurtosis 8.187 .350
Total major rule violations in 2013-2014
comparison cohort
Mean .1081 .06465 95% Confidence Interval for Mean
Lower Bound -.0230 Upper Bound .2392
5% Trimmed Mean .0345 Median .0000 Variance .155 Std. Deviation .39326 Minimum .00 Maximum 2.00 Range 2.00 Interquartile Range .00 Skewness 3.934 .388 Kurtosis 16.055 .759

215
treatment cohort
Mean 5.3665 .54660 95% Confidence Interval for Mean
Lower Bound 4.2883 Upper Bound 6.4447
5% Trimmed Mean 4.2182 Median 3.0000 Variance 57.065 Std. Deviation 7.55414 Minimum .00 Maximum 47.00 Range 47.00 Interquartile Range 7.00 Skewness 2.778 .176 Kurtosis 9.621 .350
Total minor rule violations in 2013-2014
comparison cohort
Mean .0541 .05405 95% Confidence Interval for Mean
Lower Bound -.0556
Upper Bound .1637
5% Trimmed Mean .0000
Median .0000
Variance .108
Std. Deviation .32880
Minimum .00
Maximum 2.00
Range 2.00

216
Interquartile Range .00
Skewness 6.083 .388 Kurtosis 37.000 .759
treatment cohort
Mean .8010 .10583 95% Confidence Interval for Mean
Lower Bound .5923
Upper Bound 1.0098
5% Trimmed Mean .5748
Median .0000
Variance 2.139
Std. Deviation 1.46259
Minimum .00
Maximum 8.00
Range 8.00
Interquartile Range 1.00
Skewness 2.605 .176 Kurtosis 7.650 .350

217
Table 28
Normality Diagnostics: Data Set with Outliers Deleted, Divided by Cohort
OUTCOME VARIABLE
COHORT Statistic Std. Error
Overall total rule violations in 2013-2014
comparison cohort
Mean .162 .0823 95% Confidence Interval for Mean
Lower Bound -.005
Upper Bound .329
5% Trimmed Mean .069
Median .000
Variance .251
Std. Deviation .5008
Minimum .0
Maximum 2.0
Range 2.0
Interquartile Range .0
Skewness 3.146 .388 Kurtosis 9.169 .759
treatment cohort
Mean 4.913 .3919 95% Confidence Interval for Mean
Lower Bound 4.140
Upper Bound 5.686
5% Trimmed Mean 4.371

218
Median 3.000
Variance 28.255
Std. Deviation 5.3155
Minimum .0
Maximum 26.0
Range 26.0
Interquartile Range 6.8
Skewness 1.339 .179 Kurtosis 1.533 .356
Total major rule violations in 2013-2014
comparison cohort
Mean .1081 .06465 95% Confidence Interval for Mean
Lower Bound -.0230 Upper Bound .2392
5% Trimmed Mean .0345 Median .0000 Variance .155 Std. Deviation .39326 Minimum .00 Maximum 2.00 Range 2.00 Interquartile Range .00 Skewness 3.934 .388 Kurtosis 16.055 .759
treatment cohort
Mean 4.2174 .34351 95% Confidence Interval Lower Bound 3.5396

219
for Mean Upper Bound 4.8951 5% Trimmed Mean 3.7826 Median 3.0000 Variance 21.712 Std. Deviation 4.65962 Minimum .00 Maximum 23.00 Range 23.00 Interquartile Range 6.00 Skewness 1.269 .179 Kurtosis 1.299 .356
Total minor rule violations in 2013-2014
comparison cohort
Mean .0541 .05405 95% Confidence Interval for Mean
Lower Bound -.0556
Upper Bound .1637
5% Trimmed Mean .0000
Median .0000
Variance .108
Std. Deviation .32880
Minimum .00
Maximum 2.00
Range 2.00
Interquartile Range .00
Skewness 6.083 .388

220
Kurtosis 37.000 .759 treatment
cohort Mean .6344 .07759 95% Confidence Interval for Mean
Lower Bound .4813
Upper Bound .7875
5% Trimmed Mean .4904
Median .0000
Variance 1.120
Std. Deviation 1.05815
Minimum .00
Maximum 5.00
Range 5.00
Interquartile Range 1.00
Skewness 1.883 .178 Kurtosis 3.202 .355

221
Appendix C: Results of Kolmogorov-Smirnov and Shapiro-Wilk Normality Tests
Table 29
Tests of Normality on the Data Set With Outliers Deleted
Cohort Kolmogorov-Smirnova Shapiro-Wilk
Statistic df Sig. Statistic df Sig.
Overall total rule violations in 2013-2014
comparison cohort
.519 37 .000 .363 37 .000
treatment cohort
.178 184 .000 .846 184 .000
Total major rule violations in 2013-2014
comparison cohort
.527 37 .000 .307 37 .000
treatment cohort
.183 184 .000 .844 184 .000
Total minor rule violations in 2013-2014
comparison cohort
.538 37 .000 .155 37 .000
treatment cohort
.371 186 .000 .655 186 .000
Age
comparison cohort
.084 37 .200* .962 37 .237
treatment cohort
.113 191 .000 .950 191 .000
Length of time spent incarcerated on current sentence
comparison cohort
.214 37 .000 .796 37 .000
treatment cohort
.185 184 .000 .778 184 .000
LS/CMI score
comparison cohort
.100 37 .200 .973 37 .499
treatment cohort
.063 191 .062 .983 191 .019

222
Length of time spent in DSU during 2011-2012b
treatment cohort
.121 187 .000 .917 187 .000
Total major rule violations in 2011-2012c
treatment cohort
.122 188 .000 .913 188 .000
Total minor rule violations in 2011-2012
comparison cohort
.538 37 .000 .155 37 .000
treatment cohort
.296 187 .000 .697 187 .000
Note. df = degrees of freedom; Sig. = significance. *. This is a lower bound of the true significance. a. Lilliefors Significance Correction.
b. Length of time spent in DSU during 2011-2012 is constant when cohort = comparison cohort. It has been omitted. c. Total major rule violations in 2011-2012 is constant when cohort = comparison cohort. It has been omitted.
Table 30
Tests of Normality on the Full Data Set
Cohort Kolmogorov-Smirnova Shapiro-Wilk Statistic df Sig. Statistic df Sig.
Overall total rule violations in 2013-2014
comparison cohort
.519 37 .000 .363 37 .000
treatment cohort
.230 191 .000 .704 191 .000
Total major rule violations in 2013-2014
comparison cohort
.527 37 .000 .307 37 .000
treatment cohort
.239 191 .000 .688 191 .000

223
Total minor rule violations in 2013-2014
comparison cohort
.538 37 .000 .155 37 .000
treatment cohort
.336 191 .000 .608 191 .000
Age
comparison cohort
.084 37 .200* .962 37 .237
treatment cohort
.113 191 .000 .950 191 .000
Length of time spent on current sentence
comparison cohort
.214 37 .000 .796 37 .000
treatment cohort
.215 191 .000 .714 191 .000
LS/CMI score
comparison cohort
.100 37 .200* .973 37 .499
treatment cohort
.063 191 .062 .983 191 .019
Length of time spent in DSU during 2011-2012b
treatment cohort
.140 191 .000 .881 191 .000
Total major rule violations in 2011-2012c
treatment cohort
.132 191 .000 .875 191 .000
Total minor rule violations in 2011-2012
comparison cohort
.538 37 .000 .155 37 .000
treatment cohort
.295 191 .000 .644 191 .000
Note. df = degrees of freedom; Sig. = significance. *. This is a lower bound of the true significance. a. Lilliefors Significance Correction. b. Length of time spent in DSU during 2011-2012 is constant when cohort = comparison cohort. It has been omitted. c. Total major rule violations in 2011-2012 is constant when cohort = comparison cohort. It has been omitted.

224
Appendix D: Histograms Depicting the Dependent/Outcome Variables and the
Standardized Residuals
Figure 1. A histogram of the outcome variable of Overall Total Rule Violations in 2013-2014, using the full data set.
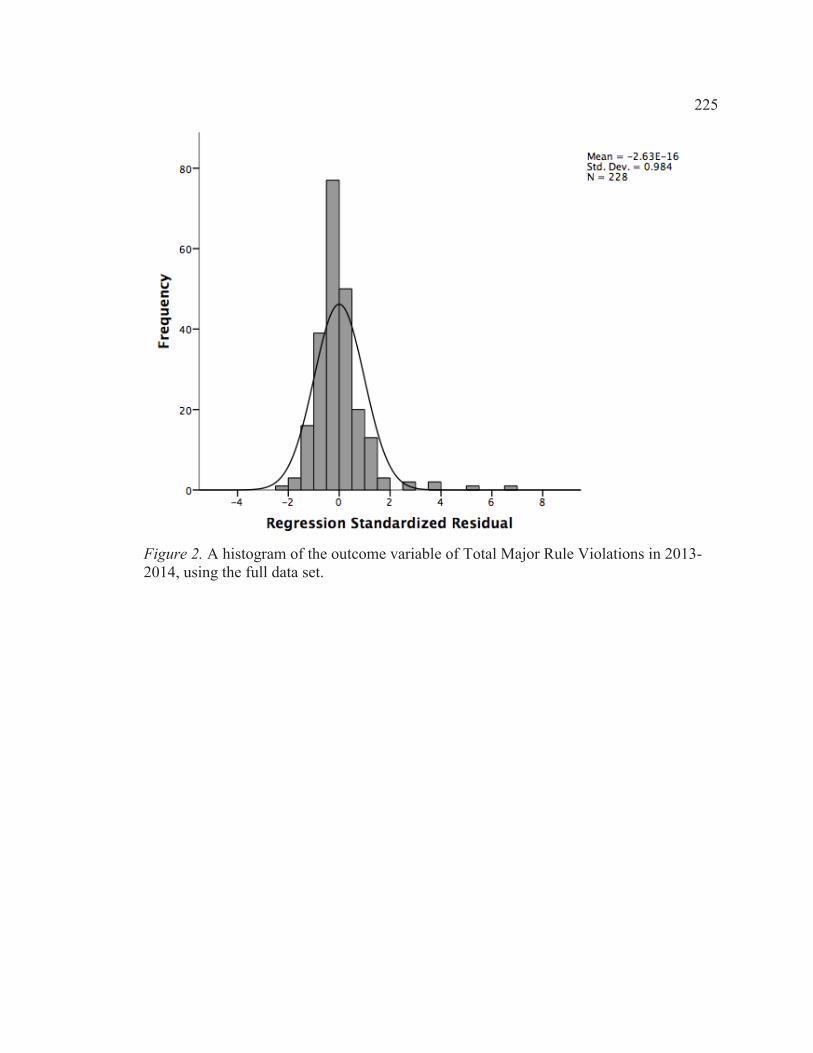
225
Figure 2. A histogram of the outcome variable of Total Major Rule Violations in 2013-2014, using the full data set.

226
Figure 3. A histogram of the outcome variable of Total Minor Rule Violations in 2013-2014, using the full data set.
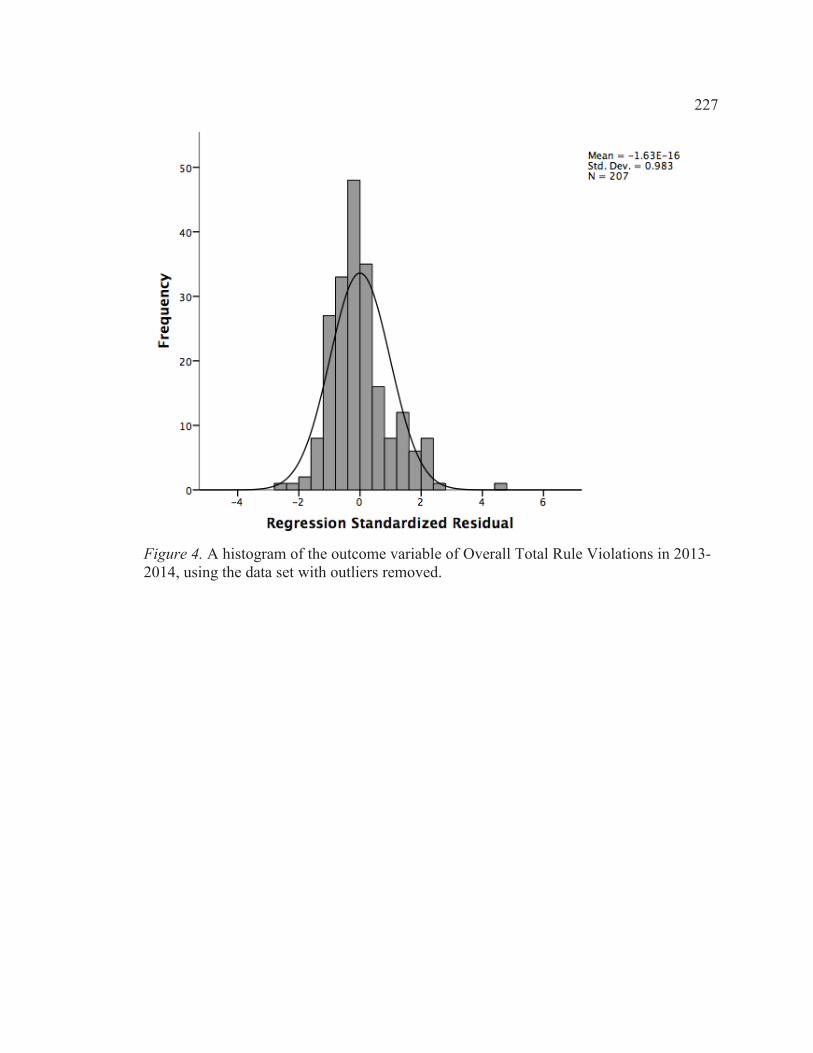
227
Figure 4. A histogram of the outcome variable of Overall Total Rule Violations in 2013-2014, using the data set with outliers removed.

228
Figure 5. A histogram of the outcome variable of Total Major Rule Violations in 2013-2014, using the data set with outliers removed.

229
Figure 6. A histogram of the outcome variable of Total Minor Rule Violations in 2013-2014, using the data set with outliers removed.

230
Appendix E: Normal Probability-Probability Plots of Regression Standardized Residuals
Figure 7. A normal P-P plot of the regression standardized residual with the outcome variable of Overall Total Rule Violations in 2013-2014, using the full data set.

231
Figure 8. A normal P-P plot of the regression standardized residual with the outcome variable of Total Major Rule Violations in 2013-2014, using the full data set.

232
Figure 9. A normal P-P plot of the regression standardized residual with the outcome variable of Total Minor Rule Violations in 2013-2014, using the full data set.

233
Figure 10. A normal P-P plot of the regression standardized residual with the outcome variable of Overall Total Rule Violations in 2013-2014, using the data set with outliers removed.

234
Figure 11. A normal P-P plot of the regression standardized residual with the outcome variable of Total Major Rule Violations in 2013-2014, using the data set with outliers removed.

235
Figure 12. A normal P-P plot of the regression standardized residual with the outcome variable of Total Minor Rule Violations in 2013-2014, using the data set with outliers removed.

236
Appendix F: Scatterplot and Partial Plots of Data With Outcome Variable Overall Total
Rule Violations in 2013-2014, Outliers Removed
Figure 13. A scatterplot with the outcome variable of Overall Total Rule Violations in 2013-2014, using the data set with outliers removed.

237
Figure 14. A partial plot with the variables Overall Total Rule Violations in 2013-2014 and Cohort, using the data set with outliers removed.

238
Figure 15. A partial plot with the variables Overall Total Rule Violations in 2013-2014 and Age, using the data set with outliers removed.

239
Figure 16. A partial plot with the variables Overall Total Rule Violations in 2013-2014 and Length of Time Spent on Current Sentence, using the data set with outliers removed.

240
Figure 17. A partial plot with the variables Overall Total Rule Violations in 2013-2014 and LS/CMI Score, using the data set with outliers removed.
241
Figure 18. A partial plot with the variables Overall Total Rule Violations in 2013-2014 and Prior Major Rule Violations in 2011-2012, using the data set with outliers removed.

242
Figure 19. A partial plot with the variables Overall Total Rule Violations in 2013-2014 and Prior Minor Rule Violations in 2011-2012, using the data set with outliers removed.

243
Figure 20. A partial plot with the variables Overall Total Rule Violations in 2013-2014 and Length of Time Spent in Disciplinary Segregation in 2011-2012, using the data set with outliers removed.

244
Appendix G: Scatterplot and Partial Plots of Data With Outcome Variable Overall Total
Rule Violations in 2013-2014, Full Data Set
Figure 21. A scatterplot with the outcome variable of Overall Total Rule Violations in 2013-2014, using the full data set.

245
Figure 22. A partial plot with the variables Overall Total Rule Violations in 2013-2014 and Cohort, using the full data set.

246
Figure 23. A partial plot with the variables Overall Total Rule Violations in 2013-2014 and Age, using the full data set.

247
Figure 24. A partial plot with the variables Overall Total Rule Violations in 2013-2014 and Length of Time Spent on Current Sentence, using the full data set.

248
Figure 25. A partial plot with the variables Overall Total Rule Violations in 2013-2014 and LS/CMI Score, using the full data set.

249
Figure 26. A partial plot with the variables Overall Total Rule Violations in 2013-2014 and Prior Major Rule Violations in 2011-2012, using the full data set.

250
Figure 27. A partial plot with the variables Overall Total Rule Violations in 2013-2014 and Prior Minor Rule Violations in 2011-2012, using the full data set.

251
Figure 28. A partial plot with the variables Overall Total Rule Violations in 2013-2014 and Length of Time Spent in Disciplinary Segregation in 2011-2012, using the full data set.

252
Appendix H: Scatterplot and Partial Plots of Data With Outcome Variable Total Major
Rule Violations in 2013-2014, Outliers Removed
Figure 29. A scatterplot with the outcome variable of Total Major Rule Violations in 2013-2014, using the data set with outliers removed.

253
Figure 30. A partial plot with the variables Total Major Rule Violations in 2013-2014 and Cohort, using the data set with outliers removed.

254
Figure 31. A partial plot with the variables Total Major Rule Violations in 2013-2014 and Age, using the data set with outliers removed.

255
Figure 32. A partial plot with the variables Total Major Rule Violations in 2013-2014 and Length of Time Spent on Current Sentence, using the data set with outliers removed.

256
Figure 33. A partial plot with the variables Total Major Rule Violations in 2013-2014 and LS/CMI Score, using the data set with outliers removed.

257
Figure 34. A partial plot with the variables Total Major Rule Violations in 2013-2014 and Prior Major Rule Violations in 2011-2012, using the data set with outliers removed.

258
Figure 35. A partial plot with the variables Total Major Rule Violations in 2013-2014 and Prior Minor Rule Violations in 2011-2012, using the data set with outliers removed.

259
Figure 36. A partial plot with the variables Overall Total Major Rule Violations in 2013-2014 and Length of Time Spent in Disciplinary Segregation in 2011-2012, using the data set with outliers removed.

260
Appendix I: Scatterplot and Partial Plots of Data With Outcome Variable Total Major
Rule Violations in 2013-2014, Full Data Set
Figure 37. A scatterplot with the outcome variable of Total Major Rule Violations in 2013-2014, using the full data set.

261
Figure 38. A partial plot with the variables Total Major Rule Violations in 2013-2014 and Cohort, using the full data set.

262
Figure 39. A partial plot with the variables Total Major Rule Violations in 2013-2014 and Age, using the full data set.

263
Figure 40. A partial plot with the variables Total Major Rule Violations in 2013-2014 and Length of Time Spent on Current Sentence, using the full data set.

264
Figure 41. A partial plot with the variables Total Major Rule Violations in 2013-2014 and LS/CMI Score, using the full data set.
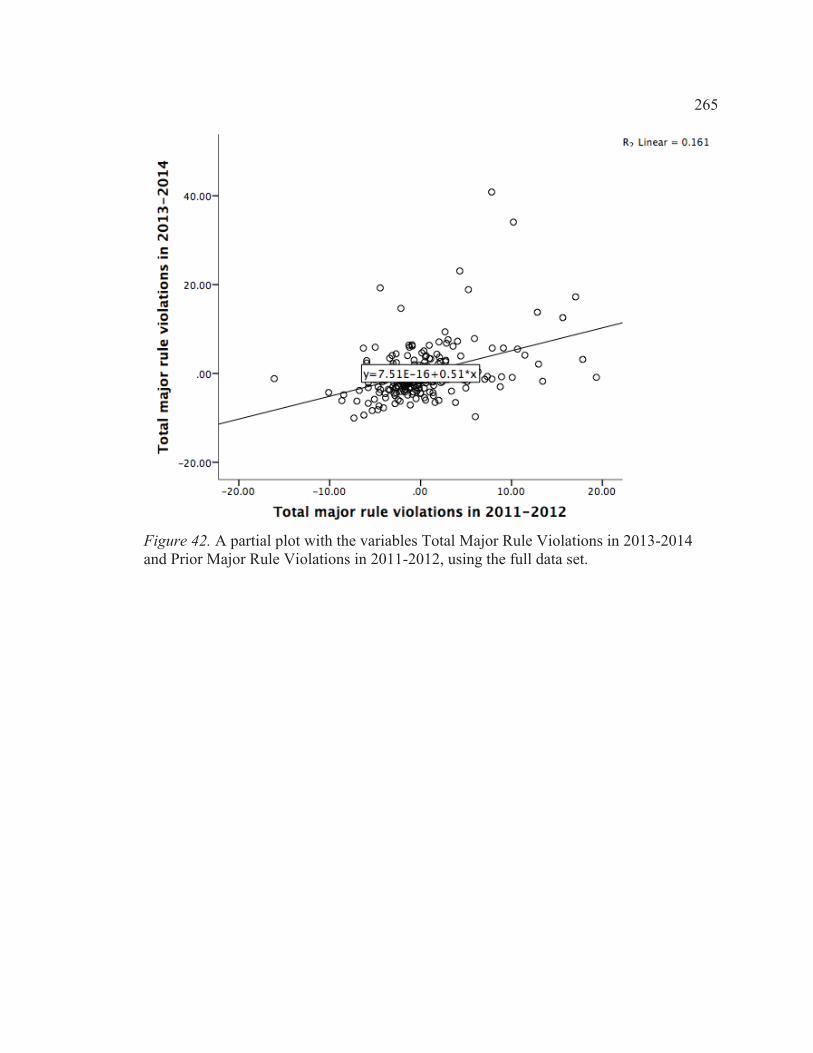
265
Figure 42. A partial plot with the variables Total Major Rule Violations in 2013-2014 and Prior Major Rule Violations in 2011-2012, using the full data set.

266
Figure 43. A partial plot with the variables Total Major Rule Violations in 2013-2014 and Prior Minor Rule Violations in 2011-2012, using the full data set.

267
Figure 44. A partial plot with the variables Total Major Rule Violations in 2013-2014 and Length of Time Spent in Disciplinary Segregation in 2011-2012, using the full data set.

268
Appendix J: Scatterplot and Partial Plots of Data With Outcome Variable Total Minor
Rule Violations in 2013-2014, Outliers Removed
Figure 45. A scatterplot with the outcome variable of Total Minor Rule Violations in 2013-2014, using the data set with outliers removed.

269
Figure 46. A partial plot with the variables Total Minor Rule Violations in 2013-2014 and Cohort, using the data set with outliers removed.

270
Figure 47. A partial plot with the variables Total Minor Rule Violations in 2013-2014 and Age, using the data set with outliers removed.

271
Figure 48. A partial plot with the variables Total Minor Rule Violations in 2013-2014 and Length of Time Spent on Current Sentence, using the data set with outliers removed.

272
Figure 49. A partial plot with the variables Total Minor Rule Violations in 2013-2014 and LS/CMI Score, using the data set with outliers removed.

273
Figure 50. A partial plot with the variables Total Minor Rule Violations in 2013-2014 and Prior Major Rule Violations in 2011-2012, using the data set with outliers removed.

274
Figure 51. A partial plot with the variables Total Minor Rule Violations in 2013-2014 and Prior Minor Rule Violations in 2011-2012, using the data set with outliers removed.

275
Figure 52. A partial plot with the variables Overall Total Minor Rule Violations in 2013-2014 and Length of Time Spent in Disciplinary Segregation in 2011-2012, using the data set with outliers removed.

276
Appendix K: Scatterplot and Partial Plots of Data With Outcome Variable Total Minor
Rule Violations in 2013-2014, Full Data Set
Figure 53. A scatterplot with the outcome variable of Total Minor Rule Violations in 2013-2014, using the full data set.

277
Figure 54. A partial plot with the variables Total Minor Rule Violations in 2013-2014 and Cohort, using the full data set.

278
Figure 55. A partial plot with the variables Total Minor Rule Violations in 2013-2014 and Age, using the full data set.

279
Figure 56. A partial plot with the variables Total Minor Rule Violations in 2013-2014 and Length of Time Spent on Current Sentence, using the full data set.

280
Figure 57. A partial plot with the variables Total Minor Rule Violations in 2013-2014 and LS/CMI Score, using the full data set.

281
Figure 58. A partial plot with the variables Total Minor Rule Violations in 2013-2014 and Prior Major Rule Violations in 2011-2012, using the full data set.
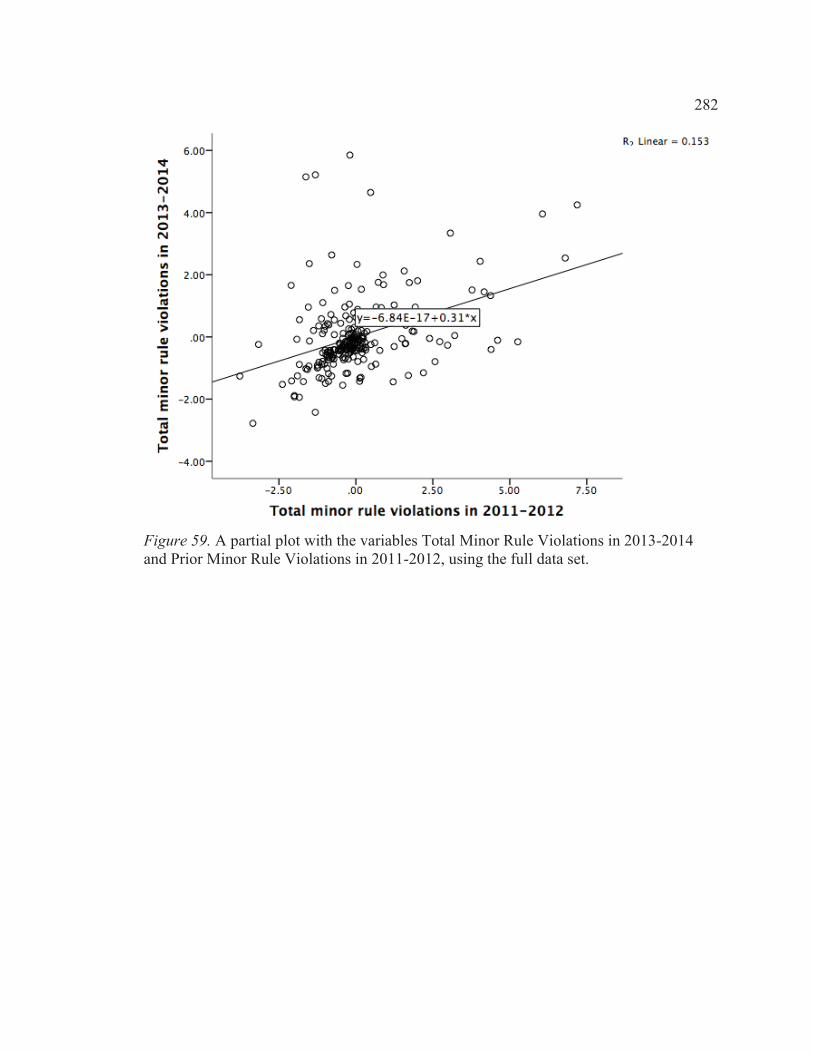
282
Figure 59. A partial plot with the variables Total Minor Rule Violations in 2013-2014 and Prior Minor Rule Violations in 2011-2012, using the full data set.

283
Figure 60. A partial plot with the variables Total Minor Rule Violations in 2013-2014 and Length of Time Spent in Disciplinary Segregation in 2011-2012, using the full data set.