Wahleach Project Water Use Plan
62
Wahleach Project Water Use Plan Wahleach Reservoir Fertilization Program Implementation Year 10 Reference: WAHWORKS-2 Wahleach Reservoir Nutrient Restoration Project Study Period: 2019 Province of British Columbia, Ministry of Environment and Climate Change Strategy, Ecosystems Branch January 27,2021
Transcript of Wahleach Project Water Use Plan

Wahleach Project Water Use Plan
Wahleach Reservoir Fertilization Program
Implementation Year 10
Reference: WAHWORKS-2
Wahleach Reservoir Nutrient Restoration Project
Study Period: 2019
Province of British Columbia, Ministry of Environment and Climate Change Strategy, Ecosystems Branch
January 27,2021

WAHLEACH RESERVOIR NUTRIENT RESTORATION PROJECT REPORT, 2019
by
H.E. Vainionpaa, J.A. Sarchuk, T. Weir and S.L. Harris
Fisheries Project Report No. RD 169 2021
Province of British Columbia Ministry of Environment and Climate Change Strategy
Ecosystems Branch

Wahleach Reservoir Nutrient Restoration Project, 2019 ii
H.E Vainionpaa1, J.A. Sarchuk1, T. Weir2 and S.L. Harris1 1. Ministry of Environment and Climate Change Strategy; Ecosystems Branch, Conservation Science
Section, 315 - 2202 Main Mall, University of British Columbia, Vancouver, BC V6T 1Z4 2. Ministry of Forests, Lands, Natural Resource Operations and Rural Development; Fish and Aquatic
Habitat Branch, PO. Box 9365 Stn. Prov. Govt., Victoria, BC V8W 9M3 Data and information contained within this report are subject to change. Copyright Notice No part of the content of this document may be reproduced in any form or by any means, including storage, reproduction, execution, or transmission without the prior written permission of the Province of British Columbia. Limited Exemption to Non-reproduction Permission to copy and use this publication in part, or in its entirety, for non-profit purposes within British Columbia, is granted to BC Hydro; and Permission to distribute this publication, in its entirety, is granted to BC Hydro for non-profit purposes of posting the publication on a publicly accessible area of the BC Hydro website.

Wahleach Reservoir Nutrient Restoration Project, 2019 iii
Acknowledgements
This project was completed by the Ministry of Environment and Climate Change Strategy, Conservation Science Section under a Memorandum of Understanding with BC Hydro. Field assistance was provided by Robert W. Land, Jessica Bayley, Kevin Gould, Allison Hebert and Claude Himbeault. Climate and hydrometric data were provided by BC Hydro Power Records staff. Taxonomic identification and enumeration of phytoplankton samples were conducted by Darren Brandt, Advanced Eco-Solutions. Identification and enumeration of zooplankton samples were conducted by Lidija Vidmanic, Ecolab Ltd. David Johner and Tyler Weir with the Ministry of Forests, Lands, Natural Resource Operations and Rural Development conducted the hydroacoustic survey. Kokanee spawner enumerations were completed with assistance from Rachel Chudnow, Natasha Sharma, Thomas Smith and Erin Stoddard. Terralink supplied fertilizer for application to Wahleach Reservoir and GFL Environmental transported the fertilizer up the Jones Lake Forest Service Road. The Freshwater Fisheries Society of British Columbia, especially Charlotte Lawson, was responsible for fish stocking, including triploiding, rearing and marking of Cutthroat Trout. Thanks to Greg Andrusak with the Ministry of Forests, Lands, Natural Resource Operations and Rural Development for his advice and snippets of R code for the fish analyses. Toby Michaud of BC Hydro provided support with administration of the project Memorandum of Understanding; an additional thank you to Erin Stoddard, also of BC Hydro, for reviewing the final draft of this report. A warm thank you to Kerry Baird with the British Columbia Conservation Foundation for contract management. Our gratitude is also extended to Nick Collisson, financial analyst with Corporate Services for the Natural Resource Sector. We thank the Jones Lake Cabin Association for their continued support of our program and for allowing continued use of a lot for fertilizer and boat storage. We also appreciate the support from Manjit Kerr-Upal and Dr. Brett van Poorten – Director of the Conservation Science Section and (former) Unit Head of the Applied Freshwater Ecology Research Unit at UBC. Financial support for this project was provided by BC Hydro and the Ministry of Environment and Climate Change Strategy.
Wahleach Reservoir Nutrient Restoration Project, 2019 iv
Executive Summary
The restoration of the Wahleach Reservoir Kokanee population continued in 2019 based on a strategy of nutrient addition in combination with biomanipulation of the food web via stocking of sterile Cutthroat Trout. Physical, chemical and biological parameters were monitored to assess the ecosystem’s response to treatments and to adaptively manage the program. This document is a summary data report for the 2019 monitoring year. In 2019, Wahleach Reservoir was characterized as ultra-oligotrophic using nutrient concentrations and as oligotrophic to mesotrophic using Secchi depths. Patterns and concentrations of nitrogen and phosphorus in the epilimnion were consistent with the seasonal growth of phytoplankton and suggested a rapid uptake and assimilation of useable forms of these nutrients by phytoplankton. The phytoplankton community consisted primarily of edible species throughout the season, except in June and July when increased biomass of inedible blue-green algae, belonging to the class Cyanophyceae, occurred. Small blooms of blue-green algae are common in Wahleach during the summer as water temperatures increase and have not been observed to negatively impact higher trophic levels. The seasonal mean phytoplankton abundance was 3,665 cells∙mL-1 (SD = 2,541) and biomass was 0.59 mm3∙L-1 (SD = 0.56). At the secondary trophic level, Daphnia densities averaged 1.5 individuals∙L-1 and biomass averaged 28 µg∙L-1; Daphnia accounted for 43% of the total zooplankton density and 61% of the total biomass. Both abundance and biomass of other cladocerans was strong early in the season. It is important to stress that the results observed provide a “snapshot” of the plankton community at a given point in time and ultimately reflect a combination of factors that increase or decrease the abundance of the community such as flushing, sinking and grazing. Project monitoring data show that nutrient addition has had a positive bottom-up effect on lower trophic levels, and subsequently on the Kokanee population. Once considered extirpated, Kokanee are now a self-sustaining population in the reservoir. Threespine Stickleback abundance based on hydroacoustic estimates remains relatively low at 78,504, suggesting predation by stocked sterile Cutthroat Trout has had the intended impact on the population density and in turn reduced competition for zooplankton resources. In 2019, the age 0 and age ≥1 Kokanee populations were 26,673 and 10,008 individuals respectively and the escapement estimate was 9,595 spawners. Cutthroat Trout catch from fall 2019 gillnetting included a range of ages from age 1+ to age 8+, with a mean length of 284 ± 56 mm (range 202 to 408 mm) and mean condition factor of 0.92 ± 0.06. Overall, data from Wahleach Reservoir have demonstrated that seasonal nutrient additions are associated with positive ecological effects, particularly for the pelagic food web. Seasonal in situ data are required to adaptively manage nutrient additions and inform restoration actions to ensure that desired outcomes are achieved.

Wahleach Reservoir Nutrient Restoration Project, 2019 v
Table of Contents
List of Figures ......................................................................................................................................... vii
List of Tables ........................................................................................................................................... x
List of Appendices .................................................................................................................................. xii
1. Introduction ...................................................................................................................................... 1
2. Study Area ....................................................................................................................................... 2
3. Methodology .................................................................................................................................... 4 3.1 Restoration Treatments ...................................................................................................... 4 3.1.1 Nutrient Additions ............................................................................................................... 4 3.1.2 Fish Stocking ...................................................................................................................... 5 3.2 Monitoring .......................................................................................................................... 6 3.2.1 Climate ............................................................................................................................... 6 3.2.2 Hydrometrics and Reservoir Operations .............................................................................. 6 3.2.3 Physical and Chemical Limnology ....................................................................................... 6 3.2.4 Phytoplankton ..................................................................................................................... 6 3.2.5 Zooplankton ........................................................................................................................ 7 3.2.6 Fish Populations ................................................................................................................. 7
3.2.6.1 Gillnet and Minnow Trap Surveys ................................................................................. 7 3.2.6.2 Kokanee Spawner Surveys ........................................................................................... 8 3.2.6.3 Hydroacoustic Surveys ................................................................................................. 8
4. Results........................................................................................................................................... 10 4.1 Hydrometrics and Reservoir Operations ............................................................................ 10 4.1.1 Inflow ................................................................................................................................ 10 4.1.2 Discharge ......................................................................................................................... 11 4.1.3 Reservoir Elevation ........................................................................................................... 12 4.2 Climate ............................................................................................................................. 13 4.2.1 Air Temperature ................................................................................................................ 13 4.2.2 Precipitation ...................................................................................................................... 13 4.3 Physical and Chemical Limnology ..................................................................................... 15 4.4 Phytoplankton ................................................................................................................... 22 4.5 Zooplankton ...................................................................................................................... 25 4.6 Fish .................................................................................................................................. 27 4.6.1 Catch & CPUE .................................................................................................................. 27 4.6.2 Kokanee ........................................................................................................................... 27
4.6.2.1 Spawners ................................................................................................................... 29 4.6.3 Rainbow Trout .................................................................................................................. 32 4.6.4 Cutthroat Trout ................................................................................................................. 34 4.6.5 Threespine Stickleback ..................................................................................................... 36 4.6.6 Hydroacoustic Fish Distribution ......................................................................................... 37 4.6.7 Population and Biomass Estimates ................................................................................... 38
5. Discussion ..................................................................................................................................... 38
6. Conclusion ..................................................................................................................................... 40
7. Recommendations ......................................................................................................................... 41

Wahleach Reservoir Nutrient Restoration Project, 2019 vi
8. References .................................................................................................................................... 43
9. Appendices .................................................................................................................................... 47

Wahleach Reservoir Nutrient Restoration Project, 2019 vii
List of Figures
Figure 1. Map of Wahleach Reservoir, BC, including select sampling locations. LS2- SB and LS1-NB are limnological sample locations and 1S, 2F, 3F, 4F, 5S, and 6S are gillnetting locations, with S=Sinking net and F=Floating net. Bathymetric contour depths (m) represent the reservoir at full pool. ................................................................................................................................... 3
Figure 2. Seasonal planned and actual nutrient additions for Wahleach Reservoir, including areal nitrogen and phosphorus loading as well as molar N:P ratios, 2019; planned values are represented by hollow points and dashed line, while actual values are represented by solid points and solid line. ................................................................................................................ 5
Figure 3. Locations of standardized hydroacoustic transects, Wahleach Reservoir, BC. .......................... 9
Figure 4. Daily inflow (m3·s-1), 2019, Wahleach Reservoir, BC. Dashed line is the long-term mean from 1993-2019 for daily inflows..................................................................................................... 11
Figure 5. Daily discharge (m3·s-1), 2019, Wahleach Reservoir, BC. ....................................................... 12
Figure 6. Daily reservoir surface elevation (m, Geodetic Survey of Canada), 2019, Wahleach Reservoir, BC. Open circles represent limnology sampling dates. The red dashed line represents minimum operating level of 628 m. ......................................................................................... 13
Figure 7. Boxplot of daily mean air temperatures (°C) during each month, 2019, Wahleach Reservoir, BC. Black dots represent outliers. ................................................................................................. 14
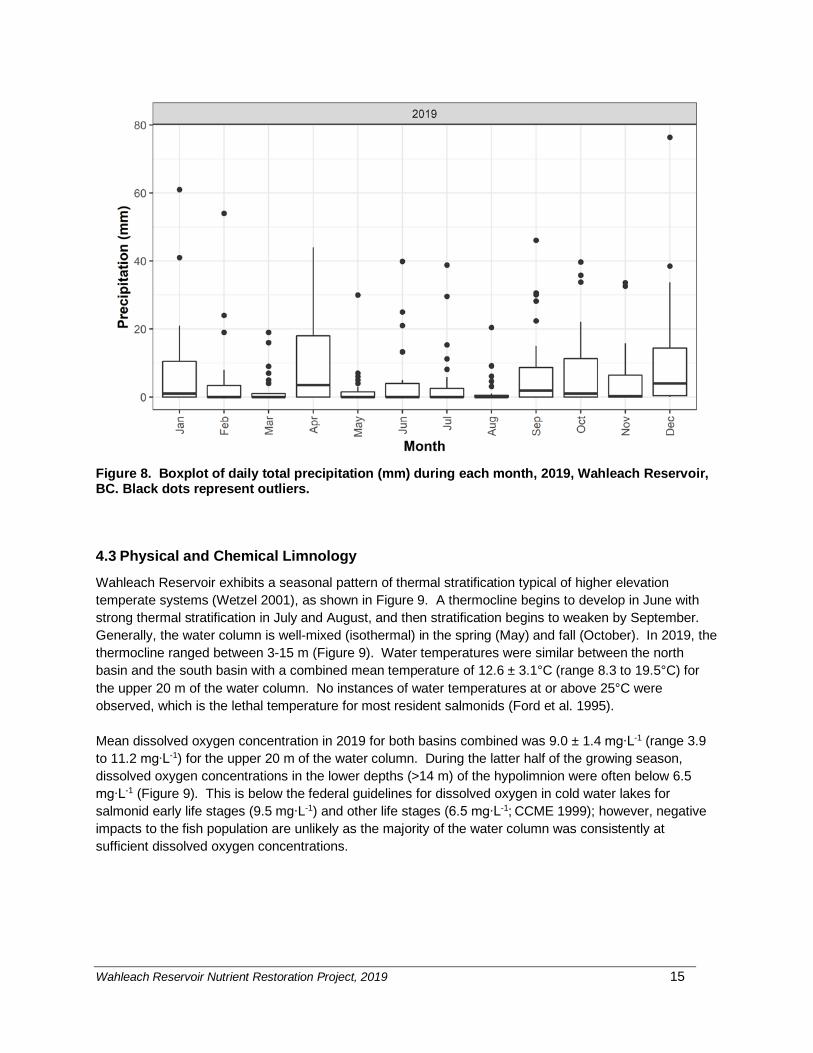
Figure 8. Boxplot of daily total precipitation (mm) during each month, 2019, Wahleach Reservoir, BC. Black dots represent outliers. ................................................................................................. 15
Figure 9. Water temperature (°C) and dissolved oxygen (mg∙L-1) profiles at the north basin (NB-LS1) and south basin (SB-LS2) limnology sampling stations May to October, 2019, Wahleach Reservoir, BC. ........................................................................................................................................ 16
Figure 10. pH values from 1 m water chemistry samples at the north basin (NB) and south basin (SB) limnology stations May to October, 2019, Wahleach Reservoir, BC. Horizontal bars represent seasonal mean for each station.............................................................................................. 17
Figure 11. Alkalinity (mg CaCO3.L-1) values from 1 m water chemistry samples at the north basin (NB) and south basin (SB) limnology stations May to October, 2019, Wahleach Reservoir, BC. Horizontal bars represent seasonal mean for each station. ..................................................... 17
Figure 12. Secchi depths (m) at the north basin (NB) and south basin (SB) limnology sampling stations May to October, 2019, Wahleach Reservoir, BC. Horizontal bars represent seasonal means for each station. .......................................................................................................................... 18
Figure 13. Total phosphorus concentration (µg·L-1) from 1 m water chemistry samples at the north basin (NB) and south basin (SB) limnology stations May to October, 2019, Wahleach Reservoir, BC. .............................................................................................................................................. 19

Wahleach Reservoir Nutrient Restoration Project, 2019 viii
Figure 14. Low level orthophosphate concentrations (µg·L-1) from 1 m water chemistry samples at the north basin (NB) and south basin (SB) limnology stations May to October, 2019, Wahleach Reservoir, BC. ....................................................................................................................... 19
Figure 15. Total nitrogen concentrations (µg·L-1) from 1 m water chemistry samples at the north basin (NB) and south basin (SB) limnology stations May to October, 2019, Wahleach Reservoir, BC; horizontal lines represent seasonal means for each station. ................................................... 20
Figure 16. Low level nitrate + nitrite nitrogen concentrations (µg·L-1) from 1 m discrete water chemistry samples at the north basin (NB) and south basin (SB) limnology stations May to October, 2019, Wahleach Reservoir, BC; black dashed line at 20 µg·L-1 represents the limiting concentration for phytoplankton growth. ....................................................................................................... 21
Figure 17. Total nitrogen (TN) to total phosphorus (TP) ratios based on 1 m water chemistry samples from the north basin (NB) and the south basin (SB) limnology stations May to October, 2019, Wahleach Reservoir, BC. Points above dashed line at 50 were likely in a state of P limitation, while points below dashed line at 20 were likely in a state of N limitation (Guildford and Hecky 2000). .................................................................................................................................... 21
Figure 18. Seasonal phytoplankton abundance (cells·mL-1) by class at the north basin (NB) and south basin (SB) limnology stations May to October, 2019, Wahleach Reservoir BC. No sample was collected in May at the north basin due to unfavourable sampling conditions. ......................... 23
Figure 19. Seasonal phytoplankton abundance (cells·mL-1) by edibility (E=edible, I=inedible, B= both edible and inedible forms) at the north basin (NB) and south basin (SB) limnology station May to October, 2019, Wahleach Reservoir, BC. No sample was collected in May at the north basin due to unfavourable sampling conditions. ............................................................................... 23
Figure 20. Seasonal phytoplankton biovolume (mm3·L-1) by class at the north basin (NB) and south basin (SB) limnology stations May to October, 2019, Wahleach Reservoir, BC. No sample was collected in May at the north basin due to unfavourable sampling conditions. ......................... 24
Figure 21. Seasonal phytoplankton biovolume (mm3.L-1) by edibility (E= edible, I=inedible, B= both edible and inedible forms) at the north basin (NB) and south basin (SB) limnology station May to October, 2019, Wahleach Reservoir, BC. No sample was collected in May at the north basin due to unfavourable sampling conditions. ............................................................................... 24
Figure 22. Monthly zooplankton density (individuals·L-1) by major group (Copepoda, Daphnia and other Cladocera) at the north basin (NB) and south basin (SB) limnology stations, 2019, Wahleach Reservoir, BC. ....................................................................................................................... 26
Figure 23. Monthly zooplankton biomass (µg·L-1) by major group (Copepoda, Daphnia and other Cladocera) at the north basin (NB) and south basin (SB) limnology stations, 2019, Wahleach Reservoir, BC. ....................................................................................................................... 26
Figure 24. Length frequency distribution by age class of Kokanee, 2019, Wahleach Reservoir, BC. ...... 28
Figure 25. Natural logarithm of length weight linear regression (LN W = LN a * LN Lb) of Kokanee, 2019, Wahleach Reservoir, BC. ....................................................................................................... 29
Wahleach Reservoir Nutrient Restoration Project, 2019 ix
Figure 26. Kokanee spawner counts from each index stream (Boulder Creek, Flat Creek, and Jones Creek), 2019, Wahleach Reservoir, BC. ................................................................................. 30
Figure 27. Age frequency of Kokanee spawners in index streams (Boulder Creek, Flat Creek and Jones Creek), 2019, Wahleach Reservoir, BC. ................................................................................. 31
Figure 28. Length frequency distribution by age class of Kokanee spawners in index streams (Boulder Creek, Flat Creek and Jones Creek), 2019, Wahleach Reservoir, BC. .................................... 31
Figure 29. Length frequency by age class of Rainbow Trout in fall nearshore gillnets, 2019, Wahleach Reservoir, BC. ....................................................................................................................... 33
Figure 30. Length weight plot and relationship (Ln W=b · Ln L + Ln a) of Rainbow Trout, 2019, Wahleach Reservoir, BC. ....................................................................................................................... 33
Figure 31. Length frequency of age classes of Cutthroat Trout in fall nearshore gillnets, 2019, Wahleach Reservoir, BC. ....................................................................................................................... 35
Figure 32. Length weight plot and relationship (Ln W = b · Ln L + Ln a) of Cutthroat Trout, 2019, Wahleach Reservoir, BC. ....................................................................................................... 35
Figure 33. Length frequency of Threespine Stickleback caught in fall 2019, Wahleach Reservoir, BC. .. 36
Figure 34. (a) Distribution of ‘All fish’ group densities by size group (small = -66 to -47 dB, large ≥ -46 dB) and depth layer based on hydroacoustic survey, 2019, Wahleach Reservoir, BC. (b) Distribution of Kokanee densities by size group (small = -55 to -47 dB, large ≥ -46 dB) and Kokanee depth layer (8-30 m) based on hydroacoustic survey, 2019, Wahleach Reservoir, BC. .............................................................................................................................................. 37
Wahleach Reservoir Nutrient Restoration Project, 2019 x
List of Tables
Table 1. Annual nutrient additions by weight and areal loading, 2019, Wahleach Reservoir, BC. ............. 5
Table 2. Locations of standard nearshore gillnet and minnow trap stations, 2019, Wahleach Reservoir, BC. .......................................................................................................................................... 7
Table 3. Summary of equipment and conditions for hydroacoustic surveys, 2019, Wahleach Reservoir, BC. .......................................................................................................................................... 8
Table 4. Summary of analysis parameters for hydroacoustic data, 2019, Wahleach Reservoir, BC. ....... 10
Table 5. Summary statistics for seasonal zooplankton density and biomass of each major group (Copepoda, Daphnia and other Cladocera), 2019, Wahleach Reservoir, BC. .......................... 25
Table 6. Summary of fall nearshore gillnetting catch and percentage (%), 2019, Wahleach Reservoir, BC. Species include Cutthroat Trout (CT), Rainbow Trout (RB), Kokanee (KO), and one unknown Trout (UK) which could not be clearly identified due to consumption by Crayfish (Pacifastacus leniusculus). .......................................................................................................................... 27
Table 7. Summary of fall nearshore gillnetting catch for standard RISC panels vs. 1.25” panel, 2019, Wahleach Reservoir, BC. The 1.25” panel was added in 2014. ............................................. 27
Table 8. Summary of Kokanee biometric data, including length, weight, and condition factor (K), 2019, Wahleach Reservoir, BC. ....................................................................................................... 28
Table 9. Summary of Kokanee biometrics by age, 2019, Wahleach Reservoir, BC. ................................ 28
Table 10. Summary of variables in R for Kokanee length weight relationships (Ln W = b · Ln L + Ln a), 2019, Wahleach Reservoir, BC. ............................................................................................. 29
Table 11. Summary of biometric data from spawning Kokanee collected during spawner surveys, 2019, Wahleach Reservoir, BC. Data are for all three index streams (Boulder Creek, Flat Creek, and Jones Creek) were combined as differences between systems were not significant. If fork length (FL) was not measured for an individual, it was calculated based on a regression equation (y = 1.3775x + 27.749, R² = 0.9578) for years (2003-2019) when both POHL and FL were measured. ..................................................................................................................... 30
Table 12. Summary of Kokanee fork length by age, 2019, Wahleach Reservoir, BC. .............................. 30
Table 13. Summary of Rainbow Trout biometric data from fall nearshore gillnetting, including length, weight, and condition factor (K), 2019, Wahleach Reservoir, BC. ........................................... 32
Table 14. Summary of Rainbow Trout biometrics by age, 2019, Wahleach Reservoir, BC. ..................... 32
Table 15. Summary of variables in R for Rainbow Trout length weight relationships (Ln W = b · Ln L + Ln a), 2019, Wahleach Reservoir, BC. ........................................................................................ 34
Table 16. Summary of Cutthroat Trout biometric data, including length, weight, and condition factor (K), 2019, Wahleach Reservoir, BC. ............................................................................................. 34
Wahleach Reservoir Nutrient Restoration Project, 2019 xi
Table 17. Summary of Cutthroat Trout biometrics by age, 2019, Wahleach Reservoir, BC. .................... 34
Table 18. Summary of variables in R for Cutthroat Trout length weight relationships (Ln W = b · Ln L + Ln a), 2019, Wahleach Reservoir, BC. Cutthroat Trout were not present in Wahleach Reservoir prior to nutrient restoration. .................................................................................................... 36
Table 19. Summary of Threespine Stickleback length and weight data from minnow trapping, 2019, Wahleach Reservoir, BC. ....................................................................................................... 36
Table 20. Population estimates with upper and lower confidence intervals for all fish and Kokanee based on hydroacoustic survey, 2019, Wahleach Reservoir, BC. ...................................................... 38
Table 21. Trophic state classification using criteria defined by Wetzel (2001) and Wetzel (1983). Blue shading is indicative of Trophic Classifications during nutrient restoration, 2019, Wahleach Reservoir, BC. ....................................................................................................................... 39
Wahleach Reservoir Nutrient Restoration Project, 2019 xii
List of Appendices
Appendix A. Phytoplankton species detected during 2019, Wahleach Reservoir, BC. ............................ 47
Appendix B. Target strength distributions by depth range (m) from hydroacoustic survey, 2019, Wahleach Reservoir, BC. ....................................................................................................................... 48
Appendix C. Acoustic density distribution by size group (small = -55 to -47 dB, large ≥ -46 dB) and transect, 2019, Wahleach Reservoir, BC. ............................................................................... 49
Appendix D. Zooplankton species detected during 2019, Wahleach Reservoir, BC. .............................. 49

Wahleach Reservoir Nutrient Restoration Project, 2019 1
1. Introduction
The Wahleach Reservoir Nutrient Restoration Project was originally developed as part of a fisheries management strategy focused primarily on the restoration of Kokanee (Oncorhynchus nerka). The first phase of restoration was initiated in 1993, at a time when the recreational fishery on Wahleach Reservoir had collapsed; Rainbow Trout (O. mykiss) were <20 cm and in poor condition, and Kokanee abundance was very low. By 1995 the Kokanee population was considered extirpated (Perrin 1996). The collapse of Wahleach Reservoir fish populations coincided with multiple stressors; foremost was low and declining nutrient availability and subsequent declines in phytoplankton and zooplankton productivity – a pattern typical of ageing reservoirs (Ney 1996, Schallenberg 1993). Resource limitations were exacerbated by an illegal introduction of Threespine Stickleback (Gasterosteus aculeatus) into the reservoir (Scott and Crossman 1973). Recognizing the value of restoring the fish populations in Wahleach Reservoir, the Province of British Columbia (the Province) and BC Hydro embarked on a multi-year restoration project that combined a bottom-up treatment of nutrient addition with a top-down treatment of fish stocking. This was the first nutrient addition project in BC coupled with a direct food web manipulation treatment. Generally, the goal of the Wahleach Reservoir Nutrient Restoration Project is to restore and maintain recreational fish populations. The nutrient addition treatment was meant to increase nitrogen and phosphorus concentrations to optimize food resources for higher trophic levels. It is well established that nutrient additions can compensate for the loss in productivity resulting from dam construction and operation (Stockner and Shortreed 1985, Ashley et al. 1997) by increasing production of phytoplankton and, in turn, zooplankton. Specifically, nutrient additions were intended to promote growth of edible phytoplankton, so that carbon was efficiently transferred through the food web to zooplankton species such as Daphnia spp., which are a key forage item for planktivorous fish like Kokanee (Thompson 1999, Perrin and Stables 2000, Perrin and Stables 2001). By increasing resource availability, nutrient additions play a critical role in increasing planktivorous fish populations. The fish stocking treatment had two purposes: the first was to re-establish the extirpated Kokanee population through short-term supplementation, and the second was to manipulate the food web through the addition of a sterile predator fish species. In some systems, competition between Kokanee and other fish species counteracted the positive effects of nutrient additions (Hyatt and Stockner 1985). So top-down control of competitor fish species would ensure increased productivity from nutrient additions would have the intended effects on the Kokanee population. Sterile Cutthroat Trout (O. clarkii), a known piscivore, were introduced to decrease the Threespine Stickleback population and associated forage pressure on Daphnia to free up resources for Kokanee. The Wahleach Reservoir Nutrient Restoration Project consisted of three phases: baseline data collection completed in 1993 and 1994, nutrient addition treatments and subsequent monitoring completed in 1995 onward, and fish stocking treatments (sterile Cutthroat Trout) completed in 1997 onward. Kokanee were stocked from 1997 to 2004 (with the exception of 2001) to re-establish a base population. Program monitoring includes collection of physical and chemical limnology data, as well as phytoplankton and zooplankton data. Additionally, the fish population is monitored through gillnetting, creel, hydroacoustic, trawl, and Kokanee spawner surveys. Project funding was provided by BC Hydro in 1993 through to 2002 for the initial delivery of the program. While the Water Use Plan (WUP) was in development, limited funding for the 2003 and 2004 seasons was provided to the Ministry of Environment for purchase of fertilizer. In 2005, BC Hydro adopted a WUP to balance water use and stakeholder interests in the watershed. Among other requirements, the WUP introduced reservoir operating constraints and a commitment to the Wahleach Reservoir Nutrient

Wahleach Reservoir Nutrient Restoration Project, 2019 2
Restoration Project (WAHWORKS-2) until 2014 (BC Hydro 2004) when the WUP Order was to be reviewed. The objective of the restoration project as stated in the WUP Terms of Reference (TOR) was to restore and maintain the reservoir’s Kokanee population (BC Hydro 2005, 2006). Various monitoring programs have been completed using an adaptive management approach to assess whether restoration actions have been effective; these programs were generally outlined in the original TOR and in subsequent revisions and addendums (BC Hydro 2005, 2006, 2008, 2010). Although the last year of the WUP was scheduled for 2014, the Province and BC Hydro agreed that the project needed to continue until completion of the WUP Order Review when a long-term decision on the project could be made. As such, an addendum to the TOR was submitted to the Comptroller of Water Rights to continue the project until the WUP Order Review is completed and was approved on April 27, 2015 (BC Hydro 2015). Due to delays in the WUP Order Review process, a three-year Memorandum of Understanding (valid until December 2020) was signed by BC Hydro and the Province to continue the project until the review is completed. This summary report presents data from the 2019 monitoring season. 2. Study Area
Wahleach Reservoir is located at 49°13’N, 121°36’W, approximately 100 km east of Vancouver, British Columbia within the traditional territory of the Sto:lo First Nation (Figure 1). It has a drainage area of 88 km2 with elevations in the basin ranging from 640 m to 2,300 m. The reservoir was created for hydroelectric power generation in 1953 with the construction of a dam at the original lake's outlet stream. Wahleach Reservoir has a surface area of 460 ha, volume of 66 million m3, maximum depth of 29 m and mean depth of 13.4 m. The maximum water surface elevation is 641.6 m (equal to the elevation of the crest of the dam), and the minimum operating elevation is constrained at 628 m (BC Hydro 2004). Inflow into the reservoir is largely uncontrolled occurring via the tributaries of upper Jones Creek, Flat Creek and several unnamed streams. One of the main tributaries situated at the north end of the reservoir near the dam is Boulder Creek. Boulder Creek has been modified with a berm and diversion channel to divert flow from its natural channel (which originally flowed into lower Jones Creek below the dam) into the reservoir. Flows can also be diverted back into the original Boulder Creek channel to meet flow requirements in lower Jones Creek downstream of the dam. At the dam, discharge can be controlled through a water release siphon to lower Jones Creek when the reservoir surface elevation is above 637 m; the dam spillway is ungated and will freely spill when water levels are above the crest elevation. Discharge is also controlled via a power intake and tunnel on the west side of the reservoir that is released into the Fraser River in the Herrling Island Side Channel. Wahleach Reservoir is dimictic with two seasons of complete mixing within the water column (spring and fall), and two seasons of thermal stratification (summer and winter). Ice cover generally occurs from December through March. Fish species in Wahleach Reservoir include: Kokanee, Rainbow Trout, sterile Cutthroat Trout and Threespine Stickleback.

Wahleach Reservoir Nutrient Restoration Project, 2019 3
Figure 1. Map of Wahleach Reservoir, BC, including select sampling locations. LS2- SB and LS1-NB are limnological sample locations and 1S, 2F, 3F, 4F, 5S, and 6S are gillnetting locations, with S=Sinking net and F=Floating net. Bathymetric contour depths (m) represent the reservoir at full pool.
1S
6S
5S
4F
3F 2F
- NB
- SB

Wahleach Reservoir Nutrient Restoration Project, 2019 4
3. Methodology
All figures and analyses contained in this report were completed using R version 3.6.1 (R Core Team 2019). Supporting R packages included doBy and tidyverse. The reported long-term mean values were calculated for the duration of the Wahleach Reservoir Nutrient Restoration Project from 1993-2019. Values used in a comparative context represent baseline conditions from 1993-1994, and nutrient restoration conditions from 1995-2019. Summary statistics were reported as means ± standard deviations. Methods were consistent with those reported in Sarchuk et al. (2019a).
3.1 Restoration Treatments
3.1.1 Nutrient Additions
Agricultural grade liquid ammonium polyphosphate (10-34-0: N-P2O5-K2O; % by weight) and urea-ammonium nitrate (28-0-0: N-P2O5-K2O; % by weight) were added on a weekly basis to Wahleach Reservoir from the first week of June (after thermal stratification) for a period of twenty weeks or until stratification in the reservoir had broken down. The ammonium polyphosphate and urea-ammonium nitrate were blended on-site immediately prior to dispensing. Seasonal ratios of fertilizer blends, timing of the additions, and total amounts added to the reservoir were adjusted seasonally to mimic natural spring phosphorus loadings, compensate for biological uptake of dissolved inorganic nitrogen, and maintain optimal nitrogen to phosphorus ratios for growth of edible phytoplankton. Based on recommendations by Perrin et al. (2006), planned annual phosphorus loading rates for Wahleach Reservoir in past years were kept near 200 mg P·m-2 to improve the production of Daphnia. Beginning in 2016 actual phosphorus loading rates were reduced to approximately half this rate to manage dissolved inorganic nitrogen concentrations and growth of undesirable phytoplankton species. Despite this reduction in phosphorous loading rates, no negative effects on Daphnia growth were observed (Sarchuk et al. 2019a). Nitrogen was added concurrently to keep epilimnetic concentrations above 20 µg∙L-1 (the concentration considered limiting to phytoplankton growth; Wetzel 2001), and to maintain suitable nitrogen to phosphorus ratios. Fertilizer additions during 2019 included nitrogen-only applications (weeks 5-7, 9 and 12) in an effort to prevent nitrogen limitation (Figure 2). Nutrient addition programs in British Columbia (i.e. Arrow Lakes, Kootenay Lake, Alouette Reservoir and Wahleach Reservoir) are adaptively managed based on the results of comprehensive monitoring programs delivered in concert with nutrient applications. In-season modifications are made based on in situ conditions of the system (e.g. Secchi disc transparencies, littoral algal accumulation, weather forecast) and results of the limnological monitoring program. While reservoir productivity is largely governed by nutrient loading, climate also strongly influences the ecosystem response. In 2019, no fertilization occurred during week 2 due to logistical issues (Figure 2, Table 1). During weeks 4 and 12 fertilization was cancelled after assessment of in situ conditions. Actual nutrient loading rates were modified in week 9 when phosphorus loading was omitted, again based on in situ conditions. Overall, weekly areal loading rates for phosphorus were greatest at the start of the season with a maximum of 12.3 mg P·m-2. Nitrogen loading increased rapidly during the first five weeks of the season with a maximum of 112 mg N·m-2 (Figure 2). The weekly molar nitrogen to phosphorus ratio peaked at 34.1 during the latter half of the season when both phosphorus and nitrogen loading rates were being ramped down (Figure 2).

Wahleach Reservoir Nutrient Restoration Project, 2019 5
Figure 2. Seasonal planned and actual nutrient additions for Wahleach Reservoir, including areal nitrogen and phosphorus loading as well as molar N:P ratios, 2019; planned values are represented by hollow points and dashed line, while actual values are represented by solid points and solid line. Table 1. Annual nutrient additions by weight and areal loading, 2019, Wahleach Reservoir, BC.
Year
Date Range Fertilizer Total Phosphorus
Total Nitrogen 10-34-0 28-0-0
t t Kg mg·m-2 Kg mg·m-2 2019 7-Jun to 17-Sep 1.38 12.4 470 51.4 3,609 902
3.1.2 Fish Stocking
Stocking of sterile (triploid) Cutthroat Trout was continued to maintain top-down pressure on the Threespine Stickleback population. In 2019, a total of 2,000 sterile (triploid) Cutthroat Trout (average weight 85.38 g) were stocked into the reservoir. Stocking decisions are evaluated annually based on the previous year’s monitoring results; specifically, indicators include the condition and growth of Cutthroat Trout captured during the fall gillnetting program, as well as acoustic population estimates.

Wahleach Reservoir Nutrient Restoration Project, 2019 6
3.2 Monitoring
3.2.1 Climate
Data were provided by BC Hydro. Analysis methods followed Sarchuk et al. (2019a).
3.2.2 Hydrometrics and Reservoir Operations
Data were provided by BC Hydro. Analysis methods followed Sarchuk et al. (2019a).
3.2.3 Physical and Chemical Limnology
Two sites were sampled monthly from May to October: one in the north at LS1 (EMS ID#E219070; also known as the north basin) and one in the south at LS2 (EMS ID#E219074; also known as the south basin; Figure 1). All physical and chemical limnology data, as well as phytoplankton and zooplankton data were collected from these locations. Parameters measured included water temperature and dissolved oxygen profiles, Secchi disc transparencies and water chemistry (i.e. dissolved and total nutrient concentrations). Discrete water chemistry samples were collected at 1 m (epilimnion) and 20 m (hypolimnion) and a depth-integrated sample of the epilimnion was also collected. All reported values, unless explicitly defined, were from the 1 m epilimnetic samples. Water chemistry samples were analyzed by ALS Laboratory in Burnaby, BC. Samples below detection limits were assigned a value equal to one half of the detection limit for analyses. For additional field sampling and analysis methods refer to Sarchuk et al. (2019a).
3.2.4 Phytoplankton
Depth-integrated samples of the epilimnion were collected monthly from May to October using tygon tubing. Samples were then transferred to glass amber bottles and preserved with acid-Lugol’s solution. Samples were stored in a cool and dark location until analysis. In previous reports phytoplankton analysis was conducted by John Stockner, Eco-Logic Ltd; however, in 2019, analysis was performed by Darren Brandt, Advanced Eco-Solutions. Counts of phytoplankton cells by taxa were completed using an Olympus© inverted plankton microscope. Counting was completed by first examining several random fields (5-10) at low power (250x magnification) for large microplankton (20 to 200 µm), such as colonial diatoms, dinoflagellates, and filamentous blue-green algae. Second, all cells were counted within a single random transect 10 to 15 mm long at high power (900x magnification). High magnification allowed for quantitative enumeration of minute (<2 µm) autotrophic picoplankton sized cells such as Cyanophyceae and small nanoflagellates (2.0-20.0 µm; Chrysophyceae and Cryptophyceae). A minimum count of 250 to 300 cells was targeted for enumeration in each sample to assure statistical accuracy of the results (Lund et al. 1958). The compendium of Canter-Lund & Lund (1995) was used as a taxonomic reference. Annual species richness (or number of species detected), as well as summary statistics (mean, standard deviation, maximum and minimum) for total abundance (cells·mL-1) and total biovolume (mm3·L-1) were reported. In addition to total abundance and biovolume, phytoplankton results were analyzed according to the edibility of each species detected in samples; the three categories used to classify edibility were inedible, edible, and both (i.e. where both edible and inedible forms of the same species were found in a sample; in those cases, the edible and inedible fractions were not determined quantitatively, thus both is represented as its own distinct category). Phytoplankton species detected each year are listed in Appendix A.
Wahleach Reservoir Nutrient Restoration Project, 2019 7
3.2.5 Zooplankton
Zooplankton sampling (duplicate 0-20 m vertical hauls) was conducted monthly from May to October using a Wisconsin plankton net with 150 µm mesh. Samples were analyzed by taxa for density, biomass and fecundity. Values are reported based on taxonomic groups: Daphnia spp. (order Cladocera), other species belonging to the order Cladocera, and species belonging to the subclass Copepoda. For additional field sampling and analysis methods, refer to Sarchuk et al. (2019a).
3.2.6 Fish Populations
Fish populations were assessed through a combination of different survey types: gillnet, minnow trap, hydroacoustic, and spawner counts. A trawl survey was conducted for 2019 but was unsuccessful in capturing targets. For simplification, abbreviated fish species names are used in tables and graphs; these include Kokanee (KO), Rainbow Trout (RB), Cutthroat Trout (CT), and Threespine Stickleback (TSB). 3.2.6.1 Gillnet and Minnow Trap Surveys
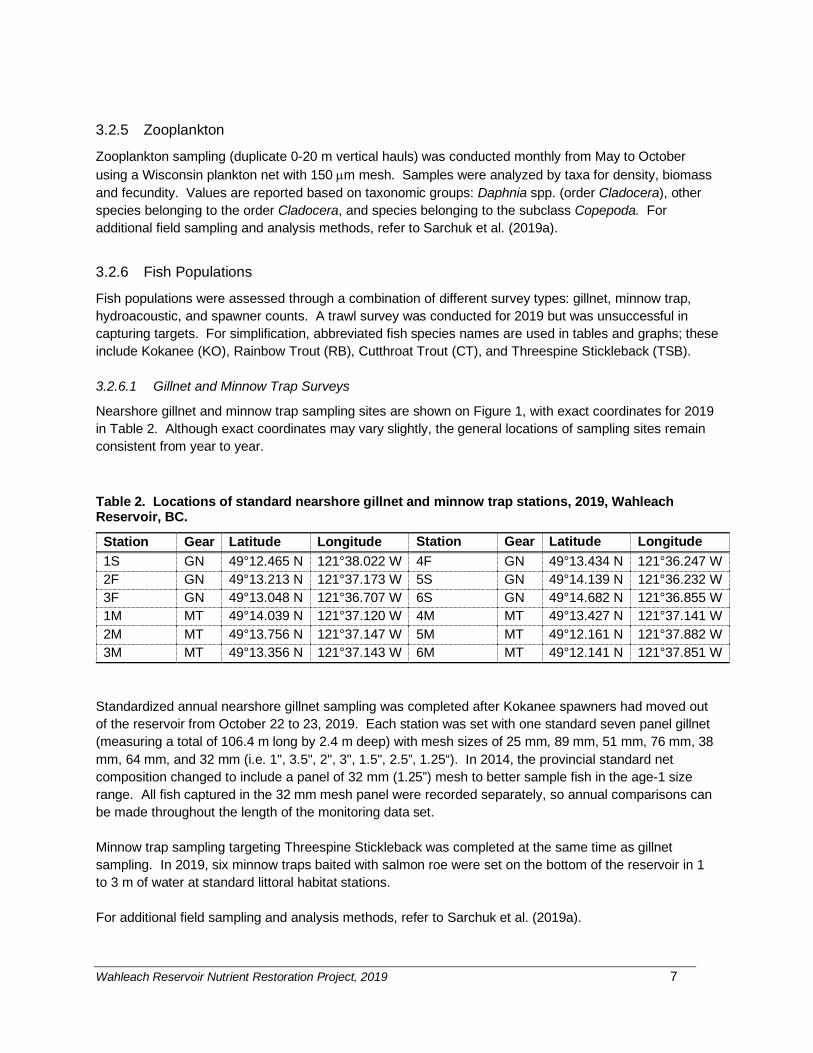
Nearshore gillnet and minnow trap sampling sites are shown on Figure 1, with exact coordinates for 2019 in Table 2. Although exact coordinates may vary slightly, the general locations of sampling sites remain consistent from year to year. Table 2. Locations of standard nearshore gillnet and minnow trap stations, 2019, Wahleach Reservoir, BC.
Station Gear Latitude Longitude Station Gear Latitude Longitude 1S GN 49°12.465 N 121°38.022 W 4F GN 49°13.434 N 121°36.247 W 2F GN 49°13.213 N 121°37.173 W 5S GN 49°14.139 N 121°36.232 W 3F GN 49°13.048 N 121°36.707 W 6S GN 49°14.682 N 121°36.855 W 1M MT 49°14.039 N 121°37.120 W 4M MT 49°13.427 N 121°37.141 W 2M MT 49°13.756 N 121°37.147 W 5M MT 49°12.161 N 121°37.882 W 3M MT 49°13.356 N 121°37.143 W 6M MT 49°12.141 N 121°37.851 W
Standardized annual nearshore gillnet sampling was completed after Kokanee spawners had moved out of the reservoir from October 22 to 23, 2019. Each station was set with one standard seven panel gillnet (measuring a total of 106.4 m long by 2.4 m deep) with mesh sizes of 25 mm, 89 mm, 51 mm, 76 mm, 38 mm, 64 mm, and 32 mm (i.e. 1", 3.5", 2", 3", 1.5", 2.5”, 1.25“). In 2014, the provincial standard net composition changed to include a panel of 32 mm (1.25”) mesh to better sample fish in the age-1 size range. All fish captured in the 32 mm mesh panel were recorded separately, so annual comparisons can be made throughout the length of the monitoring data set. Minnow trap sampling targeting Threespine Stickleback was completed at the same time as gillnet sampling. In 2019, six minnow traps baited with salmon roe were set on the bottom of the reservoir in 1 to 3 m of water at standard littoral habitat stations. For additional field sampling and analysis methods, refer to Sarchuk et al. (2019a).

Wahleach Reservoir Nutrient Restoration Project, 2019 8
3.2.6.2 Kokanee Spawner Surveys
Kokanee spawner escapement in three index streams - Boulder Creek, Flat Creek, and Jones Creek - was estimated using standardized visual surveys. Surveys were conducted weekly on index streams from September 4 to October 9, 2019. For additional field sampling and analysis methods, refer to Sarchuk et al. (2019a). 3.2.6.3 Hydroacoustic Surveys
A hydroacoustic survey was completed in the summer within one week of the new moon along eleven standardized transects (Figure 3, Table 3) using a Simrad EK60 120 kHz split beam system. Survey conditions for 2019 are shown in Table 3. Additional details on field and analysis methods can be found in Sarchuk et al. (2019a). Table 3. Summary of equipment and conditions for hydroacoustic surveys, 2019, Wahleach Reservoir, BC.
Year Survey Date Sounder Reservoir Elevation1 (m)
Avg Transect Start/End Depth (m)
2019 August 7 EK60 639.55 8.1 1. Maximum elevation of 641.6 m (equivalent to the spillway crest elevation)

Wahleach Reservoir Nutrient Restoration Project, 2019 9
Figure 3. Locations of standardized hydroacoustic transects, Wahleach Reservoir, BC.
Population and Biomass
Data were analyzed using Sonar 5 post processing software (version 606.16; Balk and Lindem 2019), from -70 dB to -24 dB, a target size range expected to include all fish within the Reservoir. Data were analyzed from the surface to reservoir bottom while applying a 0-2 m surface exclusion layer. Evaluation of the acoustic target distribution identified -66 dB as the minimum range of the fish size distribution (Appendix B); accordingly, the ‘All Fish’ population was defined as all targets >-66 dB from 2-30 m. The ‘All Fish data’ were separated into two components by visual identification of the inflection point where the more abundant small fish met the remainder of the distribution of larger fish; in 2019 the inflection point was -46 dB (Table 4). Within the ‘All Fish’ group, the small fish component (-66 to -47 dB) included age 0

Wahleach Reservoir Nutrient Restoration Project, 2019 10
Kokanee (i.e. fry) and Threespine Stickleback while the larger size group (≥ -46 dB) represented age ≥1 Kokanee, as well as lesser numbers of Cutthroat Trout and Rainbow Trout. Acoustic data were then partitioned by depth and again by size to further differentiate between species and refine the kokanee population estimates. Depth stratification of acoustic data assumed that targets distributed where water temperatures were <17˚C and dissolved oxygen concentrations >5 mg∙L-1 were primarily Kokanee, as supported by results of previous pelagic gillnetting and directed trawling (Sarchuk et al. 2019a). In 2019, the depth range that met these criteria was 8-30 m. The acoustic distribution within the Kokanee depth range of 8-30 m showed two modes within the small fish component; accordingly, to further refine the age 0 Kokanee population estimate a lower threshold was set at -55 dB to omit the smaller Threespine Stickleback targets. This partitioning was supported by trawl data from previous years that demonstrated size differences between the majority of Threespine Stickleback and age 0 Kokanee, where the Kokanee are generally larger. Appendix C illustrates the acoustic target size distributions portioned by depth, and Table 4 summarizes the depth and size criteria applied. In this report, the 8-30 m estimates are referred to simply as Kokanee populations, specifically age 0 Kokanee and as age ≥1 Kokanee and all Kokanee (all ages combined). Table 4. Summary of analysis parameters for hydroacoustic data, 2019, Wahleach Reservoir, BC.
Group Analysis Depth Range (m)
Small Fish (Age 0) Kokanee dB Thresholds
Large Fish (Age ≥1+) Kokanee dB Thresholds
All Fish 2-30 -66 to -47 ≥ -46 Kokanee 8-30 -55 to -47 ≥ -46
Fish populations were estimated with confidence intervals using a stochastic simulation approach (a Monte Carlo method). Simulations were done in R (R Core Team 2019), producing estimates for all fish size categories within the reservoir, as well as within the Kokanee depth range. Additional details can be found in Sarchuk et al. (2019a). Initial biomass (kg) estimates for Wahleach Reservoir were presented in detail in Sarchuk et al. (2019a); methods were based on a novel approach developed specifically for Wahleach Reservoir and vary from typical biomass estimates reported by the Province for other large lakes and reservoirs in BC. Biomass densities (kg/ha) were not reported for this reason. Methods for this report were consistent with the approach taken in Sarchuk et al. (2019a). 4. Results
4.1 Hydrometrics and Reservoir Operations
4.1.1 Inflow
Mean daily inflow into Wahleach Reservoir during 2019 was 4.6 ± 3.3 m3·s-1 (range 0.8 to 35.4 m3 s-1), which was lower than the long-term mean of 6.2 ± 5.4 m3·s-1 (range 0 to 96.1 m3·s-1). During the nutrient addition period (June to September, inclusive), mean daily inflow was 4.2 ± 2.2 m3·s-1 (range 1.6 to 15.0

Wahleach Reservoir Nutrient Restoration Project, 2019 11
m3·s-1). Peak flows were observed during spring freshet, while consistently high flows were also observed during the fall and winter storm season (Figure 4).
Figure 4. Daily inflow (m3·s-1), 2019, Wahleach Reservoir, BC. Dashed line is the long-term mean from 1993-2019 for daily inflows.
4.1.2 Discharge
Mean daily discharge from Wahleach Reservoir in 2019 was 5.1 ± 4.8 m3·s-1 (range 0 to 12.7 m3·s-1), which was lower than the long-term mean of 6.2 ± 4.7 m3·s-1 (range 0 to 78.6 m3·s-1). During the nutrient addition period, mean daily discharge was 3.3 ± 2.9 m3·s-1 (range 0.3 to 11.2 m3·s-1). Figure 5 shows the annual pattern in discharge, which was highly variable. Generally, discharge was the greatest during high inflow periods associated with fall and winter storms, as well as during spring freshet.

Wahleach Reservoir Nutrient Restoration Project, 2019 12
Figure 5. Daily discharge (m3·s-1), 2019, Wahleach Reservoir, BC.
4.1.3 Reservoir Elevation
Wahleach Reservoir typically reaches its minimum water elevation during the month of April or May; the reservoir is recharged during the annual spring freshet, reaching its maximum water elevation during June or July (which corresponds with the onset of nutrient additions), and then the reservoir is slowly drawn down until April or May the following year. Surface water elevations are generally stable throughout the nutrient addition season, as was observed during 2019; however, particularly low reservoir levels were observed in March when the reservoir elevation fell below the minimum standard operating level of 628 m. The drawdown was 15.8 m in 2019, which was higher than the long-term (1993-2019) mean of 12.1 m (Figure 6).

Wahleach Reservoir Nutrient Restoration Project, 2019 13
Figure 6. Daily reservoir surface elevation (m, Geodetic Survey of Canada), 2019, Wahleach Reservoir, BC. Open circles represent limnology sampling dates. The red dashed line represents minimum operating level of 628 m.
4.2 Climate
4.2.1 Air Temperature
Seasonal air temperatures in 2019 were highest in July and lowest in February (Figure 7). Overall, the mean daily temperature in 2019 (7.0 ± 7.0°C, range -15.7 to 30.2°C) was similar to the long-term mean (7.1 ± 6.8°C, range -22.3 to 33.9°C). During the nutrient addition period (June through September), mean daily temperature was 14.0 ± 3.3°C (range 1.5 to 30.2°C), which was similar to the long-term mean (14.2 ± 3.9°C, range 0.8 to 33.9 °C).
4.2.2 Precipitation
Precipitation generally followed the inverse trend of air temperature; May through August had low precipitation while the fall and winter months generally had high precipitation (Figure 8). Rainfall was highest in April during spring freshet. In 2019, mean daily (6 ± 11 mm, range 0 to 76 mm) precipitation was similar to the long-term mean of 7 ± 13 mm (range 0 to 130 mm), but mean monthly precipitation was lower at 174 ± 98 mm (range 58 to 345 mm) compared to the long-term mean of 217 ± 123 mm (range 7 to 733 mm). A total of 2,084 mm of precipitation fell in 2019, which was the lowest annual precipitation on record and less than the long-term mean of 2,605 ± 283 mm (range 2,084 to 3,124 mm). During the nutrient addition period (June through September), the daily and monthly means for precipitation in 2019 were 4 ± 9 mm (0 to 46 mm) and 134 ± 68 mm (58 to 224 mm), respectively, which were similar to the long-term means of 4 ± 9 mm (0 to 114 mm), and 124 ± 76 mm (8 to 335 mm), respectively. Total

Wahleach Reservoir Nutrient Restoration Project, 2019 14
seasonal precipitation during the nutrient addition period in 2019 was 537 mm, which was also similar to the long-term mean (495 ± 126 mm, range 202 to 746 mm).
Figure 7. Boxplot of daily mean air temperatures (°C) during each month, 2019, Wahleach Reservoir, BC. Black dots represent outliers.
Wahleach Reservoir Nutrient Restoration Project, 2019 15
Figure 8. Boxplot of daily total precipitation (mm) during each month, 2019, Wahleach Reservoir, BC. Black dots represent outliers.
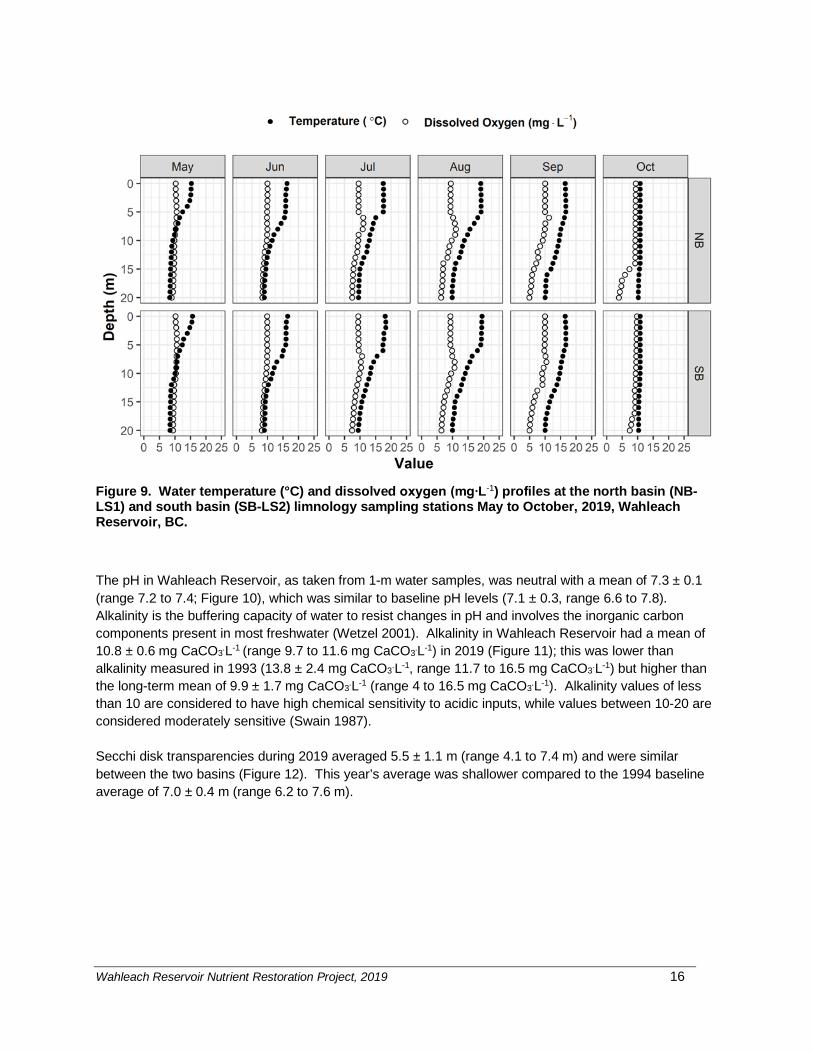
4.3 Physical and Chemical Limnology Wahleach Reservoir exhibits a seasonal pattern of thermal stratification typical of higher elevation temperate systems (Wetzel 2001), as shown in Figure 9. A thermocline begins to develop in June with strong thermal stratification in July and August, and then stratification begins to weaken by September. Generally, the water column is well-mixed (isothermal) in the spring (May) and fall (October). In 2019, the thermocline ranged between 3-15 m (Figure 9). Water temperatures were similar between the north basin and the south basin with a combined mean temperature of 12.6 ± 3.1°C (range 8.3 to 19.5°C) for the upper 20 m of the water column. No instances of water temperatures at or above 25°C were observed, which is the lethal temperature for most resident salmonids (Ford et al. 1995). Mean dissolved oxygen concentration in 2019 for both basins combined was 9.0 ± 1.4 mg∙L-1 (range 3.9 to 11.2 mg∙L-1) for the upper 20 m of the water column. During the latter half of the growing season, dissolved oxygen concentrations in the lower depths (>14 m) of the hypolimnion were often below 6.5 mg∙L-1 (Figure 9). This is below the federal guidelines for dissolved oxygen in cold water lakes for salmonid early life stages (9.5 mg∙L-1) and other life stages (6.5 mg∙L-1; CCME 1999); however, negative impacts to the fish population are unlikely as the majority of the water column was consistently at sufficient dissolved oxygen concentrations.
Wahleach Reservoir Nutrient Restoration Project, 2019 16
Figure 9. Water temperature (°C) and dissolved oxygen (mg∙L-1) profiles at the north basin (NB-LS1) and south basin (SB-LS2) limnology sampling stations May to October, 2019, Wahleach Reservoir, BC. The pH in Wahleach Reservoir, as taken from 1-m water samples, was neutral with a mean of 7.3 ± 0.1 (range 7.2 to 7.4; Figure 10), which was similar to baseline pH levels (7.1 ± 0.3, range 6.6 to 7.8). Alkalinity is the buffering capacity of water to resist changes in pH and involves the inorganic carbon components present in most freshwater (Wetzel 2001). Alkalinity in Wahleach Reservoir had a mean of 10.8 ± 0.6 mg CaCO3.L-1 (range 9.7 to 11.6 mg CaCO3.L-1) in 2019 (Figure 11); this was lower than alkalinity measured in 1993 (13.8 ± 2.4 mg CaCO3.L-1, range 11.7 to 16.5 mg CaCO3.L-1) but higher than the long-term mean of 9.9 ± 1.7 mg CaCO3.L-1 (range 4 to 16.5 mg CaCO3.L-1). Alkalinity values of less than 10 are considered to have high chemical sensitivity to acidic inputs, while values between 10-20 are considered moderately sensitive (Swain 1987). Secchi disk transparencies during 2019 averaged 5.5 ± 1.1 m (range 4.1 to 7.4 m) and were similar between the two basins (Figure 12). This year’s average was shallower compared to the 1994 baseline average of 7.0 ± 0.4 m (range 6.2 to 7.6 m).

Wahleach Reservoir Nutrient Restoration Project, 2019 17
Figure 10. pH values from 1 m water chemistry samples at the north basin (NB) and south basin (SB) limnology stations May to October, 2019, Wahleach Reservoir, BC. Horizontal bars represent seasonal mean for each station.
Figure 11. Alkalinity (mg CaCO3.L-1) values from 1 m water chemistry samples at the north basin (NB) and south basin (SB) limnology stations May to October, 2019, Wahleach Reservoir, BC. Horizontal bars represent seasonal mean for each station.

Wahleach Reservoir Nutrient Restoration Project, 2019 18
Figure 12. Secchi depths (m) at the north basin (NB) and south basin (SB) limnology sampling stations May to October, 2019, Wahleach Reservoir, BC. Horizontal bars represent seasonal means for each station. Vollenweider (1968) found total phosphorus (TP) concentrations below 5 µg∙L-1 were indicative of ultra-oligotrophic productivity, while TP concentrations between 5-10 µg∙L-1 were indicative of oligotrophic productivity. Prior to nutrient restoration, seasonal mean epilimnetic TP was 4.3 ± 2.00µg∙L-1 and ranged from 2.9 to 12.0 µg∙L-1, which was representative of ultra-oligotrophic productivity nearing oligotrophic productivity. In 2019, TP values ranged from 3.0 to 5.5 µg∙L-1 with a seasonal mean of 4.2 ± 0.8 µg∙L-1 indicating phosphorus concentrations remained in the ultra-oligotrophic productivity range (Figure 13). Soluble reactive phosphorous (SRP), a measurement of low-level orthophosphate, is the form of phosphorous readily available to phytoplankton. The SRP concentration during the baseline era was 1.1 ± 0.3 µg∙L-1 with a range of 1 to 2 µg∙L-1. Despite phosphorus additions, all 2019 SRP samples were below the detection limit of 1 µg∙L-1 (Figure 14) which suggests rapid uptake and assimilation of useable phosphorus by phytoplankton.

Wahleach Reservoir Nutrient Restoration Project, 2019 19
Figure 13. Total phosphorus concentration (µg·L-1) from 1 m water chemistry samples at the north basin (NB) and south basin (SB) limnology stations May to October, 2019, Wahleach Reservoir, BC.
Figure 14. Low level orthophosphate concentrations (µg·L-1) from 1 m water chemistry samples at the north basin (NB) and south basin (SB) limnology stations May to October, 2019, Wahleach Reservoir, BC.
Wahleach Reservoir Nutrient Restoration Project, 2019 20
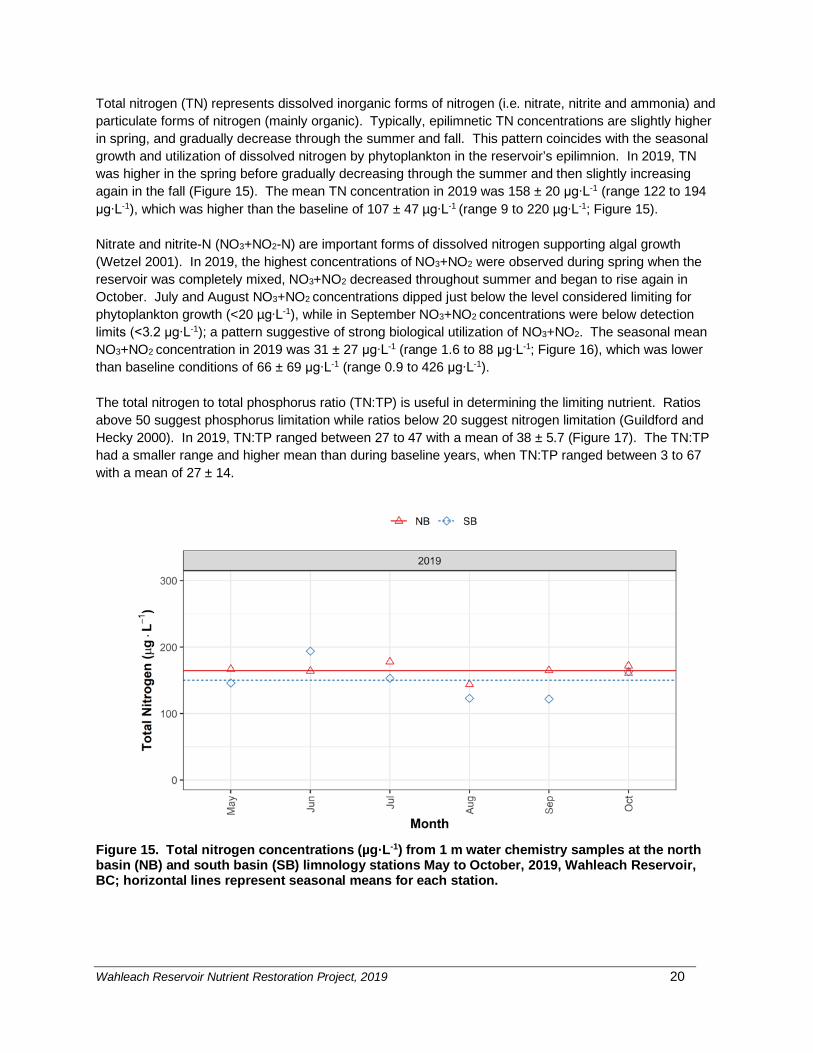
Total nitrogen (TN) represents dissolved inorganic forms of nitrogen (i.e. nitrate, nitrite and ammonia) and particulate forms of nitrogen (mainly organic). Typically, epilimnetic TN concentrations are slightly higher in spring, and gradually decrease through the summer and fall. This pattern coincides with the seasonal growth and utilization of dissolved nitrogen by phytoplankton in the reservoir’s epilimnion. In 2019, TN was higher in the spring before gradually decreasing through the summer and then slightly increasing again in the fall (Figure 15). The mean TN concentration in 2019 was 158 ± 20 µg∙L-1 (range 122 to 194 µg∙L-1), which was higher than the baseline of 107 ± 47 µg∙L-1 (range 9 to 220 µg∙L-1; Figure 15). Nitrate and nitrite-N (NO3+NO2-N) are important forms of dissolved nitrogen supporting algal growth (Wetzel 2001). In 2019, the highest concentrations of NO3+NO2 were observed during spring when the reservoir was completely mixed, NO3+NO2 decreased throughout summer and began to rise again in October. July and August NO3+NO2 concentrations dipped just below the level considered limiting for phytoplankton growth (<20 µg∙L-1), while in September NO3+NO2 concentrations were below detection limits (<3.2 µg∙L-1); a pattern suggestive of strong biological utilization of NO3+NO2. The seasonal mean NO3+NO2 concentration in 2019 was 31 ± 27 µg∙L-1 (range 1.6 to 88 µg∙L-1; Figure 16), which was lower than baseline conditions of 66 ± 69 µg∙L-1 (range 0.9 to 426 µg∙L-1). The total nitrogen to total phosphorus ratio (TN:TP) is useful in determining the limiting nutrient. Ratios above 50 suggest phosphorus limitation while ratios below 20 suggest nitrogen limitation (Guildford and Hecky 2000). In 2019, TN:TP ranged between 27 to 47 with a mean of 38 ± 5.7 (Figure 17). The TN:TP had a smaller range and higher mean than during baseline years, when TN:TP ranged between 3 to 67 with a mean of 27 ± 14.
Figure 15. Total nitrogen concentrations (µg·L-1) from 1 m water chemistry samples at the north basin (NB) and south basin (SB) limnology stations May to October, 2019, Wahleach Reservoir, BC; horizontal lines represent seasonal means for each station.

Wahleach Reservoir Nutrient Restoration Project, 2019 21
Figure 16. Low level nitrate + nitrite nitrogen concentrations (µg·L-1) from 1 m discrete water chemistry samples at the north basin (NB) and south basin (SB) limnology stations May to October, 2019, Wahleach Reservoir, BC; black dashed line at 20 µg·L-1 represents the limiting concentration for phytoplankton growth.
Figure 17. Total nitrogen (TN) to total phosphorus (TP) ratios based on 1 m water chemistry samples from the north basin (NB) and the south basin (SB) limnology stations May to October, 2019, Wahleach Reservoir, BC. Points above dashed line at 50 were likely in a state of P limitation, while points below dashed line at 20 were likely in a state of N limitation (Guildford and Hecky 2000).

Wahleach Reservoir Nutrient Restoration Project, 2019 22
4.4 Phytoplankton A total of 52 phytoplankton species were detected in Wahleach Reservoir during 2019 (Appendix A), which was higher than the 1994 baseline year, when only 38 phytoplankton species were detected. Mean phytoplankton abundance in 2019 was 3,665 ± 2,541 cells∙mL-1 (range 1,074 to 9,042 cells∙mL-1), which was lower than the 1994 baseline year abundance of 8,793 ± 4,929 cells∙mL-1 (4,632 to 20,093 cells∙mL-
1). Abundance in 2019 was driven largely by growth of small blue-green algae belonging to the class Cyanophyceae (Figure 18). Flagellates (Chryso- & Cryptophyceae) were the second most numerically dominant class and were seen throughout the 2019 growing season (Figure 18). The phytoplankton community consisted primarily of edible species and forms throughout the season (2,821 ± 1,645 cells∙mL-1; range 1,054 to 6,234 cells∙mL-1; Figure 19). Inedible fractions (829 ± 975 cells∙mL-1; range 20 to 2,798 cells∙mL-1) were generally low with the exception of June and July when increased abundance of an inedible blue-green algae species occurred. This species was initially thought to be Microcystis sp.; however, further analysis indicates that historically this may actually have been Aphanothece minutissimus, a non-toxin-producing blue-green algae. Further steps will be taken during the 2021 growing season to confirm which of these visually similar species is present in Wahleach. Small blooms of blue-green algae are not uncommon in Wahleach at this time of year and negative impacts to the fish population have not been observed. Phytoplankton biovolume in 2019 was 0.59 ± 0.56 mm3∙L-1 (range 0.07 to 1.62 mm3∙L-1) which was lower than observed during baseline years (0.88 ± 0.51 mm3∙L-1; range 0.20 to 1.90 mm3∙L-1). Early in the season, biovolume was largely driven by blue-green algae and flagellates. During the latter half of the growing season, diatoms (class Bacillariophyceae; e.g., Tabellaria spp.) were the primary contributors to biovolume results (Figure 20). Diatoms and blue-green algae generally made up the inedible biovolume fraction (0.38 ± 0.45 mm3∙L-1; range 0.002 to 1.3 mm3∙L-1); flagellates, chlorophytes and Merismopedia sp. (an edible blue-green algae) generally made up the edible fraction (0.19 ± 0.12 mm3∙L-1; range 0.07 to 0.45 mm3∙L-1). Observed phytoplankton biovolume was mainly due to larger inedible species and forms (Figure 21). It is important to stress that the values measured, and species composition observed provide a “snapshot” of the phytoplankton community at a given point in time. This snapshot does not reflect the instantaneous growth of particular species or size classes, and ultimately it reflects a combination of factors that increase or decrease the abundance of the community such as flushing, sinking and variable zooplankton grazing.

Wahleach Reservoir Nutrient Restoration Project, 2019 23
Figure 18. Seasonal phytoplankton abundance (cells·mL-1) by class at the north basin (NB) and south basin (SB) limnology stations May to October, 2019, Wahleach Reservoir BC. No sample was collected in May at the north basin due to unfavourable sampling conditions.
Figure 19. Seasonal phytoplankton abundance (cells·mL-1) by edibility (E=edible, I=inedible, B= both edible and inedible forms) at the north basin (NB) and south basin (SB) limnology station May to October, 2019, Wahleach Reservoir, BC. No sample was collected in May at the north basin due to unfavourable sampling conditions.

Wahleach Reservoir Nutrient Restoration Project, 2019 24
Figure 20. Seasonal phytoplankton biovolume (mm3·L-1) by class at the north basin (NB) and south basin (SB) limnology stations May to October, 2019, Wahleach Reservoir, BC. No sample was collected in May at the north basin due to unfavourable sampling conditions.
Figure 21. Seasonal phytoplankton biovolume (mm3.L-1) by edibility (E= edible, I=inedible, B= both edible and inedible forms) at the north basin (NB) and south basin (SB) limnology station May to October, 2019, Wahleach Reservoir, BC. No sample was collected in May at the north basin due to unfavourable sampling conditions.
Wahleach Reservoir Nutrient Restoration Project, 2019 25
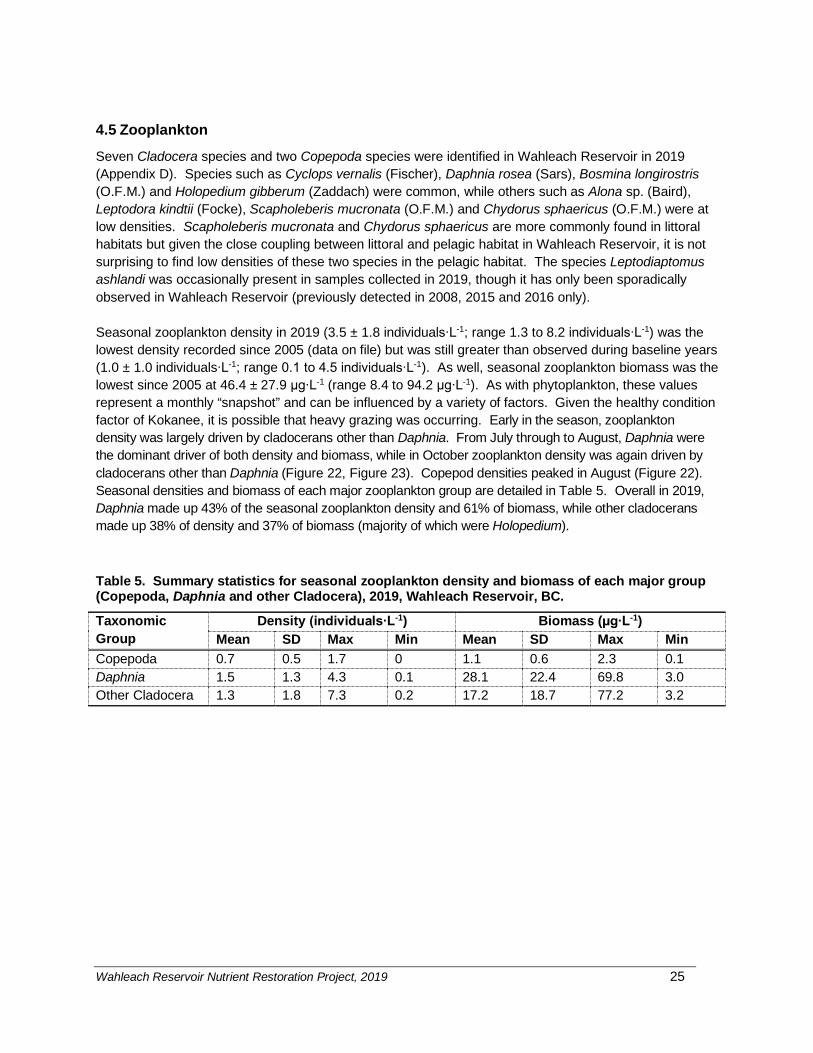
4.5 Zooplankton Seven Cladocera species and two Copepoda species were identified in Wahleach Reservoir in 2019 (Appendix D). Species such as Cyclops vernalis (Fischer), Daphnia rosea (Sars), Bosmina longirostris (O.F.M.) and Holopedium gibberum (Zaddach) were common, while others such as Alona sp. (Baird), Leptodora kindtii (Focke), Scapholeberis mucronata (O.F.M.) and Chydorus sphaericus (O.F.M.) were at low densities. Scapholeberis mucronata and Chydorus sphaericus are more commonly found in littoral habitats but given the close coupling between littoral and pelagic habitat in Wahleach Reservoir, it is not surprising to find low densities of these two species in the pelagic habitat. The species Leptodiaptomus ashlandi was occasionally present in samples collected in 2019, though it has only been sporadically observed in Wahleach Reservoir (previously detected in 2008, 2015 and 2016 only). Seasonal zooplankton density in 2019 (3.5 ± 1.8 individuals∙L-1; range 1.3 to 8.2 individuals∙L-1) was the lowest density recorded since 2005 (data on file) but was still greater than observed during baseline years (1.0 ± 1.0 individuals∙L-1; range 0.1 to 4.5 individuals∙L-1). As well, seasonal zooplankton biomass was the lowest since 2005 at 46.4 ± 27.9 µg∙L-1 (range 8.4 to 94.2 µg∙L-1). As with phytoplankton, these values represent a monthly “snapshot” and can be influenced by a variety of factors. Given the healthy condition factor of Kokanee, it is possible that heavy grazing was occurring. Early in the season, zooplankton density was largely driven by cladocerans other than Daphnia. From July through to August, Daphnia were the dominant driver of both density and biomass, while in October zooplankton density was again driven by cladocerans other than Daphnia (Figure 22, Figure 23). Copepod densities peaked in August (Figure 22). Seasonal densities and biomass of each major zooplankton group are detailed in Table 5. Overall in 2019, Daphnia made up 43% of the seasonal zooplankton density and 61% of biomass, while other cladocerans made up 38% of density and 37% of biomass (majority of which were Holopedium). Table 5. Summary statistics for seasonal zooplankton density and biomass of each major group (Copepoda, Daphnia and other Cladocera), 2019, Wahleach Reservoir, BC.
Taxonomic Group
Density (individuals∙L-1) Biomass (µg∙L-1) Mean SD Max Min Mean SD Max Min
Copepoda 0.7 0.5 1.7 0 1.1 0.6 2.3 0.1 Daphnia 1.5 1.3 4.3 0.1 28.1 22.4 69.8 3.0 Other Cladocera 1.3 1.8 7.3 0.2 17.2 18.7 77.2 3.2

Wahleach Reservoir Nutrient Restoration Project, 2019 26
Figure 22. Monthly zooplankton density (individuals·L-1) by major group (Copepoda, Daphnia and other Cladocera) at the north basin (NB) and south basin (SB) limnology stations, 2019, Wahleach Reservoir, BC.
Figure 23. Monthly zooplankton biomass (µg·L-1) by major group (Copepoda, Daphnia and other Cladocera) at the north basin (NB) and south basin (SB) limnology stations, 2019, Wahleach Reservoir, BC.

Wahleach Reservoir Nutrient Restoration Project, 2019 27
4.6 Fish
4.6.1 Catch & CPUE
Total catch during the nearshore gillnet sampling in 2019 was 97 fish (Table 6). The majority of the catch were Rainbow Trout at 49% while 29% were Kokanee (Table 6). Of the total catch, 34% were caught in the 1.25” mesh panels (Table 7). Catch-per-unit-effort (CPUE) for all species combined in the nearshore gillnetting was 0.06 fish.100m-2.hr-1; however, this is likely an underrepresentation as one of the nets was picked clean of all but one fish by a River Otter (Lontra canadensis). Catch from the minnow trap sampling was 14 Threespine Stickleback and total soak time in 2019 was 107 trap hours with CPUE at 0.1 fish per trap hour. Table 6. Summary of fall nearshore gillnetting catch and percentage (%), 2019, Wahleach Reservoir, BC. Species include Cutthroat Trout (CT), Rainbow Trout (RB), Kokanee (KO), and one unknown Trout (UK) which could not be clearly identified due to consumption by Crayfish (Pacifastacus leniusculus).
Species 20191 % CT 20 21 RB 48 49 KO 28 29 UK 1 1 Total 97 100
1. Includes catch of standard gillnet plus added 1.25” panel Table 7. Summary of fall nearshore gillnetting catch for standard RISC panels vs. 1.25” panel, 2019, Wahleach Reservoir, BC. The 1.25” panel was added in 2014.
Species 2019 - Standard 2019 - 1.25” CT 18 2 RB 22 26 KO 23 5 UK 1 0 Total 64 33
4.6.2 Kokanee
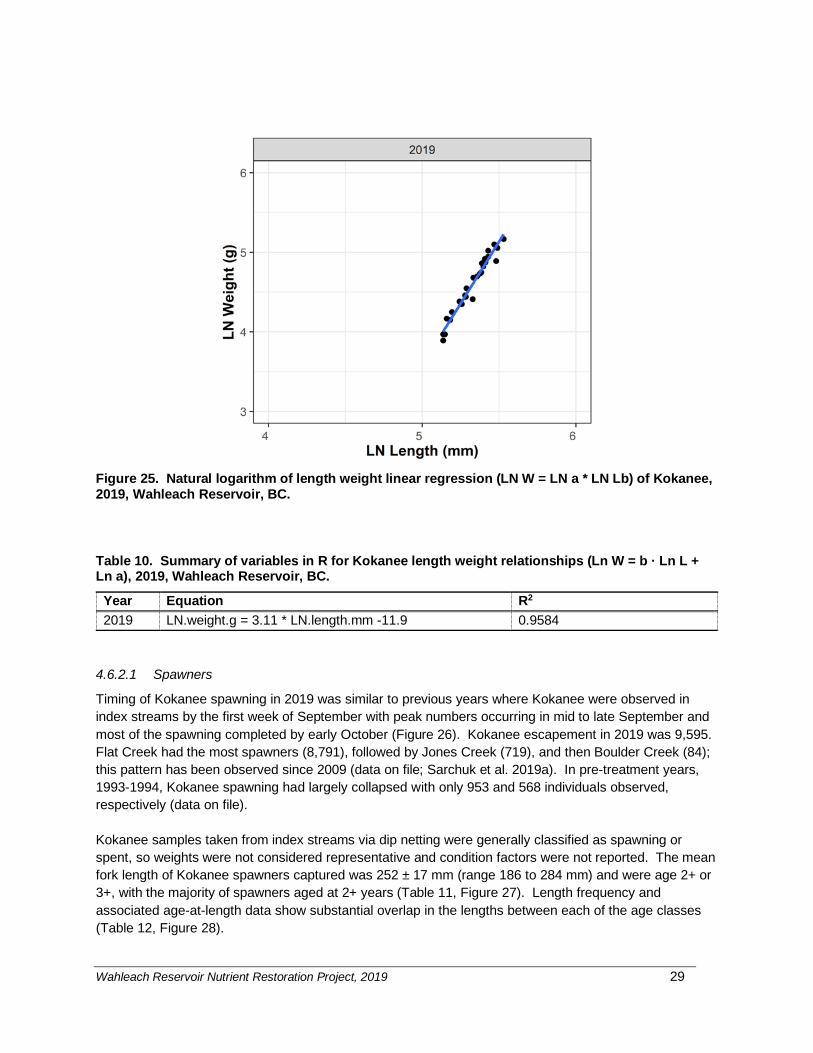
Kokanee captured during the fall nearshore gillnetting program in 2019 ranged from age 1+ to age 3+ (Figure 24) with summary statistics on biometrics presented in Table 8 and Table 9. With the exception of one mature age 3+ female, all Kokanee captured in the fall nearshore gillnetting program were immature, which is expected given the netting program occurred after the Kokanee spawning window. When comparing summary statistics of Kokanee size by age class, individuals caught in 2019 were larger and in better condition than during the baseline years, at which time age 2+ Kokanee had a mean length of 178 mm, mean weight of 55.5 g, and condition factor of 1.0 (data on file). The age 1+ Kokanee captured in 2019 were similar to the age 2+ Kokanee from baseline years (Table 9). Kokanee length-weight regressions based on the 2019 fall nearshore gillnetting data (Figure 25, Table 10), had a slope (b value) of 3.11; b values near 3 are common for fish (Anderson et al. 1983, Cone 1989).

Wahleach Reservoir Nutrient Restoration Project, 2019 28
Table 8. Summary of Kokanee biometric data, including length, weight, and condition factor (K), 2019, Wahleach Reservoir, BC.
Year n Mean Length (mm)
SD Length (mm)
Mean Weight (g)
SD Weight (g)
Mean K
SD K
2019 28 208 24 106.7 36.6 1.1 0.09 Table 9. Summary of Kokanee biometrics by age, 2019, Wahleach Reservoir, BC.
Age Fork Length (mm) Weight (g) Condition Factor (K) n
Mean SD Max Min Mean SD Max Min Mean SD Max Min
1+ 173 4 178 170 55.2 7.5 63.5 49.0 1.1 0.07 1.13 1.00 3
2+ 207 19 237 170 106.0 31.1 164.0 53.0 1.2 0.08 1.28 0.94 19
3+ 232 21 252 198 140.1 30.3 175.5 94.5 1.1 0.10 1.22 0.96 5
Figure 24. Length frequency distribution by age class of Kokanee, 2019, Wahleach Reservoir, BC.
Wahleach Reservoir Nutrient Restoration Project, 2019 29
Figure 25. Natural logarithm of length weight linear regression (LN W = LN a * LN Lb) of Kokanee, 2019, Wahleach Reservoir, BC.
Table 10. Summary of variables in R for Kokanee length weight relationships (Ln W = b · Ln L + Ln a), 2019, Wahleach Reservoir, BC.
Year Equation R2 2019 LN.weight.g = 3.11 * LN.length.mm -11.9 0.9584
4.6.2.1 Spawners
Timing of Kokanee spawning in 2019 was similar to previous years where Kokanee were observed in index streams by the first week of September with peak numbers occurring in mid to late September and most of the spawning completed by early October (Figure 26). Kokanee escapement in 2019 was 9,595. Flat Creek had the most spawners (8,791), followed by Jones Creek (719), and then Boulder Creek (84); this pattern has been observed since 2009 (data on file; Sarchuk et al. 2019a). In pre-treatment years, 1993-1994, Kokanee spawning had largely collapsed with only 953 and 568 individuals observed, respectively (data on file). Kokanee samples taken from index streams via dip netting were generally classified as spawning or spent, so weights were not considered representative and condition factors were not reported. The mean fork length of Kokanee spawners captured was 252 ± 17 mm (range 186 to 284 mm) and were age 2+ or 3+, with the majority of spawners aged at 2+ years (Table 11, Figure 27). Length frequency and associated age-at-length data show substantial overlap in the lengths between each of the age classes (Table 12, Figure 28).

Wahleach Reservoir Nutrient Restoration Project, 2019 30
Figure 26. Kokanee spawner counts from each index stream (Boulder Creek, Flat Creek, and Jones Creek), 2019, Wahleach Reservoir, BC. Table 11. Summary of biometric data from spawning Kokanee collected during spawner surveys, 2019, Wahleach Reservoir, BC. Data are for all three index streams (Boulder Creek, Flat Creek, and Jones Creek) were combined as differences between systems were not significant. If fork length (FL) was not measured for an individual, it was calculated based on a regression equation (y = 1.3775x + 27.749, R² = 0.9578) for years (2003-2019) when both POHL and FL were measured.
Year Fork Length (mm) Age Mean SD Max Min N Mean SD Max Min n
2019 252 17 284 186 55 2.4 0.5 3 2 51
Table 12. Summary of Kokanee fork length by age, 2019, Wahleach Reservoir, BC.
Age Fork Length (mm) Mean SD Max Min N
2+ 250 19 281 186 33 3+ 257 14 284 221 18
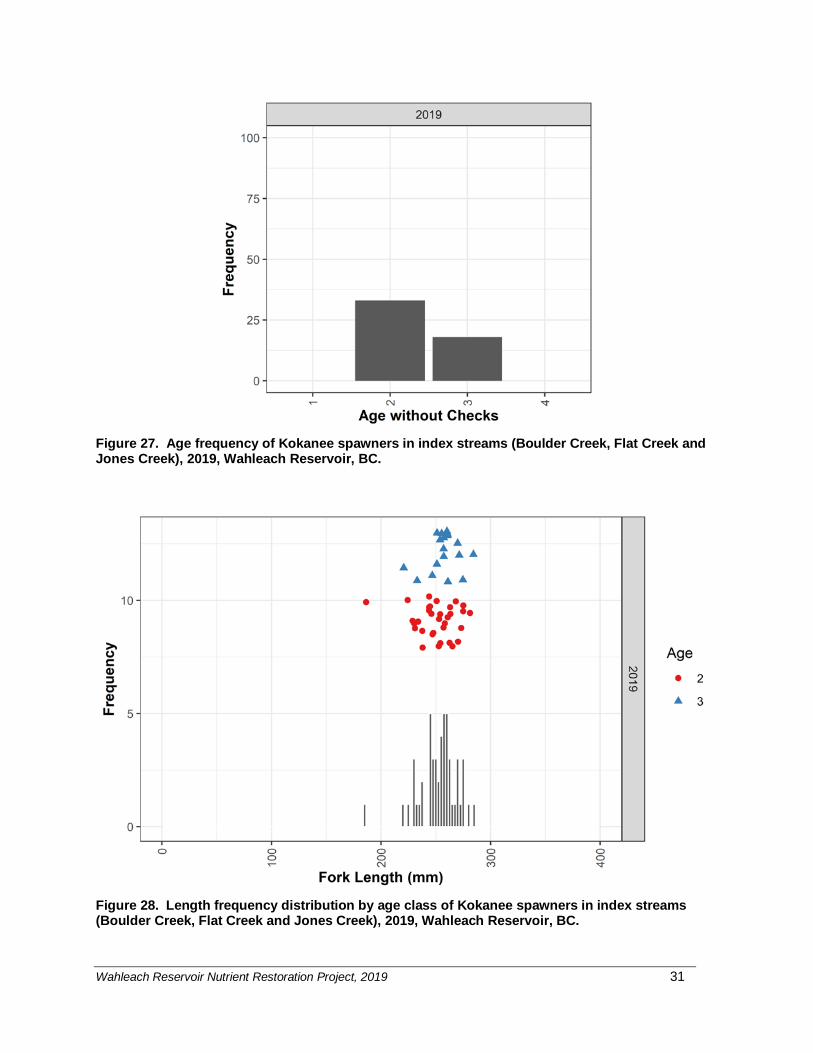
Wahleach Reservoir Nutrient Restoration Project, 2019 31
Figure 27. Age frequency of Kokanee spawners in index streams (Boulder Creek, Flat Creek and Jones Creek), 2019, Wahleach Reservoir, BC.
Figure 28. Length frequency distribution by age class of Kokanee spawners in index streams (Boulder Creek, Flat Creek and Jones Creek), 2019, Wahleach Reservoir, BC.

Wahleach Reservoir Nutrient Restoration Project, 2019 32
4.6.3 Rainbow Trout
In 2019, fall nearshore gillnet sampling captured a total of 48 Rainbow Trout ranging in length from 128 to 274 mm and in weight from 22.5 to 195.0 g (Table 13). Length and weight of Rainbow Trout in 2019 was slightly higher than baseline years which had a mean length of 186 ± 45 mm (range 109 to 329 mm) and mean weight of 72 ± 52 g (range 14 to 316 g). Age 2+ fish represented the majority of the catch in 2019, and catch of older age classes (age 4+) was low (Table 14, Figure 29); this would account for the low mean length and weight in 2019 Rainbow Trout catches. Overall, Fulton’s condition factor (K) for 2019 Rainbow Trout was 1.0 ± 0.10 indicating healthy somatic growth. Rainbow Trout length-weight regressions based on fall nearshore gillnetting data for 2019 are shown in Figure 30. The 2019 length-weight regression slope (b value) was less than 3 indicating a slimmer body shape (Figure 30, Table 15); a regression slope of 3 is common for fish (Anderson et al. 1983, Cone 1989). Table 13. Summary of Rainbow Trout biometric data from fall nearshore gillnetting, including length, weight, and condition factor (K), 2019, Wahleach Reservoir, BC.
Year n Mean Length (mm)
SD Length (mm)
Mean Weight (g)
SD Weight (g)
Mean K
SD K
2019 48 204 41 92.7 48.9 1.0 0.10 Table 14. Summary of Rainbow Trout biometrics by age, 2019, Wahleach Reservoir, BC.
Age Fork Length (mm) Weight (g) Condition Factor (K) n
Mean SD Max Min Mean SD Max Min Mean SD Max Min 1 146 30 180 128 36.7 20.4 60.0 22.5 1.13 0.16 1.31 1.03 3 2 188 31 276 140 72.7 35.6 195.0 33.5 1.03 0.09 1.35 0.91 30 3 248 16 274 214 150.0 16.1 175.5 121.0 0.95 0.07 1.05 0.77 13 4 260 - 260 260 171.0 - 171.0 171.0 0.97 - 0.97 0.97 1

Wahleach Reservoir Nutrient Restoration Project, 2019 33
Figure 29. Length frequency by age class of Rainbow Trout in fall nearshore gillnets, 2019, Wahleach Reservoir, BC.
Figure 30. Length weight plot and relationship (Ln W=b · Ln L + Ln a) of Rainbow Trout, 2019, Wahleach Reservoir, BC.

Wahleach Reservoir Nutrient Restoration Project, 2019 34
Table 15. Summary of variables in R for Rainbow Trout length weight relationships (Ln W = b · Ln L + Ln a), 2019, Wahleach Reservoir, BC.
Year Equation R2 2019 LN.weight.g = 2.68 *LN.length.mm -9.83 0.9864
4.6.4 Cutthroat Trout
Fall nearshore gillnet sampling in 2019 resulted in capture of 20 Cutthroat Trout ranging in length from 202 to 408 mm and in weight from 64.0 to 597.5 g (Table 16). Fulton’s condition factor (K) had a mean of 0.92 indicating healthy somatic growth. Cutthroat Trout caught during 2019 ranged from age 1+ to 8+ with age 1+ representing most of the catch (Table 17, Figure 31). The length-weight regression slope (b value) for Cutthroat Trout in 2019 was close to 3 (Figure 32, Table 18); b values near 3 are common for fish (Anderson et al. 1983, Cone 1989). Table 16. Summary of Cutthroat Trout biometric data, including length, weight, and condition factor (K), 2019, Wahleach Reservoir, BC.
Year n Mean Length (mm)
SD Length (mm)
Mean Weight (g)
SD Weight (g)
Mean K
SD K
2019 20 284 56 231.5 138.3 0.92 0.06 Table 17. Summary of Cutthroat Trout biometrics by age, 2019, Wahleach Reservoir, BC.
Age Fork Length (mm) Weight (g) Condition Factor (K) n Mean SD Max Min Mean SD Max Min Mean SD Max Min
1+ 242 19 267 202 134.1 34.4 173.5 64.0 0.92 0.07 1.04 0.78 10
3+ 319 36 351 259 299.2 79.2 372.5 174.5 0.90 0.07 1.00 0.83 5
5+ 369 40 408 328 466.8 132.5 597.5 332.5 0.91 0.03 0.94 0.88 3
8+ 304 - 304 304 250.5 - 250.5 250.5 0.89 - 0.89 0.89 1 *Dashes (-) indicate no data.
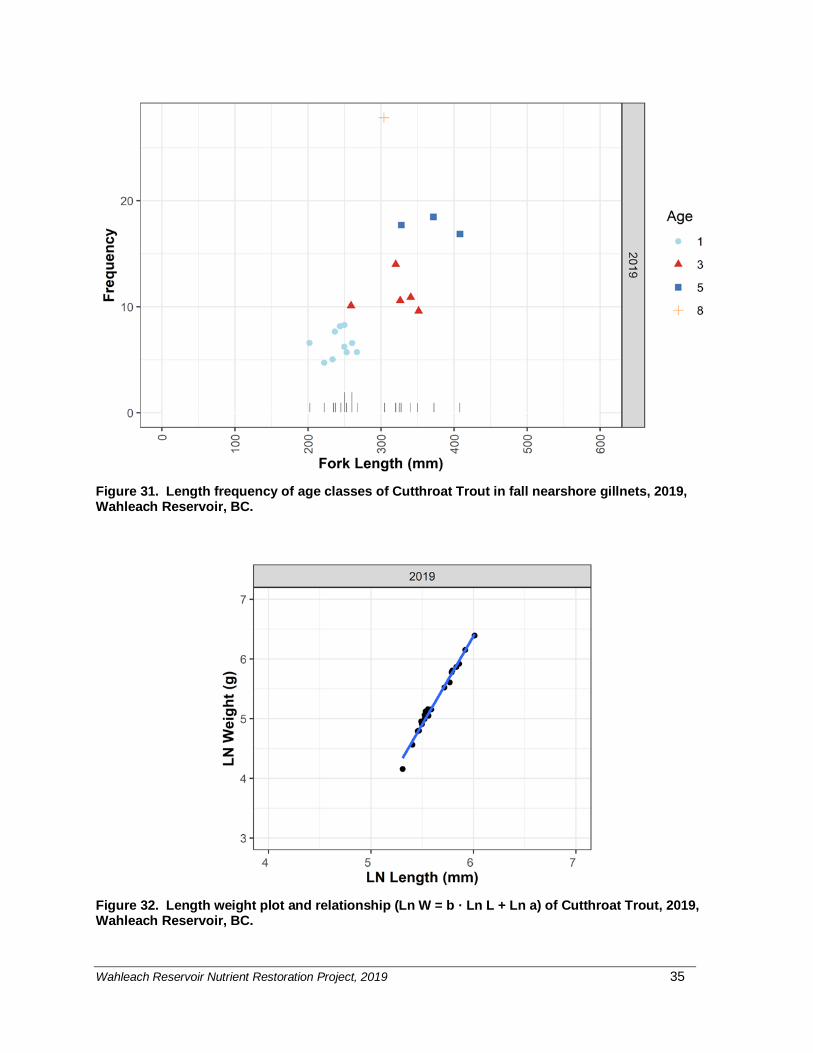
Wahleach Reservoir Nutrient Restoration Project, 2019 35
Figure 31. Length frequency of age classes of Cutthroat Trout in fall nearshore gillnets, 2019, Wahleach Reservoir, BC.
Figure 32. Length weight plot and relationship (Ln W = b · Ln L + Ln a) of Cutthroat Trout, 2019, Wahleach Reservoir, BC.

Wahleach Reservoir Nutrient Restoration Project, 2019 36
Table 18. Summary of variables in R for Cutthroat Trout length weight relationships (Ln W = b · Ln L + Ln a), 2019, Wahleach Reservoir, BC. Cutthroat Trout were not present in Wahleach Reservoir prior to nutrient restoration.
Year Equation R2 2019 LN.weight.g = 2.96 *LN.length.mm -11.4 R2=0.9855
4.6.5 Threespine Stickleback
Littoral minnow traps set in 2019 captured a total of 14 Threespine Stickleback with a range of 34-44 mm in length and 0.3-0.5 g in weight (Table 19, Figure 33). Threespine Stickleback catch remained lower than the 1994 baseline year (n=65). Table 19. Summary of Threespine Stickleback length and weight data from minnow trapping, 2019, Wahleach Reservoir, BC.
Year n Mean Length (mm)
SD Length (mm)
Mean Weight (g)
SD Weight (g)
2019 14 39 3 0.5 0.1
Figure 33. Length frequency of Threespine Stickleback caught in fall 2019, Wahleach Reservoir, BC.

Wahleach Reservoir Nutrient Restoration Project, 2019 37
4.6.6 Hydroacoustic Fish Distribution
Distribution of ‘All fish’ group (all spp & size all depths) shows two modes evident in the small fish (Figure 34a). The Threespine Stickleback represents the mode higher up in the 4-6 m layer, while the deeper small fish mode is both Threespine Stickleback and Kokanee fry (Figure 34a). For large fish some Cutthroat Trout and Rainbow Trout were evident in the 6-8m layer, while Kokanee Age 1-3+ peak in the 12-14 m layer (Figure 34a). Figure 34b identifies the distribution of Kokanee specifically, age 0 peaks at 12 m. And Kokanee Age 1-3+ peak at 12-14 m as noted as well in Figure 34a.
Figure 34. (a) Distribution of ‘All fish’ group densities by size group (small = -66 to -47 dB, large ≥ -46 dB) and depth layer based on hydroacoustic survey, 2019, Wahleach Reservoir, BC. (b) Distribution of Kokanee densities by size group (small = -55 to -47 dB, large ≥ -46 dB) and Kokanee depth layer (8-30 m) based on hydroacoustic survey, 2019, Wahleach Reservoir, BC.
(a)
(b)

Wahleach Reservoir Nutrient Restoration Project, 2019 38
4.6.7 Population and Biomass Estimates
The total fish abundance for all depths (2-30 m), representing a mixed species assemblage, was ~116,000 (ranging from ~100,000 to 132,000 individuals). The acoustic population for small fish was estimated at 105,000 (ranging from ~90,000 to 120,000) individuals in 2019, with ~ 78,000 of those being Threespine Stickleback (Table 20). Age 0 Kokanee abundance was ~26,000 individuals (ranging from ~22,000 to 31,000) and adult Kokanee (age ≥1) abundance in 2019 was ~10,000 individuals (ranging from 7,000 to 13,000), which is the lowest on record (Table 20; data on file). In 2019, the total biomass of fish (all species) was estimated at 1,008 kg, which was below the average of 1,780 kg from 2009-2019 (data on file). Generally, biomass was driven by the abundance of fish in the large size group, which was primarily made up of adult Kokanee. Table 20. Population estimates with upper and lower confidence intervals for all fish and Kokanee based on hydroacoustic survey, 2019, Wahleach Reservoir, BC.
Year Analysis Depths (m)
Group Population Estimate
Lower CI Upper CI
2019 2-30 All Fish 116,047 99,772 131,995 2019 2-30 Small Fish 105,177 90,180 120,060 2019 2-30 Large Fish 10,727 7,575 13,944 2019 8-30 All KO 36,670 30,410 42,907 2019 8-30 KO Fry 26,673 22,256 31,191 2019 8-30 Adult KO 10,008 7,052 12,972
5. Discussion
The importance of monitoring to the success of restoration projects has long been recognized. Monitoring allows for adaptive management and evaluation of the effectiveness of chosen restoration strategies. At the outset of the WUP, the key uncertainty identified was whether the nutrient restoration project would be able to maintain the Kokanee population in the reservoir (BC Hydro 2006). Trophic State & Nutrient Dynamics
Compelling evidence in the scientific literature supports the relationship between the quantity of nitrogen and phosphorus entering a system and the measured productive response (e.g. Schindler et al. 1971, Vollenweider 1968, 1976). The Wahleach Reservoir Nutrient Restoration Project was based on these known links between nutrient availability and productivity. The intent of nutrient additions was to increase productivity, while maintaining the trophic state within the range of ultra-oligotrophic to oligotrophic to mimic conditions typical of coastal British Columbia systems (Northcote and Larkin 1956, Stockner and Shortreed 1985). Productivity directly measured through a variety of methods (e.g. radio-labelled carbon, oxygen production or dissolved inorganic carbon uptake measurement) require a high degree of technical expertise and effort and is commonly used to assess the trophic status of lakes and reservoirs including those with nutrient addition programs (e.g. Harris 2015, Schindler et al. 2014, Stephens and MacKenzie-Grieve 1973). The benefit of primary productivity measurements is that they are a direct assessment of a primary productivity, and unlike abundance and biomass measurements, are not confounded by losses such as grazing, sinking and transport. In the absence of direct primary productivity data, other

Wahleach Reservoir Nutrient Restoration Project, 2019 39
parameters were used to assess the reservoir’s trophic state and response to nutrient restoration, including total phosphorus, total nitrogen, and Secchi transparency depths. In 2019, Wahleach Reservoir was characterized by ultra-oligotrophic conditions in terms of nutrient concentrations and exhibited Secchi transparency depths indicative of oligotrophic to mesotrophic conditions, which is normal for Wahleach (Table 21). Table 21. Trophic state classification using criteria defined by Wetzel (2001) and Wetzel (1983). Blue shading is indicative of Trophic Classifications during nutrient restoration, 2019, Wahleach Reservoir, BC.
Parameter (Units)
Mean ± SD (Range)
Trophic Classification, Mean (Range)
2019 Ultra-Oligotrophic
Oligotrophic Mesotrophic Eutrophic
TP (µg∙L-1) 4.2 ± 0.8 (3.0 to 5.5)
(< 1-5) 8 (3-18)
27 (11-96)
84 (16-386)
TN (µg∙L-1) 158 ± 20 (122 to 194)
(< 1-250) 661 (307-1,630)
753 (361-1,387)
1,875 (396-6,100)
Secchi (m) 5.5 ± 1.1 (4.1 to 7.4)
- 9.9 (5.4-29.3)
4.2 (1.5-8.1)
2.5 (0.8-7.0)
Patterns and concentrations of nitrogen and phosphorus in the epilimnion were consistent with the seasonal growth of phytoplankton and suggested a rapid uptake and assimilation of useable forms of nutrients by phytoplankton. In terms of nutrient loading from fertilizer additions, actual loads deviated from the annual plan several times in 2019. In week 2, changes were due to a logistical challenge, while cancellations in weeks 4 and 12 were to avoid unwanted phytoplankton blooms where in-situ conditions suggested high particulates were present in the water. A minor deviation also took place during week 9 when phosphorus loading was omitted based on in-situ conditions. Planned nutrient loading strategies will continue to be revised in response to changing reservoir and climatic conditions noted during data reviews, as will actual in-season loading based on incoming monitoring data. Phytoplankton Edibility & Zooplankton Community
Keeping the dynamic nature of phytoplankton and zooplankton communities in mind when interpreting monitoring results, monitoring the response of these two trophic levels allows us to assess the efficacy of nutrient addition strategies at stimulating certain species or groups of species that will in turn lead to desired outcomes at higher trophic levels, such as the fish community. Nutrient additions were meant to stimulate the production of edible phytoplankton, so carbon is efficiently transferred to the production of desirable zooplankton species, particularly Daphnia - a large bodied zooplankter that is the preferred forage for Kokanee (Thompson 1999). Ideally, phytoplankton are quickly ingested and assimilated by Daphnia, and would therefore leave minimal evidence of enhancement at the phytoplankton trophic level. The phytoplankton community in 2019 consisted of edible species throughout the season that would support the growth of the zooplankton community. Zooplankton abundance and density across all major taxonomic groups has increased since the nutrient restoration project began (data on file). The most significant result has been the appearance of Daphnia. Daphnia metrics in 2019 were at average levels

Wahleach Reservoir Nutrient Restoration Project, 2019 40
when compared to the most recent five-year review period (Sarchuk et al. 2019a). The abundance and biomass of other cladocerans was dominant early in the 2019 season prior to the onset of Daphnia growth, which is common in Wahleach and seen in previous years (data on file). Overall, zooplankton densities and biomass in 2019 were lower than values observed in recent years (Sarchuk et al. 2019b, Vainionpaa et al. 2020) but were high compared to earlier years of the study and demonstrate an increase in food availability for Kokanee. The baseline (1993-94) zooplankton community consisted of Bosmina longirostris, Cyclops sp., and Holopedium gibberum and no Daphnia (data on file) were found. Fish Population Response
In 2019, the hydroacoustic data indicate that Kokanee abundance was down from the previous year (Vainionpaa et al. 2020). The 2019 hydroacoustic age ≥1+ Kokanee population was the lowest recorded (since 2009; data on file) at 10,008 individuals. The Kokanee fry abundance in 2019 was ~26,600 which was also low relative to past years but was up slightly from ~20,000 in 2018. The 2019 total gillnet catch was also down and was less than half of the previous year (Vainionpaa et al. 2020), however one of the six standard nearshore gillnets was picked clean of all but one fish by a River Otter. This net location (2F) typically has one of the highest catches, with an average catch over the last five years (2014-2018) of 42 fish (data on file). Coinciding with the reduced Kokanee abundance, a density-dependant growth response culminated in increased size and condition relative to recent years when abundance was higher. Kokanee size and condition in 2019 remained well above baseline years (Perrin 2001). The annual estimate of Threespine Stickleback abundance from the hydroacoustic surveys was estimated at 78,504, which was higher than the previous two years but similar to the long-term average of 81,000 (2009-2019). This increase could be partially due to the methodology change in how the hydroacoustic data were analyzed. In 2019 the Kokanee fry and Threespine Stickleback acoustic size modes were well defined within the small fish group of the Kokanee depth layer, allowing for higher confidence in size-based partitioning but resulting in a modification from past analyses methodology where the size break was less evident. In order to standardize the methodology and increase precision in annual estimates of both age 0 Kokanee and Threespine Stickleback abundances, we recommend re-analysis of the acoustic timeseries data by applying the method for acoustic noise reduction developed for Kinbasket and Revelstoke acoustic data (see Sebastian and Weir 2015). This revised approach should result in more precise and robust estimates for both species. While minnow traps are set annually in littoral areas (14 Threespine Stickleback captured in 2019), it is not known if or how well those data represent abundance, particularly in the pelagic zone. The hydroacoustic estimates provide information on the population component oriented in pelagic habitat, and stickleback data from a refined acoustic timeseries should provide insight as to whether the catch per effort from the littoral traps has any correlation with the pelagic abundance of this important competitor of Kokanee. 6. Conclusion
It is evident from program monitoring data that nutrient addition on Wahleach Reservoir has had a positive effect on the lower trophic levels and has ultimately supported a self-sustaining Kokanee population within the reservoir. Perrin et al. (2006) and ongoing program monitoring data confirmed sterile Cutthroat Trout stocked in Wahleach Reservoir exhibit top-down pressure on the Threespine Stickleback population and have allowed Kokanee to take advantage of improved forage conditions. These combined restoration efforts have maintained Wahleach Reservoir’s Kokanee population over the long term. Although Kokanee numbers are lower in 2019, the larger size (25.2 cm mean spawner fork
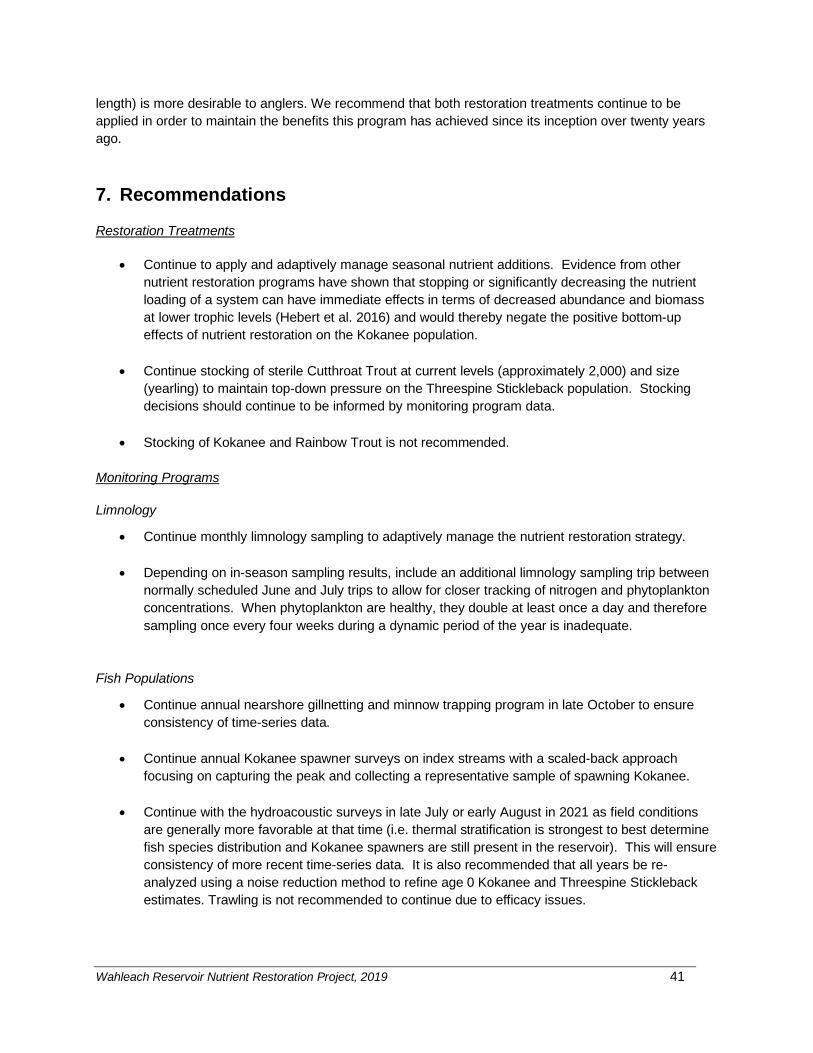
Wahleach Reservoir Nutrient Restoration Project, 2019 41
length) is more desirable to anglers. We recommend that both restoration treatments continue to be applied in order to maintain the benefits this program has achieved since its inception over twenty years ago. 7. Recommendations
Restoration Treatments
• Continue to apply and adaptively manage seasonal nutrient additions. Evidence from other nutrient restoration programs have shown that stopping or significantly decreasing the nutrient loading of a system can have immediate effects in terms of decreased abundance and biomass at lower trophic levels (Hebert et al. 2016) and would thereby negate the positive bottom-up effects of nutrient restoration on the Kokanee population.
• Continue stocking of sterile Cutthroat Trout at current levels (approximately 2,000) and size (yearling) to maintain top-down pressure on the Threespine Stickleback population. Stocking decisions should continue to be informed by monitoring program data.
• Stocking of Kokanee and Rainbow Trout is not recommended.
Monitoring Programs
Limnology
• Continue monthly limnology sampling to adaptively manage the nutrient restoration strategy.
• Depending on in-season sampling results, include an additional limnology sampling trip between normally scheduled June and July trips to allow for closer tracking of nitrogen and phytoplankton concentrations. When phytoplankton are healthy, they double at least once a day and therefore sampling once every four weeks during a dynamic period of the year is inadequate.
Fish Populations
• Continue annual nearshore gillnetting and minnow trapping program in late October to ensure consistency of time-series data.
• Continue annual Kokanee spawner surveys on index streams with a scaled-back approach
focusing on capturing the peak and collecting a representative sample of spawning Kokanee.
• Continue with the hydroacoustic surveys in late July or early August in 2021 as field conditions are generally more favorable at that time (i.e. thermal stratification is strongest to best determine fish species distribution and Kokanee spawners are still present in the reservoir). This will ensure consistency of more recent time-series data. It is also recommended that all years be re-analyzed using a noise reduction method to refine age 0 Kokanee and Threespine Stickleback estimates. Trawling is not recommended to continue due to efficacy issues.

Wahleach Reservoir Nutrient Restoration Project, 2019 42
• Evaluate ability to standardize estimation of age structure and biomass for the Wahleach acoustic dataset with other lakes and reservoirs by applying methodology recently developed and applied to Duncan, Kootenay, Arrow, Kinbasket and Revelstoke Reservoirs. The ability to compare survival and biomass density trends between Wahleach and other systems in BC will add substantial value to the monitoring program and provide new insights into annual and long-term outcomes for Kokanee and the Nutrient Restoration Program in general. This task will take a few years to complete.
Recreational Fishery
• Creel surveys to assess the recreational fishery on Wahleach Reservoir should be incorporated into regular program monitoring. One creel survey over each five-year cycle should be sufficient to understand how anglers are responding to restoration actions; ideally, the survey would be scheduled for year three of the cycle with a contingency to allow for additional survey effort in years four or five in case of logistical or other issues (as has often been the case, due to road closures for example).

Wahleach Reservoir Nutrient Restoration Project, 2019 43
8. References
Anderson, R.O. and S.J. Gutreuter. 1983. Length weight and associated structural indices. In: Nielsen, L.A., Johnson, D.L. (Eds.), Fisheries Techniques, American Fisheries Society, Bethesda, Maryland, pp. 283-300.
Ashley, K., L.C. Thompson, D.C. Lasenby, L. McEachern, K.E. Smokorowski and D. Sebastian. 1997. Restoration of an interior lake ecosystem: the Kootenay Lake fertilization experiment. Water Qual. Res. J. Canada. 32: 295-323.
Balk and Lindem. 2019. Sonar4 and Sonar5-Pro post processing systems, Operator manual version 605.8, 489p. CageEye A/S.
BC Hydro. 2004. Wahleach Project Water Use Plan. Prepared for the Comptroller of Water Rights. 10 p + appendices.
BC Hydro. 2005. Wahleach Water Use Plan, Physical Works Terms of Reference, WAHWORKS #2- Wahleach Reservoir Fertilization Program. 9 p.
BC Hydro. 2006. Wahleach Water Use Plan, Physical Works Terms of Reference, WAHWORKS #2- Wahleach Reservoir Fertilization Program Rev 1. 7 p.
BC Hydro. 2008. Wahleach Water Use Plan, Physical Works Terms of Reference, Addendum 1 to WAHWORKS#2 Wahleach Reservoir Fertilization Program. 4 p.
BC Hydro. 2010. Wahleach Water Use Plan, Physical Works Terms of Reference, Addendum 2 to WAHWORKS#2 Wahleach Reservoir Fertilization Program. 2 p.
BC Hydro. 2015. Wahleach Water Use Plan, Physical Works Terms of Reference, Addendum 3 to WAHWORKS#2 Wahleach Reservoir Fertilization Program. 3 p.
Canter-Lund, H. and J.W.G. Lund. 1995. Freshwater Algae-Their Microscopic World Explored. BioPress Ltd. Bristol, U.K.
CCME. 1999. Canadian Environmental Quality Guidelines. Guidelines are for the protection of freshwater aquatic life, 1999 plus updates. Canadian Council of Environment Ministers, Winnipeg.
Cone, R.S. 1989. The need to reconsider the use of condition indices in fishery science. Trans. Am. Fish. Soc. 118 (5). 510-514.
Ford, B.S., P.S. Higgins, A.F. Lewis, K.L. Cooper, T.A. Watson, C.M. Gee, G.L. Ennis and R.L. Sweeting. 1995. Literature reviews of the life history, habitat requirements and mitigation/compensation strategies for selected fish species in the Peace, Liard and Columbia River drainages of British Columbia. Report prepared for the Dep. of Fish. and Oceans and B.C. Ministry of Environment, Lands and Parks, Victoria, B.C. 23 pp.
Guildford, S.J. and R.E. Hecky. 2000. Total nitrogen, total phosphorus, and nutrient limitation in lakes and oceans: Is there a common relationship? Limnol. Oceanogr. 45(6): 1213-1223.

Wahleach Reservoir Nutrient Restoration Project, 2019 44
Harris, S.L. 2015. Primary productivity in Kinbasket and Revelstoke Reservoirs, 2013. Biodiversity Branch, Ministry of Environment, Province of British Columbia. In Bray, K.E. 2016. Kinbasket and Revelstoke Reservoirs Ecological Productivity Monitoring. Progress Report Year 6 (2013). BC Hydro, Environment. Study No. CLBMON-3 and CLBMON-56.
Hebert A.S., S.L. Harris, T. Weir, L. Vidmanic and N.E. Down. 2013. Wahleach Reservoir Nutrient Restoration Project, 2011-2012. RD 145. Ecosystems Protection & Sustainability Branch, Ministry of Environment, Province of British Columbia.
Hebert, A.S., G.F. Andrusak, S.L. Harris, H. Andrusak and T. Weir. 2016. Alouette Reservoir Nutrient Restoration Project, 2014-2015. RD 154. Ecosystems Protection & Sustainability Branch, Ministry of Environment, Province of British Columbia.
Hyatt, K.D. and J.G. Stockner. 1985. Responses of sockeye salmon (Oncorhynchus nerka) to fertilization of British Columbia coastal lakes. Canadian Journal of Fisheries and Aquatic Sciences 42: 320-331.
Lund, J.G., C. Kipling and E.D. LeCren. 1958. The inverted microscope method of estimating algal numbers and the statistical basis of estimations by counting. Hydrobiologia 11: 143-170.
Ney, J.J. 1996. Oligotrophication and its discontents: effects of reduced nutrient loading on reservoir fishes. P. 285-295 in L.E. Mirandah and D.R. DeVries Eds. American Fisheries Symposium 16. Bethesda, Maryland.
Perrin, C.J. 1996. Fertilization and monitoring of Wahleach Reservoir in 1995. Report prepared by Limnotek Research and Development Inc. for B.C. Hydro and Power Authority. 56p.
Perrin, C.J. and T.B. Stables. 2000. Restoration of fish populations in Wahleach Reservoir, 1997 – 1999. Report prepared by Limnotek Research and Development Inc. for B.C. Hydro. 175p.
Perrin, C.J. and T.B. Stables. 2001. Restoration of fish populations in Wahleach Reservoir: Fish and zooplankton in 2000. Report prepared by Limnotek Research and Development Inc. for B.C. Ministry of Water Land and Air Protection. 67p.
Perrin, C.J., M.L. Rosenau, T.B. Stables and K.I. Ashley. 2006. Restoration of a montane reservoir fishery via biomanipulation and nutrient addition. N. Amer. J. of Fish. Management. 26: 391-407
R Core Team (2019). R: A language and environment for statistical computing. R Foundation for Statistical Computing, Vienna, Austria. URL http://www.R-project.org/.
Sarchuk, J.A., A.S. Hebert, H. Andrusak, S.L. Harris, T. Weir and D. Sebastian. 2019a. Wahleach Reservoir Nutrient Restoration Project, Review Report, 2009-2015. RD 155. Ecosystems Protection & Sustainability Branch, Ministry of Environment, Province of British Columbia.
Sarchuk, J.A., H.E. Vainionpaa, S.L. Harris and T. Weir. 2019b. Wahleach Reservoir Nutrient Restoration Project, 2017. RD 161. Ecosystems Branch, Ministry of Environment and Climate Change Strategy, Province of British Columbia.
Schallenberg, M. 1993. Effects of impoundment on the oxygen and nutrient dynamics of sub-arctic reservoirs. James Bay Publication Series. North Wind Information Services Inc.
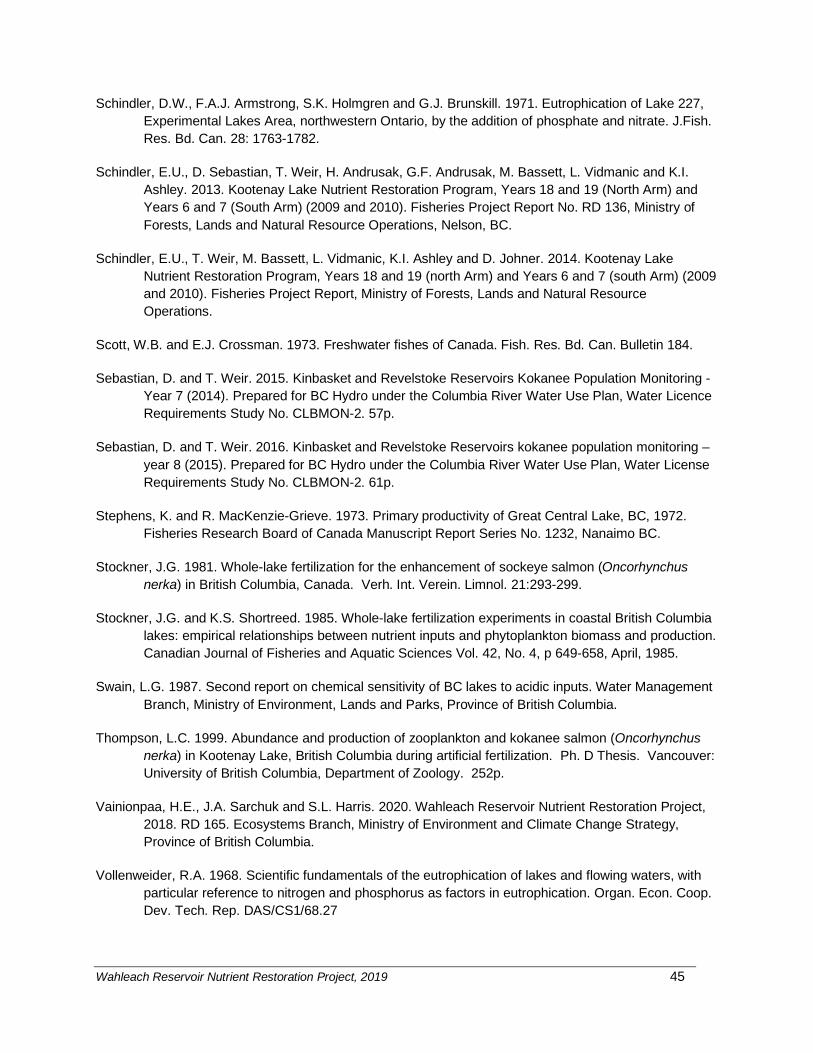
Wahleach Reservoir Nutrient Restoration Project, 2019 45
Schindler, D.W., F.A.J. Armstrong, S.K. Holmgren and G.J. Brunskill. 1971. Eutrophication of Lake 227, Experimental Lakes Area, northwestern Ontario, by the addition of phosphate and nitrate. J.Fish. Res. Bd. Can. 28: 1763-1782.
Schindler, E.U., D. Sebastian, T. Weir, H. Andrusak, G.F. Andrusak, M. Bassett, L. Vidmanic and K.I. Ashley. 2013. Kootenay Lake Nutrient Restoration Program, Years 18 and 19 (North Arm) and Years 6 and 7 (South Arm) (2009 and 2010). Fisheries Project Report No. RD 136, Ministry of Forests, Lands and Natural Resource Operations, Nelson, BC.
Schindler, E.U., T. Weir, M. Bassett, L. Vidmanic, K.I. Ashley and D. Johner. 2014. Kootenay Lake Nutrient Restoration Program, Years 18 and 19 (north Arm) and Years 6 and 7 (south Arm) (2009 and 2010). Fisheries Project Report, Ministry of Forests, Lands and Natural Resource Operations.
Scott, W.B. and E.J. Crossman. 1973. Freshwater fishes of Canada. Fish. Res. Bd. Can. Bulletin 184.
Sebastian, D. and T. Weir. 2015. Kinbasket and Revelstoke Reservoirs Kokanee Population Monitoring - Year 7 (2014). Prepared for BC Hydro under the Columbia River Water Use Plan, Water Licence Requirements Study No. CLBMON-2. 57p.
Sebastian, D. and T. Weir. 2016. Kinbasket and Revelstoke Reservoirs kokanee population monitoring – year 8 (2015). Prepared for BC Hydro under the Columbia River Water Use Plan, Water License Requirements Study No. CLBMON-2. 61p.
Stephens, K. and R. MacKenzie-Grieve. 1973. Primary productivity of Great Central Lake, BC, 1972. Fisheries Research Board of Canada Manuscript Report Series No. 1232, Nanaimo BC.
Stockner, J.G. 1981. Whole-lake fertilization for the enhancement of sockeye salmon (Oncorhynchus nerka) in British Columbia, Canada. Verh. Int. Verein. Limnol. 21:293-299.
Stockner, J.G. and K.S. Shortreed. 1985. Whole-lake fertilization experiments in coastal British Columbia lakes: empirical relationships between nutrient inputs and phytoplankton biomass and production. Canadian Journal of Fisheries and Aquatic Sciences Vol. 42, No. 4, p 649-658, April, 1985.
Swain, L.G. 1987. Second report on chemical sensitivity of BC lakes to acidic inputs. Water Management Branch, Ministry of Environment, Lands and Parks, Province of British Columbia.
Thompson, L.C. 1999. Abundance and production of zooplankton and kokanee salmon (Oncorhynchus nerka) in Kootenay Lake, British Columbia during artificial fertilization. Ph. D Thesis. Vancouver: University of British Columbia, Department of Zoology. 252p.
Vainionpaa, H.E., J.A. Sarchuk and S.L. Harris. 2020. Wahleach Reservoir Nutrient Restoration Project, 2018. RD 165. Ecosystems Branch, Ministry of Environment and Climate Change Strategy, Province of British Columbia.
Vollenweider, R.A. 1968. Scientific fundamentals of the eutrophication of lakes and flowing waters, with particular reference to nitrogen and phosphorus as factors in eutrophication. Organ. Econ. Coop. Dev. Tech. Rep. DAS/CS1/68.27

Wahleach Reservoir Nutrient Restoration Project, 2019 46
Vollenweider, R.A. 1976. Advances in defining critical loading levels for phosphorus in lake eutrophication. Mem. Ist. Ital. Idrobiol. 33: 53-83.
Wetzel, R.G. 1983. Limnology: lake and river ecosystems, 2nd edition. Saunders College Publishing. Philadelphia, PA.
Wetzel, R.G. 2001. Limnology: lake and river ecosystems, 3rd edition. Academic Press. San Diego, California.

Wahleach Reservoir Nutrient Restoration Project, 2019 47
9. Appendices
Appendix A. Phytoplankton species detected during 2019, Wahleach Reservoir, BC.
Species 2019 Species 2019 Achnanthidium sp. + Gymnodinium sp2 + Ankistrodesmus sp. + Kephyrion sp. + Asterionella formosa var1 + Komma sp. + Aulacoseira granulata + Merismopedia sp. + Aulacoseira italica + Microcystis sp. (?) + Aulicoseira distans + Monoraphidium sp. + Ceratium sp. + Navicula sp. + Chlorella sp. + Ochromonas sp. + Chromulina sp1 + Oocystis sp. + Chroomonas acuta + Phacus sp. + Chrysochromulina sp. + Planctosphaeria sp. + Chrysococcus sp. + Pseudokephrion sp. + Coelastrum sp. + Rhizosolenia sp. + Cosmarium sp. + Scenedesmus sp. + Crucigenia sp. + Scourfieldia sp. + Cryptomonas sp. + Small microflagellates + Cyclotella glomerata + Sphaerocystis sp. + Cyclotella stelligera + Staurastrum sp. + Diatoma elongatum + Synechococcus sp. (coccoid) + Dichtyosphaerium sp. + Synechococcus sp. (rod) + Dinobryon sp. + Synechocystis sp. + Elakatothrix sp3 + Synedra acus + Fragilaria capucina + Synedra nana + Fragilaria construens + Tabellaria fenestrata + Fragilaria crotonensis + Tabellaria flocculosa + Gymnodinium sp1 + Tetraedron sp. +

Wahleach Reservoir Nutrient Restoration Project, 2019 48
Appendix B. Target strength distributions by depth range (m) from hydroacoustic survey, 2019, Wahleach Reservoir, BC.

Wahleach Reservoir Nutrient Restoration Project, 2019 49
Appendix C. Acoustic density distribution by size group (small = -55 to -47 dB, large ≥ -46 dB) and transect, 2019, Wahleach Reservoir, BC.
Appendix D. Zooplankton species detected during 2019, Wahleach Reservoir, BC.
Order/Species 2019 CLADOCERA Alona sp. + Bosmina longirostris + Chydorus sphaericus + Daphnia rosea + Holopedium gibberum + Leptodora kindtii + Scapholeberis mucronata + COPEPODA Cyclops vernalis + Leptodiaptomus ashlandi r
r = rare species, + = present