Wafer Inspection & Metrology - Camtek · 2017-11-16 · metrology systems to Semiconductor...
23
Investors Presentation Rafi Amit, CEO Moshe Eisenberg, CFO November 2017
Transcript of Wafer Inspection & Metrology - Camtek · 2017-11-16 · metrology systems to Semiconductor...
Investors Presentation
Rafi Amit, CEO
Moshe Eisenberg, CFO
November 2017
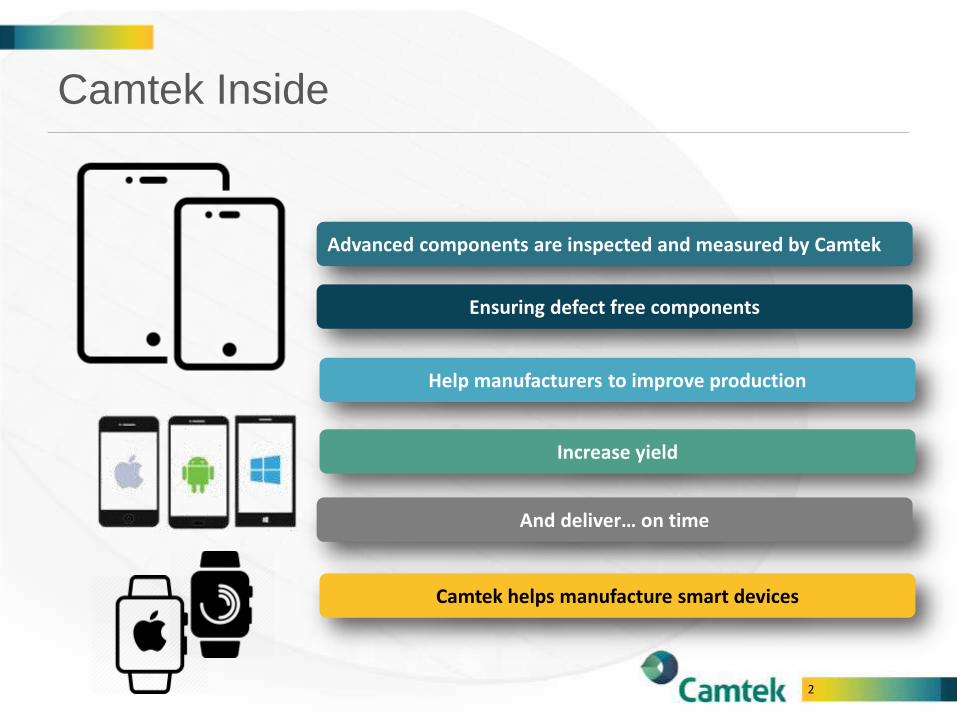
Camtek Inside
Advanced components are inspected and measured by Camtek
Ensuring defect free components
Help manufacturers to improve production
Increase yield
And deliver… on time
Camtek helps manufacture smart devices
2
Safe Harbor
3Copyright of Camtek Ltd. 2017 © All rights reserved
The information presented today contains forward-looking statements that relate to anticipated futureoperating results and performance. These statements are only predictions based on management’s currentexpectations and assumptions, including with respect to market size, Total Available Market (or “TAM”) andrevenue targets, and necessarily involve risks and uncertainties. Moreover, our stated revenue targets areinspirational and should not be taken as projections of actual future results. We do not assume any obligationto update the information provided. Actual events or results may differ materially from those projected,including as a result of changing industry and market trends, reduced demand for our products, the timelydevelopment of our new products and their adoption by the market, increased competition in the industry,price reductions and other subsequent developments and business conditions, as well as due to risks and otherimportant information identified in the documents filed with the Securities and Exchange Commission,including the Company’s Annual Reports on Form 20-F and Reports on Form 6-K.
The presentation includes non-GAAP financial measures which are not intended to be considered in isolation oras a substitute for the financial information prepared and presented in accordance with GAAP. Managementuses both GAAP and non-GAAP measures when evaluating the business internally and therefore believes it isimportant to make these non-GAAP measures available to the financial community. Reconciliations of non-GAAP measures to the most relevant GAAP amounts are included in the Company press releases.
This presentation includes the company’s estimations on Market size and TAM, (“Total Available Market,” or“TAM”) these estimations can vary and may be differ materially from the reality and are based on internalestimations. TAM or market size is the company’s estimation on the total yearly market size.
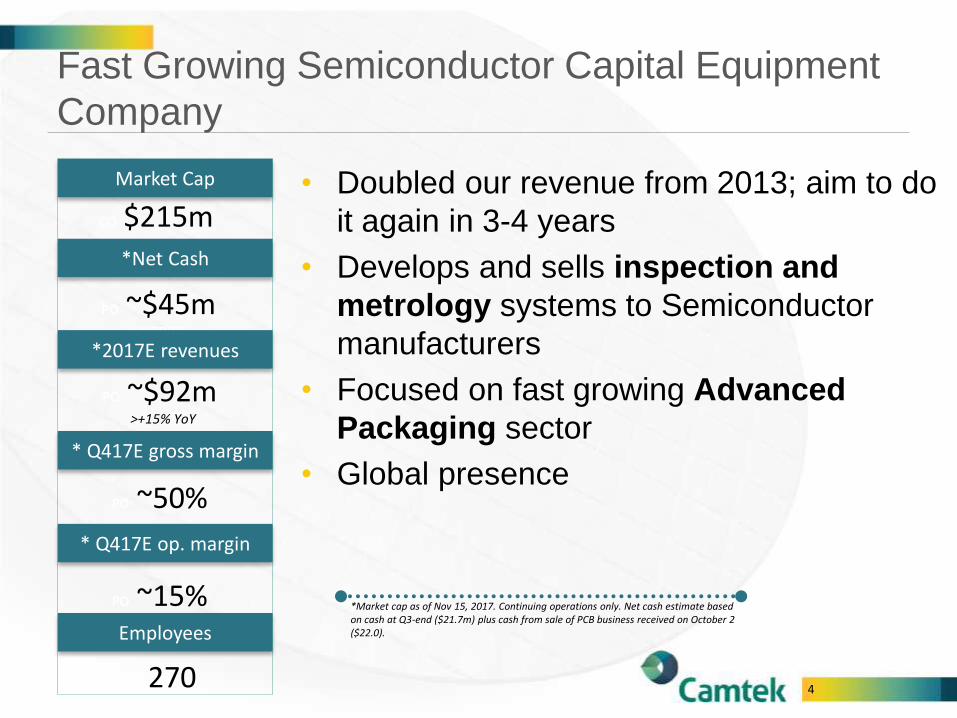
*Market cap as of Nov 15, 2017. Continuing operations only. Net cash estimate based on cash at Q3-end ($21.7m) plus cash from sale of PCB business received on October 2 ($22.0).
• Doubled our revenue from 2013; aim to do
it again in 3-4 years
• Develops and sells inspection and
metrology systems to Semiconductor
manufacturers
• Focused on fast growing Advanced
Packaging sector
• Global presence
Fast Growing Semiconductor Capital Equipment
Company
PRESENCE IN
CO $215m UNTRIES
Market Cap
*Net Cash
PO ~$45mUNTRIES
*2017E revenues
PO ~$92m>+15% YoY
* Q417E gross margin
PO ~50%
* Q417E op. margin
PO ~15%Employees
PO 270 4
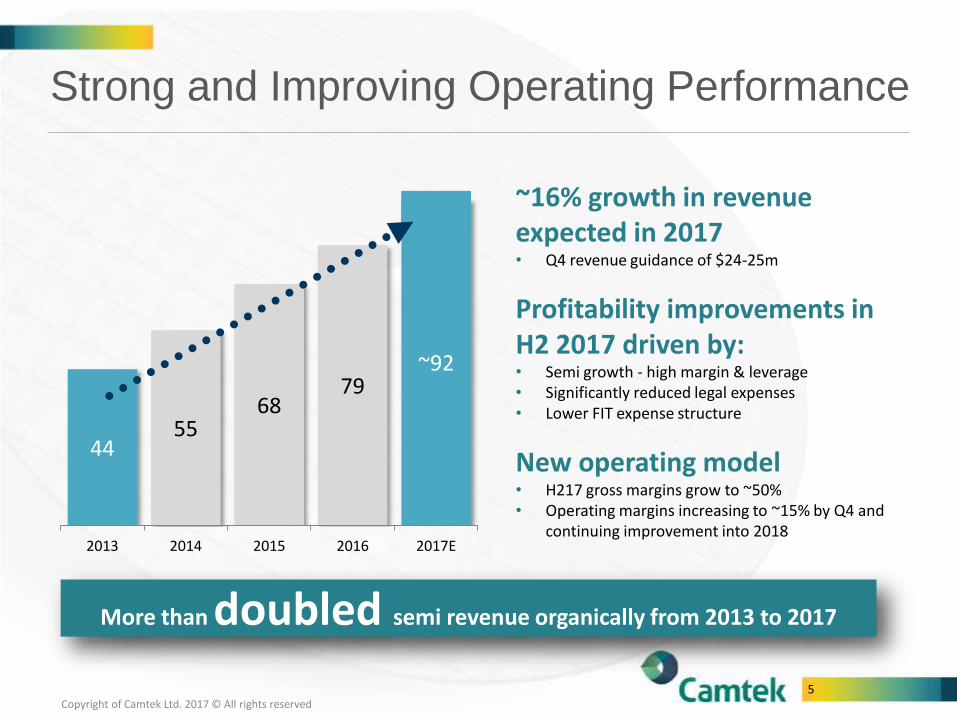
Strong and Improving Operating Performance
~16% growth in revenue expected in 2017• Q4 revenue guidance of $24-25m
Profitability improvements in H2 2017 driven by:• Semi growth - high margin & leverage• Significantly reduced legal expenses• Lower FIT expense structure
New operating model• H217 gross margins grow to ~50%• Operating margins increasing to ~15% by Q4 and
continuing improvement into 2018
More than doubled semi revenue organically from 2013 to 2017
Sem
ico
nd
uct
or
4455
6879
~92
2013 2014 2015 2016 2017E
Copyright of Camtek Ltd. 2017 © All rights reserved 5
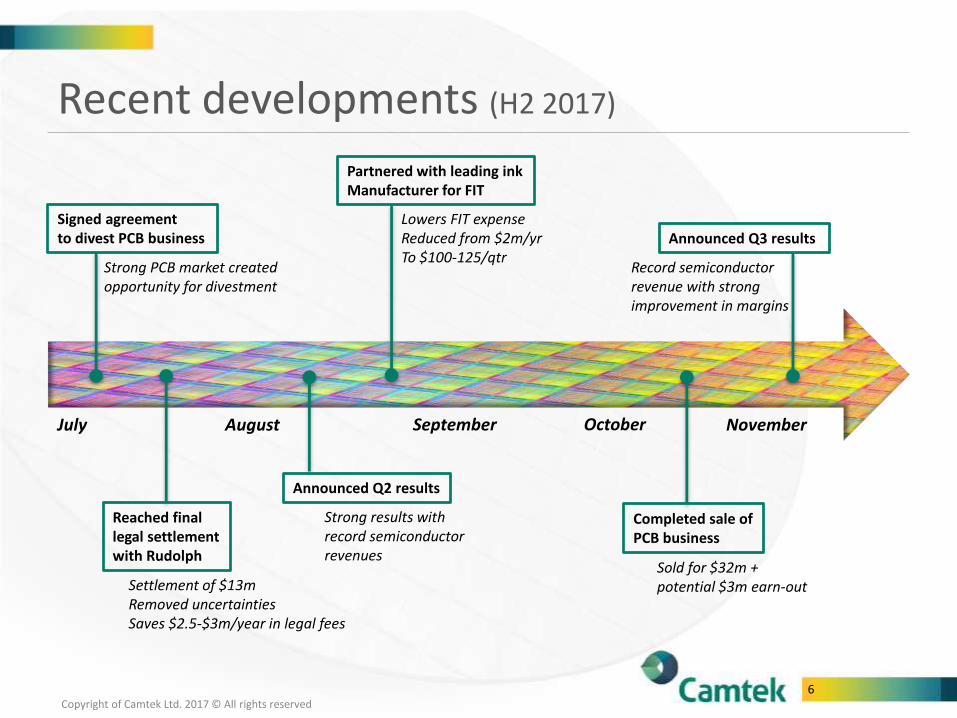
Recent developments (H2 2017)
Signed agreement to divest PCB business
Reached final legal settlementwith Rudolph
Settlement of $13mRemoved uncertaintiesSaves $2.5-$3m/year in legal fees
Partnered with leading inkManufacturer for FIT
Lowers FIT expenseReduced from $2m/yrTo $100-125/qtr
Strong PCB market createdopportunity for divestment
Completed sale ofPCB business
Sold for $32m +potential $3m earn-out
Announced Q3 results
Record semiconductor revenue with strong improvement in margins
NovemberJuly August
Announced Q2 results
Strong results with record semiconductor revenues
September October
Copyright of Camtek Ltd. 2017 © All rights reserved 6
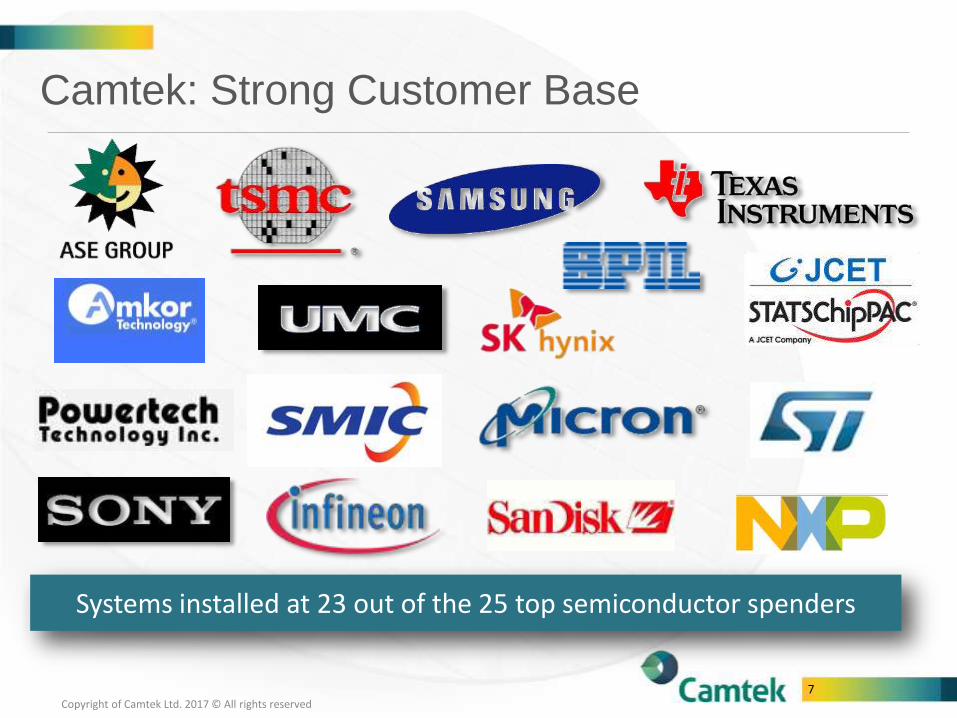
Systems installed at 23 out of the 25 top semiconductor spenders
Camtek: Strong Customer Base
Copyright of Camtek Ltd. 2017 © All rights reserved 7
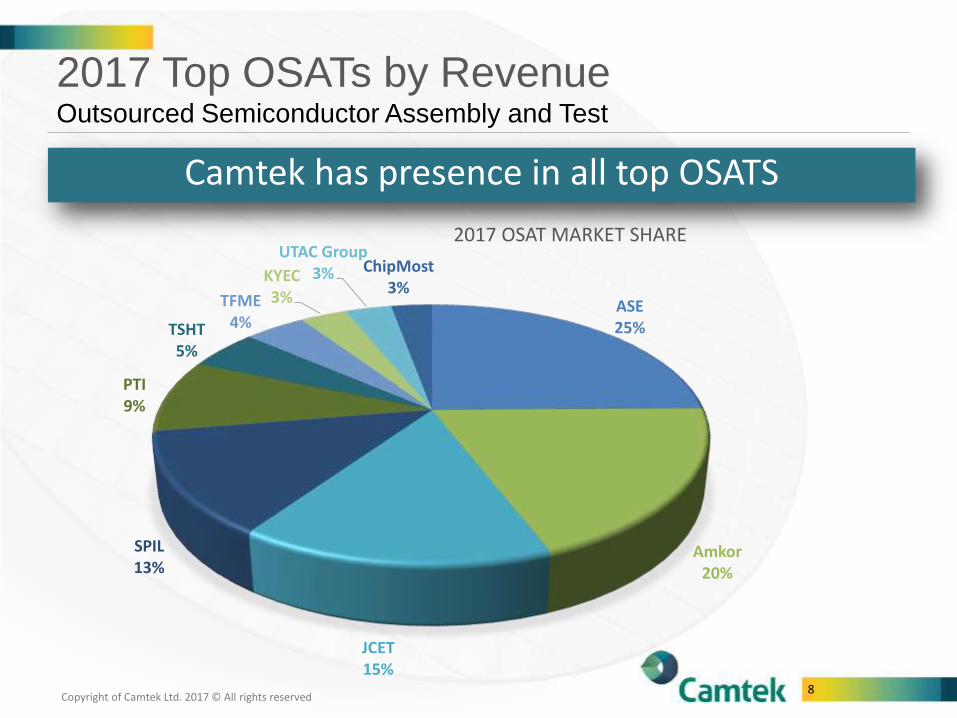
2017 Top OSATs by RevenueOutsourced Semiconductor Assembly and Test
8
ASE25%
Amkor20%
JCET15%
SPIL13%
PTI9%
TSHT5%
TFME4%
KYEC3%
UTAC Group3% ChipMost
3%
2017 OSAT MARKET SHARE
Camtek has presence in all top OSATS
Copyright of Camtek Ltd. 2017 © All rights reserved
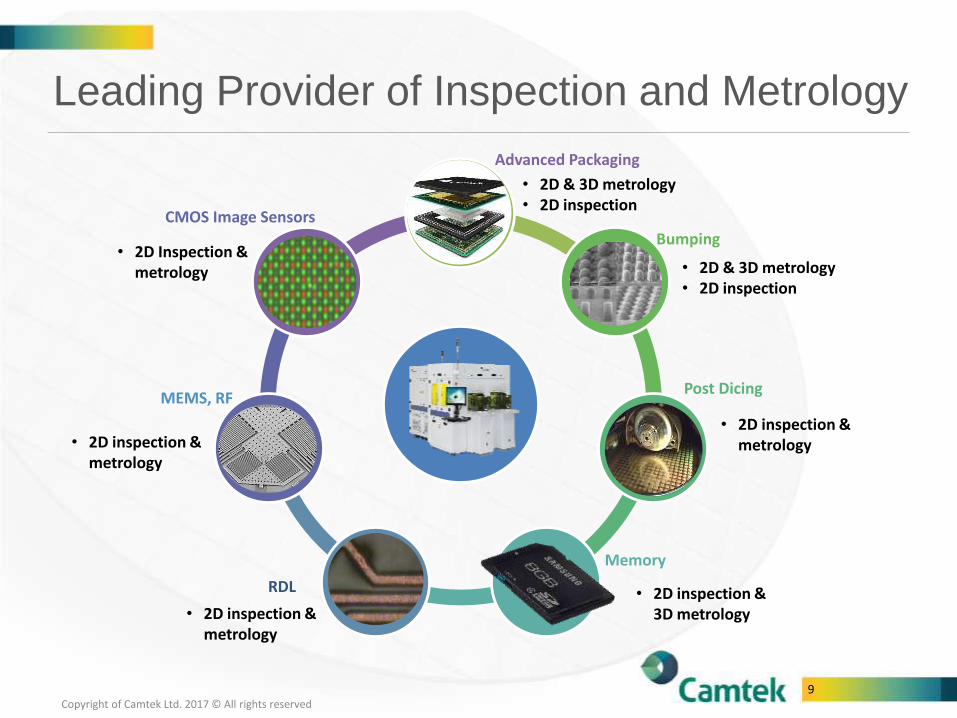
Leading Provider of Inspection and Metrology
CMOS Image Sensors
Bumping
RDL
MEMS, RF
Advanced Packaging
Post Dicing
Memory
• 2D & 3D metrology• 2D inspection
• 2D & 3D metrology• 2D inspection
• 2D inspection & metrology
• 2D inspection & 3D metrology• 2D inspection &
metrology
• 2D inspection & metrology
• 2D Inspection & metrology
Copyright of Camtek Ltd. 2017 © All rights reserved 9
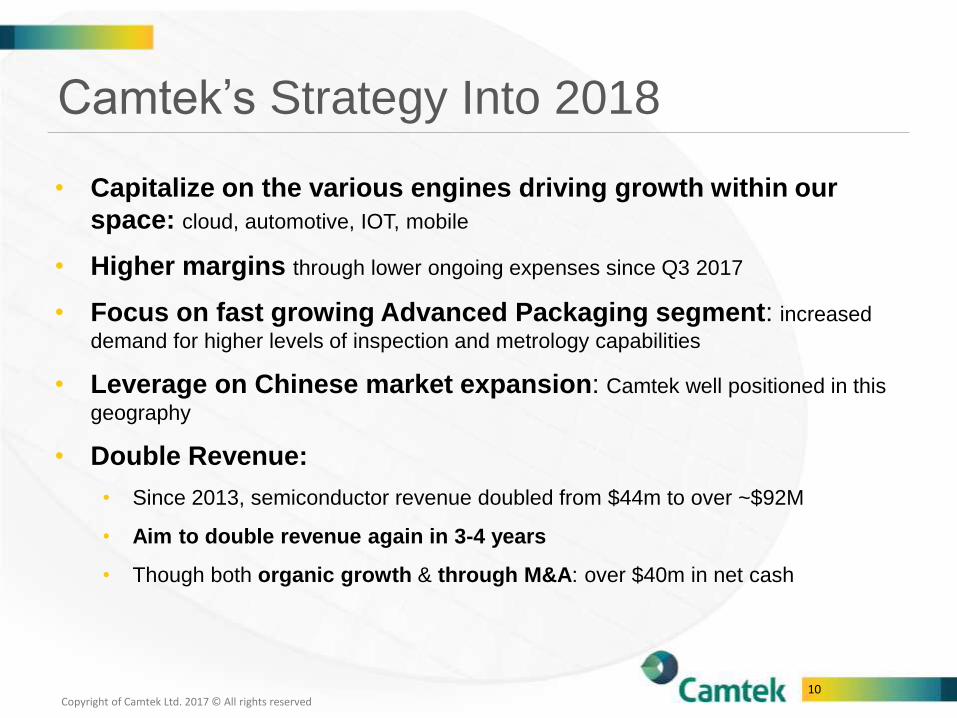
Camtek’s Strategy Into 2018
• Capitalize on the various engines driving growth within our
space: cloud, automotive, IOT, mobile
• Higher margins through lower ongoing expenses since Q3 2017
• Focus on fast growing Advanced Packaging segment: increased
demand for higher levels of inspection and metrology capabilities
• Leverage on Chinese market expansion: Camtek well positioned in this
geography
• Double Revenue:
• Since 2013, semiconductor revenue doubled from $44m to over ~$92M
• Aim to double revenue again in 3-4 years
• Though both organic growth & through M&A: over $40m in net cash
Copyright of Camtek Ltd. 2017 © All rights reserved 10
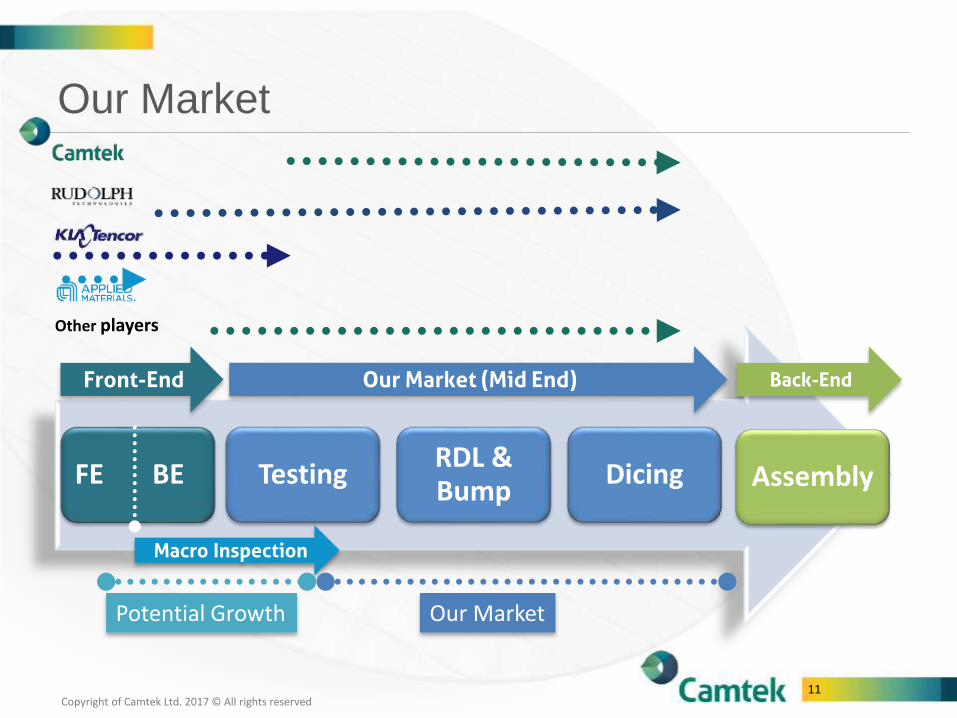
Our Market
FE BE TestingRDL & Bump
Dicing Assembly
Front-End Our Market (Mid End) Back-End
Macro Inspection
Other players
Our MarketPotential Growth
Copyright of Camtek Ltd. 2017 © All rights reserved 11
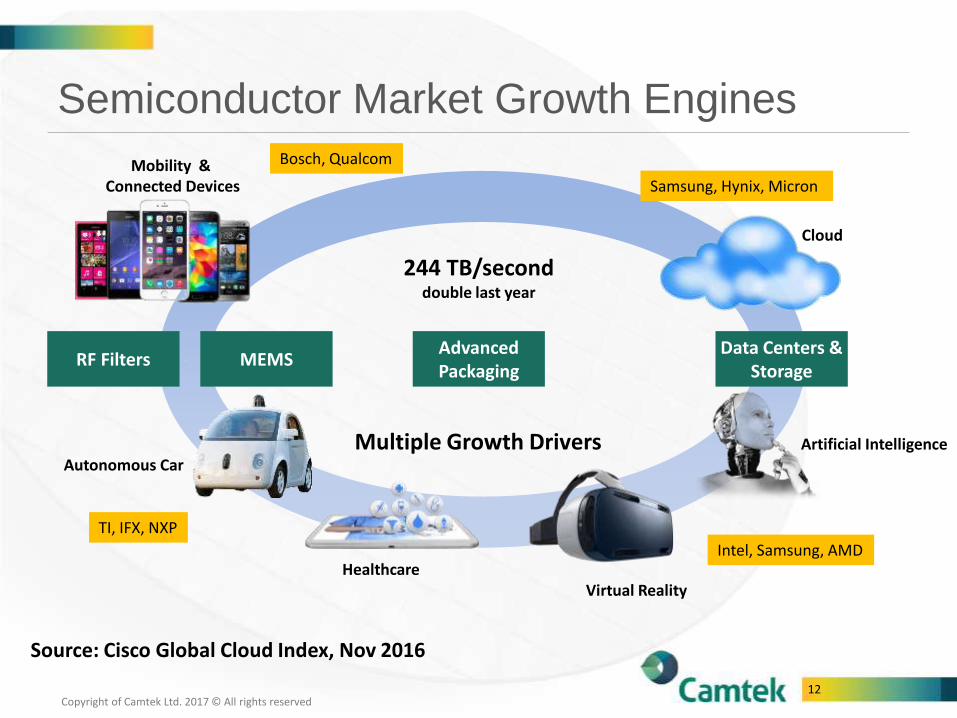
Semiconductor Market Growth Engines
Source: Cisco Global Cloud Index, Nov 2016
TI, IFX, NXP
Samsung, Hynix, Micron
Bosch, QualcomMobility & Connected Devices
Autonomous Car
HealthcareVirtual Reality
Artificial Intelligence
Cloud
RF Filters MEMSAdvanced Packaging
Data Centers & Storage
Multiple Growth Drivers
244 TB/seconddouble last year
Copyright of Camtek Ltd. 2017 © All rights reserved 12
Intel, Samsung, AMD
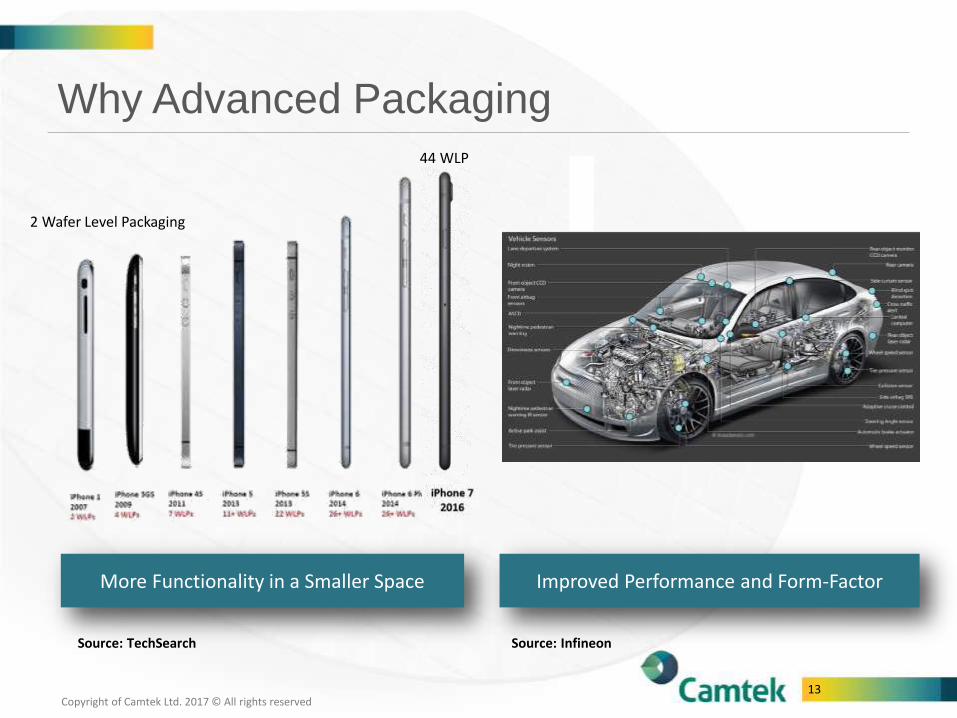
Why Advanced Packaging
Source: TechSearch
More Functionality in a Smaller Space
Copyright of Camtek Ltd. 2017 © All rights reserved 13
2 Wafer Level Packaging
44 WLP
Improved Performance and Form-Factor
Source: Infineon
14
14
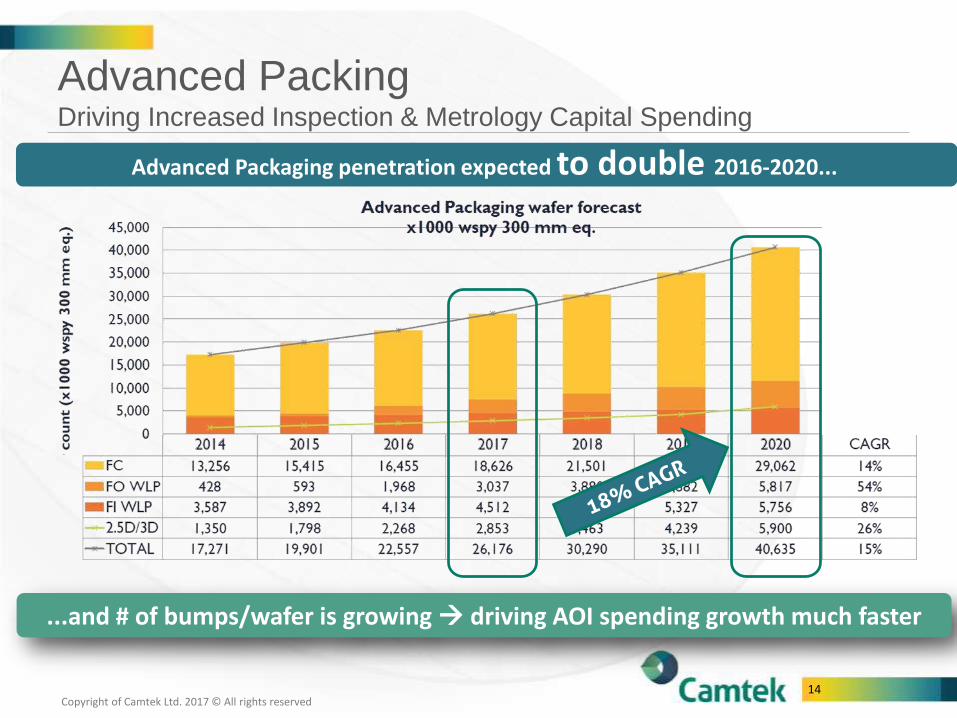
Advanced Packing Driving Increased Inspection & Metrology Capital Spending
...and # of bumps/wafer is growing driving AOI spending growth much faster
Advanced Packaging penetration expected to double 2016-2020...
Copyright of Camtek Ltd. 2017 © All rights reserved
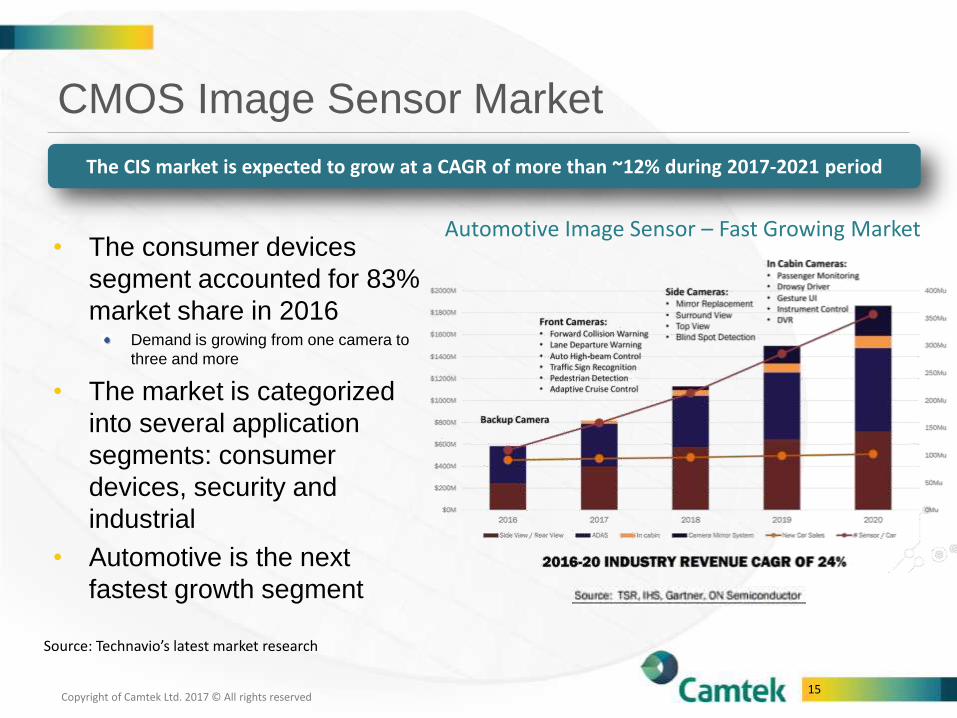
CMOS Image Sensor Market
15
• The consumer devices
segment accounted for 83%
market share in 2016Demand is growing from one camera to
three and more
• The market is categorized
into several application
segments: consumer
devices, security and
industrial
• Automotive is the next
fastest growth segment
Automotive Image Sensor – Fast Growing Market
Source: Technavio’s latest market research
The CIS market is expected to grow at a CAGR of more than ~12% during 2017-2021 period
Copyright of Camtek Ltd. 2017 © All rights reserved
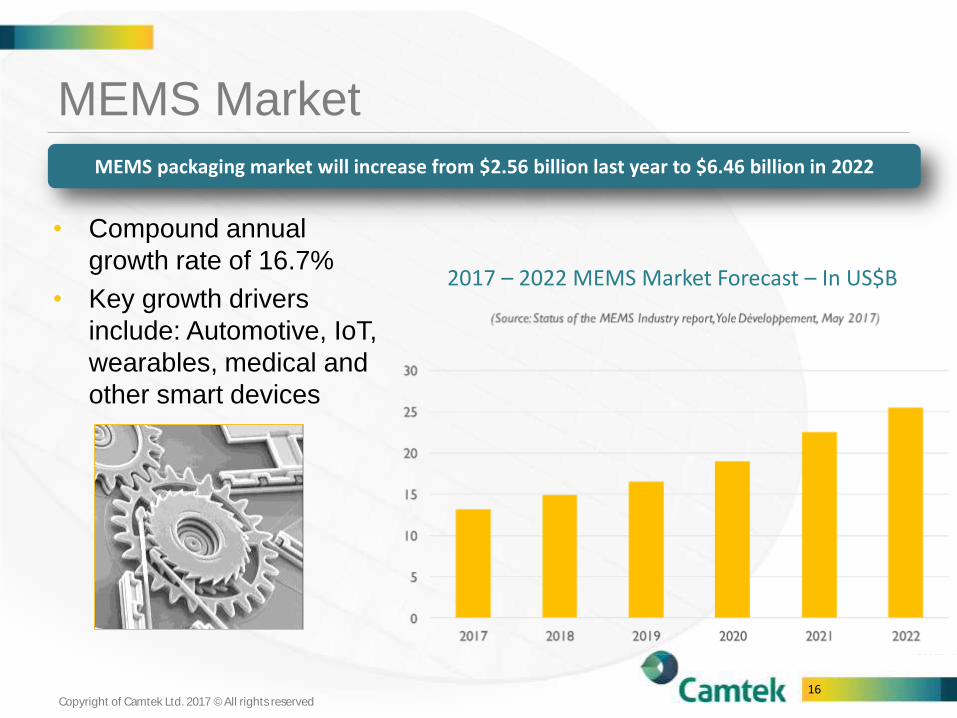
MEMS Market
16
• Compound annual
growth rate of 16.7%
• Key growth drivers
include: Automotive, IoT,
wearables, medical and
other smart devices
2017 – 2022 MEMS Market Forecast – In US$B
MEMS packaging market will increase from $2.56 billion last year to $6.46 billion in 2022
Copyright of Camtek Ltd. 2017 © All rights reserved
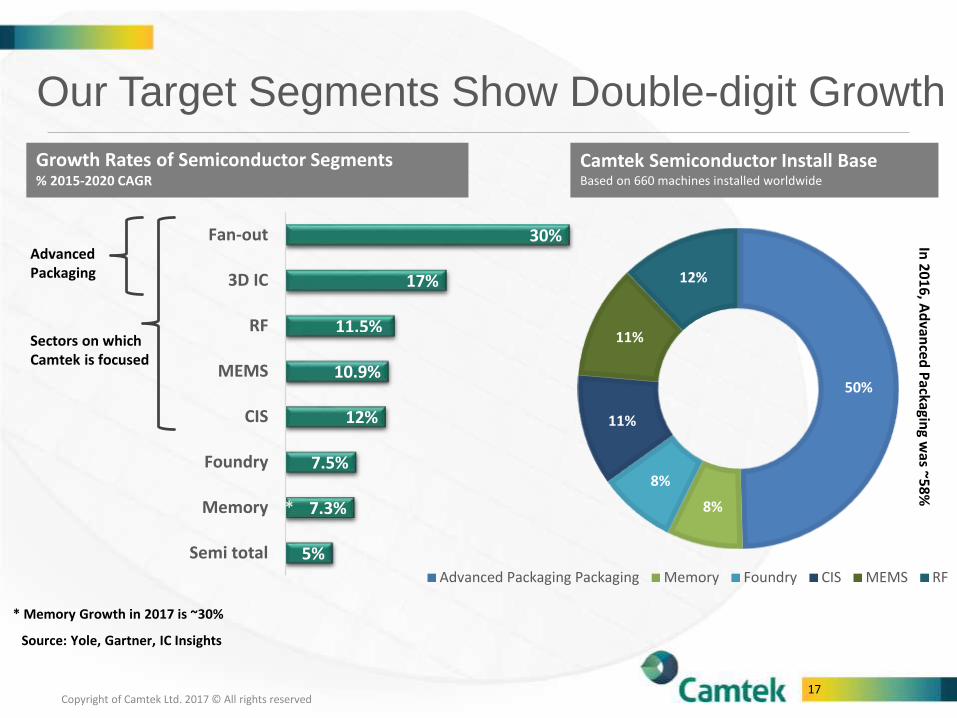
Our Target Segments Show Double-digit Growth
Source: Yole, Gartner, IC Insights
Growth Rates of Semiconductor Segments % 2015-2020 CAGR
Advanced Packaging
Sectors on whichCamtek is focused
Camtek Semiconductor Install BaseBased on 660 machines installed worldwide
In 2
01
6, A
dvan
ced
Packagin
g was ~
58
%
5%
7.3%
7.5%
12%
10.9%
11.5%
17%
30%
Semi total
Memory
Foundry
CIS
MEMS
RF
3D IC
Fan-out
*
50%
8%
8%
11%
11%
12%
Advanced Packaging Packaging Memory Foundry CIS MEMS RF
* Memory Growth in 2017 is ~30%
17Copyright of Camtek Ltd. 2017 © All rights reserved
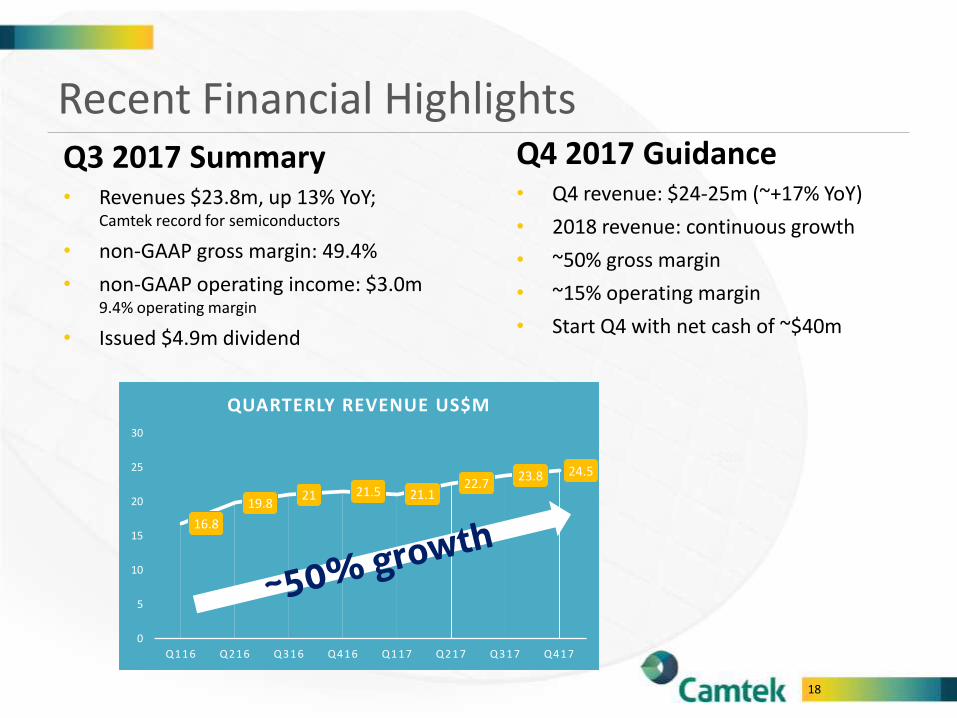
Recent Financial HighlightsQ3 2017 Summary• Revenues $23.8m, up 13% YoY;
Camtek record for semiconductors
• non-GAAP gross margin: 49.4%
• non-GAAP operating income: $3.0m 9.4% operating margin
• Issued $4.9m dividend
Q4 2017 Guidance• Q4 revenue: $24-25m (~+17% YoY)
• 2018 revenue: continuous growth
• ~50% gross margin
• ~15% operating margin
• Start Q4 with net cash of ~$40m
16.8
19.821 21.5 21.1
22.723.8 24.5
0
5
10
15
20
25
30
Q116 Q216 Q316 Q416 Q117 Q217 Q317 Q417
QUARTERLY REVENUE US$M
18
~50%
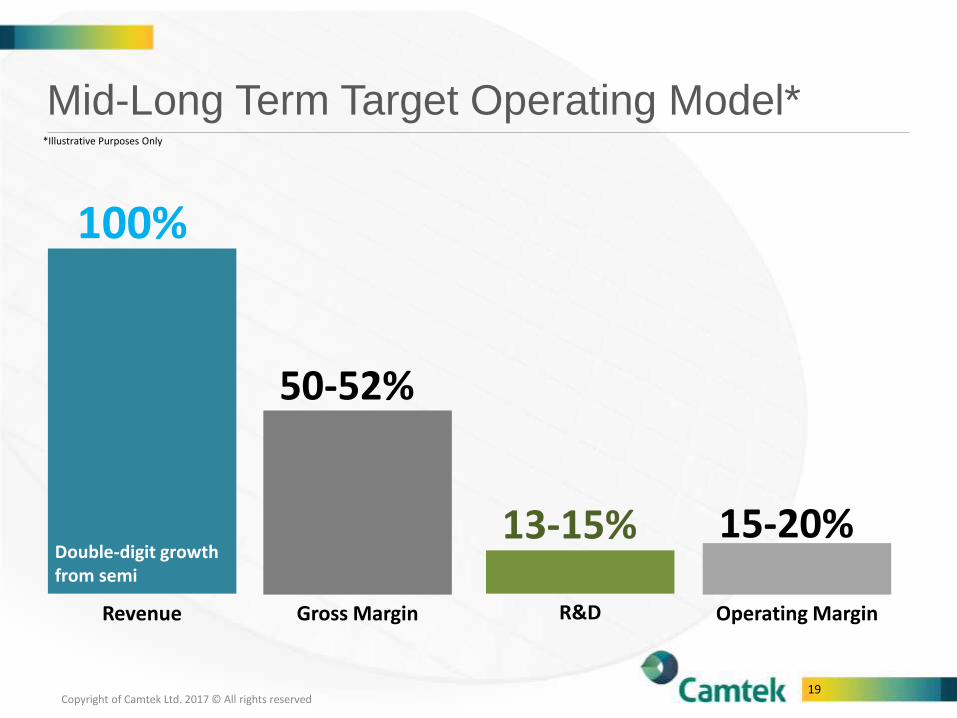
Mid-Long Term Target Operating Model*
Double-digit growth from semi
100%
50-52%
Gross MarginRevenue
13-15%
R&D
15-20%
Operating Margin
19
*Illustrative Purposes Only
19Copyright of Camtek Ltd. 2017 © All rights reserved
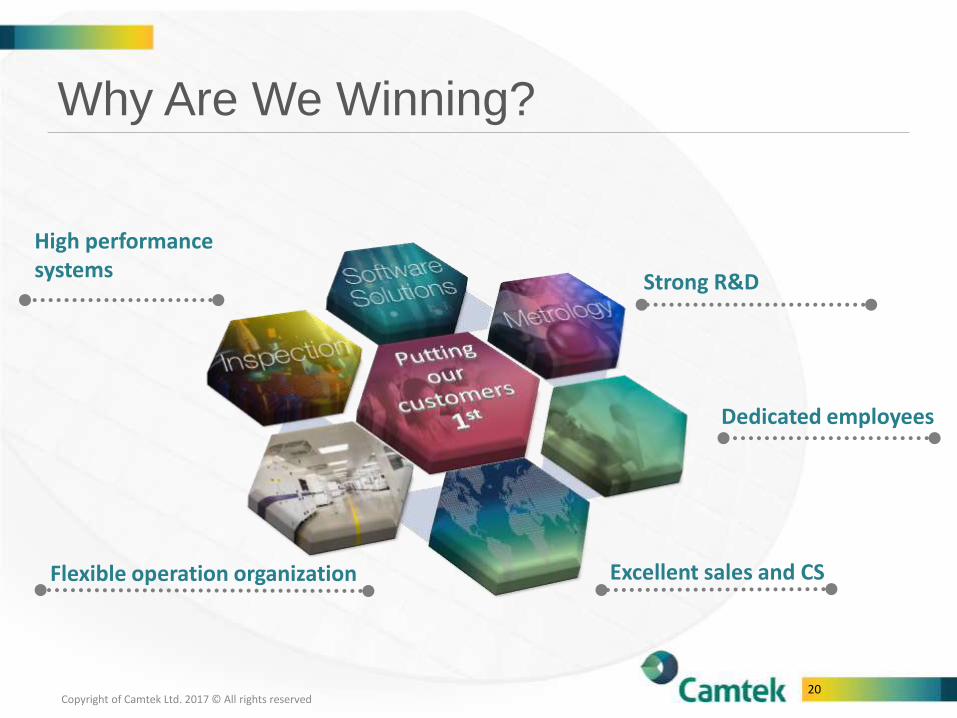
Why Are We Winning?
High performance systems
Strong R&D
Flexible operation organization Excellent sales and CS
Dedicated employees
20Copyright of Camtek Ltd. 2017 © All rights reserved
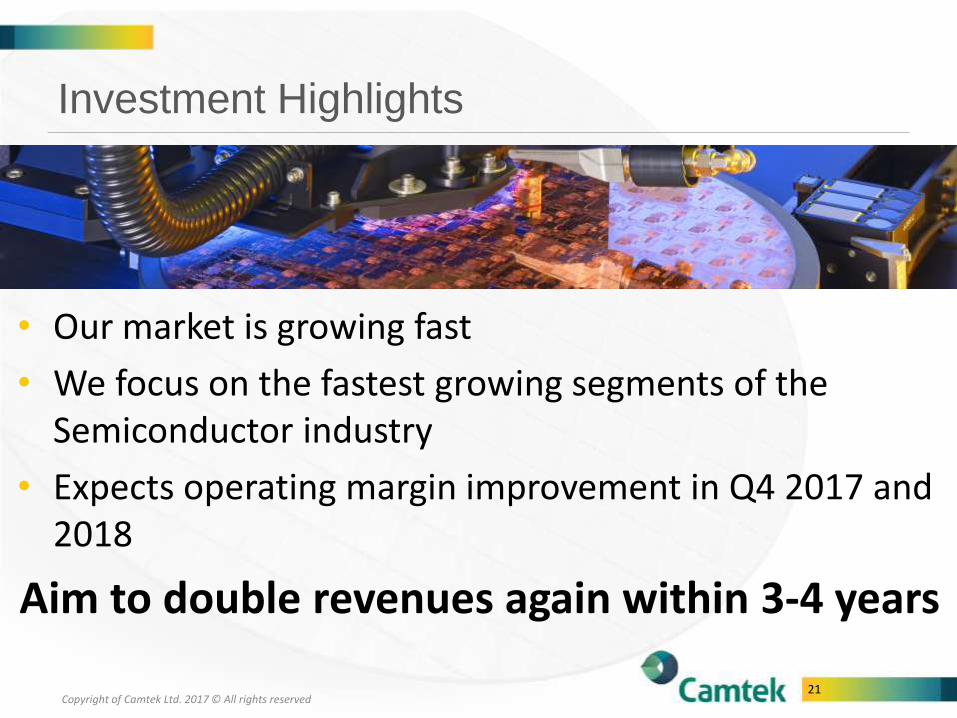
Investment Highlights
• Our market is growing fast
• We focus on the fastest growing segments of the Semiconductor industry
• Expects operating margin improvement in Q4 2017 and 2018
Aim to double revenues again within 3-4 years
Copyright of Camtek Ltd. 2017 © All rights reserved 21
Thank you!
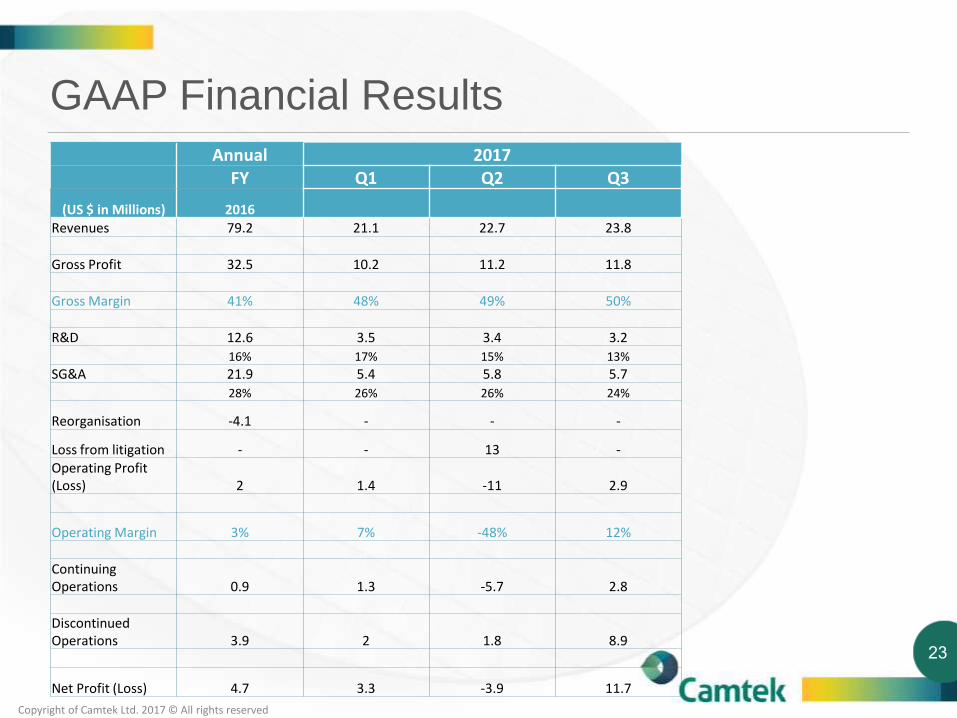
GAAP Financial Results
23
Annual 2017FY Q1 Q2 Q3
(US $ in Millions) 2016Revenues 79.2 21.1 22.7 23.8
Gross Profit 32.5 10.2 11.2 11.8
Gross Margin 41% 48% 49% 50%
R&D 12.6 3.5 3.4 3.2
16% 17% 15% 13%
SG&A 21.9 5.4 5.8 5.7
28% 26% 26% 24%
Reorganisation -4.1 - - -
Loss from litigation - - 13 -Operating Profit (Loss) 2 1.4 -11 2.9
Operating Margin 3% 7% -48% 12%
Continuing Operations 0.9 1.3 -5.7 2.8
Discontinued Operations 3.9 2 1.8 8.9
Net Profit (Loss) 4.7 3.3 -3.9 11.7
Copyright of Camtek Ltd. 2017 © All rights reserved