Wärtsilä - Q4 & Full Year Results 2015
36
Result presentation 2015, 27 January 2016 Jaakko Eskola, President & CEO Wärtsilä Corporation
-
Upload
waertsilae-corporation -
Category
Investor Relations
-
view
370 -
download
1
Transcript of Wärtsilä - Q4 & Full Year Results 2015

Result presentation 2015, 27 January 2016
Jaakko Eskola, President & CEO
Wärtsilä Corporation

Highlights 2015
27 January 2016 ©Wärtsilä2
• Order intake EUR 4,932 million, -3%
• Net sales EUR 5,029 million, +5%
• Book-to-bill 0.98 (1.06)
• EBIT EUR 612 million, 12.2% of net sales
(EUR 569 million or 11.9%)
• EBITA EUR 643 million, 12.8% of net sales
(EUR 594 million or 12.4%)
• Cash flow from operating activities EUR 255 million (452)
• Order book at the end of the period EUR 4,882 million, +8%
• Earnings per share EUR 2.25 (1.76)
• Dividend proposal EUR 1.20 per share
EBIT is shown excluding non-recurring items.
EBITA is shown excluding non-recurring items and purchase price allocation amortisation.

0
200
400
600
800
1 000
1 200
1 400
1 600
1 800
Q4/2014 Q4/2015
Year to date order intake supported by Services
Fourth quarter development
3
0
500
1 000
1 500
2 000
2 500
3 000
3 500
4 000
4 500
5 000
5 500
2011 2012 2013 2014 2015
MEUR
MEUR
Q1-Q3 Q4
-8%
-27%
1,5221,403
1%
2%
Energy
Solutions
Marine
Solutions
Services
27 January 2016 ©Wärtsilä

1,549
0
500
1 000
1 500
2 000
2 500
3 000
3 500
4 000
4 500
5 000
5 500
2011 2012 2013 2014 2015
0
200
400
600
800
1 000
1 200
1 400
1 600
1 800
Q4/2014 Q4/2015
Net sales developed in line with expectations
4
MEUR
MEUR
3%
10%
8%
-14%
1,590
27 January 2016 ©Wärtsilä
5%
Q1-Q3 Q4
Energy
Solutions
Marine
Solutions
Services
Fourth quarter development

5
Net sales by business 2015
Marine Solutions
34% (36)
Energy Solutions
22% (24)
Services
43% (41)
27 January 2016 ©Wärtsilä

1.07 1.05 1.05 1.06 0.98
0,0
0,2
0,4
0,6
0,8
1,0
1,2
0
500
1 000
1 500
2 000
2 500
3 000
3 500
4 000
4 500
5 000
5 500
2011 2012 2013 2014 2015
27 January 2016 ©Wärtsilä6
Book-to-bill ratio
MEUR
Order intake Net sales Book-to-bill

0
500
1 000
1 500
2 000
2 500
3 000
3 500
31.12.2014 31.12.2015
Delivery next year Delivery after next year
27 January 2016 ©Wärtsilä7
Order book distribution
MEUR
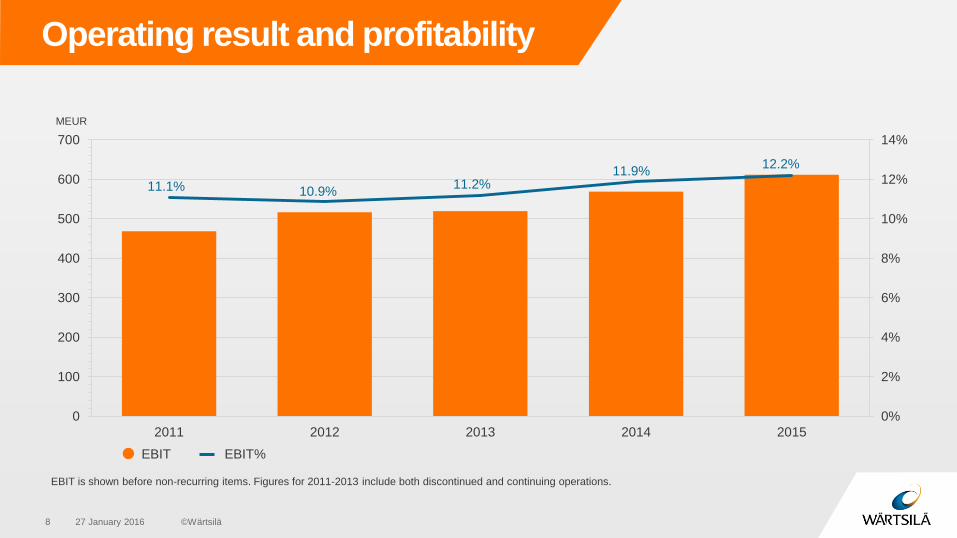
11.1% 10.9%11.2%
11.9%12.2%
0%
2%
4%
6%
8%
10%
12%
14%
0
100
200
300
400
500
600
700
2011 2012 2013 2014 2015
27 January 2016 ©Wärtsilä8
Operating result and profitability
MEUR
EBIT is shown before non-recurring items. Figures for 2011-2013 include both discontinued and continuing operations.
EBIT EBIT%

Energy Solutions

0
2 000
4 000
6 000
8 000
10 000
12 000
14 000
16 000
18 000
Q1
/20
12
Q2
/20
12
Q3
/20
12
Q4
/20
12
Q1
/20
13
Q2
/20
13
Q3
/20
13
Q4
/20
13
Q1
/20
14
Q2
/20
14
Q3
/20
14
Q4
/20
14
Q1
/20
15
Q2
/20
15
Q3
/20
15
Q4
/20
15
MW
27 January 2016 ©Wärtsilä10
Energy Solutions’ quotation activity on a high level
Liquid fuel
Gas
Multi-fuel

0
200
400
600
800
1 000
1 200
1 400
1 600
1 800
2011 2012 2013 2014 2015
Energy Solutions’ order intake
27 January 2016 ©Wärtsilä11
MEUR
IPP’s
(Independent
Power Producers)
Utilities
Industrials
Review period developmentTotal EUR 1,009 million (1,293)
Review period order intake
by fuel in MW
Gas
46%Oil
54%
Q1-Q3 Q4

27 January 2016 ©Wärtsilä12
Energy Solutions’ orders globally
Americas 638 (686)
Asia 299 (394)
Africa and Middle East 457 (639)
IPP’s
Utilities
Industrials
Europe 1,042* (769)
418220
254137
65
980
Order intake 2015: 2,436 MW (2,489)
584
165103
31
*Turkish owners contributed to the high level of activity in Europe.

Enabling the transition to a sustainable power system
The flexibility and efficiency of
Wärtsilä’s Smart Power
Generation power plants is
gaining interest in the USA
with several orders received
for peaking and renewable
support power plants
during 2015.

Market for gas and liquid fuel power plants, <500 MW
1-9/2014 1-9/2015
Market data includes all Wärtsilä power plants and other manufacturers’ gas and liquid fueled gas turbine based power plants with prime movers above 5 MW,
as well as estimated output of steam turbines for combined cycles. The data is gathered from the McCoy Power Report.
Other combustion engines not included. In engine technology Wärtsilä has a leading position.
<500 MW market volume: 17.0 GW (16.5), +3%
Total market volume: 43.9 GW (37.7), +16%
GE
55.1%
MHI
14.6%
Siemens
12.7%
Wärtsilä
10.5%
Ansaldo
3.6%
Alstom
1.8%Other GT’s
1.8%
GE
38.8%
Siemens
25.2%
MHI
19.8%
Wärtsilä
9.9%
Ansaldo
5.5%
Other GT’s
0.8%
27 January 2016 ©Wärtsilä14

Marine Solutions

0,0
0,5
1,0
1,5
2,0
2,5
3,0
3,5
4,0
4,5
5,0
0
50
100
150
200
250
01
.09
03
.09
05
.09
07
.09
09
.09
11
.09
01
.10
03
.10
05
.10
07
.10
09
.10
11
.10
01
.11
03
.11
05
.11
07
.11
09
.11
11
.11
01
.12
03
.12
05
.12
07
.12
09
.12
11
.11
01
.13
03
.13
05
.13
07
.13
09
.13
11
.13
01
.14
03
.14
05
.14
07
.14
09
.14
11
.14
01
.15
03
.15
05
.15
07
.15
09
.15
11
.15
Mill
ion C
GT
*
Num
ber
of
vessels
Merchant Offshore Cruise and Ferry Special vessels 3 months moving average in CGT
27 January 2016 ©Wärtsilä16
Vessel contracting activity remains low
Source: Clarkson Research Services, figures exclude late contracting
* CGT= gross tonnage compensated with workload
*
12.1
5

0
300
600
900
1 200
1 500
1 800
2011 2012 2013 2014 2015
Marine Solutions’ order intake
27 January 2016 ©Wärtsilä17
Review period development
Total EUR 1,599 million (1,746)
Offshore
8%
Traditional merchant
18%
Special vessels
10%
Others
6%
Gas carriers
38%
Cruise & Ferry
15%
Navy
4%
MEUR
Q1-Q3 Q4
0
100
200
300
400
500
600
700
Q1/2
010
Q2/2
010
Q3/2
010
Q4/2
010
Q1/2
011
Q2/2
011
Q3/2
011
Q4/2
011
Q1/2
012
Q2/2
012
Q3/2
012
Q4/2
012
Q1/2
013
Q2/2
013
Q3/2
013
Q4/2
013
Q1/2
014
Q2/2
014
Q3/2
014
Q4/2
014
Q1/2
015
Q2/2
015
Q3/2
015
Q4/2
015
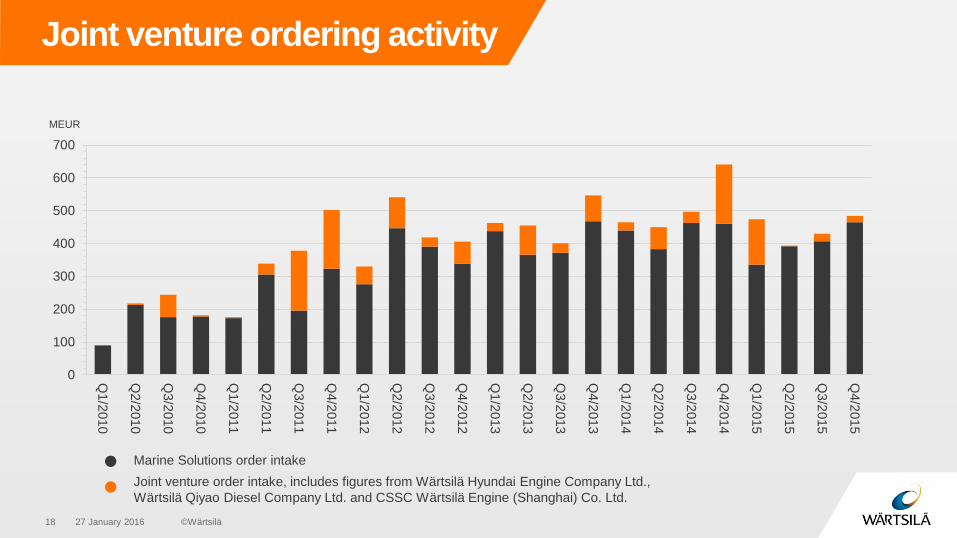
27 January 2016 ©Wärtsilä18
Joint venture ordering activity
Marine Solutions order intake
Joint venture order intake, includes figures from Wärtsilä Hyundai Engine Company Ltd.,
Wärtsilä Qiyao Diesel Company Ltd. and CSSC Wärtsilä Engine (Shanghai) Co. Ltd.
MEUR
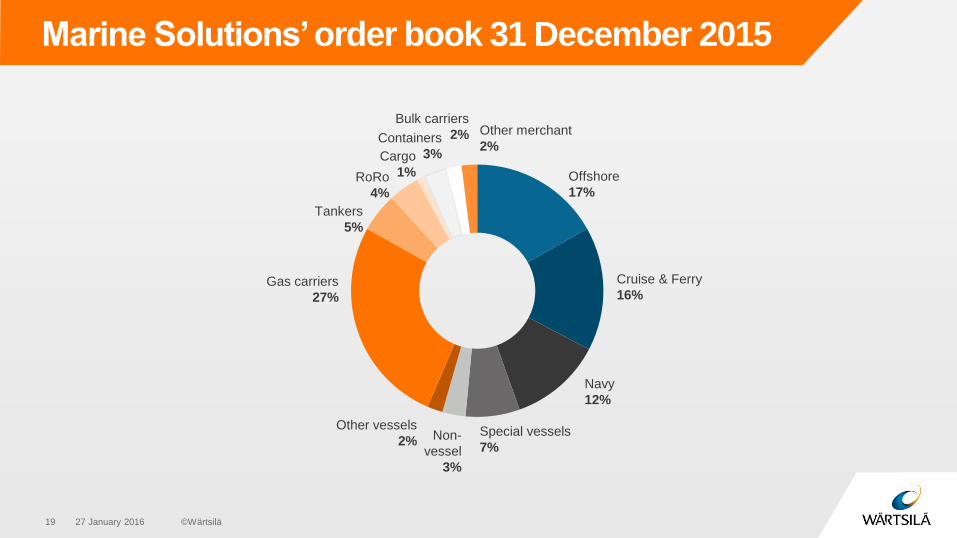
27 January 2016 ©Wärtsilä19
Marine Solutions’ order book 31 December 2015
Offshore
17%
Special vessels
7%
Navy
12%
Cruise & Ferry
16%Gas carriers
27%
Non-
vessel
3%
Tankers
5%
RoRo
4%
Other merchant
2%Containers
3%
Bulk carriers
2%
Cargo
1%
Other vessels
2%

Marine markets shifting towards gas Increased environmental awareness
and the regulatory environment is
driving interest in gas as a marine
fuel in the broader marine
markets. Wärtsilä’s proven gas
engine technology and
gas handling systems
enable us to support our
customers with integrated
solutions.

Strong position in marine engine market
Medium-speed main engines Auxiliary engines
27 January 2016 ©Wärtsilä21
Wärtsilä’s market shares are calculated on a 12 months rolling basis, numbers in brackets are from the end of the previous quarter.
The calculation is based on Wärtsilä’s own data portal.
Wärtsilä
59% (63)
Others
18% (16)
MAN D&T
16% (8)
Caterpillar
7% (13)
Total market volume last 12 months:
3,246 MW (4,519)
Wärtsilä
12% (9)
Total market volume last 12 months:
4,668 MW (3,986)
Others
88% (91)

Services

Services net sales all time high
27 January 2016 ©Wärtsilä23
0
200
400
600
800
1 000
1 200
1 400
1 600
1 800
2 000
2 200
2 400
2011 2012 2013 2014 2015
-3%
0
100
200
300
400
500
600
700
Q4/2014 Q4/2015
5% 5% 13%
MEUR
MEUR
564
10%
619
Fourth quarter development
Q1-Q3 Q4
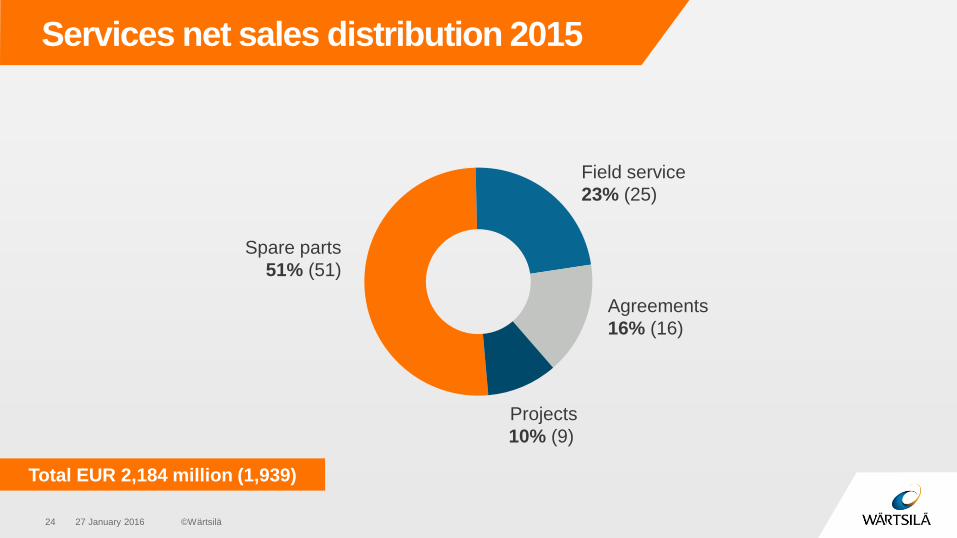
27 January 2016 ©Wärtsilä24
Services net sales distribution 2015
Spare parts
51% (51)
Field service
23% (25)
Projects
10% (9)
Agreements
16% (16)
Total EUR 2,184 million (1,939)

Services distribution per business 2015
Net sales
Total EUR 2,184 million
Installed base
Total 181,000 MW
27 January 2016 ©Wärtsilä25
Marine
Solutions
Energy
Solutions
Energy
Solutions
Marine
Solutions
2-stroke
Marine Solutions
4-stroke
0%
5%
10%
15%
20%
25%
30%
0
2 000
4 000
6 000
8 000
10 000
12 000
14 000
2009 2010 2011 2012 2013 2014 2015
MW
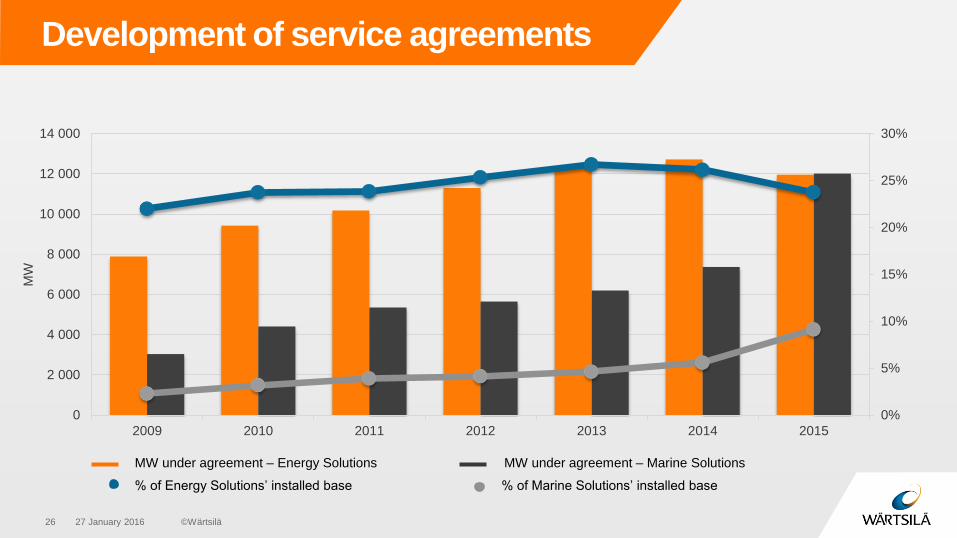
27 January 2016 ©Wärtsilä26
Development of service agreements
MW under agreement – Energy Solutions MW under agreement – Marine Solutions
% of Marine Solutions’ installed base% of Energy Solutions’ installed base

A lifecycle approach
The focus on optimising
maintenance and performance,
and the shift to gas based
technology in the marine
industry is increasing interest
in long-term service
agreements.

Financials

0
100
200
300
400
500
600
700
2011 2012 2013 2014 2015
27 January 2016 ©Wärtsilä29
Cash flow from operating activities
MEUR

Working capital affected by timing of power plant deliveries
27 January 2016 ©Wärtsilä30
235
465
313251
543
5.6%
9.8%
6.8%5.2%
10.8%
0%
5%
10%
15%
20%
25%
0
200
400
600
800
1 000
1 200
1 400
1 600
2011 2012 2013 2014 2015
MEUR
Working capital Total inventories Advances received Working capital / Net sales

Gearing impacted by working capital build up and L-3 MSI acquisition
0,00
0,10
0,20
0,30
0,40
0,50
2011 2012 2013 2014 2015
27 January 2016 ©Wärtsilä31

* Dividend 2015 - Proposal of the Board
27 January 2016 ©Wärtsilä32
EPS and dividend per share
EPS Dividend
0,0
0,5
1,0
1,5
2,0
2,5
2011 2012 2013 2014 2015*
2.25
1.20

Market outlook
Energy Solutions
The market for liquid and gas fuelled
power generation is expected to remain
challenging as economic uncertainty
continues. The megatrend towards
distributed, flexible, gas-fired power
generation continues to gain ground
globally.
27 January 2016 ©Wärtsilä33
Marine Solutions
The outlook for the shipping and
shipbuilding markets remains
challenging. Oversupply is limiting
demand for newbuild vessels and low
oil prices continues to impact
investments in offshore exploration and
development. Gas carrier contracting is
expected to remain at a normalised
level and the outlook for the cruise and
ferry segment remains positive.
Services
The service market outlook is positive
with growth opportunities in selected
regions and segments. Customers in
both the marine and power plant
markets continue to show healthy
interest in long-term service
agreements.

Prospects for 2016
Wärtsilä expects its net sales
for 2016 to grow by 0-5% and
its operational profitability
(EBIT% before non-recurring
items) to be 12.5-13.0%.

Wärtsilä’s strategy

IR Contact:
Natalia Valtasaari
Director, Investor & Media Relations
Tel. +358 (0) 40 187 7809
E-mail: [email protected]
Thank you