WABCO Baird Conference Nov 9 2011 Presentation...
28
ROBERT W BAIRD 2011 INDUSTRIAL CONFERENCE ROBERT W. BAIRD 2011 INDUSTRIAL CONFERENCE JACQUES ESCULIER © 2011 WABCO Holdings Inc. All rights reserved. JACQUES ESCULIER Chairman & Chief Executive Officer November 9, 2011
Transcript of WABCO Baird Conference Nov 9 2011 Presentation...
ROBERT W BAIRD 2011 INDUSTRIAL CONFERENCEROBERT W. BAIRD 2011 INDUSTRIAL CONFERENCE
JACQUES ESCULIER
© 2011 WABCO Holdings Inc. All rights reserved.
JACQUES ESCULIERChairman & Chief Executive Officer
November 9, 2011
FORWARD LOOKING STATEMENTS
Comments in this document contain certain forward-looking statements, which are based onmanagement’s good faith expectations and beliefs concerning future developments. Actual results may differ materially from these expectations as a result of many factors. These factors include, but are not limited to, the risks and uncertainties described in the “Risk Factors” section and the “Forward Lookinglimited to, the risks and uncertainties described in the Risk Factors section and the Forward Looking Statements” section of WABCO’s Form 10-K, as well as in the “Management’s Discussion and Analysis of Financial Condition and Results of Operations - Information Concerning Forward Looking Statements” section of WABCO’s Form 10-Q Quarterly Reports. WABCO does not undertake any obligation to update such forward-looking statements. All market and industry data are based on Company estimatesCompany estimates.
This presentation contains certain non-GAAP financial measures as that term is defined by the SEC. EBIT and sales excluding the effects of foreign exchange are non-GAAP financial measures. Additionally, gross profit, gross profit margin, operating income, operating income margin, EBIT, EBIT margin, net income and net income per diluted share on a "performance basis" are non-GAAP financial measures that exclude separation and streamlining items, and one-time and discrete tax items, as applicable. Free cash flow presents our net cash provided by operating activities less net purchases of property, plant, equipment and computer software. These measures should be considered in addition to, not as a substitute for, GAAP measures. Management believes that presenting these non-GAAP , , g p gmeasures is useful to shareholders because it enhances their understanding of how management assesses the operating performance of the Company's business. Certain non-GAAP measures may be used, in part, to determine incentive compensation for current employees. Reconciliations of the non-GAAP financial measures to the most comparable GAAP measures are available in WABCO’s quarterly results presentations posted on the company’s website
2
quarterly results presentations posted on the company s website.
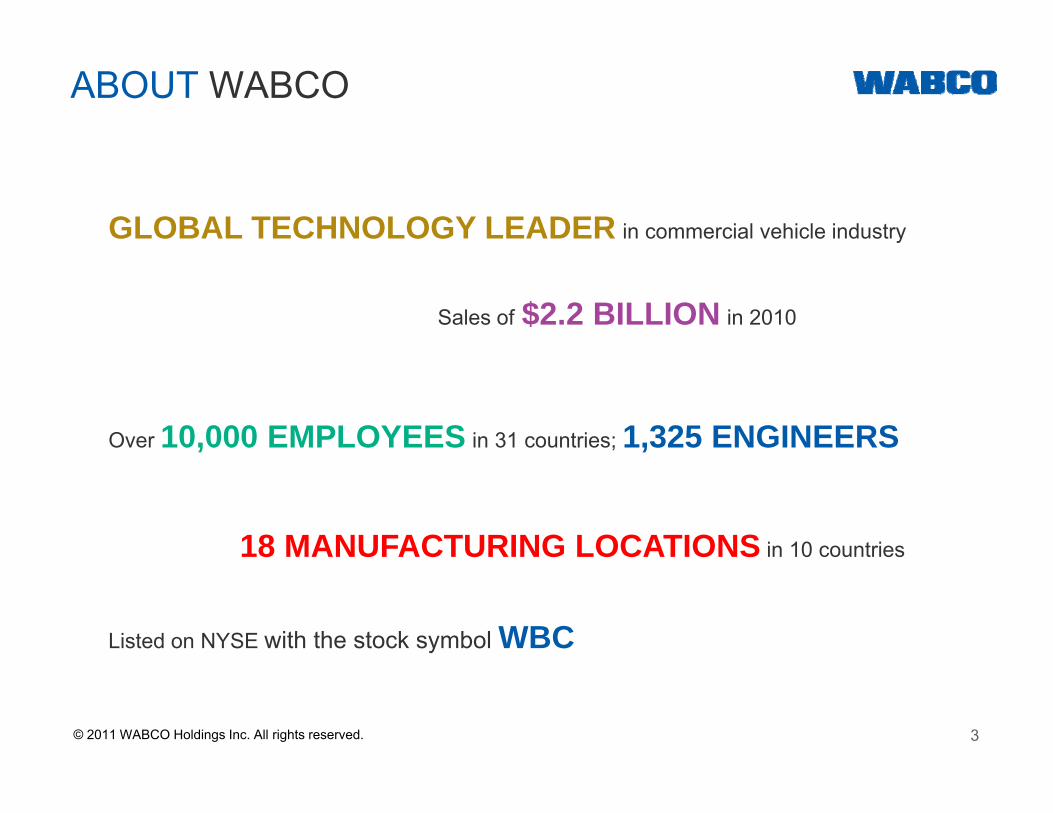
ABOUT WABCO
GLOBAL TECHNOLOGY LEADER in commercial vehicle industry
Sales of $2.2 BILLION in 2010
Over 10,000 EMPLOYEES in 31 countries; 1,325 ENGINEERS
18 MANUFACTURING LOCATIONS in 10 countries
Listed on NYSE with the stock symbol WBC
3© 2011 WABCO Holdings Inc. All rights reserved.

TECHNOLOGY AND INNOVATIONLEADER
TractionControl
Anti-LockBrakingSystem
El t i
IntegratedVehicle TireMonitoring
PneumaticTransmissionAutomation
System
ControlSystem Electronic
StabilityControl
AdaptiveCruise Control
OnGuard™CollisionMitigationSystem
RSSplus™
ESCsmart™
Trailer OptiTurn™
ElectronicallyControlled AirSuspension
(ECAS)
ECASfor automotive
RSSplus™Roll Stability
SupportTrailer System
Trailer OptiLoad™
C-comp clutchcompressor1996
200020042006 2008 2010
1980’sTwo Stage
Compressor
Trailer EBS E
Trailer Telematics
TransmissionAutomation System
ElectronicBrakingSystem
OnGuardPLUSTM
TailGUARDTM
FuelGuardTM
20012003
2007 2009
Trailer EBS - E
Roll StabilitySupport for
trailers
Trailer
New GenerationAir Disc Brake
Air SystemProtector
OnGuardMaxTM
Autonomous Emergency Braking
System
High Output
System FuelGuard
E-compTM
Air Disc BrakeNGMAXTM
Trailer remote
4
Electronic Braking System
HydraulicTransmissionAutomation
System
High OutputCompressor
Trailer remoteControl
TrailerGUARDTM
Telematics© 2011 WABCO Holdings Inc. All rights reserved.
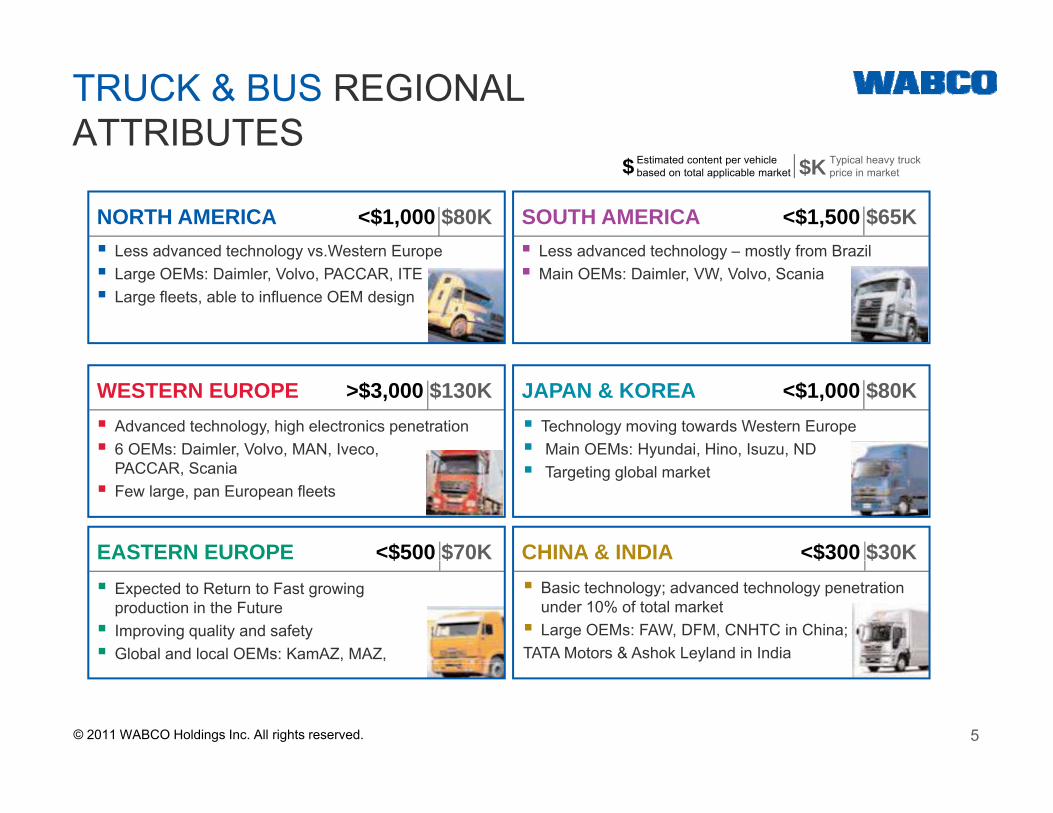
TRUCK & BUS REGIONAL ATTRIBUTES
SOUTH AMERICA <$1,500 $65KNORTH AMERICA <$1,000 $80K
Typical heavy truckprice in market
Estimated content per vehicle based on total applicable market$ $K
Less advanced technology vs Western Europe Less advanced technology – mostly from BrazilLess advanced technology vs.Western Europe Large OEMs: Daimler, Volvo, PACCAR, ITE Large fleets, able to influence OEM design
Less advanced technology mostly from Brazil Main OEMs: Daimler, VW, Volvo, Scania
JAPAN & KOREA <$1,000 $80KWESTERN EUROPE >$3,000 $130K Advanced technology, high electronics penetration 6 OEMs: Daimler, Volvo, MAN, Iveco,
Technology moving towards Western Europe Main OEMs: Hyundai, Hino, Isuzu, ND
CHINA & INDIA <$300 $30KEASTERN EUROPE <$500 $70K
PACCAR, Scania Few large, pan European fleets
Targeting global market
$ $$ $ Expected to Return to Fast growing
production in the Future Improving quality and safety Global and local OEMs: KamAZ, MAZ,
Basic technology; advanced technology penetration under 10% of total market Large OEMs: FAW, DFM, CNHTC in China; TATA Motors & Ashok Leyland in India
5© 2011 WABCO Holdings Inc. All rights reserved.
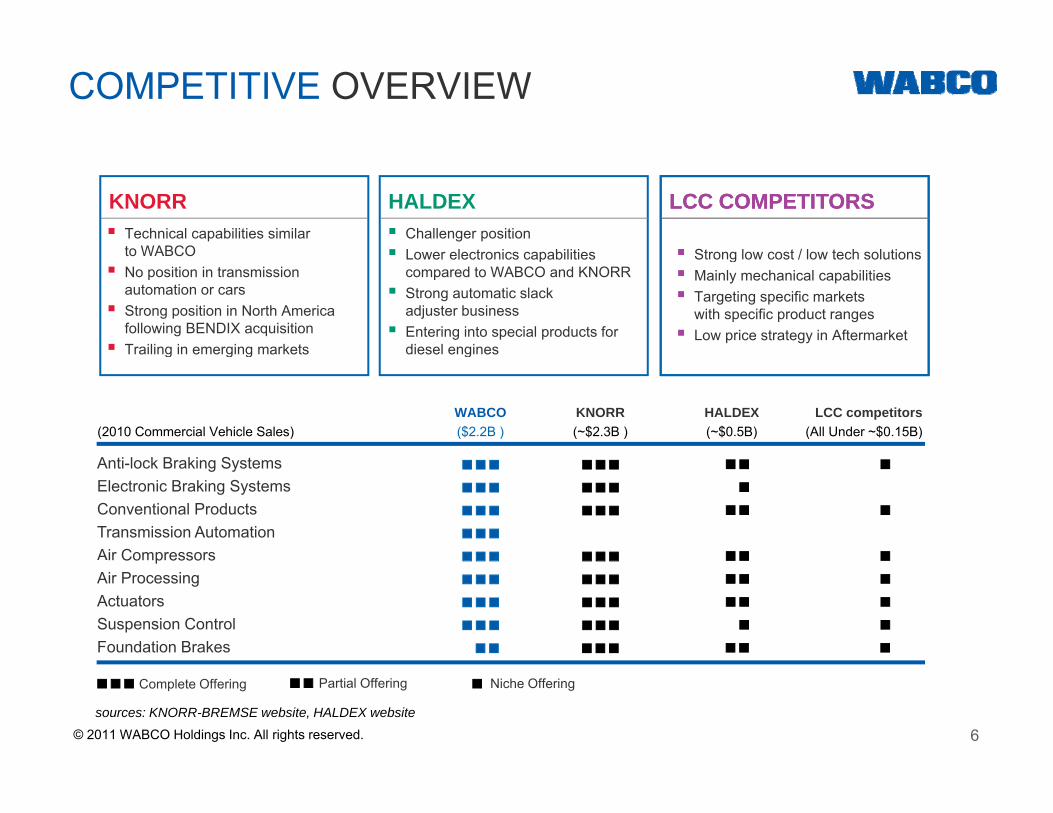
COMPETITIVE OVERVIEW
KNORR HALDEX LCC COMPETITORS Technical capabilities similar
to WABCO Challenger position Lower electronics capabilities
LCC COMPETITORS
Strong low cost / low tech solutionsto WABCO No position in transmission
automation or cars Strong position in North America
following BENDIX acquisition Trailing in emerging markets
Lower electronics capabilities compared to WABCO and KNORR Strong automatic slack
adjuster business Entering into special products for
diesel engines
Strong low cost / low tech solutions Mainly mechanical capabilities Targeting specific markets
with specific product ranges Low price strategy in Aftermarket
g g g g
WABCO KNORR HALDEX LCC competitors(2010 Commercial Vehicle Sales) ($2.2B ) (~$2.3B ) (~$0.5B) (All Under ~$0.15B)
A ti l k B ki S tAnti-lock Braking Systems Electronic Braking SystemsConventional ProductsTransmission AutomationAir CompressorsCo p esso sAir ProcessingActuatorsSuspension ControlFoundation Brakes
6
Complete Offering Partial Offering Niche Offering
sources: KNORR-BREMSE website, HALDEX website
© 2011 WABCO Holdings Inc. All rights reserved.
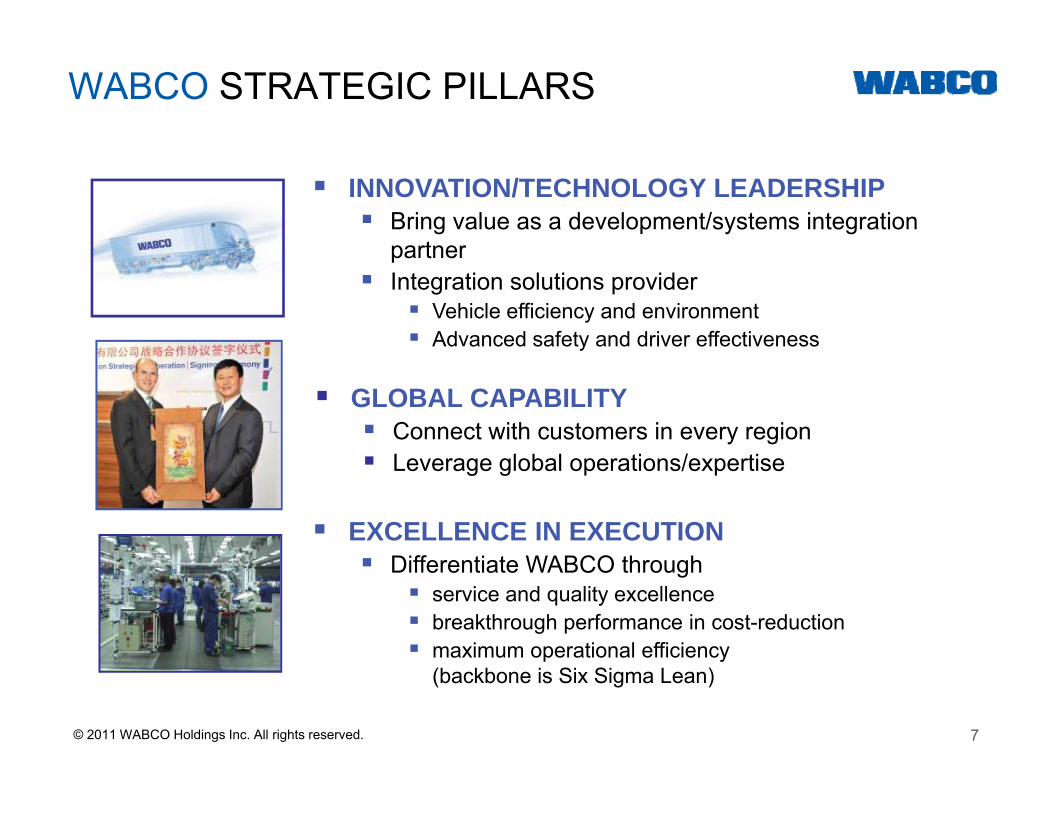
WABCO STRATEGIC PILLARS
INNOVATION/TECHNOLOGY LEADERSHIP Bring value as a development/systems integration
partnerpartner Integration solutions provider
Vehicle efficiency and environment Advanced safety and driver effectiveness
GLOBAL CAPABILITY Connect with customers in every region L l b l ti / ti Leverage global operations/expertise
EXCELLENCE IN EXECUTION Differentiate WABCO through Differentiate WABCO through
service and quality excellence breakthrough performance in cost-reduction maximum operational efficiency
7
(backbone is Six Sigma Lean)
© 2011 WABCO Holdings Inc. All rights reserved.
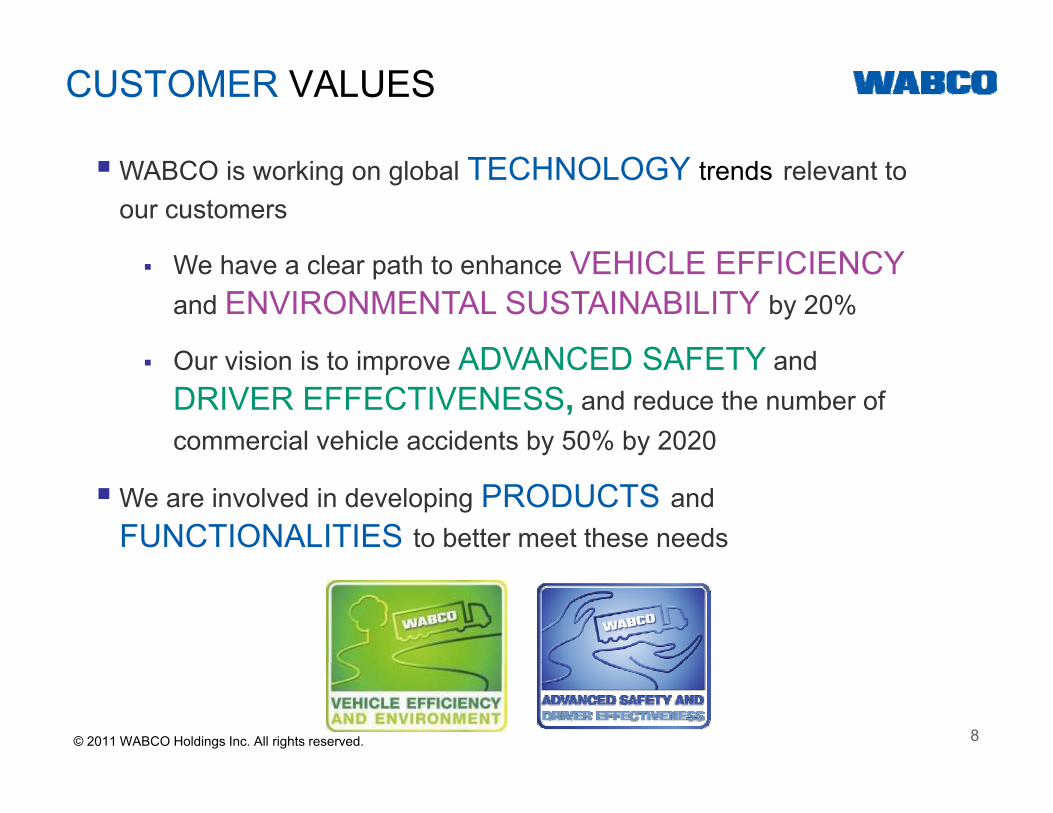
CUSTOMER VALUES
WABCO is working on global TECHNOLOGY trends relevant to our customers
VEHICLE EFFICIENCY We have a clear path to enhance VEHICLE EFFICIENCYand ENVIRONMENTAL SUSTAINABILITY by 20%
O i i i t i ADVANCED SAFETY d Our vision is to improve ADVANCED SAFETY and DRIVER EFFECTIVENESS, and reduce the number of commercial vehicle accidents by 50% by 2020
We are involved in developing PRODUCTS and FUNCTIONALITIES to better meet these needs
8© 2011 WABCO Holdings Inc. All rights reserved.
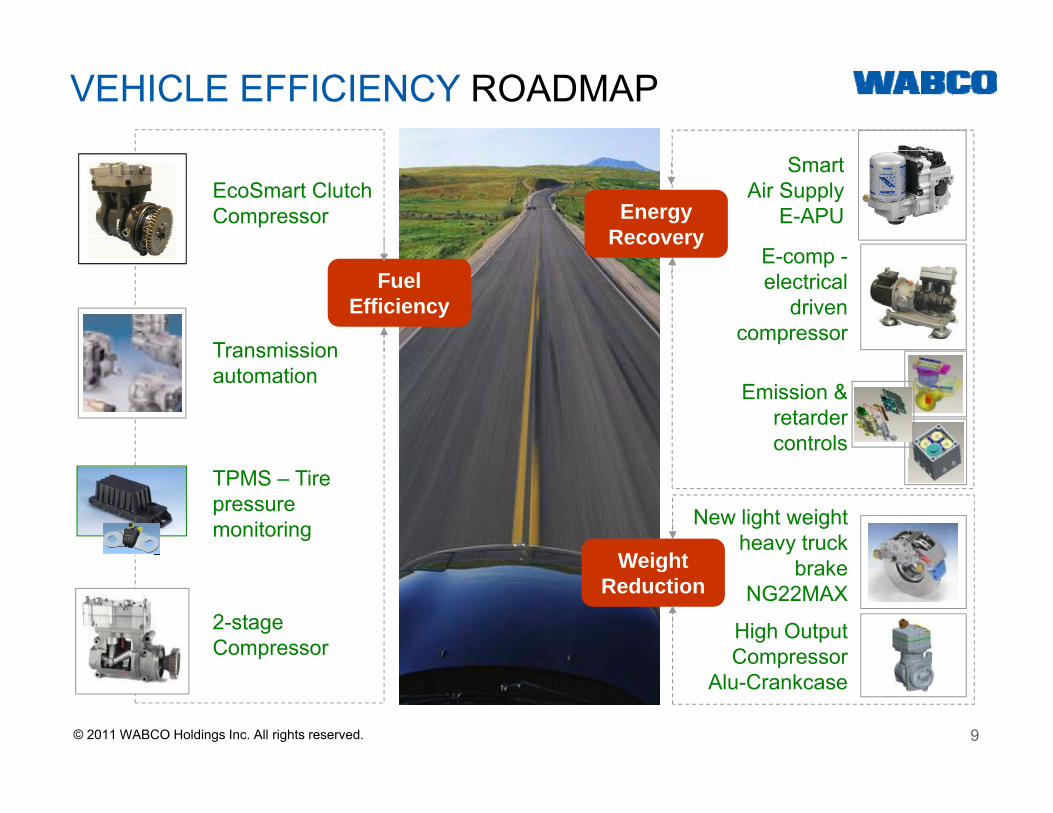
VEHICLE EFFICIENCY ROADMAP
EcoSmart Clutch Compressor
E comp
Smart Air Supply
E-APUEnergy Recovery
E-comp -electrical
driven compressor
Transmission
Fuel Efficiency
Transmission automation
Emission & retarder controls
New light weight heavy truck
b k
TPMS – Tire pressure monitoring
Weight brake NG22MAX
2-stage Compressor
High Output Compressor
Weight Reduction
9
CompressorAlu-Crankcase
© 2011 WABCO Holdings Inc. All rights reserved.
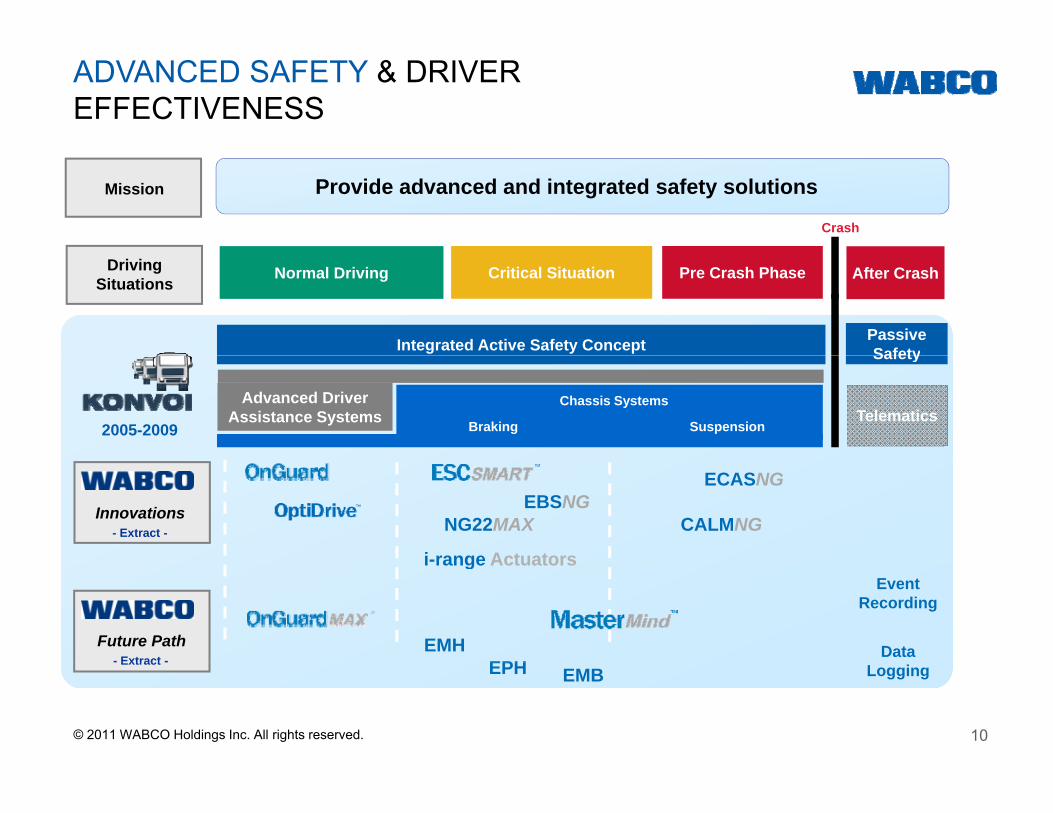
ADVANCED SAFETY & DRIVER EFFECTIVENESS
Mission Provide advanced and integrated safety solutions
Crash
Driving Situations Normal Driving Critical Situation Pre Crash Phase
Integrated Active Safety Concept
After Crash
Passive SafetySafety
TelematicsAdvanced Driver
Assistance SystemsChassis Systems
Braking Suspension2005-2009
Innovations EBSNGECASNG
- Extract - NG22MAX CALMNG
i-range Actuators
Future Path Data
Event Recording
- Extract -
i-range Actuators
EPHEMH
10
LoggingExtract EPH EMB
© 2011 WABCO Holdings Inc. All rights reserved.
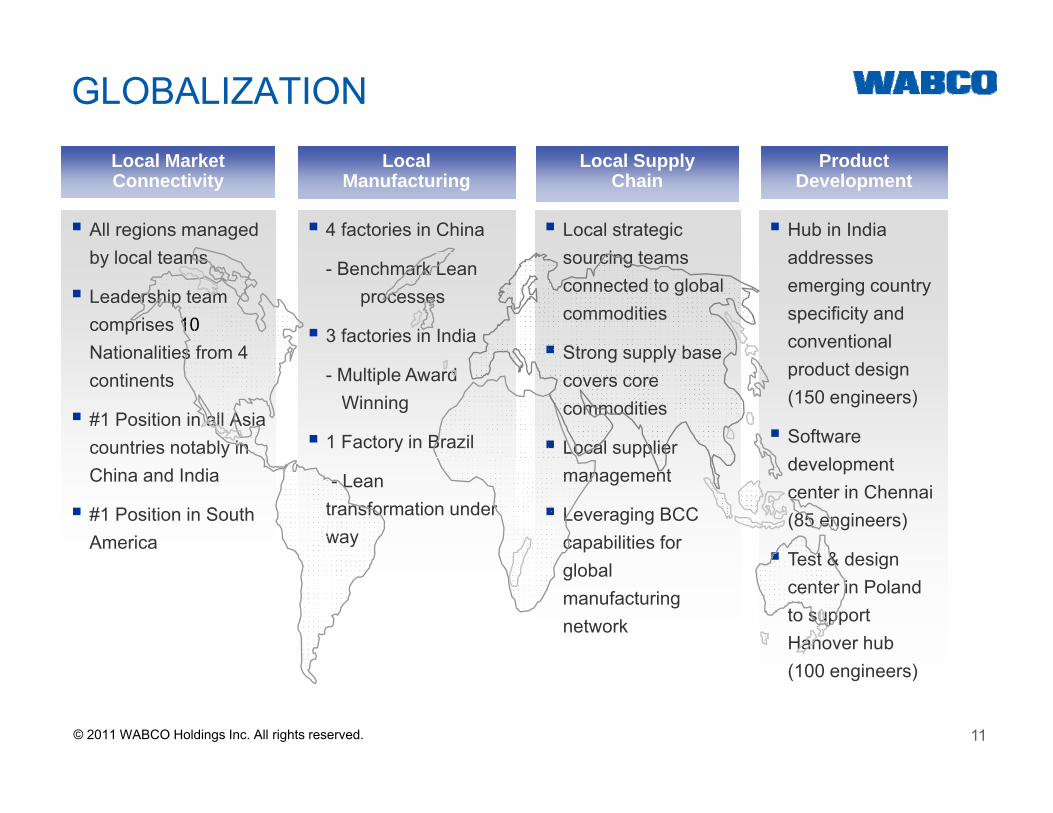
GLOBALIZATION
All regions managed b l l t
Local MarketConnectivity
4 factories in China
LocalManufacturing
Local SupplyChain
Local strategic i t
ProductDevelopment
Hub in India ddby local teams
Leadership team comprises 10Nationalities from 4
- Benchmark Lean processes
3 factories in India
sourcing teams connected to global commodities
Strong supply base
addresses emerging country specificity and conventional Nationalities from 4
continents
#1 Position in all Asia countries notably in
- Multiple Award Winning
1 Factory in Brazil
Strong supply base covers core commodities
Local supplier
product design (150 engineers)
Software d l tChina and India
#1 Position in South America
- Lean transformation under way
management
Leveraging BCC capabilities for
development center in Chennai (85 engineers)
Test & designglobal manufacturing network
Test & design center in Poland to support Hanover hub
11
(100 engineers)
© 2011 WABCO Holdings Inc. All rights reserved.
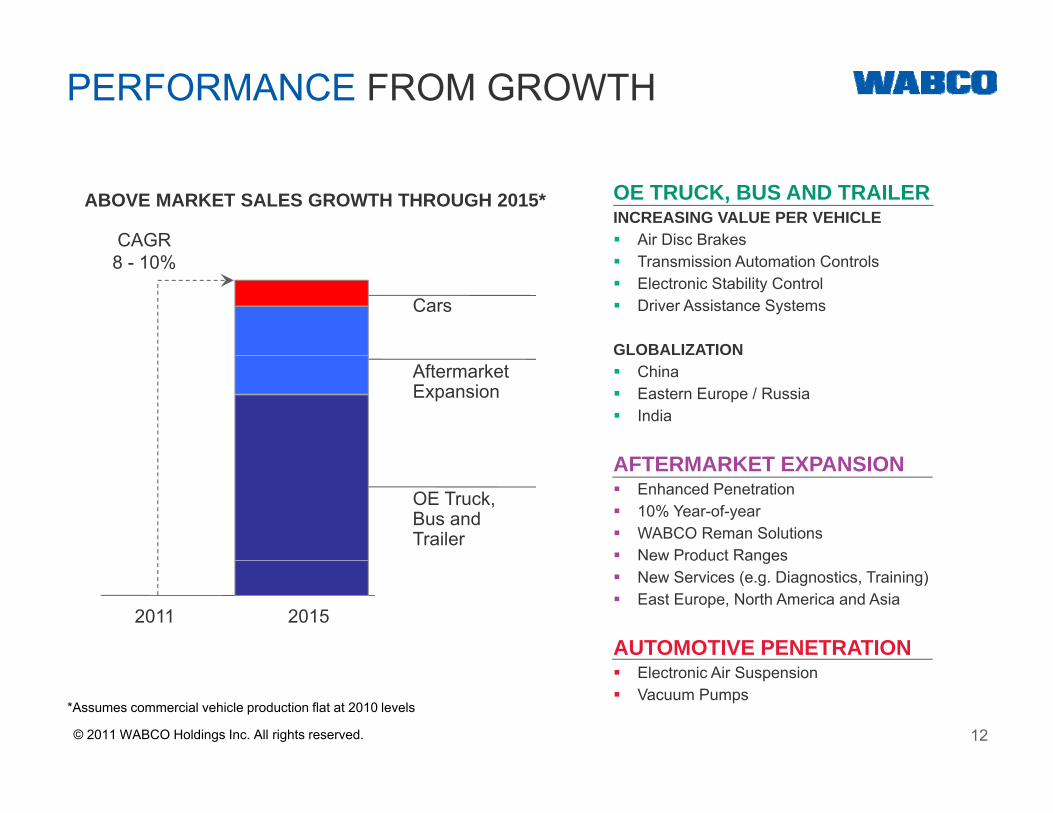
PERFORMANCE FROM GROWTH
ABOVE MARKET SALES GROWTH THROUGH 2015*
CAGR
OE TRUCK, BUS AND TRAILERINCREASING VALUE PER VEHICLE Air Disc Brakes
8 - 10%
Cars
Transmission Automation Controls Electronic Stability Control Driver Assistance Systems
GLOBALIZATIONAftermarketExpansion
China Eastern Europe / Russia India
AFTERMARKET EXPANSIONOE Truck,Bus andTrailer
AFTERMARKET EXPANSION Enhanced Penetration 10% Year-of-year WABCO Reman Solutions New Product Ranges
20152011
e oduct a ges New Services (e.g. Diagnostics, Training) East Europe, North America and Asia
AUTOMOTIVE PENETRATION
12
Electronic Air Suspension Vacuum Pumps
*Assumes commercial vehicle production flat at 2010 levels
© 2011 WABCO Holdings Inc. All rights reserved.
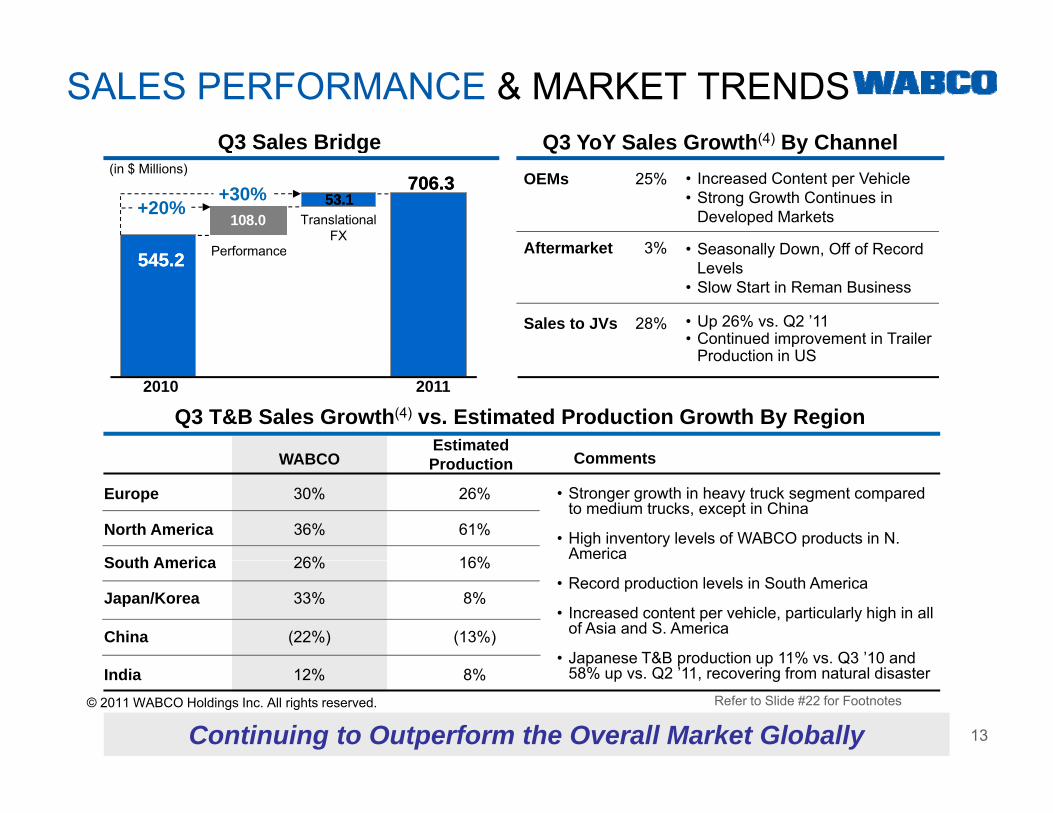
Q3 Sales Bridge Q3 YoY Sales Growth(4) By Channel
SALES PERFORMANCE & MARKET TRENDS
108.0
Performance
Q g
TranslationalFX
4 24 2
Q y
Aftermarket 3%
OEMs 25% • Increased Content per Vehicle• Strong Growth Continues in
Developed Markets
• Seasonally Down, Off of Record
706.3706.3(in $ Millions)
+20% 53.153.1+30%
• Up 26% vs. Q2 ’11• Continued improvement in Trailer
Production in US
Performance545.2545.2 Aftermarket 3%
Sales to JVs 28%
Seasonally Down, Off of Record Levels
• Slow Start in Reman Business
Q3 T&B Sales Growth(4) vs. Estimated Production Growth By Region
Production in US
20112010
WABCOEstimated
Comments
Europe
North America
South America
30%
36%
26%
26%
61%
16%
WABCO Production
• Stronger growth in heavy truck segment compared to medium trucks, except in China
• High inventory levels of WABCO products in N. America
Comments
South America
Japan/Korea
China
26%
33%
(22%)
16%
8%
(13%)
• Record production levels in South America
• Increased content per vehicle, particularly high in all of Asia and S. America
• Japanese T&B production up 11% vs. Q3 ’10 and
13
Refer to Slide #22 for Footnotes
Continuing to Outperform the Overall Market Globally
Japanese T&B production up 11% vs. Q3 10 and 58% up vs. Q2 ’11, recovering from natural disasterIndia 12% 8%
© 2011 WABCO Holdings Inc. All rights reserved.
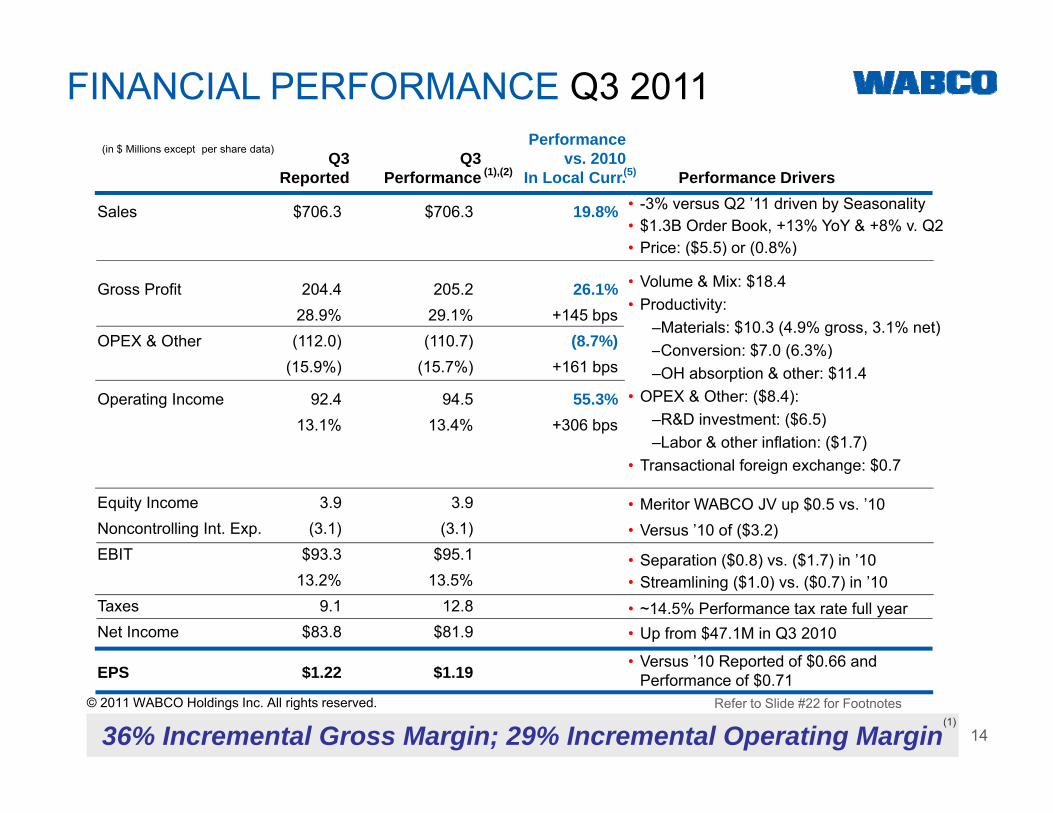
FINANCIAL PERFORMANCE Q3 2011Performance
(in $ Millions except per share data)
Sales $706.3 $706.3 19.8%
Q3 Q3 vs. 2010Reported Performance In Local Curr. Performance Drivers
(in $ Millions except per share data)
(1),(2) (5)
• -3% versus Q2 ’11 driven by Seasonality• $1.3B Order Book, +13% YoY & +8% v. Q2• Price: ($5.5) or (0.8%)
Gross Profit 204.4 205.2 26.1%28.9% 29.1% +145 bps
OPEX & Other (112.0) (110.7) (8.7%)
• Volume & Mix: $18.4• Productivity:
–Materials: $10.3 (4.9% gross, 3.1% net)–Conversion: $7.0 (6.3%)
Price: ($5.5) or (0.8%)
(15.9%) (15.7%) +161 bps
Operating Income 92.4 94.5 55.3%13.1% 13.4% +306 bps
Conversion: $7.0 (6.3%)–OH absorption & other: $11.4
• OPEX & Other: ($8.4):–R&D investment: ($6.5)–Labor & other inflation: ($1.7)
Equity Income 3.9 3.9Noncontrolling Int. Exp. (3.1) (3.1)EBIT $93.3 $95.1
• Transactional foreign exchange: $0.7
• Meritor WABCO JV up $0.5 vs. ’10• Versus ’10 of ($3.2)
• Separation ($0 8) vs ($1 7) in ’10$ $13.2% 13.5%
Taxes 9.1 12.8Net Income $83.8 $81.9
• Versus ’10 Reported of $0 66 and
• Separation ($0.8) vs. ($1.7) in 10• Streamlining ($1.0) vs. ($0.7) in ’10• ~14.5% Performance tax rate full year• Up from $47.1M in Q3 2010
14
EPS $1.22 $1.19
36% Incremental Gross Margin; 29% Incremental Operating Margin
Versus 10 Reported of $0.66 and Performance of $0.71
(1)Refer to Slide #22 for Footnotes© 2011 WABCO Holdings Inc. All rights reserved.
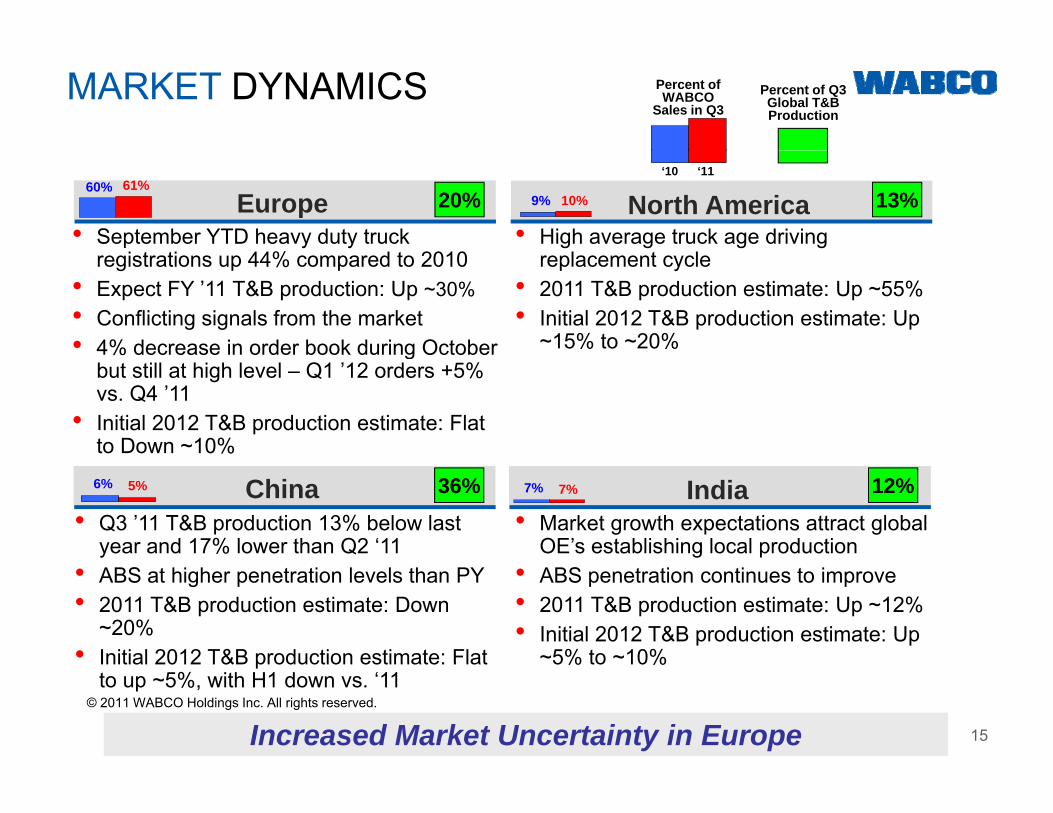
MARKET DYNAMICS Percent of WABCO
Sales in Q3Percent of Q3 Global T&B Production
North America• High average truck age driving
l t l• September YTD heavy duty truck
i t ti 44% d t 2010
Europe60% 61%
9% 10%20% 13%‘10 ‘11
replacement cycle• 2011 T&B production estimate: Up ~55%• Initial 2012 T&B production estimate: Up
~15% to ~20%
registrations up 44% compared to 2010 • Expect FY ’11 T&B production: Up ~30%• Conflicting signals from the market• 4% decrease in order book during October g
but still at high level – Q1 ’12 orders +5% vs. Q4 ’11
• Initial 2012 T&B production estimate: Flat to Down ~10%
• Q3 ’11 T&B production 13% below last year and 17% lower than Q2 ‘11
China6% 5% 36%
• Market growth expectations attract global OE’s establishing local production
India7% 7% 12%
• ABS at higher penetration levels than PY• 2011 T&B production estimate: Down
~20%• Initial 2012 T&B production estimate: Flat
• ABS penetration continues to improve• 2011 T&B production estimate: Up ~12%• Initial 2012 T&B production estimate: Up
~5% to ~10%
15Increased Market Uncertainty in Europe
Initial 2012 T&B production estimate: Flat to up ~5%, with H1 down vs. ‘11
5% to 10%
© 2011 WABCO Holdings Inc. All rights reserved.
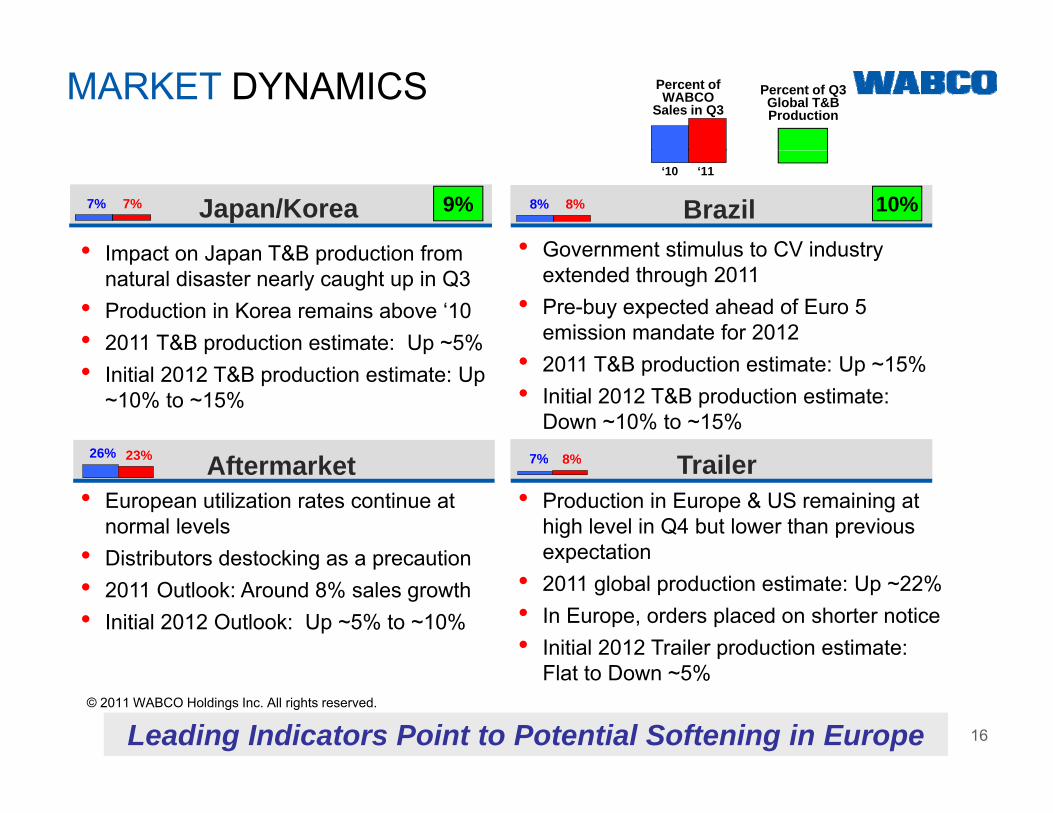
MARKET DYNAMICS Percent of WABCO
Sales in Q3Percent of Q3 Global T&B Production
• Impact on Japan T&B production from
Japan/Korea7% 7% 9% Brazil• Government stimulus to CV industry
8% 8% 10%‘10 ‘11
• Impact on Japan T&B production from natural disaster nearly caught up in Q3
• Production in Korea remains above ‘10• 2011 T&B production estimate: Up ~5%
Government stimulus to CV industry extended through 2011
• Pre-buy expected ahead of Euro 5 emission mandate for 2012
Aft k t T il26% 23% 7% 8%
• Initial 2012 T&B production estimate: Up ~10% to ~15%
• 2011 T&B production estimate: Up ~15% • Initial 2012 T&B production estimate:
Down ~10% to ~15%
Aftermarket• European utilization rates continue at
normal levels• Distributors destocking as a precaution
Trailer• Production in Europe & US remaining at
high level in Q4 but lower than previous expectation
23% 7% 8%
Distributors destocking as a precaution• 2011 Outlook: Around 8% sales growth• Initial 2012 Outlook: Up ~5% to ~10%
p• 2011 global production estimate: Up ~22%• In Europe, orders placed on shorter notice• Initial 2012 Trailer production estimate:
16Leading Indicators Point to Potential Softening in Europe
Flat to Down ~5%© 2011 WABCO Holdings Inc. All rights reserved.
WHAT COULD THIS MEAN FOR WABCO
• C t fl ibilit i di t l b• Current flexibility in direct labor:
● Above 30% temporary employees in high cost countries
● Above 50% in best cost countries● Above 50% in best cost countries
• Current footprint in best cost countries:
● Above 60% of manufacturing workforce
● Above 40% of materials sourced
● Above 40% of engineers
• Range of previously described 2012 market assumptions still leads to some revenue growth for WABCO with continued ability to outperform the market
• Margin expectations relative to sales growth:
● Stable margins at around 3% to 5% growth
● Margin erosion below 3% and expansion above 5% growth
17Prepared for Market Uncertainty
● Margin erosion below 3% and expansion above 5% growth© 2011 WABCO Holdings Inc. All rights reserved.
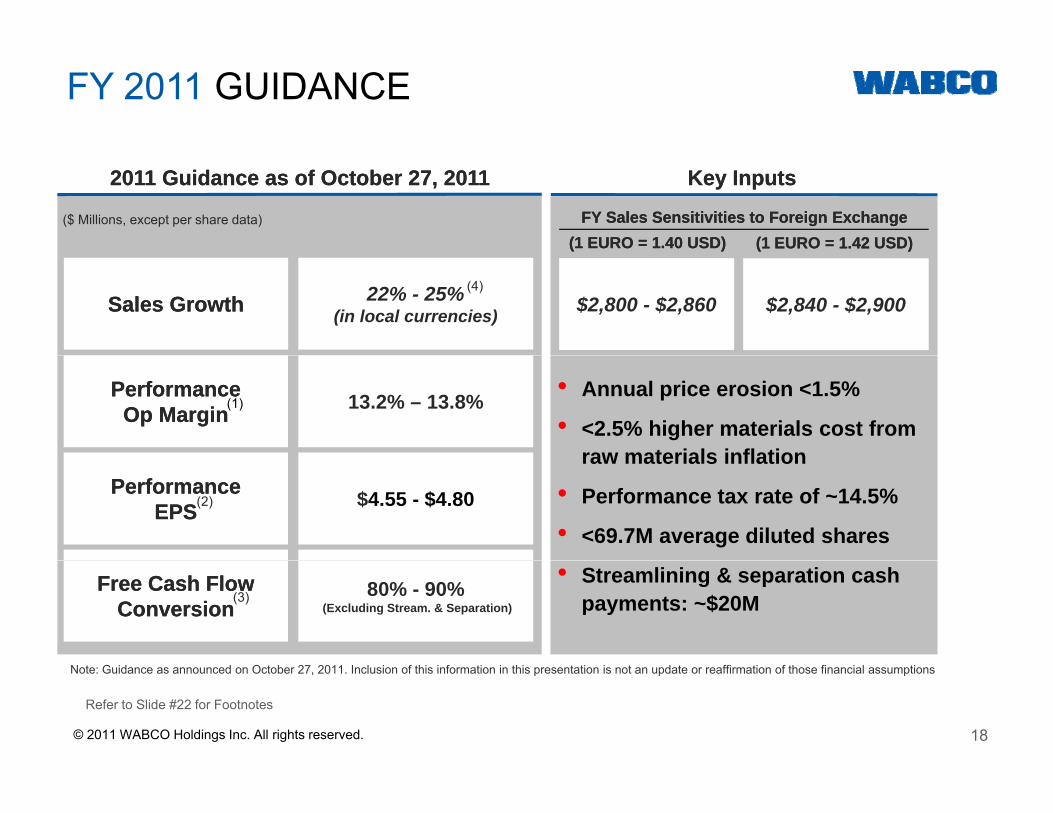
FY 2011 GUIDANCE
(1 EURO = 1.40 USD)(1 EURO = 1.40 USD)
Key InputsKey Inputs2011 Guidance as of October 27, 20112011 Guidance as of October 27, 2011
($ Millions, except per share data)
(1 EURO = 1.42 USD)(1 EURO = 1.42 USD)FY Sales Sensitivities to Foreign ExchangeFY Sales Sensitivities to Foreign Exchange
Sales GrowthSales Growth 22% - 25%(in local currencies)
(4)$2,800 - $2,860 $2,840 - $2,900
Structural Incremental MarginPerformance Performance
Op MarginOp Margin 13.2% – 13.8%(1)• Annual price erosion <1.5%
• <2.5% higher materials cost from raw materials inflation
PerformancePerformanceEPSEPS $4.55 - $4.80(2)
raw materials inflation
• Performance tax rate of ~14.5%
• <69.7M average diluted shares
Free Cash Flow Free Cash Flow ConversionConversion(3) 80% - 90%
(Excluding Stream. & Separation)
• Streamlining & separation cash payments: ~$20M
18
Refer to Slide #22 for Footnotes
Note: Guidance as announced on October 27, 2011. Inclusion of this information in this presentation is not an update or reaffirmation of those financial assumptions
© 2011 WABCO Holdings Inc. All rights reserved.
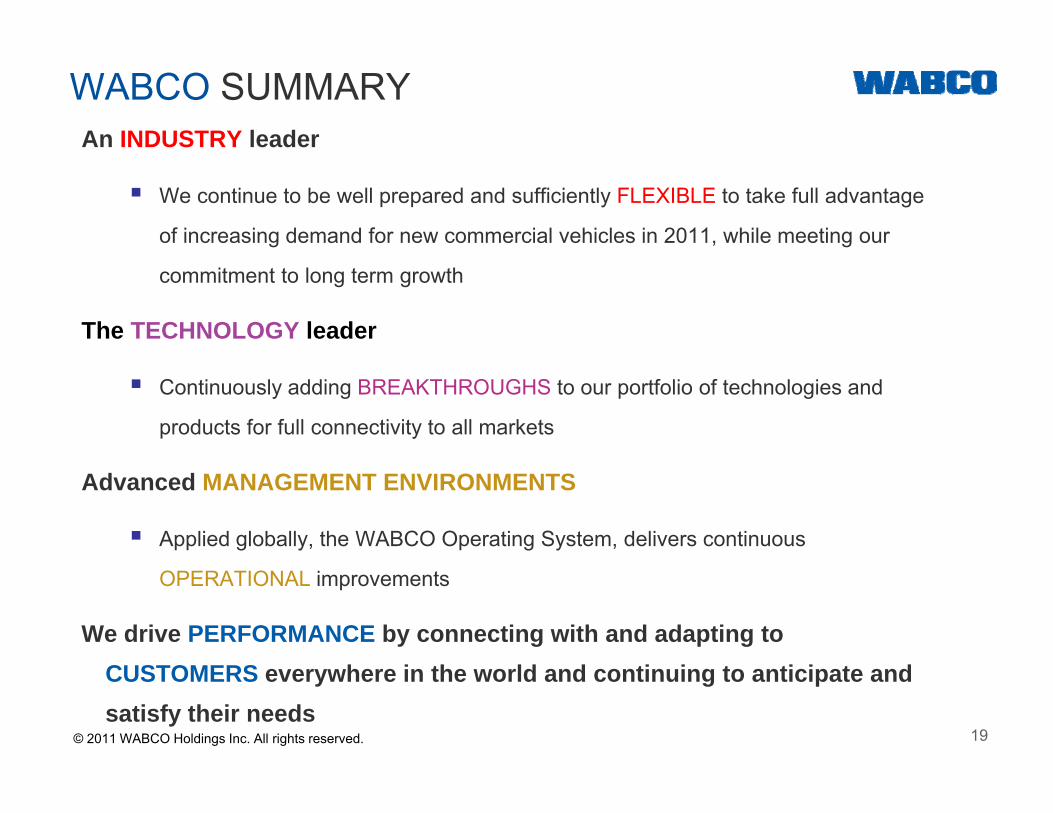
WABCO SUMMARYAn INDUSTRY leader
We continue to be well prepared and sufficiently FLEXIBLE to take full advantage
of increasing demand for new commercial vehicles in 2011, while meeting our
commitment to long term growth
The TECHNOLOGY leader
Continuously adding BREAKTHROUGHS to our portfolio of technologies and
products for full connectivity to all markets
Advanced MANAGEMENT ENVIRONMENTS
Applied globally, the WABCO Operating System, delivers continuous
OPERATIONAL improvements
We drive PERFORMANCE by connecting with and adapting to
19
CUSTOMERS everywhere in the world and continuing to anticipate and satisfy their needs
© 2011 WABCO Holdings Inc. All rights reserved.
PASSION© 2011 WABCO Holdings Inc. All rights reserved.
APPENDIXRECONCILIATIONS OF NON-GAAP MEASURES TO GAAP MEASURES
Footnotes, Tables & Definitions
Footnotes1. Adjusted for streamlining and separation costs2. Adjusted for streamlining, separation and one-time tax and discrete tax items3. Net cash provided by operating activities less net cash used in investing activitiesp y p g g4. Adjusted for currency translation5. Adjusted for currency translation, streamlining and separation costs
TablesThe tables that follow provide the reconciliations of the non-GAAP financial measures to the most comparable US GAAP measures.
Definitions Separation costs include all the incremental costs to establish WABCO as a stand-
alone separate independent company. It also includes the costs associated with certain liabilities, including contingent liabilities, that have been assumed by WABCO from Trane, formerly American Standard, in the separation but are not related to the V hi l C t l B i Th t ld i l d th (i) i di dj t t tVehicle Controls Business. These costs would include the (i) periodic adjustments to the carrying values of the liability, (ii) interest on certain liabilities and (iii) costs to defend certain of these assumed liabilities.
Streamlining costs are those costs that help adjust the company’s workforce and th t h i k t i t
22
other resources to changing market requirements.
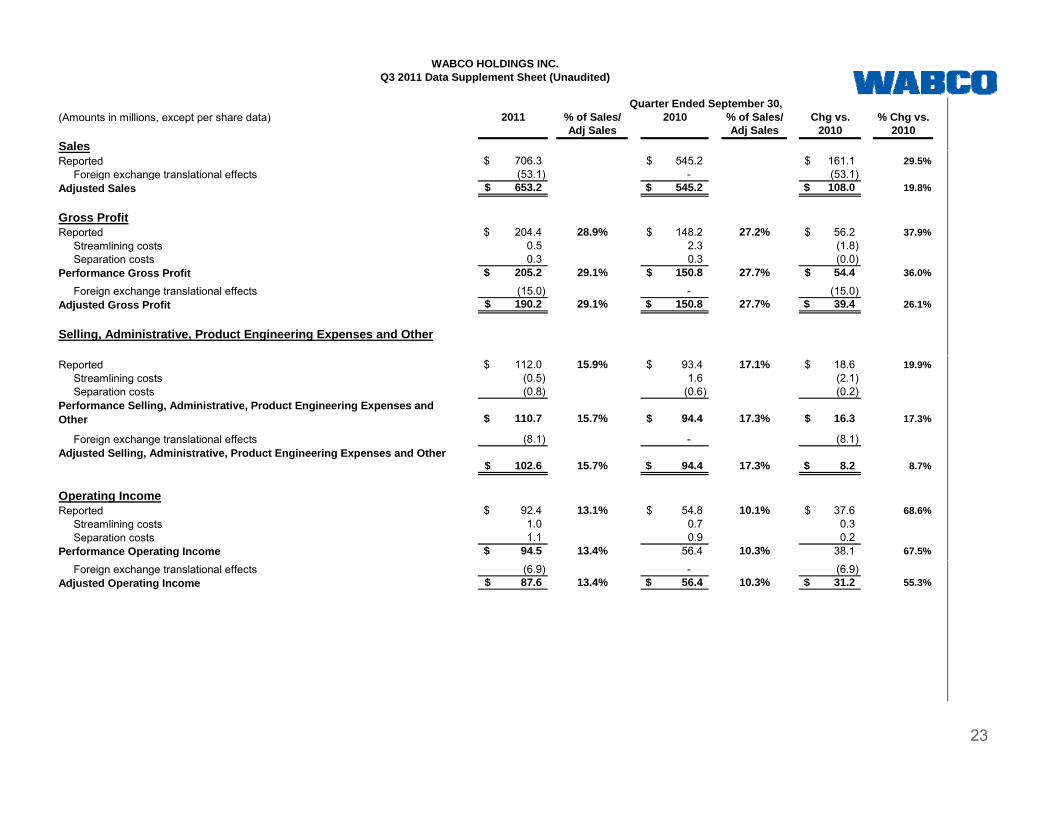
(Amounts in millions, except per share data) 2011 % of Sales/ 2010 % of Sales/ Chg vs. % Chg vs.Adj Sales Adj Sales 2010 2010
Sales
WABCO HOLDINGS INC.Q3 2011 Data Supplement Sheet (Unaudited)
Quarter Ended September 30,
Reported 706.3$ 545.2$ 161.1$ 29.5% Foreign exchange translational effects (53.1) - (53.1) Adjusted Sales 653.2$ 545.2$ 108.0$ 19.8%
Gross ProfitReported 204.4$ 28.9% 148.2$ 27.2% 56.2$ 37.9% Streamlining costs 0.5 2.3 (1.8) Separation costs 0.3 0.3 (0.0) Performance Gross Profit 205.2$ 29.1% 150.8$ 27.7% 54.4$ 36.0%
Foreign exchange translational effects (15.0) - (15.0) Adjusted Gross Profit 190.2$ 29.1% 150.8$ 27.7% 39.4$ 26.1%
Selling, Administrative, Product Engineering Expenses and Other
Reported 112.0$ 15.9% 93.4$ 17.1% 18.6$ 19.9% Streamlining costs (0.5) 1.6 (2.1) Separation costs (0.8) (0.6) (0.2) Performance Selling, Administrative, Product Engineering Expenses and Other 110.7$ 15.7% 94.4$ 17.3% 16.3$ 17.3%
Foreign exchange translational effects (8.1) - (8.1) Adjusted Selling, Administrative, Product Engineering Expenses and Otherj g, , g g p
102.6$ 15.7% 94.4$ 17.3% 8.2$ 8.7%
Operating IncomeReported 92.4$ 13.1% 54.8$ 10.1% 37.6$ 68.6% Streamlining costs 1.0 0.7 0.3 Separation costs 1.1 0.9 0.2 Performance Operating Income 94.5$ 13.4% 56.4 10.3% 38.1 67.5%
Foreign exchange translational effects (6.9) - (6.9) Adjusted Operating Income 87.6$ 13.4% 56.4$ 10.3% 31.2$ 55.3%
23
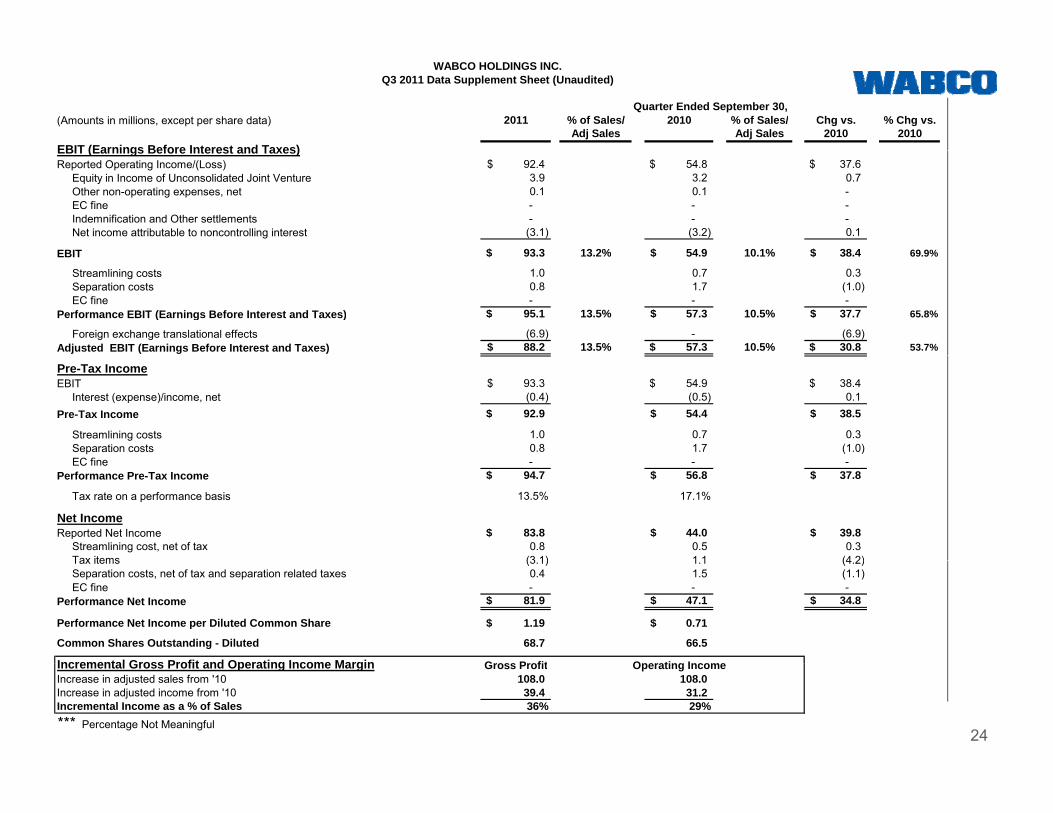
(Amounts in millions, except per share data) 2011 % of Sales/ 2010 % of Sales/ Chg vs. % Chg vs.Adj Sales Adj Sales 2010 2010
EBIT (Earnings Before Interest and Taxes)
WABCO HOLDINGS INC.Q3 2011 Data Supplement Sheet (Unaudited)
Quarter Ended September 30,
EBIT (Earnings Before Interest and Taxes)Reported Operating Income/(Loss) 92.4$ 54.8$ 37.6$ Equity in Income of Unconsolidated Joint Venture 3.9 3.2 0.7 Other non-operating expenses, net 0.1 0.1 - EC fine - - - Indemnification and Other settlements - - - Net income attributable to noncontrolling interest (3.1) (3.2) 0.1
EBIT 93 3$ 13 2% 54 9$ 10 1% 38 4$ 69 9%EBIT 93.3$ 13.2% 54.9$ 10.1% 38.4$ 69.9%
Streamlining costs 1.0 0.7 0.3 Separation costs 0.8 1.7 (1.0) EC fine - - - Performance EBIT (Earnings Before Interest and Taxes) 95.1$ 13.5% 57.3$ 10.5% 37.7$ 65.8%
Foreign exchange translational effects (6.9) - (6.9) Adjusted EBIT (Earnings Before Interest and Taxes) 88.2$ 13.5% 57.3$ 10.5% 30.8$ 53.7%
Pre-Tax IncomeEBIT 93.3$ 54.9$ 38.4$ Interest (expense)/income, net (0.4) (0.5) 0.1 Pre-Tax Income 92.9$ 54.4$ 38.5$
Streamlining costs 1.0 0.7 0.3 Separation costs 0.8 1.7 (1.0)
EC fi EC fine - - - Performance Pre-Tax Income 94.7$ 56.8$ 37.8$
Tax rate on a performance basis 13.5% 17.1%
Net IncomeReported Net Income 83.8$ 44.0$ 39.8$ Streamlining cost, net of tax 0.8 0.5 0.3
Tax items (3 1) 1 1 (4 2) Tax items (3.1) 1.1 (4.2) Separation costs, net of tax and separation related taxes 0.4 1.5 (1.1) EC fine - - - Performance Net Income 81.9$ 47.1$ 34.8$
Performance Net Income per Diluted Common Share 1.19$ 0.71$
Common Shares Outstanding - Diluted 68.7 66.5
Incremental Gross Profit and Operating Income Margin G P fit O ti I
24
Incremental Gross Profit and Operating Income Margin Gross Profit Operating IncomeIncrease in adjusted sales from '10 108.0 108.0 Increase in adjusted income from '10 39.4 31.2 Incremental Income as a % of Sales 36% 29%*** Percentage Not Meaningful
(Amounts in millions, except per share data) 2011 % of Sales/ 2010 % of Sales/ Chg vs. % Chg vs.Adj Sales Adj Sales 2010 2010
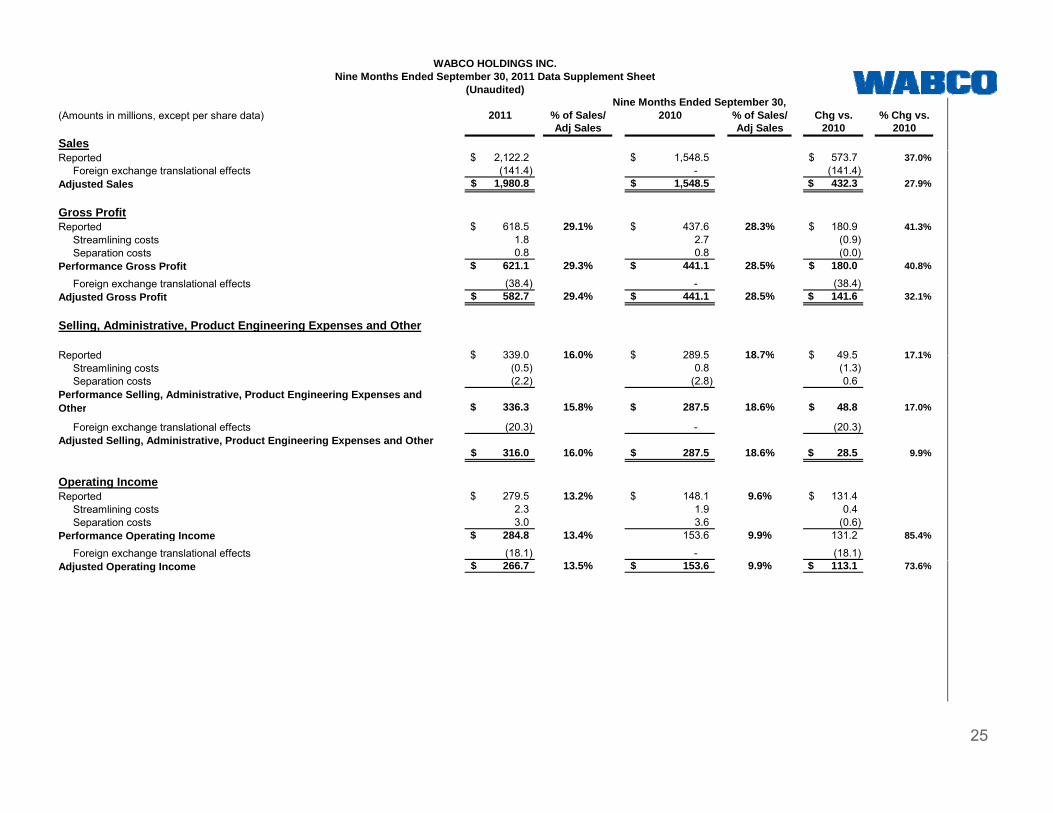
Sales
(Unaudited)
WABCO HOLDINGS INC.Nine Months Ended September 30, 2011 Data Supplement Sheet
Nine Months Ended September 30,
Reported 2,122.2$ 1,548.5$ 573.7$ 37.0% Foreign exchange translational effects (141.4) - (141.4) Adjusted Sales 1,980.8$ 1,548.5$ 432.3$ 27.9%
Gross ProfitReported 618.5$ 29.1% 437.6$ 28.3% 180.9$ 41.3% Streamlining costs 1.8 2.7 (0.9)
Separation costs 0 8 0 8 (0 0) Separation costs 0.8 0.8 (0.0) Performance Gross Profit 621.1$ 29.3% 441.1$ 28.5% 180.0$ 40.8%
Foreign exchange translational effects (38.4) - (38.4) Adjusted Gross Profit 582.7$ 29.4% 441.1$ 28.5% 141.6$ 32.1%
Selling, Administrative, Product Engineering Expenses and Other
Reported 339 0$ 16 0% 289 5$ 18 7% 49 5$ 17 1%Reported 339.0$ 16.0% 289.5$ 18.7% 49.5$ 17.1% Streamlining costs (0.5) 0.8 (1.3) Separation costs (2.2) (2.8) 0.6 Performance Selling, Administrative, Product Engineering Expenses and Other 336.3$ 15.8% 287.5$ 18.6% 48.8$ 17.0%
Foreign exchange translational effects (20.3) - (20.3) Adjusted Selling, Administrative, Product Engineering Expenses and Other
316.0$ 16.0% 287.5$ 18.6% 28.5$ 9.9%
Operating IncomeReported 279.5$ 13.2% 148.1$ 9.6% 131.4$ Streamlining costs 2.3 1.9 0.4 Separation costs 3.0 3.6 (0.6) Performance Operating Income 284.8$ 13.4% 153.6 9.9% 131.2 85.4%
Foreign exchange translational effects (18.1) - (18.1) Adjusted Operating Income 266.7$ 13.5% 153.6$ 9.9% 113.1$ 73.6%
25
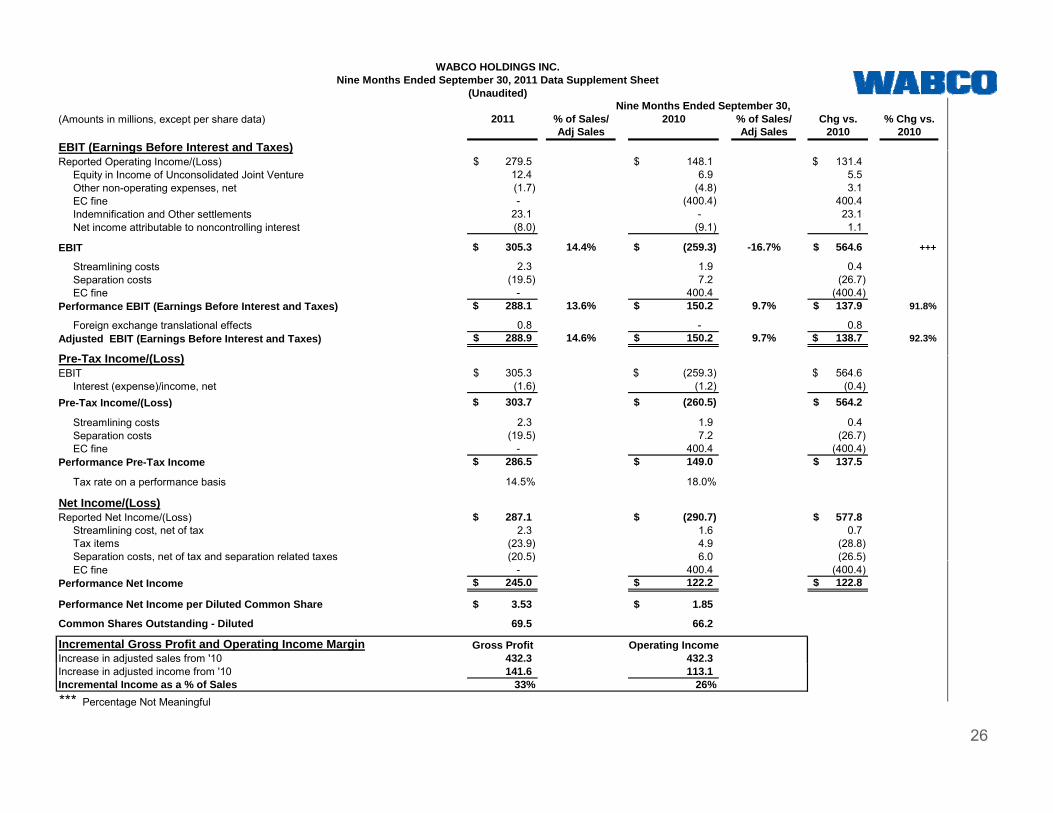
(Amounts in millions, except per share data) 2011 % of Sales/ 2010 % of Sales/ Chg vs. % Chg vs.Adj Sales Adj Sales 2010 2010
EBIT (Earnings Before Interest and Taxes)
(Unaudited)
WABCO HOLDINGS INC.Nine Months Ended September 30, 2011 Data Supplement Sheet
Nine Months Ended September 30,
EBIT (Earnings Before Interest and Taxes)Reported Operating Income/(Loss) 279.5$ 148.1$ 131.4$ Equity in Income of Unconsolidated Joint Venture 12.4 6.9 5.5 Other non-operating expenses, net (1.7) (4.8) 3.1 EC fine - (400.4) 400.4 Indemnification and Other settlements 23.1 - 23.1 Net income attributable to noncontrolling interest (8.0) (9.1) 1.1
EBIT 305.3$ 14.4% (259.3)$ -16.7% 564.6$ +++
Streamlining costs 2.3 1.9 0.4 Separation costs (19.5) 7.2 (26.7) EC fine - 400.4 (400.4) Performance EBIT (Earnings Before Interest and Taxes) 288.1$ 13.6% 150.2$ 9.7% 137.9$ 91.8%
Foreign exchange translational effects 0.8 - 0.8 Adjusted EBIT (Earnings Before Interest and Taxes) 288.9$ 14.6% 150.2$ 9.7% 138.7$ 92.3%
P T I /(L )Pre-Tax Income/(Loss)EBIT 305.3$ (259.3)$ 564.6$ Interest (expense)/income, net (1.6) (1.2) (0.4) Pre-Tax Income/(Loss) 303.7$ (260.5)$ 564.2$
Streamlining costs 2.3 1.9 0.4 Separation costs (19.5) 7.2 (26.7) EC fine - 400.4 (400.4)
286 5$ 149 0$ 137 5$Performance Pre-Tax Income 286.5$ 149.0$ 137.5$
Tax rate on a performance basis 14.5% 18.0%
Net Income/(Loss)Reported Net Income/(Loss) 287.1$ (290.7)$ 577.8$ Streamlining cost, net of tax 2.3 1.6 0.7 Tax items (23.9) 4.9 (28.8) Separation costs, net of tax and separation related taxes (20.5) 6.0 (26.5) p , p ( ) ( ) EC fine - 400.4 (400.4) Performance Net Income 245.0$ 122.2$ 122.8$
Performance Net Income per Diluted Common Share 3.53$ 1.85$
Common Shares Outstanding - Diluted 69.5 66.2
Incremental Gross Profit and Operating Income Margin Gross Profit Operating IncomeIncrease in adjusted sales from '10 432.3 432.3
26
jIncrease in adjusted income from '10 141.6 113.1 Incremental Income as a % of Sales 33% 26%*** Percentage Not Meaningful
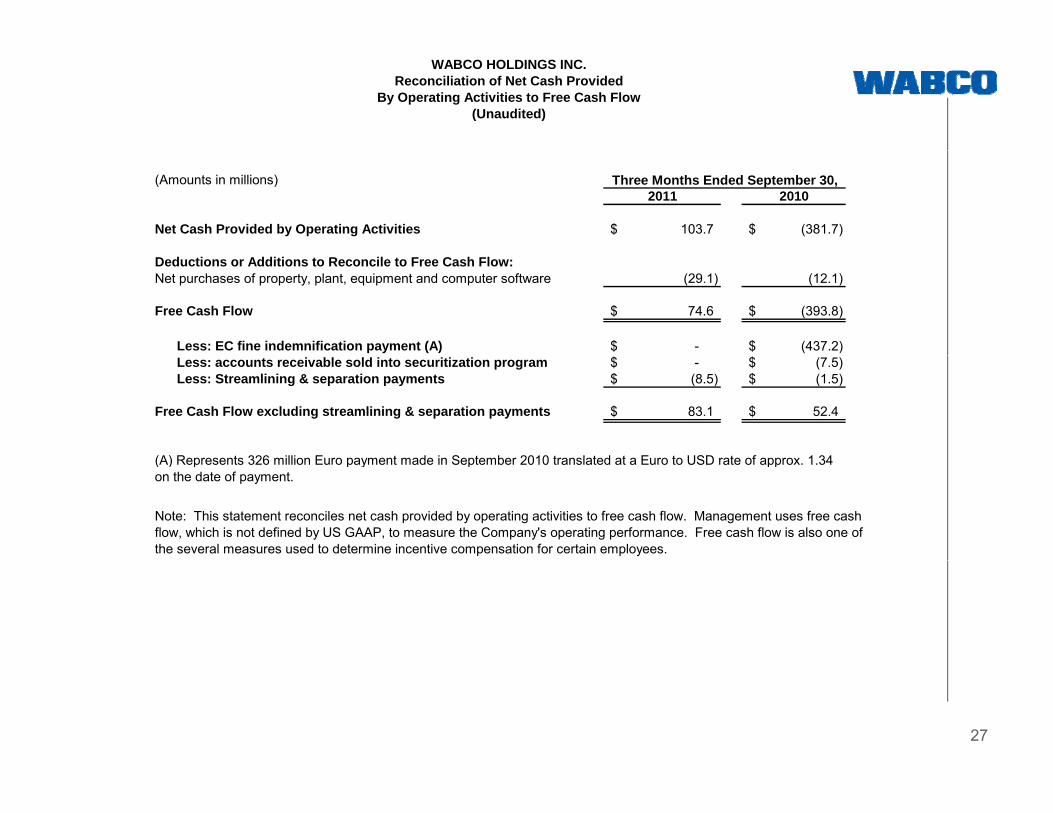
WABCO HOLDINGS INC.Reconciliation of Net Cash Provided
By Operating Activities to Free Cash Flow(Unaudited)
(Amounts in millions) Three Months Ended September 30,2011 2010
Net Cash Provided by Operating Activities 103.7$ (381.7)$
Deductions or Additions to Reconcile to Free Cash Flow:Net purchases of property, plant, equipment and computer software (29.1) (12.1)
Free Cash Flow 74.6$ (393.8)$
Less: EC fine indemnification payment (A) -$ (437.2)$ Less: accounts receivable sold into securitization program -$ (7.5)$ Less: Streamlining & separation payments (8.5)$ (1.5)$
Free Cash Flow excluding streamlining & separation payments 83.1$ 52.4$
(A) Represents 326 million Euro payment made in September 2010 translated at a Euro to USD rate of approx 1 34
Note: This statement reconciles net cash provided by operating activities to free cash flow. Management uses free cash flow, which is not defined by US GAAP, to measure the Company's operating performance. Free cash flow is also one of the several measures used to determine incentive compensation for certain employees.
(A) Represents 326 million Euro payment made in September 2010 translated at a Euro to USD rate of approx. 1.34 on the date of payment.
27
(Amounts in millions except per share data)
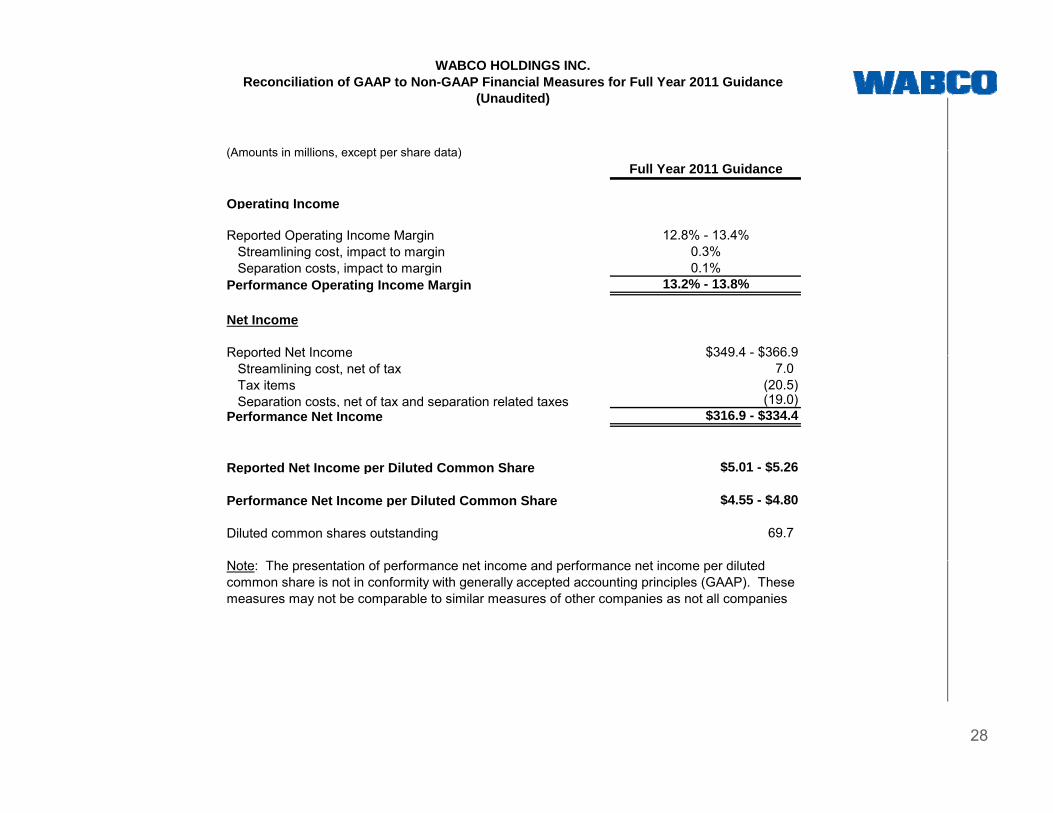
WABCO HOLDINGS INC.Reconciliation of GAAP to Non-GAAP Financial Measures for Full Year 2011 Guidance
(Unaudited)
(Amounts in millions, except per share data)Full Year 2011 Guidance
Operating Income
Reported Operating Income Margin 12.8% - 13.4%Streamlining cost impact to margin 0 3% Streamlining cost, impact to margin 0.3%
Separation costs, impact to margin 0.1%Performance Operating Income Margin 13.2% - 13.8%
Net Income
Reported Net Income $349.4 - $366.9Reported Net Income $349.4 $366.9 Streamlining cost, net of tax 7.0 Tax items (20.5) Separation costs, net of tax and separation related taxes (19.0)Performance Net Income $316.9 - $334.4
Reported Net Income per Diluted Common Share $5.01 - $5.26
Performance Net Income per Diluted Common Share $4.55 - $4.80
Diluted common shares outstanding 69.7
f f fNote: The presentation of performance net income and performance net income per diluted common share is not in conformity with generally accepted accounting principles (GAAP). These measures may not be comparable to similar measures of other companies as not all companies
28