W17 20. Bond Rating - NMASBO 20_ Bond Rating.pdf · rising 0.12% and the NASDAQ rising 0.11%. ......
18
2/8/17 1 Bond Market & Post Election Economic Outlook 2/16/2017 RBC Capital Markets 1 Table of Contents I. National Economy 3 II. Federal Policies and Trump Administration 5 III. Local Economy 13 IV. Credit Ratings 18 V. Municipal Market Update 30
-
Upload
trannguyet -
Category
Documents
-
view
216 -
download
0
Transcript of W17 20. Bond Rating - NMASBO 20_ Bond Rating.pdf · rising 0.12% and the NASDAQ rising 0.11%. ......
2/8/17
1
Bond Market & Post Election Economic Outlook
2/16/2017
RBC Capital Markets 1
Table of Contents
I. National Economy 3
II. Federal Policies and Trump Administration 5
III. Local Economy 13
IV. Credit Ratings 18
V. Municipal Market Update 30

2/8/17
2
RBC Capital Markets 2
Disclaimer
RBC Capital Markets, LLC (“RBC CM”) is providing the information contained in this document for discussion purposes only and not in connection with RBC CM serving as Underwriter, Investment Banker, municipal advisor, financial advisor or fiduciary to a financial transaction participant or any other person or entity. RBC CM will not have any duties or liability to any person or entity in connection with the information being provided herein. The information provided is not intended to be and should not be construed as “advice” within the meaning of Section 15B of the Securities Exchange Act of 1934. The financial transaction participants should consult with its own legal, accounting, tax, financial and other advisors, as applicable, to the extent it deems appropriate.
This presentation was prepared exclusively for the benefit of and internal use by the recipient. This presentation is confidential and proprietary to RBC Capital Markets, LLC (“RBC CM”) and may not be disclosed, reproduced, distributed or used for any other purpose by the recipient without RBCCM’s express written consent.
By acceptance of these materials, and notwithstanding any other express or implied agreement, arrangement, or understanding to the contrary, RBC CM, its affiliates and the recipient agree that the recipient (and its employees, representatives, and other agents) may disclose to any and all persons, without limitation of any kind from the commencement of discussions, the tax treatment, structure or strategy of the transaction and any fact that may be relevant to understanding such treatment, structure or strategy, and all materials of any kind (including opinions or other tax analyses) that are provided to the recipient relating to such tax treatment, structure, or strategy.
The information and any analyses contained in this presentation are taken from, or based upon, information obtained from the recipient or from publicly available sources, the completeness and accuracy of which has not been independently verified, and cannot be assured by RBC CM. The information and any analyses in these materials reflect prevailing conditions and RBC CM’s views as of this date, all of which are subject to change.
To the extent projections and financial analyses are set forth herein, they may be based on estimated financial performance prepared by or in consultation with the recipient and are intended only to suggest reasonable ranges of results. The printed presentation is incomplete without reference to the oral presentation or other written materials that supplement it.
IRS Circular 230 Disclosure: RBC CM and its affiliates do not provide tax advice and nothing contained herein should be construed as tax advice. Any discussion of U.S. tax matters contained herein (including any attachments) (i) was not intended or written to be used, and cannot be used, by you for the purpose of avoiding tax penalties; and (ii) was written in connection with the promotion or marketing of the matters addressed herein. Accordingly, you should seek advice based upon your particular circumstances from an independent tax advisor.
National Economy

2/8/17
3
RBC Capital Markets 4
Key Themes of a Trump Presidency An Anemic Recovery • Since 2006, US GDP has averaged just 1.6% (vs. 3.5% for the prior 50 years)
• Inflation and rates been well below average throughout the recovery
The Stage Was Set for Reflation • Labor market conditions have already begun to tighten as the recovery cycle matures
§ Unemployment at 4.9%, New Mexico is 6.6%. § Wage inflation at 2.8% § Job creation at 175k/mo vs. 85k new entrants/mo into the labor force
Pro-Growth Policies • Corporate tax cuts could easily add 5–7% to profits annually going forward • Deregulation should increase economic growth through greater productivity • Financials would be the greatest beneficiary of less onerous regulations • Fiscal spending, while a positive, would have a delayed impact on growth • Consumer spending should improve as wages rise and savings rates fall • Higher rates should positively impact Banks and consumer spending (paradox of thrift)
A New Investment Regime / Market Leadership • Asset Allocation
§ Rates to continue rising; credit spreads to tighten § Equities to rise on stronger earnings and higher multiples § Small Caps and Value to outperform § Dollar to continue strengthening as US yields outpace global rates § Volatility to rise, correlations to remain low
• Sectors § Financials most attractive § Bond-proxies and Staples to remain under pressure § Economically sensitive groups (Energy, Materials, Industrials) to outperform § IP companies with strong fundamentals to keep pace with market
• Factors § Low P/E, domestically oriented, and high-tax companies to outperform § Low vol to lag
Source: RBC Capital Markets http://ca.rbcwealthmanagement.com/documents/376147/376163/2017+Outlook+-+The+Trump+Playbook.pdf/166956c7-388e-41e8-80b9-efba4e31a805
Federal Policies and Trump Administration

2/8/17
4
RBC Capital Markets 6
Democratic Party’s Blueprint to Rebuild America’s Infrastructure
Source: Democratic Policy and Communication Center https://www.dpcc.senate.gov/files/documents/ABlueprinttoRebuildAmericasInfrastructure1.24.17.pdf
RBC Capital Markets 7
Democratic Party’s Blueprint to Rebuild America’s Infrastructure
Source: Democratic Policy and Communication Center https://www.dpcc.senate.gov/files/documents/ABlueprinttoRebuildAmericasInfrastructure1.24.17.pdf

2/8/17
5
RBC Capital Markets 8
Three-months out, policy rate The BoC made no hint of an easing bias in December but went to great lengths to highlight policy divergence between the Canada and the US. We see the Bank remaining on the sidelines this year as the Fed tightens.
We expect the Fed will continue with a gradual pace of tightening this year, holding off on the next rate hike until the second quarter when there is a bit more clarity around US fiscal policy.
We continue to expect the BoE will opt for another round of quantitative easing and further rate cut later this year, although with the UK economy carrying some momentum into 2017, policy changes will take time to materialize.
The ECB’s extension of asset purchases to December keeps them firmly in easing mode, and we don’t expect there will be much talk of tapering this year with inflation forecast to remain below target for some time.
The RBA sounded a bit more dovish toward the end of the year, consistent with recent evidence that the domestic economy is losing steam. We continue to expect a final rate cut later this year. The RBNZ shifted to a neutral bias in November, and while our forecast assumes one more rate cut in the current easing cycle, we don’t expect any policy change when they reconvene in February.
Central Bank Near-Term Bias
Source: RBC http://www.rbc.com/economics/economic-reports/pdf/financial-markets/cbw.pdf
RBC Capital Markets 9
Municipal Market Overview
- Treasuries rallied throughout the week with Treasury yields dropping up to 4 basis points in the 1-10 year range and rising 3 basis points in the 30 year range.
- Treasury strength was concurrent with equity market weakness in the early part of the week; a reversal in Treasury yields occurred after Federal Reserve Bank of San Francisco President John Williams made a case for raising rates in March. Equities ended the week mixed; with the DJIA dropping 0.11%, the S&P rising 0.12% and the NASDAQ rising 0.11%.
- The MMD curve steepened last week as performance on new issue deals was mixed. MMD yields dropped up to 6 basis points on the short end of the curve but increased 1 basis point out on the long end.
- The market looks ahead to $7.45 billion in supply this week after $4.3 billion last week. Municipal funds posted modest inflows of $14 million for the week ended February 1.
- Volatility in the Treasury market has led to challenging conditions in the municipal market.
- A large insurance account continues to sell municipals due to uncertainty surrounding corporate tax reform.
- Municipal funds reported $7 million of net inflows last week; cash continues to move into high-yield funds.
U.S. Market Movers
Positive Drivers
§ With oil price sustaining above US$50/barrel recently, drilling activity has begun to pick up in both Canada and the US.
§ While headline US GDP growth slowed in Q4/16, improving residential and business investment along with another solid quarter of consumer spending spurred domestic demand growth to its strongest pace in more than a year.
Negative Drivers
§ Minutes from the December FOMC meeting revealed a cautious outlook for 2017 as the Trump administration begins, citing uncertainty on how tax, federal spending and regulatory policies would play out
§ U.S. job growth slowed in December, with nonfarm payrolls increasing by a lower-than-expected 156,000, as the unemployment rate remains at historic lows of 4.7%
§ The nation's trade deficit widened sharply in November, to $45.2 billion with exports falling 0.2% and imports rising 1.1%
Source: RBC Capital Markets, Bloomberg and Thomson Municipal Market Data
(1) RBC Rate and Economic Forecast as of January 27, 2017. (2) Interest on Excess Reserves – RBC expects IOER, not the Fed Funds effective rate, to be the targeted
policy rate in the initial stages of the tightening cycle.
RBC Economic Outlook and Interest Rate Forecasts(1)
Q1'17 Q2'17 Q3'17 Q4'17
Real GDP (QoQ) 3.00 2.30 2.50 2.60
Core Inflation (YoY) 2.10 1.90 2.10 2.10
Unemployment 4.50 4.40 4.30 4.20
IOER(2) 0.75 1.00 1.00 1.25
2-Year Notes 1.20 1.40 1.55 1.80
5-Year Notes 1.90 2.10 2.25 2.45
10-Year Notes 2.40 2.65 2.80 3.00
30-Year Bonds 3.00 3.20 3.35 3.50

2/8/17
6
Local Economy
RBC Capital Markets 11
New Mexico Economy Update – Latest Employment Update
• New Mexico’s rate of over-the-year job growth, comparing December 2016 with December 2015 was -0.3% percent, representing an increase of 2,400 jobs.
• Seasonally adjusted unemployment rate in December 2016 was 6.6% in New Mexico unchanged from 2015, and 4.7% in the U.S down 0.3%. from 5.0%.
Source: New Mexico Department of Workforce Solutions as of 1/27/2017
Government 23%
Education & Health Services
17%
Prof. & Business Services
12%
Leisure & Hospitality
11%
Retail Trade 11%
Construction 5%
Financial Activities
4%
Other Services 4%
Manufacturing 3%
Trans, Warehousing &
Utilities 3%
Wholesale Trade
3%
Mining & Logging
2% Information
2%
-22.0%
-4.2%
-2.9%
-2.9%
-0.6%
0.3%
0.3%
1.5%
1.8%
2.4%
3.2%
3.8%
4.2%
5.8%
Mining & Logging
Wholesale Trade
Manufacturing
Retail Trade
Government
Total Nonfarm
Financial Activities
Leisure and Hospitality
Other Services
Professional & Business Services
Construction
Trans, Warehousing & Utilities
Education and Health Services
Information

2/8/17
7
RBC Capital Markets 12
Oil and Gas Price History
Source: US Energy Information Administration
RBC Capital Markets 13
Natural Gas Volume & Value Comparison New Mexico (Total for All Counties)
Natural Gas Volume2014 2015 % Change 2016 % Change
Jan 100,355,220 95,422,900 -4.91% 90,306,672 -5.36%Feb 89,820,371 90,021,653 0.22% 90,661,708 0.71%Mar 102,413,448 99,234,662 -3.10% 97,932,921 -1.31%Apr 99,640,921 98,039,345 -1.61% 97,383,158 -0.67%May 103,974,295 100,808,806 -3.04% 100,303,807 -0.50%Jun 102,489,246 97,330,876 -5.03% 96,700,048 -0.65%Jul 105,918,969 102,300,318 -3.42% 100,656,634 -1.61%Aug 105,374,874 102,912,916 -2.34% 103,107,908 0.19%Sep 100,326,987 101,160,343 0.83% 98,344,629 -2.78%Oct 96,380,895 102,987,306 6.85% 100,062,686 -2.84%Nov 97,313,741 98,810,695 1.54%Dec 96,781,859 92,538,357 -4.38%Total 1,200,790,826 1,181,568,177 975,460,171
Natural Gas Value2014 2015 % Change 2016 % Change
Jan 555,092,452$ 298,067,715$ -46.30% 202,028,604$ -32.22%Feb 582,241,468 269,870,664 -53.65% 192,475,217 -28.68%Mar 588,965,983 296,352,721 -49.68% 191,680,003 -35.32%Apr 528,890,752 277,306,075 -47.57% 200,312,450 -27.76%May 538,762,178 279,876,028 -48.05% 232,272,596 -17.01%Jun 528,856,156 279,217,682 -47.20% 246,421,276 -11.75%Jul 537,479,155 285,936,088 -46.80% 295,810,487 3.45%Aug 493,349,725 289,542,263 -41.31% 302,059,414 4.32%Sep 479,951,442 286,059,400 -40.40% 300,753,602 5.14%Oct 442,243,699 277,938,552 -37.15% 326,086,888 17.32%Nov 416,376,329 235,657,197 -43.40% Dec 396,055,364 214,126,881 -45.94% Total 6,088,264,704$ 3,289,951,266$ 2,489,900,538$
0
20,000,000
40,000,000
60,000,000
80,000,000
100,000,000
120,000,000
Jan Feb Mar Apr May Jun Jul Aug Sep Oct Nov Dec
MM
BTU
Natural Gas - Volume
2014
2015
2016
$0
$100,000,000
$200,000,000
$300,000,000
$400,000,000
$500,000,000
$600,000,000
$700,000,000
Jan Feb Mar Apr May Jun Jul Aug Sep Oct Nov Dec
Val
ue o
f Pro
duct
ion
Natural Gas - Value of Production
2014
2015
2016
-12.33% -1.49%
Jan-15-Oct-15 2,840,167,188
Jan-16-Oct-16 2,489,900,538
Jan-14-Oct-14 5,275,833,010
2015 v. 2014 -46.17%990,219,125
-1.64%975,460,171
2015 v. 2016
Natural Gas Value1,006,695,226
Year-to-Date ComparisonNatural Gas Volume
Source: NM Oil and Natural Gas Administration and Revenue Database (ONGARD)
2/8/17
8
RBC Capital Markets 14
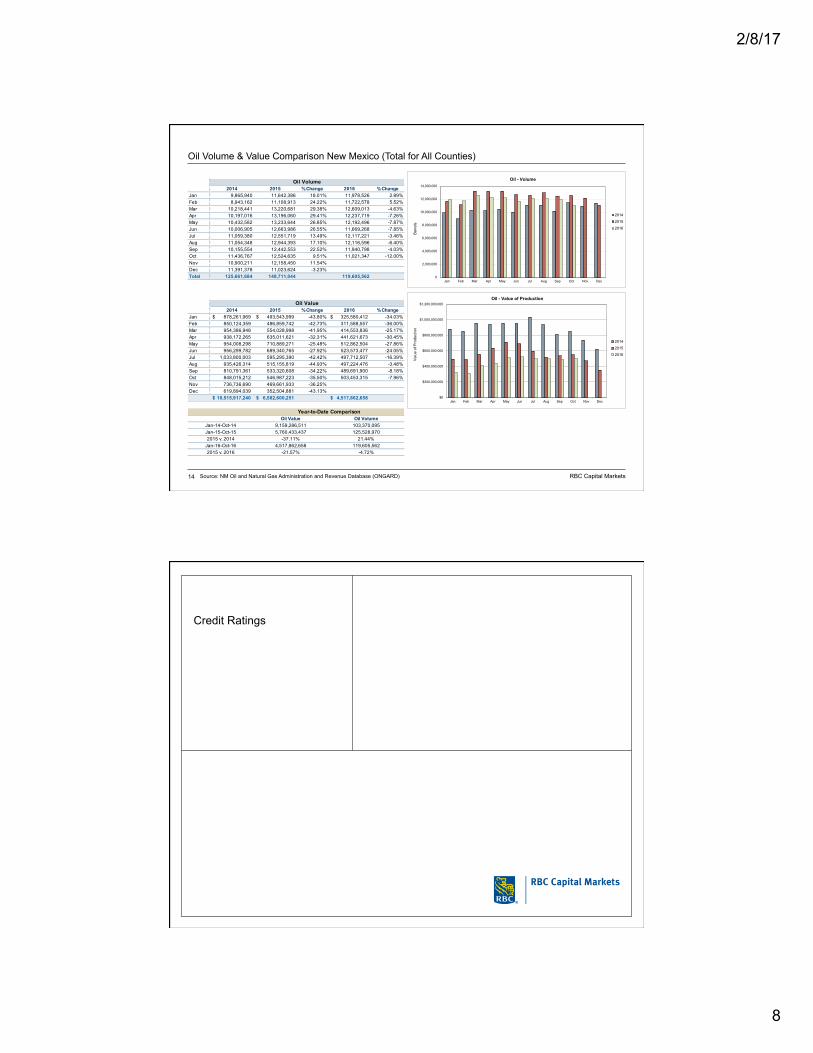
Oil Volume & Value Comparison New Mexico (Total for All Counties)
Source: NM Oil and Natural Gas Administration and Revenue Database (ONGARD)
Oil Volume2014 2015 % Change 2016 % Change
Jan 9,865,940 11,642,386 18.01% 11,978,526 2.89%Feb 8,943,162 11,108,913 24.22% 11,722,578 5.52%Mar 10,218,441 13,220,681 29.38% 12,609,013 -4.63%Apr 10,197,016 13,196,060 29.41% 12,237,719 -7.26%May 10,432,582 13,233,644 26.85% 12,192,496 -7.87%Jun 10,006,905 12,663,986 26.55% 11,669,268 -7.85%Jul 11,059,380 12,551,719 13.49% 12,117,221 -3.46%Aug 11,054,348 12,944,393 17.10% 12,116,596 -6.40%Sep 10,155,554 12,442,553 22.52% 11,940,798 -4.03%Oct 11,436,767 12,524,635 9.51% 11,021,347 -12.00%Nov 10,900,211 12,158,450 11.54%Dec 11,391,378 11,023,624 -3.23%Total 125,661,684 148,711,044 119,605,562
Oil Value2014 2015 % Change 2016 % Change
Jan 878,261,969$ 493,543,999$ -43.80% 325,580,412$ -34.03%Feb 850,124,359 486,859,742 -42.73% 311,588,557 -36.00%Mar 954,386,948 554,028,998 -41.95% 414,553,836 -25.17%Apr 938,172,265 635,011,621 -32.31% 441,621,673 -30.45%May 954,008,298 710,889,271 -25.48% 512,862,504 -27.86%Jun 956,299,782 689,340,765 -27.92% 523,573,477 -24.05%Jul 1,033,800,003 595,295,390 -42.42% 497,712,507 -16.39%Aug 935,426,314 515,155,819 -44.93% 497,224,476 -3.48%Sep 810,791,361 533,320,608 -34.22% 489,691,900 -8.18%Oct 848,015,212 546,987,223 -35.50% 503,453,315 -7.96%Nov 736,736,690 469,661,933 -36.25% Dec 619,894,039 352,504,881 -43.13%
10,515,917,240$ 6,582,600,251$ 4,517,862,658$
0
2,000,000
4,000,000
6,000,000
8,000,000
10,000,000
12,000,000
14,000,000
Jan Feb Mar Apr May Jun Jul Aug Sep Oct Nov Dec
Bar
rels
Oil - Volume
2014
2015
2016
$0
$200,000,000
$400,000,000
$600,000,000
$800,000,000
$1,000,000,000
$1,200,000,000
Jan Feb Mar Apr May Jun Jul Aug Sep Oct Nov Dec
Val
ue o
f Pro
duct
ion
Oil - Value of Production
2014
2015
2016
2015 v. 2016 -21.57% -4.72%
Oil Volume103,370,095125,528,970
21.44%Jan-16-Oct-16 4,517,862,658 119,605,562
Jan-15-Oct-15 5,760,433,4372015 v. 2014 -37.11%
Jan-14-Oct-14 9,159,286,511Oil Value
Year-to-Date Comparison
Credit Ratings

2/8/17
9
RBC Capital Markets 16
Definitions of Credit Ratings
Highest possible rating - principal and interest payments considered extremely secure.
High quality - differs from highest rating only in the degree of protection provided bondholders.
Good ability to pay principal and interest although more susceptible to adverse effects due to changing conditions.
Adequate ability to make principal and interest payments -- adverse changes are more likely to affect the ability to service debt.
Aaa
Aa1/Aa2/Aa3 AA-/AA/AA+
A1/A2/A3 A-/A/A+
Baa1/Baa2/Baa3 BBB-/BBB/BBB+
AAA
Moody’s Standard & Poor’s
& Fitch Ratings
RBC Capital Markets 17
Credit Yield Curve
Source: Municipal Market Data
0
0.5
1
1.5
2
2.5
3
3.5
4
4.5
2018 2019 2020 2021 2022 2023 2024 2025 2026 2027 2028 2029 2030 2031 2032 2033 2034 2035 2036 2037 2038 2039 2040 2041 2042 2043 2044 2045 2046 2047
Rat
e
Year
Cost of Borrowing 1/23/2017
Aaa Aa A Baa

2/8/17
10
RBC Capital Markets 18
Moody’s Scorecard
Source: Moody’s Investor Services
RBC Capital Markets 19
Moody’s Scorecard
Source: Moody’s Investor Services

2/8/17
11
RBC Capital Markets 20
Moody’s Scorecard Adjustment Factors
Source: Moody’s Investor Services
RBC Capital Markets 21
State of New Mexico Moody’s Downgrade Rationale
In October 2016 Moody's Investors Service has downgraded the State of New Mexico’s general obligation bonds to Aa1 from Aaa, affecting $327 million of outstanding debt.
In conjunction with this action downgraded to Aa2 from Aa1 the ratings of the New Mexico School District Enhancement Program (post March 30, 2007) and the New Mexico School District Enhancement Program (pre March 30, 2007), affecting approximately $2.1 billion in enhanced school district debt. The outlook on these ratings is now negative.
Reasons for downgrade:
§ The depletion of general fund reserves following a very large and unanticipated shortfall in tax revenues for fiscal 2016 and 2017.
§ Reserves are expected to equal only 1% of recurring revenues at the end of fiscal 2017
§ The state’s overall liquidity has declined
Credit Strengths
§ Governor and legislature were quick to act to replenish reserves which would have been negative as result of revenue shortfalls in 2016 and 2017.
§ Debt levels and pension liabilities are moderate.
§ General obligation bonds benefit from very rapid payout and particularly strong security provisions.
Credit Challenges
§ Despite actions taken by the legislature, general fund reserves are significantly below prior forecasts and recent history.
§ Economic diversity is relatively low, with concentration in energy and government employment.
§ Wealth levels are below average.
§ Financial reporting practices, while improving, are weaker than typical for a US state.
Source: Moody’s Investor Services

2/8/17
12
RBC Capital Markets 22
Credit Implications of Current Events on New Mexico School Districts
Source: Moody’s Investor Services
• Governor Susana Martinez signed legislation (SB 114) on 1/31/2017 that calls for a non-recurring sweep of $46.1 million in operating cash balances, or an effective 2% reduction in state aid to school districts.
• SB 114 requires the state Public Education Department Secretary to reduce the fiscal 2017 state aid distribution by roughly 2%, in addition to the 1.5% haircut approved in October.
• The sweep outlined in SB 114 excludes 14 districts that currently receive emergency supplemental funding.
• The bill establishes a minimum cash balance standard, ensuring that the sweep alone does not result in less than a 3% cash balance (as a percent of revenues).
• Despite the operational hit, the immediate risk to bondholders is low. Although districts may not be facing immediate default risk, any further deterioration in cash and reserve positions present a serious challenge to ongoing credit quality.
RBC Capital Markets 23
Moody’s Ratings of New Mexico School Districts
Nov-15 Jan-17 Nov-15 Jan-17
Albuquerque Public School District Aa1 Aa1 Ruidoso Municipal School District A1 A1
Santa Fe Public School District Aa1 Aa1 Silver Consolidated School District A1 Baa1
Los Alamos Public School District Aa2 Aa2 Taos Municipal School District A1 A1
Farmington Municipal School District Aa2 Aa2 Texico Municipal School District A1 A1
Roswell Independent School District Aa2 Aa2 Belen Consolidated School District A2 A3
Alamogordo Public School District Aa3 Aa3 Truth or Consequences Municipal Schools A1 A1
Aztec Municipal School District Aa3 Aa3 Cloudcroft Municipal School District A2 A2
Carlsbad Municipal School District Aa3 Aa3 Cobre Consolidated School District A2 N/A
Clovis Municipal School District Aa3 Aa3 Deming Public School District A2 A2
Hobbs Municipal School District Aa3 Aa3 Dexter Consolidated School District A2 A2
Las Cruces Public School District Aa3 Aa3 Dulce Independent School District A2 A2
Rio Rancho Public School District Aa3 A1 Estancia Municipal School District A2 A2
Bernalillo Public School District A1 A1 Las Vegas City Public School District W W
Bloomfield School District A1 A1 Moriarty Municipal School District A2 A3
Capitan School District A1 A1 Socorro Consolidated School District A2 Baa2
Central Consolidated School District A1 A1 Tatum Municipal School District A2 A2
Cimarron Municipal School District A1 A1 Tucumcari Public School District A2 N/A
Espanola Public School District A1 A2 Jal Public School District N/A A3
Eunice Public School District A1 A1 Jemez Valley School District A3 A3
Gadsden Independent School District A1 A1 Logan Municipal School District A3 A3
Gallup-McKinley County School District A1 A1 Mesa Vista Consolidated School District A3 N/A
Grants-Cibola County School District A1 A2 Quemado Independent School District A3 A3
Lordsburg Municipal School District A1 A3 Raton Public School District A3 Baa1
Los Lunas Public School District A1 A1 West Las Vegas Public School District A3 A3
Loving Municipal School District A1 A2 Chama Valley Independent School District Baa1 Baa2
Lovington Municipal School District A1 A1 Pecos Independent School District Baa1 N/A
Pojoaque Valley Public School District A1 A3 Penasco Independent School District Baa1 Baa1
Portales Municipal School District A1 Baa1 Santa Rosa Consolidated School District Baa1 Baa1
Source: Moody's Investors Service Carrizozo Municipal School District Baa2 N/A
W - Withdrawn
2/8/17
13
RBC Capital Markets 24
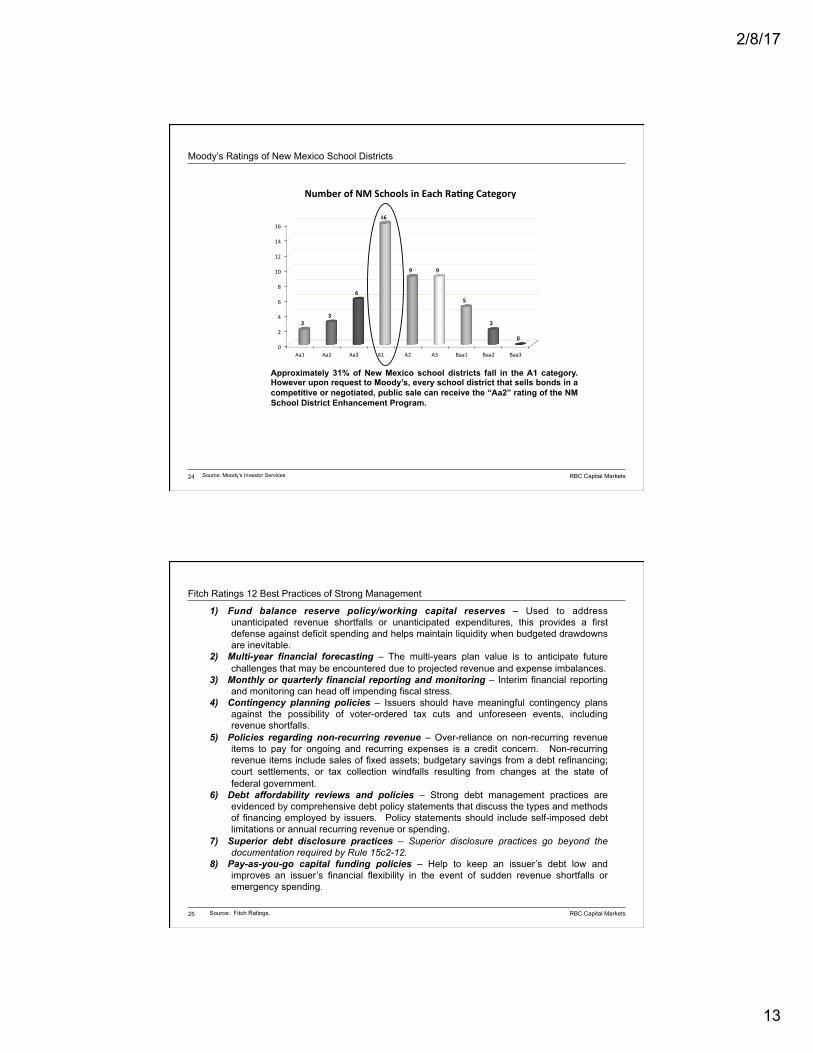
Moody’s Ratings of New Mexico School Districts
Approximately 31% of New Mexico school districts fall in the A1 category. However upon request to Moody’s, every school district that sells bonds in a competitive or negotiated, public sale can receive the “Aa2” rating of the NM School District Enhancement Program.
0
2
4
6
8
10
12
14
16
Aa1 Aa2 Aa3 A1 A2 A3 Baa1 Baa2 Baa3
23
6
16
9 9
5
2
0
NumberofNMSchoolsinEachRa<ngCategory
Source: Moody’s Investor Services
RBC Capital Markets 25
Fitch Ratings 12 Best Practices of Strong Management
1) Fund balance reserve policy/working capital reserves – Used to address unanticipated revenue shortfalls or unanticipated expenditures, this provides a first defense against deficit spending and helps maintain liquidity when budgeted drawdowns are inevitable.
2) Multi-year financial forecasting – The multi-years plan value is to anticipate future challenges that may be encountered due to projected revenue and expense imbalances.
3) Monthly or quarterly financial reporting and monitoring – Interim financial reporting and monitoring can head off impending fiscal stress.
4) Contingency planning policies – Issuers should have meaningful contingency plans against the possibility of voter-ordered tax cuts and unforeseen events, including revenue shortfalls.
5) Policies regarding non-recurring revenue – Over-reliance on non-recurring revenue items to pay for ongoing and recurring expenses is a credit concern. Non-recurring revenue items include sales of fixed assets; budgetary savings from a debt refinancing; court settlements, or tax collection windfalls resulting from changes at the state of federal government.
6) Debt affordability reviews and policies – Strong debt management practices are evidenced by comprehensive debt policy statements that discuss the types and methods of financing employed by issuers. Policy statements should include self-imposed debt limitations or annual recurring revenue or spending.
7) Superior debt disclosure practices – Superior disclosure practices go beyond the documentation required by Rule 15c2-12.
8) Pay-as-you-go capital funding policies – Help to keep an issuer’s debt low and improves an issuer’s financial flexibility in the event of sudden revenue shortfalls or emergency spending.
Source: Fitch Ratings.

2/8/17
14
RBC Capital Markets 26
Fitch Ratings 12 Best Practices of Strong Management – Cont.
9) Rapid debt retirement policies or more than 65% in 10 years – Life of the debt should not exceed the useful life of the asset or project being financed. Results from rapid debt retirement include declining debt service schedules which provide additional financial flexibility and debt capacity in future years.
10) Five-year capital improvement plan integrating operating costs – Integrating future operating costs from capital construction assumes that the issuer is also doing multi-year forecasting of its operating fund. Implementing both of these practices contributes to more favorable rating consideration.
11) Financial reporting award (GFOA, ASBO) – The achievement of these awards gives investors and credit analysts increased confidence that information disclosed in the issuer’s financial reports and budgets is comprehensive and accurate.
12) Budgeting award (GFOA, ASBO) – Same as above.
Best Practice Value* Best Practice Value*Fund balance reserve policy/working capital reserves Very Significant Superior debt disclosure practices Very SignificantMultiyear financial forecasting Significant Pay-as-you-go capital funding policies SignificantMonthly or quarterly financial reporting & monitoring Significant Rapid det retirement policies SignificantContingency planning policies Influential Five year capital improvement plan w/ operating costs InfluentialPolicies regarding nonrecurring revenue Influential Financial reporting awards InfluentialDebt affordability reviews & policies Very Significant Budgeting awards Influential
* Values in descending order of importance are: very significant, significant and influential.
Relative Values of Best Practices in Fitch's Public Finance Ratings
Source: Fitch Ratings.
RBC Capital Markets 27
Moody’s Six Critical Components of Strong Management
1. Conservative budgeting techniques – A careful, organizational approach to budgeting that ideally involves conservative fiscal policies and multi-year modeling.
2. Fund balance policies – Adoption of a clearly delineated fiscal plan which includes a fund balance target level and the instances in which reserves may be used.
3. Debt planning – A formalized debt plan that includes target and maximum debt levels, targets for pay-as-you-go funding of capital work, and incorporation of these debt policies into a multi-year capital plan.
4. Succession and contingency planning – A formalized succession/contingency plan which typically includes written documentation of organizational structures, succession plans should key personnel change, and specific scenarios to respond to likely changes that might affect credit.
5. Strategic planning for economic development – Feasible economic development plans that suit the particular strengths and needs of the community, with clear guidelines that detail allowable incentives.
6. Timely disclosure – Timely audited financial documents that are attested to by an outside firm, and the direct disclosure of any material events as soon as possible.
Source: Moody’s Investors Services

2/8/17
15
Municipal Market Update
RBC Capital Markets 29
Municipal Market Fund Flows Municipal bond funds see inflows
According to data from Lipper, for the week ended February 1st, 2017, weekly municipal bond funds reported $14 million of inflows, up from the previous week’s $7 million of inflows
§ Long-term muni bond funds also experienced inflows, gaining $17 million in the latest week, after inflows of $240 million in the previous week § Four week moving average is currently positive at $377 million, up from last week’s number of $145 million
Period ended February 1, 2017 Source:Lipper
Lipper Municipal Fund Flows
($5,000)
($4,000)
($3,000)
($2,000)
($1,000)
$0
$1,000
$2,000
12/28 1/4 1/11 1/18 1/25 2/1($5,000)
($4,000)
($3,000)
($2,000)
($1,000)
$0
$1,000
$2,000
Dec-10 May-11 Oct-11 Mar-12 Aug-12 Jan-13 Jun-13 Nov-13 Apr-14 Sep-14 Feb-15 Jul-15 Dec-15 Jun-16 Nov-16
Fund
Flo
w (
$ m
illio
ns)
Flow Change
4-Wk Moving Avg
2/8/17
16
RBC Capital Markets 30
1.000%
2.000%
3.000%
4.000%
5.000%
6.000%
Jan-07 Jan-08 Jan-09 Jan-10 Jan-11 Jan-12 Jan-13 Jan-14 Jan-15 Jan-16 Jan-17
10 Yr 20 Yr 30 Yr
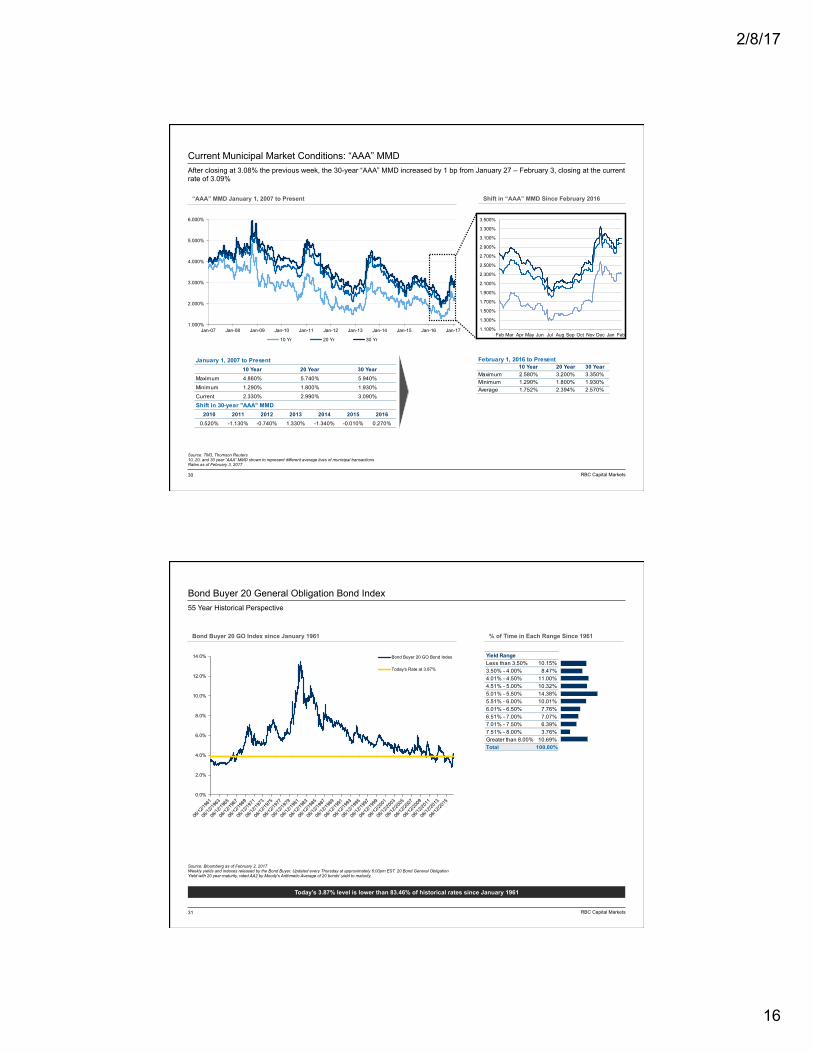
Current Municipal Market Conditions: “AAA” MMD After closing at 3.08% the previous week, the 30-year “AAA” MMD increased by 1 bp from January 27 – February 3, closing at the current rate of 3.09%
“AAA” MMD January 1, 2007 to Present Shift in “AAA” MMD Since February 2016
Source: TM3, Thomson Reuters 10, 20, and 30 year “AAA” MMD shown to represent different average lives of municipal transactions Rates as of February 3, 2017
1.100%
1.300%
1.500%
1.700%
1.900%
2.100%
2.300%
2.500%
2.700%
2.900%
3.100%
3.300%
3.500%
Feb Mar Apr May Jun Jul Aug Sep Oct Nov Dec Jan Feb
February 1, 2016 to Present10 Year 20 Year 30 Year
Maximum 2.580% 3.200% 3.350%Minimum 1.290% 1.800% 1.930%Average 1.752% 2.394% 2.570%
January 1, 2007 to Present
Maximum
Minimum
Current
Shift in 30-year "AAA" MMD2010 2011 2012 2013 2014 2015 20160.520% -1.130% -0.740% 1.330% -1.340% -0.010% 0.270%
30 Year5.940%
1.930%
3.090%
10 Year4.860%
1.290%
2.330%
20 Year5.740%
1.800%
2.990%
RBC Capital Markets 31
0.0%
2.0%
4.0%
6.0%
8.0%
10.0%
12.0%
14.0% Bond Buyer 20 GO Bond Index
Today's Rate at 3.87%
Bond Buyer 20 General Obligation Bond Index 55 Year Historical Perspective
Today’s 3.87% level is lower than 83.46% of historical rates since January 1961
Source: Bloomberg as of February 2, 2017 Weekly yields and indexes released by the Bond Buyer. Updated every Thursday at approximately 6:00pm EST. 20 Bond General Obligation Yield with 20 year maturity, rated AA2 by Moody's Arithmetic Average of 20 bonds' yield to maturity.
Bond Buyer 20 GO Index since January 1961 % of Time in Each Range Since 1961
Yield RangeLess than 3.50% 10.15%3.50% - 4.00% 8.47%4.01% - 4.50% 11.00%4.51% - 5.00% 10.32%5.01% - 5.50% 14.38%5.51% - 6.00% 10.01%6.01% - 6.50% 7.76%6.51% - 7.00% 7.07%7.01% - 7.50% 6.39%7.51% - 8.00% 3.76%Greater than 8.00% 10.69%Total 100.00%

2/8/17
17
RBC Capital Markets 32
2.5%
4.5%
6.5%
8.5%
10.5%
12.5%
14.5%
16.5% Bond Buyer Revenue Bond Index
Today's Rate at 4.02%
Bond Buyer Revenue Bond Index 37 Year Historical Perspective
Today’s 4.02% level is lower than 96.97% of historical rates since September 1979
Source: Bloomberg as of February 2, 2017 Weekly yields and indexes released by the Bond Buyer. Updated every Thursday at approximately 6:00pm EST. 25 Revenue Bond Yield with 30 year maturity, rated A1 by Moody's and A+ by S&P Arithmetic Average of 25 bonds' yield to maturity.
Bond Buyer Revenue Index since September 1979 % of Time in Each Range Since 1979
Yield RangeLess than 3.50% 1.13%3.50% - 4.00% 1.90%4.01% - 4.50% 5.79%4.51% - 5.00% 12.97%5.01% - 5.50% 20.92%5.51% - 6.00% 12.82%6.01% - 6.50% 8.67%6.51% - 7.00% 3.64%7.01% - 7.50% 6.41%7.51% - 8.00% 5.13%Greater than 8.00% 20.62%Total 100.00%
RBC Capital Markets 33
Questions??
2/8/17
18
RBC Capital Markets 34
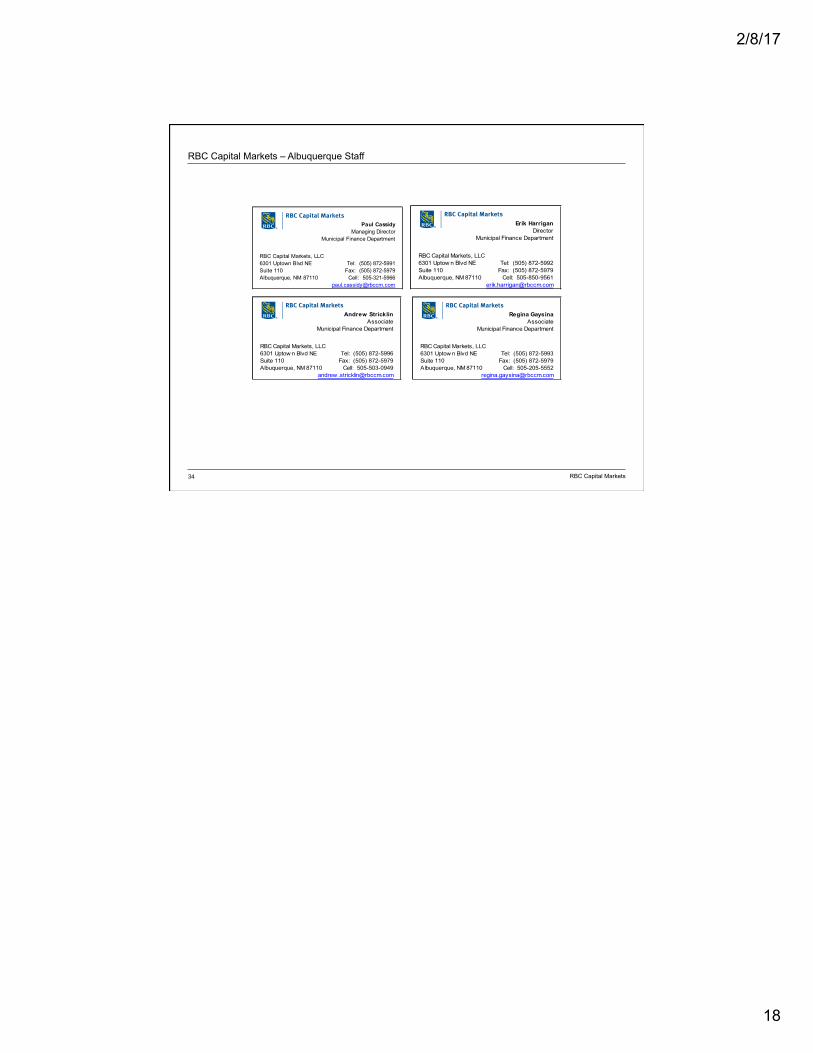
RBC Capital Markets – Albuquerque Staff
Erik HarriganDirector
Municipal Finance Department
RBC Capital Markets, LLC6301 Uptow n Blvd NE Tel: (505) 872-5992Suite 110 Fax: (505) 872-5979Albuquerque, NM 87110 Cell: 505-850-9561
Paul CassidyManaging Director
Municipal Finance Department
RBC Capital Markets, LLC6301 Uptown Blvd NE Tel: (505) 872-5991Suite 110 Fax: (505) 872-5979Albuquerque, NM 87110 Cell: 505-321-5966
Regina GaysinaAssociate
Municipal Finance Department
RBC Capital Markets, LLC6301 Uptow n Blvd NE Tel: (505) 872-5993Suite 110 Fax: (505) 872-5979Albuquerque, NM 87110 Cell: 505-205-5552
Andrew StricklinAssociate
Municipal Finance Department
RBC Capital Markets, LLC6301 Uptow n Blvd NE Tel: (505) 872-5996Suite 110 Fax: (505) 872-5979Albuquerque, NM 87110 Cell: 505-503-0949
andrew [email protected]