w m Doppler Reflectometry Simulations e d t r a for...
27
C. Lechte et al., Doppler Reflectometry Simulations, TMIAEA2015 Nice 1 Institute of Interfacial Process Engineering and Plasma Technology www.igvp.uni-stuttgart.de/mw Doppler Reflectometry Simulations for ASDEX Upgrade C. Lechte Institute of Interfacial Process Engineering and Plasma Technology IGVP University of Stuttgart Pfaffenwaldring 31, 70569 Stuttgart | Germany Phone +49 711 685 – 62306 | Fax +49 711 685 – 63102 G. D. Conway, T. Görler, C. Tröster, and the ASDEX Upgrade Team Max-Planck-Institut für Plasmaphysik Boltzmannstr. 2, 85748 Garching | Germany
Transcript of w m Doppler Reflectometry Simulations e d t r a for...

C. Lechte et al., Doppler Reflectometry Simulations, TMIAEA2015 Nice 1
Institute of Interfacial Process Engineering and Plasma Technologyw
ww
.igvp
.un
i-st
utt
gar
t.d
e/m
w Doppler Reflectometry Simulations for ASDEX Upgrade
C. Lechte
Institute of Interfacial Process Engineering and Plasma Technology IGVPUniversity of StuttgartPfaffenwaldring 31, 70569 Stuttgart | GermanyPhone +49 711 685 – 62306 | Fax +49 711 685 – 63102
G. D. Conway, T. Görler, C. Tröster, and the ASDEX Upgrade Team
Max-Planck-Institut für PlasmaphysikBoltzmannstr. 2, 85748 Garching | Germany

C. Lechte et al., Doppler Reflectometry Simulations, TMIAEA2015 Nice 2
Institute of Interfacial Process Engineering and Plasma Technologyw
ww
.igvp
.un
i-st
utt
gar
t.d
e/m
w
Outline
Doppler reflectometry
Role of simulations
Simulation of plasma turbulence
Simulation of Doppler scattering
Properties of the turbulence
Simulation results for the perpendicular wavenumber spectrum
position of the 'knee'
roll-off at large k (spectral index)
Conclusions

C. Lechte et al., Doppler Reflectometry Simulations, TMIAEA2015 Nice 3
Institute of Interfacial Process Engineering and Plasma Technologyw
ww
.igvp
.un
i-st
utt
gar
t.d
e/m
w
Doppler Reflectometry as a Turbulence Diagnostic
Millimeter waves reflected at cutoff
Backscattering on fluctuations, wavenumber resolved Pol. velocity from Doppler shift: ω
D ≈ -2 k
in v
perp sin(θ)
Scattering condition: kfluct
= -2 Nkin = -2 k
in sin(θ)
already widely used on fusion experiments robust diagnostic for poloidal rotation for fluctuations + transport + correlations, large interest
in simulations
Scan θ, kin S
fluct(k)
Simulate ñe(k) S
fluct(k)
[C. Tröster, PhD Thesis 2008]
vpol
from shift
of fitted peak
Sfluct
from area
of fitted peak

C. Lechte et al., Doppler Reflectometry Simulations, TMIAEA2015 Nice 4
Institute of Interfacial Process Engineering and Plasma Technologyw
ww
.igvp
.un
i-st
utt
gar
t.d
e/m
w
Overall Goal for Doppler Reflectometry Simulations
Experiment
Plasma turbulenceS(k) spectrum
Doppler wavescattering F(S(k))
Received Dopplerspectrum (exp.)
Simulation
Turbulence code(s)S(k) spectrum
Reflectometry codeF(S(k))
Received Doppler spectrum (sim.)
Information known?
✓
✓
✓✓
Comparison at level of received signal: Synthetic Diagnostic
Explore characteristics of exp. diagnostics F(·)
Validate turbulence codes

C. Lechte et al., Doppler Reflectometry Simulations, TMIAEA2015 Nice 5
Institute of Interfacial Process Engineering and Plasma Technologyw
ww
.igvp
.un
i-st
utt
gar
t.d
e/m
w
Plasma Turbulence Simulations: The Gyrokinetic Code GENE
GENE is a physically comprehensive Vlasov code [F. Jenko et al., PoP 2000, gene.rzg.mpg.de]
3D in space and 2D in velocity space = 5D
allows for kinetic electrons and electromagnetic fluctuations, collisions, and external EB shear flows
coupled to various MHD codes and transport code TRINITY
supports local (flux tube) and global (full torus), gradient and flux driven simulations
uses magnetic equilibrium and profiles from ASDEX Upgrade 2008 campaign
adapted Ti profile to match heat flux
restrict to flux tube due to computational costs

C. Lechte et al., Doppler Reflectometry Simulations, TMIAEA2015 Nice 6
Institute of Interfacial Process Engineering and Plasma Technologyw
ww
.igvp
.un
i-st
utt
gar
t.d
e/m
w
The Fullwave Code IPF-FD3D Finite difference time domain code
Maxwell equations and plasma currents(cold plasma)
numeric TX and RX antennas, Gaussian beams, all frequencies (= probed wave numbers) in same run
plasma dynamics
fmicrowave
>>> fturbulence
: “frozen” turbulence
run simulations at time points determined by turbulence time scale
assemble complex, time dependent RXsignal from ~1000 runs
IF turbulence has rotation speed: recoverDoppler spectrum
ELSE: std deviation as measure of fluctuation level [E. Blanco, priv. disc.]
AUG lower outer quadrant

C. Lechte et al., Doppler Reflectometry Simulations, TMIAEA2015 Nice 7
Institute of Interfacial Process Engineering and Plasma Technologyw
ww
.igvp
.un
i-st
utt
gar
t.d
e/m
w
The Finite Difference Time Domain Method for Plasma Waves
Spatial and time derivatives as centered differences, leapfrogging of E, H
Incorporation of J straightforward if no external B0 field
Conditionally stable for small enough dt, second order accuracy
J colocated with Esame time grid as H
En+1 En = dt * Ėn+1/2 Ex += dt * { Hz(y-dy/2, z) – Hz(y+dy/2, z) }/dy + Jx(y, z) n n+1/2 n+1/2 n+1/2
Ex
Hy
Hz
Hy
Hz Ex
Hy
Hy
dxz Hy
y Hz
y
z
dx = c dt
electron eq. of motion

C. Lechte et al., Doppler Reflectometry Simulations, TMIAEA2015 Nice 8
Institute of Interfacial Process Engineering and Plasma Technologyw
ww
.igvp
.un
i-st
utt
gar
t.d
e/m
w
Magnetised Plasma: X Mode
New type of DE, dJ/dt ~ J: need J from 1/2dt in future
Jx Jy, Jz: not obvious where to locate J components
3 ways of dealing with time dependence:
Runge-Kutta method to advance J by 1 time step (expensive)
substitute “future” J components with finite difference expressions, solve algebraically for new components ("Crank-Nicolson”)
ignore it: works surprisingly well, but wave fronts are slightly distorted (symplectic)
J location: common grid for all J components or colocation with E components?
n, n+1 n+1/2

C. Lechte et al., Doppler Reflectometry Simulations, TMIAEA2015 Nice 9
Institute of Interfacial Process Engineering and Plasma Technologyw
ww
.igvp
.un
i-st
utt
gar
t.d
e/m
w
Numerical Dispersion in X Mode
Homogenous plasma with cutoff at 141.2 GHz
Needs sophisticated simultaneous J solver (CN)
And correct location or interpolation of J
relatively low resolution is sufficient (ppc=32)
No method is really bad
along major axes along diagonals

C. Lechte et al., Doppler Reflectometry Simulations, TMIAEA2015 Nice 10
Institute of Interfacial Process Engineering and Plasma Technologyw
ww
.igvp
.un
i-st
utt
gar
t.d
e/m
w
Numerical Dispersion in X Mode
Homogenous plasma with cutoff at 141.2 GHz
Needs sophisticated simultaneous J solver (CN)
And correct location or interpolation of J
relatively low resolution is sufficient (ppc=32)
No method is really bad
Full spatial interpolation[L. Xu, N. Yuan, IEEE Ant. W. Prop. Lett., 2006]
Same special grid for all J
along major axes along diagonals

C. Lechte et al., Doppler Reflectometry Simulations, TMIAEA2015 Nice 11
Institute of Interfacial Process Engineering and Plasma Technologyw
ww
.igvp
.un
i-st
utt
gar
t.d
e/m
w
Scaling of Scattered Power with Density Fluctuation Strength
Coherent density fluctuations for the probed wavenumber
Received power scales linearly with density 'power' over several orders of magnitude
Eventually, non-linear saturation appears

C. Lechte et al., Doppler Reflectometry Simulations, TMIAEA2015 Nice 12
Institute of Interfacial Process Engineering and Plasma Technologyw
ww
.igvp
.un
i-st
utt
gar
t.d
e/m
w
The Typical Turbulence Spectrum: Knee And Power Law
ASDEX Upgrade shot 22009ff
Use same setup in fullwave simulations
L mode
k-4 GENE spectrum features similar
characteristics:
spectral index very close
knee position off by significant amount
[C. Tröster, PhD Thesis 2008]
knee at k where turbulent drive is occurring
nature of turbulent cascade determines slope

C. Lechte et al., Doppler Reflectometry Simulations, TMIAEA2015 Nice 13
Institute of Interfacial Process Engineering and Plasma Technologyw
ww
.igvp
.un
i-st
utt
gar
t.d
e/m
w
GENE Turbulence: Transformation to Laboratory Frame
export from field aligned coordinate system to R-z frame
< without poloidal rotation
with poloidal rotation >
possibility to capture Doppler shift in fullwave simulation

C. Lechte et al., Doppler Reflectometry Simulations, TMIAEA2015 Nice 14
Institute of Interfacial Process Engineering and Plasma Technologyw
ww
.igvp
.un
i-st
utt
gar
t.d
e/m
w
Recovery of Doppler Spectrum From Turbulence
GOAL: same signal as in experiment, i. e. Doppler spectrum, fit peaks
Same GENE run, but transform to lab frame including background EB flow First result promising
Prominent Doppler peak with clear shift But too large time step between turbulence snapshots
Clash between good statistics (dt >> turb ,Lturb/v) and good time resolution (dt << Lturb/v)
Experimental Doppler Spectrum:prominent carrier
[C. Tröster, PhD Thesis 2008]

C. Lechte et al., Doppler Reflectometry Simulations, TMIAEA2015 Nice 15
Institute of Interfacial Process Engineering and Plasma Technologyw
ww
.igvp
.un
i-st
utt
gar
t.d
e/m
w
Recovery of Doppler Spectrum From Turbulence
GOAL: same signal as in experiment, i. e. Doppler spectrum, fit peaks
Same GENE run, but transform to lab frame including background EB flow First result promising
Prominent Doppler peak with clear shift But too large time step between turbulence snapshots
Clash between good statistics (dt >> turb ,Lturb/v) and good time resolution (dt << Lturb/v)
Experimental Doppler Spectrum:prominent carrier
[C. Tröster, PhD Thesis 2008]
For now, treat turbulence snapshots as independent and use variance of signal as measure of fluctuation strength

C. Lechte et al., Doppler Reflectometry Simulations, TMIAEA2015 Nice 16
Institute of Interfacial Process Engineering and Plasma Technologyw
ww
.igvp
.un
i-st
utt
gar
t.d
e/m
w
Presence of ExB Shear in Turbulence Data
ExB shearing is applied discontinuously in GENE for flux-tube simulations
Visible 'jumps' in turbulence movie
Is this a problem for reconstruction of Doppler spectrum?
looks OK
too early to call
similar phenomenon as GAMs
Implications:
ExB shearing is present in reality
If switched off, input parameters have to be tweaked to get same transport
Doppler/k spectrum will be slightly different
1000
100
10
1-1 -0.5 0 0.5 1
Doppler shift (MHz)

C. Lechte et al., Doppler Reflectometry Simulations, TMIAEA2015 Nice 17
Institute of Interfacial Process Engineering and Plasma Technologyw
ww
.igvp
.un
i-st
utt
gar
t.d
e/m
w
knee to higher k in saturation
Wavenumber Spectrum from Simulated Doppler Reflectometer
Radial position 0.86, X mode
Turbulence amplitude scan to judge linear-ness of scattering process
Interesting phenomenon: knee position moves with fluctuation strength
Explained by non-linear saturation ofreflected power
spectrum 'squished'against maximum
spectral index too high
GENE knee
Experiment knee

C. Lechte et al., Doppler Reflectometry Simulations, TMIAEA2015 Nice 18
Institute of Interfacial Process Engineering and Plasma Technologyw
ww
.igvp
.un
i-st
utt
gar
t.d
e/m
w
Wavenumber Spectrum from Simulated Doppler Reflectometer
Radial position 0.86, X mode
Turbulence amplitude scan to judge linear-ness of scattering process
Interesting phenomenon: knee position moves with fluctuation strength
Explained by non-linear saturation ofreflected power
spectrum 'squished'against maximum
spectral index too high
knee to higher k in saturationGENE knee
Experiment knee
factor 10000

C. Lechte et al., Doppler Reflectometry Simulations, TMIAEA2015 Nice 19
Institute of Interfacial Process Engineering and Plasma Technologyw
ww
.igvp
.un
i-st
utt
gar
t.d
e/m
w
Impact of Using Different Solvers
Reference: colocated currents
Compare to: interpolation of J components to different grids
Result: very different spectral indices
Not clear how the impact can be so large when dispersion relation quite similar
Very surprising, working with ERCC members (E. Blanco) to investigate further

C. Lechte et al., Doppler Reflectometry Simulations, TMIAEA2015 Nice 20
Institute of Interfacial Process Engineering and Plasma Technologyw
ww
.igvp
.un
i-st
utt
gar
t.d
e/m
w
Impact of Using Different Solvers
Reference: colocated currents
Compare to: interpolation of J components to different grids
Result: very different spectral indices
Not clear how the impact can be so large when dispersion relation quite similar
Very surprising, working with ERCC members (E. Blanco) to investigate further
factor 10000
C. Lechte et al., Doppler Reflectometry Simulations, TMIAEA2015 Nice 21
Institute of Interfacial Process Engineering and Plasma Technologyw
ww
.igvp
.un
i-st
utt
gar
t.d
e/m
w
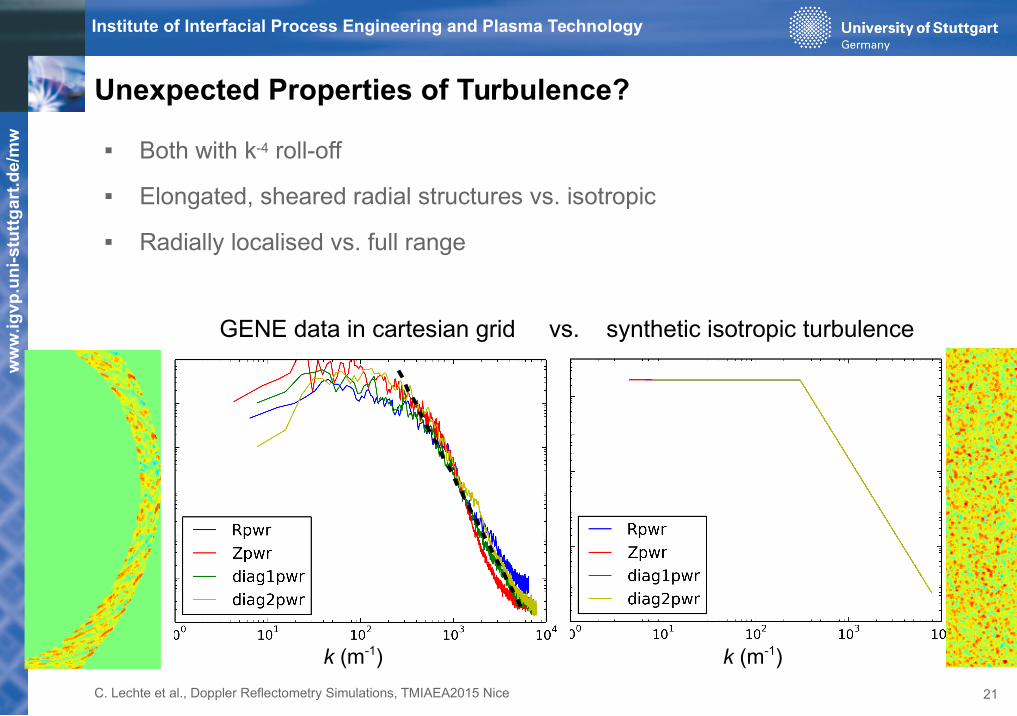
Unexpected Properties of Turbulence?
Both with k-4 roll-off
Elongated, sheared radial structures vs. isotropic
Radially localised vs. full range
GENE data in cartesian grid vs. synthetic isotropic turbulence
k (m-1) k (m-1)

C. Lechte et al., Doppler Reflectometry Simulations, TMIAEA2015 Nice 22
Institute of Interfacial Process Engineering and Plasma Technologyw
ww
.igvp
.un
i-st
utt
gar
t.d
e/m
w
GENE and Synthetic Turbulence
Some difference
However, not certain that absolute fluctuation levels really equal
Synthetic fluctuation level may be too small
Needs full amplitude scan

C. Lechte et al., Doppler Reflectometry Simulations, TMIAEA2015 Nice 23
Institute of Interfacial Process Engineering and Plasma Technologyw
ww
.igvp
.un
i-st
utt
gar
t.d
e/m
w
k (m-1)
Effect of Limited Radial Extent of Turbulence
Using isotropic synthetic turbulence and O mode
Gaussian envelope around =0.86
Spectral shape stays the same
More scattering volume means just overall increase
Only a problem for extremely small widths
0.02 0.06

C. Lechte et al., Doppler Reflectometry Simulations, TMIAEA2015 Nice 24
Institute of Interfacial Process Engineering and Plasma Technologyw
ww
.igvp
.un
i-st
utt
gar
t.d
e/m
w
O Mode Doppler Reflectometry: First Results
seems to be 'less non-linear', i.e. potentially easier to analyse
knee closer to real position
spectral index very high
From TORE SUPRAand ASDEX Upgrademeasurements,larger (>7) spectral indexexpected

C. Lechte et al., Doppler Reflectometry Simulations, TMIAEA2015 Nice 25
Institute of Interfacial Process Engineering and Plasma Technologyw
ww
.igvp
.un
i-st
utt
gar
t.d
e/m
w
Conclusions
Synthetic Doppler reflectometry for turbulence diagnostics on ASDEX Upgrade
Coupling of turbulence code GENE with fullwave code IPF-FD3D
Results
wavenumber spectrum recovered in simulations, but spectral index much steeper
knee position (turbulent drive) shifted to higher k
Explained: non-linear effects of strong fluctuations affect spectral characteristics
Big differences in X mode solvers
O mode seems to be less far in the non-linear regime
Properties of plasma turbulence vs. synthetic isotropic turbulence
Outlook
Investigation of scattering process in different solvers
Further co-moving / lab frame analysis
Application to more recent data
Acknowledgements: bwUniCluster (Ministry of Science, Research and Arts and the Universities of the State of Baden-Württemberg) and HERMIT and HELIOS supercomputers

C. Lechte et al., Doppler Reflectometry Simulations, TMIAEA2015 Nice 26
Institute of Interfacial Process Engineering and Plasma Technologyw
ww
.igvp
.un
i-st
utt
gar
t.d
e/m
w
Ex grid points
Sources for Gaussian Beams in 2D
add E or H component to grid line
phase and amplitude according to desired wave pattern including tilt and curved phase front (focussing or diverging beam)
higher order Hermite modes
many frequencies simultaneously (ref. freq. 100 GHz, all multiples of 100 MHz need 100 GHz/100 MHz = 1000 cycles to separate at receiver) still 25 fold speed increase
radiates in both directions, need to subtract backpropagating wave from receiver signal

C. Lechte et al., Doppler Reflectometry Simulations, TMIAEA2015 Nice 27
Institute of Interfacial Process Engineering and Plasma Technologyw
ww
.igvp
.un
i-st
utt
gar
t.d
e/m
w
Why Is The Spectral Index So Large?
Not a problem of resolution
32 vs. 48 sampling points per wave period (~4 times CPU)