Vulnerability of Transport systems · kaite (NEA), Anestis Papanikolaou, Vangelis Mitsakis (CERTH)...
120
WEATHER Weather Extremes: Assessment of Impacts on Trans- port Systems and Hazards for European Regions Deliverable 2 Vulnerability of Transport systems Main report Status: Public Version: 2.0 (revised final) Date: 14.6.2011 Authors: Riccardo Enei (ISIS), Claus Doll, Stefan Klug, Ina Partzsch (Fraunhofer), Norbert Sedlacek (Herry Consult GmbH), Nina Nesterova, Jan Kiel, Loreta Rudzi- kaite (NEA), Anestis Papanikolaou, Vangelis Mitsakis (CERTH) Study funded under the 7 th Framework Program of the European Commission
Transcript of Vulnerability of Transport systems · kaite (NEA), Anestis Papanikolaou, Vangelis Mitsakis (CERTH)...

WEATHER
Weather Extremes: Assessment of Impacts on Trans-port Systems and Hazards for European Regions
Deliverable 2
Vulnerability of Transport systems
Main report
Status: Public
Version: 2.0 (revised final)
Date: 14.6.2011
Authors: Riccardo Enei (ISIS), Claus Doll, Stefan Klug, Ina Partzsch (Fraunhofer), Norbert Sedlacek (Herry Consult GmbH), Nina Nesterova, Jan Kiel, Loreta Rudzi-kaite (NEA), Anestis Papanikolaou, Vangelis Mitsakis (CERTH)
Study funded under the 7th Framework Program
of the European Commission
WEATHER D2: Vulnerability of Transport Systems
2
Document details
This document should be cited as:
Enei, R., C. Doll, S. Klug, I. Partzsch, N. Sedlacek, J. Kiel, N. Nesterova, L. Rudzikaite, A. Papaniko-laou, V. Mitsakis (2011):, ― Vulnerability of transport systems- Main report‖ Transport Sector Vulnerabili-ties within the research project WEATHER (Weather Extremes: Impacts on Transport Systems and Hazards for European Regions) funded under the 7
th framework program of the European Commission.
Project co-ordinator: Fraunhofer-ISI. Karlsruhe, 30.9.2010.
Document title: Deliverable 2: Vulnerability of transport systems. Main report
Lead author: R. Enei (ISIS), C. Doll (Fraunhofer), N. Sedlacek (HERRY), J. Kiel, N. Nesterova, Loreta Rudzikaite (NEA)
Contributions: G.Giuffre (ISIS), Valentina Pavan (ARPA-EM)
Version: 2.0 (revised final)
Date: 14.6.2011
Status: Public
Quality review:
Accepted:
The WETHER project:
Full title: WEATHER – Weather Extremes: Impacts on Transport Systems and Hazards for European Regions.
Duration: November 1st 2009 to April 30
th 2012
Funding: Call 2008-TPT-1, 7th
framework program of the European Commission, Directorate General for Research and Technical Development
Contract.: Grant Agreement no. 233 783
Consortium: Fraunhofer-Institute for Systems and Innovation Research (ISI), Karlsruhe – project co-ordinator Fraunhofer-Institute for Transportation and Infrastructure Systems (IVI), Dresden , Centre for Research and Technology Hellas (CERTH), Helenic Institute for Transport (HIT), Thessaloniki Société de Mathématiques Appliquées et de Sciences Humaines - International re-search Center on Environment and Development (SMASH-CIRED), Paris Karlsruhe Institute for Technology (KIT), Institute for Industrial Production (IIP), Karlsru Institute of Studies for the Integration of Systems (ISIS), Rome HERRY Consult GmbH, Vienna Agenzia Regionale Prevenzione e Ambiente dell'Emilia Romagna (ARPA-ER), Servizio Idro-Meteo-Clima (SIMC), Bologna NEA Transport Research and Training, Zoetermeer
Internet: www.weather-project.eu
Contact: Dr. Claus Doll Fraunhofer-Institute for Systems and Innovation Research (ISI), Breslauer Str. 48, 76139 Karlsruhe, Germany, T: +49 721 6809-354, E: [email protected]

WEATHER D2: Vulnerability of Transport Systems
3
TABLE OF CONTENTS
EXECUTIVE SUMMARY.............................................................................................. ix
1 Introduction ........................................................................................................ 16
1.1 Introduction to the WEATHER project ................................................ 16
1.2 Project objectives and work plan ........................................................ 16
1.3 The Objective of Deliverable 2 ........................................................... 17
1.4 Structure of Deliverable 2 ................................................................... 18
PART A: GENERAL TOPICS ..................................................................................... 19
2 The General Assessment Framework ............................................................... 19
2.1 The concept of systemic risks ............................................................ 19
2.2 Dimensions of the assessment framework ......................................... 21
2.2.1 Time horizon ...................................................................................... 21
2.2.2 Transport modes ................................................................................ 21
2.2.3 Categories of extreme weather considered ........................................ 21
2.3 Assessment principles ........................................................................ 22
2.3.1 Recording damages ........................................................................... 23
2.3.2 Assessing economic impacts ............................................................. 23
3 Climate and Weather Scenarios for Europe ..................................................... 25
3.1 Projected main Climate Changes ....................................................... 25
3.2 Extreme weather events and natural disasters ................................... 27
3.3 Climate Change impacts on extreme events ...................................... 28
3.3.1 Precipitation extremes ........................................................................ 29
3.3.2 Land Slides ........................................................................................ 30
3.3.3 Avalanches ........................................................................................ 31
3.3.4 Storm ................................................................................................. 31
3.3.5 Snow .................................................................................................. 32
3.3.6 Maritime ice cover .............................................................................. 34

WEATHER D2: Vulnerability of Transport Systems
4
3.3.7 Summer temperature extremes .......................................................... 34
3.3.8 Droughts ............................................................................................ 35
3.3.9 Wild Fires ........................................................................................... 36
4 Criticality Assessment ....................................................................................... 37
4.1 Setting the scene ............................................................................... 37
4.2 Literature review ................................................................................. 38
4.3 Criticality of transport networks........................................................... 38
4.3.1 The distinction between Transport network criticality and
vulnerability ........................................................................................ 38
4.3.2 Methodological approach for assessing the criticality of
transport networks .............................................................................. 39
4.3.3 Criticality assessment for different transport networks ........................ 39
4.3.4 Mode-internal criticality assessment ................................................... 40
4.3.5 Brief description of criticality assessment methodology for
road networks ..................................................................................... 40
4.4 Application of the criticality assessment method ................................. 41
4.4.1 Critical assessment of the road networks of Greece,
Germany and Netherlands ................................................................. 42
4.4.2 Results and conclusions ..................................................................... 42
4.5 Application of the method for simulating scenarios of road
failures in the three networks and assessing the impacts ................... 47
5 Workshop 1: Transport System Vulnerability .................................................. 49
5.1 The Insurance Sector ......................................................................... 49
5.2 Road and urban public transport ........................................................ 49
5.3 Rail and intermodal freight transport ................................................... 50
5.4 Air transport........................................................................................ 52
5.5 Inland navigation and maritime shipping ............................................. 53
PART B: MODAL ASSESSMENTS ............................................................................ 54
6 Road infrastructure and operators .................................................................... 54
WEATHER D2: Vulnerability of Transport Systems
5
6.1 Evidence from literature ..................................................................... 54
6.2 The incident cost database ................................................................. 57
6.3 The hybrid model for cost generalisation ............................................ 59
6.4 Total costs for Europe 2010 ............................................................... 60
7 Rail infrastructure and operators ...................................................................... 62
7.1 Evidence from literature ..................................................................... 62
7.2 Cost estimation methodology ............................................................ 64
7.3 Results and conclusions ..................................................................... 66
8 Urban Public Transport ...................................................................................... 68
8.1 Evidence from literature ..................................................................... 68
8.2 Cost estimation methodology ............................................................. 69
8.3 Results and generalisation ................................................................. 69
9 Airports and air services .................................................................................... 71
9.1 Evidence from literature ..................................................................... 71
9.2 Cost estimation methodology ............................................................. 73
9.3 Results and conclusions ..................................................................... 75
10 Maritime transport .............................................................................................. 77
10.1 Evidence from literature ..................................................................... 77
10.2 Cost estimation methodology ............................................................ 78
10.3 Results and conclusions ..................................................................... 81
11 Inland waterways transport ............................................................................... 83
11.1 Evidence from literature ..................................................................... 83
11.2 Cost estimation methodology ............................................................ 84
11.3 Results and conclusions ..................................................................... 85
12 Intermodal transport .......................................................................................... 88
WEATHER D2: Vulnerability of Transport Systems
6
12.1 Evidence from literature ..................................................................... 88
12.2 Cost estimation methodology ............................................................ 89
12.3 Results and conclusions ..................................................................... 91
PART C: CONCLUSIONS .......................................................................................... 93
13 Compilation of results ........................................................................................ 93
14 Conclusions and outlook ................................................................................... 98
14.1 Comparison of objectives and results ................................................. 98
14.2 Overall achievement ......................................................................... 101
14.3 Interpretation and outlook ................................................................. 101
REFERENCES .......................................................................................................... 102
Annexes:
Part A: Additional Information in General Topics
Annex 1: Climate and Extreme Weather rends in Europe
Annex 2: Criticality of transport infrastructure networks
Part B: Full Reports on Vulnerability Assessment by Transport Mode
Annex 3: Vulnerability of Road Transport
Annex 3: Vulnerability of Rail Transport
Annex 5: Vulnerability of Urban Public Transport
Annex 6: Vulnerability of Air Transport
Annex 7: Vulnerability Assessment for Maritime Shipping
Annex 7: Vulnerability Assessment for Inland Navigation
Annex 9: Vulnerability Assessment for Intermodal Transport

WEATHER D2: Vulnerability of Transport Systems
7
Index of tables
Table 1: Definition of basic terms in risk assessment .................................................. 20
Table 2: Categories of extreme weather events .......................................................... 22
Table 3: Main climate changes for Europe in 2080-2099 compared to 1980-
1999 .............................................................................................. 26
Table 4:Results for the base case scenarios (with no link closures) ............................ 48
Table 5: Overall presentation of results from different scenarios ................................. 48
Table 6: Evaluation principles for infrastructure assets ................................................ 57
Table 7: Evaluation principles for infrastructure assets ................................................ 58
Table 8: Data availability for cost generalisation .......................................................... 60
Table 9: Bandwith of costs per costs type and weather event type for
selected countries ......................................................................... 66
Table 10: Unit costs for calculation of impacts ............................................................. 67
Table 11: Preliminary extrapolation of railway damage costs to Europe ...................... 67
Table 12: Damage cost figures for urban public transport in Germany for
selected events ............................................................................. 69
Table 13: Summary of economic impact from floods and droughts on Kaub
area, mln euro ............................................................................... 87
Table 14: Summary of economic impact from droughts in Kaub area, mln
euro ............................................................................................... 87
Table 15: Qualitative assessment of climate change impacts on intermodal
transport ........................................................................................ 89
Table 16: Average maintenance costs per Loading Unit (€2010)................................. 91
Table 17: Share of climate change sensitive infrastructure items on the final
price (€2000 prices) ....................................................................... 91
Table 18: Annual costs (mil. €) by affected actor groups ............................................. 92
Table 19: Generalization of extreme weather events costs for the European
transport system (annual data in € m) ........................................... 93

WEATHER D2: Vulnerability of Transport Systems
8
Index of figures
Figure 1: Terms and concepts of systemic risk theory ................................................. 19
Figure 2: Temperature increase 2080-2099 compared to 1980-1999 ......................... 26
Figure 3: Precipitation increase 2080-2099 compared to 1980-1999 .......................... 27
Figure 4: Disasters due to natural hazards in EEA member countries, 1980–
2009 .............................................................................................. 28
Figure 5: Changes (%) in the largest one-day precipitation 2080-2099
compared to 1980-1999, A2 scenario and different
climate models .............................................................................. 30
Figure 6: Change in total number of storm peaks (gusts larger 8 Bft, in %)
2080-2099 compared to 1980-1999 .............................................. 32
Figure 7: Change of the lowest minimum temperature (in °) 2080-2099
compared to 1980-1999, according to different climate
models .......................................................................................... 33
Figure 8 Number of hot summer days ......................................................................... 35
Figure 9: Projected change in the difference of maximum dry spell length
2080-2099 compared to 1980-1999 .............................................. 36
Figure 10: Criticality assessment for the network of Greece ........................................ 44
Figure 11: Criticality assessment for the network of Germany ..................................... 45
Figure 12: Criticality assessment for the network of Netherlands ................................ 46
Figure 13: Results of the incident cost database ......................................................... 59
Figure 14: Generalised costs by sector element and weather category ....................... 61
Figure 15: Generalised costs by climate region and category of extreme .................... 61
Figure 16: Number of delay minutes attributable to ‗buckle‘ events recorded
in the ADB for London and the south-east and the
maximum temperature reached on the day of
occurrence. ................................................................................... 63
Figure 17: Airline delay reports for 12 countries on weather purposes 2007
to 2010 .......................................................................................... 73
Figure 18: Monthly distribution of weather-related air accidents over EUR29 .............. 74
Figure 19: Summary of delay groups 71-77 by month ................................................. 75
Figure 21: Comparison of total results by type of event ............................................... 95

WEATHER D2: Vulnerability of Transport Systems
ix
EXECUTIVE SUMMARY
The WEATHER project
Records of reinsurance companies clearly highlight the rising damages caused by
natural catastrophes and extreme weather events, which can at least partly be attrib-
uted to climate change. While many studies focus on CO2 mitigation in transport,
research on the vulnerability of the sector on climate driven effects, namely extreme
weather events, is coming up only recently. Little knowledge has so far been devel-
oped on the economic costs of climate and extreme weather driven damages to
transport, and even less evidence is available on the options, costs and benefits of
adaptation measures. Thus there is a need for European studies addressing local
conditions.
In front of this background the WEATHER project aims at analysing the economic
costs of more frequent and more extreme weather events on transport and on the
wider economy and explores the benefits and costs of suitable adaptation and emer-
gency management strategies for reducing them in the context of sustainable policy
design. The research is carried out by an international team of eight European insti-
tutes. The project runs for 30 months from November 2009 until April 2012. The
weather project is funded by the 7th RTD framework program of the European Com-
mission and is supervised by the Directorate General for Research.
Objective and structure of this report
Deliverable 2: ―The vulnerability of transport systems‖ is the first report published by
the WEATHER project. It describes research results on impacts of the various types
of weather extremes on the different modes of transport. Emphasis has been taken
to translate the partly very heterogeneous and fragmentary information on the im-
pacts of climate change and weather extremes on transport systems into Europe-
wide cost estimates. These figures can, and shall, only provide house numbers on
the order of magnitude of costs imposed by extreme weathers on transport systems.
The structure of this Deliverable follows the complex background works underlying
the assessment of climate change costs for the European transport system.
Firstly, in the PART A of this Deliverable, four sections have been included, introduc-
ing the general accounting framework, discussing the evidence from major climate
models on the likely development of extreme weather events, presenting results on
network criticality modelling and providing an overview of the first weather workshop
on vulnerability issues.
Then, the PART B summarizes the conclusions of the assessment of the extreme
weather events for seven transport modes. The corresponding full reports have been
WEATHER D2: Vulnerability of Transport Systems
x
included in detailed modal annexes. Finally, the PART C draws conclusions in terms
of cross-comparisons of costs assessments among transport modes.
The General Accounting Framework
For each of the four modes (road, rail, waterborne and air) we consider the following
categories of damages:
Infrastructure damages and impacts on infrastructure maintenance, wear and tear
and operations, e.g. snow removal, cleaning, small-scale repair measures, etc.
Vehicle fleet damages and impacts on the costs of service provision, e.g. addi-
tional personnel, energy costs or vehicle preparation.
User travel time costs, including time for freight movements, and perceived ser-
vice quality, e.g. reliability, crowding and temperatures in vehicles.
Traffic safety, i.e. the number of killed, severely and slightly injured transport users.
The research concentrates on singular weather events which clearly exceed the
long-term average of comparable meteorological activities over the annual mean or
related to the specific season, which have considerable negative impacts on assets
and operations, or which affect human health or lives. The following table gives an
overview of the categories of extremes considered here.
General issues
In terms of future development of extreme weather events, the annual mean tem-
peratures in Europe are likely to increase more than the global mean. Seasonally, the
largest warming is likely to be in northern Europe in winter and in the Mediterranean
area in summer. Minimum winter temperatures are likely to increase more than the
average in northern Europe. Maximum summer temperatures are likely to increase
more than the average in southern and central Europe.
The analysis of Climate Models reveals a temperature increase in Europe, with
changes to 2050 being relatively moderate compared to expected Climate Change
impacts in 2100. Since the THER project takes a shorter perspective - 2050 -, im-
pacts are expected to be considerably higher in 2100. Additionally, the statistical sig-
nificance of the changes is lower.
Annual precipitation is very likely to increase in most of northern Europe and de-
crease in most of the Mediterranean area. In central Europe, precipitation is likely to
increase in winter but decrease in summer. Extremes of daily precipitation will in-
crease in northern Europe. The annual number of precipitation days is very likely to
decrease in the Mediterranean area. Risk of summer drought is likely to increase in
central Europe and in the Mediterranean area. The duration of the snow season is
very likely to shorten, and snow depth is likely to decrease in most of Europe.

WEATHER D2: Vulnerability of Transport Systems
xi
Categories of events Explanation Relevant region and / or season
Relevant for transport segments
Te
mp
era
ture
Heat Several consecutive days exceeding 35°C with single days ex-ceeding 38°C
Northern coun-tries not accom-modated to high temperatures
Rail tracks and services Public transport Roads and raod users
Frost Several consecutive weeks remaining below -5°C daily maximum
Middle and southern Euro-pean states not accommodated
Inland navigation Roads and railways, Airports
Pre
cip
ita
tio
n
Rainfalls Strong single event or consecutive day ex-ceeding 200 mm
All Europe, par-ticularly severe in mountain areas
Roads and road users Rail tracks and services
Snow Longer period with snow level exceeding a given minimum.
Southern and middle Europe with varying thresholds
Road users Rail services Airports
Hail Hail with bigger hail-stones
Road users
Drought Several consecutive dry weeks
Southern and partly middle Europe
Inland navigation
Win
d
Storms Events with wind speeds exceeding a certain level
British Islands, middle Europe
Road users, rail services Aviation
Storm surges Wind speeds and water levels exceed-ing certain levels
North-western Europe along coast lines.
Roads and road users Rail tracks and services Ports and shipping Airports and aviation
Atm
os
-
ph
ere
Fog Longer periods with frequent sight below a certain distance
Mountain and northern coast line
Road users
Ash could Volcano ash or similar concentration the atmosphere
All Europe Aviation
Co
ns
eq
uen
ce
s
Wild fires Uncontrolled fires covering bigger areas
Southern Europe Roads and road users Rail trancks and ser-vices Aviation
Floods / flash floods
Water levels exceed-ing a given threshold
All Europe around river systems
Rail tracks and services Roads and raod users Inland navigation, Airports
Flash floods Flooding in less than 6 hours
Geomorphic low lying areas
Rail tracks and services Roads and raod users Inland navigation, Airports
Mass move-ment (dry)
Slipping ground (land slides) or avalanches
Mountain areas Rail tracks and services Roads and raod users Inland navigation, Airports
The criticality of networks was assessed for the road networks of Germany,
Greece and the Netherlands, reflecting very different European transport environ-
ments. The method application is based on datasets from the European transport
model TRANSTOOLS, using the VISUM model for network flow assignment. The
simulations show that in first place the non-availability of access links to the major

WEATHER D2: Vulnerability of Transport Systems
xii
national agglomerations is most critical. In second order, cutting off major trans-
national trunk roads lead to high costs of detouring. But in general it can be con-
cluded that the vulnerability of the dense European road network is limited due to a
high degree of redundancy. This will look different for the rail, air and particularly in-
land navigation networks, which are less dense and / or services on them are highly
inter-connected.
Impact assessment by mode of transport
Road sector vulnerability towards weather extremes builds on three pillars. In a first
step 974 damage reports from super-regional newspapers and transport undertak-
ings in six countries from 2000 to 2010 were assessed and generalized. These were
supplemented by an elasticity model relating literature findings to meteorological in-
dices of extremes. Total costs found are roughly €1.8 billion annually or roughly 0.1
€-Ct per vkm across Europe and all weather categories. Of these 35% relate to infra-
structure damages by heavy precipitation and floods alone, and winter and flood
consequences together create roughly 80% of annual mean costs.
The literature on railways and climate change concentrate on impacts of longer and
more extreme heat periods on track conditions and resulting impacts on operations
and users. The heat summer 2003 alone has caused 127 buckles and 130000 delay
minutes above average, costing €m1.8 to the UK. Additional problems can be caused
by frozen points, and damaged rails due to tension cracking. The assessment of Eu-
ropean media and transport sector data lead to €m7.0. per heavy precipitation event,
€m45 for permanent rain with flooding, €m0.9 per thunderstorm, €m2.5 per winter
storm and €m5.6. per avalanche. Of the dominating rain and flood costs 40% are
attributed each to infrastructure assets and to operations, while the remaining 20%
are borne by users through delays.
The vulnerability assessment of urban public transport has been focused on two
major flood events in eastern Germany: the Elbe flood 2002 costing €333 million of
which €83 are attributable to infrastructure reconstruction costs in Dresden and €230
million are reported for metro restoration in Prague, and the summer flood in 2010.
The assessment of weather consequences to the aviation sector concentrates on
the impact of airport winter maintenance and on accidents and delays to airlines and
passengers. Input data has been provided by EUROCONTROL‘s delay database
and from EASA and were accompanied by information from media sector docu-
ments. The most affected actors are airlines and air passengers through delays,
bearing 70% of the estimated €360 million total costs per year. Further 27% are at-
tributed to aircraft damages and user health and life impacts in the course of
weather-inflicted accidents. From a regional perspective the most penalised area is
Western Europe, and in particular the North Sea coast (including the British islands).

WEATHER D2: Vulnerability of Transport Systems
xiii
For maritime transport studies commonly cope with the long-term effects of climate
change. The most severe consequences arise from storms/hurricanes, followed by
heavy rains, high wind speeds and, sometimes, hail, causing all kinds of damage,
from infrastructure destruction to the impossibility of accessing the port, and extreme
frost periods and iceing, causing a temporary blockade of the port activities. The es-
timation process focuses on short-term costs from extreme events for two case stud-
ies for the winter storm Kyril in 2007. The Damage of the container ship MSC Napoli
in the English Channel caused estimated costs of €m3060. Total costs of the disrup-
tion of the Stena Lines connecting Rosslare in Ireland and Fishguard in the UK cost
approximately €482‗493, with the main costs attributable to dropping fare incomes of
€180‗754
The extreme weather events that have the biggest impact on inland waterway
transport are floods, causing high water levels and possibly resulting in a lack of
bridge clearance and, if critical values are exceeded, in a disruption of traffic. Drought
periods cause low water levels and resulting in lower load factors, lower speeds,
more fuel consumption and possibly a disruption of traffic (in particular for bigger
vessels) and finally ice cause severe delays or a blockade for the inland waterway
vessels. Cost estimates have been performed for the Rhine and its neighbouring
rivers based on Pegel Points and reports on ice days. Illustrative economic costs for
floods in the Kaub area are estimated at €m29.2 from 2003 to 2010.
Intermodal transport is partly affected less by weather extremes due to the heavi-
ness of the infrastructures, but impacted more due the inflexibility of the system. The
extreme weather events potentially affecting intermodal transport are flooding, land-
slides, avalanches, to the extent that they are causing delays in operations or inter-
ruptions in transport services. The assessment of intermodal transport vulnerability to
climate change and extreme weather events leads to €m6.8 p.a. borne by infrastruc-
ture managers (57%) and social actors (43%), i.e. the overall cost for the society due
to additional accidents costs.
Overview of Results
In terms of the cost assessment, the following table provides an overall picture at EU
level of the cost assessment of the weather extreme events by transport mode, type
of stakeholder involved and type of extreme event considered. The total costs
amount to about € 2.5 billion yearly.

WEATHER D2: Vulnerability of Transport Systems
xiv
Generalization of extreme weather events costs for the European transport system
(annual data in € m)
Extreme weather event Infrastructure
Assets (m€)
Infrastructure
Operations
(m€)
Vehicle
Assets
(m€)
Vehicle
Operations
(m€)
User
Time
(m€)
Health &
Life
(m€)
Total
(m€)
Storm Road (1) 76,10 22,60 5,10 1,40 63,00 5,90 174,10
Rail (2) 6,28 18,39
Maritime (5) 2,10 17,98 20,08
Intermodal (6) (7) 0,72 1,25
Air (8) 53,80 34,30 38,40 28,30 154,80
Winter Road (1) 248,80 126,30 81,30 12,50 125,50 164,90 759,30
Rail (2) (3) 1,60 5,02
Intermodal (6) (7) 0,21 0,42
Air (8) 11,20 12,00 57,70 64,60 1,90 147,40
Flood Road (1) 630,10 21,90 24,40 30,01 93,70 21,50 821,61
IWW (4) 4,87
Rail (2) 67,30 282,55
Air (8) 3,20 26,50 29,60 0,20 59,50
Intermodal (6) (7) 0,10 0,42
Heat&drought Road (1) 46,90 46,90
Total 1059,82 182,00 308,92 180,39 494,84 270,63 2496,60
4,87
0,07 12,05
0,04 3,38
0,53
0,21
0,32
103,66 111,60
(1) Average year 2000-2010.
(2) Average annual data 1999-2010
(3) Avalanches, winter storms and extreme heat events not included
(4) Average annual data 2003-2009, service providers costs
(5) Average data hurricane Kyrill 2007 from case studies, freight transport
(6) Average data 2009 freight transport without AT, CH, I, CZ, DE (already included in Rail)
(7) Including extreme temperatures (heat)
(8) Average annual data
As suggested by the several footnotes to the table, the cross-modal comparison of
extreme weather events related costs is subjected to several caveats. For road, rail,
air and combined (freight) transport average annual values are presented, while for
maritime shipping and inland navigation only specific case studies have been as-
sessed.
Furthermore, and most significantly, in some case the annual estimation is the result
of the generalization at EU level of cost estimations available for given countries,
using specific parameters and variables (traffic flows, number of container, etc), i.e.
for the road and rail sectors, the intermodal transport (freight) and the air transport; in
other cases the generalization has not been made possible, as for waterborne trans-
port (inland waterways and maritime). When the generalization has not been made
possible, a certain downward bias in the final results must be taken into account. And
even when the gerneralization has been made possible, a certain downward bias is
still possible due to lack of information, as for the costs suffered by the rail transport
system because of extreme very cold days.

WEATHER D2: Vulnerability of Transport Systems
xv
On the other hand, the table shows that of the € 2.496 billion of total costs, about
97% are related to the transport modes for which the generalization at EU level has
been carried out: road, rail, intermodal freight transport and air transport, whose total
extreme weather related costs amount to € 2.413 billion. This implies that the trends
and the conclusions drawn below can be considered representative of the impacts
suffered by the overall European transport system.
In general, infrastructure asset and operation account not surprisingly for the higher
toll: 50% of the total costs (43% asset and 7% operations). The literature review has
in fact stressed the fact that the likely most relevant implications arising from climate
change concern planning, design, construct, operate, and maintaining of transport
infrastructure (TRB, 2008). But also the burden suffered by users (due in particular
to congestion and time losses to citizens and transport users) is quite relevant (about
€450 million per year, corresponding to 20% of the total costs). The health costs
amount to 12% of total costs, corresponding to € 270 million per year.

WEATHER D2: Vulnerability of Transport Systems
16
1 Introduction
1.1 Introduction to the WEATHER project
Records of reinsurance companies clearly highlight the rising damages caused by
the consequences of climate change, and in particular of natural catastrophes and
extreme weather events. While many studies focus on CO2 mitigation in transport,
research on the vulnerability of the sector on climate driven effects, namely extreme
weather events, is coming up only recently.
Little knowledge has so far been developed on the economic costs of climate and
extreme weather driven damages to transport, and even less evidence is available
on the options, costs and benefits of adaptation measures. National adaptation pro-
grams of EU Member States, the US, Canada, New Zealand and the 4th assessment
report of the IPCC provide only indicative measures and global fields of action. Thus
there is a need for European studies addressing local conditions.
The third branch of WEATHER research is concerned with the role of transport sys-
tems for crisis/disaster management. In the transport literature, the term ―emergency
operations‖ spans a number of topics including logistics, traffic planning, and institu-
tional issues. The major tasks under these topics are the transport of emergency
vehicles and search-and-rescue teams, medical evacuation, and distribution of goods
and local medical aid. In this field of research European evidence is already avail-
able.
1.2 Project objectives and work plan
In front of this background the WEATHER project aims at analysing the economic
costs of more frequent and more extreme weather events on transport and on the
wider economy and explores the benefits and costs of suitable adaptation and emer-
gency management strategies for reducing them in the context of sustainable policy
design. The research is carried out by an international team of eight European insti-
tutes, lead by the Fraunhofer-Institute for Systems and Innovation Research (ISI).
The project runs for 30 months from November 2009 until April 2012.The weather
project is funded by the 7th RTD framework program of the European Commission
and is supervised by the Directorate General for Research.
The project work plan is broken down in two work packages for management dis-
semination and seven work packages on research:
WP1: Weather trends and economy-wide impacts
WP2: Vulnerability of transport systems
WP3: Crisis management and emergency strategies

WEATHER D2: Vulnerability of Transport Systems
17
WP4: Adaptation options and strategies
WP5: Governance, incentives and innovation
WP6: Case studies
WP7: Policy conclusions and final conference
The WEATHER work packages are closely interlinked as sound adaptation and cri-
ses prevention strategies require the simultaneous consideration of various aspects
of weather trends, transport economics and policy design. Of utmost importance for
the weather research are contacts to transport operators and the insurance sector.
For this reason each of the core work packages organises workshops to discuss the
project findings with transport professionals and academia.
1.3 The Objective of Deliverable 2
The Deliverable 2: ―The vulnerability of transport systems‖ is the first report published
by the WEATHER project. It describes research results on impacts of the various
types of weather extremes on the different modes of transport. Emphasis has been
taken to translate the partly very heterogeneous and fragmentary information on the
impacts of climate change and weather extremes on transport systems into Europe-
wide cost estimates. These figures can, and shall, only provide house numbers on
the order of magnitude of costs imposed by extreme weathers on transport systems.
The results of Deliverable 2 provide the basis for the benefit-cost considerations of
adaptation measures in later stages of the project. Thus, total cost values are of a
general interest for the WEATHER research. Even more important than total figures
of weather related costs is their structure and variability. With the differentiation by
mode, category of extreme and region within Europe we derive hot spots, for which
adaptation measures shall be investigated with particular attention. Accordingly, De-
liverable 2 feeds into all other branches of the WEATHER project:
Work Package 1: ―Weather trends and economy-wide impacts‖ is provided the
basic economic data and requirements for generating prognoses of extremes and
their impacts on transport and the economy. In order not to anticipate sophisti-
cated scenario results, this report disclaims to present forecasts of transport-
related costs due to weather impacts. This will be done in the frame of Deliverable
1.
Work Package 4: ―Adaptation Strategies‖ and consequently Work Package 5:
―Governance, Incentives and Innovation‖ get direct guidance on the hot spots to
be investigated concerning the design and implementation of adaptation strate-
gies.
Work Package 6: ―Case Studies‖ will on the one hand re-visit the partly rather
general assumptions on costs and cost variability in the present research, but will

WEATHER D2: Vulnerability of Transport Systems
18
on the other hand get information which cost elements to look at in more detail at
the single study cases.
In the following, a brief overview of the Work Package 2 methodology and of its struc-
ture are given.
1.4 Structure of Deliverable 2
The structure of this Deliverable follows the complex background works underlying
the assessment of climate change costs for the European transport system.
Firstly, in the PART A of this Deliverable, four sections have been included:
1. the general accounting framework that represents the overall methodology
of the WEATHER project, e.g. terminology, assessment principles, etc
2. an overview of the most important Climate Change models, whose outcomes
are crucial for the assessment of future climate change impacts in Europe by
type of extreme weather events
3. an introduction to the methodological approaches to the impact assessment
of extreme weather events on transport networks for a sample of European
countries (road network)
4. a brief account of the first WEATHER Workshop on the vulnerability of the
transport sector to climate change and related extreme weather events.
Then, the PART B summarizes the conclusions of the assessment of the extreme
weather events for seven transport modes. The corresponding full reports have been
included in the WEATHER D2 Detailed Report.
Finally, the PART C draws conclusions in terms of cross-comparisons of costs as-
sessments among transport modes.

WEATHER D2: Vulnerability of Transport Systems
19
PART A: GENERAL TOPICS
2 The General Assessment Framework
The general assessment framework constitutes the overall methodology of the
weather project. It sets the dimensions to be covered and provides guidance on the
selection of input values and the design of the modal assessment models. However,
as data availability and the organisation of the transport modes strongly diverges it
was decided by the project steering committee to give freedom to the single modes
to adapt the GAF to the specific needs. Thus, for more detailed, mode specific dis-
cussions it is referred to the annexes 3 to 9 to this report. Here we introduce some
general notations and dimensions of the risk assessment concept.
2.1 The concept of systemic risks
Before discussing the structure of the GAF we need to introduce a number of core
expressions to be precise on what we talk about throughout the document. These
expressions more broadly define the common terminology around the research field
of systemic risks and risk assessment.
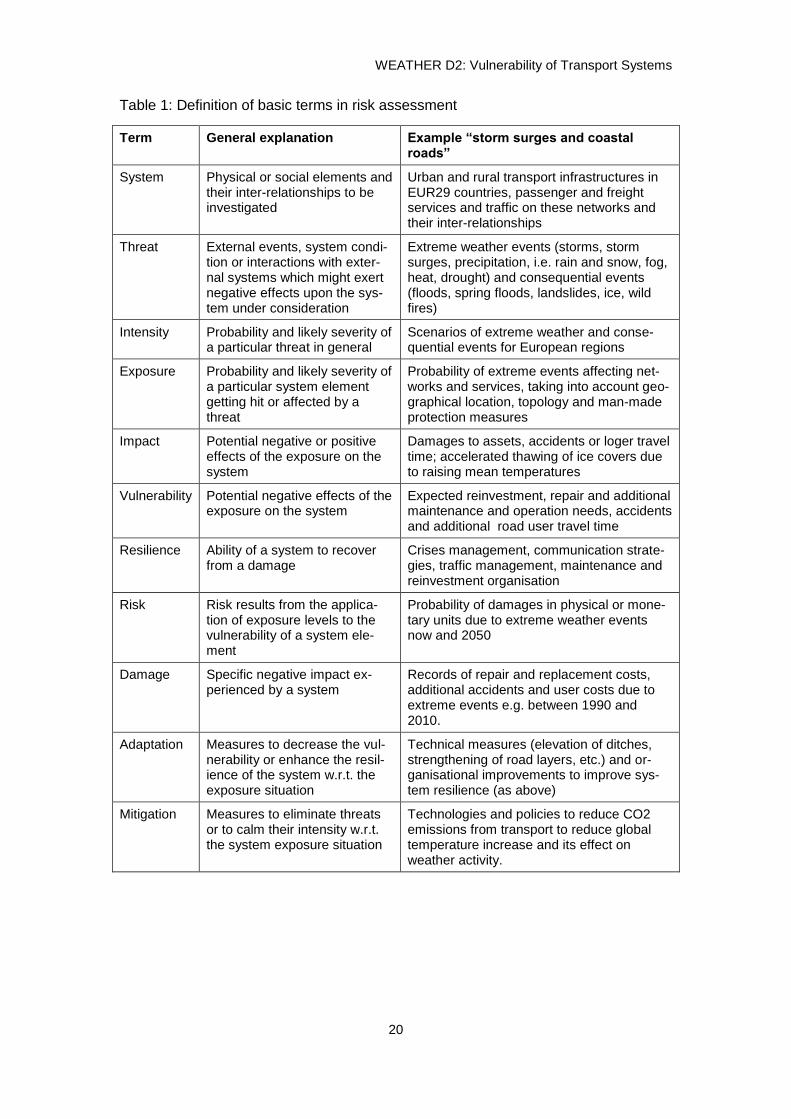
The main concept of the systemic risk terminology is illustrated by Figure 1. A more
detailed description of the concepts is then provided by Table 1.
Figure 1: Terms and concepts of systemic risk theory
System
Threats Intensity
Exposure
Impact Vulnerability
Resilience
Adaptation
Risk Damage
Mitigation
WEATHER D2: Vulnerability of Transport Systems
20
Table 1: Definition of basic terms in risk assessment
Term General explanation Example “storm surges and coastal roads”
System Physical or social elements and their inter-relationships to be investigated
Urban and rural transport infrastructures in EUR29 countries, passenger and freight services and traffic on these networks and their inter-relationships
Threat External events, system condi-tion or interactions with exter-nal systems which might exert negative effects upon the sys-tem under consideration
Extreme weather events (storms, storm surges, precipitation, i.e. rain and snow, fog, heat, drought) and consequential events (floods, spring floods, landslides, ice, wild fires)
Intensity Probability and likely severity of a particular threat in general
Scenarios of extreme weather and conse-quential events for European regions
Exposure Probability and likely severity of a particular system element getting hit or affected by a threat
Probability of extreme events affecting net-works and services, taking into account geo-graphical location, topology and man-made protection measures
Impact Potential negative or positive effects of the exposure on the system
Damages to assets, accidents or loger travel time; accelerated thawing of ice covers due to raising mean temperatures
Vulnerability Potential negative effects of the exposure on the system
Expected reinvestment, repair and additional maintenance and operation needs, accidents and additional road user travel time
Resilience Ability of a system to recover from a damage
Crises management, communication strate-gies, traffic management, maintenance and reinvestment organisation
Risk Risk results from the applica-tion of exposure levels to the vulnerability of a system ele-ment
Probability of damages in physical or mone-tary units due to extreme weather events now and 2050
Damage Specific negative impact ex-perienced by a system
Records of repair and replacement costs, additional accidents and user costs due to extreme events e.g. between 1990 and 2010.
Adaptation Measures to decrease the vul-nerability or enhance the resil-ience of the system w.r.t. the exposure situation
Technical measures (elevation of ditches, strengthening of road layers, etc.) and or-ganisational improvements to improve sys-tem resilience (as above)
Mitigation Measures to eliminate threats or to calm their intensity w.r.t. the system exposure situation
Technologies and policies to reduce CO2 emissions from transport to reduce global temperature increase and its effect on weather activity.
WEATHER D2: Vulnerability of Transport Systems
21
The manifold impacts of extreme weather events on transport depend on:
1. the mode, type, function and occupation of transport network elements,
2. their geographic and topographic environment and
3. the type and severity of weather impact
The proposed systematic of these three groups of characteristics is discussed in turn.
The resulting matrix of potential impacts is huge and will contain many irrelevant or
less significant fields. The identification of the remaining ―hot spots‖ is subject to a
final step.
2.2 Dimensions of the assessment framework
2.2.1 Time horizon
This report concentrates on the economic impacts of intensive weather conditions on
current transport networks and activities. The base year for costs is 2010. The results
of the cost computations shall provide the basis for predictions of possible costs (or
benefits) or altering weather conditions until the target year 2050. These forecasts
will be carried out in later stages of the project as climate and weather scenarios
have been agreed and finally quantified. An introduction into the results of current
climate models is provided by the following section.
2.2.2 Transport modes
The WEATHER research generally looks at all modes of transport, however with
varying intensity. These are:
Road: European perspective derived from country-specific data.
Rail and urban public transport (UPT): discussion of case-specific results.
Aviation coverage of Europe by assessing Europe-wide statistics.
Maritime and inland navigation: sector-specific focus on a few countries.
Intermodal transport European focus by generalising sector information.
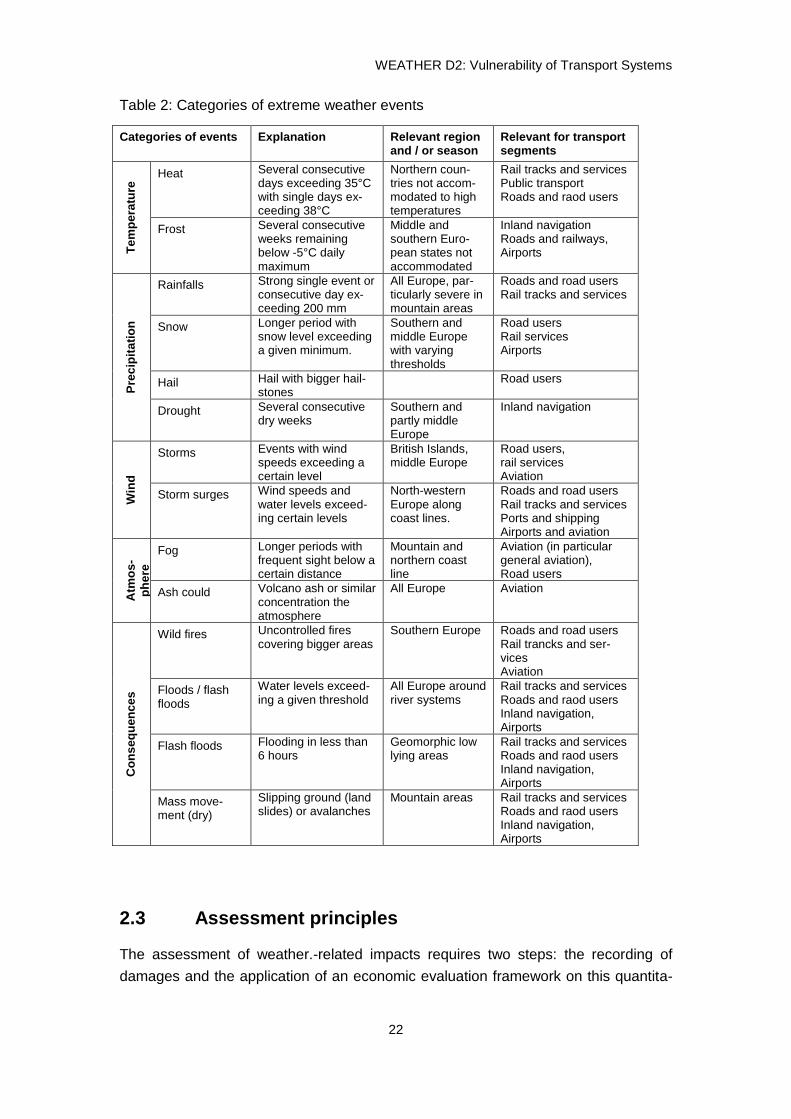
2.2.3 Categories of extreme weather considered
The research concentrates on singular weather events which clearly exceed the
long-term average of comparable meteorological activities over the annual mean or
related to the specific season, which have considerable negative impacts on assets
and operations, or which affect human health or lives. Table 2 gives an overview of
the categories of extremes considered here.
WEATHER D2: Vulnerability of Transport Systems
22
Table 2: Categories of extreme weather events
Categories of events Explanation Relevant region and / or season
Relevant for transport segments
Te
mp
era
ture
Heat Several consecutive days exceeding 35°C with single days ex-ceeding 38°C
Northern coun-tries not accom-modated to high temperatures
Rail tracks and services Public transport Roads and raod users
Frost Several consecutive weeks remaining below -5°C daily maximum
Middle and southern Euro-pean states not accommodated
Inland navigation Roads and railways, Airports
Pre
cip
ita
tio
n
Rainfalls Strong single event or consecutive day ex-ceeding 200 mm
All Europe, par-ticularly severe in mountain areas
Roads and road users Rail tracks and services
Snow Longer period with snow level exceeding a given minimum.
Southern and middle Europe with varying thresholds
Road users Rail services Airports
Hail Hail with bigger hail-stones
Road users
Drought Several consecutive dry weeks
Southern and partly middle Europe
Inland navigation
Win
d
Storms Events with wind speeds exceeding a certain level
British Islands, middle Europe
Road users, rail services Aviation
Storm surges Wind speeds and water levels exceed-ing certain levels
North-western Europe along coast lines.
Roads and road users Rail tracks and services Ports and shipping Airports and aviation
Atm
os
-
ph
ere
Fog Longer periods with frequent sight below a certain distance
Mountain and northern coast line
Aviation (in particular general aviation), Road users
Ash could Volcano ash or similar concentration the atmosphere
All Europe Aviation
Co
ns
eq
uen
ce
s
Wild fires Uncontrolled fires covering bigger areas
Southern Europe Roads and road users Rail trancks and ser-vices Aviation
Floods / flash floods
Water levels exceed-ing a given threshold
All Europe around river systems
Rail tracks and services Roads and raod users Inland navigation, Airports
Flash floods Flooding in less than 6 hours
Geomorphic low lying areas
Rail tracks and services Roads and raod users Inland navigation, Airports
Mass move-ment (dry)
Slipping ground (land slides) or avalanches
Mountain areas Rail tracks and services Roads and raod users Inland navigation, Airports
2.3 Assessment principles
The assessment of weather.-related impacts requires two steps: the recording of
damages and the application of an economic evaluation framework on this quantita-

WEATHER D2: Vulnerability of Transport Systems
23
tive dataset. Further, the issue of generalisation of country- or event-specific findings
to larger geographical entities is of particular interest when trying to grasp the size of
the problem.
2.3.1 Recording damages
For each of the four modes (road, rail, waterborne and air) we consider the following
categories of damages:
4. Infrastructure damages and impacts on infrastructure maintenance, wear and
tear and operations, e.g. snow removal, cleaning, small-scale repair measures,
etc.
5. Vehicle fleet damages and impacts on the costs of service provision, e.g. addi-
tional personnel, energy costs or vehicle preparation.
6. User travel time costs, including time for freight movements, and perceived
service quality, e.g. reliability, crowding and temperatures in vehicles.
7. Traffic safety, i.e. the number of killed, severely and slightly injured transport
users.
As far as possible we use weather-inflicted damages reported by infrastructure op-
erators, service providers or user associations. But as damage records for the trans-
port sector in many cases do not exist or are not publically available, in addition we
apply a media research in selected countries. The subsequent sections on single
modes show the current state of knowledge concerning the respective relevant im-
pacts by the above impact categories.
2.3.2 Assessing economic impacts
In case the original sources of damage reporting provide with cost values we take
these. Otherwise a simplistic but workable procedure is applied to estimate missing
data and economic costs. We use the following very cause assumptions and proce-
dures:
8. Infrastructure damages: We start from standard cost values for infrastructure
construction by construction element taken from the IMPACT (2008), GRACE
(2006) and UNITE (2002). If no state of damage is reported we only consider
the costs of resurfacing and equipment renewal. To separate standard renewal
costs from weather-related damages we take only the share of the asset‘s re-
maining life time or 50% of not available. Capital costs are considered by a de-
fault value of 10% upon the replacement or repair costs.
9. Infrastructure operations: Here we do not have standard cost values avail-
able, as these will strongly differ between categories of weather extremes, re-
gions and the organisational structure of the infrastructure company.

WEATHER D2: Vulnerability of Transport Systems
24
10. Vehicle damages: Cost values are based on prices for new vehicles, of which
we apply 50% to reflect age and partial damages. In further steps these will be
cross-checked to insurance reports of material damages.
11. Vehicle operation costs comprise of costs for additional heating and cooling in
case of temperature-related events or of fuel, personnel and depreciation in
case of detouring. Respective cost values are provided by automobile associa-
tions for passenger cars or HGVs and can be derived from balance sheets of
transport service providers. The time and distance of detouring is estimated by
the TRANS-TOOLS network database. If the number of vehicles affected is not
given, national average traffic volumes per type of infrastructure are taken.
12. User time costs are computed like vehicle operating costs using standard cost
values from the IMPACT and HEATCO projects. If not available by modal sta-
tistics, default values for delays and detours are also taken from the TRANS-
TOOLS model. Besides national infrastructure load rates, national vehicle oc-
cupancy figures are provided to transfer vehicle delays into passengers or
freight units.
13. Users’ discomfort arises from over-crowding, excessive or too low tempera-
tures in vehicles. We have not found a reliable method for valuing these effects
and thus exclude comfort-related impacts from the assessment.
14. Accident impacts on human health and life are assessed by standard cost
values for death casualties, severe and slight injuries derived in recent Euro-
pean studies. Usually the number of fatalities and injuries associated with ex-
treme events are well documented.
The default values shall help to set the order of magnitude of transport related
weather consequences in relation to total damages reported by re-insurance compa-
nies and to the costs and benefits of adaptation and crises preparation measures to
be estimated in the course of the project.
An example on the analysis, data sources and potential issues arising from
WEATHER research project, with reference to the Road sector is provided in the fol-
lowing section.

WEATHER D2: Vulnerability of Transport Systems
25
3 Climate and Weather Scenarios for Europe
3.1 Projected main Climate Changes
This chapter reviews the most prominent Climate Change models and analyses its
impacts on extreme weather events. The analysis relies mainly on the IPCC A1B and
A2 Scenarios with projections of Climate Change to 2050 and 2100.
The A1 storyline describes a future world of very rapid economic growth, global
population that peaks in mid-century and declines thereafter, and the rapid introduc-
tion of new and more efficient technologies.
The A2 scenario family describes a very heterogeneous world. The underlying theme
is self-reliance and preservation of local identities, with fertility patterns across re-
gions converge very slowly, which results in continuously increasing population. Eco-
nomic development is primarily regionally oriented and per capita economic growth
and technological change more fragmented and slower.
The following projects/publications were used to assess the impacts of climate
change on extreme weather conditions: IPCC AR4 (Christensen 2007, Alcamo 2007,
Meehl 2007), ENSAMBLES ((van der Linden et al 2009), PRUDENCE (Christensen
2007) and ESPON 1.3.1 (Schmidt-Thomé 2006). Next to these, a number of addi-
tional papers were reviewed to retrieve further information.
Table 3 lists the outputs from the Prudence assessments for North Europe (NEU)
and South Europe and Mediterranean (SEM): Here the changes in mean tempera-
ture and precipitation averaged for the period 1980 to 1999 period and the 2080 to
2099 period of A1B Scenario are presented. Computing the difference between these
two periods, the table shows the minimum, maximum, median (50%), and 25 and
75% quartile values among the 21 models, for temperature (°C) and precipitation (%)
change.
The table gives as well information about the duration (in years) until the changes are
statistically significant at a 95% level. Additionally, Table 3 presents the frequency of
extreme weather events.

WEATHER D2: Vulnerability of Transport Systems
26
Table 3: Main climate changes for Europe in 2080-2099 compared to 1980-1999
(i) Source: Christensen et al 2007, 4th AR Working Group I, Chapter 11
Annual mean temperatures in Europe are likely to increase more than the global
mean. Seasonally, the largest warming is likely to be in northern Europe in winter and
in the Mediterranean area in summer. Minimum winter temperatures are likely to in-
crease more than the average in northern Europe. Maximum summer temperatures
are likely to increase more than the average in southern and central Europe.
(ii) Source: Christensen 2007, p 875
Figure 2: Temperature increase 2080-2099 compared to 1980-1999
The analysis reveals a temperature increase in Europe, with changes to 2050 being
relatively moderate compared to expected Climate Change impacts in 2100. Since
this WEATHER project takes a shorter perspective - 2050 -, impacts are expected to
be considerably higher in 2100. Additionally, the statistical significance of the
changes is lower.
Annual precipitation is very likely to increase in most of northern Europe and de-
crease in most of the Mediterranean area. In central Europe, precipitation is likely to

WEATHER D2: Vulnerability of Transport Systems
27
increase in winter but decrease in summer. Extremes of daily precipitation will in-
crease in northern Europe. The annual number of precipitation days is very likely to
decrease in the Mediterranean area. Risk of summer drought is likely to increase in
central Europe and in the Mediterranean area. The duration of the snow season is
very likely to shorten, and snow depth is likely to decrease in most of Europe.
Annual DJF JJA
(iii) Source: Christensen 2007, p.875
Figure 3: Precipitation increase 2080-2099 compared to 1980-1999
3.2 Extreme weather events and natural disasters
For the period 1998–2009, EEA (2010) reports 576 disasters due to natural hazards
causing near to 100 000 fatalities, and close to EUR 150 billion in overall losses. Dur-
ing this period, more than 11 million people (out of a population of 590 million, ap-
proximately, in the EEA member countries) were somehow affected by disasters
caused by natural hazards. Extreme temperature, storms and floods made up nearly
90% of all natural disasters.
According to EEA (2010), the number of disasters in Europe has been showing an
upward trend since 1980, largely due to the continuous increase of meteorological
and hydrological events.
The trend is depicted in Figure 4.

WEATHER D2: Vulnerability of Transport Systems
28
Figure 4: Disasters due to natural hazards in EEA member countries, 1980–2009
3.3 Climate Change impacts on extreme events
Meehl (2007) states that ―the type, frequency and intensity of extreme events are
expected to change as Earth‘s climate changes, and these changes could occur
even with relatively small mean climate changes. Changes in some types of extreme
events have already been observed, for example, increases in the frequency and
intensity of heat waves and heavy precipitation events.‖
In a warmer future climate, there will be an increased risk of more intense, more fre-
quent and longer-lasting heat waves. The European heat wave of 2003 is an exam-
ple of the type of extreme heat event lasting from several days to over a week that is
likely to become more common in a warmer future climate. A related aspect of tem-
perature extremes is that there is likely to be a decrease in the daily temperature
range in most regions. It is also likely that a warmer future climate would have fewer
frost days (i.e., nights where the temperature dips below freezing). Growing season
length is related to number of frost days, and has been projected to increase as cli-
mate warms. There is likely to be a decline in the frequency of cold air outbreaks
(i.e., periods of extreme cold lasting from several days to over a week) in NH winter
in most areas.
In a warmer future climate, most Atmosphere-Ocean General Circulation Models pro-
ject increased summer dryness and winter wetness in most parts of the northern
middle and high latitudes. Summer dryness indicates a greater risk of drought. Along
with the risk of drying, there is an increased chance of intense precipitation and flood-
ing. This has already been observed and is projected to continue because in a

WEATHER D2: Vulnerability of Transport Systems
29
warmer world, precipitation tends to be concentrated into more intense events, with
longer periods of little precipitation in between. Therefore, intense and heavy down-
pours would be interspersed with longer relatively dry periods. Another aspect of
these projected changes is that wet extremes are projected to become more severe
in many areas where mean precipitation is expected to increase, and dry extremes
are projected to become more severe in areas where mean precipitation is projected
to decrease.
In concert with the results for increased extremes of intense precipitation, even if the
wind strength of storms in a future climate did not change, there would be an in-
crease in extreme rainfall intensity. In particular, over land, an increase in the likeli-
hood of very wet winters is projected over much of central and northern Europe due
to the increase in intense precipitation during storm events, suggesting an increased
chance of flooding over Europe and other mid-latitude regions due to more intense
rainfall and snowfall events producing more runoff. The increased risk of floods in a
number of major river basins in a future warmer climate has been related to an in-
crease in river discharge with an increased risk of future intense storm-related pre-
cipitation events and flooding. Some of these changes would be extensions of trends
already underway.
There is evidence from modelling studies that future tropical cyclones could become
more severe, with greater wind speeds and more intense precipitation. Projections
also indicate as probable an eastward extension of the Atlantic storm-track into
Europe. This is the reason for the increase of winds in central Europe, increase in
precipitation in Northern Europe. This extension has already been observed in the
last decades. A number of modelling studies have also projected a general tendency
for more intense but fewer storms outside the tropics, with a tendency towards more
extreme wind events and higher ocean waves in several regions in association with
those deepened cyclones. Models also project a poleward shift of storm tracks in
both hemispheres by several degrees of latitude.
3.3.1 Precipitation extremes
IPCC observes ―in northern Europe and in central Europe in winter, where time mean
precipitation is simulated to increase, high extremes of precipitation are very likely to
increase in magnitude and frequency. In the Mediterranean area and in central
Europe in summer, where reduced mean precipitation is projected, extreme short-
term precipitation may either increase (due to the increased water vapour content of
a warmer atmosphere) or decrease (due to a decreased number of precipitation
days, which if acting alone would also make heavy precipitation less common). …
However, there is still a lot of quantitative uncertainty in the changes in both mean
and extreme precipitation.‖ (Christensen 2007)

WEATHER D2: Vulnerability of Transport Systems
30
Räisänen (2004, p 25) conducted simulations on the changes of extreme precipita-
tion (Figure 5) and observed that ―maximum precipitation increases even in most of
those areas where the mean annual precipitation decreases. Disregarding the small-
scale noise, the change in maximum precipitation varies less between different parts
of Europe and the different scenario simulations than the change in mean precipita-
tion… An increase in heavy precipitation in a warmer climate is a remarkably robust
model result.‖
RH-A2 RE-A2
(iv) Source: Räisänen 2004, p26
Figure 5: Changes (%) in the largest one-day precipitation 2080-2099 compared to
1980-1999, A2 scenario and different climate models
3.3.2 Land Slides
The Climate Change model simulate increases in average precipitation and in pre-
cipitation extremes. Since heavy rainfall events are frequent triggering factors for
landslides, the following trends can be assumed according to EEA (2010):
Increase in the number of debris flows from high intensity rainfall, together
with soil erosion and degradation phenomena, as a consequence of in-
creases in temperatures and aridity;
Decline in activity for slow landslide phenomena due to the drop in the to-
tal average annual rainfall and the consequent decrease in the recharge
capacity of the water tables;
Increase in deformations of slopes (rock falls due to freeze thaw, debris
flows, earth flows) in areas which are now covered by permafrost and
WEATHER D2: Vulnerability of Transport Systems
31
therefore substantially stable, following progressive increases in tempera-
ture and the consequent reduction in permafrost and glacial areas. For the
time being
3.3.3 Avalanches
An analysis of the avalanche records in the Swiss Alps shows that natural avalanche
activity has not changed over the last 70 years (EEA 2010). Climate Change is, how-
ever, having a more and more pronounced effect at altitudes below 1 000 m, where a
significant temporal as well as spatial reduction of snow coverage is already taking
place. In contrast, no trend is visible at higher altitudes. Further increases of tem-
perature obviously reduce the period during which large avalanches can occur. How-
ever, the occurrence of large avalanches is not governed by general climatic trends
but rather by short term weather events, such as particularly intense snow falls dur-
ing a couple of days, possibly linked with strong winds or a rapid temperature in-
crease with rainfall at high altitudes. Such marked weather periods will possibly be-
come more frequent with climate change. The percentage of wet snow avalanches is
expected to increase relative to dry snow avalanches. An increase or decrease in the
size of the avalanches should not be expected, as avalanche size is governed by the
release height and release area, which are hardly influenced by climatological devel-
opments but mainly by the topography and shear strength of the snowpack. From the
conflicting tendencies described above — reduced snow coverage as against possi-
bly more heavy precipitation events — it is currently still difficult make a clear sce-
nario projection for the long term development of avalanche hazards under a chang-
ing climate.
3.3.4 Storm
According to IPCC ―extreme wind speeds in Europe are mostly associated with
strong winter cyclones the occurrence of which is only indirectly related to the mean
circulation. Nevertheless, climate change models suggest a general similarity be-
tween the changes in average and extreme wind speeds. Regarding extreme winds,
some authors found an increase in extreme wind speeds for western and central
Europe. Extreme wind speeds increase for the area between 45°N and 55°N, except
over and south of the Alps. This could generate more North Sea storms leading to
increases in storm surges along the North Sea coast, especially in the Netherlands,
Germany and Denmark. Two models with gust parameterisation estimate an in-
crease of up to 20% of the number of storm peak (defined as gusts≥8 Bft) events
over Central Europe in the future. Leckebusch (2008) found positive trends for both
the severity of storms during the historic period (1960–2000), and under climate
change conditions. Additionally an increase in the spatial extent of storms is diag-
nosed, amounting up to about 10 % between present day and the scenario climate.

WEATHER D2: Vulnerability of Transport Systems
32
Rockel et al (2007) research the change in total number of storm peak events over
Europe from 1961–1990 to 2071– 2100 for two models as shown in Figure 6. Both
models simulate an increase in the number of events over land areas in Western,
Central and Eastern Europe. A decrease is modelled in the other parts of Europe,
which are mostly over the ocean.
Model CHRM CLM
(v) Source: Rockel et al 2007, p 273
Figure 6: Change in total number of storm peaks (gusts larger 8 Bft, in %) 2080-
2099 compared to 1980-1999
3.3.5 Snow
According to IPCC (Christensen et al 2007) is ―the overall warming very likely to
shorten the snow season in all of Europe. Snow depth is also likely to be reduced, at
least in most areas, although increases in total winter precipitation may counteract
the increased melting and decreased fraction of solid precipitation associated with
the warming. The changes may be large, including potentially a one-to-three month
shortening of the snow season in northern Europe and a 50 to 100% decrease in
snow depth in most of Europe by the late 21st century. However, snow conditions in
the coldest parts of Europe, such as northern Scandinavia and north-western Russia
and the highest peaks of the Alps appear to be less sensitive to the temperature and
precipitation changes projected for this century than those at lower latitudes and alti-
tudes.‖
Raisänen (2004) conducted simulations on extreme winter temperatures and reveals
that in many areas, this change exceeds the average winter warming by a factor of
WEATHER D2: Vulnerability of Transport Systems
33
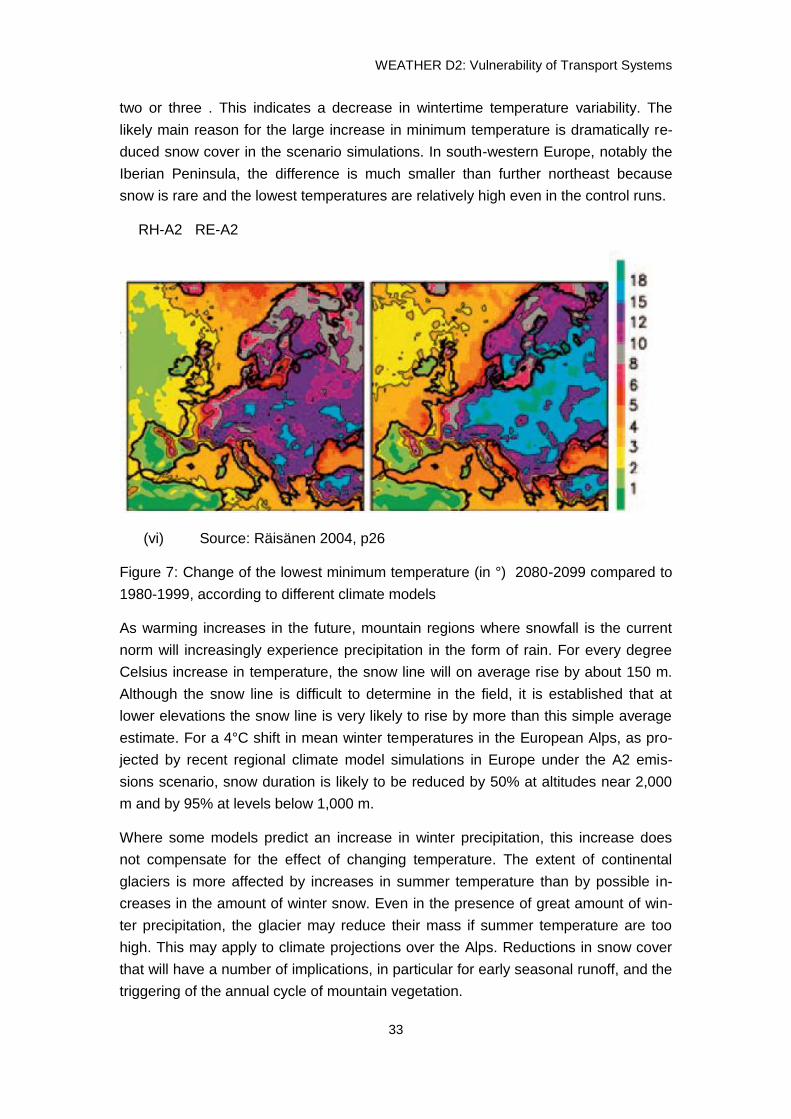
two or three . This indicates a decrease in wintertime temperature variability. The
likely main reason for the large increase in minimum temperature is dramatically re-
duced snow cover in the scenario simulations. In south-western Europe, notably the
Iberian Peninsula, the difference is much smaller than further northeast because
snow is rare and the lowest temperatures are relatively high even in the control runs.
RH-A2 RE-A2
(vi) Source: Räisänen 2004, p26
Figure 7: Change of the lowest minimum temperature (in °) 2080-2099 compared to
1980-1999, according to different climate models
As warming increases in the future, mountain regions where snowfall is the current
norm will increasingly experience precipitation in the form of rain. For every degree
Celsius increase in temperature, the snow line will on average rise by about 150 m.
Although the snow line is difficult to determine in the field, it is established that at
lower elevations the snow line is very likely to rise by more than this simple average
estimate. For a 4°C shift in mean winter temperatures in the European Alps, as pro-
jected by recent regional climate model simulations in Europe under the A2 emis-
sions scenario, snow duration is likely to be reduced by 50% at altitudes near 2,000
m and by 95% at levels below 1,000 m.
Where some models predict an increase in winter precipitation, this increase does
not compensate for the effect of changing temperature. The extent of continental
glaciers is more affected by increases in summer temperature than by possible in-
creases in the amount of winter snow. Even in the presence of great amount of win-
ter precipitation, the glacier may reduce their mass if summer temperature are too
high. This may apply to climate projections over the Alps. Reductions in snow cover
that will have a number of implications, in particular for early seasonal runoff, and the
triggering of the annual cycle of mountain vegetation.

WEATHER D2: Vulnerability of Transport Systems
34
3.3.6 Maritime ice cover
The Baltic Sea is likely to lose a large part of its seasonal ice cover during this cen-
tury. Using a regional atmosphere-Baltic Sea model, the average winter maximum
ice extent decreased by about 70% (60%) between 1961 to 1990 and 2071 to 2100
under the A2 (B2) scenario. The length of the ice season was projected to decrease
by one to two months in northern parts and two to three months in the central parts.
Comparable decreases in Baltic Sea ice cover were projected by other studies.
3.3.7 Summer temperature extremes
Climate change has already influenced the frequency and intensity of extreme tem-
perature events. High-temperature extremes like hot days, tropical nights and heat
waves have become more frequent. The number of warm extremes has been in-
creasing twice as fast over the last 25 years. This is in line with the general trend in
Europe, warming more than the global average. EEA (2010) counts 19 major events
of temperature extremes from 1998 to 2009 in Europe.
Along with the overall warming and changes in variability, heat waves are very likely
to increase in frequency, intensity and duration (Christensen 2007). The development
of summer heat extremes in 1990, 2050 and 2100 are depicted in the ENSEMBLES
project (van der Linden P et al 2009) as given in Figure 8. The maps show projected
average number of summer days exceeding the temperature (heat index) threshold
of 40.7°C. The maps show that the impact in 2050 is still moderate compared to
2100.
Projected average number of summer days exceeding the apparent temperature
(heat index) threshold of 40.7°C
Source: van der Linden et al 2009, p.75
WEATHER D2: Vulnerability of Transport Systems
35
Figure 8 Number of hot summer days
―In summer, the warming of large parts of central, southern and eastern Europe may
be more closely connected to higher temperatures on warm days than to a general
warming…Inter annual temperature variability is likely to increase in summer in most
areas. However, the magnitude of change is uncertain, even in central Europe where
the evidence for increased variability is strongest. In some PRUDENCE simulations,
interannual summer temperature variability in central Europe doubled between 1961
to 1990 and 2071 to 2100 under the A2 scenario, while other simulations showed
almost no change. …Simulated increases in summer temperature variability also
extend to daily time scales.‖ PRUDENCE simulations and find that ―a general in-
crease in summer daily temperature variability is evident, especially in southern and
central parts of Europe, with the highest maximum temperatures increasing more
than the median daily maximum temperature‖ (Christensen 2007).
3.3.8 Droughts
The combined effects of warmer temperatures and reduced mean summer precipita-
tion would enhance the occurrence of heat waves and droughts (Alcamo et al 2007).
The risk of drought is likely to increase in southern and central Europe. By contrast,
the same studies do not suggest major changes in dry-spell length in northern
Europe. Countries in central Europe will experience the same number of hot days as
currently occur in southern Europe and Mediterranean droughts will start earlier in
the year and last longer. The regions most affected could be the southern Iberian
Peninsula, the Alps, the eastern Adriatic seaboard, and southern Greece. The Medi-
terranean and even much of eastern Europe may experience an increase in dry peri-
ods by the late 21st century.
Table 3 presents as well the frequency (%) of dry summers in 2100. While in the
North of Europe only 2% of the summers in 2080 to 2099 are expected to be dry, in
the South this share reaches 42%. Figure 9 maps the projected change in the differ-
ence of maximum dry spell length for the Mediterranean region under the A1B sce-
nario for the time period 2021–2050 relative to the 1961–1990 mean. The largest
increase of drought hazard may be expected in Portugal, South West Spain and
South Greece.

WEATHER D2: Vulnerability of Transport Systems
36
(vii) Source: van der Linden et al 2009
Figure 9: Projected change in the difference of maximum dry spell length 2080-2099
compared to 1980-1999
3.3.9 Wild Fires
The risk of wild fires concentrates not only on the Mediterranean Countries, but af-
fects as well Romania and Poland. Climate Change will induce risk increases similar
to the drought risk above: the effects concentrate on selected regions in the Mediter-
ranean: Portugal, West Spain, South Italy and parts of Greece.

WEATHER D2: Vulnerability of Transport Systems
37
4 Criticality Assessment
4.1 Setting the scene
Over the last years, great attention has been placed on the issue of assessing the
impacts of climate change and extreme weather events on the society, on several
economic sectors and on transportation networks in particular. It is broadly acknowl-
edged that transport constitutes a special field of the overall economic activity, since
not only represents a great share of it but also influences and contributes to the regu-
lar function and every-day operations of the other sectors. This is the main reason
behind the realization of numerous studies, aiming to assess the impacts of extreme
weather events on transport networks.
However, when it comes to examine the impacts of extreme weather events to trans-
port networks, many different problems and questions emerge. First of all, transport
networks of different transport modes have little similarities, at both constructional
and operational level (e.g. the maritime network and the road network). Second, the
impacts from transport networks‘ malfunctions (or closures) of the various modes
differ to the amount of economic losses that cause. This means that there is different
magnitude (and thus different economic results) from closing a central rail station of
the rail network in comparison to the closure of some kilometres of the national road
network. For such kind of different scenarios, the comparison and the evaluation is
proved to be an extremely difficult and demanding process. Last but not least, even
for the same transport network, it is acknowledged that not all parts of a transport
network are of the same importance. E.g. certain ports are more important than oth-
ers (in terms of size or/and traffic), some parts of the road network are more critical
than others etc. It can be concluded that the examination of the impacts from ex-
treme weather events to transport networks conceals a high degree of difficulty in
many levels.
In the framework of the current section, the concept of transport networks criticality
has been tackled. More specifically, the major contribution is the development of a
methodology for assessing the road network criticality. The road sector has been
chosen for study case as it can be modelled with sufficient reliability, which is not the
case for other modes, due to its dominant role in the transport sector and because of
its importance for crises and emergency management. Moreover three countries
have been selected as case studies: Greece, Netherlands and Germany. The selec-
tion of countries reflects different road transport environments: high dense metropoli-
tan areas (the Netherlands), a structurally diverse country (Germany) and a more
sparkly populated country with a challenging topographical environment (Greece).

WEATHER D2: Vulnerability of Transport Systems
38
The proposed method is proved particularly useful for a broad spectrum of cases that
include network management, namely from defining suitable adaptation plans for
extreme weather events, organizing crisis and emergency management and re-
sponding to terrorist attacks to simple traffic information and management proce-
dures.
4.2 Literature review
The performance of transport networks and the criticality of network components
have been studied by several researchers. Taylor and D‘Este (2007) have proposed
a methodology for obtaining the vulnerability of each component of the network. The
methodology is applicable on the level of national networks. The authors emphasize
the differences between reliability and vulnerability: reliability is related to the connec-
tivity of the network while vulnerability is related to the consequences of failure. In
their model, nodes are vulnerable and links have criticality values. An application of
the proposed method on the Australian road network is presented. Kim and Lee
(2006) identify the crucial infrastructure from national economic functional view point,
reflecting the spatio-temporal characteristics of the economy. In the model of Kim
and Lee criticality of each link is analyzed for earthquakes, defining zones and using
the national highway network and economic data for calculating criticality values.
Nagurney et al (2009) propose a new methodology for calculating criticality of net-
work links, using the total demand of the network and the difference in the travel time
as consequence of the closure of a link. The notion of network vulnerability in relation
to extreme events is presented in (2007). The author proposes not to act in the struc-
tural vulnerability ―there is no way to reduce the hazard or it is unknown (e.g. for ter-
rorist attacks) and that constructions are already built and maintained in an optimal
way‖ but to act in the functional vulnerability, defined as ―the consequential degree
and duration of capacity reduction‖. The author applies the proposed method in order
to identify vulnerable locations of the road infrastructure in a German state, taking the
passengers on each link as the potential damage and using the methodology pre-
sented in Nagurney et al (2009) for calculating the criticality of each link.
4.3 Criticality of transport networks
4.3.1 The distinction between Transport network criticality and
vulnerability
It is important to provide a definition and differentiation between vulnerability and
criticality for transport networks. For the scope of the present study vulnerability of a
network element is defined as its physical sensitivity to extreme events. Criticality of
a network element, on the other hand, is a term associated to the entire network per-

WEATHER D2: Vulnerability of Transport Systems
39
formance, indicating the relative importance of the independent network components:
road sections (links) and intersections (nodes) to the entire network efficiency. Thus,
criticality answers to the question of which parts of a network are the most ‗important‘
(critical) for the regular function of the network, while vulnerability indicates which
parts of a network are the most ‗sensitive‘.
Therefore, the criticality assessment of a transport network provides a hierarchy of
transport network components in relation to their importance, which in combination
with vulnerability data or indicators of transport infrastructure, can lead to the identi-
fication of the ‗hot-spots‘ of the transport system, in relation to potential damages or
failures of the network.
4.3.2 Methodological approach for assessing the criticality of
transport networks
The overall objective of the proposed methodological approach is to indicate the
most ‗important‘ (critical) components of a transport system. It is assumed that trans-
port networks (of all modes) can be represented by a set of links and nodes. Thus,
the aim is to define which of the respective links and nodes possess the most critical
role in the performance of the overall transport system.
To achieve this, a two-level approach is proposed; firstly to assess the criticality of
the different transport networks (upper level - networks of different modes) and se-
condly to assess the criticality of the components of the same transport network (low
level - mode internal critical assessment). These two distinct methodological steps
are described in more detail hereafter.
4.3.3 Criticality assessment for different transport networks
The output of the first phase depends on the ‗economic importance‘ of the respective
modes for a specific area extent. The ‗economic importance‘ of the different transport
modes is defined as the total economic production quantity that is created from the
regular function of each transport infrastructure. In order to optimally allocate a cer-
tain amount of money for adaptation strategies to different transport modes, the rela-
tive portion of the economic product of each transport mode must be computed. The
amount assigned to each transport mode is equal to its relative portion of the total
social (economic) benefit of transport infrastructures for each area extent. Different
socio-economic benefits of modes can be defined as a, b, c, d and e while the rela-
tive portion Ri per transport mode is equal to:
Ri = i / ΣB,
where i={a, b, c, d, e},

WEATHER D2: Vulnerability of Transport Systems
40
a, b, c,…,e the economic benefits (product) of different transport modes
B= economic benefit (product) of each transport mode
ΣΒ = a + b + c + d + e,
This simplistic method can provide a first priority setting for resources allocation be-
tween the different transport modes (and their respective transport networks). A step
further from this priority setting is to define the critical components for intervention in
the same transport network.
4.3.4 Mode-internal criticality assessment
The criticality assessment of a transport network (and road in particular) is the main
contribution of the present section. The proposed criticality assessment is distin-
guished from the one of different networks, since it can also constitute a stand-alone
method. Moreover, it follows a totally different methodological approach depending
on the respective transport network mode.
The proposed methodology is applicable specifically for the road networks (and un-
der certain conditions for the rail network as well) since it is the only mode of trans-
port that its infrastructure is very dense (many different options-routes for going from
point A to point B) as well as the links of the network need to be constructed (unlike
air and maritime transport that the (constructed) network is restricted only to nodes).
Therefore the particularity (and difficulty) of assessing the critical components of a
road network is obvious, since road constitutes the only mode with these specific
characteristics. On the contrary, for the other modes, more simplistic approaches can
be adopted, since no traffic assignment procedures are needed, and the criticality
assessment is depended totally on the traffic volumes (and their economic impact) of
the nodes (ports, airports) and not the links. This is the reason that in the present
study the principal objective is to describe a method capable of identifying the critical
links of road networks (that can also be used for rail in cases where the network is
very dense and alternative (traffic) assignment options exist).
4.3.5 Brief description of criticality assessment methodology
for road networks
In this paragraph, the link criticality assessment methodology is described briefly,
which finds direct applications to the identification of the critical components of the
road transport networks. However, it is noteworthy, that due to factors such as land
use and case specific special social needs (e.g. isolated islands) the following steps
cannot be applied to local networks. For all other types of area extent (regional, na-
tional and international networks), the methodology can be applied and provide the
valid results. A brief description of the method approach is presented herein:

WEATHER D2: Vulnerability of Transport Systems
41
1. The Origin-Destination demand matrices are assigned on the road network, us-
ing given network data (ODs, centroids, connectors, links, nodes). For each
OD, demand is assigned on the network according to a user equilibrium crite-
rion.
2. The overall Network efficiency (ε) is computed, based on A. Nagurney‘s Unified
Network Performance Measure, which constitutes the base case scenario
(network efficiency with no link closures)
3. One link of the network is removed and the (new) Network efficiency of the
road network is computed again. Iteratively, this process is repeated for each
link of the network in order to compute the Network efficiency for each re-
moved link.
4. The importance of each network component (link) is computed, based on A.
Nagurney‘s Network Component Importance (I).
This criticality index for each link (I) represents the difference of the network‘s effi-
ciency after the link(s) removal in relation to the initial (normal) condition of the net-
work. It can be assumed that the lower the I(g) indicator is (values near zero), the
more important is the removed link(s) and the higher the I(g) is (values near one), the
less important is the link(s) removed. For surpassing this reverse characteristic, the
final indicator that provides the significance - importance of each link is provided as:
Link Importance (Lim) = 1 - I.
A more detailed description of the method, along with the necessary data sets and
assumptions is provided in the D2 WEATHER Detailed Report.
4.4 Application of the criticality assessment method
Two different applications of the methodology are presented in the following para-
graphs. Firstly, the proposed network criticality method has been applied for the criti-
cality assessment of the road networks of Greece, Germany and Netherlands. Then,
modeling exercises with hypothetical scenarios of link closures have been conducted
for each country for isolating the effect from link deteriorations and closures.
Thus, this chapter will provide getting an idea of the number and the typical location
of critical links in European road networks and the order of magnitude of the addi-
tional time losses and travel kilometers is the purpose of the following section.

WEATHER D2: Vulnerability of Transport Systems
42
4.4.1 Critical assessment of the road networks of Greece, Ger-
many and Netherlands
The method application has been based on datasets from TRANSTOOLS [5] for the
three countries, using VISUM [6] as the traffic assignment computation tool. A de-
tailed description of the datasets used and the basic assumptions is presented in the
Annex to the WEATHER Detailed Report. The application of the method to the three
road networks provided the hierarchy of the links, based on their importance (Lim), as
presented in Maps 1, 2 and 3 that follow.
4.4.2 Results and conclusions
The assessment of network criticalities for the national road network of Greece pro-
vides some first useful indications, in case of link failures (Map1). These are:
1. A general observation is that the main arterial of the national road network is of
high importance, as well as the road connections between the main arterial with the
inner (urban) network. Especially the connections in the northern Greece, where the
density of the network is not high, gain significant importance. This is a very logical
result, since possible road closures of these parts of the network will result major
detours through the urban and rural road networks.
2. The connections of the main land with Peloponnesus (through the Rio-Antirio
bridge and the Athens-Korinthos corridor) are both very significant for the road net-
work efficiency of Greece, since the closure of either one of these connections entails
very high detours and delays for drivers (see scenarios of link closures of the next
paragraph).
3. Along the main road corridor of Greece from Athens to Thessaloniki, the criticality
of the national road network differs in importance. Specifically, the northern part of
the national road (approaching Thessaloniki) seems to be more critical than the part
near Athens. This interesting result can be explained by the different density of the
road network, and namely, a link closure in the broader Athens area will not create
many delays due to the different alternatives (roads) that exist. On the contrary, the
northern national road network, and especially in the area of Tempi (see scenarios of
the next section), does not have many alternative routs and potential link closures at
these points could entail major detours and travel time delays.
The assessment of network criticalities for Germany highlights two different types of
network parts, which are critical in case of disruption (Map 2). These are:
1. Links around the big agglomerations. From the map the locations of the four most
densely urban areas, i.e. Berlin, Hamburg, Cologne and the Ruhr area, Munich
and Stuttgart are visible. Here the closure of urban access link will have a great

WEATHER D2: Vulnerability of Transport Systems
43
impact on the overall performance of the network due to the affected traffic volume
alone. This is remarkable as usually around big agglomerations the network densi-
ty is high and thus multiple alternative travel routes exist. But in the case of the
listed agglomerations considerable congestion makes these detouring options less
attractive or impose even more time losses by adding to anyway critical levels of
service.
Relevant connecting rouges in remote areas. Examples from the computation are
the route from Munich to Austria in the very south-east, the Baltic sea motorway
(A20) around Rostock in the north-east, the connection from Cologne and Aachen to
the Netherlands in the north-west or finally the south-western routes through Rhein-
land-Palatinate and the Saarland to France and Luxembourg. All these routes are
characterized by a moderate traffic volume, but little alternatives. Accordingly, detour-
ing is time consuming and thus boosts the criticality indicator upwards.
For the Netherlands (Map 3) the same analysis as for Germany holds:
1. Around the big agglomerations, in particular Rotterdam and Arnheim into the direc-
tion of Utrecht is a particularly critical area. This is not surprising as the Port of Rot-
terdam is the heart of European maritime shipping and at the same time an impor-
tant population centre. Surprisingly not all of the heavily congested Randstad re-
gion is equally critical in terms of road closures, which confirms the conclusion that
the specific role of the Rotterdam port strongly determines the model outputs.
2. Following the pattern identified for Germany, the critical inter-urban links can be
identified in rather sparkly populated remote area. Such, the criticality assessment
delivers the road link between Zwolte and Assen / Groningen in the north and from
Einthoven and Venlo to Germany in the south-western corner of the country as
particularly costly in terms of deterioration or closure.

WEATHER D2: Vulnerability of Transport Systems
44
Figure 10: Criticality assessment for the network of Greece

WEATHER D2: Vulnerability of Transport Systems
45
Figure 11: Criticality assessment for the network of Germany
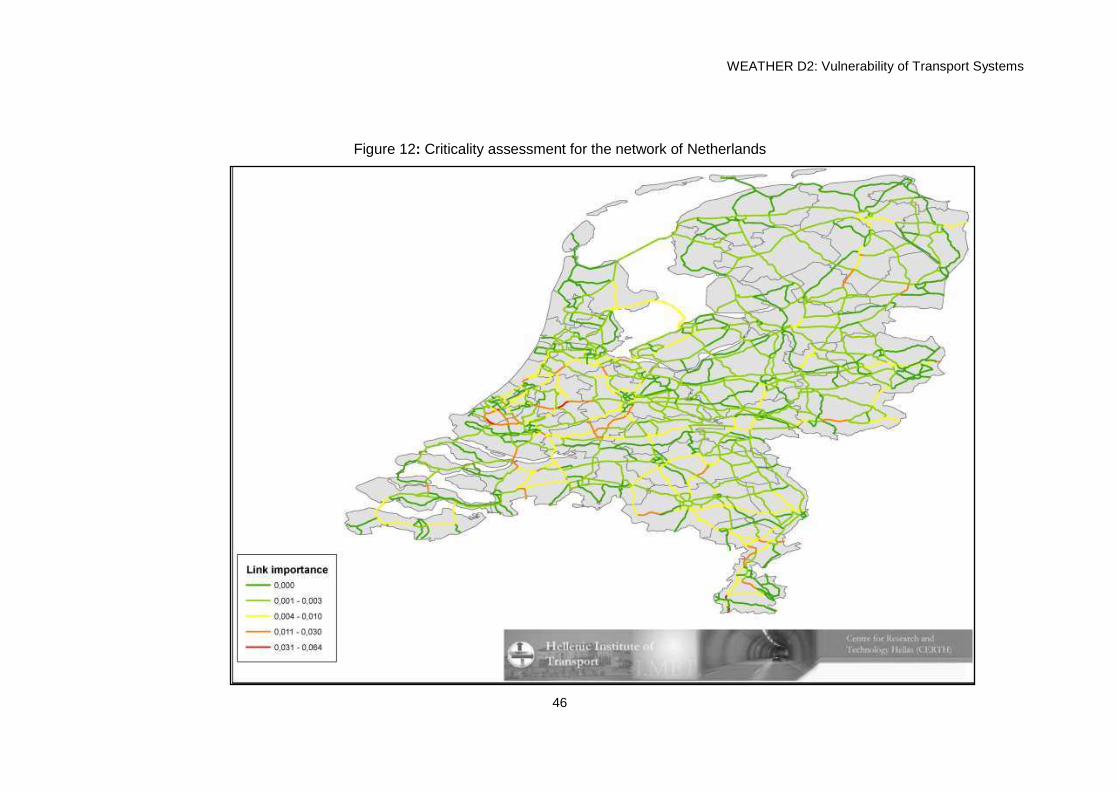
WEATHER D2: Vulnerability of Transport Systems
46
Figure 12: Criticality assessment for the network of Netherlands

WEATHER D2: Vulnerability of Transport Systems
47
4.5 Application of the method for simulating scenarios of road failures in the three networks and assessing the
impacts
In this application, various scenarios of link closures have been tested for calculating
and comparing the impacts on the networks. For each scenario, the new traffic vo-
lumes and the respective travel times were calculated, providing useful insights in
relation to the different groups of links. The overall results for each scenario are pre-
sented in Table 1 that follows. A more detailed presentation of the results is provided
in the Annex of the WEATHER Detailed Report.
The methodological approach followed the same rationale; a first scenario ran in
VISUM for the road network of each country, which constituted the base case scena-
rio (with no link closures - normal conditions). All base case characteristics of the
road networks were computed (total veh/kms, veh/hours). Then, iterative runs have
been realized, one for each different scenario (group of links closure). Each scenario
has given different results in terms of time delays (in comparison with the base case
scenario), total veh/kms and total veh/hours realized.
The results shall provide additional detour distances and times by network characte-
ristic and demand level to the assessment of costs of extreme weather events in the
road sector. Further the results shall raise general awareness towards impacts of
extreme weather events, which might get more severe and more frequent in the fu-
ture.

WEATHER D2: Vulnerability of Transport Systems
48
Table 4:Results for the base case scenarios (with no link closures)
Country No of links modeled Total length (kms) Total Vehicle Kilometers (annual, in millions) Total Vehicle Hours (annual, in millions)
Germany 6.540 53.935 142.703,03 1.500,72
Netherlands 1.336 7.842 35.919,68 510,91
Greece 415 8.811 8.686,85 82,83
Table 5: Overall presentation of results from different scenarios
5 Workshop 1: Transport System Vulnerability
To date, two workshops have been carried out in the framework of the WEATHER pro-
ject turning around the topic of transport sector vulnerability to climate and weather:
Kick-off workshop 17.11.2009 in Brussels and
Workshop 1, 14.9.2010 in Brussels
The following paragraphs provide a brief overview of the contents of the workshops.
The respective presentations may be accessed through the weather website at
www.weather-project.eu/weather/inhalte/proj-events.php.
5.1 The Insurance Sector
At the WEATHER kick-off workshop on November 17th 2009 in Karlsruhe, Petra Löw
(Munich-RE) emphasized the climate change research for the insurance business. The
NatCatSERVICE database contains roughly 26000 entries back to 1950 and covers
overall and insured losses, but does not differentiate between sectors. The main driver
for the strong increase of damages and victims reported are socio-economic factors
rather than climate change. But the extraction of climate trends is enforced in co-
operation with the London school of Economics. Main difficulties are encountered with
national biases in data reporting and the long delays in data provision, which in some
cases exceeds 10 years. Transport is generally encoded under the heading ―marine
business‖; specific evaluations of transport losses in the heat summer 2003 lead to
insured losses due to the interruption of transport activities of €40 million.
5.2 Road and urban public transport
Among the various climate conditions affecting the Swedish road sector, Kenneth Na-
tanaelsson (Trafikverket) lists temperature, rainfall, wind, winter, fooding and sea level
rise. But among these impacts related to water are the most costly. A detailed assess-
ment of landslide activity raises major safety concerning in the southern Part of Swe-
den already in the near future. Major impacts of storm surges and intensive rain on
small catchment areas on bridge will cause high costs. Improvement of competences
and knowledge on vulnerabilities and the review of rules and regulations is the neces-
sary way forward to prevent from major losses. Presented is the Swedish risk assess-
ment model including direct and indirect risk, such as the impact of delayed or can-
celled trips on companies and their reputation).
©©Roberto Arditi (SINA on behalf of ASECAP, the Association of European Toll Mo-
torway Operators) highlights the importance of roads to access emergency areas,

WEATHER D2: Vulnerability of Transport Systems
50
commonly substituting other modes. Thus, the restoring of road sections may be very
rapid, as in the case of the Autostrada Turin – Milan after the summer flood 2000 taking
only 14 days. A means of increasing knowledge on infrastructure conditions and dam-
ages is the equipment of vehicles with LASER measurement technology for high-speed
road observation and the instant generation of digital maps through point clouds. In
snow conditions motorway capacity per lane may drop by 75%, entailing long-range
traffic obstructions. Due to climate change the number of very hot days will increase
with impacts on road construction practices and the termal expansion of bridge joints
and pavements. On the other hand a decrease in very cold days may positively impact
snow removal costs and the environmental impact from salt. But the main problems will
be encountered with increased precipitation causing floodings, overload of drainage
systems, wash-out. landslide affecting the structural integrity of roads, bridges and
tunnels.
Matthew Webb (TfL) presented TfL‘s strategy for assessing and adapting to climate
change. Climate conditions assumed until 2050 include temperatures rise by 3°C with -
30% to -40% rainfalls in summer, +1.5 to -2.3°C and +25% to -30% rainfalls in winter,
rising sea level and more extreme events. Most penalising events in the recent past
were the summer heat 2003, 2007 rainfalls and the longest frost and snow periods in
the two past winters (2009/2010 and 2010/2011. The list of risks of assets to climate
change identified by TfL embraces tracks, drainages, bridges, embankments, signals,
stations, green estate, surface and interchanges. Most important in the process of
adapting to changing climate conditions is the internal and external communication,
time table setting, emergency planning and the consideration of customer comfort.
Existing activities by TfL include flood risk assessment, road drainage works, under-
ground groundwater management and tunnel cooling. Early results from TfLs risk as-
sessment report suggest that all weather risks, including heat, snow and ice, and high
winds are manageable with some consideration in the rail sector. Concerning under-
ground very hot days and rain and flooding are serious risks with a very high likelihood
to occur in the future and a high impact level.
5.3 Rail and intermodal freight transport
In the second session on railway and intermodal transport at the September workshop
Chris Baker (University of Birmingham) discussed findings of the FUTURENET project
funded under UK‘s EPSRC ―Adaptation and resilience to climate change‖ programme.
The effects of high temperatures on track (buckling,etc), the effects of high rainfall on
earthworks, the effects of extreme precipitation levels on current drainage systems,
and the effects of extreme winds on the overhead system are the major effects that are

WEATHER D2: Vulnerability of Transport Systems
51
likely to be of concern to the railway industry in future. Hot dry summers impact the UK
rail system by increased track buckling, desiccation of track earthworks, increased ven-
tilation problems on underground railway systems and increased vegetation because of
longer growing season. Warmer, wetter winters cause increased surface water and
flooding and increased frequency of landslips, scours and washouts. Related costs in
the London underground system between 1999 and 2004 caused costs due to passen-
ger delays of around €10 million. Increasing in the frequency of extreme storms includ-
ing intense rainfall and extreme winds increase the likelihood of dewirement, of train
overturning derailment and of accidents or network disruption and track blockage. The
FUTURENET project looks at these impacts in detail and seeks to work out solutions to
improve the resilience of UK transport systems to changing climatic conditions.
French experiences with the vulnerability of railway infrastructure was presented by
Samuel Brunet (RFF). Problems encountered include increased rain- and snowfalls
resulting in damage on earthworks and structures, more and more serious storms re-
sulting in troubles in electric and signalling systems and causing in tree falling and
catenary injuries. Humidity affecting tunnel and earthwork fragility, and flooding impos-
ing additional risk on embankments, fundaments, seawalls and electric facilities and
further consequences of changes in precipitation patterns. Termperature-related prob-
lems include heatwaves as well as general changes in temperature (rail dilatation, elec-
tric systems failures). Consequences include dryness with increased risks for structure
fundaments on clay and nearby rivers. On the contrary, coldwaves cause rail contrac-
tion, problems with catenaries and ice in electric systems. A study assessing the three
main lines in the Aquitaine Arc (Bordeaux) should be finalised by the 2nd quarter of
2011 with similar studies to follow.
Turning towards combined road-rail freight transport, Martin Burkardt (UIRR) stresses
the several problems railway operations encounter under adverse weather conditions.
Weather extremes have effects on infrastructure (e.g. lines, overhead lines), on termi-
nal operation (swinging loads), on rolling stock and on loading units due to falling
trees/branches, inundation of rail tracks and routes. Because of storms accompanied
with falling trees etc. there are delays or stops of operation. Transalpine Railways have
to handle landslides, avalanches and storms. Due to weather extremes transalpine
railways close tracks in winter. Example: in the year 2002 there were landslides on the
route line Bellinzona - Luino - Gallarante (DE – CH – IT) – the landslides cause two
closure of this route for several weeks. Afterwards to line Bellinzona – Luino – Galla-
rante was reconstructed with galleries and fixing slopes. The monetary impact of op-
erational disruptions and infrastructure damages are widely unknown and should be
approached by current research activities.
WEATHER D2: Vulnerability of Transport Systems
52
5.4 Air transport
Henrik Littorini (Swedavia) highlights two reports dealing with the consequences of
climate change for the Swedish air transport sector: ―Vulnerability analysis report from
the aviation sector‖ (LFV, Swedish Civil Aviation Authority, 2007) and ―The Conse-
quences of Climate Change and Extreme Weather Events‖ (Swedish Government Offi-
cial Report, 2007). Among the several weather and climate impacts assessed by these
reports, in the past decade storms during winter season are the main extreme weather
events that has (during short periods of time) affected Swedish air traffic. The main
problems of heavy snowfalls are visibility, friction and passenger access to the airports.
While current measures include a over-dimensioning of snow clean-up and cooperation
with road and rail authorities, climate forecasts indicate less snowfall for Scandinavia.
Flooding and sea level rise is only considered problematic for a few smaller airports
with old or under-dimensioned storm water systems and drainages. in the coming 50
years adaptation costs of €20 million are estimated to cope with the projected increase
in precipitation, but these will largely part of continuous renovation activities. Frost is
the main determinant for the dimensioning of runway superstructures. As climate mod-
els indicate warmer winters there are not additional costs of climate change to be ex-
pected. The problem of ice is more differentiated: there will be more days calling for de-
icing and skid prevention, but less in the southern part. The overall need for de-icing
and skid reduction will thus decrease, associated with cost savings of €5 million annu-
ally in 2050. A major problem for aviation are thunderstorms causing cross-winds and
the drop of power supply. The lack of alternative airports in easy reach, the non-
availability of reserve power systems and the dependency on computer systems makes
airports particularly vulnerable. Adaptation costs are probably high, while information of
climate models on the development of thunderstorms is hardly available. Finally, ash is
raised being a problem to different parts of aircraft, as the measurement of ash concen-
tration is still not satisfying and due to lacking co-ordination in the European airspace.
The perspective of air traffic control was introduced by Rachel Burbidge and Dennis
Hart (Eurocontrol) by stressing on the impacts of the past winter. Reported are drops of
aircraft movements by 0.5% in Frankfurt and heavy delays, cancellations and flight re-
routing in Paris. The seasonal difference in weather-related ATFM-delays are consid-
erable: the shares at all AFTM delays have e.g. varied between 17.6% in December
2009 to 55.0% in January 2010, clearly indicating the winter storm Daisy over Europe.
But ATFM delays are primary delays which are the result of an imbalance between
demand and available capacity en-route or at airports and thus depend more on airport
and en-route capacities than on weather. At annual primary departure delays roughly
4% are due to AFTM-related weather and another 6% are reported weather delays by
WEATHER D2: Vulnerability of Transport Systems
53
the airlines. Total annual delay costs amounted to €1.5 billion in 2008. Future chal-
lenges of ATC are three times more traffic, safety and environmental improvements by
10% while cutting costs by 50%. This shall be reached by a co-operative trajectory
management of flight paths. Therefore, MET services need to move from a problem-
focussed view and the wait-and-see approach using information systems designed in
the 1950s towards as system of ―mapping uncertainty with a high level of confidence‖.
In this system weather delays will not be prevented, and thus become more predict-
able. Climate change was considered a problem for the first time in the Eurocontrol
work ―Challenges of Growth‖ 2008 by discussing sea level rise impacts for airports,
increased storminess and climate-driven demand changes. In Europe 34 airports are at
risk through sea level rise with impacts on runway capacity, ground transport access
routes and global knock-on effects. A useful indicator for storminess is the Convective
Available Potential Energy (CAPE), indicating a strong increase (3 days / a) until 2020,
but a potential fall under current conditions until 2050. For spring and autumn predic-
tions show significantly increasing trends until 2020 as well as 2050.
5.5 Inland navigation and maritime shipping
Ina final session Nina Nesterova and Jan Kiel presented the study teams approach to
address the economic costs of weather extremes for inland navigation and maritime
shipping. The main treats identified for IWW are droughts, floods and ice periods, caus-
ing suspensions of navigation and imposing considerable costs to the future develop-
ment of the sector. For maritime shipping the main stresses are heavy rain, storms,
floods and ice periods. Infrastructure damage statements of the ports and insurance
reports will most likely uncover considerable burdens.

WEATHER D2: Vulnerability of Transport Systems
54
PART B: MODAL ASSESSMENTS
6 Road infrastructure and operators
6.1 Evidence from literature
A literature review was conducted on the impacts of extreme weather conditions on the
road sector. The review revealed that a large number of studies had been conducted in
the USA, Australia and New Zealand, while European research may be regarded as
rather piecemeal.
1. Damages to infrastructure assets: Various studies from North America and Aus-
tralia estimate the weather impacts on the road infrastructures. The shares vary from
10% to 72% which is due to the different climatic conditions and road types. Damages
may be caused by (i) precipitation and floods, (ii) storms, and (iii) winter conditions.
Even though large evidence from North America and Australia is provided, general
conclusions costs are difficult to draw, since local conditions vary, and often special
events are described.
The US Federal Highway Administration estimates the repair costs on its network
caused by snow and ice at 5 bn US$ annually. With an average of 81 frost days, the
damages amount to 62 m US$ per frosty day. One of the most severe weather condi-
tions caused extensive flooding in parts of England in from December 2009 to January
2010 and March 2010. The total cost to return the road network to its prior condition
amount to £3.743m, which is 5,714 £ per kilometre. The effects of strong winds are
rarely researched. However, some evidence from the hurricane Katrina in New Orleans
2005 might be used as exemplary evidence.
2. Infrastructure management and operations: Winter maintenance is an essential
cost component of infrastructure management and operations. Norway spends roughly
30% of its maintenance budget for winter maintenance, Slovenia reports a share of
50%, while in Switzerland these costs can amount to 15% - 25% of total annual main-
tenance costs.
In Germany winter maintenance on federal roads ranges between 2,000 and 10,000
Euro per kilometre on highways. Average cost amount to 5,000 €/km on motorways
and 1,300 €/km on land highways. A regression over the number of snow days reveals
that on motorways the fixed annual costs amount to €4251 per km and variable costs

WEATHER D2: Vulnerability of Transport Systems
55
per snow day of €99. In result we receive 28% weather-related costs at motorways and
25% at federal trunk roads.
3. Vehicle assets: The literature on weather impacts on vehicle assets is scarce.
Some evidence may be found about hail storms. A thunderstorm in Australia in 1999
entailing winds, rains, and in particular, a large hail, damaged 24,000 homes and
70,000 automobiles along its path. The insured loss totalled AUD$1.7 billion (US$1.04
billion), and this cost remains the largest absolute insured loss in Australian history.
The damage costs for hail on cars may be considerable. Car receive 30-400 dents dur-
ing a hail storm. Insurances prefer a method to mechanically buckling the dents without
destroying the varnish of the car. The costs in Europe amount to 40-70€ per dent. Thus
minimum costs amount to 1200 Euro. The insurance costs for hail damages in the USA
amount to 2000 -3000 US$.
4. Safety issues: Even though research has shown that motorists adjust their road
behaviour during bad weather, there is overwhelming evidence, that accident risks in-
creases during rains and snow. In this case the research evidence stems from Europe
countries: Research in the Netherlands which gives clear indications that precipitation
and temperature are the most important factors, when examining the relationship of
weather and road safety in both summer and winter. A great amount of precipitation, as
either rain or snow, generally accompanies a higher victim rate for all modes of trans-
port, and a smaller exposure, especially for cyclists.
The more rain, snow, or hail falls, the less the friction of the road surface. Rain can lead
to dynamic aquaplaning. A layer of water on the road surface can cause the vehicle to
lose contact with the road surface and to skid. The chance of aquaplaning depends on
the skidding resistance of the road, but of course also on the vehicle's speed and tyre
tread depths. Based on literature, one can assume that the crash rate approximately
doubles during rain.
Research in the USA. reveals that in terms of crash frequency, rate, and severity; wet
weather is far more dangerous than winter weather. Drivers travel much slower when
faced with winter weather, compared to rainy weather. However, ice on Dutch National
State Roads increases the number of accidents of between 77% and 245%. These
findings are confirmed through research in the USA.
Evidence linking high temperatures to road crashes is sparse. A German study found
out that with increasing heat above 27° the average accident rates in urban areas in-
creases by 11%, with 32° by 22%. In rural areas the increase is much lower. Here ex-
treme heat above 37° increases accident rates by 18%.

WEATHER D2: Vulnerability of Transport Systems
56
5. Congestion and delays: Research on the impacts of bad weather conditions on
road congestion and delays has been intensively done in the USA, while little evidence
may be found in Europe. The US Federal Highway Administration concludes that rain
causes wet pavement, which reduces vehicle traction, manoeuvrability, visibility dis-
tance and thereby prompt drivers to travel at lower speeds causing reduced roadway
capacity and increased delay.
Various studies in the USA reveal traffic flow reductions due to winter conditions. The
flow reductions range between 7% and 56% and speed reductions between 3% and
40%. Research in Europe observes reduced traffic speeds by 7 % in the Netherlands
and capacity reduction by 10%-60% during snowfall on German motorways.
Research in the Netherlands reveals that strong winds reduce traffic speed by about 3
percent on average. During rains speed are reduced by 2%-17% according to several
studies in the USA.
6. Impacts of Climate Change on the Road Sector: Warming winter temperatures
will bring about reductions in snow and ice removal costs, lessen adverse environ-
mental impacts from the use of salt and chemicals on roads and bridges, extend the
construction season, and improve the mobility and safety of passenger and freight
travel through reduced winter hazards. Expected increases in temperature extremes,
however, will have less positive impacts. More freeze–thaw conditions may occur, cre-
ating frost heaves and potholes on road and bridge surfaces and resulting in load re-
strictions on certain roads to minimize the damage. With the expected earlier onset of
seasonal warming, the period of springtime load restrictions may be reduced in some
areas but is likely to expand in others with shorter winters but longer thaw seasons.
Periods of excessive summer heat are likely to increase wildfires, threatening commu-
nities and infrastructure directly and bringing about road and rail closures in affected
areas. Longer periods of extreme heat may compromise pavement integrity (e.g., sof-
tening asphalt and increasing rutting from traffic) and cause thermal expansion of
bridge joints, adversely affecting bridge operation and increasing maintenance costs.
The most immediate impact of more intense precipitation will be increased flooding of
coastal roads. Low-lying bridge and tunnel entrances for roads, rail, and rail transit will
also be more susceptible to flooding, and thousands of culverts could be undersized for
flows. Engineers must be prepared to deal with the resulting erosion and subsidence of
road bases and rail beds, as well as erosion and scouring of bridge supports. Interrup-
tion of road traffic is likely to become more common with more frequent flooding. When
precipitation falls as rain rather than snow, it leads to immediate runoff and increases

WEATHER D2: Vulnerability of Transport Systems
57
the risk of floods, landslides, slope failures, and consequent damage to roadways, es-
pecially rural roadways in the winter and spring months.
6.2 The incident cost database
To bridge the non-availability of systematic damage records in the largely public Euro-
pean road network we have conducted a review of press and transport sector publica-
tions in Germany, Austria, Switzerland, Italy, the Czech Republic and the UK, contain-
ing 974 incident reports for the years 2000 to 2010. In conjunction with the evidence
from literature and further data sources, the damage cost database shall help the en-
trepreneurial and social costs of extreme weather events to infrastructure providers,
transport operators, users and society.
Where not directly reported, entrepreneurial and social costs were assessed by a set of
standard cost values. These are defined along weather extreme and consist of simple,
as well as more complex composite events and provide default costs to each of the six
transport sector elements. The sections in turn go through selected assessment princi-
ples of the standard cost values and their generalisation:
Road infrastructure assets are subject to multiple stress factors, including traffic,
physical aging and weather. We distinguish between sudden destructions due to floods
or storms, were we apply 50% of the gross asset value for age deterioration, and par-
tial damages, were usually traffic, insufficient maintenance and weather are responsi-
ble for damages. Here we deduct the weather-related share by another 50%.
Table 6: Evaluation principles for infrastructure assets
Event category
Type of impact Net cost value Cost allocation Regional dispari-ties
Flood Inundation and landslides on roads and bridges
Average damage data from ASFINAG (AT), CZ, FR (Loire 2000) and DE (Elbe 2002)
Sudden dam-age, mainly re-pair costs: 100% allocation to weather
Assessment of specific events; differentiation by GDP/capita
Storms Mainly damages to bridges
Data from US (Katrina, Rita 2005)
Winter conditions
Deterioration of pavements and main course
Damage reports from German communities: 7800€/km average, 2000€/km coastal area
Continuous de-terioration (50%) and mix of im-pacts (70% weather related)
Higher gross damage with lower allocation per frost day in southern areas
Heat Softening, crack-ing and bubbles in pavement
Standard pavement costs from German accounts (500 k€/km)
Age (50%) and weather (Austra-lia / US): 40%
Only relevant for central Europe and Scandinavia
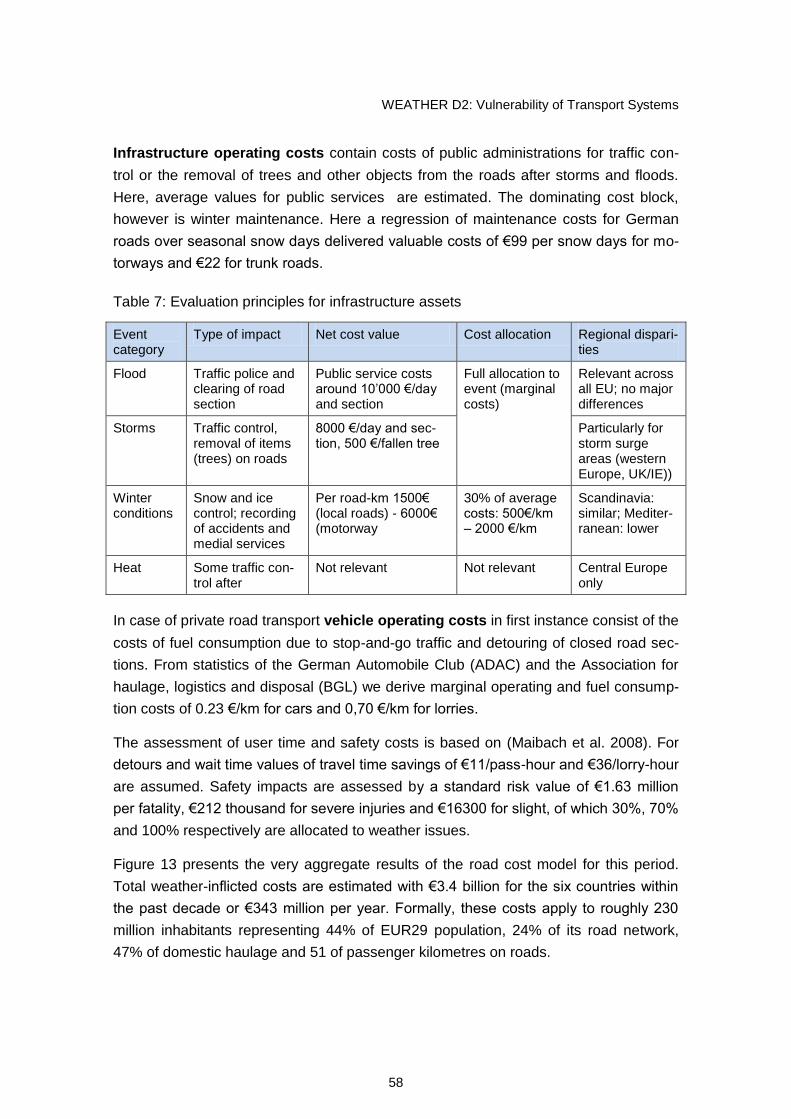
WEATHER D2: Vulnerability of Transport Systems
58
Infrastructure operating costs contain costs of public administrations for traffic con-
trol or the removal of trees and other objects from the roads after storms and floods.
Here, average values for public services are estimated. The dominating cost block,
however is winter maintenance. Here a regression of maintenance costs for German
roads over seasonal snow days delivered valuable costs of €99 per snow days for mo-
torways and €22 for trunk roads.
Table 7: Evaluation principles for infrastructure assets
Event category
Type of impact Net cost value Cost allocation Regional dispari-ties
Flood Traffic police and clearing of road section
Public service costs around 10‘000 €/day and section
Full allocation to event (marginal costs)
Relevant across all EU; no major differences
Storms Traffic control, removal of items (trees) on roads
8000 €/day and sec-tion, 500 €/fallen tree
Particularly for storm surge areas (western Europe, UK/IE))
Winter conditions
Snow and ice control; recording of accidents and medial services
Per road-km 1500€ (local roads) - 6000€ (motorway
30% of average costs: 500€/km – 2000 €/km
Scandinavia: similar; Mediter-ranean: lower
Heat Some traffic con-trol after
Not relevant Not relevant Central Europe only
In case of private road transport vehicle operating costs in first instance consist of the
costs of fuel consumption due to stop-and-go traffic and detouring of closed road sec-
tions. From statistics of the German Automobile Club (ADAC) and the Association for
haulage, logistics and disposal (BGL) we derive marginal operating and fuel consump-
tion costs of 0.23 €/km for cars and 0,70 €/km for lorries.
The assessment of user time and safety costs is based on (Maibach et al. 2008). For
detours and wait time values of travel time savings of €11/pass-hour and €36/lorry-hour
are assumed. Safety impacts are assessed by a standard risk value of €1.63 million
per fatality, €212 thousand for severe injuries and €16300 for slight, of which 30%, 70%
and 100% respectively are allocated to weather issues.
Figure 13 presents the very aggregate results of the road cost model for this period.
Total weather-inflicted costs are estimated with €3.4 billion for the six countries within
the past decade or €343 million per year. Formally, these costs apply to roughly 230
million inhabitants representing 44% of EUR29 population, 24% of its road network,
47% of domestic haulage and 51 of passenger kilometres on roads.
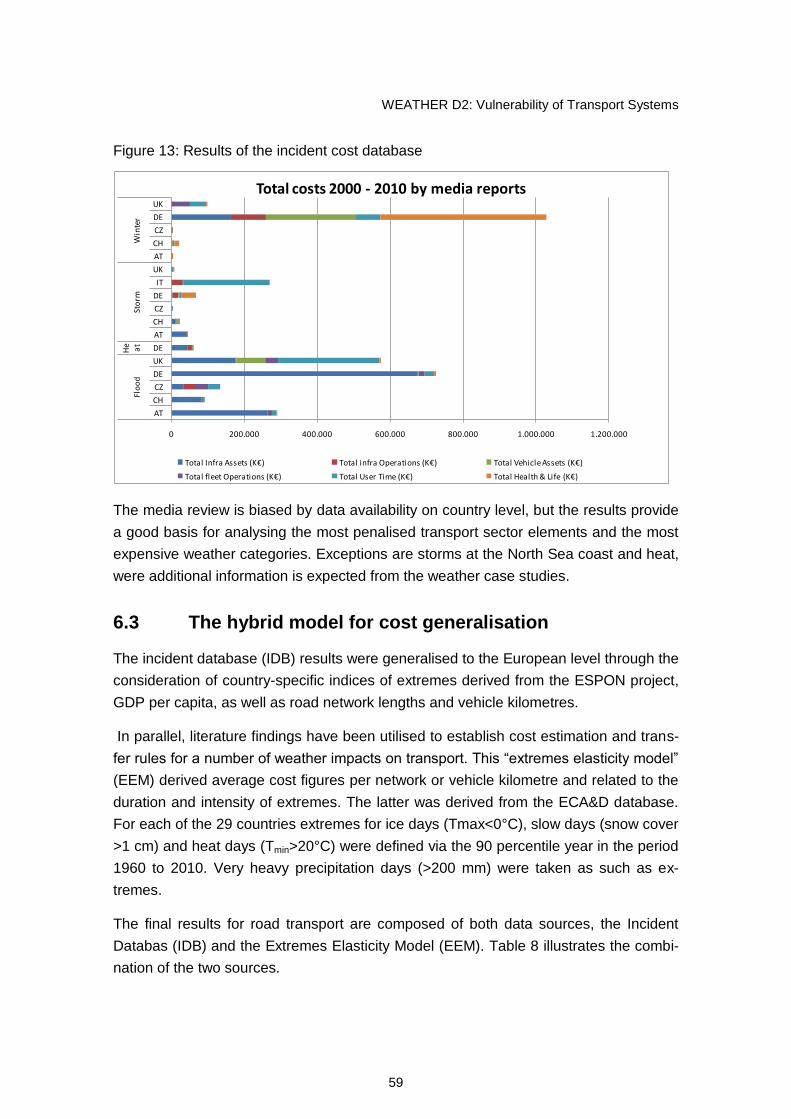
WEATHER D2: Vulnerability of Transport Systems
59
Figure 13: Results of the incident cost database
0 200.000 400.000 600.000 800.000 1.000.000 1.200.000
AT
CH
CZ
DE
UK
DE
AT
CH
CZ
DE
IT
UK
AT
CH
CZ
DE
UK
Flo
od
He at
Sto
rmW
inte
r
Total costs 2000 - 2010 by media reports
Total Infra Assets (K€) Total infra Operations (K€) Total Vehicle Assets (K€)
Total fleet Operations (K€) Total User Time (K€) Total Health & Life (K€)
The media review is biased by data availability on country level, but the results provide
a good basis for analysing the most penalised transport sector elements and the most
expensive weather categories. Exceptions are storms at the North Sea coast and heat,
were additional information is expected from the weather case studies.
6.3 The hybrid model for cost generalisation
The incident database (IDB) results were generalised to the European level through the
consideration of country-specific indices of extremes derived from the ESPON project,
GDP per capita, as well as road network lengths and vehicle kilometres.
In parallel, literature findings have been utilised to establish cost estimation and trans-
fer rules for a number of weather impacts on transport. This ―extremes elasticity model‖
(EEM) derived average cost figures per network or vehicle kilometre and related to the
duration and intensity of extremes. The latter was derived from the ECA&D database.
For each of the 29 countries extremes for ice days (Tmax<0°C), slow days (snow cover
>1 cm) and heat days (Tmin>20°C) were defined via the 90 percentile year in the period
1960 to 2010. Very heavy precipitation days (>200 mm) were taken as such as ex-
tremes.
The final results for road transport are composed of both data sources, the Incident
Databas (IDB) and the Extremes Elasticity Model (EEM). Table 8 illustrates the combi-
nation of the two sources.

WEATHER D2: Vulnerability of Transport Systems
60
Table 8: Data availability for cost generalisation
Overview of the availability of cost estimates in road transport due to extreme weather conditions:
EEM: Extremes elasticity model
IDG: Incident Database Generalisa-tion
Ra
infa
lls
Flo
ods /
fla
sh
flo
ods
Ma
ss m
ove
men
ts
Extr
atr
op
. cyclo
ne
s
Sto
rm s
urg
es
Ha
il an
d h
ail
sto
rms
Fro
st p
erio
ds
Sn
ow
Win
ter
Sto
rms
He
at
pe
rio
ds
Dro
ug
hts
Wild
fir
es
Infrastructure assets
Infrastructure operations
Vehicle assets
Transport service operations
Safety issues
Congestion and delays
Data sources: EEM IDB Both No data Irrelevant
6.4 Total costs for Europe 2010
Total costs amount to roughly €1.8 billion in an average year. Related to passenger
and freight performance in the 29 countries considered, this is roughly 0.1 €-Cent per
vehicle kilometre. To put this value into relation: motorway tolls in many European
countries raising them range between 5 and 10 €-Ct./km. Moreover, the costs of CO2
emission amounts to roughly 1 €-Ct/vehicle-km.
Heavy rain and floods account for the highest mean annual costs, followed by winter
conditions with only little difference. Both account for roughly €800 million annually.
Storms and storm surges (€175 million) and heat, drought and wild fires (€47 million)
appear of comparably limited importance.
By far the most hit transport sector element are infrastructure assets (53% of total
costs), followed by user time losses (16%) and safety implications (13%). Looking at
both dimensions, rain and flood impacts on road infrastructure, accounting to 35% of
total costs, dominate all other consequences of weather extremes. Most affected re-
lated to vehicle kilometres are Scandinavia and France.
Turning towards the regional distribution of costs we can identify the hot spots for
weather extremes in the central altitude of continental Europe reaching from France to
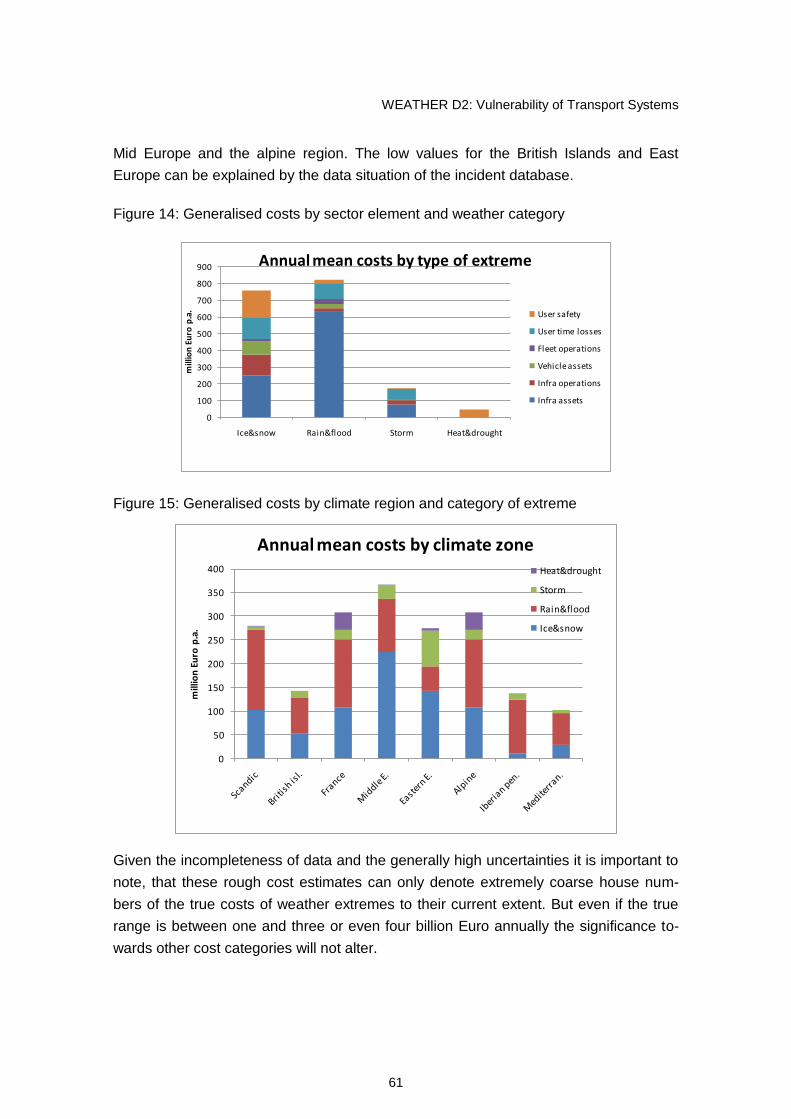
WEATHER D2: Vulnerability of Transport Systems
61
Mid Europe and the alpine region. The low values for the British Islands and East
Europe can be explained by the data situation of the incident database.
Figure 14: Generalised costs by sector element and weather category
0
100
200
300
400
500
600
700
800
900
Ice&snow Rain&flood Storm Heat&drought
mill
ion
Eu
ro p
.a.
Annual mean costs by type of extreme
User safety
User time losses
Fleet operations
Vehicle assets
Infra operations
Infra assets
Figure 15: Generalised costs by climate region and category of extreme
0
50
100
150
200
250
300
350
400
mill
ion
Eu
ro p
.a.
Annual mean costs by climate zoneHeat&drought
Storm
Rain&flood
Ice&snow
Given the incompleteness of data and the generally high uncertainties it is important to
note, that these rough cost estimates can only denote extremely coarse house num-
bers of the true costs of weather extremes to their current extent. But even if the true
range is between one and three or even four billion Euro annually the significance to-
wards other cost categories will not alter.

WEATHER D2: Vulnerability of Transport Systems
62
7 Rail infrastructure and operators
7.1 Evidence from literature
The latest review of high summer temperatures due to climate change on buckling and
rail related delays in the south-east Kingdom is provided by the FUTURE-NET project
(K. Dobney, C. J. Baker, A. D. Quinn and L. Chapman, 2009). Estimates have shown
that 20% of all unplanned delays on the UK rail network are the cause of present day
adverse weather conditions. Due to climate change weather related problems such as
buckling, flooding due to inadequate drainage, sudden earthworks failure, scour at the
base of bridges and damage to overhead wires; Eddowes et al., 2003) will occur with
increasing frequency on the network.
Increased incidences of rail buckles are associated with extreme high temperatures. In
the UK extreme high temperatures becoming an increasingly frequent occurrence. As a
consequence of extreme high temperature the number of buckles, and therefore de-
lays, will increase if the track is maintained to the current standard.
A buckle is any track misalignment serious enough to cause a derailment (ORR, 2008).
Although railway track is pre-stressed to withstand a reasonable temperature range
(Chapman et al., 2006, 2008), extremes of temperatures can cause both jointed track
and continuously welded rail to buckle due to the forces produced by the metal expand-
ing. The threshold at which a rail may buckle is highly dependent on the condition of
the track. Tracks in good condition would not be expected to buckle until 39°C ambient
air temperature. In contrast for track in bad condition the track is at risk at 25°C.
An additional increase in delays can also be noted at lower temperatures. Cold weather
poses an alternative set of problems for the rail network such as frozen points, and
damaged rails due to tension cracking.

WEATHER D2: Vulnerability of Transport Systems
63
Figure 16: Number of delay minutes attributable to ‗buckle‘ events recorded in the
ADB1 for London and the south-east and the maximum temperature reached on the
day of occurrence.
Weather analogues: the 2003 heat wave
August 2003 was an exceptionally hot month in Europe and caused a great deal of
damage in many sectors. This extreme weather can clearly be detected in the ADB
where 137 railway buckles were reported compared to the long-term average of 30. in
the south-east region of the United Kingdom. From the period between 14 May and 18
September 2003, 165 000 delay minutes were considered attributable to heat-related
incidents. This figure is significantly higher than for the summer of 2004 which is con-
sidered ‗normal‘ with only 30 000 delay minutes recorded. The difference between the
2 years is largely attributed to the exceptionally hot conditions during August 2003.
The cost of the 130 000 additional delay minutes was estimated to be in the region of
£2.2 million, which gives an average outlay of £16.70 per delay minute. However, this
figure is conservative. It is based on UK-wide averages used to derive the cost of a
delay minute based on train-related delays. It does not include the cost of materials or
labour for infrastructure repairs. An analysis of the cost of weather related seasonal
delays performed by Rail Safety and Standards Board used a notional value of £50 per
delay (Eddowes et al.,2003). The evident limitations of deriving a cost based solely on
average train and passenger profiles indicates that using the value of £50 cost per de-
lay minute will produce more realistic costing.
1 ADB (alterations database) is a record of all incidents that have caused delay minutes on the railway in the United Kingdom.

WEATHER D2: Vulnerability of Transport Systems
64
7.2 Cost estimation methodology
Entrepreneurial costs. Extreme weather events have been selected out of the gath-
ered databases and media reviews. Data entries have always been clustered to one
weather event. So for instance all cases described in the Swiss database that belong to
one weather event are clustered and finally summed up to one cost value (even if the
costs have been calculated for each case separately).
Infrastructure damages. Rail infrastructure damage or replacement costs are either
taken over from existing data bases and information from media reports or calculated
for those cases where damage or replacement costs are not reported.
The calculation for these damages without existing cost information is based on the
following indicators:
Replacement costs per average track-kilometre (not network-kilometre!)
Information on destroyed network-length
Information on type of network (single-track or multiple track respective main line
or secondary line)
Increased service operation costs. Increased operating costs can be caused by dif-
ferent reasons:
Detouring costs of passenger transport (costs for rail replacement bus services)
Revenue loss if passengers are not able to use the railway at all (no installation
of a rail replacement bus service) or if passenger use other modes (private
cars) or cancel their trips due to missing ―normal‖ rail services.
Detouring costs of freight transport (detouring of long distance freight via other
rail routes)
Costs for cleaning up the rail track due to heavy snow falls
Costs for Cleaning up of tracks. The last part of the operation costs to be considered
are only relevant for closure of rail tracks due to heavy snow fall – the necessary addi-
tional snow cleaning to be able to open the tracks as soon as possible. For this calcula-
tion it is necessary to know the affected net work length per event that has to be
cleaned and the average cost per network-km for snow cleaning. The first information
is partly available from the media review and data sets. For those cases where such
information is not available average values from similar events have been taken over.

WEATHER D2: Vulnerability of Transport Systems
65
Quantification of user costs. Vehicle operations costs.
To be able to calculate this it is necessary to provide the following information:
Average rail ticket price per km
Average car operation costs per vehicle-km
Average occupancy rate of private cars
Average persons per train
Average trains per section
Average distance per train trip
Average persons changing from trains to cars due to the event
Time losses due to infrastructure closures. Passenger transport. For the estima-
tion of the additional time that customers of the rail passenger transport system have to
spend due to the interruption of service provision caused by extreme weather events
again the different possible reactions of the customers have to be taken into account:
Customers using the rail replacement bus service (if it is provided)
Customers changing from trains to car during the interruption of service provision
and
Customers cancelling their trips.
Freight transport. For the calculation of the time losses the following information is
necessary:
Time costs per ton-hour
average km per ton (tkm/ton)
detouring route length extension factor
average km/ton with detouring
additional km per transported ton
average speed of freight trains

WEATHER D2: Vulnerability of Transport Systems
66
7.3 Results and conclusions
The total costs are summarised per event type to give an overview on average costs
caused by an event.
Table 9: Bandwith of costs per costs type and weather event type for selected coun-
tries
Heavy
rainfalls
with
consequent
events
Permanent
rainfalls
with
consequent
events
Thunder-
storms
Winter-
stormsAvalanches
min 0,00 1,97 0,00 0,00 0,00
max 2,81 50,37 0,04 0,04 0,09
average 0,73 18,13 0,02 0,01 0,04
median 0,26 2,06 0,02 0,00 0,04
min 0,15 3,40 0,49 0,20 0,16
max 18,82 40,29 0,63 5,94 7,36
average 3,84 16,62 0,56 1,65 3,76
median 1,56 6,17 0,56 0,58 3,76
min 0,10 2,01 0,29 0,12 0,08
max 11,96 23,79 0,29 2,48 3,47
average 2,44 9,84 0,29 0,86 1,78
median 1,01 3,73 0,29 0,40 1,78
min 0,26 7,37 0,82 0,35 0,23
max 31,97 114,46 0,93 8,42 10,92
average 7,00 44,60 0,87 2,52 5,58
median 2,69 11,96 0,87 1,40 5,58
Bandwith of costs per costs type and weather event type
in mio EUR
capital
costs
oprational
costs
user
costs
Total
costs
In addition to this the average costs of track closure per day and section (used for the
calculation of the costs) and the average infrastructure damage costs per km (including
the information on damage costs reported by the selected media data bases and the
railway companies) are presented.

WEATHER D2: Vulnerability of Transport Systems
67
Table 10: Unit costs for calculation of impacts
average
replacement
costs
per affected
network-km
average
replacement
capital costs
per affected
network-km
average
additional
service costs
and revenue loss
per day and
affected network
section
average
additional
user costs
per day and
affected network
section
Mio EUR/km Mio EUR/km EUR/day/section EUR/day/section
2,55 0,13 43.600 27.700
WEATHER
Unit costs for calculation of impacts
An extrapolation of weather-related costs of the rail system to Europe is extremely diffi-
cult due to the stron dependence on construction levels and maintenance and operat-
ing policies. Nevertheless the detailed Annex 4 on rail transport discusses data needs
and options for value transfer across regions and over time.
With some very simple rules the results of the railway vulnerability assessment have
been extrapoliated to the EUR-29 countries. This was possible for avalanches, storms
and floods (including landslides). From assessments of the Euroepan Environment
Agency the numbers and severity (in terms of costs) of events were taken and
multiplied by the respective unit cost values by Table 9.
Table 11: Preliminary extrapolation of railway damage costs to Europe
Event of extreme Unit costs (m€) Average annual costs (m€)
Category Severity # Infra-structure
Oper-ations Users
Infra-structure
Oper-ations Users TOTAL
Avalanches Major 9 0.04 3.76 1.78 0.04 3.38 1.60 5.02
Storms Very large 32 0.01 1.65 0.86 0.03 5.28 2.75 8.06
Major 41 0.01 1.65 0.86 0.04 6.77 3.53 10.33
Floods major landslides 54 0.73 3.84 2.44 3.94 20.74 13.18 37.85
Major floods 55 18.13 16.52 9.84 99.72 90.86 54.12 244.70
TOTAL 103.77 127.03 75.18 305.97
Total costs are roughly €300 million per year. The largest part (€175 mill.) is borne by
operators, while the rail passenger and freight forwarders carry the least part (€75
mill.). The dominant weather category is major floods, causing 80 % of damages.
However, due to the omission of storm winters and heat problems these results only
reflect a friction of the real damages the railway sector has to bear. An extended as-
sessment of Europe-wide costs will revise these figures later in this project.

WEATHER D2: Vulnerability of Transport Systems
68
8 Urban Public Transport
8.1 Evidence from literature
The EC-funded research project STAR-TRANS analyses the vulnerability of urban
transportation networks. UPT networks are complex and all parts of them are in prin-
ciple vulnerable to weather extremes. UPT link and node elements may be internal
(e.g. part of a tramway line or stops), connecting elements (e.g. access footway) or part
of supporting technology, such as energy supply or telecommunication.
Energy supply further consists of several sub-elements, e.g. fuelling systems, elec-
tric power plants, transformer substations, contact wires, power rails and cables.
Energy is also necessary for communication services. Energy supply might be inter-
fered by extreme weather events and has to be guaranteed by all means. Moreover,
telecommunication including, telephony, telegraphy and television as well as radio
communication (broadcast systems) have to be secured when operating a UPT
network as they are essential for security as well as for operational purposes. Fi-
nally, meta-structures like traffic control centres are essential when managing emer-
gency situations, but are vulnerable to breakdowns of energy supply or of the com-
munication system.
Disruptions of services due to current weather situations could be eased by time
buffers; however operators are often not willing to plan tolerant as this would require
extra staff and rolling stock. Disruptions in services are largely borne by passenger
in case of monthly ticket users, while single ticket users might reschedule their jour-
neys imposing financial losses to the UPT provider. In extreme situations, whole sub
networks may be separated into parts, but the necessary reorganisation process re-
quires standby staff and means of transport in decentralized depots. Further per-
sonnel are needed for increased repair measures.
Increased user costs comprise the value of additional waiting time and the cost due
to a higher accident risk. If passengers are unable to plan their journey due to un-
known delays or unpredictable risks, they may alter their preferred means of trans-
port.
Early results of the Adaptation Report by Transport for London confirm that virtually
all elements of the local transport system are subject to a certain risk of climate
change. Hotter and dryer summer season and possibly wetter winters together with
more frequent extreme events impose particularly high risks to the underground sys-
tem.
Heat periods include problems with key track, signals, & communications assets and
staff & passengers.

WEATHER D2: Vulnerability of Transport Systems
69
Rain and flooding cause problems to tracks and signalling systems and overload
key infrastructure drainage.
8.2 Cost estimation methodology
The contribution on extreme weather related costs in Urban Public Transport (UPT)
touches analyses for London, but focus on German events from 2000 to 2010. Inter-
views have been carried out among the German Bundesland Saxony, being the region
with most losses due to the European Flooding in 2002.
Literature on UPT costs due to extreme weather situations is only available for single
extreme events, such as the European floods in August 2002. For this case govern-
mental reports and scientific as well as non-scientific analyses exist. All other events
are mostly documented by newspapers, which cover such catastrophes at a broader
view not only taking the traffic sector into account.
Used internet sources are accident databases of statistical offices (Saxony, Germany,
Europe, UN) as well as online archives of newspapers and governmental press re-
leases. The four major Saxon UPT providers were asked to deliver figures on weather-
related financial losses (for profiles of the companies see Annex A):
General statements are that summaries on smaller, regular events are not easily avail-
able as causes for repair and maintenance measures are usually not documented.
Facts and figures are often spread across the organisation, so carrying out such ana-
lyses would mean intensive research work for those companies. Thus, analyses have
only been prepared for larger events, where governmental aids were needed (larger
flooding 2002/2006/2010, storm ―Kyrill‖, thunderstorms).
8.3 Results and generalisation
The review of impacts of weather extremes on public transport remains rather qualita-
tive. The results are thus not included into the total cost matrix and can in no way be
extrapolated to Europe. Nevertheless, the available cost figures from the selected
damage events are presented by Table 12.
Table 12: Damage cost figures for urban public transport in Germany for selected
events
Event Location Impact description Damages
2002 summer flood Saxony, communities
Roads and bridges
UPT
€464 mill
€69 mill

WEATHER D2: Vulnerability of Transport Systems
70
Event Location Impact description Damages
Thereof district Dresden
Valid for January 2003
(Striefler et al. 2003)
€66,8 mill
Saxony,
state
State roads and bridges €113 mill
Dresden roads (307 cases)
UPT (full renewal),
Valid for November 2010 (DVB 2010)
thereof
- infrastructures
- vehicles & ferries
- buildings & others
€202.8 mill.
€99.2 mill
€83.8 mill.
€13.4 mill.
€0.5 mill.
Prague Metro restoration €230.0 mill.
Chemnitz Track reconstruction €22‘000
2010 flood Chemnitz Quality inspection and repair (City-Bahn)
€197‘000
Chemnitz UPT track reconstruction €280*000
City-Bahn 3 week track repair, replace-ment bus service & lost income
€150‘000
Thunderstorm 5/2007 Chemnitz Asset damage due to hail €24*000
Hurricane Kyrill 2007 Chemnitz Overhead wires & trees on roads €16000
Hurricane Lothar 1999
Albtal region (Karlsruhe)
Rail infrastructure (track/wires) € 6-digit
The review of extreme weather related costs in UPT revealed that documentation of
cost is not focused on weather extremes so far – at least for the interviewed UPT pro-
viders in Saxony. Costs of larger extremes, like those of August 2002, have been do-
cumented carefully, as most UPT providers depended on governmental aids for recon-
struction measures. However, ―normal‖ weather extremes and their consequences are
accepted up to now.
With rising risks of extreme weather events, it is necessary to estimate the develop-
ment of additional costs. A unified documentation scheme of extreme weather related
costs would be helpful.
WEATHER D2: Vulnerability of Transport Systems
71
9 Airports and air services
The winter seasons 2009/2010 and 2010/2011 as well as the volcano ash cloud over
Europe in April have made the past year a very interesting study case for the sensitiv-
ity of transport systems to adverse weather conditions. In particular aviation had to suf-
fer from these conditions by closing down important hubs during the most severe winter
days and by completely closing parts of the European airspace in spring 2010.
9.1 Evidence from literature
US figures suggest that the total costs of air traffic management (ATM) disruptions
amounts to US$41 billion, of which 70% (US$28 billion) are attributable to weather. Of
these, US$19 billion could be avoidable (EUROCONTROL 2009a). The same source
reports annual costs of €900 mill. for Europe. Among the most critical phenomena are
convective weather conditions, i.e. thunderstorms. For Europe, similar figures are still
lacking, but are foreseen to be generated under the Single European Sky (SES) re-
search agenda (EUROCONTROL 2009b).
Convective weather poses a problem for the efficient airspace and airport operation.
Thunderstorms and related phenomena can close airports, degrade airport capacities
for acceptance and departure, and hinder or stop ground operations. Convective haz-
ards en route lead to rerouting and diversions that result in excess operating costs and
lost passenger time. Lightning and hail damage can remove aircraft from operations
and result in both lost revenues and excess maintenance costs. With 2001/2002 data
from the U.S. it is estimated that the vast majority of the warm season delays are due
to convective weather (DOT 2002).
Airport operations: The strong and persistent winter conditions in the end of 2010
caused problems in supply with de-icing substances and the clearance of movement
surfaces to reach an acceptable breaking action at major European airports. A review
of winter maintenance practices at Scandinavian and Canadian airports clearly indi-
cates that three factors are decisive for avoiding winter-related problems: an early re-
cruiting and training of staff for winter maintenance, use of high quality equipment in
sufficient quantity and the availability of sufficient runway capacity to perform mainte-
nance. In particular the latter point seems problematic for the major hub airports.
Aircraft damages: Following Kulesa (2002) aircraft damages can result from a number
of weather phenomena: lightning and hail in Thunderstorms, turbulences of all type
(convective and non-convective weather) in all altitudes. Major impacts arise from sud-
den accelerations of the aircraft affecting the aircraft itself and its passengers and light-

WEATHER D2: Vulnerability of Transport Systems
72
ning and hail damage can remove aircraft from operations and result in both lost reve-
nues and excess maintenance costs.
Airline operations: Airlines and their customers are generally affected by all problems
encountered by airports and air traffic management. Thunderstorms and related con-
vective weather reduce airport capacity, result in a suspension of refuelling, up- and
off-loading of baggage to aircrafts and can increase en-route operating costs by re-
routing flight paths. Lightning and hail damages can further result in lost revenues and
excess maintenance costs. These effects impose delays, cause additional fuel and
other costs and imply safety impacts for all classes of aircraft. A statistical analysis of
flight schedule data of two US airlines (Rosen 2002) concludes that (1) hub-and-spoke
airline schedules, and thus hub airports, are much more affected by weather impacts
than point-to-point systems or smaller airports, and that snow constitutes the major
challenge for flight operations. The extra costs for detouring hurricanes have been es-
timated by Quan et al. (2002) for the U.S. ranging from US$51000 to US$225000.
Delays: Weather, in particular poor visibility, low clouds and strong winds at the desti-
nation airport, is responsible for approximately 35% to 50% of non-airline related de-
lays, costing approximately €900 million annually (ICAO 2009). EUROCONTROL sta-
tistics show, while in the winter months (December to February) weather-related delays
range between 13% and 17%, their contribution to total delays ranges about 4% or less
in the summer months with a small peak of AFTCM delays in autumn which could be
caused by storm activities. The comparison between flight performance in the US and
in Europe (EUROCONTROL, FAA 2009) reports extreme weather being responsible
for 1% of delayed flights in the U.S., and concludes the same order of magnitude for
Europe. EUROCONTROL (2005) look a bit deeper into weather phenomena around
airports and finds the following share at weather-related AFTCM delays: wind: 27%,
visibility / fog: 35%, and other weather, in particular winter conditions: 38%.

WEATHER D2: Vulnerability of Transport Systems
73
Figure 17: Airline delay reports for 12 countries on weather purposes 2007 to 2010
0
5
10
15
20
25
30
35
0%
2%
4%
6%
8%
10%
12%
14%
16%
18%
J F M A M J J A S O N D J F M A M J J A S O N D J F M A M J J A S O N D J F M A M J J A S O N D
2007 2008 2009 2010
AD
M: A
vera
ge d
epar
ture
del
ay p
er m
ove
men
t (m
in.)
Shar
e o
f de
lay
gro
up a
t A
DM
Average delay per movement and share of delay groups in commercial air transport 2007 - 2010
77: Ground handling
76: Airport snow removal
75: De-icing of aircraft
73: En-route
72: Destination station
71: Departure station
Av. departure delay
Data source: EUROCONTROL 2011
Source: Fraunhofer-ISI with data from EUROCONTROL
Safety: Quan et al. (2002) analyses studies on fatal aviation accidents in extreme
weather and concludes, that in most cases spatial disorientation with low visibility are
caused by a too high level of self confidence of the pilots. ICAO (2010) estimate for
Europe that nearly 20% of all accidents and nearly 8% of fatalities are weather-related.
According to EASA (2009) the accident category with the highest shares of fatal acci-
dent is ―controlled flight into terrain (CFIT), were in most cases adverse weather condi-
tions were prevalent, such as reduced visibility due to mist or fog. The multi-decade
accident statistics in PlaneCrashInfo (2011) show two major impacts of weather on
flight operations: affecting the pilots and affecting the aircraft and its manoeuvrability
itself. Weather-related pilot errors have caused 16% of fatal crashes from the 1950s to
the past decade, while another 12% of fatal accidents were caused by other weather –
related factors.
9.2 Cost estimation methodology
The cost estimation process focuses on five cost elements: Airport winter maintenance,
airline operating costs and user time losses due to delays and aircraft damages and
user deaths and injuries due to aircraft accidents. The methodology is drafted in brief.
Airport winter maintenance uses average personnel and equipment costs identified
for Scandinavian airports and relate them to traffic volumes and additional cold and
snow days in extreme winters across Europe. The average cost of winter maintenance
per ATM is €116.

WEATHER D2: Vulnerability of Transport Systems
74
Aircraft damage costs are estimated on the basis of EASA assessments of accidents
related to weather extremes. From internet sources average prices of aircrafts have
been collected. It is assumed that 50% of these costs are already written off and a fur-
ther 50% is subtracted to acknowledge that accidents usually have several causes. AS
the EASA database provides the degree of severity of accidents capital losses have
been estimated. In total the database contains 88 accidents over the EUR29 territory
from 2000 to 2010.
Figure 18: Monthly distribution of weather-related air accidents over EUR29
0
2
4
6
8
10
12
14
01 02 03 04 05 06 07 08 09 10 11 12
Acc
ide
nts
re
late
d t
o w
eat
he
r
Month
Air accidents in EUR29 2000 - 2010
Unknown
None
Minor
Serious
Fatal
Data source: EASA evaluation 2011
Source: Data provided by EASA, 2011
Airline delay costs are computed on the basis of a database on delay causes pro-
vided by EUROCONTROL-CODA. The data contains the average delay per movement
for the IATA delay groups 71, 72, 73, 75, 76 and 77 by month from January 2007 to
December 2010. Each of these delay groups shows a characteristic slope across the
year, allowing identifying typical weather patterns. We thus allocate weather categories
by seasons and delay group. A regional allocation is then made by allocating the
weather-specific delays using ESPON and ECA&D indices of extremes. According to
EUROCONTROL (2004) a value of €36 per delayed flight and minute is assumed.

WEATHER D2: Vulnerability of Transport Systems
75
Figure 19: Summary of delay groups 71-77 by month
0,00 0,50 1,00 1,50 2,00 2,50
JAN
FEB
M…
APR
M…
JUN
JUL
A…
SEP
OCT
N…
DEC
Average delay (minutes)
Average delays 71-77 by month, 2007-2010
Delaycode 71
Delaycode 72
Delaycode 73
Delaycode 75
Delaycode 76
Delaycode 77
Source: Fraunhofer-ISI with data from EUROCONTROL-CODA
User delay costs: Delay accounts are taken from airline operating costs. The structure
of passenger delay costs due to extreme weather conditions is therefore considered
identical to the costs to airlines. These are assessed using a passenger value of time
of €21/h out of the range of €16 to €32/h suggested by Maibach et al. (2008).
User safety costs: The costs of fatalities and injuries in air accidents are taken from
the EASA dataset already applied to assess aircraft damage costs. The database con-
tains the number of fatalities and injuries, which are assessed by €m1.65 per death
casualty, €150000 per severe injury and €10000 per slight injury. The regional alloca-
tion is given by the place of the aircraft crash and the allocation to weather extreme is
done on a seasonal basis as for plane damages.
9.3 Results and conclusions
With €360 million overall annual costs imposed by extreme weather conditions, i.e.
adverse weather exceeding currently expectable seasonal conditions, on air transport
are considerable in absolute terms. But when relating them to industry estimates of
total weather inflicted costs (€900 million p.a.) or relating them to aircraft movements
(€36 per ticket), they appear to be of a less significant level. The inclusion of further
cost categories like flight cancellations or cargo related costs may significantly impact
their absolute values and lead to more considerable values for the aviation industry and
their customer.
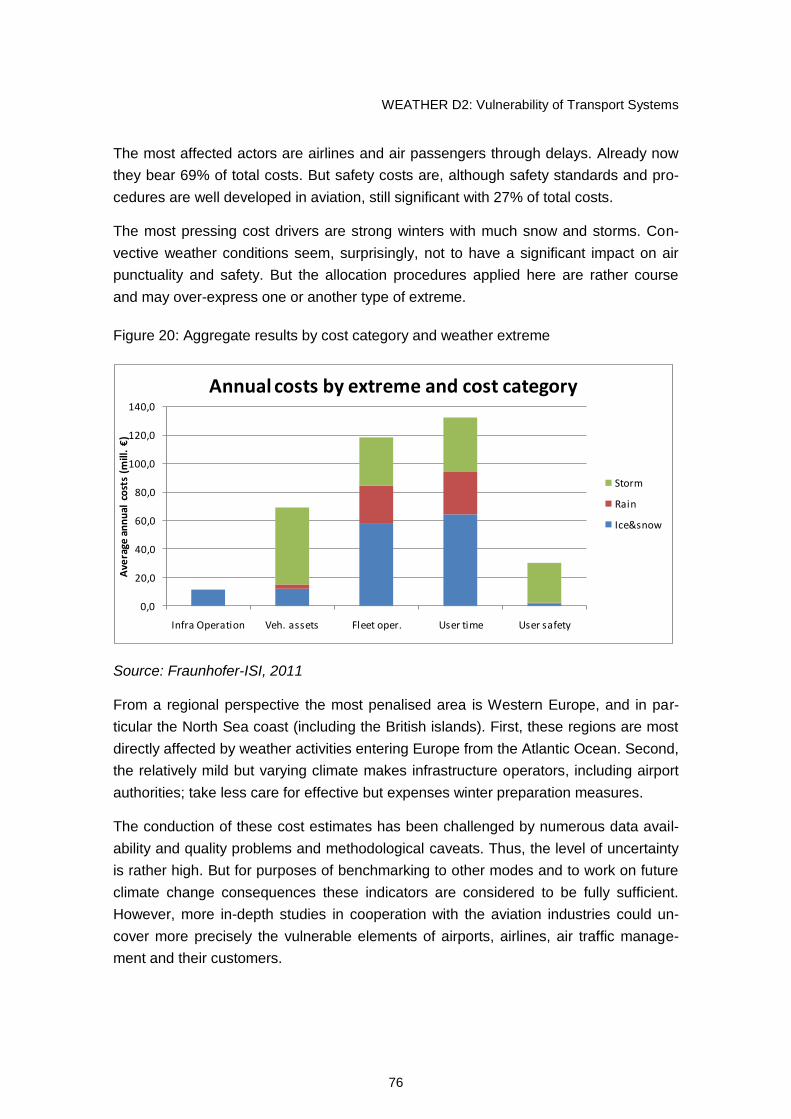
WEATHER D2: Vulnerability of Transport Systems
76
The most affected actors are airlines and air passengers through delays. Already now
they bear 69% of total costs. But safety costs are, although safety standards and pro-
cedures are well developed in aviation, still significant with 27% of total costs.
The most pressing cost drivers are strong winters with much snow and storms. Con-
vective weather conditions seem, surprisingly, not to have a significant impact on air
punctuality and safety. But the allocation procedures applied here are rather course
and may over-express one or another type of extreme.
Figure 20: Aggregate results by cost category and weather extreme
0,0
20,0
40,0
60,0
80,0
100,0
120,0
140,0
Infra Operation Veh. assets Fleet oper. User time User safety
Ave
rage
an
nu
al c
ost
s (m
ill. €
)
Annual costs by extreme and cost category
Storm
Rain
Ice&snow
Source: Fraunhofer-ISI, 2011
From a regional perspective the most penalised area is Western Europe, and in par-
ticular the North Sea coast (including the British islands). First, these regions are most
directly affected by weather activities entering Europe from the Atlantic Ocean. Second,
the relatively mild but varying climate makes infrastructure operators, including airport
authorities; take less care for effective but expenses winter preparation measures.
The conduction of these cost estimates has been challenged by numerous data avail-
ability and quality problems and methodological caveats. Thus, the level of uncertainty
is rather high. But for purposes of benchmarking to other modes and to work on future
climate change consequences these indicators are considered to be fully sufficient.
However, more in-depth studies in cooperation with the aviation industries could un-
cover more precisely the vulnerable elements of airports, airlines, air traffic manage-
ment and their customers.

WEATHER D2: Vulnerability of Transport Systems
77
10 Maritime transport
10.1 Evidence from literature
In our literature review we have focused on six main information sources:
1. research projects of international institutions;
2. articles in scientific magazines (maritime transport and meteorological issues);
3. insurance-related companies and media ;
4. reports of consulting companies on catastrophe management;
5. general news media sources;
6. news on the port‘s websites.
Over the last years, large international organizations have been focusing more and
more attention on the possible impacts of climate change on the different economy
sectors, including transport. In this framework, a lot of research projects were initiated
focusing on the impact of climate change on the different transport modes, including
maritime transport.
For example, in the framework of the PESETA project (Projection of Economic Impacts
of climate change in Sectors of the European Union based on the bottom-up analysis)
sea-level rise projection was done and possible economic and physical effects induced
from it were studied. The ESPON project (the Spatial Effects and Management of Natu-
ral and Technological Hazards in Europe) studies the main technological and natural
hazards, their geographical scope and spatial effects. Projects like ASTRA (Developing
Policies and Adaptation Strategies to Climate change in Baltic Sea Region) assess
impacts of the climate change in the concrete region and sectors.
Another study, performed by OECD focus on assessing the climate change impacts on
port cities (Assessing climate change impacts, sea level rise and storm surge risk in
port cities: a case study on Copenhagen). All these reports are more focused on long-
term effects of the climate change on the different transport sectors and make an over-
view of recent extreme weather events as an example of the on-going tendency.
From the above mentioned literature, the most relevant extreme weather events for
maritime transport are:

WEATHER D2: Vulnerability of Transport Systems
78
Storms/hurricanes, followed by heavy rains, high wind speeds and, sometimes,
hail, causing all kinds of damage, from infrastructure destruction to the impossi-
bility of accessing the port;
Extreme frost periods and iceing, causing a temporary blockade of the port ac-
tivities.
Therefore, the subsequent literature review was focused on these extreme weather
events and their impacts on maritime transport. A number of scientific articles, studying
different effects and meteorological evolution of the EWE‘s were reviewed. These ar-
ticles provide good background information about events, sometimes estimation of the
losses and very often results in the prospects of future trends. A very useful information
source is insurance companies‘ reports and media (e.g. Munich Re Group, Lloyds list,
Guy Carpenter).
10.2 Cost estimation methodology
As the impacts of an EWE on maritime transport do not have a regular character and
are hard to forecast (especially from hurricanes), it is hard to determine a systematic
costs calculation approach. Infrastructure damages are recorded at the level of ports
and can be verified through the concerned port websites. Transport service providers
and transport user costs are difficult to generalize as they are individual for each event.
Specifics of maritime transport for that sector, is that transport users can wait a couple
of days for cargo delivery, therefore these delays are not crucial. They only cost run-
ning costs of ships (fixed costs).
In our estimation process we have focused on the short-term costs from extreme
weather events, which occur directly after the event. In section 3.1 of the detailed an-
nex the elements for the cost assessment approach for different maritime transport
actors are presented. The EWE bound costs vary for a shipper of maritime cargo and
for a ferry operator (ro-ro) and therefore are presented in different paragraphs. As ex-
treme low temperatures have more impact on MT in long-term scale (increase in port
maintenance costs, type of vessels operating, rates on ice-breaking services, etc) and
are not usually characterised by the infrastructure damage or suspension of navigation,
we further illustrate our approach on the case of the windstorm/hurricanes.
Port operator costs. Input information for the assessment of port operator costs can
first be verified through the media review for each particular EWE. Usually port web-
sites provide information on damage produced by the Extreme weather event. Fur-
thermore, interviews with port authorities and terminal operators can be done for the
assessment of the additional cost components.
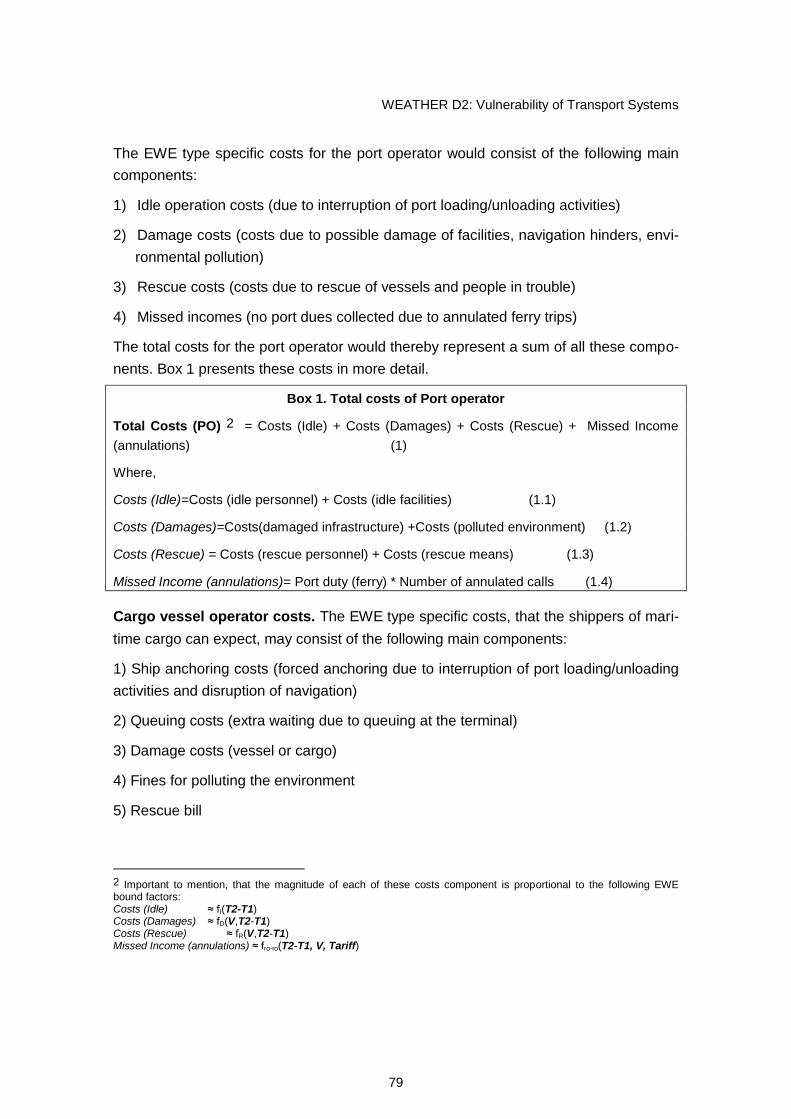
WEATHER D2: Vulnerability of Transport Systems
79
The EWE type specific costs for the port operator would consist of the following main
components:
1) Idle operation costs (due to interruption of port loading/unloading activities)
2) Damage costs (costs due to possible damage of facilities, navigation hinders, envi-
ronmental pollution)
3) Rescue costs (costs due to rescue of vessels and people in trouble)
4) Missed incomes (no port dues collected due to annulated ferry trips)
The total costs for the port operator would thereby represent a sum of all these compo-
nents. Box 1 presents these costs in more detail.
Box 1. Total costs of Port operator
Total Costs (PO) 2 = Costs (Idle) + Costs (Damages) + Costs (Rescue) + Missed Income
(annulations) (1)
Where,
Costs (Idle)=Costs (idle personnel) + Costs (idle facilities) (1.1)
Costs (Damages)=Costs(damaged infrastructure) +Costs (polluted environment) (1.2)
Costs (Rescue) = Costs (rescue personnel) + Costs (rescue means) (1.3)
Missed Income (annulations)= Port duty (ferry) * Number of annulated calls (1.4)
Cargo vessel operator costs. The EWE type specific costs, that the shippers of mari-
time cargo can expect, may consist of the following main components:
1) Ship anchoring costs (forced anchoring due to interruption of port loading/unloading
activities and disruption of navigation)
2) Queuing costs (extra waiting due to queuing at the terminal)
3) Damage costs (vessel or cargo)
4) Fines for polluting the environment
5) Rescue bill
2 Important to mention, that the magnitude of each of these costs component is proportional to the following EWE bound factors: Costs (Idle) ≈ fI(T2-T1) Costs (Damages) ≈ fD(V,T2-T1) Costs (Rescue) ≈ fR(V,T2-T1) Missed Income (annulations) ≈ fro-ro(T2-T1, V, Tariff)

WEATHER D2: Vulnerability of Transport Systems
80
For each particular case its necessary to check who is paying the penalty in case of
Force Major events, and does the rescued shipper have to reimburse the rescue costs
afterwards. The total costs for the cargo shipper would usually be a sum of all the
above-mentioned components (Box 2).
Box 2. Total cost of cargo vessel operator
Total Costs(CO)*3 = Costs(Anchor) + Costs(Queue) + Costs(Damages)+ Fine (2)
Where,
Costs(Anchor) = Costs(idle crew) + Costs(missed income) + Penalty(late delivery) (2.1)
Costs(Queue) = CostsQ(idle crew) + CostsQ (missed income) + PenaltyQ(late deliv.) (2.2)
Costs(Damages)=Costs (ship repair) + Costs (damaged or lossed cargo) (2.3)
Fine = Fine (IMO tariff) or Fine(country specific fine regulations) (2.4)
* for the ease of the assessment the costs for paying the rescue bill by the shipper in trouble are ignored.
Source: NEA
Ferry operator costs. For the ferry operator the crucial and relevant effect caused by
this EWE type, is the forced cancellation of the scheduled ferry services during the ex-
treme weather event. This has the following costly implications:
1) Missed income (return of sold tickets to passengers choosing for other travel op-
tions)
2) Catering and accommodation for stranded passengers (as far as it is foreseen in
the rules)
As in previous cases, the total EWE bound costs for the ferry operator would be a sum
of the abovementioned components (Box 3).
Box 3. Total cost for Ferry operator
Total Costs(FO) = Costs(missed income) + Costs(catering & accommodation) (3)
3 Again, the magnitude of each of these costs component is proportional to the following EWE bound factors, terminal characteristics, lucky timing and regulations in force: Costs (Anchor) ≈ fA(T2-T1) Costs (Queue) ≈ fQ(1/CT , NT *ST) Costs (Damages) ≈ fD(V,T2-T1) Fine (pollution) ≈ fP((fD(V,T2-T1)) * Fine tariff) Where: CT -: spare capacity; number of queuing ships NT (in front of a shipper concerned) and ship sizes ST (per DWT category).

WEATHER D2: Vulnerability of Transport Systems
81
The missed income for the ferry operator:
Costs(missed income)=NRTp*TicketPrice +∑i(NRTv,i*VehicleTicketPricei)+Income(on-board
shopping) –Tax(port) – Costs(crew) –Costs(fuel) (3.1)
Where
NRTp – number of returned traveller tickets,
NRTv,I – number of returned vehicle tickets per vehicle pricing category i.
Source: NEA
10.3 Results and conclusions
Case study 1. The windstorm Kyrill occurred in January, 2007 and lasted in some re-
gions for more than 24 hours. It was referred to as a widely spread extra-tropical
cyclone with hurricane-strength winds. For the demonstration of the proposed costs
estimation methodology we have focused on two specific study cases:
Case 1: Damage of the container ship MSC Napoli in the English Channel on the 18th
of January, 2007, including the damaged cargo onboard and the environmental
pollution;
Case 2: Disruption of ferry services on the connection ‗Rosslare-Fishguard’ between
Ireland and the UK on January 17th and 18th, 2007.
The following estimated costs can be claimed:
Claimed ship damage: € 17.5 mln
Claimed cargo damage: € 2.1 mln
Fatality claims: € 0
Therefore; the total costs of the accident for the MSC Napoli would be in the range of €
3.060 mill.
Case study 2. The ferry connection between Rosslare in Ireland and Fishguard in
the UK was severely affected by the windstorm Kyrill in the late hours on January
17th and throughout the day on January 18th, 2007. The costs experienced by the
operator Stena Line due to the cancellation of the scheduled sailings on the Rosslare-
Fishguard connection on January 17th and 18th, 2007 are the following. The total costs
of the disruption period for Stena Lines will therefore approximate € 482.493.

WEATHER D2: Vulnerability of Transport Systems
82
January 17 January 18
Income sold tickets: € 85.880 € 94.874
Income vehicle fares: € 85.277 € 116.410
Income sold facilities: € 5.938 € 7.058
Income onboard shopping: € 13.749 € 20.887
Costs crew: € 22.100 € 22.100
Depreciation costs: € 4.110 € 4.110
TOTAL COSTS € 217.054. € 265.438

WEATHER D2: Vulnerability of Transport Systems
83
11 Inland waterways transport
11.1 Evidence from literature
We have followed a three step approach in our literature review. First of all, our objec-
tive was to receive the general understanding of how large the impact is of extreme
weather events (EWE) on inland waterways transport (IWT). Secondly, we have fo-
cused our literature analysis on the EWE‘s which have the strongest impact on IWT.
Finally, we have further delimited our research to the navigable European rivers.
Searching for the impacts of the EWE‘s on IWT in media and literature provided us with
the first impression on the frequency of occupancy of different events and the scope of
impact they might have. In our literature review we have looked through extensive pro-
jects that have been executed by international organisations and financial institutions
(EU, the World Bank, UNECE, etc), websites of the River Basin commissions and other
river organisations, EU national IWT agencies and responsible authorities, at the out-
comes of the major conferences and newsletters of the IWT related projects (the over-
view of the information sources is in Annexe A). These sources provide extensive and
comprehensive general information about rivers, navigation conditions and weather
event occurrences on rivers.
As outcomes from initial research, the EWE‘s that have the biggest impact on the IWT
are:
floods causing high water levels and possibly resulting in lack of bridge
clearance and, if critical values are exceeded, in a disruption of traffic;
drought periods causing low water levels and resulting in lower load factors,
lower speeds, more fuel consumption and possibly a disruption of traffic (in
particular for bigger vessels);
ice causing severe delays or a blockade for the inland waterway vessels.
Therefore, the literature review was further focused on spotting the biggest floods,
droughts and extreme cold periods. Recent work from the ECCONET project (FP 7,
European Commission DG MOVE) was also taken into account.
A lot of information (especially on floods and droughts) and some databases are avail-
able for public use, but there is not much information which describes specific eco-
nomic impact on inland waterways and its operators. At the same time, the available
information is important as it gives the general qualitative description of the event,

WEATHER D2: Vulnerability of Transport Systems
84
global estimation of the event costs in terms of damaged property (buildings and farm
lands) and casualties.
11.2 Cost estimation methodology
Infrastructure providers costs (infrastructure damages and increase from operating
costs) have been estimated case by case, through the evidence found in the literature
and media. Per case a specific literature/media review on the river port or river stretch
needs to be done to see if there were any infrastructure damages recorded. Port web-
sites, river basin commission websites, insurance reports can be of a big use. In case
more details are necessary, interviews with infrastructure managers (e.g. waterway
operators, port authorities) have been carried out to describe the impacts and relevant
costs for infrastructure operators due to extreme weather events. If no information is
available through the mentioned sources, these costs are considered as non identified.
Damage to vehicles have been recorded only if any indication of it is found in me-
dia/literature sources. The gathered information will be checked with concerned opera-
tors and will then be further reported.
As the effects of floods/ice periods on the IWT differs from those of droughts, two dif-
ferent cost calculation approaches have been developed in order to estimate the eco-
nomic impact on the transport service providers. Costs calculations for the transport
operators from floods and ice periods are developed around calculations of volume of
different types of goods transported in the area where navigation was interrupted,
number and types of ships which circulate per day in the area concerned, costs of the
waiting time for ships and other parameters as detailed in the Inland Waterway Annex
to this report. For the calculation of the impact of the drought period, the ship draught
parameter is very important. Therefore, the calculations take into consideration the
drought severity, ship draught measurements, volume of goods transported in the
drought area, costs of waiting time of ships and other parameters. In both cases, the
critical parameter to have is the number of days that navigation was suspended.
The costs for the transport users (time losses through system capacity and infrastruc-
ture closure) are highly dependent on the duration of the extreme weather event. The
first reaction will be to postpone the transports and in the case of the short service in-
terruption (which often takes place during floods) transport users do not record any
substantial additional costs. However, in case of a flood or drought period exceeds a
certain time period, the transport user will pay surcharges for the transport service pro-
vider or even will shift the cargo to other modes of transport, e.g. rail or road transport.
In that case, the transport costs can increase significantly: both for the transport user,

WEATHER D2: Vulnerability of Transport Systems
85
who has to pay substantial higher freight rates and/or need to find an emergency
measure and for the transport service provider who will have missed transport vol-
umes. The situation however will be different for each user and also depends on the
value of the goods and the stock levels. It would require a very detailed assessment to
make an estimation. Such detailed assessments are planned in 2011 in the ECCONET
project (June 2011). Therefore, a knowledge transfer is recommended as soon as re-
sults from ECCONET become available.
The costs from time losses through system capacity depend a lot on the EWE duration.
They can have an impact both on transport service providers and transport users. For
the first ones, these costs are already taken into account in the methodology of trans-
port service provider‘s costs calculation. The estimation of the transport user‘s losses
through the reduced system capacity will be done in June 2011 within the ECCONET
project, as described beforehand. Therefore, these costs are not assessed within this
deliverable.
The costs from infrastructure closure occur in two cases: because of the infrastructure
damage or because of the obligatory suspension of navigation due to the high or low
water levels.
Therefore, the first case will be assessed only if any infrastructure damage is identified
in previous phases. The second case is already included in the assessment of trans-
port service provider‘s costs.
External accident costs have an impact on IWT in the case if there was environmental
damage on IWW due to the EWE or there were social costs from persons injured or
dead involved in the inland waterways industry. In the quantification of the external
accident costs we are following the same approach as for the infrastructure damage
costs. Literature/media review for each particular case is done and if there is no infor-
mation on time loses because of the infrastructure closures, accident or environment
damage costs, then these costs are considered as not identified.
11.3 Results and conclusions
The river Rhine and its tributes (Neckar, Mosel, Saar) were chosen to illustrate calcula-
tion methodology of the impact of floods/ice periods and droughts on inland waterways
transport.
The Rhine river is one of the longest (about 1232 km) and most important rivers in Eu-
rope, which crosses the territory of the Netherlands, Germany, and Switzerland.
Through its main tributes, the Rhine is also connected to France and Austria. More

WEATHER D2: Vulnerability of Transport Systems
86
than 63% of the goods volume transported by IWT in Europe is done via Rhine route4
and this volume continues to grow.
The structure of goods transported by IWT on the Rhine varies. The Rhine is for exam-
ple used for hinterland distribution of energy (coal and oil) as well as for the supply of
raw materials for industries (e.g. steel plants located along the Rhine). Moreover, there
is a vast network of container terminals along the Rhine linked to the maritime con-
tainer flows via seaports. There is for instance, a lot of transport of oil and oil products.
Detailed data on the transportation on the Rhine can be found in the Market Observa-
tion Reports provided by the CCNR (see http://www.ccr-zkr.org/ ).
The water level observations on the Rhine are done at so called ―Pegel‖ points. The
assessment of all the costs in this study is further made for the Kaub pegel point, which
is considered to be the most critical for the Rhine river and determines the load factor
of vessels that perform transports to/from the upper Rhine (e.g. Basel, Mannheim,
Stuttgart area).
Floods. In order to delimitate concrete flood areas on the Rhine, we use water level
measurement points on the Rhine and its tributes (www.elwis.de). Using historic data
available5 for the period 2000-2010 it is possible to determine the days when water
level exceeded the HSW mark for each of the pegel points. If the HSW value was ex-
ceeded, then no navigation was possible in this area. Following this approach we were
able to determine if during the period 2001 – 2010 the water levels observed at Kaub
pegel point were exceeding its HSW indicator.
Droughts. The selection of drought periods can also be based on the daily water levels
for certain bottlenecks. Bottlenecks on the Rhine are for example the stretch at Kaub
and Ruhrort. The pegel value is used to determine the actual water level6. The differ-
ence between the pegel value at Kaub and the possible draft of a moving vessel is 85
cm. That is why for the further definition of drought periods we are adjusting recorded
water levels to 85 cm. Afterwards this level is compared with the maximum empty
draught of the vessel.
Ice periods. The waterway managers provide information on the number of days when
there was a suspension of navigation due to ice. Available information is quite general
4 Market observation for inland navigation in Europe, 2007-1. Central Commission for Navigation on the Rhine, EC DG TREN, April 2008
5 http://www.wetteronline.de/dldlpeg.htm
6 http://www.wetteronline.de/dldlpeg.htm)

WEATHER D2: Vulnerability of Transport Systems
87
for the Upper Rhine, Middle Rhine, Neckar, Saar and Mosel, but does not provide de-
tailed information on what particular part of the river is concerned (Annexe D). Kaub
pegel point is situated in the Middle Rhine area. During the period of analysis (1990-
2010) there were no ice periods to consider.
The estimation of economic loss on IWW from floods in Kaub area is presented in the
following table.
Table 13: Summary of economic impact from floods and droughts on Kaub area, mln
euro
Cost category/ mln euro Flood 2001 Flood 2002 Flood 2003
Infrastructure damage 1)
- - -
Infrastructure operating costs 1)
- - -
Damage of vehicles 1)
- - -
Service provision 0,9 0,3 0,5
Time loss through system capacity 2)
- - -
Time loss through infrastructure damage 2)
- - -
External accident costs 1)
- - -
TOTAL costs, euro 0,9 0,3 0,5
1) not identified 2) not relevant
Therefore, the total economic loss per year can be attributed to the transport service
provider‘s personal loss, when taking the small number of days when suspension of
navigation took place around the Kaub area, due to floods into consideration. The es-
timation of economic loss from droughts in the Kaub area is presented in the following
table.
Table 14: Summary of economic impact from droughts in Kaub area, mln euro
Cost category/ mln euro 2003 2004 2005 2006 2007 2009
Infrastructure damage 1)
- - - - - -
Infrastructure operating costs 1)
- - - - - -
Damage of vehicles 1)
- - - - - -
Service provision 9,6 1 7,5 4,7 0,9 5,5
Time loss through system capacity 3)
- - - - - -
Time loss through infrastructure dam-age
2)
- - - - - -
External accident costs 1)
- - - - - -
TOTAL costs, euro 9,6 1 7,5 4,7 0,9 5,5
1) not identified 2) not relevant 3) not estimated

WEATHER D2: Vulnerability of Transport Systems
88
12 Intermodal transport
12.1 Evidence from literature
The literature review on the impacts of climate change and extreme weather events on
transport vulnerability has stressed the general lack of available impact assessments
(e.g., Koetse, M.J, Rietveld, P. (2009). In such a context, the situation for intermodal
transport may be considered even worse.
The basic reason relies on the fact that the case of the relationship between climate
change and intermodal transport vulnerability basically implies the consideration of the
interchange and transhipments facilities and infrastructures involved in this type of
transport, and the way in which they are affected by extreme weather events.
The concepts of ―intermodal transport― can be defined as ―the movements of goods in
one and the same loading unit or vehicle which uses successively several modes of
transport without handling of the goods themselves in changing modes‖, according to
the definition of The European Conference of Ministers of Transport (ECMT) and the
European Committee for standardisation (CEN).
The most important implication is that the goods have to be transported in one loading
unit from the loading at the beginning until the unloading at the end of the transport
chain, without handling the goods themselves. Containers, swap bodies, trailers, semi-
trailers and whole trucks (backpack traffic or rolling highways and roll –on roll-off) are
allowed to transport the goods and are transhipped at terminal and interchanges
points.
The analysis of the intermodal transport vulnerability to climate change carried out in
this report is primarily focused on intermodal freight transport, due to the fact that the
intermodal passenger transport infrastructures, e.g. airports, ports and rail stations, are
already taken into account in the dedicated sections of this Deliverable, i.e. Airports
and air services, Maritime and inland ports and Public Transport.
It should be stressed that the vulnerability to heavy storms, rain, ice is in general lower
than in other transport means, e.g. trucks in pure road transport, due to the heaviness
of the intermodal transport infrastructures described in the above table (track keeping
in line vehicles, gantry cranes, intermodal wagons, loading units, terminals).
On the other hand, the less flexibility of intermodal freight transport network, i.e. due to
a limited number of lines in the railway network that are able to meet the technical re-
quirements allowing combined transport (e.g. Seidelman C., 2010), makes the inter-

WEATHER D2: Vulnerability of Transport Systems
89
modal transport more vulnerable to rail lines interruptions caused for example by ava-
lanches.
The following tables provide a qualitative evaluation of the climate change weather
related events and their likely impacts on intermodal transport (operation and infra-
structure).
Table 15: Qualitative assessment of climate change impacts on intermodal transport
Potential Climate Change Impacts on Intermodal land transportation
extreme weather events Operation Infrastructure
Temperatures increases in very hot days and heat waves
Mild: Vehicle overheating and tire deterioration
Mild: Rail track deformity
Change in seasonal precipita-tion and flooding patterns
High: Frequent interruptions, increases in weather related delays
High: Flooding of road/rail lines, tunnels, landslides, damages to road and tracks
Increase in drought condi-tions
Medium: Wildfires reducing transport activities
Medium: Wildfires threaten-ing intermodal infrastructure
Increased intensity in storms, winds and waves
High: Debris on road and rail lines, interruptions
High: Increase probability for infrastructure damages, sup-ports, lighting fixtures, etc
Source: Adapted from Committee on Climate Change and U.S. Transportation, National Research Council
(2009)
The table shows that the extreme weather events potentially affecting intermodal
transport are flooding, landslides, avalanches, to the extent that they are causing de-
lays in operations or interruptions in transport services. Damages from extreme tem-
peratures, winds and intense precipitations can be considered of minor importance,
due to the heaviness of intermodal infrastructures. However, it should be considered
that heavy rain and winds can hamper terminal operations with swinging loads, ulti-
mately reducing productivity and causing delays.
12.2 Cost estimation methodology
Infrastructure damages. On February 2002, at Colmegno near Luino a landslide
made the railway line as well as the road unusable. The Swiss intermodal operator and
UIRR-member Hupac on 27 February explained the situation due to the interruption of
the lines in Chiasso and Luino. 10 daily trains were sent via Lötschberg/Simplon and
the Domodossola border, 2 daily trains go via Austria and Brenner, and 10 daily trains
stopped in the southern Swiss terminals Chiasso, Lugano and Stabio (near Chiasso).

WEATHER D2: Vulnerability of Transport Systems
90
Hupac was forced to equip the terminals in Tessin (southern canton in Switzerland)
with further cranes and personnel to achieve higher lifting capacity.
The total interruption of the lines in Chiasso, made clear how important a definitive line
reconstruction on the line Bellinzona – Gallarate via Luino was in order to allow the
further development of combined transport flows.
Estimates of the construction costs for similar infrastructure lines in the Alpine crossing
of Gotthard and Lotshchberg amount to 90-100 M€/km (RFI, 2007).
Increased infrastructure operating costs. Literature review has stressed the lack of
evidences on the impacts of climate change and changes in weather conditions on
infrastructure operating costs. In fact, this appears to be more an engineering that an
economic issue ( Koetse, M.J, Rietveld, P. (2009), whose access to information, evi-
dences and impact assessment is in general limited. Available evidences have been
provided in the context of the Arctic Climate Impact Assessment, with reference to ar-
eas with permanent and discontinuous permafrost (Instanes, A; et al. (2005).
However, despite the lack of evidences, the review of climate change related events
and the available studies have pointed out that infrastructure maintenance costs are
likely to increase relative to those at present, due to the impacts of climate change.
The hypothesis assumed in this evaluation is that the increase of maintenance costs
due to the impacts of climate change (extreme weather events) is something about
10%-20%.
According to the RECORDIT project outcomes (2003), a detailed classification of in-
termodal costs (including maintenance costs at terminal and transhipment points) was
carried out along three pan-European intermodal corridors: the Freight freeways corri-
dor (Patras-Gothenburg); the Tri-modal corridor (Genoa-Manchester); the Door-to-door
corridor (Barcelona-Warsaw). Intermodal transport requires the use of terminals at the
interface between modes, and sometimes between the same modes. In the case of rail
to rail transfers, at €2000 costs, the RECORDIT project showed the lowest cost at an
average €27 per movement of a 40‘ container. Road-rail transfers were rather higher at
€36. In the case of inland waterways and short sea shipping even higher figures were
reported rising to around €60 with a figure of €166 quoted for the case of a transfer
between an inland water vessel and a ship.
The following table summarises the detailed maintenance costs by each RECORDIT
corridor (in € 2010 costs) and the resulting average costs assumed as standard cost
per Loading Unit transported (A Class 40' container).

WEATHER D2: Vulnerability of Transport Systems
91
Table 16: Average maintenance costs per Loading Unit (€2010)
Genova-
Manchester Patras-
Gothenburg Barcelona-
Warsaw Average costs
per LU Maintenance of quay-rail cranes 37.3 12.9 23.3 24.5 Maintenance of marshal-ling locomotive 10.7 3.7 7.2
Storage cranes mainte-nance 5.3 1.8 2.6 3.3 Personnel costs (moni-toring of infrastructure lines, marshalling control staff, rail crane person-nel, etc) 214.1 88.8 137.2 146.7
Total 267.5 107.1 163.2 181.6
Assuming the average maintenance costs of €181.6 per Loading Unit, the hypothesis is
that the additional impacts of the extreme weather events on infrastructure mainte-
nance costs range between +10% and +20%, corresponding to an average increase by
€18 per loading Unit.
Increased costs of service provision. Assuming 100 as the final intermodal service
price for the user (shippers or forwarders), the following table shows the share of these
costs on the final price in the three RECORDIT corridors.
Table 17: Share of climate change sensitive infrastructure items on the final price
(€2000 prices)
Genova- Manchester
Patras- Gothenburg
Barcelona- Warsaw
Average share on final price per LU
Maintenance and use of infrastructure 17.2% 12.1% 9.4% 12.2%
The impacts on the final cost for service provision will range between +0.5% and
+0.8%.
12.3 Results and conclusions
The following table generalizes the results at EU level. The assessment of intermodal
transport vulnerability to climate change extreme weather events leads to €6.8 million
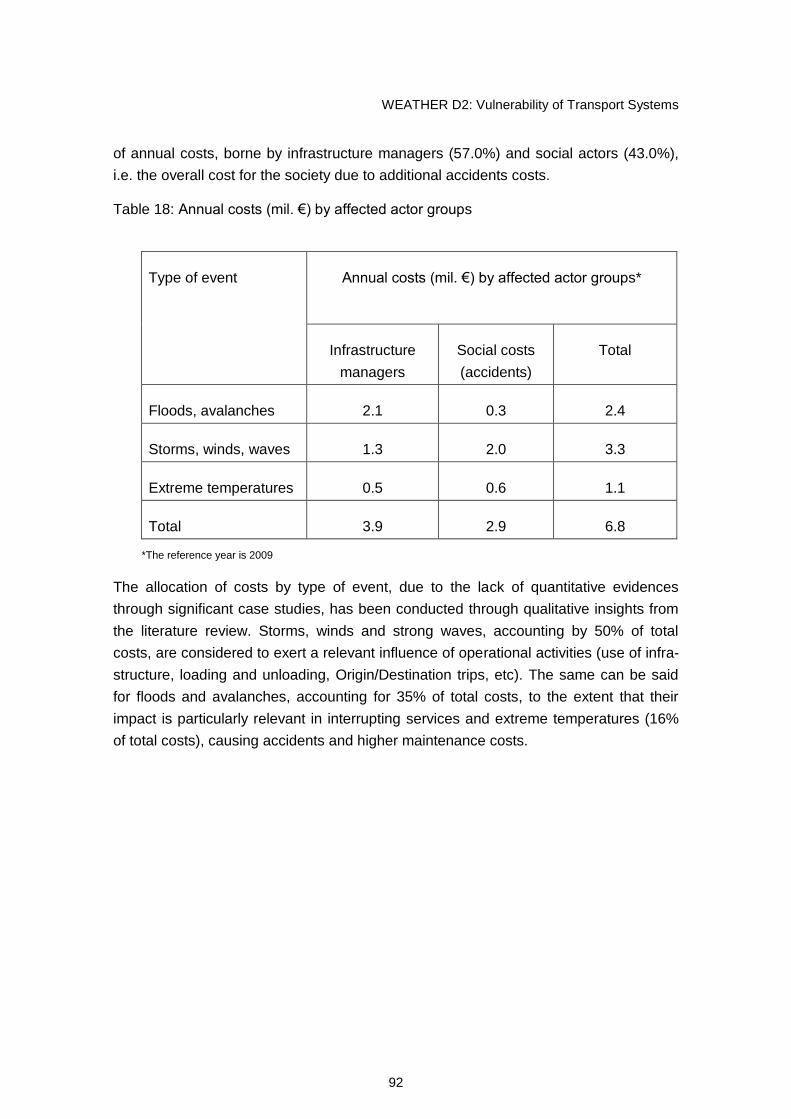
WEATHER D2: Vulnerability of Transport Systems
92
of annual costs, borne by infrastructure managers (57.0%) and social actors (43.0%),
i.e. the overall cost for the society due to additional accidents costs.
Table 18: Annual costs (mil. €) by affected actor groups
Type of event Annual costs (mil. €) by affected actor groups*
Infrastructure
managers
Social costs
(accidents)
Total
Floods, avalanches 2.1 0.3 2.4
Storms, winds, waves 1.3 2.0 3.3
Extreme temperatures 0.5 0.6 1.1
Total 3.9 2.9 6.8
*The reference year is 2009
The allocation of costs by type of event, due to the lack of quantitative evidences
through significant case studies, has been conducted through qualitative insights from
the literature review. Storms, winds and strong waves, accounting by 50% of total
costs, are considered to exert a relevant influence of operational activities (use of infra-
structure, loading and unloading, Origin/Destination trips, etc). The same can be said
for floods and avalanches, accounting for 35% of total costs, to the extent that their
impact is particularly relevant in interrupting services and extreme temperatures (16%
of total costs), causing accidents and higher maintenance costs.

WEATHER D2: Vulnerability of Transport Systems
93
PART C: CONCLUSIONS
13 Compilation of results
The following table provides an overall picture at EU level of the cost assessment of
the weather extreme events by transport mode, type of stakeholder involved and type
of extreme event considered. The total costs amount to € 2.5 billion yearly. Thereof,
€1.8 billion are computed for road, € 361 million relate to air and € 306 to the rail sec-
tor. Minor costs are incurred to maritime transport (€20 million), inland waterways (€ 4
million) and intermodal freight transport (€2 million).
Table 19: Generalization of extreme weather events costs for the European transport
system (annual data in € m)
Extreme weather event Infrastructure
Assets (m€)
Infrastructure
Operations
(m€)
Vehicle
Assets
(m€)
Vehicle
Operations
(m€)
User
Time
(m€)
Health &
Life
(m€)
Total
(m€)
Storm Road (1) 76,10 22,60 5,10 1,40 63,00 5,90 174,10
Rail (2) 6,28 18,39
Maritime (5) 2,10 17,98 20,08
Intermodal (6) (7) 0,72 1,25
Air (8) 53,80 34,30 38,40 28,30 154,80
Winter Road (1) 248,80 126,30 81,30 12,50 125,50 164,90 759,30
Rail (2) (3) 1,60 5,02
Intermodal (6) (7) 0,21 0,42
Air (8) 11,20 12,00 57,70 64,60 1,90 147,40
Flood Road (1) 630,10 21,90 24,40 30,01 93,70 21,50 821,61
IWW (4) 4,87
Rail (2) 67,30 282,55
Air (8) 3,20 26,50 29,60 0,20 59,50
Intermodal (6) (7) 0,10 0,42
Heat&drought Road (1) 46,90 46,90
Total 1059,82 182,00 308,92 180,39 494,84 270,63 2496,60
4,87
0,07 12,05
0,04 3,38
0,53
0,21
0,32
103,66 111,60
(1) Average year 2000-2010.
(2) Average annual data 1999-2010
(3) Avalanches, winter storms and extreme heat events not included
(4) Average annual data 2003-2009, service providers costs
(5) Average data hurricane Kyrill 2007 from case studies, freight transport
(6) Average data 2009 freight transport without AT, CH, I, CZ, DE (already included in Rail)
(7) Including extreme temperatures (heat)
(8) Average annual data

WEATHER D2: Vulnerability of Transport Systems
94
As suggested by the several footnotes to the table, the cross-modal comparison of ex-
treme weather events related costs is subjected to several caveats.
Firstly, the reference year is different. In some case, the year is estimated as an aver-
age of several years, e.g. for inland waterways (2003-2009), in others the estimate is
simply based on a one-year observation, e.g. for maritime (2007).
Furthermore, and most significantly, in some case the annual estimation is the result of
the generalization at EU level of cost estimations available for given countries, using
specific parameters and variables (traffic flows, number of container, etc), i.e. for the
road and rail sectors, the intermodal transport (freight) and the air transport; in other
cases the generalization has not been made possible, as for waterborne transport
(inland waterways and maritime). When the generalization has not been made possi-
ble, a certain downward bias in the final results must be taken into account. And even
when the generalization has been made possible, a certain downward bias is still pos-
sible due to lack of information, as for the costs suffered by the rail transport system
because of extreme very cold days.
.
On the other hand, the table shows that of the € 2.496 billion of total costs, about 97%
are related to the transport modes for which the generalization at EU level has been
carried out: road, rail, intermodal freight transport and air transport, whose total ex-
treme weather related costs amount to € 2.413 billion. This implies that the trends and
the conclusions drawn below can be considered representative of the impacts suffered
by the overall European transport system.
Taking all that in the duly account, the table does not show double-counting, for exam-
ple the climate change costs suffered by intermodal freight transport do not include the
costs assessment estimated under the rail transport mode. Concerning intermodal
transport in general, it must be stressed that the climate change impacts incurred to the
intermodal passenger transport and public transport network (buses and coaches)
have not been generalized to the overall European level, due to the lack of case stud-
ies and literature evidences on the matter.
In terms of the type of stakeholders affected by the extreme weather events, infrastruc-
ture asset and operation account not surprisingly for the higher toll: 50% of the total
costs (43% asset and 7% operations). The literature review has in fact stressed the fact
that the likely most relevant implications arising from climate change concern planning,
design, construct, operate, and maintaining of transport infrastructure (TRB, 2008). But
also the burden suffered by users (due in particular to congestion and time losses to
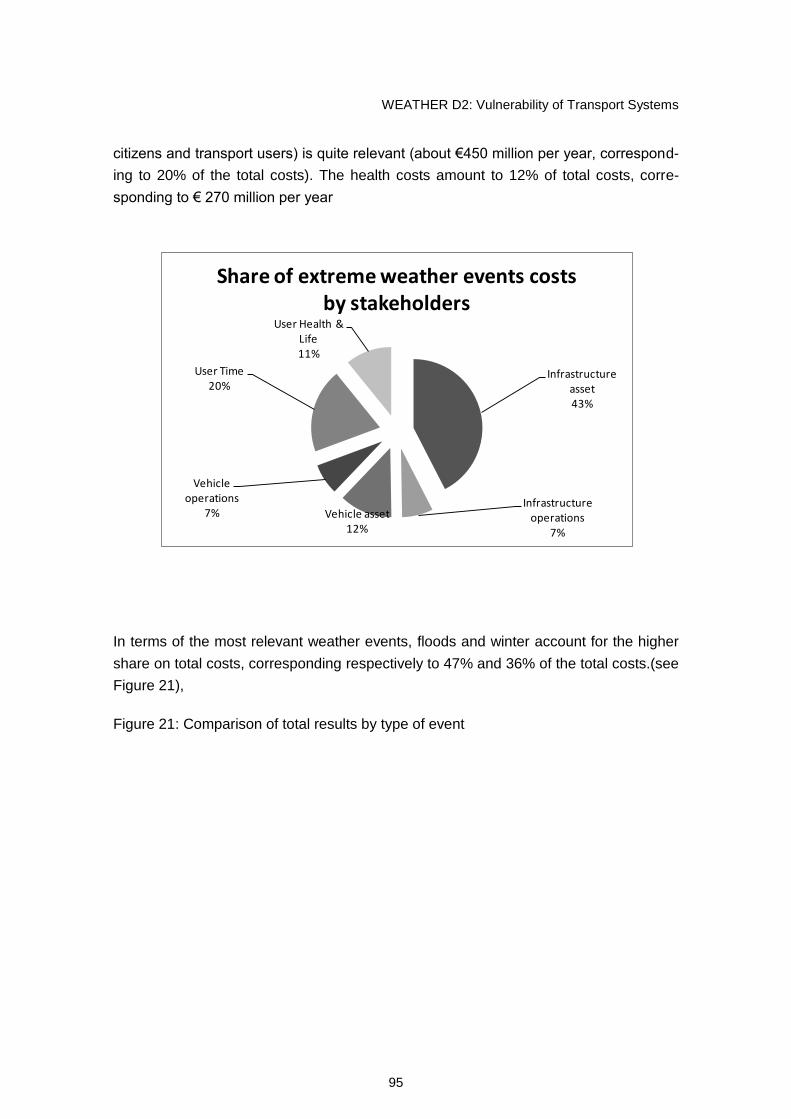
WEATHER D2: Vulnerability of Transport Systems
95
citizens and transport users) is quite relevant (about €450 million per year, correspond-
ing to 20% of the total costs). The health costs amount to 12% of total costs, corre-
sponding to € 270 million per year
Infrastructure asset43%
Infrastructure operations
7%
Vehicle asset12%
Vehicle operations
7%
User Time20%
User Health & Life11%
Share of extreme weather events costs by stakeholders
In terms of the most relevant weather events, floods and winter account for the higher
share on total costs, corresponding respectively to 47% and 36% of the total costs.(see
Figure 21),
Figure 21: Comparison of total results by type of event

WEATHER D2: Vulnerability of Transport Systems
96
Storm; 15%
Winter; 36%
Flood; 47%
Heat&drought; 2%
Share of extreme weather events on total costs
The damages arising from storms correspond to 15% of the total costs.. As concerns
heat impacts (2% of the total costs) we must consider a certain downward bias, as here
less accurate and information for economic assessment are available.
In terms of impacts on transport modes, the most significant impacts affect the road
sector (72%, due to the relevant impacts on infrastructure asset and operations) and
the air sector (15% of the total costs, mainly due to the impacts on users and operators
caused by delays -).. In conclusion, the figures reported in Table 19 report on the aver-
age annual costs for selected types of weather extremes.
But apart from all methodological difficulties the results allow to indicate the most vul-
nerable elements and the most costly impacts per model of transport. These are:
Infrastructure damages due to floods and multiple impacts of harsh winter conditions
in the road sector,
consequences of durable rainfalls on rail infrastructure and operations,
storms on maritime operations and floods on user time losses in road navigation,
winter conditions and storms for intermodal freight infrastructures and safety and
storms and winter conditions on air operations and punctuality.
These findings will feed into the forthcoming steps of the WEATHER project. The eco-
nomic figures either in terms of total annual costs across Europe or specific costs per

WEATHER D2: Vulnerability of Transport Systems
97
event and region will provide the basis for the assessment of the level of saving poten-
tial of adaptation measures. On a regional level the findings will be re-visited by the
cases studies to be carried out.

WEATHER D2: Vulnerability of Transport Systems
98
14 Conclusions and outlook
14.1 Comparison of objectives and results
The following section compares the objectives of the WP2 ―Vulnerability of transport
systems‖, as indicated in the WEATHER Technical Annex, and the results of the Deliv-
erable 2 ‖The vulnerability of transport systems‖, which has been specifically designed
to address the objectives of the WP2.
Objective 1: Identify the vulnerable elements of the transport sector and the
specificities of each mode and of intermodal processes with respect to different
extreme weather events (sub-objective 2)
Results of the Deliverable. The Deliverable has identified specific weather events
(Chapter 2.2.3) which clearly exceed the long-term average of comparable meteoro-
logical activities over the annual mean or related to the specific season, which have
considerable negative impacts on assets and operations, or which affect human health
or lives.
The above weather events have been related to all modes of transport. These are:
Road: European perspective derived from country-specific data.
Rail and urban public transport (UPT): discussion of case-specific results.
Aviation coverage of Europe by assessing Europe-wide statistics.
Maritime and inland navigation: sector-specific focus on a few countries.
Intermodal transport European focus by generalising sector information (only freight
transport).
Objective 2: Quantify the entrepreneurial costs of extreme weathers for trans-
port operators
Results of the Deliverable . The cost assessment has been carried out according to
an evaluation framework (Chapter 2.3.2) including the following cost items and main
assumptions:
Infrastructure damages: We start from standard cost values for infrastructure con-
struction by construction element taken from the IMPACT (2008), GRACE (2006)
and UNITE (2002). If no state of damage is reported we only consider the costs of
resurfacing and equipment renewal. To separate standard renewal costs from
weather-related damages we take only the share of the asset‘s remaining life time or
WEATHER D2: Vulnerability of Transport Systems
99
50% of not available. Capital costs are considered by a de-fault value of 10% upon
the replacement or repair costs.
Infrastructure operations: Here we do not have standard cost values avail-able, as
these will strongly differ between categories of weather extremes, regions and the
organisational structure of the infrastructure company.
Vehicle damages: Cost values are based on prices for new vehicles, of which we
apply 50% to reflect age and partial damages. In further steps these will be cross-
checked to insurance reports of material damages.
Vehicle operation costs comprise of costs for additional heating and cooling in case
of temperature-related events or of fuel, personnel and depreciation in case of de-
touring. Respective cost values are provided by automobile Associations for pas-
senger cars or HGVs and can be derived from balance sheets of transport service
providers. The time and distance of detouring is estimated by the TRANS-TOOLS
network database. If the number of vehicles affected is not given, national average
traffic volumes per type of infrastructure are taken.
User time costs are computed like vehicle operating costs using standard cost val-
ues from the IMPACT and HEATCO projects. If not available by modal statistics, de-
fault values for delays and detours are also taken from the TRANS-TOOLS model.
Besides national infrastructure load rates, national vehicle occupancy figures are
provided to transfer vehicle delays into passengers or freight units.
Users‘ discomfort arises from over-crowding, excessive or too low temperatures in
vehicles. We have not found a reliable method for valuing these effects and thus ex-
clude comfort-related impacts from the assessment.
Accident impacts on human health and life are assessed by standard cost values for
death casualties, severe and slight injuries derived in recent European studies.
Usually the number of fatalities and injuries associated with extreme events are well
documented.
Objective 3: Estimate and predict the social costs of extreme weathers affecting
transport
Results of the Deliverable .The current costs of weather extremes are summarised in
the Table 18 in the Conclusions section. The footnotes to the table guide to a correct
interpretation of the cost assessment. It turns out that the extreme weather events
amount to about € 2.5 billion yearly, estimated along a ten years time span (2000-
2010).
The prediction of costs to 2050 has been addressed by reviewing the results of major
climate models and by indicating sensitivities and forecast procedures for the main
transport modes. Quantitative predictions will be carried out in the framework of WP4
as soon as the meteorological results from WP1 are available.

WEATHER D2: Vulnerability of Transport Systems
100
Objective 4: To deepen the insight into the vulnerabilities of transport infra-
structure and system operation to extreme weather events within a WP2 Work-
shop with transport professional will be organised. The workshop will cover in-
frastructures, passenger, and freight services within each mode. For each topic
key presentations from transport professionals will be invited.
Results of the Deliverable. The WP2 Workshop was held on 14.9.2010 in Brussels
(Chapter 5). The Workshop has addressed all the transport modes, taking stock of
the contributions of the following specialists:
Road and urban public transport:
Kenneth Natanaelsson (Trafikverket) Swedish Maritime Association, providing a de-
tailed assessment of landslide activity in the southern Part of Sweden, current and in
the near future.
Roberto Arditi (SINA on behalf of ASECAP, the Association of European Toll Mo-
torway Operators) highlighting the importance of roads to access emergency areas
Matthew Webb (Transport for London) presenting TfL‘s strategy for assessing and
adapting to climate change.
Rail and intermodal freight transport:
Chris Baker (University of Birmingham) discussing findings of the FUTURENET pro-
ject funded under UK‘s EPSRC ―Adaptation and resilience to climate change‖ pro-
gramme.
Samuel Brunet (RFF, French Rail Infrastructure Manager), discussing problems en-
countered through increased rain- and snowfalls resulting in damage on earthworks
and structures
Martin Burkardt (UIRR) stressing the several problems railway operations encounter
under adverse weather conditions
Air transport sector:
Henrik Littorin (Swedavia) highlighting two reports dealing with the consequences of
climate change for the Swedish air transport sector
Rachel Burbidge and Dennis Hart (Eurocontrol) stressing the impacts of the past
winter episodes on the air sector.
Inland navigation and maritime shipping:
Nina Nesterova and Jan Kiel presented the study teams approach to address the
economic costs of weather extremes for inland navigation and maritime shipping.

WEATHER D2: Vulnerability of Transport Systems
101
14.2 Overall achievement
The comparison of planned and actually achieved results within this work package of
the WEATHER project reveals that the goals have been met. Furthermore, for the first
time it has been possible to establish a cross-modal and cross-regional comparison of
the economic costs of weather extremes on the transport sector for Europe. This en-
ables to set transport‘s role as a victim of climate change into perspective and provides
a benchmark for suitable cost-efficiency-ratios of adaptation strategies.
Nevertheless, the results are not fully comprehensive, as not all cost categories and
modes have been looked at with equal intensity. Subsequent work in this project, paral-
lel research in this area currently funded by DG-RTD and DG-MOVE as well as future
activities should help closing gaps and deepening the analyses initiated by this study.
14.3 Interpretation and outlook
The moderate results found by this study amount to 0.1 €-Ct. per passenger car kilo-
metre on European roads or roughly 30 €-Ct per air ticket. These are far below the
costs for infrastructure provision and maintenance, system operation or climate gas
emissions. The current results acknowledge that there are considerable total costs,
which are even more dramatic when looking at single large events. But they also reveal
that the policy priorities should be on mitigating GHG emissions and on easing the bur-
den of world regions, which are more vulnerable than Europe and which have less
economic resources to cope with the consequences of climate change.
The outlook to 2050 and beyond appears different for the various transport modes and
weather categories. We see different growth rates of population, and thus of transport
activities, in the various areas of the Union. While Northern Europe, the British Islands
and France envisage a further population increase, Germany, Eastern and Southern
Europe are heading towards stagnation or even a decline of inhabitants. These are
confronted with differing impacts of climate change on our weather. While heat and
storm and rain, entailing wild fires and floods, will increase, winter conditions will sof-
ten. Thus, some areas particularly in Mid Europe may see an overall decline of weather
related costs – or a shift towards different hazards. A quantitative analysis of the future
trends of total and average costs of weather extremes will be provided within Deliver-
able 4 on Adaptation Strategies of the WEATHER project.

WEATHER D2: Vulnerability of Transport Systems
102
REFERENCES
A. Goussiatiner (2009). "Systematic Approach to Quayside Container Crane Productivi-
ty Improvement". Container Management, Feb 2009:
ACI (2010): Economic Report 2009: Airports Council International - ACI Europe.
AEA (2007): Market Research Quarterly, Brussels: Association of European Airlines
(AEA).
Agarwal, Maze, Souleyrette (2006): The Weather and Its Impact on Urban Freeway
Traffic Operations, 85th Transportation Research Board (TRB) Annual Meeting;
Iowa State University, Center for Transportation Research and Education.
Alcamo, J., J.M. Moreno, B. Nováky, M. Bindi, R. Corobov, R.J.N. Devoy, C.
Giannakopoulos, E. Martin, J.E. Olesen, A. Shvidenko, (2007): Europe. Climate
Change 2007: Impacts, Adaptation and Vulnerability. Contribution of Working
Group II to the Fourth Assessment Report of the Intergovernmental Panel on
Climate Change, M.L. Parry, O.F. Canziani, J.P. Palutikof, P.J. van der Linden
and C.E. Hanson, Eds., Cambridge University Press, Cambridge, UK, 541-580.
Andrey, J. & Yagar, S., (1993): A Temporal Analysis of Rain-Related Crash Risk, Uni-
versity of Waterloo, Ontario, Canada; Accident Analysis and Prevention, Vol. 25,
No. 4, pp. 465-472.
Andrey, Jean, Brian Mills and Jessica Vandermolen (2001): Weather Information and
Road Safety, Department of Geography, University of Waterloo, Adaptation and
Impacts Research Group, MSC Environment Canada Paper Series - No. 15.
Andrey, Mills, Vandermolen (2003):A Temporal Analysis of Weather-Related Collision
Risk for Ottawa, Canada: 1990-1998, 82nd Transportation Research Board
(TRB) Annual Meeting, University of Waterloo (Canada).
Anfosso-Lédée, Fabienne and Yves Pichaud (2007): Temperature effect on tyre-road
noise, Applied Acoustics 68 (2007), 1-16.
Arditi, R. (2010): Weather and Consequent Impacts on Main Roads. What impact will
climate change have on roads in Sweden and how to deal with it? Presentation at
the WEATHER Workshop (Vulnerability Workshop), 14. September 2010, Brus-
sels.

WEATHER D2: Vulnerability of Transport Systems
103
Baker, C. (2010): Extreme weather, climate change and the railways. Presentation at
the WEATHER Workshop (Vulnerability Workshop), 14. September 2010, Brus-
sels.
Baker, C. (2010): WEATHER, WS 1 – Presentation: Extreme Weather, climate change
and the railways.
Baker, C.; Cheli, F.; Orellano A.; Paradot, N.; Proppe, C.; Rocchi, D. (2009): Cross-
wind effects on road an rail vehicles.
Baker, C.J.; Chapman, L.; Quinn, A.; Dobney, K. (2009): Climate change and the rail-
way industry: a review.
Bengtsson, Jens and Böðvar Tómasson (2008): Vulnerability and risk analysis of the
road infrastructure in Reykjavik, Project Number VR7RA, Vegagerðin Island.
Bijleveld, Frits and Tony Churchill (2009): The influence of weather conditions on road
safety, An assessment of the effect of precipitation and temperature, SWOV Insti-
tute for Road Safety Research, The Netherlands, Leidschendam
Blair, John (2010): Road Network Condition, Report by the Director Commercial Ser-
vices, Midlothian Council, Tuesday 27 April 2010, Item No 7
Bos, J.M.J. (2001): Door weer en wind, Gevolgen van perioden met extreem weer voor
de verkeersveiligheid, Stichting Wetenschappelijk Onderzoek Verkeersveiligheid
SWOV, R-2001-23, Leidschendam
Brodsky, H. & Hakkert, A. S.; (1988): Risk of a Road Accident in Rainy Weather; Uni-
versity of Maryland at College Park, U.S.A. & Technion, Road Safety Center,
Haifa, Israel; Accident Analysis and Prevention, Vol. 20, No. 3, pp. 161-176.
Bronstert, Axel (2004): Möglichkeiten zur Minderung von Hochwasser durch Nutzung
von Flutpoldern an Havel und Oder, Schlussbericht BMBF Projekt "Be-
wirtschaftsungsmöglichkeiten im Einzugsbereich der Havel", Potsdam.
Brunet, S. (2010): Rail infrastructure answer to extreme weather events: a first French
study. Presentation at the WEATHER Workshop (Vulnerability Workshop), 14.
September 2010, Brussels.
Burbidge, R. and D. Hart (2010): Weather, Climate and Air Traffic Management
Setting the Scen. Presentation at the WEATHER Workshop (Vulnerability Work-
shop), 14. September 2010, Brussels.

WEATHER D2: Vulnerability of Transport Systems
104
Burkhardt, M. (2010): Weather Extremes – Vulnerability of Combined Transport and
measures to reduce impacts. Presentation at the WEATHER Workshop (Vulner-
ability Workshop), 14. September 2010, Brussels.
Burkhardt, M. (2010): WEATHER, WS1 – Presentation: Vulnerability of Combined
Transport and measures to reduce impacts.
CANSO (2009): Global Benchmarking: 2003-2007 ANSP Performance Results. Final
Deidentified Summary Version, Hoofddorp, the Netherlands: CANSO, the Civil Air
Navigation Services Organisation.
Carter, Timothy R. and Susanna Kankaanpä (eds) (2003): Adapting to climate change
in Finland: Research priorities Proceedings of the FINADAPT seminar Finnish
Environment Institute (SYKE) Helsinki 14 November 2003, FINADAPT Working
Paper 1
CE Delft (2008): Handbook on estimation of external costs in the transport sector, DG
TREN.
CE Delft, 2008 "Handbook on estimation of external costs in the transport sector", DG
TREN, 2008
Chatterton, John, Christophe Viavattene, Joe Morris, Edmund Penning-Rowsell, Sue
Tapsell (2010): The costs of the summer 2007 floods in England, Department for
Environment, Project: SC070039/R1, http://publications.environment-
agency.gov.uk/pdf/SCHO1109BRJA-e-e.pdf.
Christensen, J.H. and O.B. Christensen (2007): A summary of the PRUDENCE model
projections of changes in European climate during this century. Climatic Change,
81, S7-S30.
Christensen, J.H., B. Hewitson, A. Busuioc, A. Chen, X. Gao, I. Held, R. Jones, R.K.
Kolli, W.-T. Kwon, R. Laprise, V. Magaña Rueda, L. Mearns, C.G. Menéndez, J.
Räisänen, A. Rinke, A. Sarr and P. Whetton, (2007): Regional Climate Projec-
tions. In: Climate Change 2007: The Physical Science Basis. Contribution of
Working Group I to the Fourth Assessment Report of the Intergovernmental
Panel on Climate Change [Solomon, S., D. Qin, M. Manning, Z. Chen, M. Mar-
quis, K.B. Averyt, M. Tignor and H.L. Miller (eds.)]. Cambridge University Press,
Cambridge, United Kingdom and New York, NY, USA.

WEATHER D2: Vulnerability of Transport Systems
105
Christensen, Jørgen (2008): Preparing Road Infrastructure, Chief Counsellor Danish
Road Directorate, Presentation at the Transportforum 2008, Session 16: Climate
Change Robustness for Future Climate Change, Linköping, 9 January 2008.
Committee on Climate Change and U.S. Transportation, National Research Council
(2009) "Potential Impacts of Climate Change on U.S. Transportation: Special Re-
port 290
Cook, A.; Tanner, G.; Anderson, S. (2004): Evaluating the true cost to airlines of one
minute of airborne or ground delay, Transport Studies Group,University of West-
minster: EUROCONTROL, Performance Review Commission.
Cook, A.; Tanner, G.; Anderson, S. (2004a): Evaluating the true cost to airlines of one
minute of airborne or ground delay, Transport Studies Group,University of West-
minster: EUROCONTROL, Performance Review Commission.
Cook, A.; Tanner, G.; Anderson, S. (2004b): Evaluating the true cost to airlines of one
minute of airborne or ground delay, Transport Studies Group,University of West-
minster: EUROCONTROL, Performance Review Commission.
Cook, A.; Tanner, G.; Anderson, S. (2004c): Evaluating the true cost to airlines of one
minute of airborne or ground delay, Transport Studies Group,University of West-
minster: EUROCONTROL, Performance Review Commission.
Cook, A.; Tanner, G.; Anderson, S. (2004d): Evaluating the true cost to airlines of one
minute of airborne or ground delay, Transport Studies Group,University of West-
minster: EUROCONTROL, Performance Review Commission.
Cypra, Thorsten (2006): Optimierung des Winterdienstes auf hoch belasteten Auto-
bahnen, Berichte der Bast, Verkehrstechnik Heft V135.
Dailey P.S. (2004) Anatol, Lothar and Martin - When will they happen again? AIR
worldwide Corporation report
Dawson, Andrew, and Alessandra Carrera, (2010): Pavement Performance & Reme-
diation Requirements following Climate Change, DRAFT, P2R2C2 Report 11 -
Overall Advice & Summary, Nottingham.
Didenkulova I et al (2006), Freak waves in 2005. Nat. Hazards Earth Syst. Sci., 6,
1007-1015, 2006

WEATHER D2: Vulnerability of Transport Systems
106
Dobney, K and al, 2009 "The future cost to the United Kingdom's railway network hea-
trelated delays and buckles caused by the predicted increase in high summer
temper-tures owing to climate change
Dobney, K.; Baker, C.J.; Quin, A.D.; Chapmann, L. (2009): Quantifying the effects of
high summer temperatures due to climate change on buckling and rail related de-
lays in south-east Kingdom.
Doré, Guy, Philippe Drouin, Pascale Pierre and Pierre Desrochers (2005): Estimation
of the Relationships of Road Deterioration to Traffic and Weather in Canada,
FINAL REPORT, BPR Reference: M61-04-07 (60ET), TC Reference: T8080-04-
0242.
DOT (2002): The Potential Impacts of Climate Change on Transportation. Federal Re-
search Partnership Workshop October 1-2, 2002 Summary and Discussion Pa-
pers: DOT Center for Climate Change and Environmental Forecasting.
DOT (2002): The Potential Impacts of Climate Change on Transportation. Federal Re-
search Partnership Workshop October 1-2, 2002 Summary and Discussion Pa-
pers: DOT Center for Climate Change and Environmental Forecasting.
Dotzek et al (2002) Pilot Study for a European Severe Storms Laboratory ESSL
Doyle, James, Gary Ketcheson (2008): Lessons Learned from Management Response
to Flood Damaged Roads in the Western Washington Cascades Mt. Baker-
Snoqualmie National Forest, Mountlake Terrace, Washington.
http://www.stream.fs.fed.us/afsc/pdfs/Doyle.pdf
DVR (2000). Wind und Wetter. Wie das Wetter auf den Menschen wirkt. DVR-Report
2000, nr. 4. p. 8-11. Deutscher Verkehrssicherheitsrat e.V., Bonn.
EASA (2009): Annual Safety Review 2009, Cologne: European Aviation Safety
Agency.
EASA (2009): Annual Safety Review 2009, Cologne: European Aviation Safety Agen-
cy.
EC (2009): White Paper Adapting to climate change: Towards a European framework
for action, COM(2009) 147, Brussels: European Commission.
ECMT (1998) Report on the Current State of Combined Transport in Europe", Paris
WEATHER D2: Vulnerability of Transport Systems
107
EEA (2010): Mapping the impacts of natural hazards and technological accidents in
Europe An overview of the last decade, EEA Technical report No 13/2010,
doi:10.2800/62638, Copenhagen
Eidg. Forschungsanstalt für Wald, Schnee und Landschaft (WSL) (2010): Auszug aus
der WSL Unwetterschadens-Datenbank der Schweiz: Ereignisse, bei denen die
Bahn betroffen war 2000-2009.
Eidg. Forschungsanstalt für Wald, Schnee und Landschaft WSL 2010 "Auszug aus der
WSL Unwetterschadens-Datenbank der Schweiz: Ereignisse, bei denen die Bahn
be-troffen war 2000-2009"
Eisenberg, Daniel and Kenneth E. Warner, PhD (2005): Effects of Snowfalls on Motor
Vehicle Collisions, Injuries, and Fatalities, Vol 95, No. 1 American Journal of Pub-
lic Health 120-124.
El Faouzi, Nour-Eddin, Romain Billot, Pertti Nurmi, Bernhard Nowotny (2010): Effects
Of Adverse Weather On Traffic And Safety: State-Of-The-Art And A European
Initiative, SIRWEC 2010: 15th International Road Weather Conference.
Estrela T., Menendez M., Dimas M. and others (2001), Sustainable water use in
Europe, Part 3: Extreme hydrological events: floods and droughts
EurAqua, "Discussion document Towards a European Drought Policy, November 2004
EUROCONTROL (2005): Report on Punctuality Drivers at Major European Airports,
Brussels: Eurocontrol Performance Review Unit (PRU).
EUROCONTROL (2005): Report on Punctuality Drivers at Major European Airports,
Brussels: Eurocontrol Performance Review Unit (PRU).
EUROCONTROL (2006): The Cost of Delay. Notes on estimating the cost of delay,
using the University of Westminster Report and using the cost of delay model.:
EUROCONTROL - The European Organisation for the Safety of Air Navigation.
EUROCONTROL (2006): The Cost of Delay. Notes on estimating the cost of delay,
using the University of Westminster Report and using the cost of delay model.:
EUROCONTROL - The European Organisation for the Safety of Air Navigation.
EUROCONTROL (2009a): AVIATION METEOROLOGY (MET) WORKSHOP #1, 27-
28th MAY 2009, MET support to ATM, Brussels: European Organisation for the
Safety of Air Navigation.
WEATHER D2: Vulnerability of Transport Systems
108
EUROCONTROL (2009a): AVIATION METEOROLOGY (MET) WORKSHOP #1, 27-
28th MAY 2009, MET support to ATM, Brussels: European Organisation for the
Safety of Air Navigation.
EUROCONTROL (2009b): AVIATION METEOROLOGY (MET) WORKSHOP #1, 27-
28th MAY 2009, MET support to ATM, Brussels: European Organisation for the
Safety of Air Navigation.
EUROCONTROL (2009b): Report of the second MET support for ATM workshop 26.-
28.10.2009, MET support for ATM, Brussels: European Organisation for the
Safety of Air Navigation.
EUROCONTROL (2009c): Report of the second MET support for ATM workshop 26.-
28.10.2009, MET support for ATM, Brussels: European Organisation for the
Safety of Air Navigation.
EUROCONTROL (2009d): Report of the second MET support for ATM workshop 26.-
28.10.2009, MET support for ATM, Brussels: European Organisation for the
Safety of Air Navigation.
EUROCONTROL (2010a): Delays to Air Transport in Europe, Annual 2009, Central
Office for Dalay Analyses (CODA) (ed.), Brussels: EUROCONTROL - European
Organisation for the Safey of Air Navigation.
EUROCONTROL (2010b): Delays to Air Transport in Europe, Annual 2009, Central
Office for Dalay Analyses (CODA) (ed.), Brussels: EUROCONTROL - European
Organisation for the Safey of Air Navigation.
EUROCONTROL (2010c): Delays to Air Transport in Europe, Annual 2009, Central
Office for Dalay Analyses (CODA) (ed.), Brussels: EUROCONTROL - European
Organisation for the Safey of Air Navigation.
EUROCONTROL; FAA (2009): U.S./Europe Comparison of ATM-related Operational
Performance, Washington D.C, Brussels: FAA Air Traffic Organization Strategy
and Performance Business Unit, EUROCONTROL, Performance Review Unit.
EUROCONTROL; FAA (2009): U.S./Europe Comparison of ATM-related Operational
Performance, Washington D.C, Brussels: FAA Air Traffic Organization Strategy
and Performance Business Unit, EUROCONTROL, Performance Review Unit.
European Environment Agency (2004). Mapping the impacts of recent natural disasters
and technological accidents in Europe. Environment issue report No 35. Euro-
pean Envi-ronment Agency, Copenhagen.

WEATHER D2: Vulnerability of Transport Systems
109
European Union (2007): Green Paper From The Commission To The Council, The
European Parliament, The European Economic And Social Committee And The
Committee Of The Regions, Adapting to climate change in Europe - options for
EU ac-tion,(SEC(2007) 849), Brussels
EUROSTAT (2010) Tables from the Intermodal transport dataset EUROSTAT web site
Eurostat, European Commission (2009). Panorama of Transport, Eurostat statistical
book.
Federal Highway Administration (2010): Road Weather Management Program, US
Department of Transportation, http://ops.fhwa.dot.gov/Weather/index.asp.
FEMA (2008): Benefit-Cost Analysis of Hazard Mitigation Projects, Report of Benefit-
Cost Analysis, 09/09/2008, City of Lincoln and Lancaster County, Nebraska,
USA, http://lincoln.ne.gov/city/pworks/watrshed/scstorage/pdf/appendixj.pdf
Ferré de France, R. (2010): WEATHER, WS1 - Presentation: Rail infrastructure answer
to extreme weather events: a first French study.
Fink et al (2009), The European storm Kyrill in January 2007: synoptic evolution, me-
teorological impacts and some considerations with respect to climate change,
Nat. Ha-zards Earth Syst. Sci., 9, 405-423, 2009
Fridstrøm, L., Ifver, J., Ingebritsen, S., Kulmala, R. & Krogsgård Thomsen, L. (1995):
Measuring the contribution of randomness, exposure, weather and daylight to the
variation in road accident counts. In: Accidents Analysis and Prevention, vol. 27,
nr. 1, p. 1-20.
Gallivan, F.; Bailey, K.; O'Rourke, L. (2009): Planning for impacts of climate change at
U.S. ports. In: Journal of the Transportation Research Board, pp. 15-21.
Gallivan, F.; Bailey, K.; O'Rourke, L. (2009): Planning for impacts of climate change at
U.S. ports. In: Journal of the Transportation Research Board, pp. 15-21.
Gardiner, L.; Firestone, D.; Waibl, G.; Mistal, N.; Van Reenan, K.; Hynes, D.; Smart, J.;
Byfield, J.; Oldfield, S.; Allan, S.; Kouvelis, B.; Tait, A. (2008): Climate change ef-
fects on the land transport network volume one: Literature Review and Gap
Analysis, NZ Transport Agency Research Report 378 (ed.).
Gebauer, J.; Welp, M.; Wurbs, S. (2009): Arbeitspapier zur Vorbereitung des Stake-
holderdialogs zu Chancen und Risiken des Klimawandels, Verkehrsinfra-struktur-
Dialoge zur Klimaanpassung Verkehrsinfrastruktur.

WEATHER D2: Vulnerability of Transport Systems
110
GHD (2008): Far North Flood Damage, Local Roads Perspective;
http://www.roads.co.nz/Napier%20Presentations/pdfs/FAR%20NORTH%20FLO
OD%20DAMAGE.pdf
Goodwin, Lynette C. (2002): Weather Impacts on Arterial Traffic Flow, Mitretek Sys-
tems, Inc.
Guest, T. (2007): A Matter of Time: Air Traffic Delay in Europe, Trends in Air Traffic,
Volume 2, Brussels: EUROCONTROL European Organisation for the Safety of
Air Navigation .
Haanpaa et al (2006) Impacts of winter storm Gudrun of 7th-9th January 2005 and
measures taken in Baltic Sea Region. EC ASTRA project
Hallegatte et al (2008), Assessing climate change impacts, sea level rise and storm
surge risk in port cities: a case study on Copenhagen, OECD Environment work-
ing pa-pers no 3.
Hanbali, R.M. and D.A. Kuemmel (1993): Traffic Volume Reductions Due to Winter
Storm Conditions, In Transportation Research Record 1387, Transportation Re-
search Board, National Research Council, Washington, D.C., pp. 159-164.
Hauf, T.; Leykauf, H.; Schumann, U. (2004a): Luftverkehr und Wetter, Statuspapier
Juni 2004: Universität Hannover, Deutscher Wetterdienst (DWD), Deutsches
Zentrum für Luft- und Raumfahrt (DLR).
Hauf, T.; Leykauf, H.; Schumann, U. (2004b): Luftverkehr und Wetter, Statuspapier
Juni 2004: Universität Hannover, Deutscher Wetterdienst (DWD), Deutsches
Zentrum für Luft- und Raumfahrt (DLR).
HEATCO (2006) "Developing Harminised European Approaches for Transport Costing
and Project Asssessment"
HEATCO (2006): Developing Harminised European Approaches for Transport Costing
and Project Asssessment.
Hellman, Fredrik, Knud A. Pihl and Klas Hansson (2010): Inspection and Maintenance
guide for reducing vulnerability due to flooding of roads, Report 4 May 2010, Dan-
ish Road Institute, Swedish National Road and Transport Research Institute,
SWAMP, Storm WAter prevention - Methods to Predict damages from water
stream in and near road pavements in lowland areas, Project Nr. TR80A 2008-
72545.

WEATHER D2: Vulnerability of Transport Systems
111
Henny A.J. van Lanen, 2006 Drought in the Netherlands, 20 July 2006
Hermans, Elke, Geert Wets? and Filip Van den Bossche (2005): Describing the Evolu-
tion in the Number of Highway Deaths by a Decomposition in Exposure, Accident
Risk and Fatal risk, Diepenbeek, Belgium.
Hermans, Elke, Tom Brijs, Tim Stiers and Col Offermans (no date): The Impact of
Weather Conditions on Road Safety Investigated on an Hourly Basis, Diepen-
beek, Belgium.
Hisdal, H., Stahl, K., Tallaksen, L.M., Demuth S. 2001, Have droughts in Europe be-
come more severe or frequent? International Journal of Climatology, 21, 317 -
333
Hoffmann, E.; Rotter, M.; Welp, M. (2009): Arbeitspapier zur Vorbereitung des Stake-
holderdialogs zu Chancen und Risiken des Klimawandels - Verkehrsinfrastruk-
tur, Institut für ökologische Wirtschaftsforschung (IÖW); FH-Eberswalde (eds.),
Berlin.
ICAO (2009): MET Strategy in supporting the Global ATM Operational Concept for the
EUR Region (working draft), Neuilly-sur-Seine, France: International Civil Avia-
tion Organisation (ICAO), European and North Atlantic Office.
ICAO (2009): MET Strategy in supporting the Global ATM Operational Concept for the
EUR Region (working draft), Neuilly-sur-Seine, France: International Civil Avia-
tion Organisation (ICAO), European and North Atlantic Office.
ICAO (2010): High Level Safety Conference 2010, Montréal, 29 March to 1 April 2010,
Topic 3.3: Effects of Climate Change on Aviation Safety, Montréal: International
Civil Aviation Organnisation (ICAO).
ICAO (2010): High Level Safety Conference 2010, Montréal, 29 March to 1 April 2010,
Topic 3.3: Effects of Climate Change on Aviation Safety, Montréal: International
Civil Aviation Organnisation (ICAO).
ICF (2007): The Potential Impacts of Global Sea Level Rise on Transportation Infra-
structure. Phase 1 - Final Report: the District of Columbia, Maryland, North Caro-
lina and Virginia: ICF International.
Internationale Verlade- und Transportbedingungen für die Binnenschiffahrt (IVTB),
1999, prepared by Verein für europäische Binnenschiffahrt und Wasserstraßen.

WEATHER D2: Vulnerability of Transport Systems
112
IPCC (2001): Climate Change 2001: The Scientific Basis. Contribution of the Working
Group I to the Third Assessment Report of the Intergovernmental Panel on Cli-
mate Change, Cambridge and New York.
IPCC (2007): Fourth Assessment Report: Climate Change 2007 (AR4). Working Group
I Report "The Physical Science Basis", Solomon, S.; Quin, D.; Manning, M.;
Chen, Z.; Marquis, M.; Averyt, K.B.; Tignor, M.; Miller, H.L. (eds.), Geneva: Inter-
governmental Panel on Climate Change (IPCC).
Istanes, A; et al. (2005) " Infrastructure: Buildings, Support Systems, and Industria Fa-
cilities", Arctic Climate Impact Assessment, Cambridge
Jenelius, Erik (2008): Network structure and travel patterns: explaining the geographi-
cal disparities of road network vulnerability, Div. of Transport and Location Analy-
sis, KTH, Sweden.
Jetzki, M. (2009): ´The propagation of air transport delays in Europe: Department of
Airport and Air Transportation Research, RWTH Aachen.
Kågeson, Per (2005): Reducing CO2 Emissions from New Cars A progress report on
the car industry's voluntary agreement and an assessment of potential policy in-
struments, T&E 05/1, Brussels.
Karlaftis, Matthew G and Yannis, George (2010): Weather Effects on Daily Traffic Ac-
cidents and Fatalities: Time Series Count Data Approach, Transportation Re-
search Board 89th Annual Meeting, Washington DC.
Kerr, A.; McLeod, A. (2001): Potential adaptation strategies for climate change in Scot-
land, University of Edinburgh, Scottish Executive Central Research Unit.
Kim T. J., Lee J. S. Development of Index for Identifying Critical Transportation Links.
Irene Johansson (ed), Uddevalla Symposium: Entrepreneurship and Develop-
ment-Local Processes and Global Patterns, University West, Trollhättan, Swe-
den, 2006.
Kinsella,. Yvette and Frank McGuire (2006): Climate change uncertainty and the state
highway network: A moving target Transit New Zealand.
Knapp, K.K.; Smithson, L.D.; Khattak, A.J. (2000): The Mobility and Safety Impacts of
Winter Storm Events in a Freeway Environment.
WEATHER D2: Vulnerability of Transport Systems
113
Knapp, Keith K., Leland D. Smithson, and Aemal J. Khattak (2000): The Mobility and
Safety Impacts of Winter Storm Events in a Freeway Environment, Mid-Continent
Transportation Symposium 2000 Proceedings, Iowa, USA.
Koetse, M. J.; Rietveld, P. (2009): The impact of climate change and weather on trans-
port: An overview of empirical findings.
Koetse, M.J, Rietveld, P. (2009) "The impact of climate change and weather ontrans-
port: An overview of empirical findings", Transportation Research, Part D
Koetse, M.J.; Rietveld, P. (2009): The impact of climate change and weather on trans-
port: An overview of empirical findings. In: Transportation Research Part D, 14
(2009), pp. 205-221.
Kulesa, G. (2002): Weather and Aviation: How Does Weather Affect the Safety and
Operations of Airports and Aviation, and How Does FAA Work to Manage
Weather-related Effects?, Washington D.C.: Transportation Research Board
(TRB).
Kulesa, G. (2002): Weather and Aviation: How Does Weather Affect the Safety and
Operations of Airports and Aviation, and How Does FAA Work to Manage
Weather-related Effects?, Washington D.C.: Transportation Research Board
(TRB).
Leckebusch, Gregor C., Dominik Renggli and Uwe Ulbrich (2008): Development and
application of an objective storm severity measure for the Northeast Atlantic re-
gion, Meteorologische Zeitschrift, Vol. 17, No. 5, 575-587
Lemmen, D.S.; Warren, F.J. (2004): Climate Change Impacts and Adaptation: A Cana-
dian Perspective, Natural Resources Canada (ed.), Otrtawa: Transpot Canada.
Lindberg, G. (1999), Calculating transport accident costs, Final report of the expert
advisors to the High Level Group on Transport Infrastructure Charging, Working
Group 2, European Commission, Brussels.
Lindgren, J.; Jonsson, D.K.; Carlsson-Kanyama, A. (2009): Climate adaption of rail-
ways: Lessons from Sweden. In: EJTIR (9), pp. 164-181.
Littorini, H. (2010): Weather Extremes – Vulnerability and adaptation at Swedish air-
ports. Presentation at the WEATHER Workshop (Vulnerability Workshop), 14.
September 2010, Brussels.
Lockwood, Steve: Operational Responses to Climate Change Impacts, PB Consult

WEATHER D2: Vulnerability of Transport Systems
114
Maggi, R. (2009):Evaluation of the optimal resilience for vulnerable infrastructure net-
works. An interdisciplinary pilot study on the transalpine transportation corridors,
NRP 54 "Sustainable Development of the Built Environment", Projekt Nr. 405
440, Swiss National Science Foundation, Lugano.
Maibach, M.; Schreyer, C.; Sutter, D.; van Essen, H.P.; Boon, B.H.; Smokers, R.;
Schroten, A.; Doll, C.; Pawlowska, B.; Bak, M. (2008): Handbook on estimation of
External Costs in the Transport Sector. Report Produced within the study In-
ternalisation Measures and Policies for All external Cost of Transport (IMPACT),
INFRAS (Zurich); CE (Delft); Fraunhofer-ISI (Karlsruhe); University of Gdansk
(eds.), Delft: European Commission.
Maibach, M.; Schreyer, C.; Sutter, D.; van Essen, H.P.; Boon, B.H.; Smokers, R.;
Schroten, A.; Doll, C.; Pawlowska, B.; Bak, M. (2008): Handbook on estimation of
External Costs in the Transport Sector. Report Produced within the study Inter-
nalisation Measures and Policies for All external Cost of Transport (IMPACT),
INFRAS (Zurich); CE (Delft); Fraunhofer-ISI (Karlsruhe); University of Gdansk
(eds.), Delft: European Commission.
Market observation for inland navigation in Europe, 2007-1. Central Commission for
Navi-gation on the Rhine, EC DG TREN, April 2008
Market Observation no.9. Supply and Demand in 2008 and Analysis of the Situation as
of Mid-2009.
Martin, P., et al, (2000): Inclement Weather Signal Timings, University of Utah Traffic
Lab, 2000
Martin, T (2002): Estimating heavy road wear costs for bituminous surfaced arterial
roads, Journal of Transportation Engineering, Vol 128, No 2, p103-110.
Maze, Thomas H., Michael R. Crum, and Garrett Burchett (2005): An Investigation of
User Costs and Benefits of Winter Road Closures, MTC Project 2003-01, U.S.
Department of Transportation Research and Special Programs Administration,
Washington.

WEATHER D2: Vulnerability of Transport Systems
115
Meehl, G.A., T.F. Stocker, W.D. Collins, P. Friedlingstein, A.T. Gaye, J.M. Gregory, A.
Kitoh, R. Knutti, J.M. Murphy, A. Noda, S.C.B. Raper, I.G. Watterson, A.J.
Weaver and Z.-C. Zhao, (2007): Global Climate Projections. In: Climate Change
2007: The Physical Science Basis. Contribution of Working Group I to the Fourth
Assessment Report of the Intergovernmental Panel on Climate Change [Solo-
mon, S., D. Qin, M. Manning, Z. Chen, M. Marquis, K.B. Averyt, M. Tignor and
H.L. Miller (eds.)]. Cambridge University Press, Cambridge, United Kingdom and
New York, NY, USA.
Mitretek Systems (no date): Analysis of Weather Incident Effects on Commercial Vehi-
cle Mobility in Large U.S. Cities.
Muzira, Stephen and Martin Humphreys and Wolfhart Pohl (2010): Geohazard Man-
agement in the Transport Sector, The World Bank, Washington, DC, Transport
Note No. TRN-40 March 2010.
Nagurney A., Qiang Q. Fragile Networks: Identifying Vulnerabilities and Synergies in an
Uncertain World. John Wiley & Sons, Amherst, Massachusetts, 2009.
Nathanaelsson, K. (2010): What impact will climate change have on roads in Sweden
and how to deal with it? Presentation at the WEATHER Workshop (Vulnerability
Workshop), 14. September 2010, Brussels.
National Research Council (2004): When the Weather meets the Road.
National Research Council (2008): Potential impacts of climate change on U.S. trans-
portation, Committee on Climate Change and U.S. Transportation, Transportation
Research Board Special Report 290.
NEA Kostenkengetallen binnenvaart 2008
Norwell, Gary (2004): Impact of Climate Change on Road Infrastructure, Austroads
Project No. RSM.S.N.503, Austroads Publication No. AP-R243/04, Sydney
O. Jonjeren, B. Jourquin, P.Rietveld (2009), Modal-split effects of climate change: the
effect of low water levels on the competitive position of inland waterway trans-
port in the river Rhine area, Transportation Research Part A: Policy and Prac-
tice,
ÖBB-Infrastructure 2004 - 2010 "Annual Reports 2004 to 2009"
OEBB Infrastructure (2004 – 2010): Annual Reports 2004 to 2009.

WEATHER D2: Vulnerability of Transport Systems
116
Olaf Jonkeren, Piet Rietveld and Jos van Ommeren, Climate Change and Inland Wa-
ter-way Transport: Welfare Effects of Low Water Levels on the river Rhine, Jour-
nal of Trans-port Economics and Policy, 2007, vol. 41, issue 3, pages 387-411
OoCC / ProClim (2007): Klimaänderung und die Schweiz 2050: Erwartete Auswirkun-
gen auf Umwelt, Gesellschaft und Wirtschaft.
Padgett; Jamie , Reginald DesRoches; Bryant Nielson; Mark Yashinsky; Oh-Sung
Kwon; Nick Burdette; and Ed Tavera (2008): Bridge Damage and Repair Costs
from Hurricane Katrina, / Journal Of Bridge Engineering, January/February 2008.
Perry, A.H. and L.J. Symons (1991): Highway Meteorology, University of Wales, Swan-
sea, Wales, United Kingdom.
PIANC. Waterborne transport, ports and waterways: a review of climate change dri-
vers, impacts, responses and mitigation. Report of PIANC EnviCom Task Group
3: Climate change and navigation.
PIARC Technical Committee (2010): Snow And Ice Data Yearbook 2010, B5 Winter
Service.
Pisano, P, Goodwin, L, and Stern, A (2002) Surface Transportation Safety and Opera-
tions: The Impacts of Weather within the Context or Climate Change. Proceed-
ings from The Potential Impacts of Climate Change on Transportation Workshop,
U.S. Department of Transportation: Centre for Climate Change and Environ-
mental Forecasting. [electronic version]. Retrieved 27 January 2007 from
http://climate.volpe.dot.gov/workshop1002/ index.html
Pisano, Paul A., Lynette C. Goodwin and Michael A. Rossetti (2007):U.S. Highway
Crashes In Adverse Road Weather Conditions, Washington D.C.
PlaneCrashInfo.com (2011): Statistics: Causes of Fatal Accidents by Decade.
PlaneCrashInfo.com (2011): Statistics: Causes of Fatal Accidents by Decade.
Prevedouros, Kongsil (2003): Synthesis of the Effects of Wet Conditions on Highway
Speed and Capacity, University of Hawaii-Manoa, Department of Civil Engineer-
ing.
PTV (2011): URL http://www.ptv-vision.com/software/transportation-planning-traffic-
engineering/software-system-solutions/visum/

WEATHER D2: Vulnerability of Transport Systems
117
Qiu, Nixon (2007): Effects of Adverse Weather on Traffic Crashes: Systematic Review
and Meta-Analysis, 87th Transportation Research Board (TRB) Annual Meeting,
University of Iowa.
Quan, C.; Trani, A.A.; Srinivas, S. (2002): Modeling the economic impact of adverse
weather into en route flights. In: Transportation research record, 1788, pp. 76-82.
Quan, C.; Trani, A.A.; Srinivas, S. (2002): Modeling the economic impact of adverse
weather into en route flights. In: Transportation research record, 1788, pp. 76-82.
Queensland Government (2002): Guidance on the Assessment of Tangible Flood
Damages,
http://www.derm.qld.gov.au/water/regulation/pdf/guidelines/flood_risk_manageme
nt/tangible_flood_damages.pdf
Räisänen, J., U. Hansson, A. Ullerstig, R. Döscher, L.P. Graham, C. Jones, M. Meier,
P. Samuelsson and U. Willén (2004): European climate in the late 21st century:
regional simulations with two driving global models and two forcing scenarios.
Climate Dyn., 22, 13-31.
RECORDIT (2003) "Real Cost Reduction of Door-to-Door Intermodal Transport", Deli-
verable 3 Resource cost calculation for selected corridors
Regmi, M.B.; Hanaoka, S. (2009): Impacts of Climate Change on Transport and Adap-
tation in Asia.
Reidenbach, Michael et al (2008): Investitionsrückstand und Investitionsbedarf der
Kommunen, Edition Difu, Stadt Forschung Praxis, Berlin.
RFI, 2007 "Rete AV/AC Analisi dei Costi", presentation to the internal seminar at RFI
(Italian Railway Network manager)
Risk Management Solution (2009): The 1999 Sydney Hailstorm, 10-Year Retrospec-
tive, RMS Special Report.
Rockel, B. and K. Woth (2007): Extremes of near-surface wind speed over Europe and
their future changes as estimated from an ensemble of RCM simulations. Cli-
matic Change, 81, S267-S280.
Rosen, A. (2002): Flight Delays on US Airlines: The Impact of Congestion Externalities
in Hub and Spoke Networks: Department of Economics, Stanford University
Rosen, A. (2002a): Flight Delays on US Airlines: The Impact of Congestion External-
ities in Hub and Spoke Networks: Department of Economics, Stanford University.

WEATHER D2: Vulnerability of Transport Systems
118
Rosen, A. (2002b): Flight Delays on US Airlines: The Impact of Congestion External-
ities in Hub and Spoke Networks: Department of Economics, Stanford University.
Rossetti, M.A. (2002): The Potential Impacts of Climate Change on Transportation -
Potential Impacts of Climate Change on Railroads.
Rossi, G., Cancelliere, A., Pereira, L., and Oweis, T. (2003). Tools for Drought Mitiga-
tion in Mediterranean Region, Kluwer.
Rowland, Bevan D. and Davey, Jeremy D. and Freeman, James E. and Wishart, Dar-
ren E. (2007): Road transport sensitivities to weather and climate change in Aus-
tralia. In Proceedings 30th Australasian Transport Research Forum, Melbourne,
Australia.
Saarelainen, Seppo (2006): Adaptation to climate change in the transport sector.
FINADAPT. Working Paper 8, Finnish Environment Institute Mimeographs 338,
Helsinki.
Sabir, Muhammad, Jos van Ommeren, Mark Koetse, Piet Rietveld (2008): Welfare Ef-
fects Of Adverse Weather Through Speed Changes In Car Commuting Trips, VU
University, Department of Spatial Economics, Amsterdam, the Netherlands.
Satterthwaite, S., (1976): An Assessment of Seasonal and Weather Effects on the Fre-
quency of Road Accidents in California, University College London, Traffic Stud-
ies Group; Accident Analysis and Prevention, Vol. 8, No. 2, pp. 87-96.
Savonis, M.J.; Burkett, V.R.; Potter, J.R. (2008): Impacts of Climate Change and Vari-
abil-ity on Transportation Systems and Infrastructure: Gulf Coast Study, Phase I,
Federal Highway Administration; U.S.Geological Survey; Cambridge Systematics
(eds.): U.S. Climate Change Science Program and the Subcommittee on Global
Change Re-search.
Schmidt-Thome et al (2006). The Spatial Effects and Management of natural and
Technological Hazards in Europe - ESPON 1.3.1. Executive Summary.
Schmidt-Thomé, Philipp (ed) (2006): The Spatial Effects and Management of Natural
and Technological Hazards in Europe, ESPON 1.3.1
Schreyer, C.; Schneider, C.; Maibach, M.; Rothengatter, W.; Doll, C.; Schmedding, D.
(2004): External Costs of Transport Update Study. Final Report, IWW (Uni
Karlsruhe); INFRAS (eds.), Zürich, Karlsruhe: International Union of Railways
(UIC).
WEATHER D2: Vulnerability of Transport Systems
119
Schulz C., ‗Identification of critical transport infrastructures‘, Climate change and vul-
nerability: challenges for spatial planning and civil protection, 2007.
SEDEMED Hydro meteorological monitoring systems and drought bulletins.
www.uirsicilia.it
Seidelman C., 2010 "40 years of Road-Rail Combined Transport in Europe", UIRR
Seneviratne, Sonia I., Daniel Lüthi, Michael Litschi and Christoph Schär (2006): Land–
atmosphere coupling and climate change in Europe, Nature Vol 443|14 Septem-
ber 2006|doi:10.1038/nature05095.
Smith, K. (1982). How seasonal and weather conditions influence road accidents in
Glasgow. In: Scottish Geographical Magazine, vol. 98, p. 103-114.
Stiers, T. (2005). Studie van de impact van weercondities op de verkeersveiligheid op
uurniveau. Limburgs Universitair Centrum, Faculteit Toegepaste Economische
Wetenschappen, Leuven.
SWOV Fact Sheet (2009): The influence of weather on road safety, Leidschendam, the
Netherlands.
Taylor M. A. P. and D‘Este G. M. ‗Transport Network Vulnerability: a Method for Diag-
nosis of Critical Locations in Transport Infrastructure Systems‘. Critical Infrastruc-
ture: Reliability and Vulnerability, pp. 9-30, 2007.
Thoma, J. (1993). Geschwindigkeitsverhalten und Risiken bei verschiedenen Stras-
senzuständen, Wochentagen und Tageszeiten. Schweizerische Beratungsstelle
für Unfallverhütung BfU, Bern.
Thordarson, Skuli (2008): Climate Change and Winter Road Service, COST 353 Final
Seminar Bad Schandau, Germany May 26. - 28. 2008.
TRANS-TOOLS (2011): URL http://energy.jrc.ec.europa.eu/transtools
TRB (2008): Potential impacts of climate change on U.S transportation, Transportation
Research Board (ed.), Washington D.C.
TRKC (2009) "Thematic Research Summary Freight Transport", available at
www.trasport-research.info
WEATHER D2: Vulnerability of Transport Systems
120
U.S. Climate Change Science Program and the Subcommittee on Global Change Re-
search (2008): U.S. Climate Change Science Program Synthesis and Assess-
ment Product 4.7, Impacts of Climate Change and Variability on Transportation
Systems and Infrastructure: Gulf Coast Study, Phase I.
UNECE map of navigable rivers.
UNEP, 2003. Impacts of summer 2003 heat wave in Europe. DEWA/Europe/GRID -
Ge-neva.
Van der Linden P., and J.F.B. Mitchell (eds.) (2009): ENSEMBLES: Climate Change
and its Impacts: Summary of research and results from the ENSEMBLES project.
Met Office Hadley Centre, FitzRoy Road, Exeter EX1 3PB, UK. 160pp.
Victorian Government (2006): Climate Change and Infrastructure – Planning Ahead:
part of the Victorian climate change adaptation program, A Victorian Government
initiative.
Washington State Department of Transportation (2002): Highway Construction Cost
Comparison Survey, Final Report, Washington DC.
Wasser und Schifffahrtsdirektion Sudwest.2009, Verkehrsbericht der Wasser und und
Schifffahrtsdirektion Sudwest 2008
Webb, Matthew (2010): TfL – Managing Adaptation to Climate Change. Presentation at
the WEATHER Workshop (Vulnerability Workshop), 14. September 2010, Brus-
sels.
Welch, J, Vaughan, R, Andreassend, D and Folovary, L (1970): Weather conditions
and road accidents. In Proceedings of the Australian Road Research Board Con-
ference. 5 pp. 190- 208.
Windstorm Erwin/Gudrun - January 2005. Guy Carpenter, Practice Briefing, issue no 2
(2005)
Winter storms in Europe (II). Analysis of 1999 losses and loss potentials (2002). Mu-
nich Re Group


![Elastic Analysis & Application Tables of Rectangular Plates [Artigo-papanikolaou]](https://static.fdocuments.in/doc/165x107/55cf9cb5550346d033aac39c/elastic-analysis-application-tables-of-rectangular-plates-artigo-papanikolaou.jpg)