Vulnerability of Paddy and Maize to Climate Variability in ... · to Climate Variability in...
59
Vulnerability of Paddy and Maize to Climate Variability in Indonesia and Vulnerability Map of paddy to Climate Change in Bali Dr. Edvin Aldrian, Dr. Takeshi Takama, Alifi Maria Ulfa, Pudji Setyani, Risya Okta and Mamenun Center for Climate Change and Air Quality Meteorological Climatological and Geophysical Agency (BMKG) Email: [email protected] The First International Workshop of Climatic Changes and their Effects on Agriculture in Asian Monsoon Region, 3-4 March 2012, Bangkok, Thailand
Transcript of Vulnerability of Paddy and Maize to Climate Variability in ... · to Climate Variability in...
Vulnerability of Paddy and Maize to Climate Variability in Indonesia and
Vulnerability Map of paddy to Climate Change in Bali
Dr. Edvin Aldrian, Dr. Takeshi Takama, Alifi Maria Ulfa, Pudji Setyani, Risya Okta and Mamenun
Center for Climate Change and Air Quality Meteorological Climatological and Geophysical
Agency (BMKG)Email: [email protected]
The First International Workshop of Climatic Changes and their Effects on Agriculture in Asian Monsoon Region, 3-4 March 2012, Bangkok, Thailand
Presentation Outline
1.Background of regional climate phenomena
2.ENSO phases and impacts3.Vunerability index of harvest area
from paddy and maize4.Development of Vulnerability Map
of Paddy for Bali
BMKG
Background of regional climate phenomena
BMKG
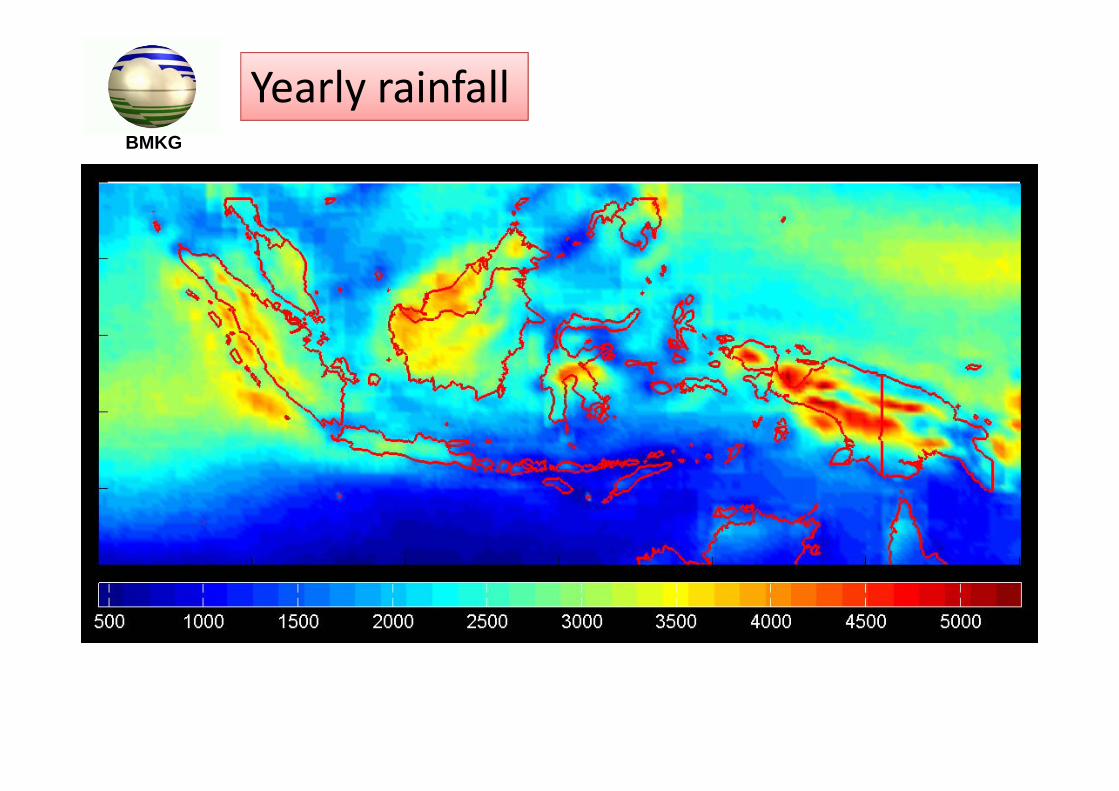
Yearly rainfallBMKG
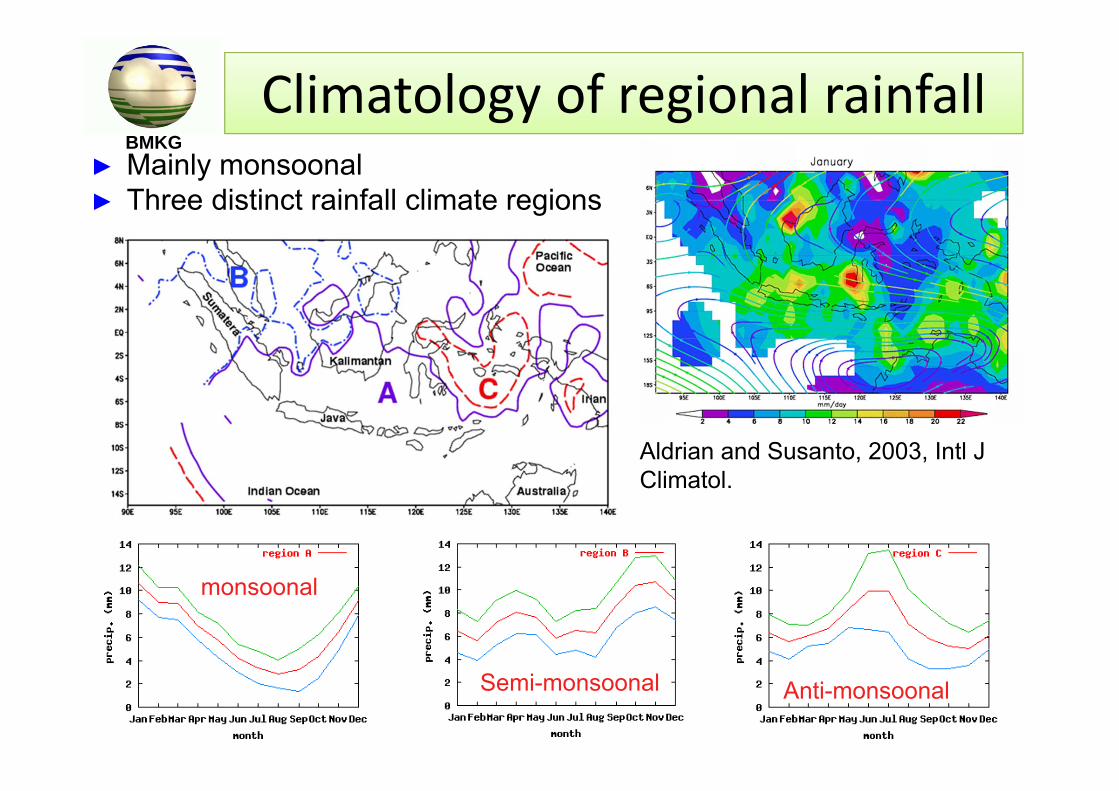
Climatology of regional rainfall► Mainly monsoonal► Three distinct rainfall climate regions
monsoonal
Semi-monsoonal Anti-monsoonal
Aldrian and Susanto, 2003, Intl J Climatol.
BMKG
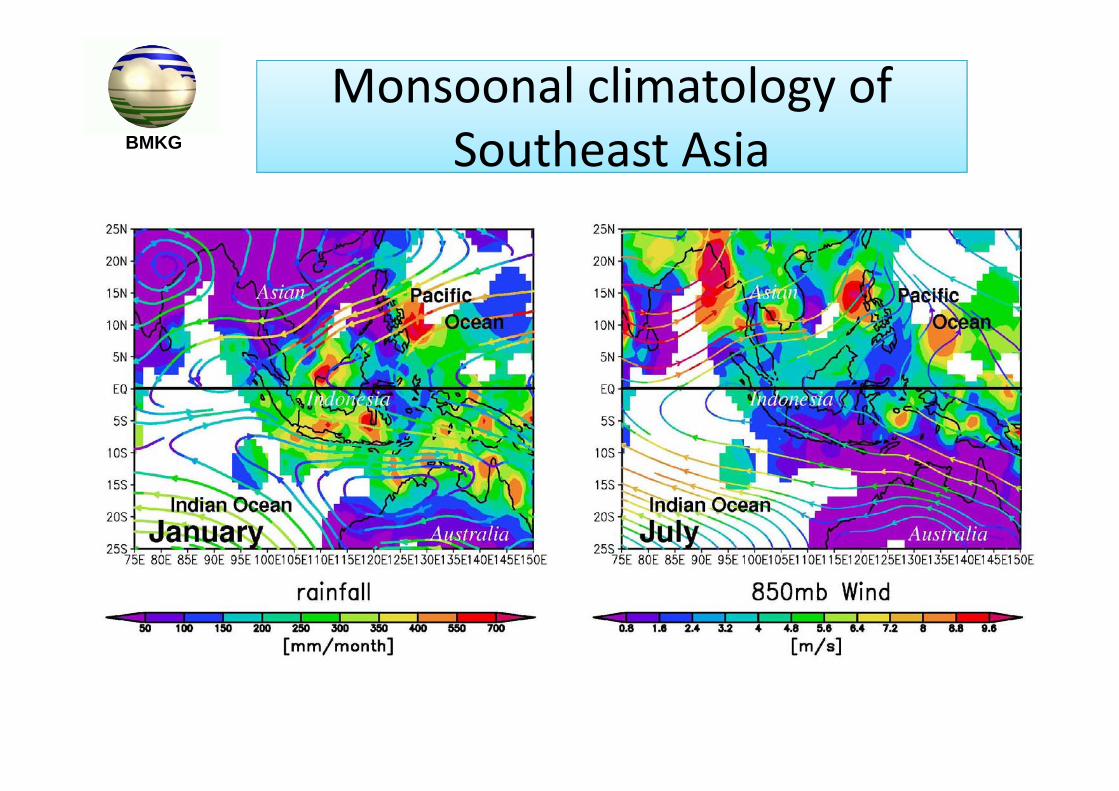
Monsoonal climatology of Southeast AsiaBMKG
BMKG
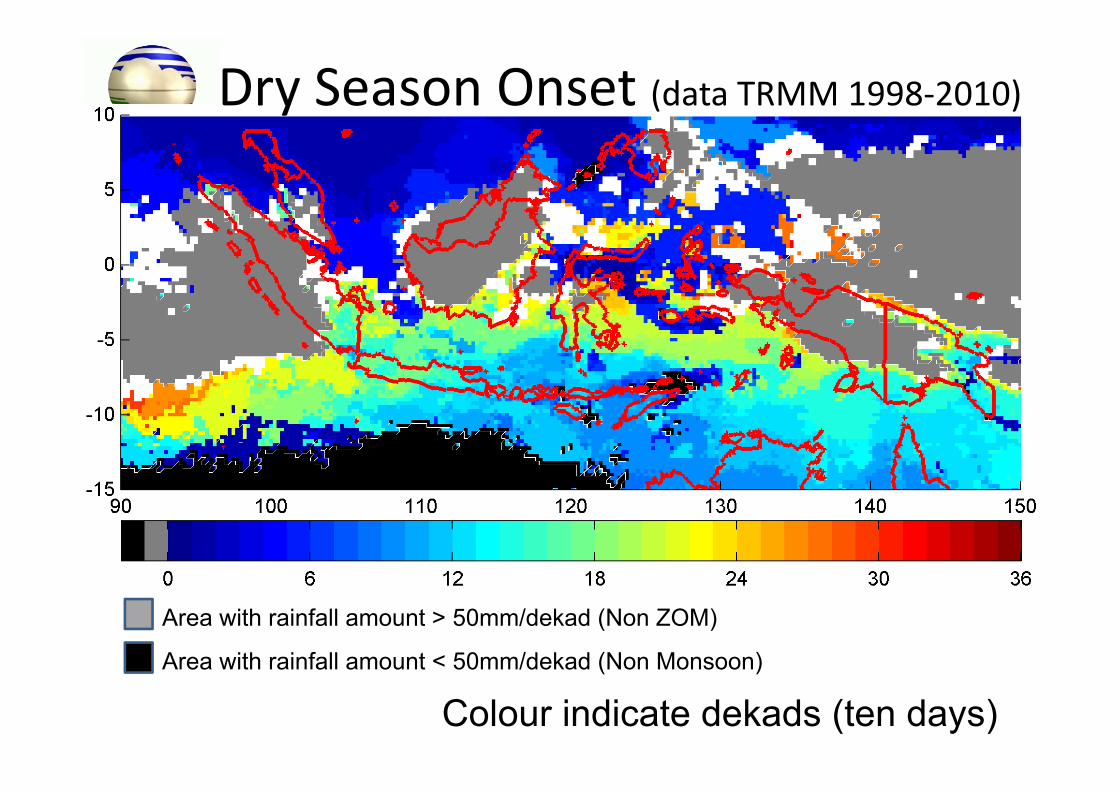
Colour indicate dekads (ten days)
Area with rainfall amount > 50mm/dekad (Non ZOM)
Area with rainfall amount < 50mm/dekad (Non Monsoon)
Dry Season Onset (data TRMM 1998‐2010)
BMKG
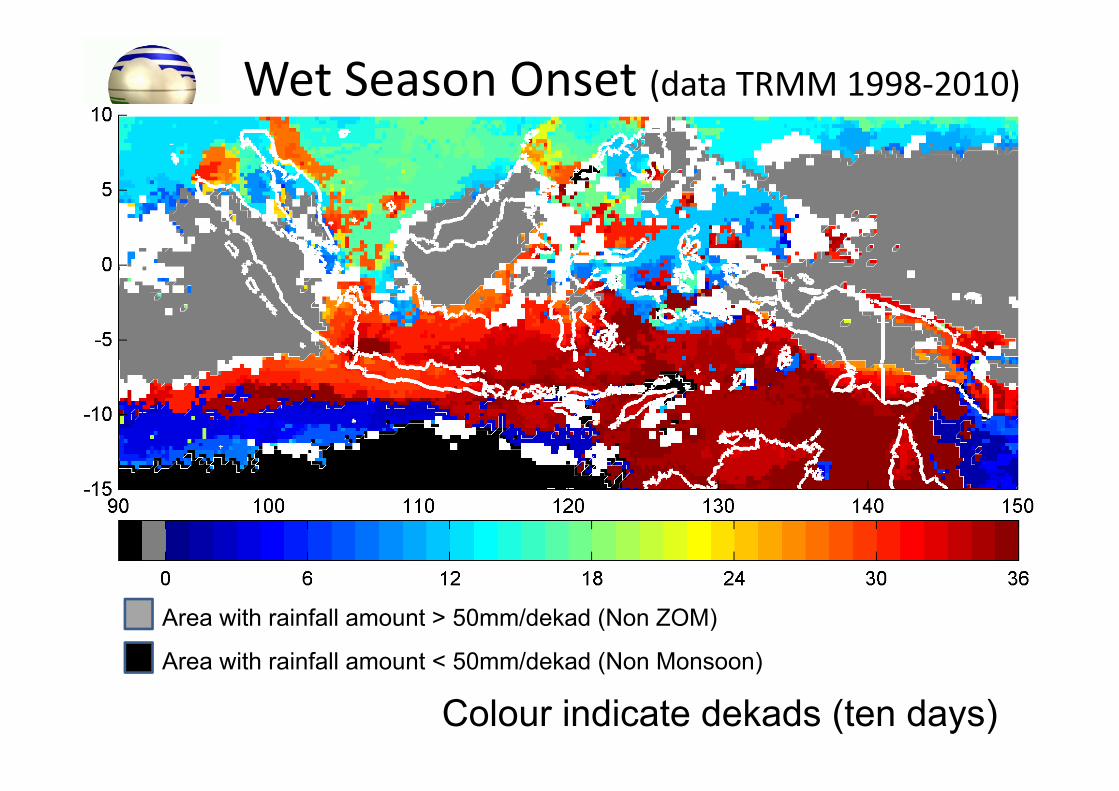
Wet Season Onset (data TRMM 1998‐2010)
Colour indicate dekads (ten days)
Area with rainfall amount > 50mm/dekad (Non ZOM)
Area with rainfall amount < 50mm/dekad (Non Monsoon)
ENSO phases and impacts
BMKG
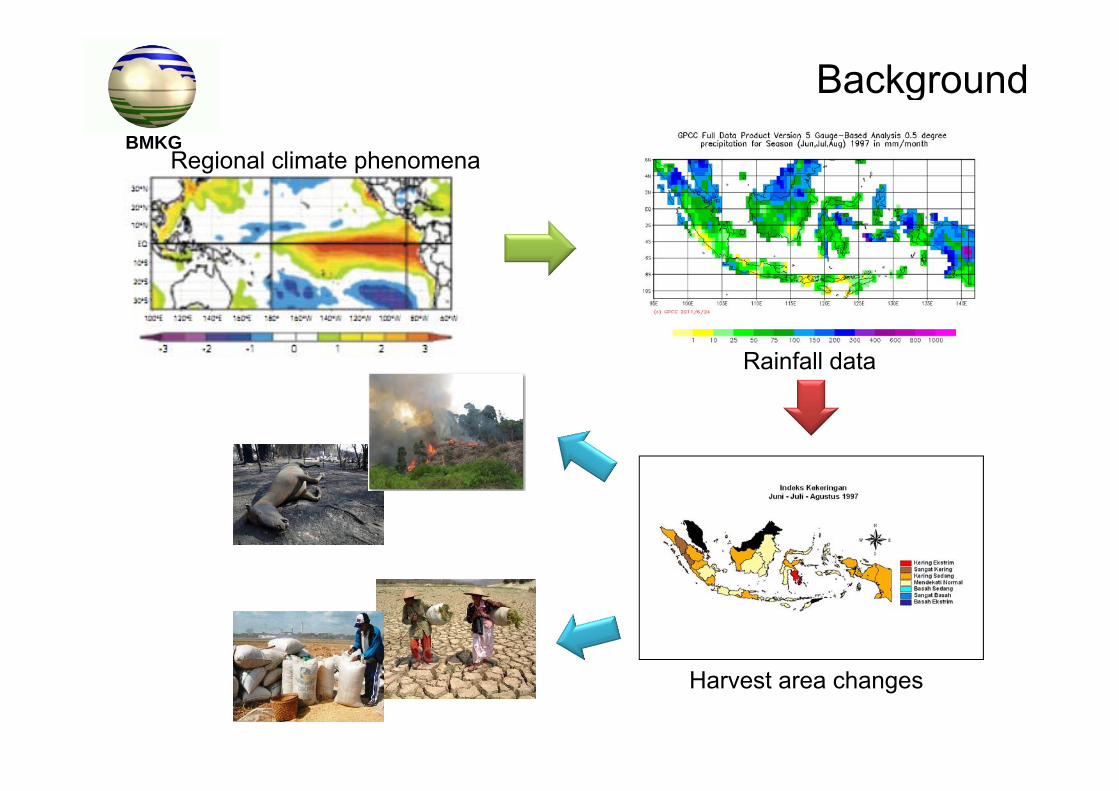
Background
Regional climate phenomena
Rainfall data
Harvest area changes
BMKG
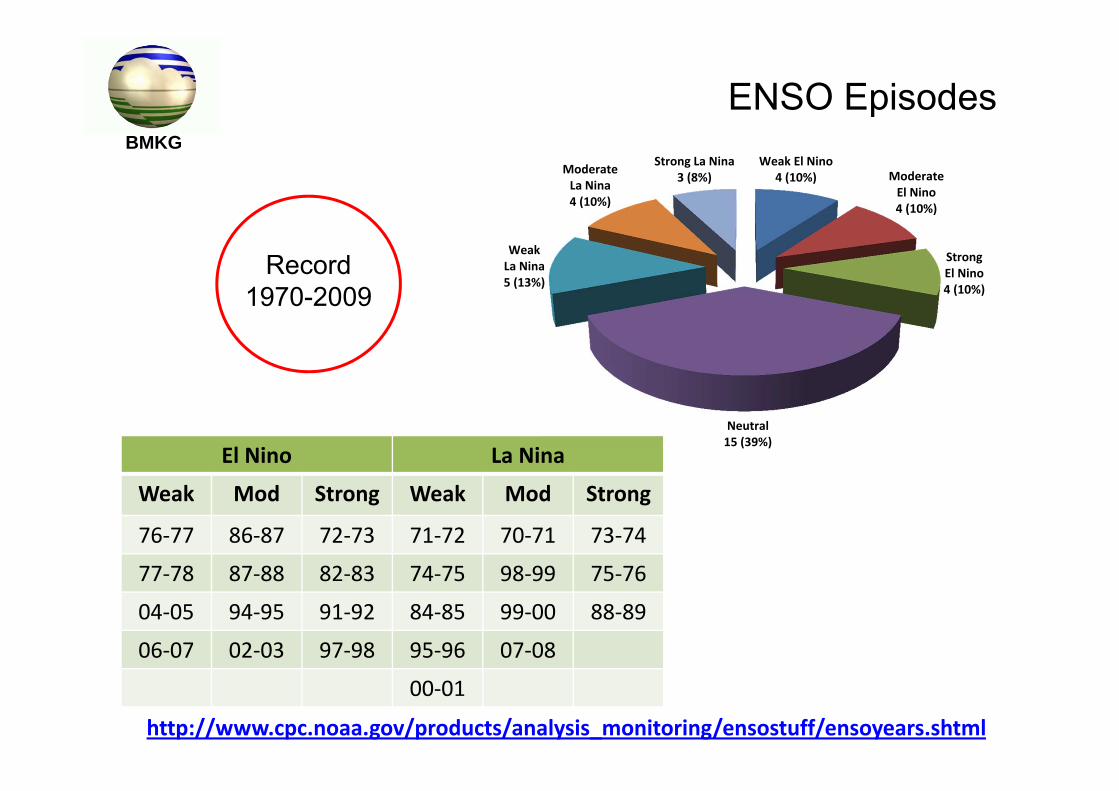
Record1970-2009
http://www.cpc.noaa.gov/products/analysis_monitoring/ensostuff/ensoyears.shtml
El Nino La Nina
Weak Mod Strong Weak Mod Strong
76‐77 86‐87 72‐73 71‐72 70‐71 73‐74
77‐78 87‐88 82‐83 74‐75 98‐99 75‐76
04‐05 94‐95 91‐92 84‐85 99‐00 88‐89
06‐07 02‐03 97‐98 95‐96 07‐08
00‐01
Weak El Nino4 (10%) Moderate
El Nino4 (10%)
Strong El Nino4 (10%)
Neutral15 (39%)
Weak La Nina5 (13%)
Moderate La Nina4 (10%)
Strong La Nina3 (8%)
ENSO EpisodesBMKG
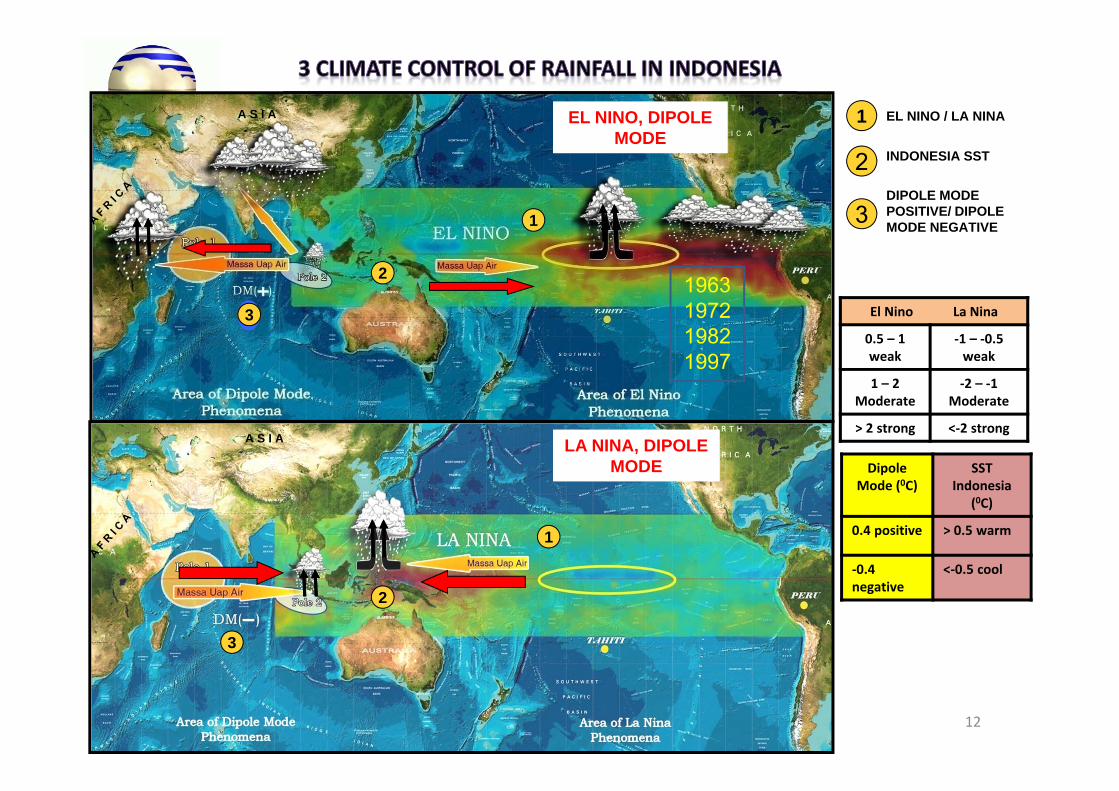
BMKGEL NINO / LA NINA
INDONESIA SST
A S I A
A S I A
1
2
3DIPOLE MODE POSITIVE/ DIPOLE MODE NEGATIVE1
2
1
3
2
Dipole Mode (0C)
SST Indonesia
(0C)
0.4 positive > 0.5 warm
‐0.4 negative
<‐0.5 cool
El Nino La Nina
0.5 – 1 weak
‐1 – ‐0.5 weak
1 – 2 Moderate
‐2 – ‐1Moderate
> 2 strong <‐2 strong
1963197219821997
3
EL NINO, DIPOLE MODE
LA NINA, DIPOLE MODE
12
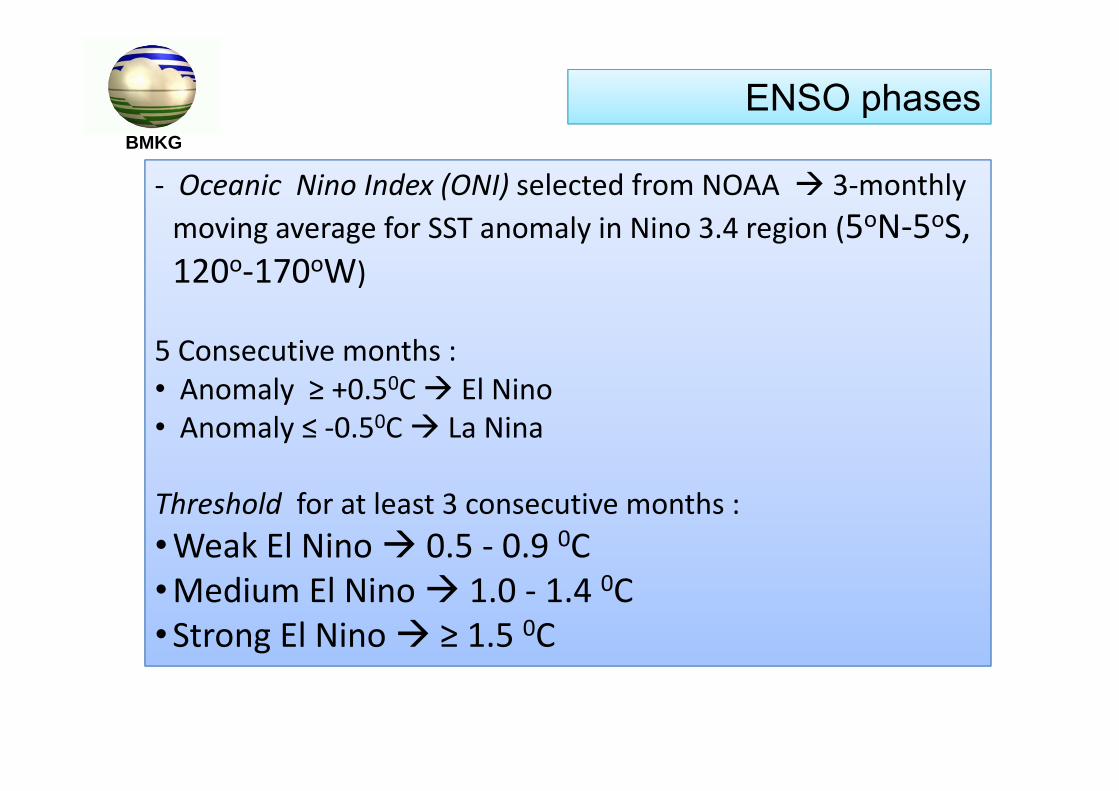
‐ Oceanic Nino Index (ONI) selected from NOAA 3‐monthly moving average for SST anomaly in Nino 3.4 region (5oN‐5oS, 120o‐170oW)
5 Consecutive months :• Anomaly ≥ +0.50C El Nino• Anomaly ≤ ‐0.50C La Nina
Threshold for at least 3 consecutive months :•Weak El Nino 0.5 ‐ 0.9 0C•Medium El Nino 1.0 ‐ 1.4 0C•Strong El Nino ≥ 1.5 0C
ENSO phasesBMKG
BMKG
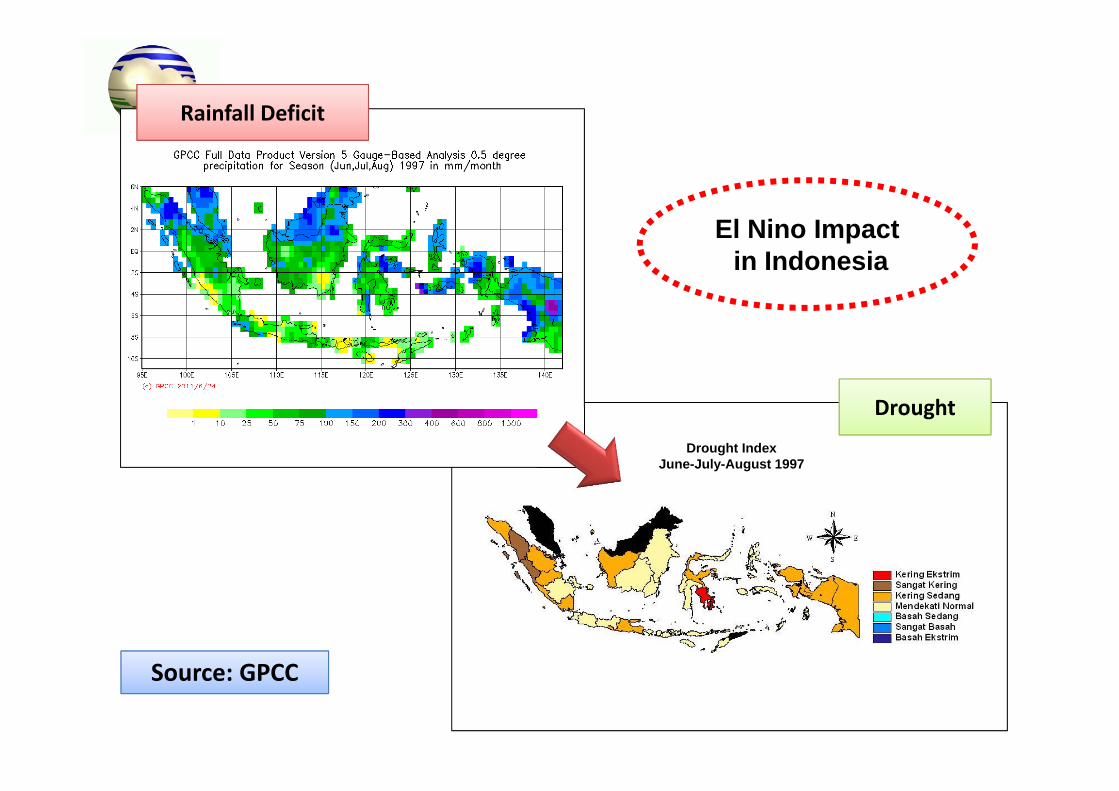
Drought
Drought IndexJune-July-August 1997
Rainfall Deficit
El Nino Impactin Indonesia
Source: GPCC
BMKG
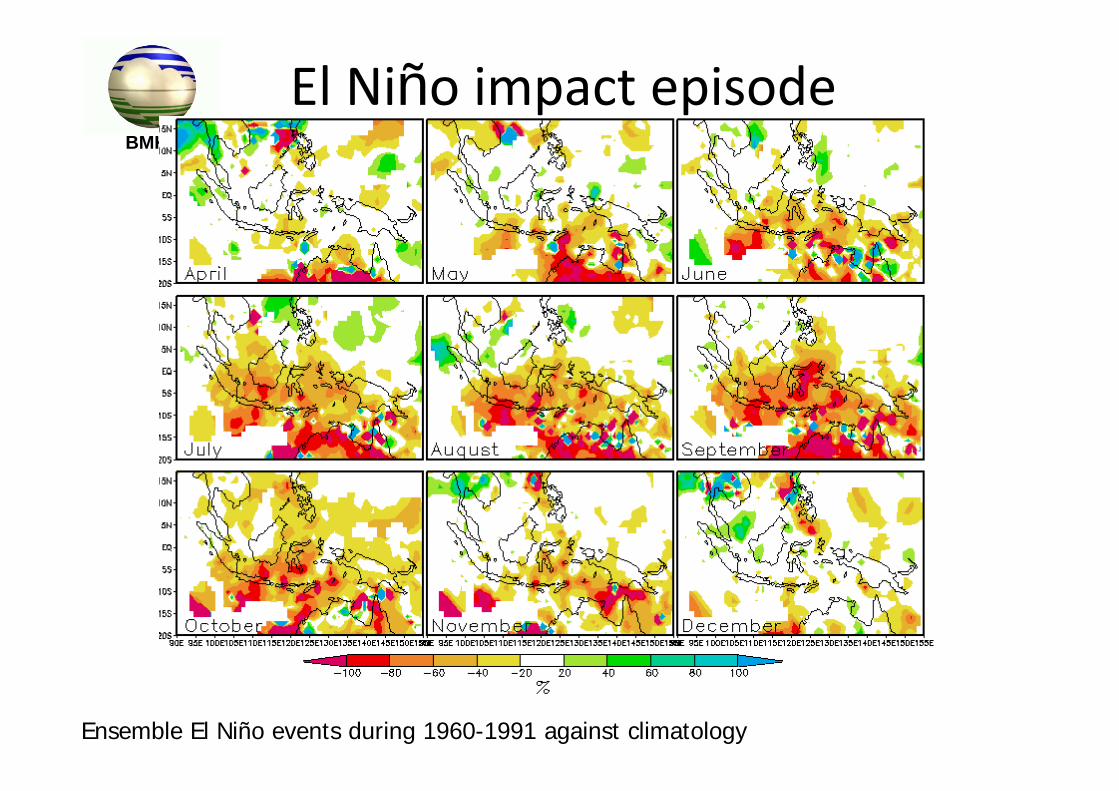
El Niño impact episode
Ensemble El Niño events during 1960-1991 against climatology
BMKG
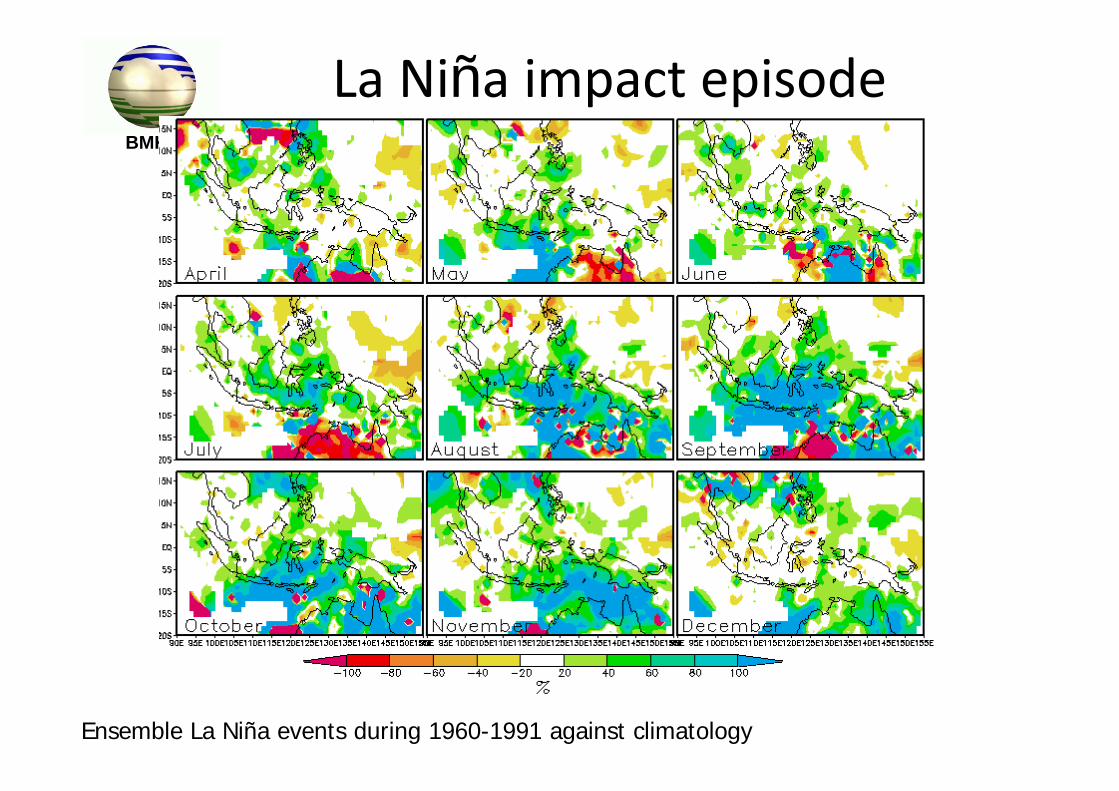
La Niña impact episode
Ensemble La Niña events during 1960-1991 against climatology
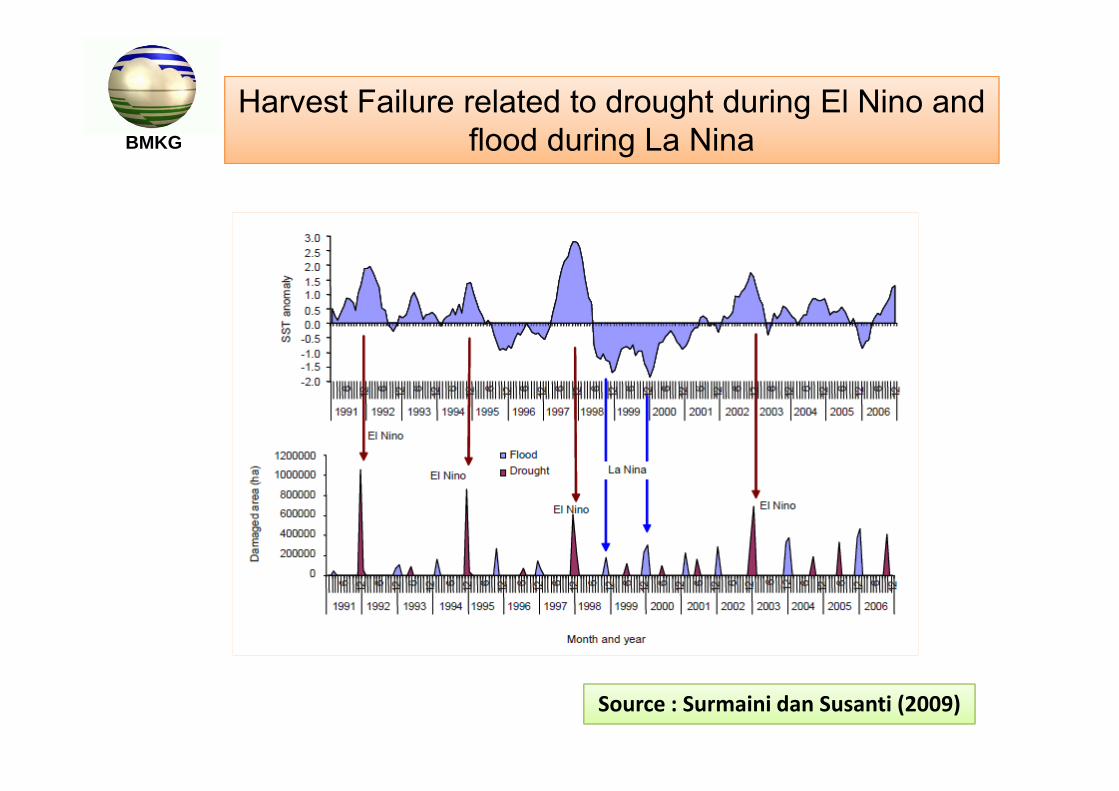
Harvest Failure related to drought during El Nino and flood during La Nina
Source : Surmaini dan Susanti (2009)
BMKG
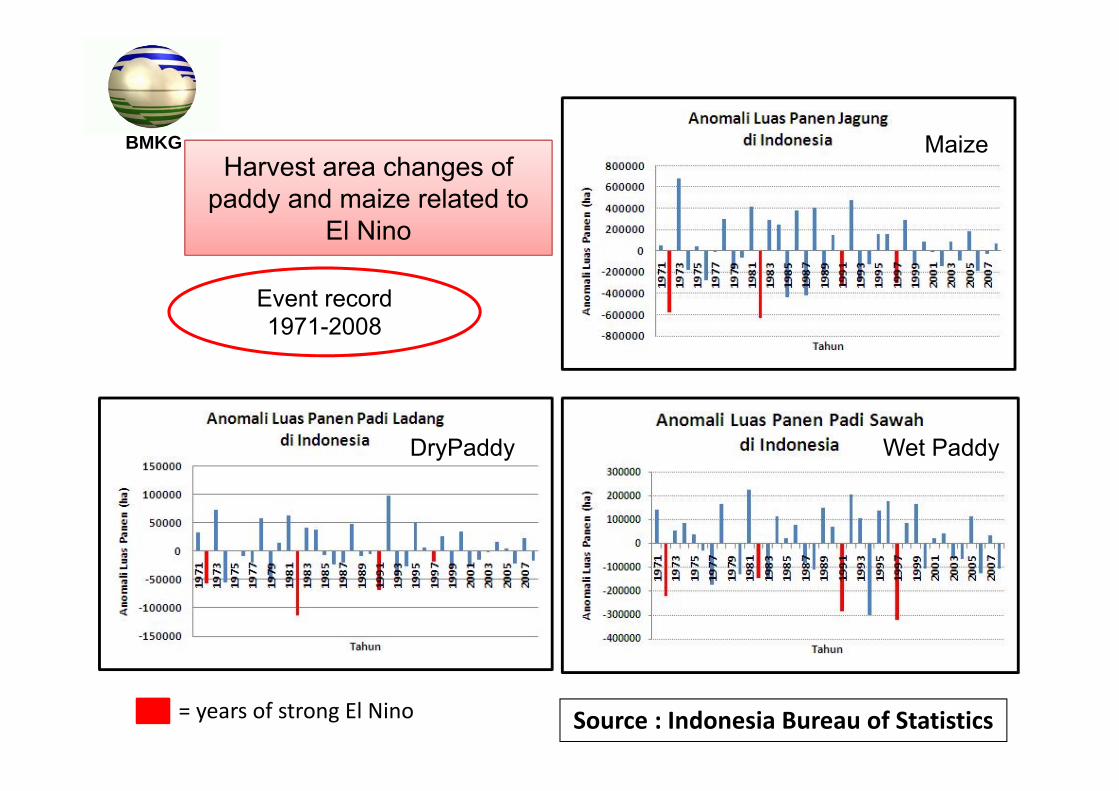
Event record 1971-2008
Harvest area changes of paddy and maize related to
El Nino
Source : Indonesia Bureau of Statistics= years of strong El Nino
DryPaddy Wet Paddy
MaizeBMKG
BMKG
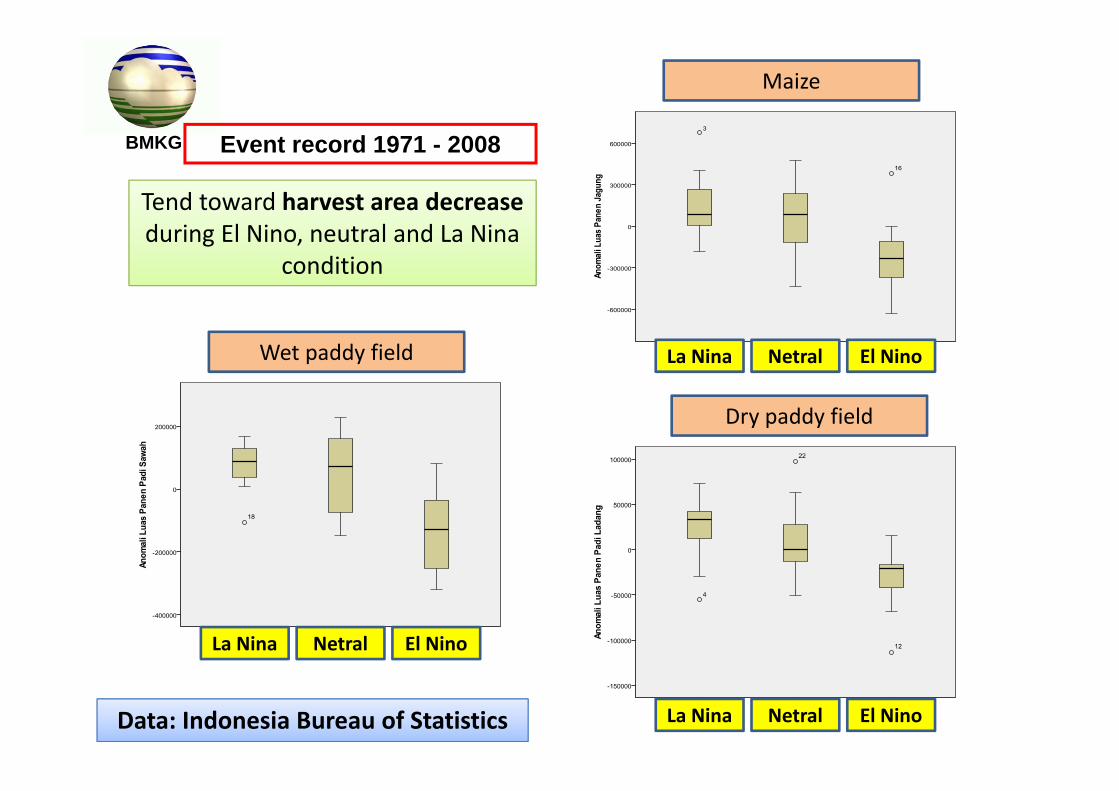
Data: Indonesia Bureau of Statistics
Event record 1971 - 2008
Wet paddy field
La Nina Netral El Nino
Dry paddy field
La Nina Netral El Nino
Maize
La Nina Netral El Nino
Tend toward harvest area decreaseduring El Nino, neutral and La Nina
condition
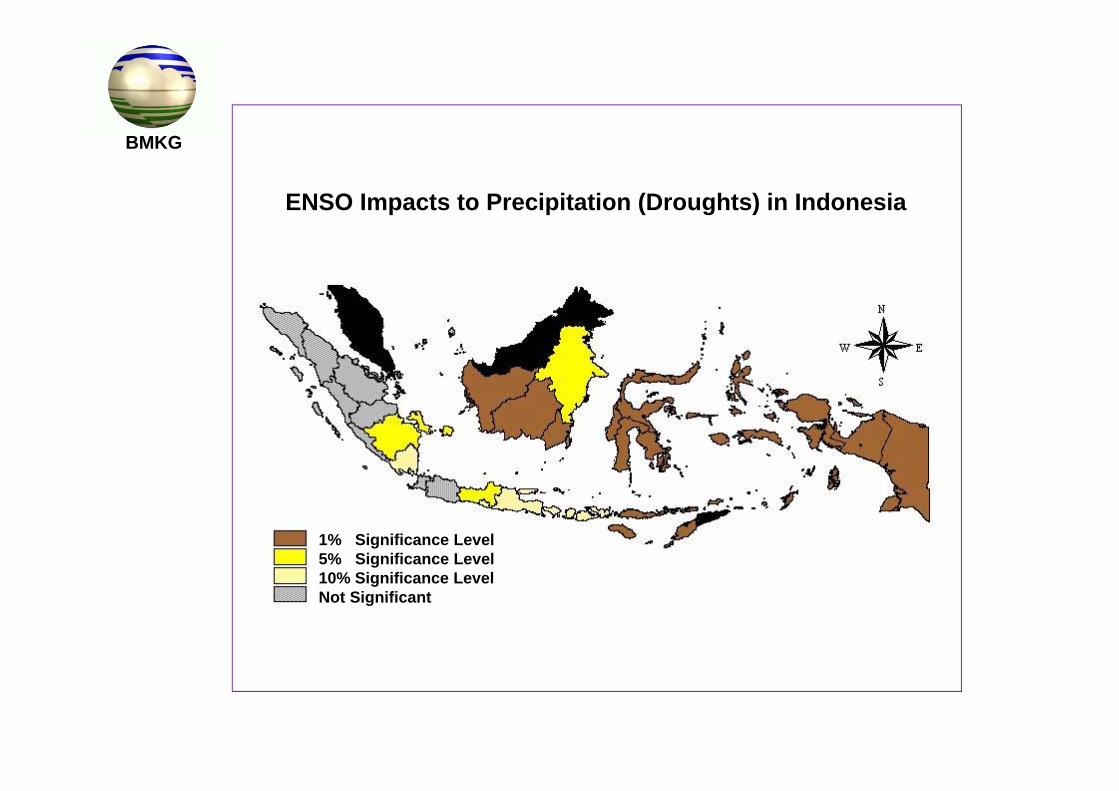
ENSO Impacts to Precipitation (Droughts) in Indonesia
1% Significance Level5% Significance Level10% Significance LevelNot Significant
BMKG
Vunerability index of harvest area from paddy and maize
BMKG
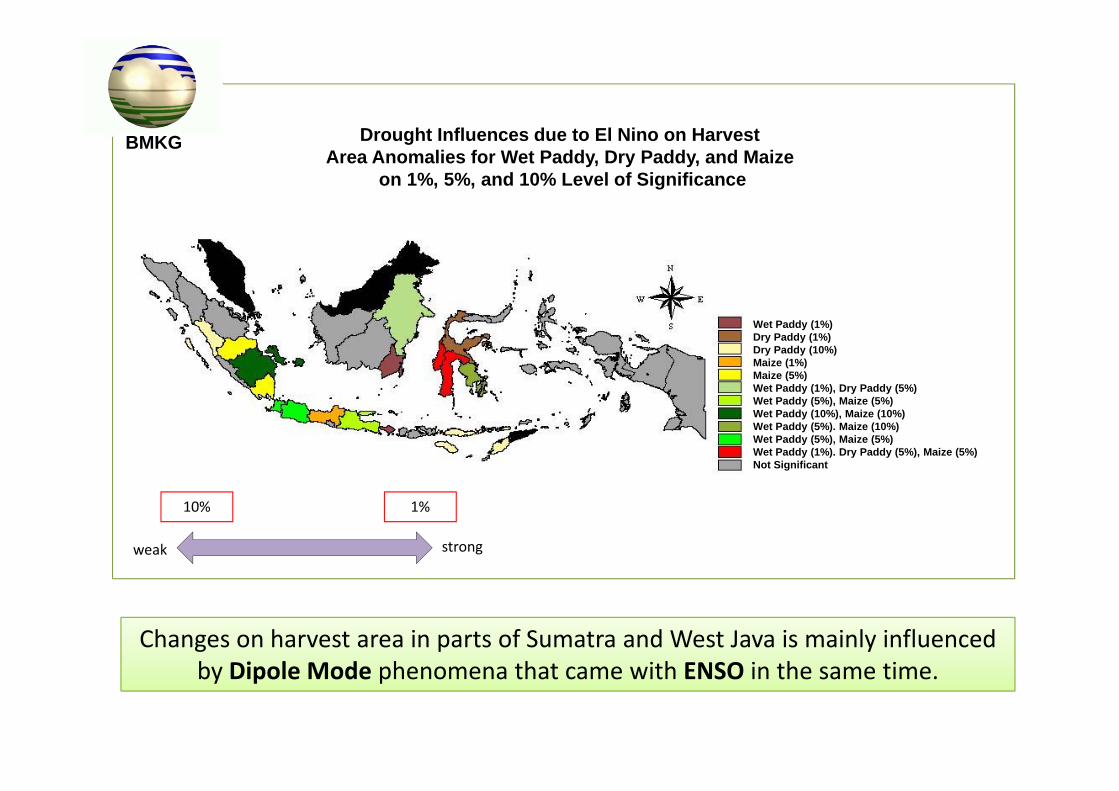
Changes on harvest area in parts of Sumatra and West Java is mainly influenced by Dipole Mode phenomena that came with ENSO in the same time.
10% 1%
weak strong
Drought Influences due to El Nino on HarvestArea Anomalies for Wet Paddy, Dry Paddy, and Maize
on 1%, 5%, and 10% Level of Significance
Wet Paddy (1%)Dry Paddy (1%)Dry Paddy (10%)Maize (1%)Maize (5%)Wet Paddy (1%), Dry Paddy (5%)Wet Paddy (5%), Maize (5%)Wet Paddy (10%), Maize (10%)Wet Paddy (5%). Maize (10%)Wet Paddy (5%), Maize (5%)Wet Paddy (1%). Dry Paddy (5%), Maize (5%)Not Significant
BMKG
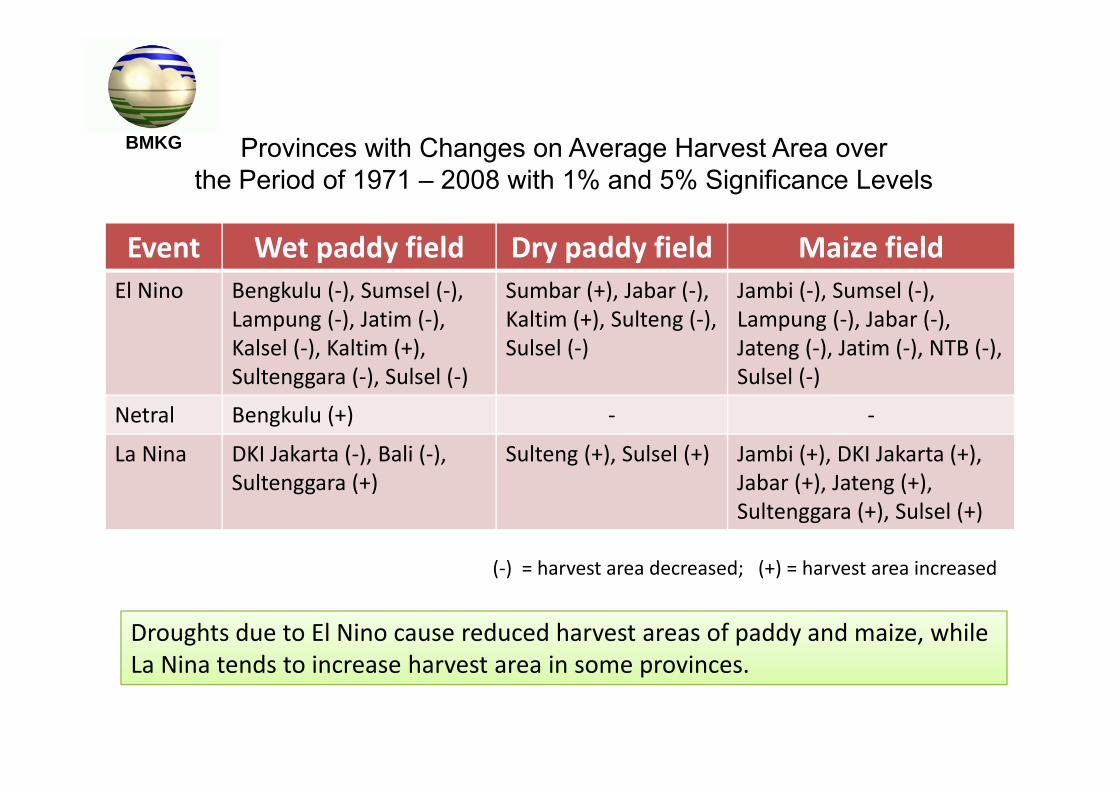
Provinces with Changes on Average Harvest Area overthe Period of 1971 – 2008 with 1% and 5% Significance Levels
Event Wet paddy field Dry paddy field Maize fieldEl Nino Bengkulu (‐), Sumsel (‐),
Lampung (‐), Jatim (‐), Kalsel (‐), Kaltim (+), Sultenggara (‐), Sulsel (‐)
Sumbar (+), Jabar (‐), Kaltim (+), Sulteng (‐), Sulsel (‐)
Jambi (‐), Sumsel (‐), Lampung (‐), Jabar (‐), Jateng (‐), Jatim (‐), NTB (‐), Sulsel (‐)
Netral Bengkulu (+) ‐ ‐
La Nina DKI Jakarta (‐), Bali (‐), Sultenggara (+)
Sulteng (+), Sulsel (+) Jambi (+), DKI Jakarta (+), Jabar (+), Jateng (+), Sultenggara (+), Sulsel (+)
(‐) = harvest area decreased; (+) = harvest area increased
Droughts due to El Nino cause reduced harvest areas of paddy and maize, while La Nina tends to increase harvest area in some provinces.
BMKG
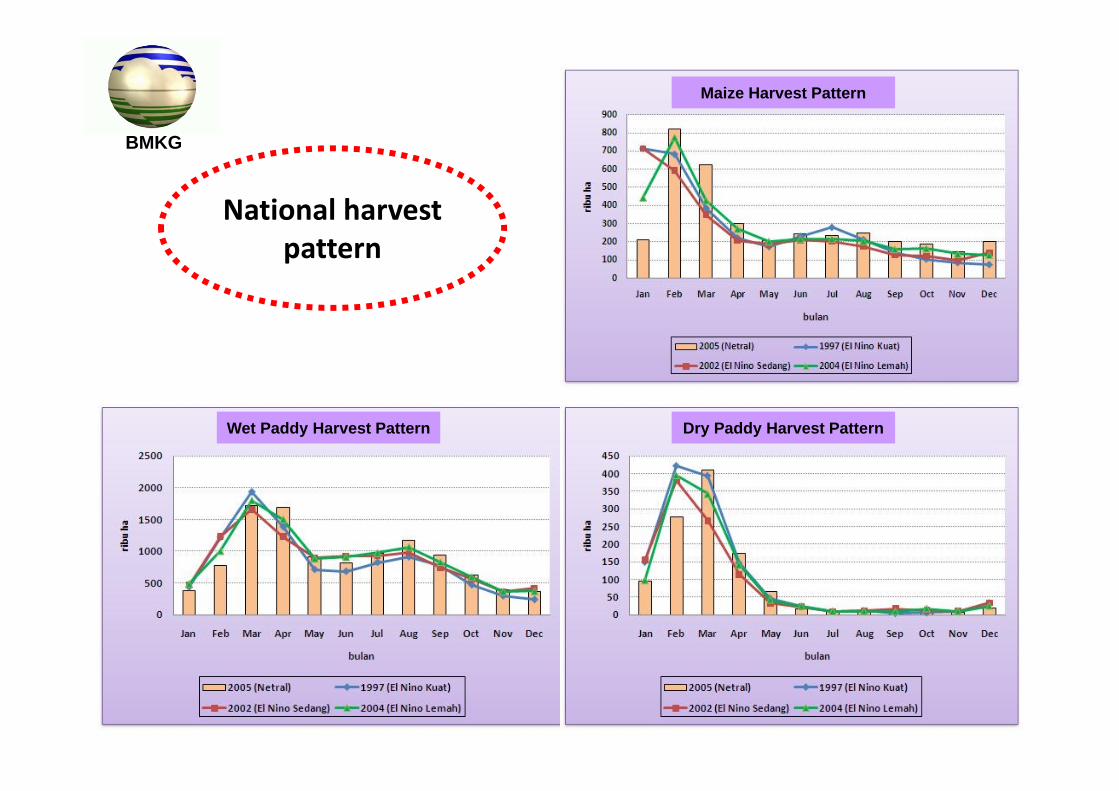
National harvest pattern
Maize Harvest Pattern
Wet Paddy Harvest Pattern Dry Paddy Harvest Pattern
BMKG
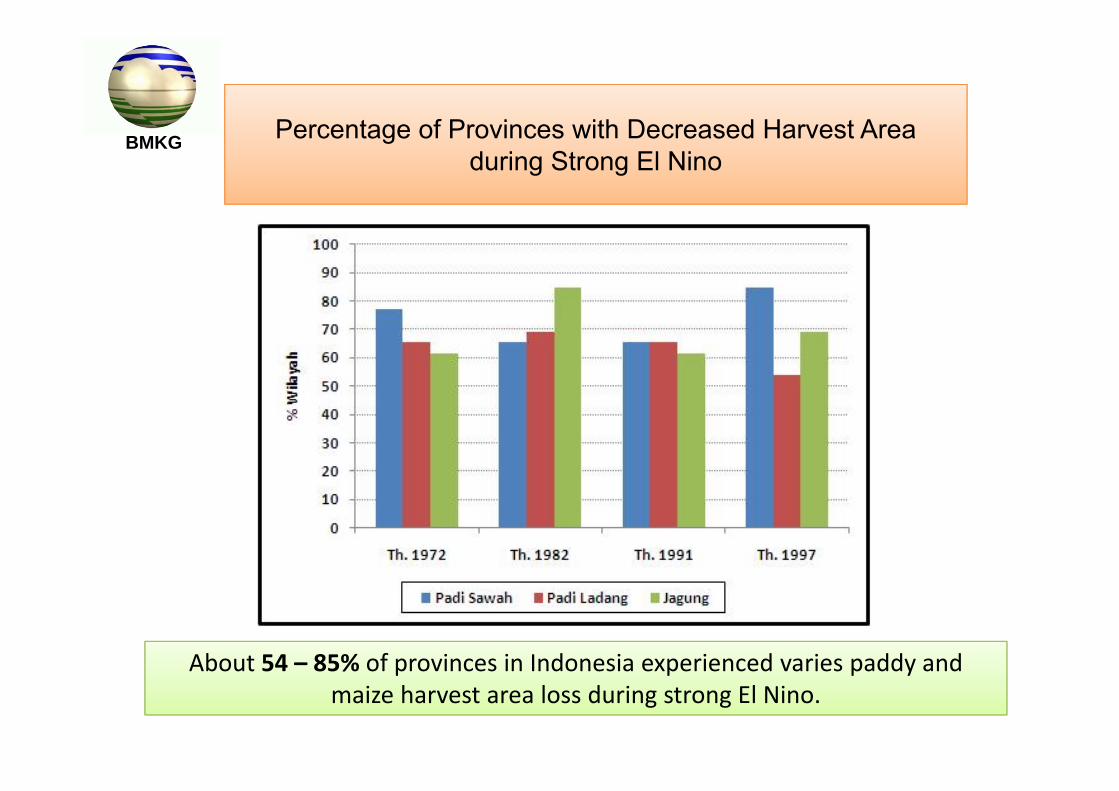
Percentage of Provinces with Decreased Harvest Area during Strong El Nino
About 54 – 85% of provinces in Indonesia experienced varies paddy and maize harvest area loss during strong El Nino.
BMKG
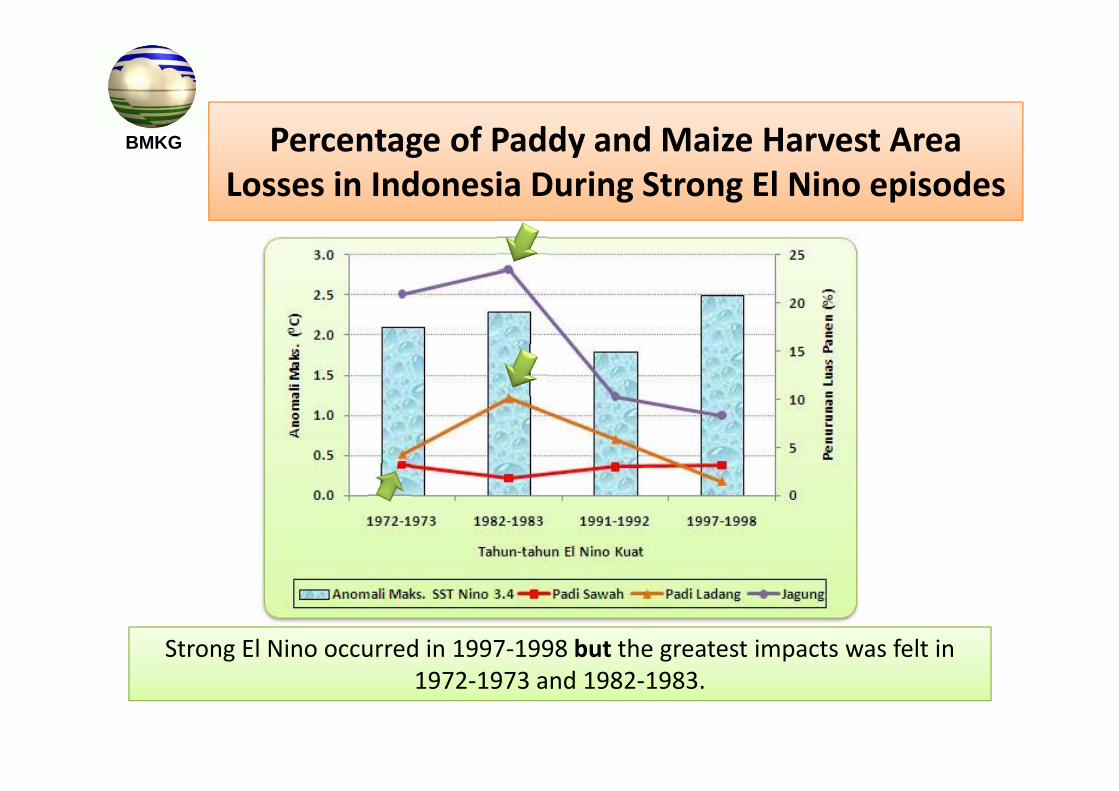
BMKG Percentage of Paddy and Maize Harvest Area Losses in Indonesia During Strong El Nino episodes
Strong El Nino occurred in 1997‐1998 but the greatest impacts was felt in 1972‐1973 and 1982‐1983.
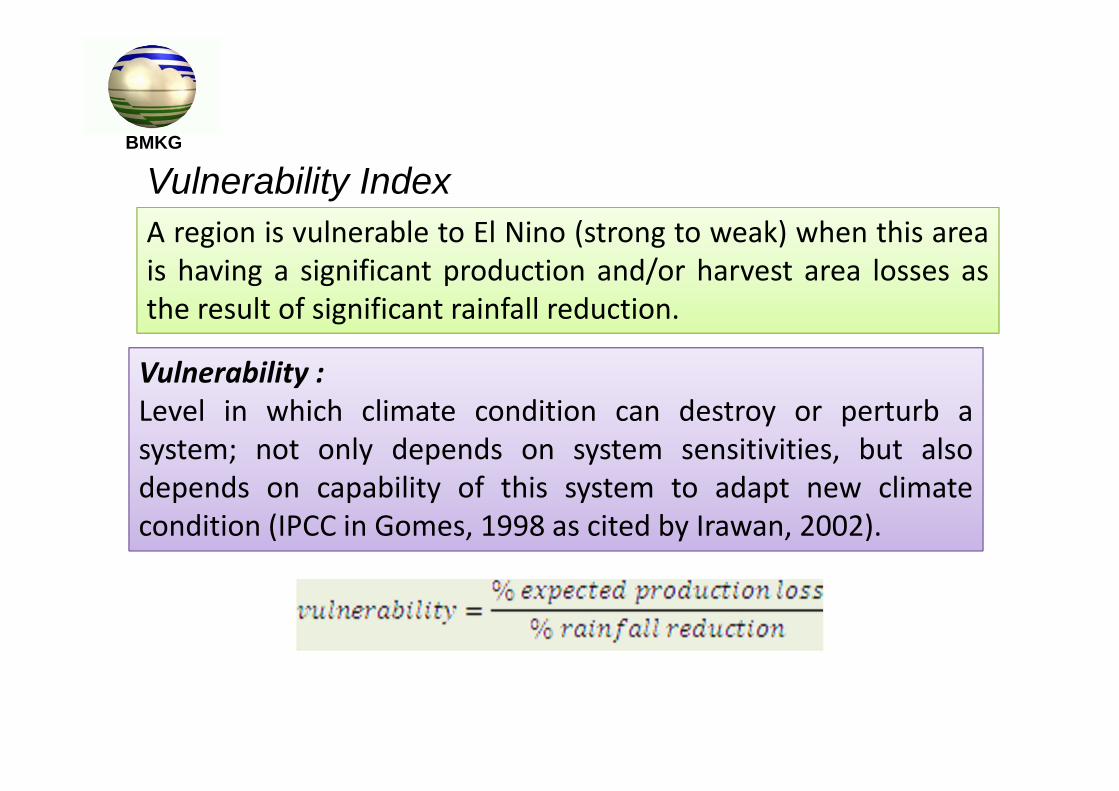
Vulnerability Index
Vulnerability :Level in which climate condition can destroy or perturb asystem; not only depends on system sensitivities, but alsodepends on capability of this system to adapt new climatecondition (IPCC in Gomes, 1998 as cited by Irawan, 2002).
A region is vulnerable to El Nino (strong to weak) when this areais having a significant production and/or harvest area losses asthe result of significant rainfall reduction.
BMKG
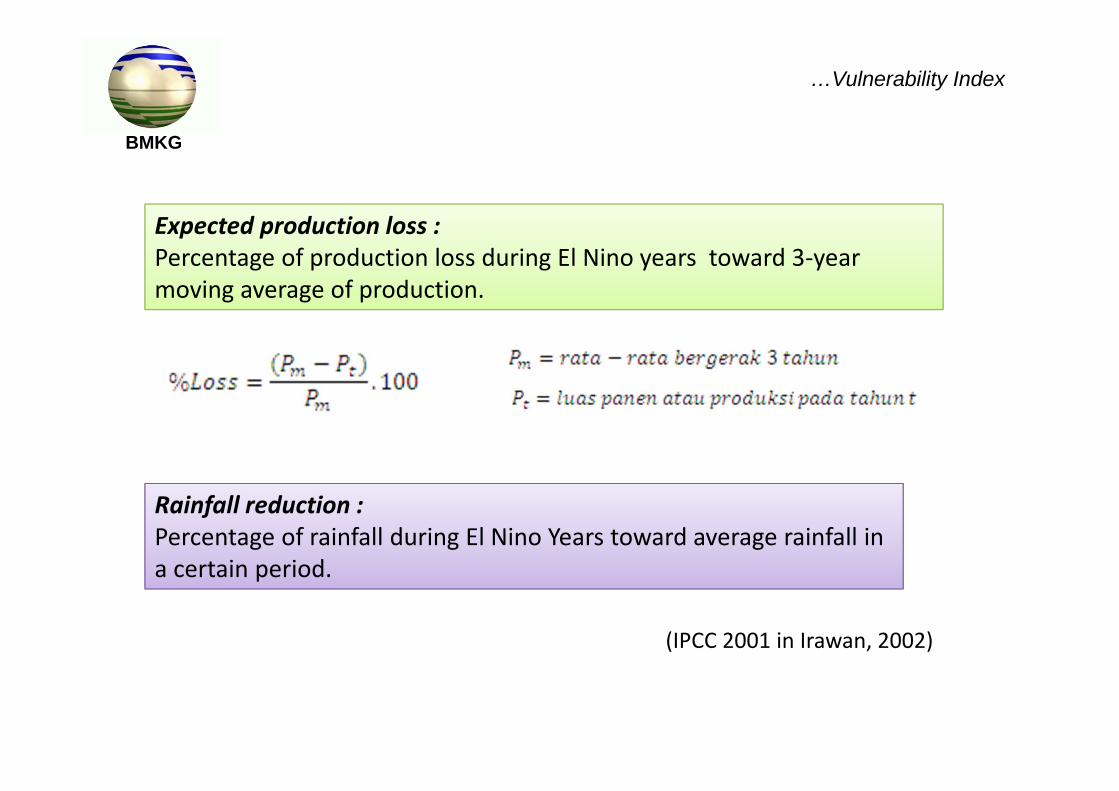
…Vulnerability Index
Expected production loss :Percentage of production loss during El Nino years toward 3‐year moving average of production.
(IPCC 2001 in Irawan, 2002)
Rainfall reduction :Percentage of rainfall during El Nino Years toward average rainfall in a certain period.
BMKG
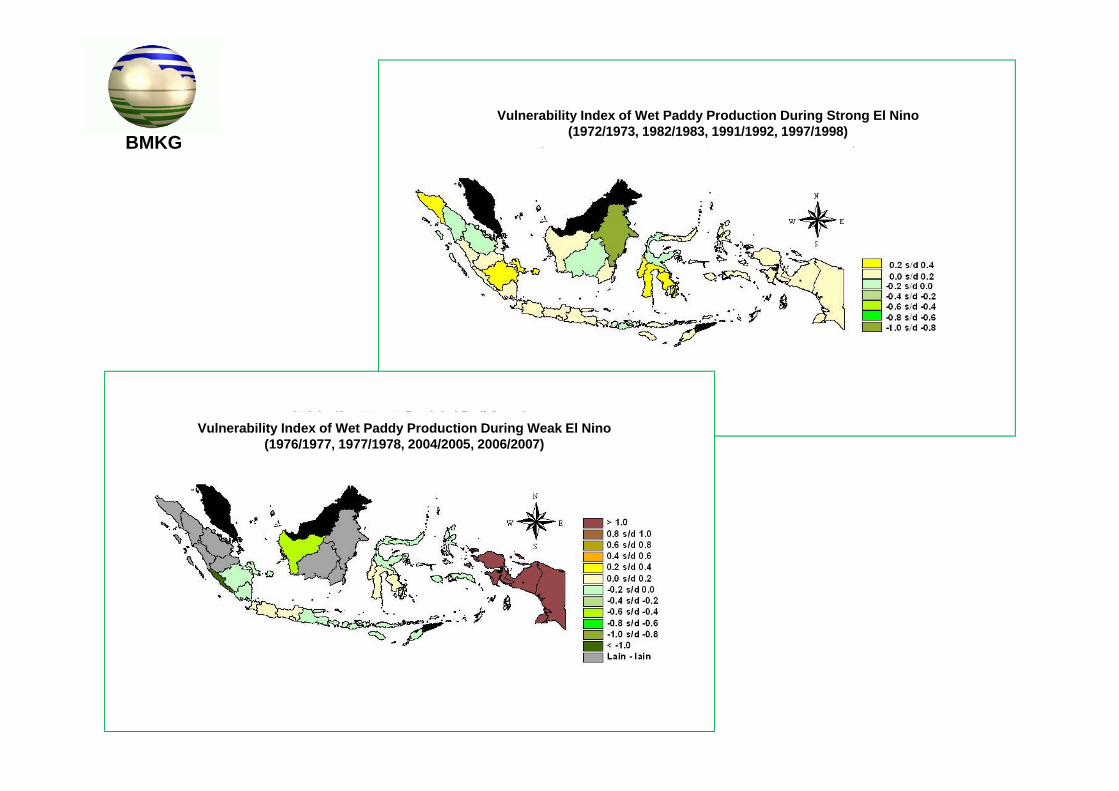
Vulnerability Index of Wet Paddy Production During Strong El Nino(1972/1973, 1982/1983, 1991/1992, 1997/1998)
Vulnerability Index of Wet Paddy Production During Weak El Nino(1976/1977, 1977/1978, 2004/2005, 2006/2007)
BMKG
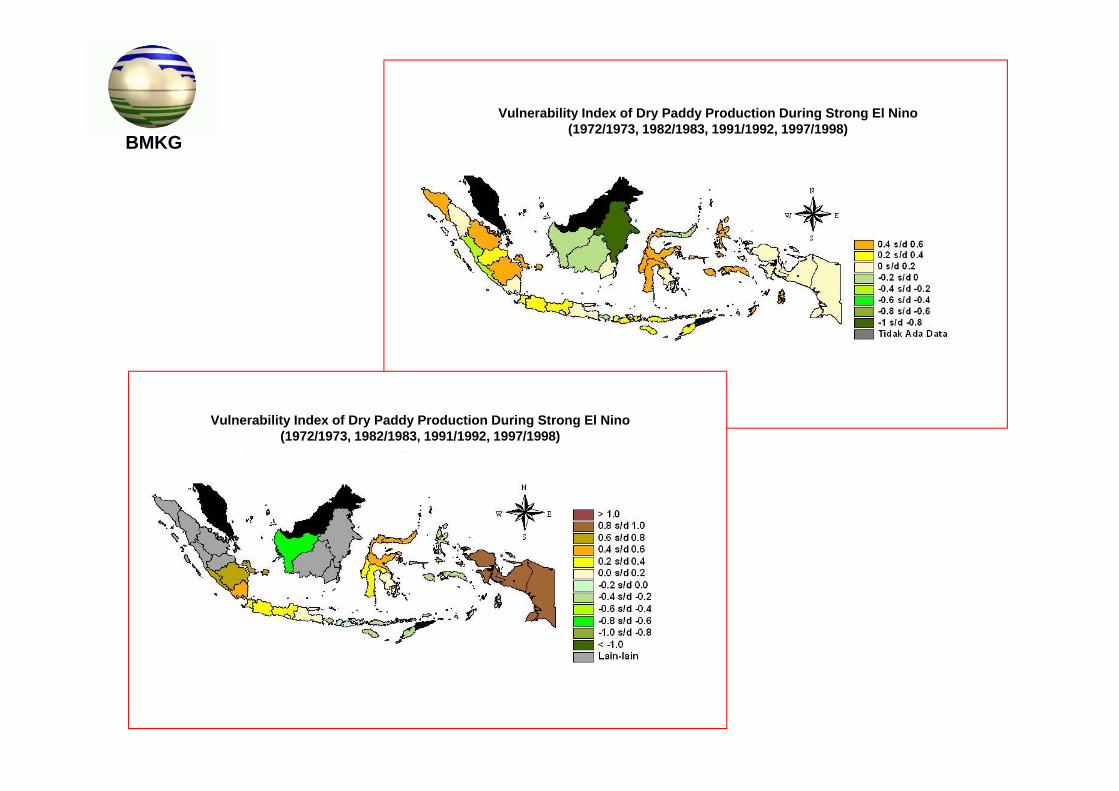
Vulnerability Index of Dry Paddy Production During Strong El Nino(1972/1973, 1982/1983, 1991/1992, 1997/1998)
BMKG
Vulnerability Index of Dry Paddy Production During Strong El Nino(1972/1973, 1982/1983, 1991/1992, 1997/1998)
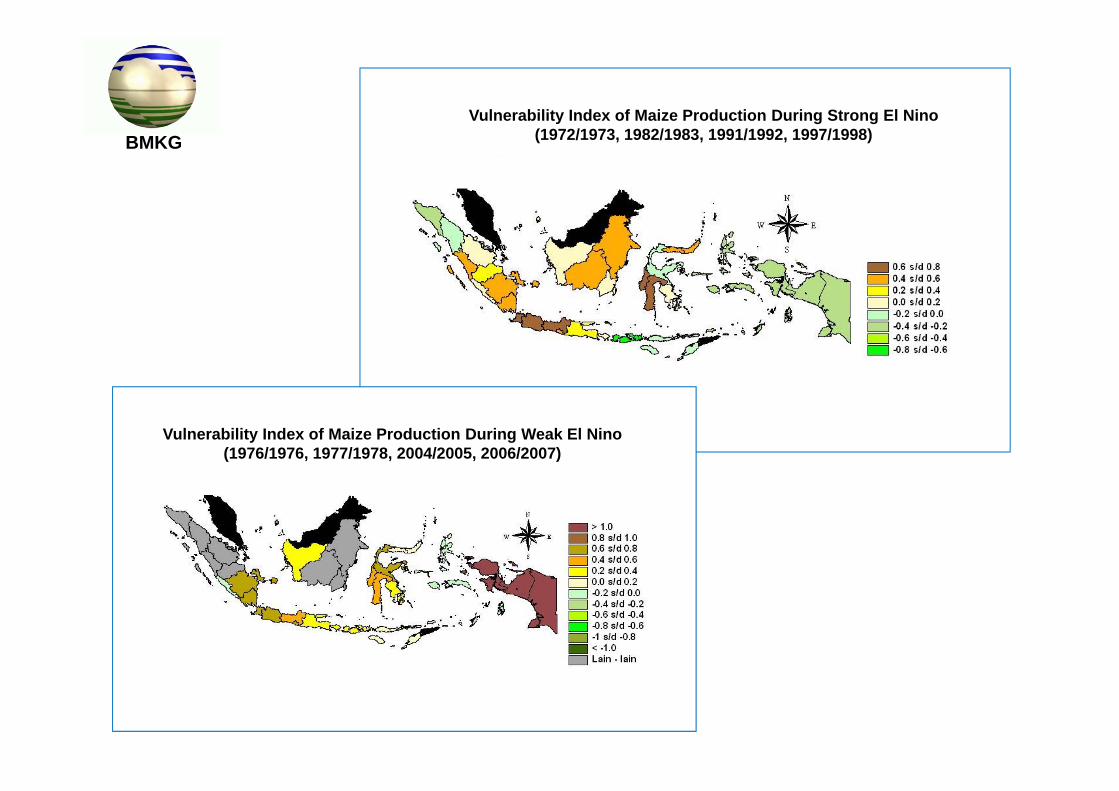
Vulnerability Index of Maize Production During Strong El Nino(1972/1973, 1982/1983, 1991/1992, 1997/1998)
Vulnerability Index of Maize Production During Weak El Nino(1976/1976, 1977/1978, 2004/2005, 2006/2007)
BMKG
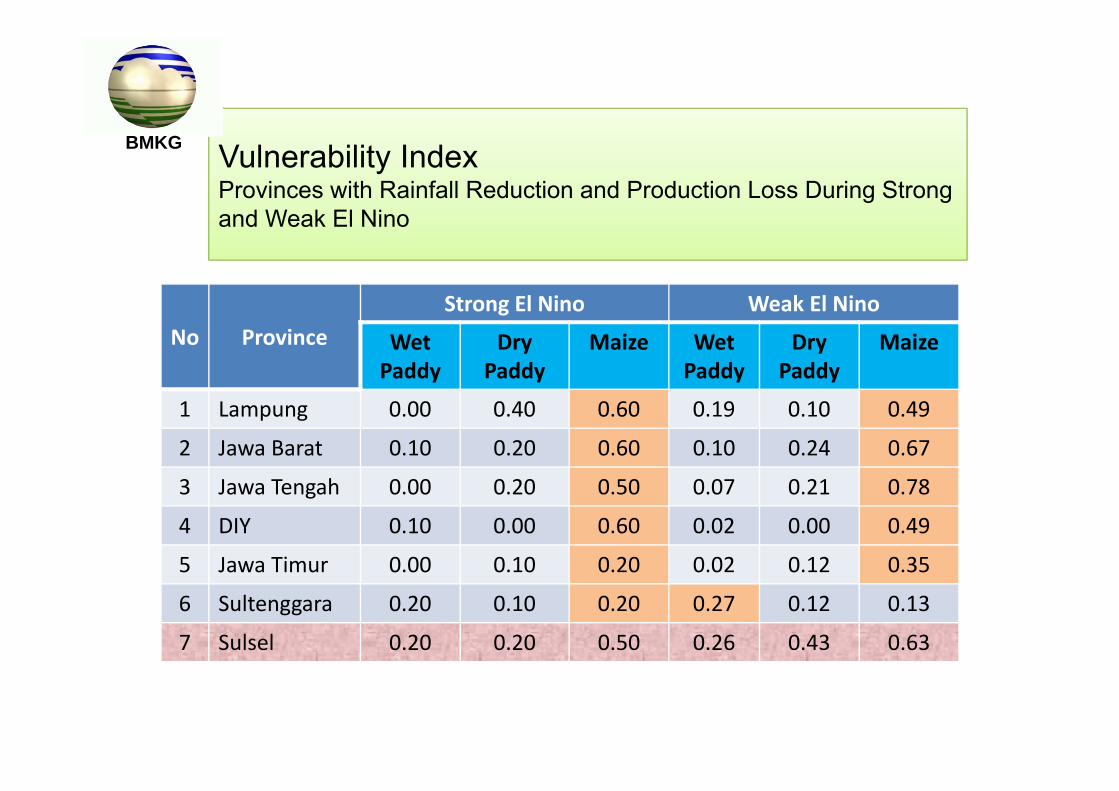
No ProvinceStrong El Nino Weak El Nino
Wet Paddy
Dry Paddy
Maize Wet Paddy
Dry Paddy
Maize
1 Lampung 0.00 0.40 0.60 0.19 0.10 0.49
2 Jawa Barat 0.10 0.20 0.60 0.10 0.24 0.67
3 Jawa Tengah 0.00 0.20 0.50 0.07 0.21 0.78
4 DIY 0.10 0.00 0.60 0.02 0.00 0.49
5 Jawa Timur 0.00 0.10 0.20 0.02 0.12 0.35
6 Sultenggara 0.20 0.10 0.20 0.27 0.12 0.13
7 Sulsel 0.20 0.20 0.50 0.26 0.43 0.63
Vulnerability IndexProvinces with Rainfall Reduction and Production Loss During Strong and Weak El Nino
BMKG
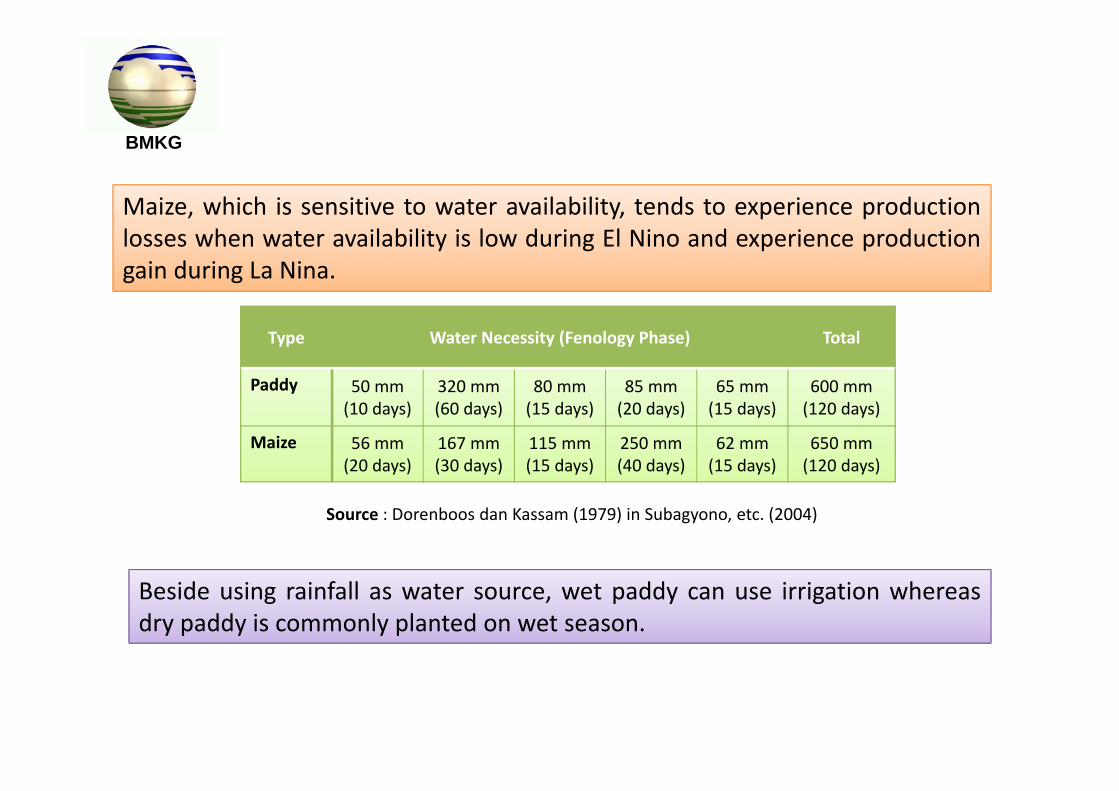
Maize, which is sensitive to water availability, tends to experience productionlosses when water availability is low during El Nino and experience productiongain during La Nina.
Source : Dorenboos dan Kassam (1979) in Subagyono, etc. (2004)
Beside using rainfall as water source, wet paddy can use irrigation whereasdry paddy is commonly planted on wet season.
Type Water Necessity (Fenology Phase) Total
Paddy 50 mm (10 days)
320 mm (60 days)
80 mm (15 days)
85 mm (20 days)
65 mm (15 days)
600 mm (120 days)
Maize 56 mm (20 days)
167 mm (30 days)
115 mm (15 days)
250 mm (40 days)
62 mm (15 days)
650 mm (120 days)
BMKG
Development of Vulnerability Map of Paddy for Bali
BMKG
BMKG
1979 1990 2000 2010
Tempe
rature [d
egree Celcius
]
23
24
25
26
27
28
29
30
31
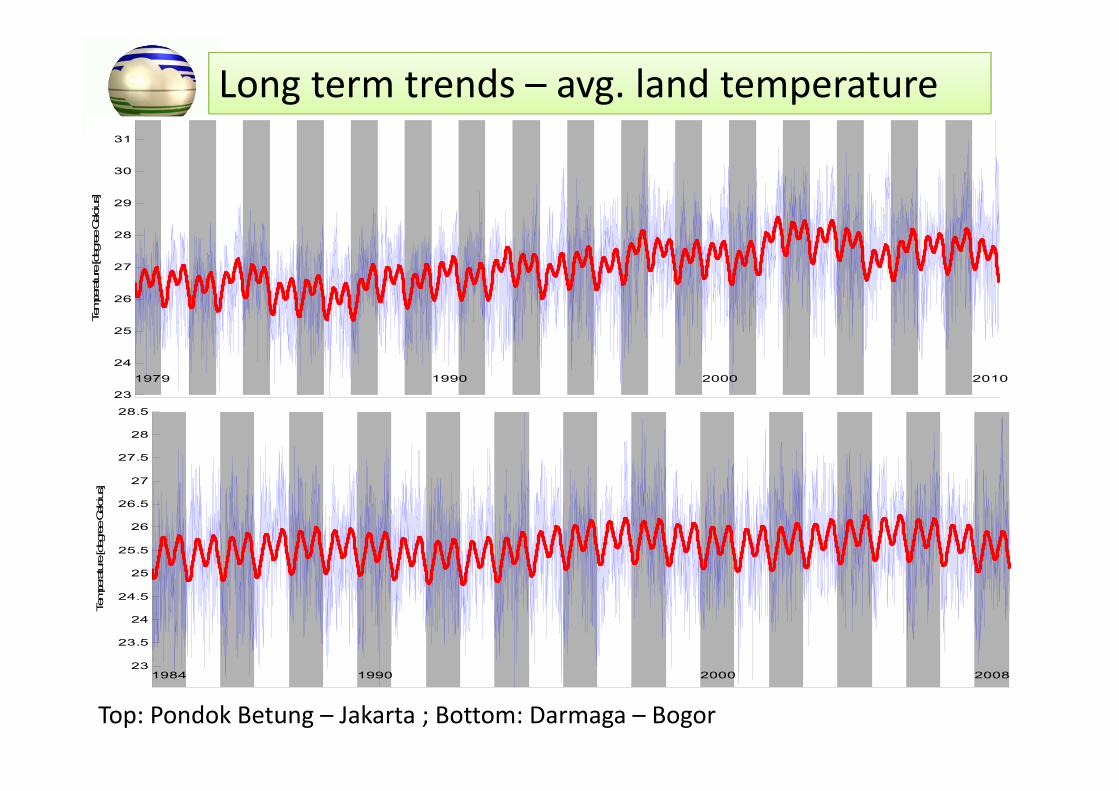
Long term trends – avg. land temperature
Top: Pondok Betung – Jakarta ; Bottom: Darmaga – Bogor
1984 1990 2000 2008
Tempe
rature [d
egree Celcius
]
23
23.5
24
24.5
25
25.5
26
26.5
27
27.5
28
28.5
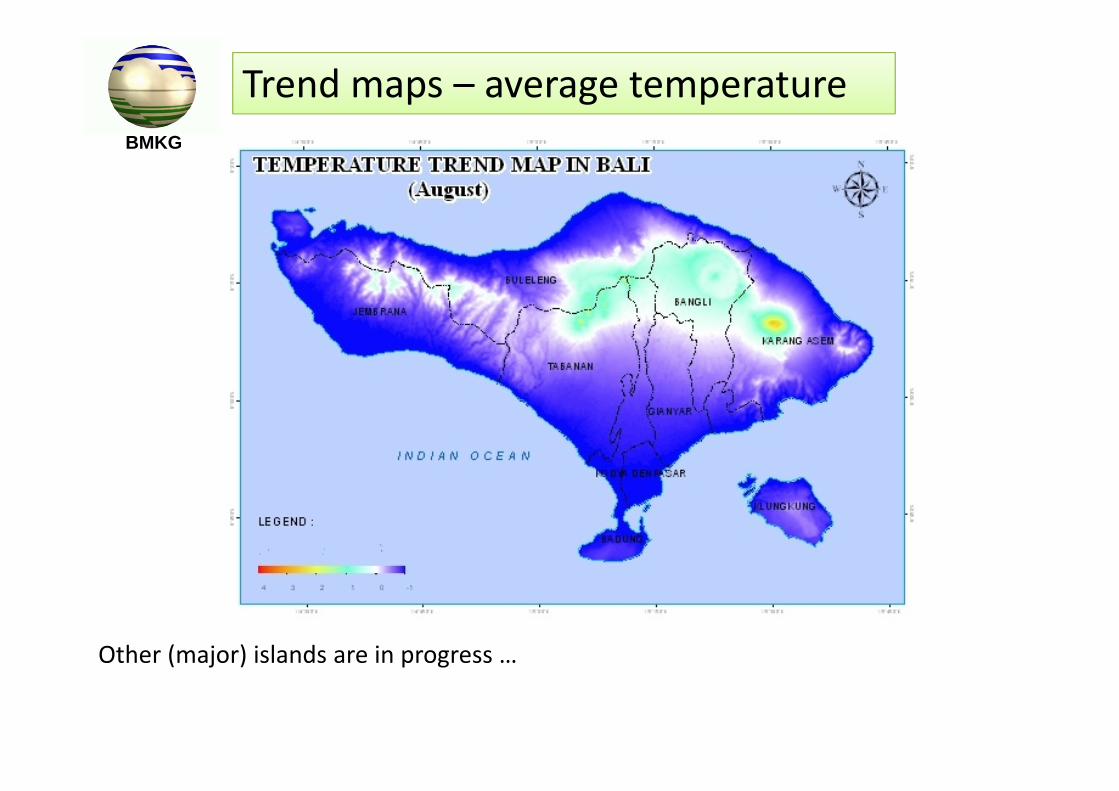
Trend maps – average temperature
Other (major) islands are in progress …
BMKG
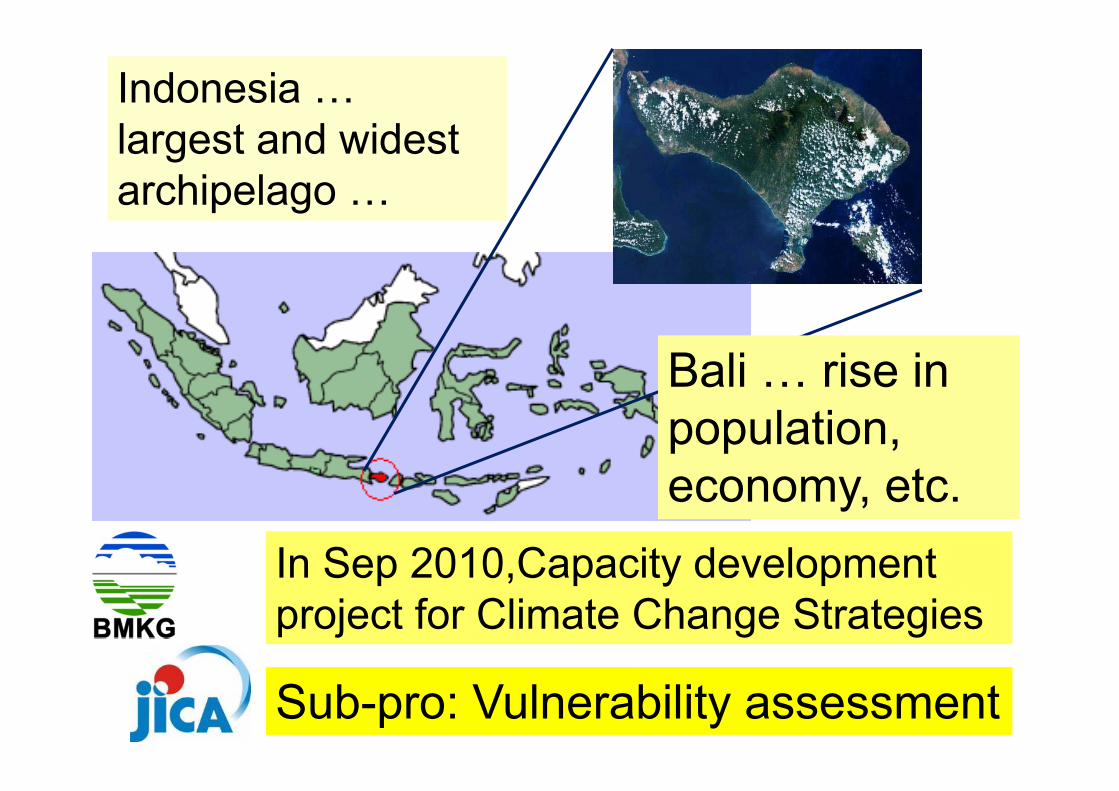
Indonesia … largest and widest archipelago …
Bali … rise in population, economy, etc.
In Sep 2010,Capacity development project for Climate Change Strategies
Sub-pro: Vulnerability assessment
BMKG
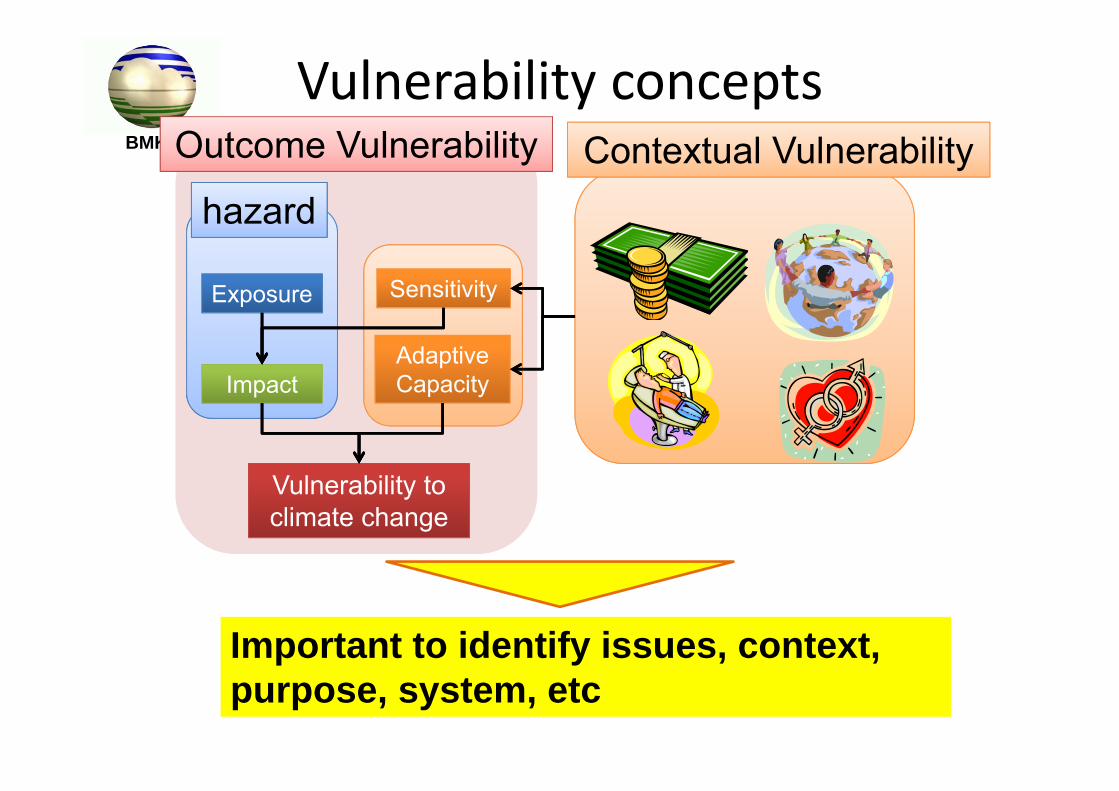
Exposure
Impact
Sensitivity
Adaptive Capacity
Vulnerability to climate change
Outcome Vulnerability Contextual Vulnerabilityhazard
Important to identify issues, context, purpose, system, etc
Vulnerability concepts
BMKG
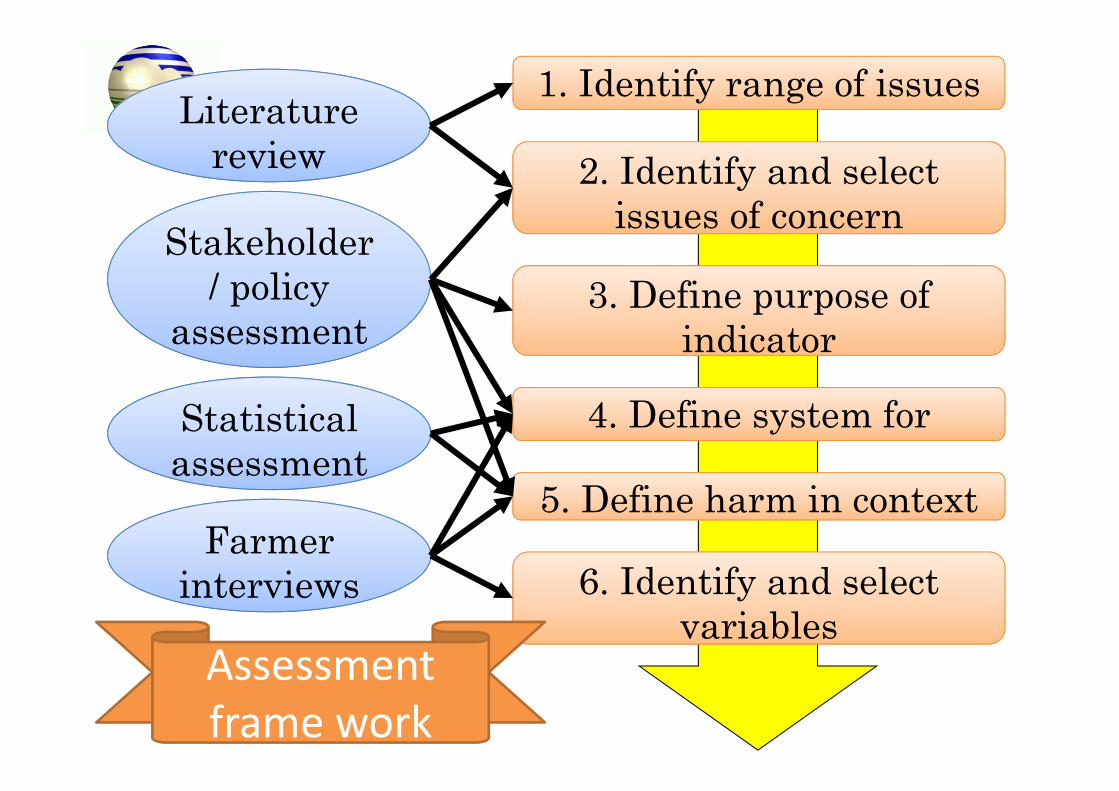
1. Identify range of issues
2. Identify and select issues of concern
3. Define purpose of indicator
4. Define system for
5. Define harm in context
6. Identify and select variables
Literature review
assessmentStatistical assessment
assessment
Stakeholder/ policy
assessment
interviewsFarmer
interviews
Assessment frame work
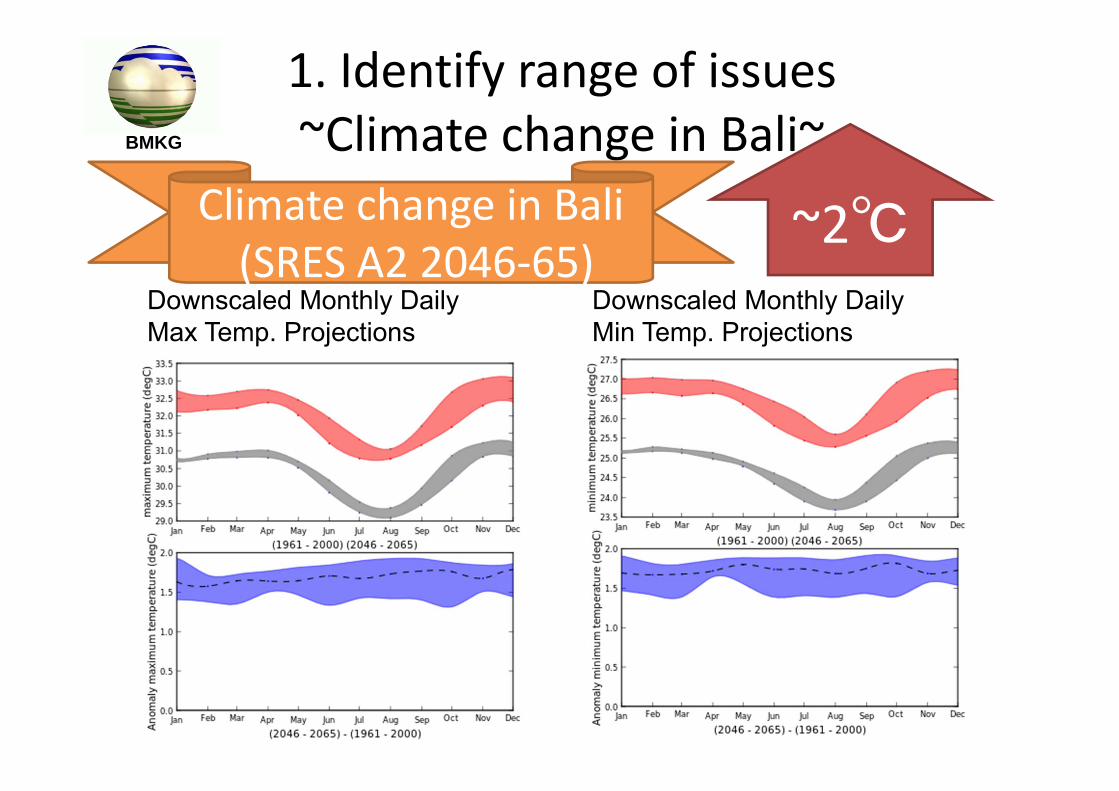
1. Identify range of issues~Climate change in Bali~
Downscaled Monthly Daily Max Temp. Projections
Downscaled Monthly Daily Min Temp. Projections
~2℃Climate change in Bali(SRES A2 2046‐65)
BMKG
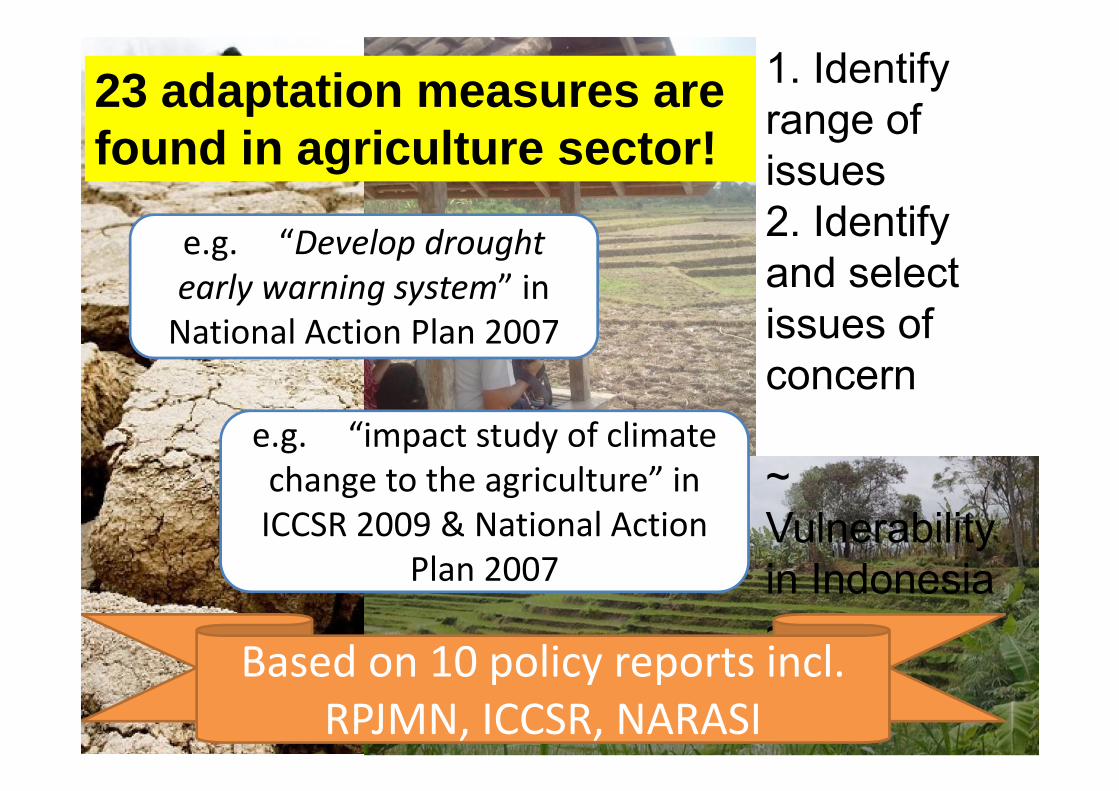
e.g. “Develop drought early warning system” in National Action Plan 2007
e.g. “impact study of climate change to the agriculture” in ICCSR 2009 & National Action
Plan 2007
1. Identify range of issues2. Identify and select issues of concern
~ Vulnerability in Indonesia ~
Based on 10 policy reports incl. RPJMN, ICCSR, NARASI
23 adaptation measures are found in agriculture sector!
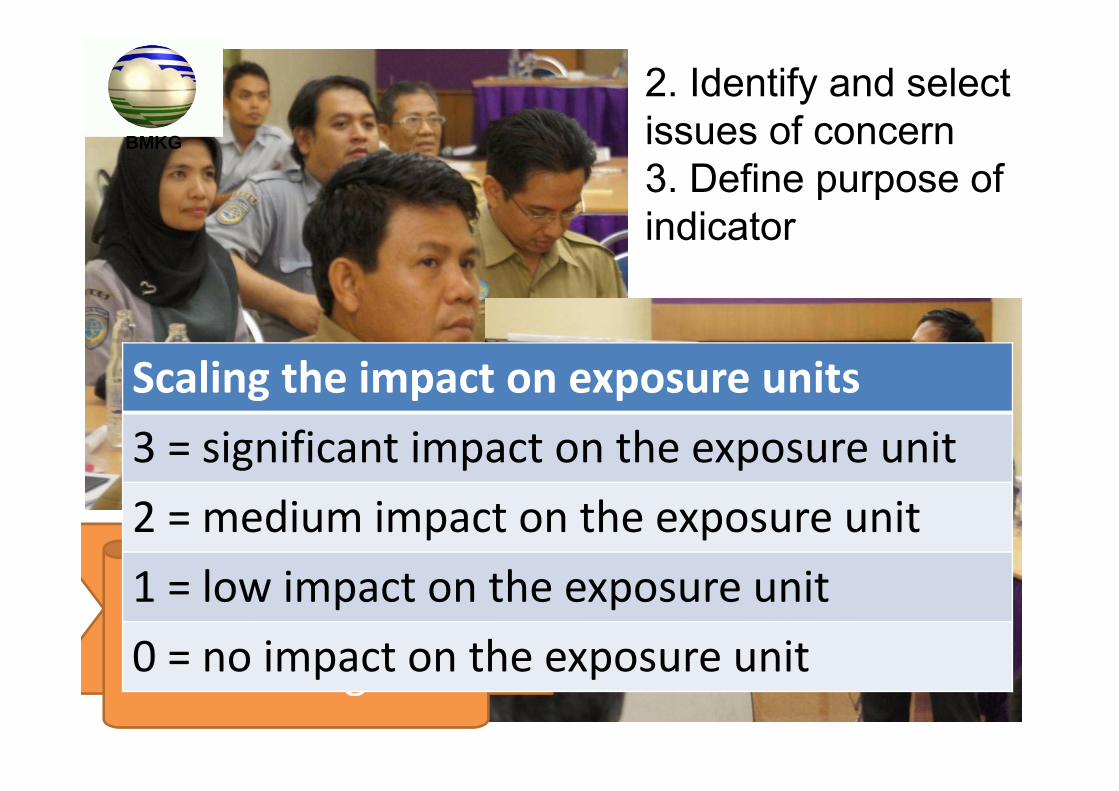
2. Identify and select issues of concern3. Define purpose of indicator
Stakeholder meetings
Scaling the impact on exposure units3 = significant impact on the exposure unit2 = medium impact on the exposure unit1 = low impact on the exposure unit0 = no impact on the exposure unit
BMKG
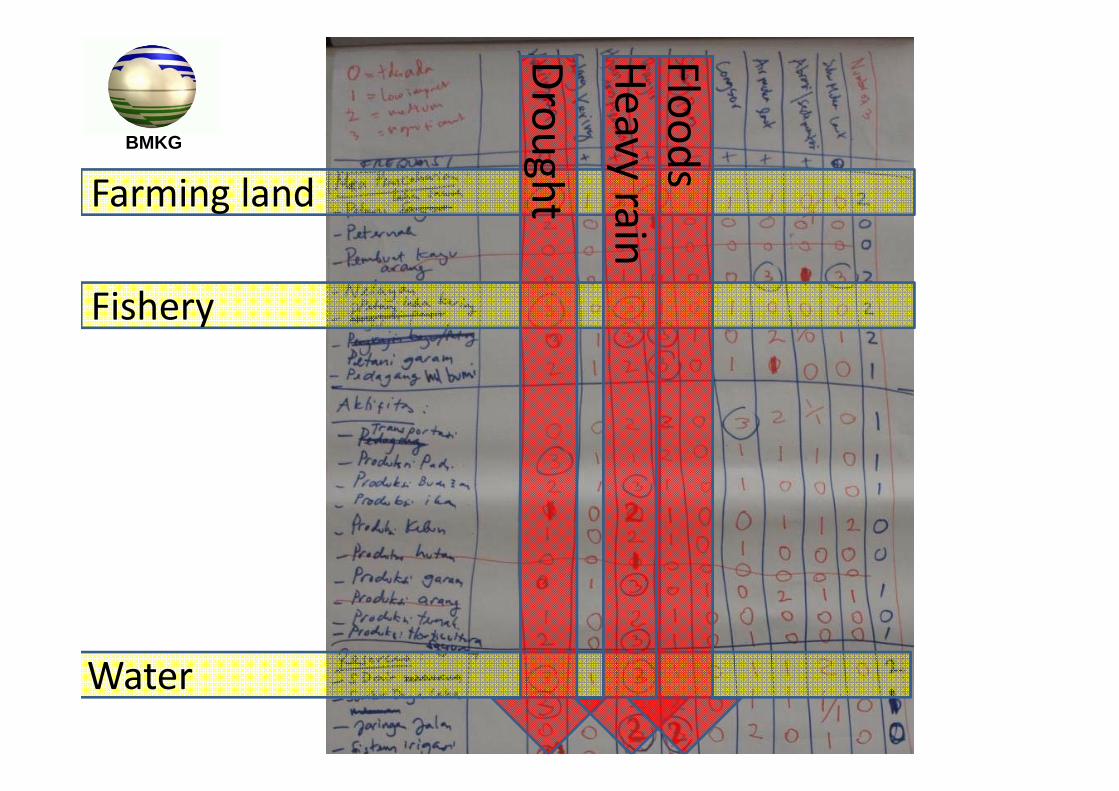
Farming land
Fishery
Water
Drought
Heavy rainFloodsBMKG
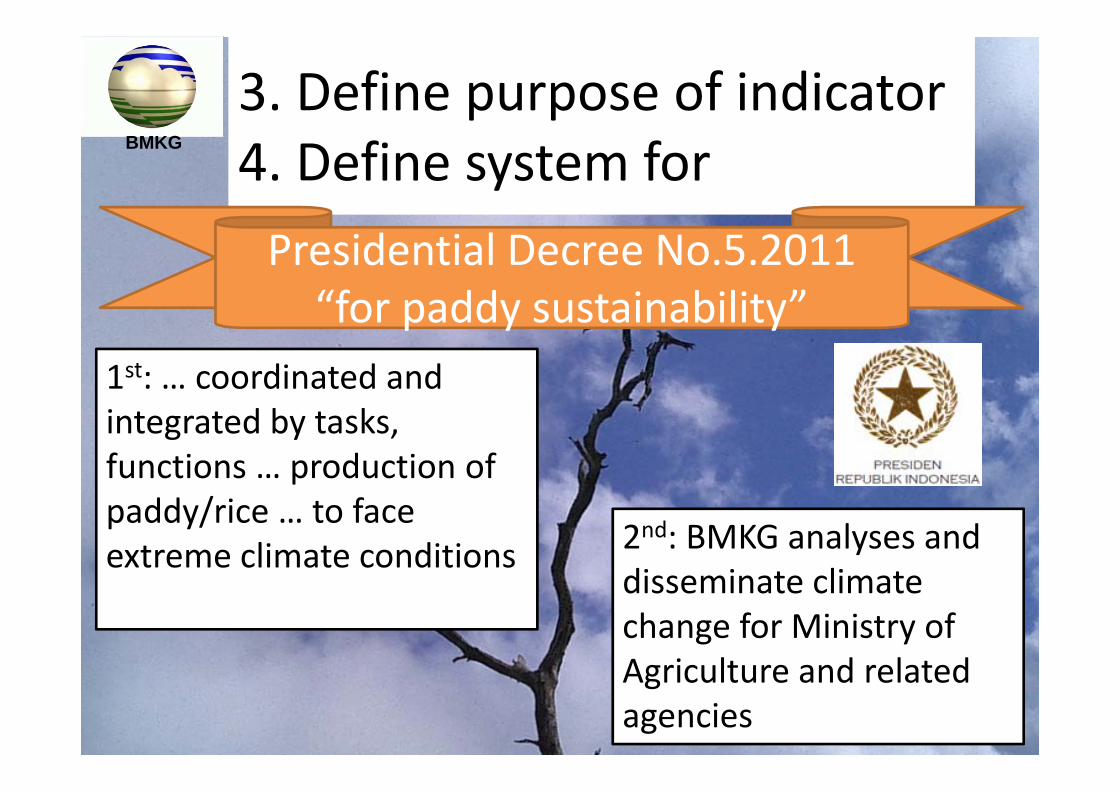
3. Define purpose of indicator4. Define system forPresidential Decree No.5.2011“for paddy sustainability”
1st: … coordinated and integrated by tasks, functions … production of paddy/rice … to face extreme climate conditions 2nd: BMKG analyses and
disseminate climate change for Ministry of Agriculture and related agencies
BMKG
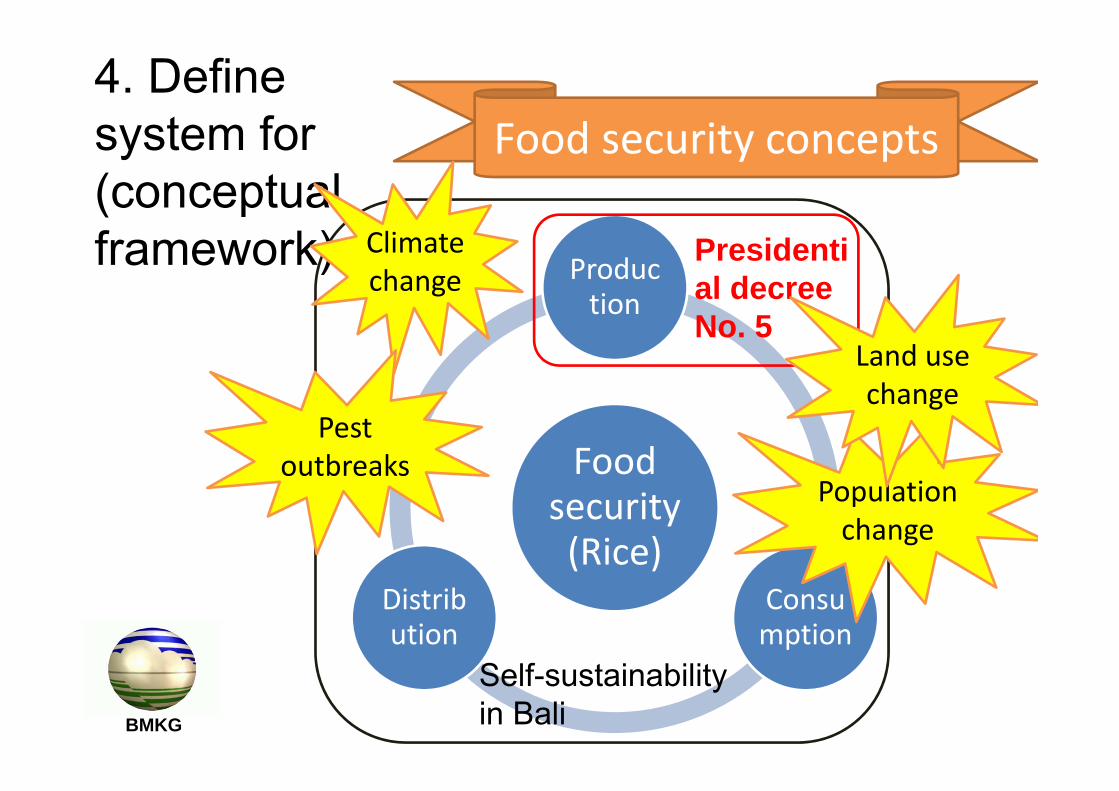
Food security (Rice)
Production
Consumption
Distribution
Presidential decree No. 5
Self-sustainability in Bali
4. Define system for (conceptual framework)
Food security concepts
Climate change
Population change
Land use change
Pest outbreaks
BMKG
BMKG
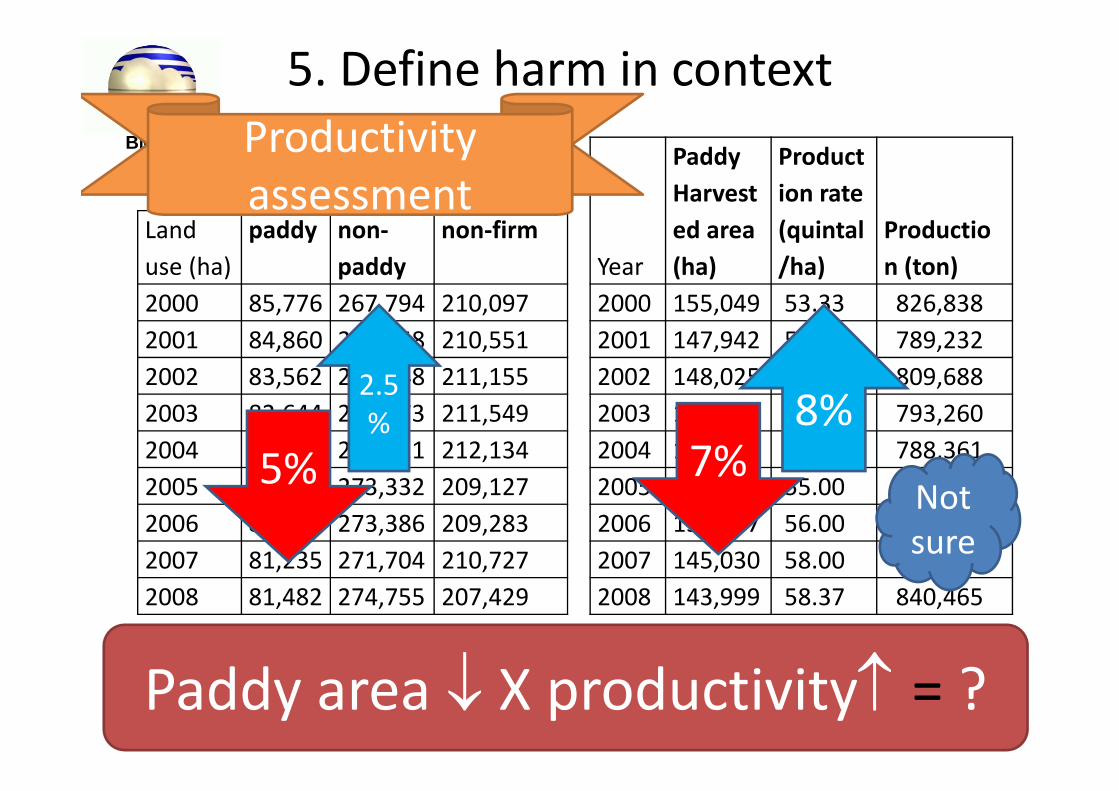
5. Define harm in context
Land use (ha)
paddy non‐paddy
non‐firm
2000 85,776 267,794 210,0972001 84,860 268,258 210,5512002 83,562 268,948 211,1552003 82,644 269,473 211,5492004 82,089 269,411 212,1342005 81,207 273,332 209,1272006 80,997 273,386 209,2832007 81,235 271,704 210,7272008 81,482 274,755 207,429
Year
Paddy Harvested area (ha)
Production rate (quintal/ha)
Production (ton)
2000 155,049 53.33 826,8382001 147,942 53.35 789,2322002 148,025 54.70 809,6882003 145,294 54.60 793,2602004 142,663 55.00 788,3612005 141,577 55.00 785,4812006 150,557 56.00 840,8912007 145,030 58.00 839,7752008 143,999 58.37 840,465
5% 7%Not sure
Productivity assessment
Paddy area X productivity = ?
2.5% 8%
BMKG
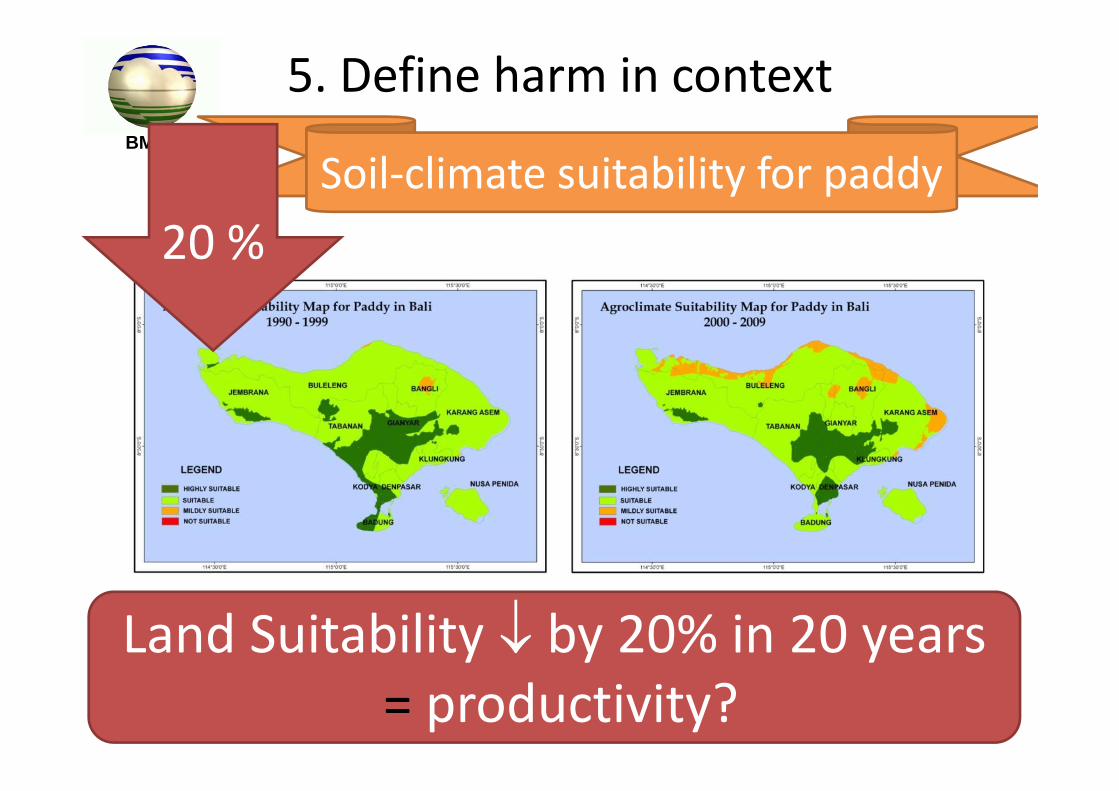
5. Define harm in context
Soil‐climate suitability for paddy20 %
Land Suitability by 20% in 20 years= productivity?
BMKG
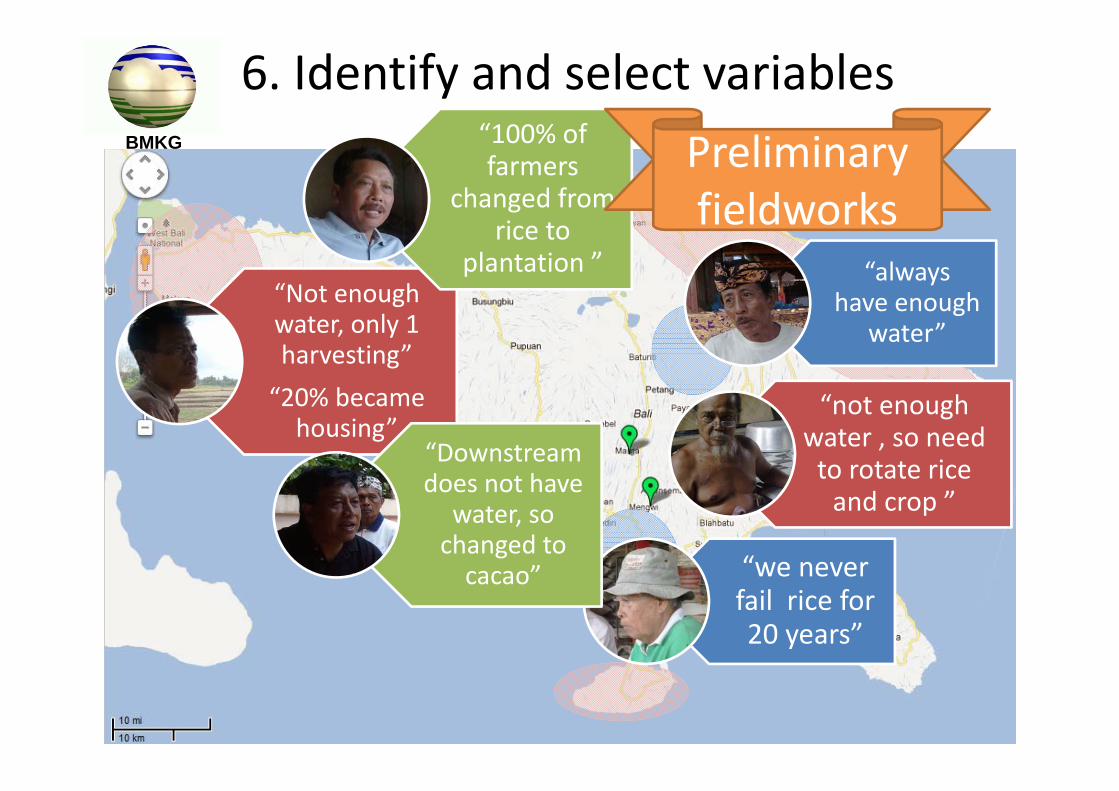
“we never fail rice for 20 years”
“Not enough water, only 1 harvesting” “20% became housing”
“100% of farmers
changed from rice to
plantation ”
“Downstream does not have
water, so changed to cacao”
“always have enough
water”
“not enough water , so need to rotate rice and crop ”
6. Identify and select variablesPreliminary fieldworks
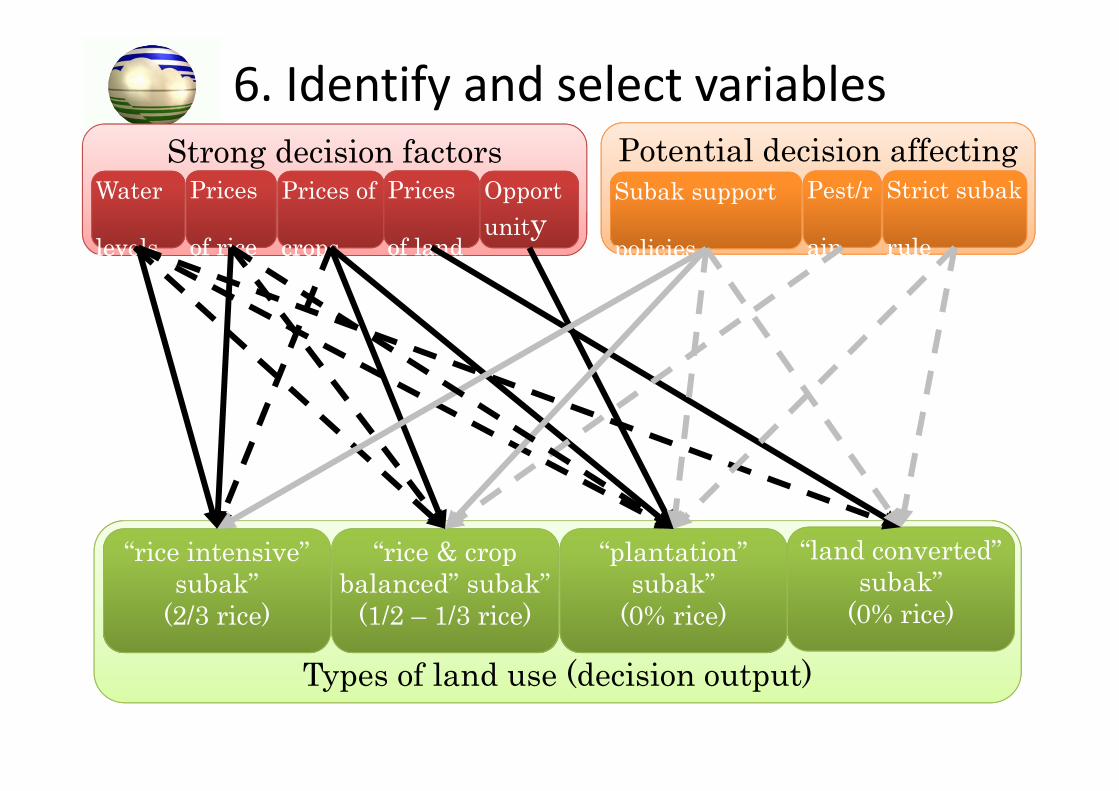
BMKG Potential decision affectingStrong decision factors
Types of land use (decision output)
“rice intensive” subak”
(2/3 rice)
“rice & crop balanced” subak”
(1/2 – 1/3 rice)
“plantation” subak”
(0% rice)
“land converted” “land converted” subak”
(0% rice)
Prices of
crops
Prices of
crops
OpportOpportunity
Prices
of rice
Prices
of rice
Subak support
policies
Subak support
policies
Pest/r
ain
Pest/r
ain
Strict subak
rule
Strict subak
ruleof land
Prices
of landlevels
Water
levels
6. Identify and select variables
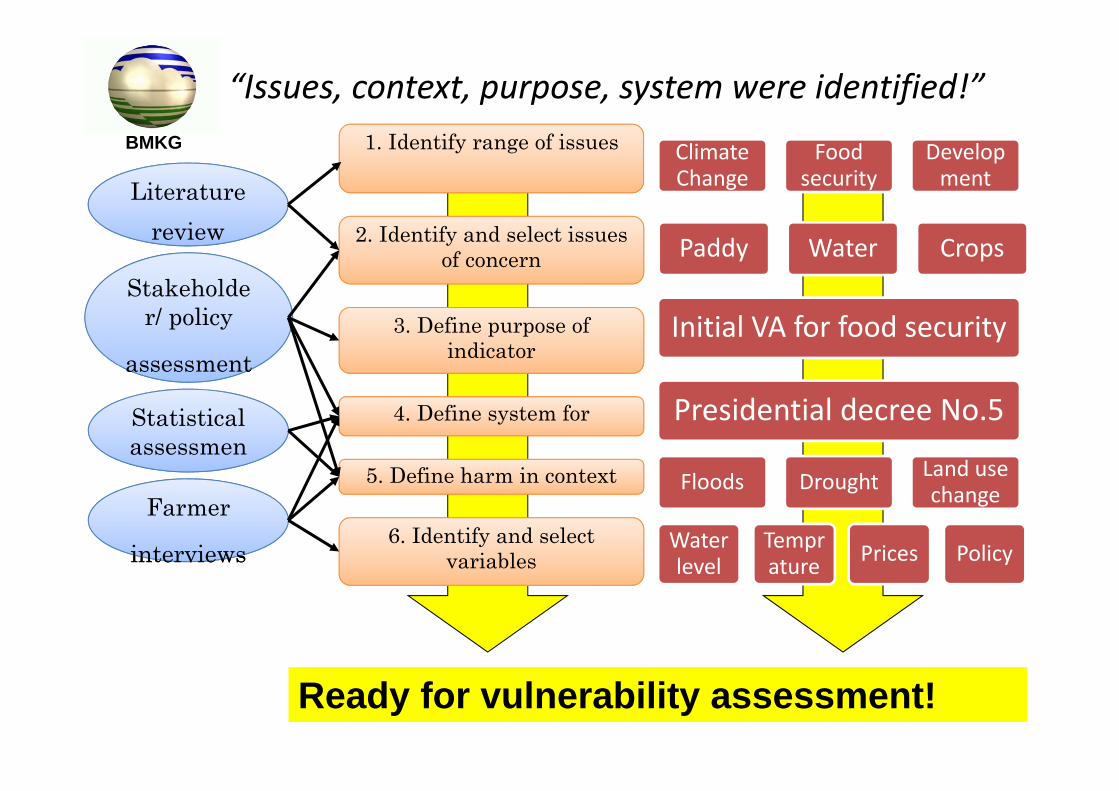
1. Identify range of issues
2. Identify and select issues of concern
3. Define purpose of indicator
4. Define system for
5. Define harm in context
6. Identify and select variables
reviewLiterature
review
t
Statistical assessmen
t
assessment
Stakeholder/ policy
assessment
interviews
Farmer
interviews
Presidential decree No.5
Initial VA for food security
Climate Change
Food security
Development
Water level
Temprature Prices Policy
Floods Drought Land use change
Paddy Water Crops
Ready for vulnerability assessment!
“Issues, context, purpose, system were identified!”BMKG
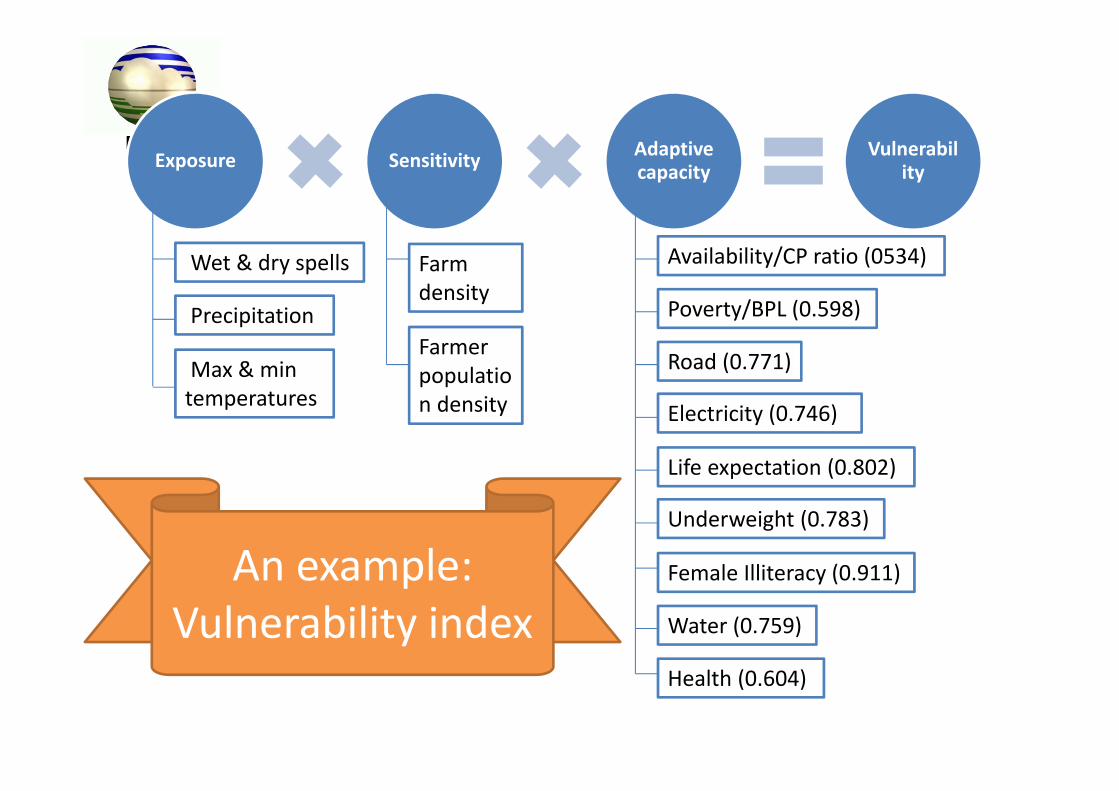
BMKGExposure Sensitivity Adaptive
capacityVulnerabil
ity
Wet & dry spells
Precipitation
Max & min temperatures
Farm density
Farmer population density
Availability/CP ratio (0534)
Poverty/BPL (0.598)
Road (0.771)
Electricity (0.746)
Life expectation (0.802)
Underweight (0.783)
Female Illiteracy (0.911)
Water (0.759)
Health (0.604)
An example:Vulnerability index
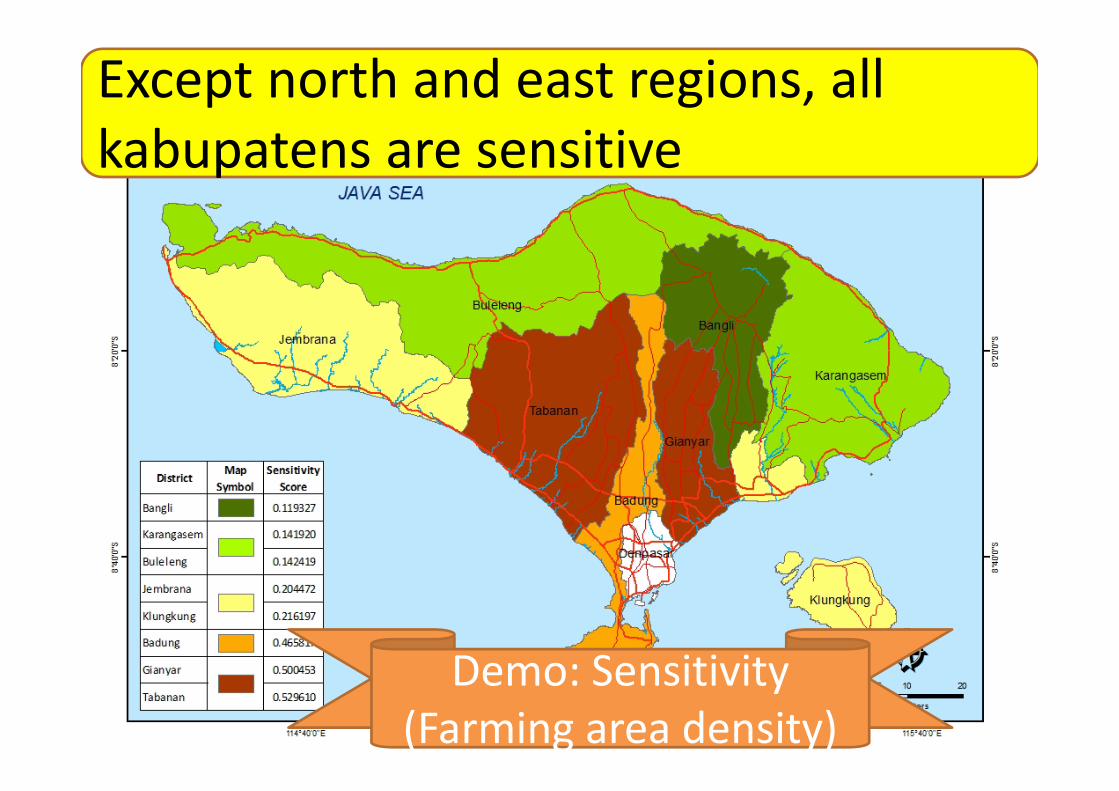
SensitivityExcept north and east regions, all kabupatens are sensitive
Demo: Sensitivity (Farming area density)
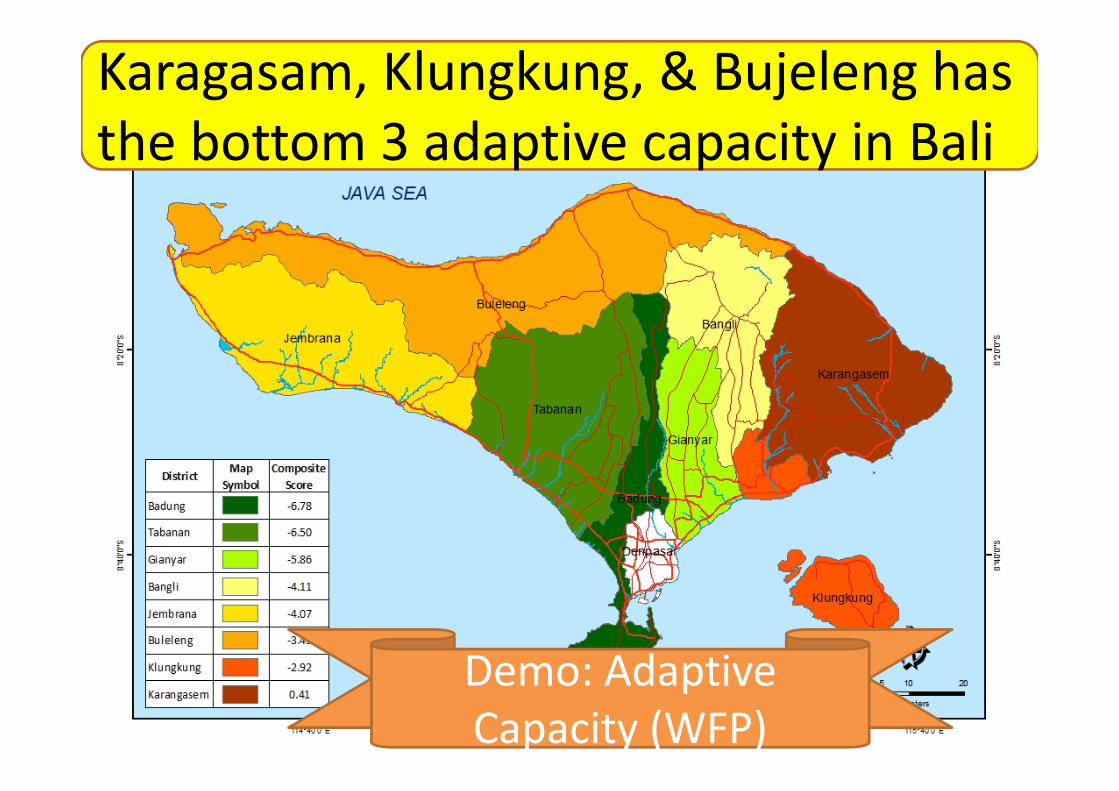
Adaptive CapacityKaragasam, Klungkung, & Bujeleng has the bottom 3 adaptive capacity in Bali
Demo: Adaptive Capacity (WFP)
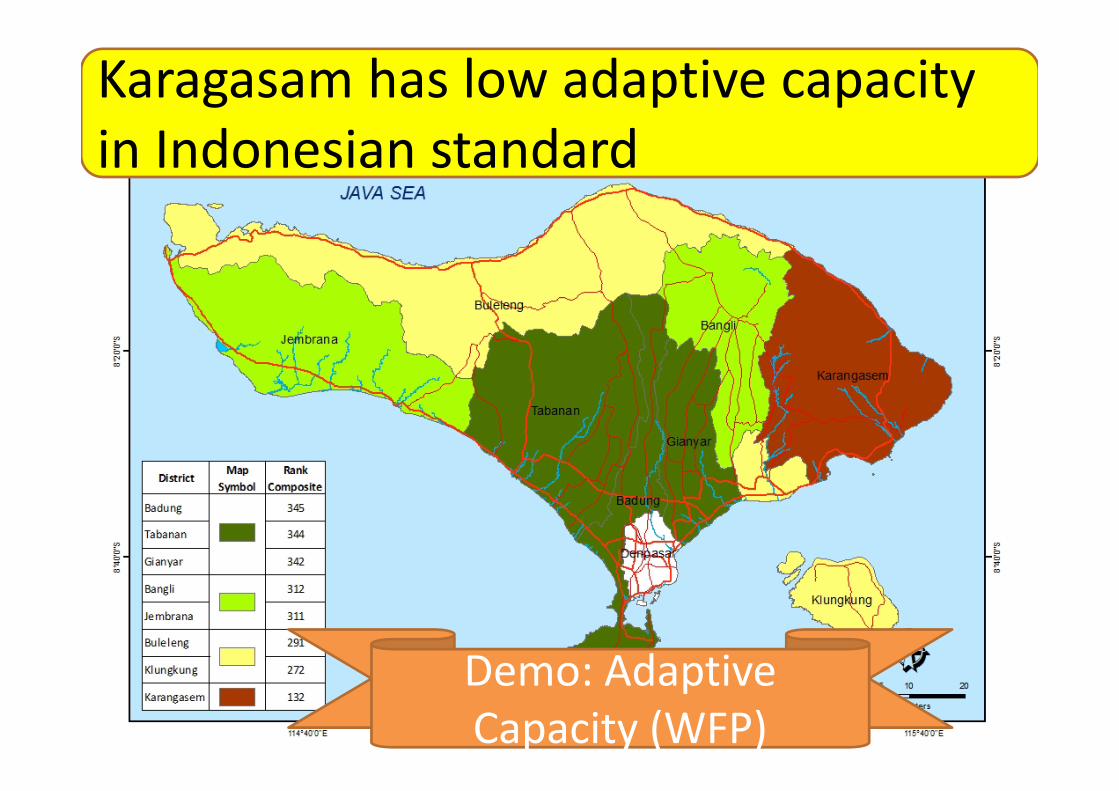
Adaptive CapacityKaragasam has low adaptive capacityin Indonesian standard
Demo: Adaptive Capacity (WFP)
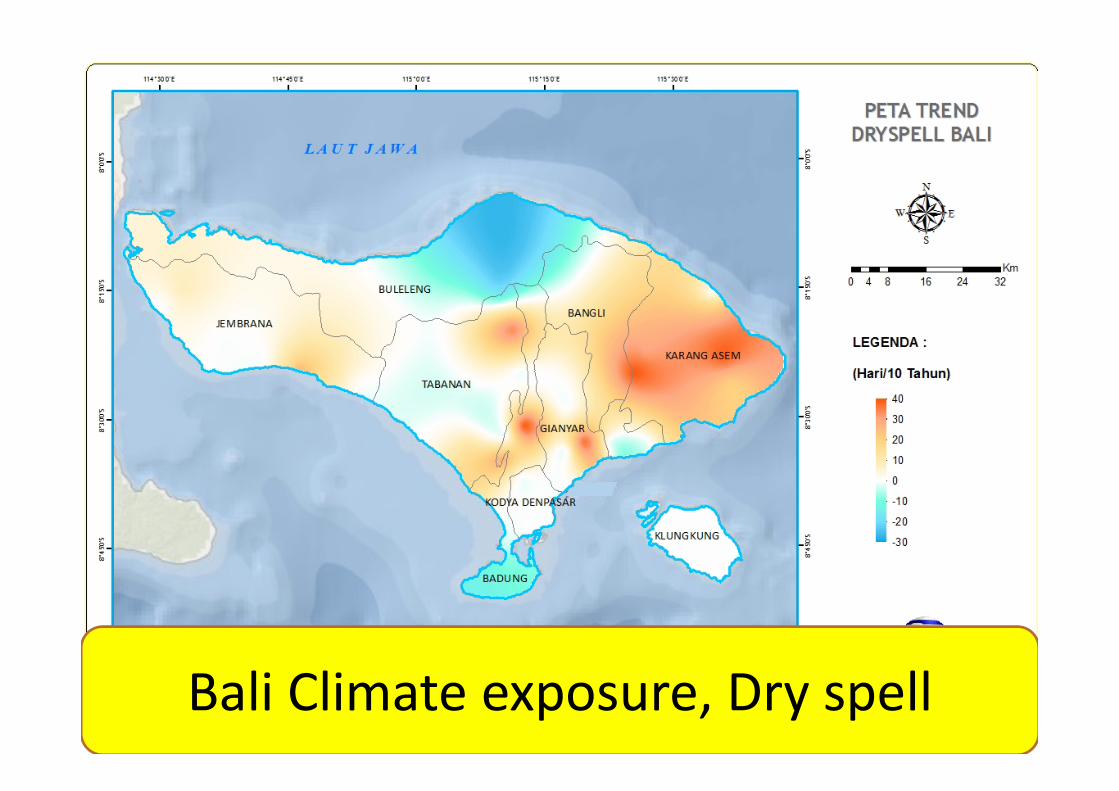
Bali Climate exposure, Dry spell
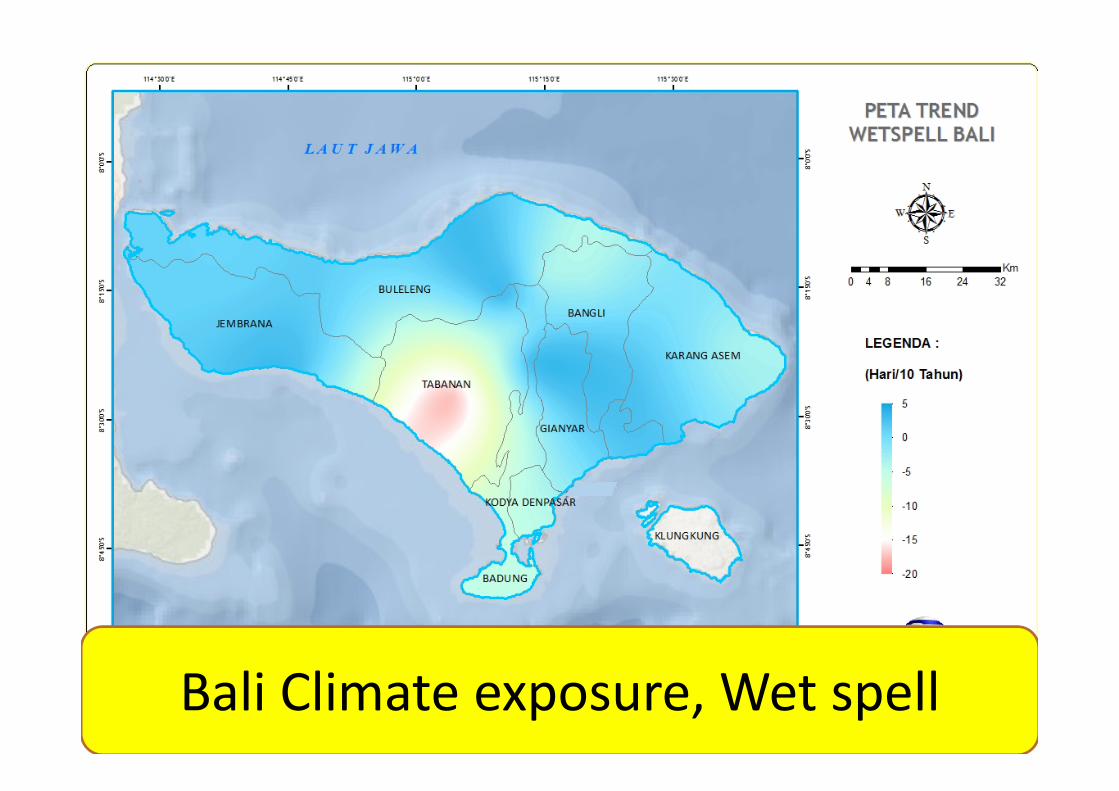
Bali Climate exposure, Wet spell
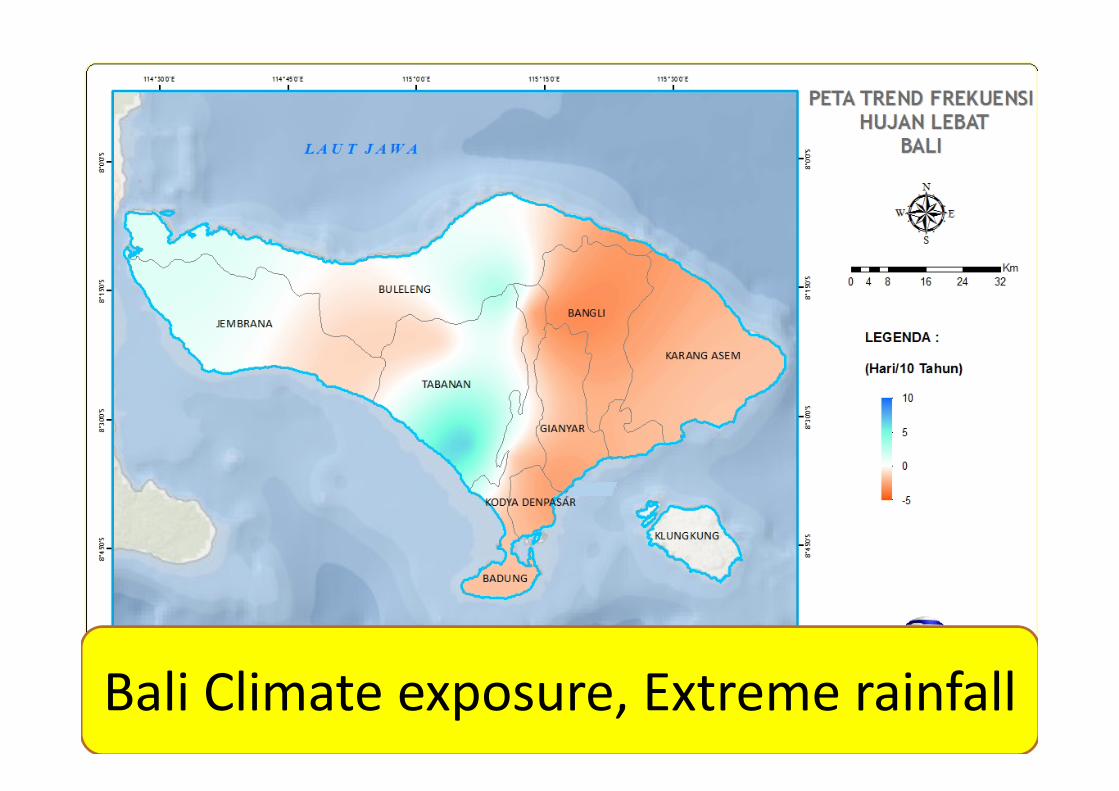
Bali Climate exposure, Extreme rainfall
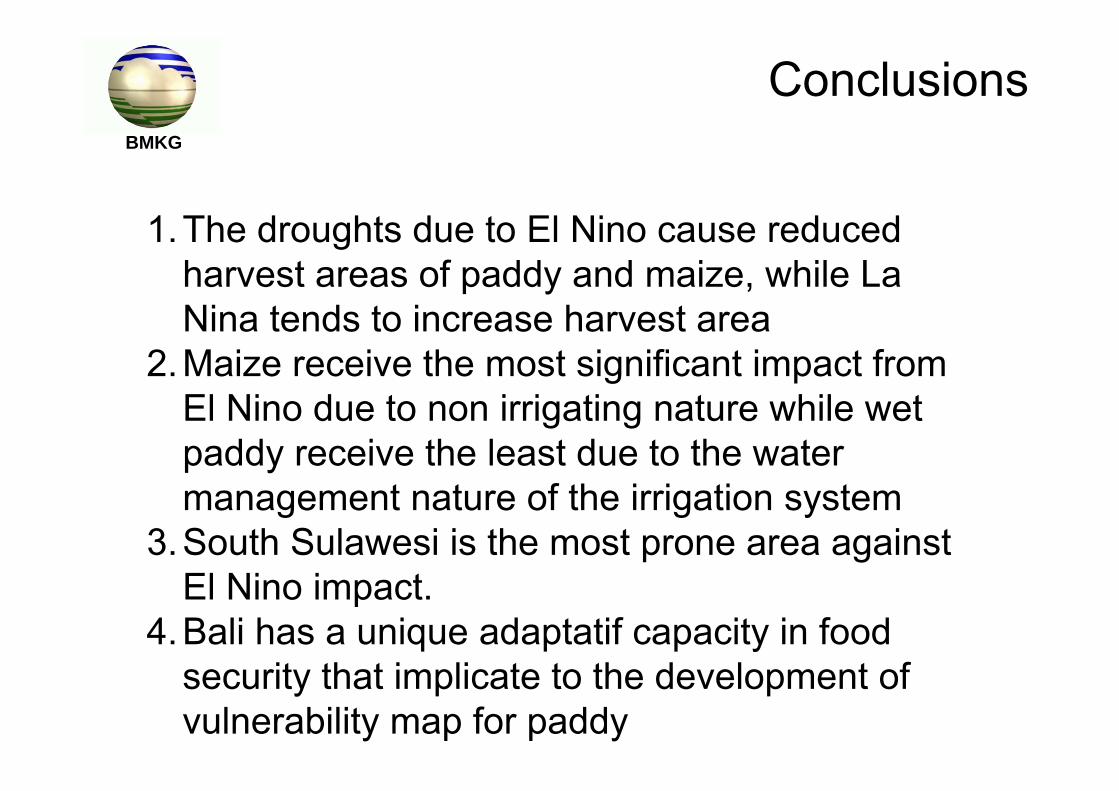
Conclusions
1.The droughts due to El Nino cause reduced harvest areas of paddy and maize, while La Nina tends to increase harvest area
2.Maize receive the most significant impact from El Nino due to non irrigating nature while wet paddy receive the least due to the water management nature of the irrigation system
3.South Sulawesi is the most prone area against El Nino impact.
4.Bali has a unique adaptatif capacity in food security that implicate to the development of vulnerability map for paddy
BMKG
THANK YOU