VULNERABILITY ASSESSMENT -...
136
2017 UNDERSTANDING SOCIAL-ECOLOGICAL SYSTEMS UNDER CLIMATE CHANGE – EXPLORING THE ECOSYSTEM SERVICE CONCEPT TOWARDS AN INTEGRATED VULNERABILITY ASSESSMENT S.A. Beichler D ISSERTATION - H AFEN C ITY U NIVERSITÄT H AMBURG
-
Upload
phungkhanh -
Category
Documents
-
view
213 -
download
0
Transcript of VULNERABILITY ASSESSMENT -...

2017
UNDERSTANDING
SOCIAL-ECOLOGICAL SYSTEMS
UNDER CLIMATE CHANGE –
EXPLORING THE ECOSYSTEM SERVICE
CONCEPT TOWARDS AN INTEGRATED
VULNERABILITY ASSESSMENT
S.A. Beichler
D I S S E R T A T I O N - H A F E N C I T Y U N I V E R S I T Ä T H A M B U R G


UNDERSTANDING SOCIAL-ECOLOGICAL SYSTEMS UNDER
CLIMATE CHANGE–
EXPLORING THE ECOSYSTEM SERVICE CONCEPT
TOWARDS AN INTEGRATED VULNERABILITY ASSESSMENT
Vorgelegt im Promotionsausschuss der
HafenCity Universität Hamburg
zur Erlangung des akademischen Grades Doktor-Ingenieurin (Dr.-Ing.)
Dissertation
von M.Sc. Simone A. Beichler
aus Berlin
2016
Betreuer:
Prof. Dr.-Ing. Jörg Knieling M.A.
Hafencity Universität Hamburg
Fachgebiet Stadtplanung und Regionalentwicklung
Prof. Dr. rer. nat. Felix Müller
Christian- Albrechts- Universität Kiel
Ökosystemforschung Arbeitsbereich Ökosystemmanagement
Institut für Natur- und Ressourcenschutz

Danksagung
Ich möchte mich besonders bei Felix Müller und Jörg Knieling für die anregenden
fachlichen Gespräche bedanken. Ihre unterschiedlichen Sichtweisen aus der
Perspektive der Ökosystemleistungsforschung auf der einen und der Stadt- und
Regionalplanung auf der anderen Seite haben spannende Fragen aufgeworfen und
somit zu meiner wissenschaftlichen Entwicklung beigetragen.
Ein großer Dank geht auch an das Team von plan B:altic. Die interdisziplinären
Dialoge im Team haben mich inspiriert und die enge Zusammenarbeit in dem
transdisziplinären Szenarioprozess war besonders wertvoll für mich. In diesem
Zusammenhang seien insbesondere noch einmal die Hilfskräfte genannt, die mich eifrig
bei der Digitalisierung der Erhebungsdaten unterstützt haben.
Besonders möchte ich den Teilnehmern und Teilnehmerinnen der partizipativen
Erhebung für die Zeit danken, die sie investiert haben. Die Arbeit hat mir sehr viel
Freude bereitet, nicht zuletzt dank ihrer offenen und diskussionsfreudigen Haltung.
Abschließend danke ich meinem Partner, meiner Familie und meinen Freunden die
mich immer unterstützt haben. Ihr habt mich wenn nötig aufgebaut, Motivationslöcher
gestopft und mir Halt gegeben.

I
OUTLINE
Vorabveröffentlichungen der Dissertation ........................................................................ 1 Abbreviations .................................................................................................................... 3 List of Figures ................................................................................................................... 4 List of Tables .................................................................................................................... 6 1 Abstract ..................................................................................................................... 7 2 Introduction ............................................................................................................. 11 3 Vulnerability ........................................................................................................... 18
3.1 Vulnerability Approaches ............................................................................... 20
3.2 Indicating Vulnerability Components ............................................................. 22
3.3 Key Findings ................................................................................................... 26
4 The Ecosystem Service Concept ............................................................................. 28 4.1 Terminology and Frameworks ........................................................................ 28
4.2 The Ecosystem Service Concept in the Urban Context .................................. 31
4.3 Application in the Context of Climate Change ............................................... 35
4.3.1 Implications regarding Ecosystem Service Categories ............................... 36
4.3.2 Supply-Demand-Interactions ...................................................................... 37
4.4 Key Findings ................................................................................................... 38
5 The Interdisciplinary Research Perspective ............................................................ 40 5.1 Social-ecological Resilience – The Interdisciplinary Process ........................ 40
5.2 Interdisciplinary Implications ......................................................................... 42
5.2.1 Climate Change Impact .............................................................................. 43
5.2.2 Adaptive Capacity in the Interdisciplinary Context ................................... 44
5.2.3 Scales .......................................................................................................... 45
5.3 Social-ecological System Approaches and Resilience - From Complexity to
Practicability ............................................................................................................... 46
5.4 Key Findings ................................................................................................... 49
6 Integrated Framework - The Social-ecological Vulnerability Loop ....................... 50 6.1 The Social-ecological Vulnerability Loop ...................................................... 51
6.2 Main Characteristics of the Proposed Framework .......................................... 53
6.3 Key Findings ................................................................................................... 56
7 Case Study and Methods ......................................................................................... 58

II
7.1 The Urban Region of Rostock (Germany) ...................................................... 58
7.2 Inter- and transdisciplinary Knowledge Base ................................................. 60
7.3 Participatory Assessment in the Urban Region of Rostock ............................ 60
7.4 Spatial Analysis ............................................................................................... 62
8 Approaching Adaptive Capacity ............................................................................. 64 8.1 First Knowledge Loop Science Science ................................................. 65
8.2 Second Knowledge Loop Practice Science ................................................ 66
8.3 Third Knowledge Loop Science Practice ............................................... 66
8.4 Key Findings ................................................................................................... 67
9 Characterization of the Urban Region ..................................................................... 68 9.1 Supply of Cultural Ecosystem Services .......................................................... 72
9.2 Perceived Vulnerability ................................................................................... 75
9.3 Exploring the Categorical Link between Supply and Demand ....................... 75
9.4 Exploring the Spatial Link between Supply and Demand .............................. 79
9.5 Integrated Analysis of Supply and Demand .................................................... 80
9.6 Quantitative Application of the Social-ecological Vulnerability Loop .......... 82
10 Integrating Discussion ............................................................................................. 85 11 Conclusion ............................................................................................................... 98
11.1 Which theoretical frameworks can be used to describe the vulnerability of
social-ecological systems? .......................................................................................... 98
11.2 How can the different concepts be integrated to describe the vulnerability of
the social-ecological system and its dynamics? .......................................................... 99
11.3 How can the adaptive capacity of a social-ecological system be characterized
and evaluated in the face of climate change. ............................................................. 100
11.4 Which methods can be used to characterize the social-ecological system
quantitatively as a basis for vulnerability assessment? ............................................. 101
11.5 Which interrelations between the social and the ecological system can be
found and what are implications regarding climate change adaptation? .................. 101
12 References ............................................................................................................. 103 13 Appendix ............................................................................................................... 118

Vorabveröffentlichungen der Dissertation
1
VORABVERÖFFENTLICHUNGEN DER DISSERTATION
nach §8 Absatz 4 der Promotionsordnung der HafenCity Universität Hamburg
Genehmigt durch den Promotionsausschuss am 20.05.2015 und am 28.10.2015
Journal Artikel:
Titel: The Dynamic Knowledge Loop – Inter- and Transdisciplinary Cooperation and Adaptation of Climate Change Knowledge.
Autoren: Hagemeier-Klose, M.*; Beichler, S.A.*; Davidse, B.J.; Deppisch, S. *first authors equally contributed
Journal (peer reviewed): International Journal of Disaster Risk Science 5:21–32 Veröffentlicht: online am 29.03.2014 Titel: The role played by social-ecological resilience as a
method of integration in interdisciplinary research. Autoren: Beichler, S.A.; Hasibovic, S.; Davidse, B.J.; Deppisch, S. Journal (peer reviewed): Ecology and Society 19(3): 4 Veröffentlicht: online 14.07.2014 Titel: Exploring the link between supply and demand of cultural
ecosystem services – towards an integrated vulnerability assessment
Autoren: Beichler, S.A. Journal (peer reviewed): International Journal of Biodiversity Science, Ecosystem
Services & Management 11(3): 250-263 Veröffentlicht: online 13.07.2015 Titel: Does the Ecosystem Service Concept Reach its Limits in
Urban Environments? Autoren: Beichler, S.A.; Bastian, O.; Haase, D.; Heiland, S.;
Kabisch, N.; Müller, F. Journal (peer reviewed): Landscape Online Veröffentlicht: 2017

Vorabveröffentlichungen der Dissertation
2
Tagungen: a) Beichler, S.; Hagemeier-Klose, M.; Deppisch, S.: “Knowledge of Adaptation –
Adaptation of Knowledge. Mapping the Adaptive Capacity of a social-ecological system”, 32nd International Geographical Congress, Köln, 26.-30.08.2012.
b) Beichler, S.; Davidse, B.J.; Deppisch, S.: “Dynamics of a social-ecological system under climate change – searching for a match with levels of governance.” EURA Conference 2012, Wien, Österreich, 20.-22.09.2012.
c) Hagemeier-Klose, M.; Beichler, S.: “The Dynamic Knowledge Loop – Inter- and Transdisciplinary Cooperation and Adaptation of Climate Change Knowledge”. European Climate Change Adaptation Conference, Hamburg, 18.-20.03.2013.
d) Beichler, S.; Deppisch, S.: “Why do we like our city? Exploring the ecosystem service cascade through the lens of social-ecological adaptation”. IALE-EU Congress - Changing European Landscapes, Landscape ecology local to global Symposium "Ecosystem Services: building informed policies to orient landscape dynamics" Manchester 09.-12.09.2013
e) Beichler, S.; Deppisch, S.: „Was leistet Ihre Stadt heute, und morgen? Partizipative Erhebung von kulturellen Ökosystemdienstleistungen in Rostock“. IALE-D Tagung, Dresden 10.-12.10.2013
f) Beichler, S.: “Exploring the use of participatory mapping in indicator development Cultural ecosystem services in the urban region of Rostock (Germany)”. Postervortrag Ecosystem Service Partnership Meeting, Kiel 6.-8. Mai 2013.
g) Beichler, S.: „The social-ecological vulnerability of an urban region”. Conference Urban Regions under Change: towards social-ecological resilience, Hamburg 27.05.2014
Lesehinweise zur Zitation in der vorliegenden Arbeit: Teilweise waren die Inhalte der Tagungsbeiträge Arbeiten die in den jeweiligen Journal Artikeln resultierten. In diesem Falle wird in der Dissertation immer auf die offizielle schriftliche Veröffentlichung d.h. den Artikel (siehe Seite 1) verwiesen. Im Kapitel „Introduction“ wird speziell in Fußnoten auf die hier aufgeführten Vorabveröffentlichungen verwiesen um einen Überblick über deren Verwendung zu geben.

Abbreviations
3
ABBREVIATIONS
aest aesthetics and inspiration
CES cultural ecosystem services
cult cultural heritage and identity
DPSIR driver-pressure-state-impact-response
DTH distance to home
edu knowledge and education
nat natural heritage and intrinsic value of biodiversity
recr recreation
SES social-ecological system
spirit spiritual and religious

List of Figures
4
LIST OF FIGURES
Figure 1: Description of the research process: the theoretical examination of the different research approaches resulting in the integrated framework (blue), the qualitative application (yellow), and the quantitative application case study on cultural ecosystem services (CES) (orange), as well as the integrating discussion (green) ............................................................................................. 15
Figure 2: Visualization of indicators for sensitivity and adaptive capacity (exposure solely included as type). Social system indicators are depicted in red and ecological system indicators are depicted in green. Indicators with ambiguous relations are depicted in orange. The bigger the size of the letters, the more frequent the indicators have been used. ............................................................ 23
Figure 3: Description of the ecosystem service concept illustrating a) the ecosystem service cascade adopted from Haines-Young and Potschin (2010), b) the supply-demand approach adopted from Burkhard et al. (2012b), and c) the Driver-Pressure-State-Impact-Response (DPSIR) context adopted from Müller and Burkhard (2012) ......................................................................................... 29
Figure 4: The interdisciplinary process adopted and summarized based on Beichler et al. (2014) ................................................................................................................ 41
Figure 5: Visualization of the overlap between vulnerability and resilience referring to the interdisciplinary perspective within the project, the single vulnerability elements (exposure, sensitivity, and adaptive capacity) as well as the social-ecological system (SES) approach. ................................................................... 47
Figure 6: The Driver-Pressure-State-Impact-Response (DPSIR) framework adopted from EEA (1999). ............................................................................................. 50
Figure 7: The social-ecological vulnerability loop. Visualization of the social (red) and the ecological (green) system and their interactions. ........................................ 52
Figure 8: The urban region of Rostock. a) Population per km2 living area b) Topographical map. ...................................................................................... 58
Figure 9: Case study area division into city districts and rural municipalities. .............. 59 Figure 10: Example of the participatory mapping .......................................................... 61 Figure 11: Description of the spatial analysis methods conducted. Figure adopted from
Beichler (2015) ................................................................................................. 62 Figure 12: The dynamic knowledge loop adopted from Hagemeier-Klose et al. (2014).
The application in the context of vulnerability research in social-ecological systems (SES) illustrates the interplay between the knowledge of adaptation (orange) and the adaptation of knowledge (red) influencing the adaptive capacity (dark red). Blue refers to scientific implications and green indicates implications for practitioners involved in the process. ..................................... 65
Figure 13: Map showing the individual entries of the participatory mapping of the cultural ecosystem services (CES) aesthetics and inspiration (aest), spiritual and religious (spirit), cultural heritage and identity (cult), recreation (recr), knowledge and education (edu), and natural heritage and intrinsic value of biodiversity (nat) in the urban region of Rostock. The results from the participatory mapping of the perceived vulnerability are indicated by the striped area. The topographical map is depicted in the background. ................ 70

List of Figures
5
Figure 14: Resulting cultural ecosystem service areas including quality ranks (5 very high – 1 very low) for a) aesthetics and inspiration (aest), b) cultural heritage and identity (cult), c) knowledge and education (edu), d) recreation (recr), e) natural heritage and intrinsic value of biodiversity (nat). Areas of perceived vulnerability to drought (D), heat wave (H) and extreme precipitation (S). (modified Source: Beichler, 2015) ................................................................... 71
Figure 15: Visualization of the share of land use classes (see legend) related to the individual CES areas. Areas valued high (5-4) and medium (3-2) are distinguished. .................................................................................................... 72
Figure 16: Overlap between the individual cultural ecosystem services aesthetics and inspiration (aest), knowledge and education (edu), recreation (recr), cultural heritage and identity (cult), natural heritage and intrinsic value of biodiversity (nat), and spiritual and religious (spirit). .......................................................... 74
Figure 17: Ranking for the cultural ecosystem services aesthetics and inspiration (aest), cultural heritage and identity (cult), knowledge and education (edu), natural heritage and intrinsic value of biodiversity (nat), recreation (recr), and spiritual and religious (spirit) according to a) the importance for wellbeing and b) the satisfaction with supply. Source: Beichler, 2015. ............................................ 76
Figure 18: Comparison of importance for wellbeing (1, not important – 5, very important) for the individual cultural ecosystem services aesthetics and inspiration (aest), cultural heritage and identity (cult), knowledge and education (edu), natural heritage and intrinsic value of biodiversity (nat), recreation (recr), and spiritual and religious (spirit) with regard to grouped social factors a) - p). Source: Beichler, 2015 ................................................... 77
Figure 19: Comparison of satisfaction with supply (1, not satisfied – 5, fully satisfied) for the individual cultural ecosystem services aesthetics and inspiration (aest), cultural heritage and identity (cult), knowledge and education (edu), natural heritage and intrinsic value of biodiversity (nat), recreation (recr), and spiritual and religious (spirit) with regard to grouped social factors a) duration of residence, b) gender, c) age. Source: Beichler, 2015........................................ 79
Figure 20: Distance to home (DTH) for the cultural ecosystem services aesthetics and inspiration (aest), cultural heritage and identity (cult), knowledge and education (edu), natural heritage and intrinsic value of biodiversity (nat), recreation (recr), and spiritual and religious (spirit). Source: Beichler, 2015 .. 80
Figure 21: The integrated supply-demand map showing the supply of the individual districts in terms of number (small maps) and area for a) aest, b) edu, c) cult, d) recr, e) nat (see legend). The darker the color/grey, the bigger the values. ...... 81
Figure 22: Integrated ecosystem service supply-demand map of a) the accumulated area in km2 of cultural ecosystem services (CES) b) the remaining area of CES excluding areas of perceived vulnerability. Very high values are represented in red (hotspots) and very low values in blue (coldspots). ................................... 82
Figure 23: Integrated ecosystem service supply-demand map of a) the accumulated number of cultural ecosystem services (CES) within a critical distance, b) the remaining number of CES excluding areas of perceived vulnerability, c) the diversity of CES, and d) the remaining CES diversity excluding areas of perceived vulnerability. .................................................................................... 83

List of Tables
6
LIST OF TABLES
Table 1: Vulnerability definitions ................................................................................... 18
Table 2: Definition of key terms after the IPCC 2007, 2012 and 2014. Words in bold are included as definitions in this table. Words in italic represent additions made in IPCC 2014. ........................................................................................................ 19
Table 3: Summary of the different aspects of resilience that are of importance in the individual subprojects of plan B:altic (a-f) representing different scientific disciplines (summarized based on Beichler et al. 2014) ................................... 43
Table 4: Results of the participatory mapping of cultural ecosystem services showing raw data and the data with overlap correction. ................................................. 68
Table 5: Results of the participatory mapping of perceived vulnerability to climate change showing raw data and the data with overlap correction........................ 69
Table 6: Areal statistics of the overlap between the cultural ecosystem services and perceived vulnerability (CC). ............................................................................ 75

Abstract
7
1 ABSTRACT
Urban and regional planning is confronted with the challenge to develop measures for
climate change adaptation. In this context, on the one hand vulnerability assessments
are increasingly requested by decision makers in order to prioritize actions. On the other
hand, it is argued in literature that ecosystem based adaptation could assist in finding
long-term adaptation strategies, whereby ecosystem services could serve as a common
language. This signalizes the need to combine the vulnerability and the ecosystem
service concept, which so far have been developed in parallel. Against this background,
the thesis presents a framework that integrates the concepts in order to enhance the
understanding of social-ecological systems under climate change.
Inter- and transdisciplinary research approaches were undertaken to unravel the
complex characteristics of social-ecological systems and issues related to climate
change. First, studies from various disciplines related to vulnerability, ecosystem
services, and resilience were investigated. The results clearly demonstrate conceptual
overlaps and methodological limitations particularly regarding the balanced focus on
the social and the ecological system. Moreover, elements that ought to be included in an
integrated approach were revealed. Thereby, the underlying objective was to develop a
method that allows a comprehensive spatial characterization of the urban region as a
basis for an integrated vulnerability assessment. For the development of a framework,
the Driver-Pressure-State-Impact-Response approach served as a pragmatic tool to
structure the vulnerability elements and associated analytical steps. The social-
ecological vulnerability loop proposed here, combines vulnerability and ecosystem
service supply and demand, whereby a consideration of the social and the ecological
system as well as their interactions was achieved.
To apply the proposed framework, methods directed towards the understanding of
adaptive capacity and the linkages between ecosystem service supply and demand were
developed and applied in the urban region of Rostock (Germany). A comprehensive
dataset was obtained through the participatory mapping of the cultural ecosystem
services aesthetics / inspiration, spiritual / religious, recreation, knowledge / education,
cultural heritage / identity, and natural heritage / intrinsic value of biodiversity, as well
as the participants’ perceived vulnerability to extreme precipitation, heat wave, and
drought. Besides the mapping, the participants evaluated the importance of the

Abstract
8
individual cultural ecosystem services for their wellbeing as well as their satisfaction
with supply in the urban region. Adaptive capacity was approached by a combination of
inter- and transdisciplinary methods exploring knowledge aspects (exchange,
generation) in science-science and science-practice cooperations. To investigate supply-
demand relationships, the categorical link between social factors and the importance of
the cultural ecosystem services for wellbeing, as well as the spatial link between
population and cultural ecosystem service were analyzed. Remarkably, no differences
according to social factors were found considering the relation to the importance for
wellbeing as well as the spatial link. Furthermore, the differences between the services
highlighted the high importance of both, recreation and natural heritage /
intrinsic value of biodiversity. Through the established critical distances between supply
and demand ranging from 2-7 km for the individual cultural ecosystem services, the
innovative integrated supply-demand map was generated. This allowed for the first time
a clear spatially explicit visualization of the differences between the city, the hinterland,
and coastal areas as well as the potential vulnerability to climate change in the urban
region. In this regard, the total area, the number, and the diversity of cultural ecosystem
services were identified as key parameters. Through the enhanced understanding of the
supply-demand relationships, it was possible to characterize the elements of the social-
ecological system as well as their interactions. Therewith, responses in terms of
adaptation measures can be linked to consequences for the whole system. The proposed
comprehensive social-ecological approach can assist planning in the formulation of
targets, the identification of suitable areas, and the reflection of potential shortcomings.
Finally, it was highlighted that a development of adaptation measures in combination
with cultural ecosystem services can create win-win opportunities and therewith
facilitate the implementation of long-term strategies.
Zusammenfassung
Die Anpassung an den Klimawandel stellt eine große Herausforderung für die Stadt-
und Regionalplanung dar. In diesem Kontext wird einerseits von Praktikern verstärkt
der Bedarf an Untersuchungen zu Vulnerabilität geäußert. Anderseits wird in der
Literatur darauf hingewiesen, dass ein ökosystembasiertes Management zur
Entwicklung von langfristigen Anpassungsoptionen beitragen kann, wobei
Ökosystemleistungen als Grundlage für die Verständigung zwischen Praktikern dienen

Abstract
9
könnten. Dies unterstreicht die Notwendigkeit, die Konzepte von Vulnerabilität und
Ökosystemleistungen miteinander zu kombinieren, denn bisher wurden diese Konzepte
unabhängig voneinander entwickelt. Vor diesem Hintergrund präsentiert die
vorliegende Arbeit ein Rahmenkonzept, das beide Konzepte integriert, um somit zu
einem besseren Verständnis von sozial-ökologischen Systemen im Klimawandel
beizutragen.
Im Forschungsprozess wurden inter- und transdisziplinäre Ansätze angewendet, um den
komplexen Eigenschaften von sozial-ökologischen Systemen und der Problemstellung
des Klimawandels auf den Grund zu gehen. Dabei wurden zunächst Studien mit Bezug
zu Vulnerabilität, Ökosystemleistungen und Resilienz aus unterschiedlichen
wissenschaftlichen Disziplinen untersucht. Die Ergebnisse zeigen klar konzeptionelle
Überschneidungen und methodische Einschränkungen insbesondere hinsichtlich der
Berücksichtigung des sozialen und des ökologischen Systems auf. Desweiteren wurden
Elemente, die in einem integrierten Ansatz berücksichtigt werden sollen, identifiziert.
Das Hauptziel der vorliegenden Arbeit war dabei eine Methode zu entwickeln, die eine
umfassende räumliche Charakterisierung von sozial-ökologischen Systemen ermöglicht,
um daraus eine integrierte Vulnerabilitätsanalyse abzuleiten. Als Ausgangspunkt für die
Entwicklung des Rahmenkonzeptes wurde der Driver-Pressures-State-Impact-Response
(DPSIR) Ansatz genutzt, da dieser es ermöglicht, die Vulnerabilitätselemente und
assoziierten Analysen zu strukturieren. Die hier vorgestellte sozial-ökologische
Vulnerabilitäts-Schleife (social-ecological vulnerability loop) verbindet erstmals
Vulnerabilität mit dem Angebot von und der Nachfrage nach Ökosystemleistungen
(ecosystem service supply and demand). Dadurch konnte erreicht werden, dass sowohl
das soziale als auch das ökologische System und insbesondere deren Interaktionen in
die Vulnerabilitätsanalyse mit einbezogen wurden.
Für die Umsetzung des Rahmenkonzeptes wurden innovative Methoden entwickelt, um
in der Stadtregion Rostock (Deutschland) die Anpassungskapazität (adaptive capacity)
hinsichtlich des Klimawandels und die Verknüpfungen zwischen dem Angebot von und
der Nachfrage nach Ökosystemleistungen konkret darzustellen. Hierzu wurde eine
partizipative Erhebung durchgeführt hinsichtlich der kulturellen Ökosystemleistungen
Ästhetik / Inspiration, spirituell / religiös, Erholung, Wissen / Bildung, kulturelles Erbe /
Identität und Naturerbe / intrinsischer Wert von Biodiversität sowie der wahrgenommen
Vulnerabilität der Teilnehmer in Bezug auf Starkregen, Hitzewelle und Dürre. Neben

Abstract
10
der Kartierung haben die Teilnehmer die Bedeutung der einzelnen kulturellen
Ökosystemleistungen für ihr Wohlbefinden sowie ihre Zufriedenheit mit der
Bereitstellung bewertet. Die Anpassungskapazität wurde mittels einer Kombination aus
inter- und transdiziplinären Methoden untersucht, wobei Wissensaspekte (Austausch,
Generierung) in der Kooperation zwischen Wissenschaftlern sowie zwischen
Wissenschaft und Praxis betrachtet wurden. Um die Verbindung von
Ökosystemleistungsangebot und -nachfrage zu bestimmen, wurde der Zusammenhang
zwischen sozialen Faktoren und der Bedeutung von kulturellen Ökosystemleistungen
für das Wohlbefinden sowie die räumliche Verknüpfung zwischen kulturellen
Ökosystemleistungen und der Bevölkerung untersucht. Bemerkenswerterweise wurde
kein signifikanter Einfluss der sozialen Faktoren auf die Bedeutung der
Ökosystemleistungen für das Wohlbefinden sowie auch hinsichtlich der räumlichen
Verteilung gefunden. Außerdem konnte gezeigt werden, dass in der Stadtregion
Rostock Erholung einerseits und Naturerbe / intrinsischer Wert von Biodiversität
andererseits von gleich hoher Bedeutung für das Wohlbefinden sind. Auf Basis der
ermittelten kritischen Distanzen zwischen Angebot und Nachfrage für die einzelnen
kulturellen Ökosystemleistungen im Bereich von 2-7 km wurde erstmals eine integrierte
Angebots-Nachfrage-Karte für die Stadtregion erstellt. Dies ermöglichte eine räumlich
explizite Darstellung der Unterschiede zwischen Stadt, Umland und Küstenbereich und
der potentiellen Klimawandel-Vulnerabilität. Dabei wurden als Hauptmerkmale bei der
Analyse von Stadtregionen die Gesamtfläche, die Anzahl und die Diversität der
kulturellen Ökosystemleistungen identifiziert. Das verbesserte Verständnis des
Zusammenhangs zwischen Angebot und Nachfrage ermöglichte es, die Elemente des
sozial-ökologischen Systems und deren Interaktionen zu charakterisieren. Auf dieser
Grundlage können die Auswirkungen von Anpassungsmaßnahmen an den Klimawandel
auf das gesamte sozial-ökologische System dargestellt werden. Der vorgestellte
umfassende sozial-ökologische Ansatz kann die Planung dabei unterstützen, Ziele zu
formulieren, geeignete Flächen zu identifizieren und mögliche Konsequenzen von
Maßnahmen zu reflektieren. Damit konnte erstmals aufgezeigt werden, dass
Klimawandelanpassung in Verbindung mit kulturellen Ökosystemleistungen Win-Win-
Situationen ermöglicht, die die Umsetzung von langfristigen Strategien erheblich
fördern.

Introduction
11
2 INTRODUCTION
This thesis is indented to contribute to the understanding of dynamics of social-
ecological systems under climate change. Already since the IPCC report in 2007, it
became clear that climate change adaptation is needed alongside mitigation strategies
(IPCC, 2007). Adaptation to climate change is considered one of the largest challenges
facing regional and urban development, as innovative local planning decisions need to
be taken under uncertainty (Mooney et al., 2009). To be able to handle this challenge, it
is required to gain knowledge about the characteristics of climate change impacts, as
well as to evaluate possible responses and to prioritize investments and adaptation
measures (Adger, 2006; Hinkel and Klein, 2009). In this context, the term vulnerability
is increasingly used in many disciplines with definitions differing considerably (De
Lange et al., 2010). However, most studies, in accordance with the IPCC definition
(IPCC, 2007), agree on the main vulnerability-components being exposure, sensitivity,
and adaptive capacity, and their dynamic interactions (Adger, 2006; De Lange et al.,
2010). The classification and the detailed meaning of the elements are however ongoing
subjects of discussion (Gallopín, 2006; Hinkel, 2011).
In central Europe and particularly Germany, the predicted effects of climate change in
terms of increased urban heat island effects, changes in the precipitation regime, and the
increase of extreme events are comparatively moderate (IPCC, 2012), but will have
considerable effects on the quality of life especially in cities (EEA, 2009). Hence,
climate change adaptation is needed. Yet, as the risk of fatalities is currently low, it
bears the opportunity to develop long-term adaptation strategies, which could contribute
to achieving a more sustainable development in general. Important approaches in this
context are ecosystem based adaptation and management. Ecosystem based adaptation
considers ecosystem degradation and the associated decrease of ecosystem services to
manage the vulnerability of the society to climate change (Vignola et al., 2009).
Ecosystem based management takes into account the role of ecological structures and
processes as well as the interconnectedness of the social and the ecological system.
Here, ecosystem services could serve as a common language for comparing
management options (Granek et al., 2010). That context signalizes the need for methods
that allow for an integrated analysis of the social-ecological system in terms of
ecosystem services and vulnerability.

Introduction
12
The concept of social-ecological systems (Ostrom, 2009) and their inherent interactions
has been adopted by many research disciplines. Vulnerability research shows a trend
towards system oriented approaches that consider the vulnerability of social-ecological
systems holistically (Adger, 2006) including the analysis of multiple variables in
relation to various driving forces (De Chazal et al., 2008; Luers, 2005). However,
although many theoretical vulnerability frameworks exist (e.g. Metzger et al., 2006;
Turner et al., 2003a), they are seldom put into practice (Hinkel and Klein, 2009) or give
little reference to practical applications in decision-making (Luers, 2005).
The ecosystem service concept is an application oriented framework to analyze social-
ecological systems (Burkhard et al., 2010b; Müller et al., 2010b). There are diverse
ecosystem service assessment approaches (Hermann et al., 2011). However, in order to
be relevant for decision-making, studies need to be more stakeholder-oriented and
transparent (Cowling et al., 2008; Daily et al., 2009), and should allow for
interdisciplinary integration, which is useful for target setting, discussion, and reflection
(Termorshuizen and Opdam, 2009). As such, comparing vulnerability and ecosystem
services approaches, it can be stated that both are indicator based and take a social-
ecological approach. On the one hand, vulnerability studies often focus on the
identification of areas with urgent need for action or with the highest impact on people,
thus focus on the social system, and are hard to be translated into practical measures. On
the other hand, ecosystem service studies focus on the identification of areas with
ecosystem service supply, which could be translated into practical measures. However,
ecosystem service studies are often thought to be only relevant for the environmental
sector, as they focus more on the ecological system and are less stakeholder oriented,
especially in terms of target setting. This suggests that through the cross-fertilization of
disciplines, a combination of both concepts could be of high value, as there is a need for
more research on the description of complex social-ecological systems as a basis of
vulnerability analysis (Luers, 2005).
Against this background, it becomes clear that to understand the effects of climate
change and to find effective adaptation strategies, input from various scientific
disciplines is required. The integration between and across disciplines is described by a
range of theoretical approaches referring to multidisciplinarity, interdisciplinarity, or
transdisciplinarity (Mobjörk, 2010; Stock and Burton, 2011) that are however related to
a variety of meanings (Stock and Burton, 2011). In this thesis, interdisciplinarity refers

Introduction
13
to approaches, where knowledge of different disciplines is accumulated and integrated
to bridge disciplinary boundaries, e.g. between social and natural science (Stock and
Burton, 2011). In this context, this thesis deals on the one hand with the state of the art
in literature related to different disciplines. As multiple concepts such as
multifunctionality, sustainability, ecosystem services, vulnerability, and resilience exist
in parallel, there is a need for integrative approaches (Bruckmeier, 2012; Burkhard et
al., 2010b; O’Farrell and Anderson, 2010; Turner, 2010). On the other hand, the
interdisciplinary discussions within the research project plan B:altic related to e.g.
issues of spatial planning, governance, and knowledge will be reflected. Therewith, the
often requested need for interdisciplinary exchange of knowledge in the context of
climate change adaptation (Sanchez-Rodriguez, 2009) will be addressed. Moreover, in
this thesis, transdisciplinarity refers to approaches that explicitly include cooperation
between researchers and practitioners from outside academia (Mobjörk, 2010). Multiple
studies underlined the need to include stakeholders into the research process. Thus, the
importance of local knowledge in studies concerning vulnerability, ecosystem services,
and social-ecological systems is emphasized (Bruckmeier, 2012; Hutton et al., 2011;
O’Farrell and Anderson, 2010; Smit and Wandel, 2006). These issues are acknowledged
by applying a participatory approach in the spatial analysis of this thesis.
Urban regions represent interesting “laboratories” to understand patterns and processes
related to human modifications in the context of global change (Grimm et al., 2008).
This is due to the high population density and the high degree of imperviousness that
increase the potential vulnerability. Moreover, urban regions are interesting laboratories
for the application of the ecosystem service concept linking science with planning
(Ahern, 2012). Due to the interaction between the city and its hinterland, the concept of
ecosystem service supply and demand could give insights in understanding spatial
relationships. In this context, the use of a social-ecological system approach is an
excellent supplement to explore sustainability science beyond interdisciplinary
approaches (Angelstam et al., 2013). Although, vulnerability studies consider the social
and the ecological system, the results often give solely information on people or places
that might be impacted, but they rarely indicate where adaptation could take place. In
contrast, ecosystem service studies point at areas with potential for adaptation, but the
direct link to the people often remains unclear. As such, it is important to consider both,
the supply and demand of ecosystem services as done in more and more studies in

Introduction
14
recent years (Baró et al., 2015; Nedkov and Burkhard, 2012; Stürck et al., 2014; Wolff
et al., 2015). Especially in the context of climate change, research on the interactions
between the supply and the demand, and the related indirect effects of climate change is
necessary.
Given this multitude of approaches that exists in parallel, the main question is, how the
social-ecological system of an urban region and its dynamics can be described
combining existing approaches. To find answers to this question, the thesis aims at
finding a way to operationalize the vulnerability concept and the ecosystem service
concept in an integrated manner.
Against this background, the thesis has two main objectives:
Investigating social-ecological system approaches regarding climate change
adaptation in the inter- and transdisciplinary context
Developing a method for the spatial characterization of the urban region as a basis
for vulnerability assessment including the distribution of ecosystem services and
the link between supply and demand
The theoretical background is elucidated in detail in the individual chapters concerning
vulnerability, ecosystem services, the interdisciplinary work, and the developed
framework.
The thesis explores the use of the ecosystem service concept with the ambition to
develop an integrated approach for the assessment of vulnerability. The practical
background of the study is adaptation to climate change in urban regions that are
understood as social-ecological systems. Given the complexity of the topic, which is
influenced by several scientific disciplines, concepts that exist in parallel, the need for
methodological development as well as inter- and transdisciplinary research approaches,
the thesis is divided into three parts (Figure 1): the theoretical examination and
integration of the different concepts (blue), method development and the application of
the framework (yellow and orange), and the integrating discussion (green).

Introduction
15
The first part of the thesis is of conceptual and theoretical nature (cf. Figure 1, blue)
taking an interdisciplinary perspective in the reflection of literature. First, a short
overview on vulnerability approaches is given. The elements of vulnerability and
associated indicators are evaluated against the background of a social-ecological system
approach (Chapter 3)1. Furthermore, the ecosystem service concept is introduced
focusing on the urban context. An overview on assessment approaches and the
applications of the ecosystem service concept in practice is presented, whereby the
discussion emphasizes the handling of urban structures (Chapter 4)2. Morover, the
process of interdisciplinary integration within the research project plan B:altic is
presented (Chapter 5) 3. Herein, the use of resilience as a bridging concept is discussed
reflecting the interdisciplinary process and the implications derived for the thesis
1 Parts based on the presentation a) Beichler et al. (2012) cf. page 2 2 Parts based on the article manuscript Beichler et al. (2017) cf. page 1 3 Parts based on the article Beichler et al. (2014) cf. page 1
Figure 1: Description of the research process: the theoretical examination of the different research approaches resulting in the integrated framework (blue), the qualitative application (yellow), and the quantitative application case study on cultural ecosystem services (CES) (orange), as well as the integrating discussion (green)
vulnerability concepts and indicators
ecosystem service concept and
assessment methods
interdisciplinary research process
social-ecological approach to vulnerability - framework integrating vulnerability and ecosystem services
knowledge loopinter- & trans-
disciplinary process
quantitative application development of the method, participatory
assessment, spatial analysis
qualitative applicationmethod development
approaching adaptive capacity
perceived vulnerability CES supply
exposure
social-ecological link
integrating discussion
integrated supply-demand
exemplary vulnerability assessment

Introduction
16
regarding vulnerability elements and the social-ecological approach. Considering the
first three elements of the thesis (Figure 1, light blue), the literature on the different
concepts was compiled, summarized, and reflected in an iterative research process. As
such, the chapters on vulnerability, ecosystem services, and the interdisciplinary process
are closely interwoven, as one finding was reflected back to the other conceptual
approaches.
The first part of this thesis ends with the resulting integrated theoretical framework
(Chapter 6)1. Herein, the concepts are combined under the Driver-Pressure-State-
Impact-Response framework (DPSIR).
The goals of the theoretical part are related to the following focal research questions:
Which theoretical frameworks can be used to describe the vulnerability
of social-ecological systems?
How can the different concepts be integrated to describe the
vulnerability of the social-ecological system and its dynamics?
The second part of this thesis (Figure 1, yellow and orange) refers to the application of
the framework. First, the urban region of Rostock is introduced, summarizing the
basic information on the case study region as well as the broad interdisciplinary
knowledge base derived through the transdisciplinary scenario process. Moreover, the
empirical data and developed methods are described that provide the basis for the
following application of the framework (Chapter 7). In the qualitative application
(Figure 1, yellow), the theoretical framework is reflected in the inter- and
transdisciplinary context (Chapter 8). The aspects of knowledge are emphasized in
order to approach adaptive capacity. In the quantitative application (Figure 1, orange),
the results of the case study focusing on cultural ecosystem services (CES) in the
urban region of Rostock are presented (Chapter 9)2. Here, the spatial characterization of
the urban region by means of ecosystem service supply and the relation to land use
classes, the exploration of the link between supply and demand considering social
factors, and the implications regarding vulnerability in the urban region are presented.
1 Parts based on the presentation b) Beichler et al (2012) cf. page 2 2 Parts based on the article Beichler (2015) cf. page 1

Introduction
17
The second part addresses specifically the questions:
How can the adaptive capacity of a social-ecological system be
characterized and evaluated in the face of climate change?
Which methods can be used to characterize the social-ecological system
quantitatively as a basis for vulnerability assessment?
Which interrelations between the social and the ecological system can be
found and what are implications regarding climate change adaptation?
All findings are brought together in the integrating discussion (Figure 1, green). Here,
the results are reflected in the context of the overall thesis presenting limitations of the
study, future research needs, and implications for adaptation (Chapter 10). Finally, the
conclusion answers the research questions posed.

Vulnerability
18
3 VULNERABILITY
Vulnerability research has developed in parallel within the social and biophysical
science. Traditionally, vulnerability studies focused either on the social sector, meaning
the vulnerability of people, or on the spatial assessment of natural hazards related to
different sectors, such as agriculture or water (Adger, 2006; De Chazal et al., 2008;
Luers, 2005). Currently, the different scientific disciplines in the context of climate
change research are merging, towards system oriented approaches, which consider the
vulnerability of social-ecological systems in a holistic manner (Adger, 2006; Folke,
2006). Numerous vulnerability approaches (e.g. Brooks et al., 2005; Brown et al., 2014;
Füssel, 2010; Lissner et al., 2012; Metzger and Schröter, 2006; Metzger et al., 2006,
2005; Reyer et al., 2012; Schauser et al., 2010) are based upon the IPCC (2007, 2001)
definition referring to vulnerability as a function of exposure, sensitivity, and adaptive
capacity (Table 2), which was also the starting point of this thesis. In contrast, the
disaster risk approach (Table 1) refers to hazard, exposure, vulnerability, and resilience
as being key elements (UNISDR, 2011). The definition of Adger (2006) in turn uses the
terms susceptibility and capacity to adapt, whereas expanded vulnerability takes
resilience, exposure, and sensitivity into consideration (Table 1). A detailed description
of the different fields of vulnerability research (e.g. climate and global environmental
change, development and livelihood, human ecology), schools of thoughts, and a
detailed examination of approaches (e.g. risk-hazard, pressure-and-release, expanded
Table 1: Vulnerability definitions
Disaster risk (UNISDR 2011, p.x)
“[…]disaster risk is considered to be a function of hazard, exposure and vulnerability. Exposure: “location of people or economic assets in hazard-prone areas.” Vulnerability: “susceptibility to suffer damage and loss” Resilience: “the capacity of systems to absorb or buffer losses, and recover.
Vulnerability (Adger 2006, p.268)
“the state of susceptibility to harm from exposure to stresses associated with environmental and social change and from the absence of capacity to adapt”
Expanded vulnerability (Turner 2003, p. 8074 & 8075)
“Vulnerability is the degree to which a system, subsystem, or system component is likely to experience harm due to exposure to a hazard […]”Resilience: “The system’s capacities to cope or respond” “Exposure beyond the presence of a perturbation and stressor/stress, including the manner in which the coupled system experiences hazards” “Sensitivity of the coupled system to the exposure”

Vulnerability
19
Table 2: Definition of key terms after the IPCC 2007, 2012 and 2014. Words in bold are included as definitions in this table. Words in italic represent additions made in IPCC 2014.
Vulnerability (IPCC 2007, p. 883)
“the degree to which a system is susceptible to, and unable to cope with, adverse effects of climate change, including climate variability and extremes. Vulnerability is a function of the character, magnitude, and rate of climate change and variation to which a system is exposed, its sensitivity, and its adaptive capacity.”
Adaptive capacity (IPCC 2007, p. 869)
“The ability of a system to adjust to climate change […] to moderate potential damages to take advantage of opportunities, or to cope with the consequences.”
Sensitivity (IPCC 2007, p. 881; italic 2014, p. 1772)
“The degree to which a system [or species] is affected, either adversely or beneficially, by climate variability or change. The effect may be direct […] or indirect […].”
Disaster risk reduction (IPCC 2012, p. 558; equiv. 2014, p. 1763)
“Denotes both a policy goal or objective, and the strategic and instrumental measures employed for anticipating future disaster risk; reducing existing exposure, hazard, or vulnerability; and improving resilience.”
Vulnerability (IPCC 2012, p. 564; italic 2014, p.1775)
“The propensity or predisposition to be adversely affected.” “Vulnerability encompasses a variety of concepts and elements including sensitivity or susceptibility to harm and lack of capacity to cope and adapt.”
Risk (IPCC 2014, p. 1772)
“often represented as probability of occurrence of hazardous events or trends multiplied by the impacts if these events or trends occur. Risk results from the interaction of vulnerability, exposure, and hazard.”
Exposure (IPCC 2012, p. 559; italic 2014, p. 1765)
“The presence of people, livelihoods, [species or ecosystems, environmental functions,] services, and resources, infrastructure, or economic, social, or cultural assets [in places and settings] that could be adversely affected.”
Hazard (IPCC 2012, p. 560; italic 2014, p. 1766)
“The potential occurrence of a natural or human-induced physical event [or trend or physical impact] that may cause loss of life, injury, or other health impacts, as well as damage and loss to property, infrastructure, livelihoods, service provision, [ecosystems,] and environmental resources.”
Adaptive capacity (IPCC 2012, p. 556)
“The combination of the strengths, attributes, and resources available to an individual, community, society, or organization that can be used to prepare for and undertake actions to reduce adverse impacts, moderate harm, or exploit beneficial opportunities.”
Adaptive capacity (IPCC 2014, p. 1758)
“The ability of systems, institutions, humans, and other organisms to adjust to potential damage, to take advantage of opportunities, or to respond to consequences.”
Resilience (IPCC 2012, p. 563)
“The ability of a system and its component parts to anticipate, absorb, accommodate, or recover from the effects of a hazardous event in a timely and efficient manner, including through ensuring the preservation, restoration, or improvement of its essential basic structures and functions.”
Resilience (IPCC 2014, p. 1772)
“The capacity of social, economic, and environmental systems to cope with a hazardous event or trend or disturbance, responding or reorganizing in ways that maintain their essential function, identity, and structure, while also maintaining the capacity for adaptation, learning, and transformation.”

Vulnerability
20
vulnerability) has been realized in several reviews (Füssel, 2007; Gallopín, 2006;
Hufschmidt, 2011; Preston et al., 2011; Smit and Wandel, 2006; Turner, 2010).
Accordingly, it can be summarized that the concepts of vulnerability, risk, resilience,
adaptive capacity, and adaptation are not only closely interrelated, but largely overlap,
whereby some key terms might be used in the same way, might be labeled differently or
even have a completely different meaning. Interestingly, comparing the definitions of
the sequent IPCC reports (2014, 2012, 2007) (Table 2), the development of the
definitions over time and the influence of different, to some extent overlapping research
domains, becomes apparent. Whereas in 2007 vulnerability was defined as function of
exposure, sensitivity, and adaptive capacity (cf. Table 2), in 2012 the risk/hazard
approach was applied with exposure, hazard, vulnerability, and resilience being central
elements, wherein the term vulnerability partially parallels the sensitivity description of
2007 (IPCC, 2012, 2007). Yet, the subsequent IPCC (2014) vulnerability definition
represents a mixture of both. As such, the development of the IPCC definitions in recent
years illustrates that the fields are more and more merging, borrowing ideas,
conceptualizations or methods from one another. However, a new or adapted definition
is beyond the scope of this thesis, as the objective of this thesis relates to method
development focusing on practical applications. In this regard, bearing the theoretical
discussion in mind, the following chapter introduces some vulnerability approaches
showing different applications and common research challenges.
3.1 Vulnerability Approaches
A broad range of theoretical vulnerability frameworks/models have been proposed
(Metzger et al., 2005; Schröter et al., 2005; Turner et al., 2003a). Vulnerability is a
complex, dynamic characteristic of a social-ecological system that is influenced by
multiple factors and conflicts inherent to the system, and the specification of the
exposure (Adger, 2006; Brooks et al., 2005; Luers, 2005). Short term extreme events as
well as gradual changing variables need to be integrated (Brooks et al., 2005; Luers,
2005). Moreover, the feedbacks caused by the reactions of the social and the ecological
system need to be taken into consideration (Turner et al., 2003a). Particularly, the
impacts of land use change and climate change as well as the associated impairment of
ecosystem services and the thread to various species are closely related (Mooney et al.,
2009). Furthermore, social vulnerability is often hidden and hard to grasp, since various
human aspects and levels of society need to be considered (Fekete, 2009). Against this

Vulnerability
21
background, it becomes clear that vulnerability is a multifaceted concept. In that
context, a variety of approaches and methods aiming at the spatially explicit mapping of
vulnerability evolved. For example, the DIVA tool (Dynamic and Interactive
Vulnerability Assessment) includes different climate and socio-economic scenarios as
well as adaptation strategies, and therewith enables a comparison of the different
vulnerability components (Hinkel and Klein, 2009). Luers (2005) proposed a three
dimensional visualization method aimed at the systematic assessment of vulnerable
places and people to different impacts (e.g. climatic and economic). The “spatial units
of vulnerability” (Kienberger et al., 2010; Leidel et al., 2009) combined land use / land
cover data and census data for the spatial modeling of vulnerability independent from
administrative boundaries. Schröter et al. (2005) presented a European-wide assessment
of the change in ecosystem service supply including multiple global change scenarios
(socio-economic, climate, and land use factors) and ecosystem models. They found that
changes related to climate and land use resulted in a decreased ecosystem service
supply, which in turn increased the vulnerability (e.g. by decreasing water availability).
The “social vulnerability index” (Fekete, 2009), a subnational index developed in the
context of river floods, enabled the characterization of different social groups in
Germany. De Chazal et al. (2008) presented a method that could complement different
vulnerability approaches by including stakeholders into the assessment. By means of
flexible and transparent matrices, the biophysical properties, land uses, ecosystem
services, and stakeholder values were combined to analyze the vulnerability in terms of
different land use scenarios. Also Brooks et al. (2005) and Schröter et al. (2004) found
that expert based approaches are valuable to validate vulnerability indicators, since the
importance of indicators is closely related to local situations.
A comparison of different vulnerability approaches was presented by Wolf (2012). It
was stated that in addition to the exposure unit and the entities under consideration, the
results could be differentiated in being future-explicit (including scenarios or
projections) or present-based (measurements). Hufschmidt (2011) formulated similar
differences between studies concerning temporal scales including adaptations or
changes. Another distinctive feature was the involvement of local knowledge or
stakeholders. For example, De Chazal et al. (2008) extended the vulnerability concept
by introducing the term acceptability to measure the different valuations of stakeholders
concerning undesirable changes of ecosystem services. As vulnerability is a rather

Vulnerability
22
complex and anthropocentric concept, an expert based approach was valuable to take
local requirements into account (Leidel et al., 2009). In spite of these different groups of
vulnerability studies, the conceptualization of adaptive capacity and related assessments
are rather diffuse. This inconsistency may be due to the fact that adaptive capacity is
rooted in resilience and vulnerability literature (Engle, 2011). Brooks et al. (2005)
argued that the relationship between adaptive capacity and vulnerability depends on
time scales. They differentiated between coping capacity for short term and adaptation
strategies for long-term reactions. Analogously, Turner et al. (2003b) differentiated the
capacity to cope from adaptive capacity (or adaptation strategies), whereby both were
considered components of resilience. However, when different case studies are
compared (cf. Chapter 3.2), such a temporal specification is often not elucidated, and is
therefore only implicit.
It needs to be acknowledged that the body of literature on vulnerability is growing
rapidly, reflecting strong development in this area including a multitude of scientific
disciplines. At this stage, however, the literature is to some extent inconsistent. Studies
often refer to the abovementioned IPCC (2007) definition, but in more simple terms
meaning that vulnerability is defined as a function of exposure, sensitivity, and adaptive
capacity. Yet, the individual definitions as well as the weighting of the components of
vulnerability remain somehow arbitrary. In search of suitable assessment methods
focusing on social-ecological systems, in the following section, several case studies are
compared focusing on indicators. Hereby, the approach to adaptive capacity is
particularly emphasized.
3.2 Indicating Vulnerability Components
The number of European studies that address climate change impacts and adaptation in
cities is growing. However, these studies differ substantially with regard to their
theoretical or conceptual frameworks, making it difficult to compare approaches and
results (Hunt and Watkiss, 2011). Yet, in theory the indicators constructed should allow
for comparisons between assessments (Polsky et al., 2007). To structure and compare
the indicators used in different studies, the vulnerability scoping diagram by Polsky et
al. (2007) was adopted in Figure 2. The scoping study on indicators in vulnerability
assessments in urban regions (Schauser et al., 2010) gives an overview on climate
change related vulnerability indicators including components of exposure, sensitivity,

Vulnerability
23
and adaptive capacity. The illustration in Figure 2 refers to studies conducted in
European urban regions with exposure (or hazard) units related to regional climate
change models, floods, and heat waves (Birkmann et al., 2010; Brooks et al., 2005;
Fekete, 2009; Kienberger et al., 2009; Kropp et al., 2009; Kubal et al., 2009; Lindley et
al., 2006; Schröter et al., 2004; Tapsell et al., 2002). The review is not comprehensive,
but gives an exemplary overview of vulnerability indicators and therewith provides a
basis to reflect the indicators in the light of the social-ecological system approach.
In spite of differences in theoretical foundations, the indicators chosen exhibit parallels
in most studies. A number of general conclusions can therefore be drawn after
comparing assessment indicators as illustrated in Figure 2. A quite similar set of
sensitivity indicators was applied in most of the studies. The most commonly used
indicators are proportion of elderly people and building type followed by population
density and land use (e.g. % of forest). This conformity illustrated that the sensitivity
assessment is relatively well developed. Nevertheless, additional indicators differed
ranging for example from social hotspots to suitable habitats to land prices.
Figure 2: Visualization of indicators for sensitivity and adaptive capacity (exposure solely included as type). Social system indicators are depicted in red and ecological system indicators are depicted in green. Indicators with ambiguous relations are depicted in orange. The bigger the size of the letters, the more frequent the indicators have been used.
impervious surface
population density
elderly children
population health
land use (crops, pasture, forests)
building type / urban morphology
household typesingle parents
land prices
social hot spots
contaminated sites
soil erodibility
infrastructure (roads, power plants)
sensitive land covers / biotopes
employment
species richness suitable habitats
calorific intakepolitical rights
government effectiveness
life expectancy
gross domestic product
female activity rate
age structure
early warning system ecosystem integrity
origin of population
education level
employment / workplaces
population density / living space per
person
ownership (car, home)
income
expectation
durationof stay
regional climate models
flood
heat wave
infrastructure distance to health facilities, roads
long-term sick

Vulnerability
24
In the case of adaptive capacity, a diffuse picture was revealed (Figure 2). Adaptive
capacity was used in rather different contexts, for example with respect to warning
systems and health related issues as well as the capacity to respond to changes (e.g.
economically). These indicators are strongly dependent on the objective of the study
and on the consequent temporal scale. As such, even if studies applied a similar
conceptual definition of adaptive capacity and a similar exposure unit, indicators
differed substantially, inhibiting the comparability of results. However, despite
featuring different focal points, a number of indicators were used more frequently. The
most common indicator for adaptive capacity was education level. In addition,
employment and infrastructure (e.g. distance to roads) were used more frequently
followed by population density, income, and ownership (Figure 2). Books et al. (2005)
validated 46 adaptive capacity indicators by means of statistical analysis (correlation to
mortality) and expert evaluation (weighting of importance). They found that in a
shortlist of proxy indicators, the key indicators are unlikely to be independent.
Moreover, they recognized that the context was highly significant. For example, while
isolation and income were decisive factors in Africa, in Norway the infrastructure and
efficiency in spatial planning played an important role. However, governance, health,
and education were generally of importance (Brooks et al., 2005).
Although almost all studies inherently adopt the social-ecological system approach,
vulnerability studies differ with respect to the incorporation of multiple dimensions
(social, environmental, economic, and political) (Hufschmidt, 2011). The different
elements of the social-ecological system were unequally covered by the indicators (cf.
colors in Figure 2). Concerning sensitivity, more recent studies integrated both, social
and ecological system indicators. In this context, land use and sensitive land cover units
as well as species suitability represented ecological systems (cf. Figure 2). Concerning
adaptive capacity, however, social system indicators were clearly overrepresented.
The current study led to the assumption that the indicators used for adaptive capacity
and sensitivity overlap, since common indicators were found for both dimensions of
vulnerability. The specific variables used to indicate the vulnerability elements often do
not measure vulnerability directly. Thus there is room for interpretation concerning the
key variable and the overall vulnerability (Adger, 2006). In this connection, it should be
noted that it is often solely referred to sensitivity and adaptive capacity as the objects of
indication (indicandum). Yet, both of these elements are rather complex, thus subsets

Vulnerability
25
are established, which are often not specified. To exemplify, considering adaptive
capacity, it is assumed that a good economic status increases the ability to react in case
of an impact, which is in turn indicated via the income. Likewise, for sensitivity, a low
mobility and health status are assumed to have an effect, which is indicated by the
proportion of elderly people. At the same time, it is assumed that the elderly people
have less access to information, which is a component of adaptive capacity. Thus a
better comprehension of the indicandum is required, which could be achieved using the
steps of systems analysis (Müller et al., 2016). The signalized overlap between the
indicators could be related to conceptualization and/or data availability. Nonetheless, as
a consequence, sensitivity and adaptive capacity are likely to be correlated, meaning
that indicators such as age are overrepresented in the overall vulnerability. Although
this was not necessarily the case in single studies, it is a critical point when comparing
and communicating results. Also Polsky et al. (2007) stated that the dimensions of
vulnerability often are intimately related and the choice on the positioning of the
indicators is somehow ambiguous.
Adaptive capacity is considered to be a key element of vulnerability, alongside
sensitivity and exposure (IPCC, 2007). Moreover, adaptive capacity is often described
as a decisive aspect of the social part of the system that can positively influence the
vulnerability of the overall social-ecological system. In this context, knowledge as the
basis for taking decisions and actions in adapting to climate change is a crucial
prerequisite for all adaptation efforts. However, even more diverse conceptualizations
of adaptive capacity and knowledge exist in addition to a number of vulnerability
frameworks (Hinkel, 2011). There is no clarity concerning interrelations between
indicators of adaptive capacity and vulnerability or between adaptive capacity and
knowledge. Given this lack of clarity in conceptualization, the practicability and
applicability of mapping adaptive capacity requires scrutiny. This is of special
importance considering that resulting maps are often taken for granted and background
indicators are not sufficiently reflected. However, mapping is, as it is understood
intuitively, an important communication tool. Mapping vulnerability is an important
first step for awareness rising, but due to the inherent uncertainty, the limitations must
be communicated clearly. Mapping only the exposure of regions to climate change
might include less assumptions concerning statistical analysis, but could also lead to
wrong conclusions. To exemplify, regions with high exposure but low sensitivity and

Vulnerability
26
high adaptive capacity could be oversupplied considering the distribution of money for
adaptation measures. Socio-ecological systems are complex and difficult to capture,
hence there can be a dislocation between the climate impact and the social response.
Vulnerability mapping is still under development and as such, several methodological
challenges are still to be solved. Common shortcomings in vulnerability studies are the
spatial resolution, where more local studies are required, and the dynamics between the
social and the ecological system need to be considered (Hinkel and Klein, 2009).
However, some indicators are only available at the national level (e.g. GDP) or can
hardly be represented by spatially explicit units (e.g. governance structures related to
adaptive capacity) (Leidel et al., 2009).
3.3 Key Findings
With the growing evidence on climate change, the field of vulnerability research in
recent years has been taken up by many disciplines and thus developed rapidly. In this
regard, the vulnerability framework evolved from individual approaches in different
disciplines towards expanded vulnerability frameworks, which refer to various
approaches. Overlaps between the vulnerability approaches became clear when
comparing the indicators used. In this regard, the data set used not only depends on the
conceptual framework, but in turn can be used to inform conceptual development in
vulnerability assessment (Polsky et al., 2007). Knowledge is an important factor in
vulnerability assessment, since it is represented 1) as indicators (e.g. education, access
to information), 2) as the consideration of local knowledge by means of
transdisciplinary approaches and 3) as the scientific knowledge related to different
disciplines. At the same time, the factors knowledge and adaptive capacity as well as
adaptive capacity and sensitivity are inherently linked. This leads to the question, how
the dimensions of adaptive capacity of a social-ecological system can be captured
adequately. Hence, different knowledge forms in various scientific disciplines need to
be integrated interdisciplinarily in order to achieve a holistic view on social-ecological
vulnerability and associated potential adaptation strategies in urban regions.
In summary, on the one hand, there is a confusion concerning the theoretical
frameworks, as there is up to now no generally agreed definition on vulnerability or its
components. On the other hand, the merging of different fields bears the opportunity to
further develop the framework in an interdisciplinary manner referring to different

Vulnerability
27
conceptual approaches and methods. For this thesis, such an initially open approach was
of particular importance for the iterative process of developing a social-ecological
vulnerability framework based on vulnerability theory (presented here), approaches in
ecosystem service research (Chapter 4), and the interdisciplinary process (Chapter 5).
From reviewing vulnerability approaches, key implications for the thesis are the
importance of clear and transparent reporting of the methods used and related
shortcomings, the need for spatially explicit local vulnerability assessments taking both
the social and the ecological system into account, and the consideration of different
forms of knowledge.

The Ecosystem Service Concept
28
4 THE ECOSYSTEM SERVICE CONCEPT
The ecosystem service concept was already developed in the early 1980s (Ehrlich and
Ehrlich, 1981). Yet, the rise of the concept started later after the publications of Daily
(Daily, 1997), Costanza (1997), and the Millennium Ecosystem Assessment (MEA,
2005). Since then, research on the ecosystem service concept became very productive
with a continuous increase in the number of publications (Martínez-Harms and
Balvanera, 2012). Until now, there is a lively scientific debate on the terminology,
frameworks, and classification systems (de Groot et al., 2010; Hermann et al., 2011),
which resulted in various concepts, frameworks, and assessment approaches. These also
related to different terms such as environmental services, landscape services, and
ecological services (Lamarque et al., 2011). The following sections first give a short
overview on the theoretical basis of the ecosystem service concept. Second, the
application of the ecosystem service concept in the urban context is reflected, and third,
the practical application considering climate change adaptation is discussed.
4.1 Terminology and Frameworks
The ecosystem service concept represents an application-oriented framework to analyze
social-ecological systems. It is inherently interdisciplinary, as it is comprised of
elements that refer to natural as well as social sciences. In simple terms ecosystem
services are “the benefits people obtain from ecosystems” (MEA, 2005, p. V). In this
context, nature is described as being “essential for sustaining and improving human
well-being” (Daily et al., 2009, p. 27). This thesis refers to the ecosystem service
definition of Burkhard et al. (2012a, p. 2): “Ecosystem services are the contributions of
ecosystem structure and function – in combination with other inputs – to human well-
being”. This ecosystem service definition acknowledges the practical difficulties in the
separation of human inputs and nature based contributions to ecosystem services.
Human wellbeing is a multifaceted concept that can be approached differently. In this
thesis, the classification of Summers et al. (2012) was used distinguishing 1) basic
human needs, 2) economic wellbeing, 3) environmental needs, and 4) subjective
wellbeing or happiness.
The ecosystem service cascade (Haines-Young and Potschin, 2010) provides a
framework for the description of the link between ecosystems and human-wellbeing. In

The Ecosystem Service Concept
29
the cascade, as depicted in Figure 3a, landscape structures and processes exhibit
functions that are regarded as services when used by people. Depending on the context
(e.g. places and society), different benefits and values are assigned to the services
(Haines-Young and Potschin, 2010). The first two elements of the cascade refer to
ecosystems and biodiversity (Figure 3, green), the benefits and associated values refer
to human well-being (Figure 3, red), and the ecosystem services represent the linking
element (Figure 3, blue). The cascade could also be seen as “stairways” (Spangenberg et
al., 2014) beginning at the value end.
Figure 3: Description of the ecosystem service concept illustrating a) the ecosystem service cascade adopted fromHaines-Young and Potschin (2010), b) the supply-demand approach adopted from Burkhard et al. (2012b), andc) the Driver-Pressure-State-Impact-Response (DPSIR) context adopted from Müller and Burkhard (2012)
human well-being ecosystems and biodiversity
structures and
processes ecosystem functions ecosystem
services benefitsvalues
land cover / land use
ecological integrity ecosystem structures
and processes
supply
ecosystem services
regulating provisioning
cultural services
demand
population, economy
human benefitssocial, economic & personal well-being
a)
b)
biophysical structure or processecosystem properties
ecosystem functions
ecological integrity
ecosystem services
regulating provisioning
cultural services
human benefits
social economic personal
well-being
value
relative importance
STATE
PRESSURE DRIVER RESPONSE
IMPACT IIA d a p t i v e m a n a g e m e n t c y c l e
c)
IMPACT I

The Ecosystem Service Concept
30
The cascade is used in different contexts as a starting point followed by detailed
definitions of the elements and their operationalization for the assessment. In this
context, it is difficult to separate ecosystem functions (as in Figure 3 a) from ecosystem
structures and processes as well as from ecosystem services. Focusing on the central
element, Burkhard et al. (2012b) circumvented the problem with a framework that
differentiates between ecosystem service supply and demand (Figure 3b). Therein, the
supply is defined as “the capacity of a particular area to provide a specific bundle of
ecosystem goods and services within a given time period” (Burkhard et al., 2012b, p.
18). The demand refers to the sum of ecosystem services that are “currently consumed
or used in a particular area over a given time period” (Burkhard et al., 2012b, p. 18).
This approach allows to consider landscape change in a market situation of demand and
supply. By this means, resource allocation, such as a demand from outside a planning
region can be incorporated (Termorshuizen and Opdam, 2009).
In addition, it has been shown that the ecosystem service concept can be applied in an
adaptive management cycle (Figure 3c). Herein, Müller and Burkhard (2012) referred to
the DPSIR framework (cf. Chapter 6). The basic idea is that the social system produces
pressures (through e.g. development and consumption), which could affect the state of
the system i.e. the ecosystem structures and processes as well as ecosystem functions.
Changes in the state of the system could result in impacts related to the provision of
ecosystem services and consequently human well-being. Finally, the response refers to
actions taken to minimize the negative impacts (Müller and Burkhard, 2012). This
application shows the typical position of ecosystem services in indicator frameworks,
which can be approached from different viewpoints concerning for example the
evaluation of responses or the characterization of impacts. Research challenges relate to
the complexity within the components and the linkages between the components
(Müller and Burkhard, 2012).
In that context, the definition of ecosystem services, their classification, and the
development of indicators depends on the characteristics of the system under
consideration, which in this thesis are urban regions. Furthermore, it depends on the
potential application in practice, where the focus is set on climate change adaptation,
here. These aspects are elaborated in the following sections.

The Ecosystem Service Concept
31
4.2 The Ecosystem Service Concept in the Urban Context
In the last years, more and more ecosystem service studies were performed in urban
environments (Haase et al., 2014). Yet, urban land use exhibits unique characteristics,
which are according to Haase (2014): a) A high share of artificial surfaces, which are
unlikely to revert back to pre-urban conditions; b) A high degree of and variability in
imperviousness; c) A high multifunctionality that varies across vertical and horizontal
dimensions. As such, the application of the ecosystem service concept in urban
environments needs to be reflected carefully (Beichler et al., 2017)1. On the one hand,
there is a general acceptance that the ecosystem definition is very flexible and diverse
conceptualizations exist (Currie, 2011; Pickett and Cadenasso, 2002), thus it could be
applied in the urban context. On the other hand, it can be argued that the ecosystem
service concept could promote an exploitative human-nature relationship (Schröter et
al., 2014). Thus, regarding all kinds of urban structures as ecosystems could dissent
from the normative principles (as described in the introduction of Chapter 4) of the
ecosystem service concept. Against this background, Beichler et al. (2017) provide an
overview on approaches and discuss the handling of urban structures as subjects
capable of providing ecosystem services or not.
The paper discusses different ecosystem definitions in the context of urban ecosystem
services from the initial definition proposed by Transley (1935) to the conception of
novel ecosystems (Hobbs et al., 2006; Kowarik, 2011). It is summarized that in general
a city could be defined as either one ecosystem or an assembly of ecosystems (after
Bolund and Hunhammar, 1999). The individual entities of a city could be referred to as
remains of natural landscape, cultural landscapes, horticultural designed green spaces or
specific urban nature (four types of nature in cities after Kowarik, 1992) and some are
no ecosystems at all. A city as a whole might be best described as “Total Human
Ecosystem” (Naveh, 2000) or by focusing on ecological processes instead of entities
(Currie, 2011).
In practice, altered ecosystems could be characterized by management or land use types
(de Groot et al., 2010). Thus, the different land use types in urban regions namely the
1 cf. „
Vorabveröffentlichungen der Dissertation“ page 1

The Ecosystem Service Concept
32
classes housing, industry, transport, urban blue and green as well as urban agriculture
were reflected considering types of ecosystems with regard to remaining natural
components, degree of human modification, and human input (Beichler et al., 2017). In
general, urban land use classes represent a pattern (not a single patch) and due to the
vertical dimension, one patch could include built up structures and ecological structures
at the same time. As such, the problem of scale needs to be considered not only in the
theoretical definition of an ecosystem, but also in the practical application considering
ecosystem service indicators (Beichler et al., 2017).
In urban environments, the fact that humans are an interactive part of the system
becomes apparent looking at the different levels of ecosystem transformation, the
different forms of management, and levels of input influencing abiotic and biotic
components and therewith ecosystem service provision (Kowarik, 2011; Mooney et al.,
2009). The structures that need to be dealt with in the urban context referring to
different ecosystem definitions could be classified (Beichler et al., 2017) into: 1) Near
natural ecosystems (e.g. lakes, forests); 2) Managed ecosystems – still based on original
ecosystem components continuously influenced and managed (e.g. parks, gardens); 3)
Overbuilt (eco)systems – built up areas, where some original ecosystem components
and processes are retained (e.g. parking places with grass pavers); 4) Constructed
(eco)systems – man-made ecosystem structures that form artificial habitats (e.g. green
roofs). Although, these classes are not mutually exclusive, they allow for a structured
discussion of the consistency with the different frameworks of the Millennium
Ecosystem Assessment (MEA, 2005), the EPPS framework (Ecosystem Properties
Potentials Service) (Bastian et al., 2013, 2012b), the ecosystem service cascade (Haines-
Young and Potschin, 2010), and the proposed frameworks of Burkhard et al. (2012a,
2012b) and Müller et al. (2010b). The discussion revealed that in principle all
frameworks could be applied in the urban environment, as they do not refer to a specific
ecosystem definition, but take biophysical structures and processes (see also Figure 3)
as a starting point.
From the conceptual point of view, any system could be the object of an ecosystem
service study as the degree of human modification and input should be considered
during assessment, which would allow to distinguish between ecosystem services and
man-made services (Beichler et al., 2017). However, taking human effects on
ecosystems, their services, and related values into account, as well as separating human

The Ecosystem Service Concept
33
input and the service provided by the ecosystem itself, becomes in practice a yet to be
solved, complex scientific challenge (Burkhard et al., 2014; Daily et al., 2009; de Groot
et al., 2010).
The consideration of human benefits and values is one of the main principles of the
ecosystem service concept designed to analyze social-ecological systems (Spangenberg
et al., 2014). In that context, as pointed out in the introduction (Chapter 2), urban
regions represent interesting laboratories to study the complex interactions in social-
ecological systems. Reflecting the relative importance of different urban structures by
using the ecosystem service concept could be particularly insightful due to the close
spatial proximity of supply and demand, the scarcity of ecosystems, and the high
population density (Beichler et al., 2017). The application of the ecosystem service
concept in urban environments could give ecological aspects a higher status in decision-
making, which reflects a basic objective of the ecosystem service concept explicitly
addressing the intrinsic value of nature (Schröter et al., 2014).
In recent years, there has been a conceptual shift towards the process-oriented approach
in defining ecosystems (Currie, 2011). In this context, it is of high importance to
consider the issue of long-term ecosystem integrity (Currie, 2011; Müller et al., 2010b),
characterizing the ecosystem state, in order to assure the consistency with the
normative principles of the ecosystem service concept (Beichler et al., 2017).
Ecosystem integrity refers to the self-organizing capacity of the system, which can be
described by means of several structural and functional variables (Burkhard et al.,
2012b; Kandziora et al., 2013; Müller and Burkhard, 2012; Müller et al., 2010a).
These theoretical considerations, however, are countered by the considerable challenges
researchers are facing during the practical ecosystem service assessment. Various
assessment approaches have been developed, on the one hand focusing on urban green
areas or green infrastructure (Bezák and Lyytimäki, 2011), such as urban parks (e.g.
Breuste et al., 2013b) or green roofs (e.g. Oberndorfer et al., 2007). On the other hand,
there are land use and land cover based assessments covering the overall urban region
(for example Burkhard et al., 2010a; Larondelle et al., 2014). Moreover, participatory
approaches (for example Kabisch and Haase, 2014; Voigt et al., 2014) were applied
with increasing frequency in the recent years. This diversity of approaches indicates
various ways of dealing with urban structures, which however had rarely been made
transparent in case studies (Beichler et al., 2017). This need for a more detailed and

The Ecosystem Service Concept
34
transparent reporting has been noticed by other authors as well (Martínez-Harms and
Balvanera, 2012; Seppelt et al., 2012). Based on the data used and the indicators and
methods developed, the implicit theoretical considerations or practical requirements
were discussed. It was found that challenges were related to the quality of data (e.g.
related to land use/land cover classification (Breuste et al., 2013a)), to statistical
methods (e.g. aggregation (Scholes et al., 2013)), and to the integration of different
datasets (subsystems social, ecological (Müller et al., 2010b; Scholes et al., 2013), and
the built up environment (Moffatt and Kohler, 2008)) as well as to the dealing with
participatory data (for detailed description see Beichler et al., 2017). Against this
background, it became apparent that it is on the one hand technically challenging to
distinguish between different types of urban structures. On the other hand,
comprehensive approaches are needed to identify the underlying mechanisms that
characterize the complex dynamic interactions between social and ecological structures
and processes (Alberti, 2005; Mörtberg et al., 2012; Reyers et al., 2013).
In summary, urban environments represent an extreme case that calls special
attention to the consideration of human input, modification, ecosystem state, and social-
ecological interactions. These aspects are mostly covered in the theoretical frameworks,
but assessment methods need to be further developed in order to take them
systematically into account. Almost all ecosystems on earth have been heavily altered
and are impacted through human activities, which resulted in substantial loss of
ecosystems and their services (MEA, 2005; Mooney et al., 2009). Thus, the identified
challenges hold true for the application of the ecosystem service concept in general.
Nevertheless, ecosystem service assessments provide valuable information to assist in
urban planning through the identification of intangible values of ecosystems (Daily et
al., 2009). It has been shown that urban areas can provide various different ecosystem
services at multiple scales (Bezák and Lyytimäki, 2011; Bolund and Hunhammar, 1999;
Haase et al., 2014). Although urban areas cannot substitute for the functioning of
natural ecosystems (Kowarik, 2011), urban ecosystem services are of high relevance
considering the wellbeing of the population as well as the ecological connectivity in the
overall urban region. Hereby, ecosystem service maps can support planning processes
through the identification and framing of problems (Hauck et al., 2013). The application
of the concept in the context of climate change represents a special case, for which the
associated practical implications for this thesis are described in the following chapter.

The Ecosystem Service Concept
35
4.3 Application in the Context of Climate Change
Considering climate change, the ecosystem service concept could assist the
development of ecosystem based adaptation and management approaches (Chapter 2
Introduction). Ecosystem service modeling enables the visualization of the functioning
of the landscape and potential future development. The ecosystem service concept could
be implemented in the planning sector, since herein norms and rules for the decision
making process related to the use of natural resources are established (Cowling et al.,
2008). Yet, a lot of ecosystem services receive no consideration in planning and
decision making, inhibiting the development of multifunctional landscapes (de Groot et
al., 2010). Often, the significance of an ecosystem service is only recognized after it has
been lost (Daily et al., 2009). In the context of climate change, several land use forms
and their associated services could play a special role. For example, natural areas that
retain water, especially close to settlements, could be of particular importance
considering the predicted increase in extreme precipitation events.
As pointed in the previous chapters, urban regions represent interesting laboratories to
study interactions in social-ecological systems. However, vulnerability studies tend to
focus on the social system (cf. Chapter 3.3), thus the population’s vulnerability.
Whereas, ecosystem service studies tend to focus on the supply side of the ecosystem
services cascade (Reyers et al., 2013). In the context of climate change, on the one
hand, the ecosystem service supply is likely to change through impacts on the
ecological system. On the other hand, due to impacts on the population (e.g. caused by
heavy rain), the demand could change (detailed description in Chapter 6). However, the
application of the ecosystem service concept to evaluate impacts (Chapter 4.1, Figure
3c) is difficult, as the linkages between the components are not completely understood
yet. A major challenge in ecosystem service research is to establish the link between
different groups of the population and ecosystem services (Daily et al., 2009; Granek et
al., 2010). This direct link between the social and the ecological system is of particular
importance to combine the vulnerability and the ecosystem service concept.
Understanding the interactions between the social and ecological system under climate
change is essential to develop enhanced adaptation measures. Against this background,
it becomes clear that method development is needed to approach these issues. In this
regard, the different groups of ecosystem services and supply-demand interactions are
described in detail in the following sections.

The Ecosystem Service Concept
36
4.3.1 Implications regarding Ecosystem Service Categories
Over the years, several different ecosystem service classification systems have been
proposed (e.g. de Groot et al., 2002; MEA, 2005). In an attempt to integrate the
different perspectives, the common international classification of ecosystem services
(CICES) has been proposed and is as still subject to continuous development (Haines-
Young and Potschin, 2013). In general, the three main groups provisioning, regulating,
and cultural ecosystem services can be distinguished (Crossman et al., 2013; Hermann
et al., 2011; Martínez-Harms and Balvanera, 2012). Supporting services, which
maintain the generation of all ecosystem services (MEA, 2005), are often additionally
mentioned. This group, however, largely overlaps with the assessment of basic
ecosystem functions and the integrity approach (cf. Chapter 4.1 and 4.2).
Provisioning ecosystem services relate to products derived from ecosystems, such as
wood, fiber and agricultural goods (MEA, 2005). Thus, the generated benefit can be
perceived directly through the value of the products. However, for studies at the local
scale it has to be acknowledged that urban regions depend on worldwide
teleconnections (Seto et al., 2012). Hence, under climate change, the supply of
provisioning services could be impacted, but changes do not essentially relate to the
local demand (e.g. considering food supply).
Regulating ecosystem services refer to benefits obtained through the regulation of
ecosystem processes such as air quality, climate, and water regulation (MEA, 2005).
Regulating ecosystem services play a special role in the context of climate change.
Measures to increase regulating services could decrease the vulnerability. Yet, since
regulating services are perceived indirectly, the link to different groups of the
population is difficult to establish. In addition, regulating services are less suitable for
participatory assessments (Brown et al., 2012). However, in the last years, the group of
regulating service was studied more frequently than the others, particularly in urban
environments (Haase et al., 2014; Martínez-Harms and Balvanera, 2012). Thus, there is
a sound knowledge base, which enables to draw on a broad range of literature using
indicators to assess regulating services.
Cultural ecosystem services (CES) refer to benefits derived from the relationship
between humans and ecosystems, such as recreation, education, and aesthetics. The
group of CES has been studies less frequently then other ecosystem services (Haase et
al., 2014; Martínez-Harms and Balvanera, 2012). Although in the last years the topic

The Ecosystem Service Concept
37
gained more attention, most studies focused on recreation. Thus studies including
services like cultural identity and spiritual values are largely absent (Chan et al., 2012).
The insufficient consideration of CES in assessment relates to difficulties in evaluation
and their intangible and subjective nature (Chan et al., 2012; Daniel et al., 2012). Yet,
this very dependence on social constructs enables to identify social-ecological linkages
and to bridge the gaps between disciplines (Milcu et al., 2013). As the benefits derived
from CES are directly perceived, they are particularly suitable for stakeholder
involvement and provide the opportunity to study the link to different groups of the
population. For both, ecosystem service assessment and vulnerability assessments (cf.
Chapter 3.1), it has been reported that, to take local characteristics into account,
stakeholder participation is crucial (Hernández-Morcillo et al., 2013; Hunt and Watkiss,
2011; Hutton et al., 2011). Thus, focusing on CES has a high potential finding
integrated assessment approaches. As such, in the quantitative assessment of this thesis,
a participatory assessment approach focusing on CES was undertaken in order to bring
local experiences from stakeholders into a spatial context (Brown et al., 2012;
Fagerholm et al., 2012) and to evaluate the relative importance of ecosystem services
and the relationship to human wellbeing (Maynard et al., 2011).
4.3.2 Supply-Demand-Interactions
It has been shown that the provision of ecosystem services differs along the urban-rural
gradient (Kroll et al., 2012; Larondelle and Haase, 2013). This underlines the fact that
ecosystem services are supplied locally, but could generate benefits at other scales (de
Groot et al., 2010). This is of special importance when studying the linkages of social-
ecological systems in urban regions considering interactions between the city and the
hinterland. In recent years, the number of case studies considering also the ecosystem
service demand is increasing, whereby different conceptualizations of demand can be
distinguished namely risk reduction, preferences, consumption, and direct use (Wolff et
al., 2015). The assessment of ecosystem service providing areas and benefitting areas
enables the evaluation of matches and mismatches between supply and demand
(Burkhard et al., 2012b; Schulp et al., 2014). Combining the spatial pattern of supply
and demand could help identifying priority areas for investments (Stürck et al., 2014).
However, further research is required to understand the feedbacks between supply and
demand considering e.g. spatial dynamics (Wolff et al., 2015). In the context of climate
change adaptation in urban and regional planning, the spatial relations between the city

The Ecosystem Service Concept
38
and the hinterland are of special interest. Uncovering these relations, could help to
locate areas were adaptation measures have the highest effect. Moreover, studying the
interrelations between supply and demand areas could assist in identifying the impact
on the population related to the loss or decrease of distant ecosystem services.
4.4 Key Findings
The ecosystem service cascade and the supply-demand approach are versatile starting
points for the operationalization of the ecosystem service concept for practical
assessments. The ecosystem service concept aims at the internalization of the benefits
derived from ecosystems into decision making processes. A detailed elaboration of the
application of the ecosystem service concept in urban environments was undertaken
(summarized based on Beichler et al. (2017)) showing that the concept does not reach
its limits in urban environments. It rather points at practical challenges related to the
ecosystem service concept in general. These challenges range from the problem of scale
considering different land use types in urban regions, to the systematical consideration
of humans as interactive parts of the system, to the need for a more transparent
reporting of assessment methods.
Main research needs relate to the linkages between the components in the ecosystem
service concept particularly the interactions in the social-ecological system. Two
dimensions have been found to be of particular importance in the context of climate
change: 1) The categorical link referring to the supply of ecosystem and the demand of
different groups of the population considering social factors. 2) The spatial link
between the ecosystem service supply areas and the location of the beneficiaries. These
two dimensions were further explored in the practical part of this thesis. Thereby, the
focus was set on CES, as they have been identified to be most suitable to study the link
between supply and demand. Additionally, the required assessment methods show
parallels to vulnerability assessment. Nonetheless, due to their importance in the context
of climate change, the results are discussed reflecting upon regulating services as well.
Furthermore, a focus was laid on differences between the city and the hinterland, as
these bear important implications to inform urban and regional planning with regard to
adaptation (see also scales in the interdisciplinary context described in Chapter 5.2.3).
The ecosystem service concept has already been applied in a DPSIR context (Chapter
4.1). Yet, to combine the ecosystem service concept and the vulnerability concept,

The Ecosystem Service Concept
39
while equally considering the social and the ecological system, a comprehensive
methodological approach is required. This includes a combination of the theoretical
frameworks (Chapter 6) as well as the development of assessment methods (Chapter 7.3
and 7.4).

The Interdisciplinary Research Perspective
40
5 THE INTERDISCIPLINARY RESEARCH PERSPECTIVE
In order to manage the interdisciplinary challenge of climate change, approaches that
integrate the different scientific disciplines and conduct transdisciplinary research are
needed (Deppisch and Hasibovic, 2013). The thesis project was embedded in the wider
research context of the project plan B:altic. The overall objective of plan B:altic was the
development of climate change adaptation strategies in the context of urban and
regional development in urban regions at the Baltic Sea coast taking a social-ecological
approach. Although this thesis is a discrete project with independent research questions,
the individual components of vulnerability are inherently linked to the topics of the
other subprojects of plan B:altic, particularly climate change modeling, knowledge
exchange, governance, and planning instruments. Hence, for vulnerability research in
the context of climate change, the development of an interdisciplinary understanding of
the different research domains, contexts, and applications is crucial (Bhaskar et al.,
2010). As such, the process of interdisciplinary integration within the project played an
essential role in building a strong research basis facilitating a comprehensive and
interdisciplinary view on the topic of vulnerability. Two parallel processes can be
distinguished, the development of the bridging concept for the project plan B:altic and
the manifestation of aspects of the bridging concept within the individual subprojects
(Beichler et al., 2014). In this regard, the conception of the thesis had a major influence
on the process itself and at the same time benefitted from it.
5.1 Social-ecological Resilience – The Interdisciplinary Process
Interdisciplinarity is a “lively process” (Buller, 2008) that can take many forms
depending on the scope, the type of interaction (empirical, methodological, theoretical),
and the goal (Huutoniemi et al., 2010). In the project plan B:altic, the concept of
resilience was used to integrate approaches and perspectives of several disciplines, such
as earth system science, spatial planning, landscape ecology, geography, and
communication sciences. The interdisciplinary process (summarized based on Beichler
et al. (2014) in Figure 4) started with the examination of different resilience concepts
(Adger, 2006; Adger et al., 2005; Carpenter et al., 2001; Folke, 2006; Füssel, 2007;
Gallopín, 2006; Gunderson and Holling, 2002; Smit and Wandel, 2006; Walker et al.,
2006, 2004). It was found that the concept of social-ecological resilience (Folke, 2006)
represents a valuable basis to integrate the different disciplinary perspectives,

The Interdisciplinary Research Perspective
41
Figure 4: The interdisciplinary process adopted and summarized based on Beichler et al. (2014)
working definition: “Social-ecological resilience is the capacity of an urban region to absorb uncertain climatic stimuli and their effects so as to maintain the essential social and ecological functional and structural properties, while undergoing change.”basic elements:(1) resilience as a capacity (Walker et al. 2004)(2) contextualized notion (resilience of what to what) (Carpenter et al. 2001) (3) change and complexity intrinsic to social-ecological systems (Folke
2006; Adger 2005).
identification and acknowledgement of the variety of meanings and of possible structures from conceptual precision to vagueness
(Strunz 2012)
• defining structural and functional properties of the social-ecological system
• degree of self-organization • temporal and spatial scales• interpretative/symbolic dimensions• degree of normativity
• tension between change and persistence, transformative change
• notions of adaptive capacity• political/power dimension• knowledge • uncertainties
examination of various resilience concepts
social-ecological resilienceas basis to integrate disciplinary perspectives
• emphasizing the social-ecological context • social-ecological resilience thinking as an endpoint: basis or normative
setting for discussing adaptation measures
social-ecological resilience thinking(Folke et al. 2010)
contested issues

The Interdisciplinary Research Perspective
42
due to its systemic character, the strong interdisciplinary character (bridging natural and
social sciences), and the potential to deal with uncertainty and nescience (Beichler et al.,
2014).
In order to find a joint definition of social-ecological resilience (cf. Figure 4), the
individual elements of the social-ecological resilience definition, such as capacity or
essential social and ecological properties, were discussed in detail. This enabled the
exploration of assumptions and perspectives of all disciplines involved. The
interdisciplinary dialog revealed that the general principles of existing social-ecological
resilience concepts are adoptable by all disciplines involved, but the precise meaning of
several elements differed considerably among disciplines (cf. contested issues in Figure
4). Although for some factors a remarkably degree of convergence was achieved, some
issues (e.g. “what should be maintained”) concerned the conceptual core of the
disciplines involved and thus needed to be addressed differently. As a result, the
objective to find a joint definition of social-ecological resilience, that is adoptable by all
disciplines involved, proved to be unachievable. To acknowledge the variety of
meanings, the focus was shifted to the conceptual vagueness (Strunz, 2012) using the
concept of social-ecological resilience thinking (Folke et al., 2010). Nevertheless, the
conceptual precision of a social-ecological resilience definition facilitated the extensive
exchange of disciplines by means of cognitive and social functions (Beichler et al.,
2014). This resulted in an enhanced interdisciplinary understanding of the social-
ecological resilience elements. The contested issues are elaborated in the next chapter
focusing on implications for this thesis.
5.2 Interdisciplinary Implications
The main aspects of the resilience concept used in the other subprojects (summarized in
Table 3, see Beichler et al. 2014 for a detailed description) give an overview of the
different disciplinary backgrounds and notions of resilience. What all projects had in
common, was the focus on climate change adaptation in the context of urban and
regional planning, whereby urban regions are understood as social-ecological systems.
The contested issues (as displayed in Figure 4) in principle could be described as key
issues that overlap between the disciplines involved with differing implications
considering concept, method, and application. As the vulnerability and the resilience
concept are closely related, discussing these overlaps in the interdisciplinary context

The Interdisciplinary Research Perspective
43
proved a valuable asset in the framing
of the key objects, namely the elements
of vulnerability, the urban region, and
the social-ecological system.
5.2.1 Climate Change Impact
One element of the vulnerability
assessment (cf. Chapter 3) the exposure
as part of this thesis overlapped with
the study on climate change modeling
as both deal with climate change impact
assessment. In climate change
literature, “climate change impact” can
have multiple meanings, which could
be related to different vulnerability
components. Through the
interdisciplinary work dealing with the
question ”What does impact really
mean?” it became clear that there is a
need for a more precise vocabulary.
Two different meanings of climate
change impact were identified. First,
climate change modeling investigates
the development of the regional
climate, therewith the effect of global
climate change on the regional climate.
Second, vulnerability research studies
the manifestation of the effect of
climate change on the social-ecological
system. Hence, in the context of this
thesis, the exposure was defined as an
internal property (the regional effect
driven by external factors) of the
system describing the spatially explicit,
Table 3: Summary of the different aspects of resilience that are of importance in the individual subprojects of plan B:altic (a-f) representing different scientific disciplines (summarized based on Beichler et al. 2014)
a) c
limat
e ch
ange
m
odel
ing
• uncertainty related to future development of climate change (including scenarios)• uncertainty intrinsic to the models• uncertainty and complexity considering urban spatial development and its feedback to local climates• need for clearly defined spatial and temporal scales
b) in
stru
men
ts &
m
etho
ds in
urb
an &
re
gion
al p
lann
ing
• open notion of resilience thinking shows parallels in planning theory (non-linearity, uncertainty, self-organization, learning processes and adaptive capacity)• complexity and dynamics of future developments considering implications for spatial planning
c)go
vern
ance
• normative assumption: multilevel governance structures can positively influence adaptive capacity, enhancing the resilience of social-ecological system• governance structures as part of the social-ecological system (actions of stakeholders and relations between them influence the state of the system)
d)
know
ledg
e
• concept of social-ecological resilience highlights change and social learning• assumption that social-ecological systems can adapt and change only through learning (generating and exchanging knowledge)• knowledge generation and social learning contribute to building adaptive capacity
e)co
mm
unic
atio
n • using the concept of resilience thinking leads to a different nature and perception of adaptation• resilience influenced by notions of change (transformative), complexity, social construction, and power
f)et
hics
• complexity and learning to live with change• perspective of social and ecological interdependencies• considering potential transformation of essential functional and structural properties

The Interdisciplinary Research Perspective
44
region-specific manifestation of climate change, namely the nature and degree to which
ecosystems are exposed to change (see also Chapter 6).
The overlap with the subproject of climate change modeling resulted in a discussion
about how the vulnerability could be framed in order to be able to include updated
climate change modeling results. Thus, the exposure element needs to be implemented
in a transparent way in order to be adaptable to new findings, which would also enhance
the transferability into practice dealing with multiple climate change scenarios. Hence,
here the vulnerability assessment includes information on the nature of the exposure
(vulnerability to what, e.g. increased heat island effect). That way, the results from
climate change modeling could be used in addition to describe the exposure in a
spatially explicit way. However, if no spatially explicit information on the exposure is
available, all areas are assumed to be exposed equally focusing on the link between the
social and the ecological system and associated consequences, thus the sensitivity
element. The sensitivity describes the potential susceptibility to change of land use,
ecosystem services, and population wellbeing as a response to exposure.
5.2.2 Adaptive Capacity in the Interdisciplinary Context
Adaptive capacity is of special importance, as it can have differing connotations in the
context resilience, vulnerability, and adaptation (cf. Table 3 and Table 2 p. 19).
Adaptive capacity is an inherent property of the overall system, but at the same time
influences vulnerability directly. Moreover, as pointed out in Chapter 3, adaptive
capacity is directly related to the vulnerability as well as the resilience concept. The
interdisciplinary research process widened the perspective on how adaptive capacity in
the context of a vulnerability framework could be approached.
Looking at the manifestation of the resilience concept within the individual subprojects
(Table 3), different aspects that are captured by adaptive capacity can be identified. On
the one hand, the ability of a system to self-organize changes through time with
accumulation of information (Table 3d and e) was described as part of adaptive
capacity. On the other hand, the increasing connectedness (Table 3b and c) was related
to adaptive capacity. As a result, particularly the aspects of governance and knowledge
exchange were included in the reflection of the framework developed in this thesis
(further elaborated in section 5.3).

The Interdisciplinary Research Perspective
45
5.2.3 Scales
The discussion of the contested issues related to spatial and temporal scales was
inherently linked to the disciplinary definitions of the social-ecological systems’
structural and functional properties (Figure 4). Concerning the temporal scales, different
time frames could be identified. The temporal scale of climate change models refers to
at least 30 years, whereas the time horizon in planning is restricted to the validity of
plans (5-7 years). Whilst the vulnerability assessment in turn was related to the time
steps, at which data for a spatial analysis of the region was available. In addition,
vulnerability assessments need to integrate short-term extreme events and gradual
changing variables (Brooks et al., 2005; Luers, 2005) (see also Chapter 3). Due to data
availability, the practical application of the framework in this thesis is restricted to one
point in time, but considers two different temporal levels in terms of potential exposure:
short-term extreme events (drought, heat) and a slow continuous long-term process (sea
level rise).
Adaptation measures derived through vulnerability analysis should be relevant to urban
and regional planning. Furthermore, as pointed out in Chapter 4, there are multiple
methods to assess ecosystem services. Hereby, the scale of assessment is of crucial
importance for the outcome, as an ecosystem can comprise many different spatial levels
(Hermann et al. 2011). Here, the assessment at the landscape level was adopted,
wherein ecosystem services are assigned to different land uses. In this context, is has to
be acknowledged that land use has an effect on the regional climate (Potschin, 2009;
Schröter et al., 2005). Consequently, land use plays a crucial role in discussing
adaptation as a key variable that a) influences the regional effect of climate change, b) is
used to assess the spatial distribution of ecosystem services, and c) is a main aspect in
urban and regional planning. Thus, the spatial scale was related to data availability in
the case study region and the spatial scale of land use plans. In addition, the regional
ecosystem service supply might lead to benefits at other scales (de Groot et al., 2010).
In former times, this relationship was rather prominent in urban regions, farmers in the
hinterland produced the food demanded by the population of the city. Nowadays goods
are traded throughout the world and the direct observable link is missing (cf. Chapter
4.3). Nevertheless, services like recreation, air filtering, and groundwater filtering are
still produced mainly in the hinterland and used by the city’s population. Thus, to set the
spatial boundaries for the practical application of the framework, it was important to

The Interdisciplinary Research Perspective
46
analyze urban regions as a whole to consider the interactions between the city and its
hinterland, which does not necessarily correspond to the spatial scale of land use plans.
5.3 Social-ecological System Approaches and Resilience - From Complexity to
Practicability
Social-ecological system approaches stress the fact that human actions and social
structures are integrated into the ecological system. Thus, a dependent consideration in
the context of vulnerability assessment is inevitable (Adger, 2006; Gallopín, 2006).
Particularly the dynamic interactions between the subsystems are essential for future
development (Gallopín, 2006). However, social-ecological systems are complex and
hard to assess. There are multiple and overlapping, so called nested scales, within
social-ecological systems (Gunderson and Holling, 2002). The challenge is to analyze
the dynamics between and within both systems in a rather simple way, while making
sure that the complexity of the overall system is included (Kluvánková-Oravská and
Chobotová, 2007). A general framework for the identification of subsystem variables of
social-ecological systems was proposed by Ostrom (2009). Although it was developed
to analyze the sustainability of social-ecological systems in the context of natural
resources, Ostrom’s framework can be applied using different theories and approaches
and supports the process of conceptualization (Schlüter and Hinkel, 2014). As such, it
helped to identify important factors to be included in the vulnerability analysis of this
thesis, namely users, resource system and units, governance, and social-ecological
interactions.
Clearly, the resilience concept opens up a wide perspective to approach complex
coupled social-ecological systems. Nevertheless, the approach needs to be aligned to the
timeframe and resources available within the limited time of a thesis. As mentioned in
Chapter 3, the concepts of vulnerability and resilience are closely related. However,
merging them is not straightforward as the concepts are coalescing, complementary, and
conflicting at the same time (for a detailed review see for example Gallopín, 2006;
Miller et al., 2010; Turner, 2010). In general, vulnerability assessments seek to identify
the weakest parts of the system, whereas resilience refers to characteristics making the
system withstand disturbances (Turner, 2010). Vulnerability might be simply described
as antonymic to resilience (Folke, 2006). However, this definition falls short as “a
resilient system is less vulnerable than a non resilient one, but this relation does not

The Interdisciplinary Research Perspective
47
necessarily imply symmetry” (Gallopín, 2006, p. 299). As such, in the context of this
thesis, resilience is seen as overall system property influencing its behavior in case of
change. The vulnerability is embedded as one characteristic of the social-ecological
system influencing resilience, explicitly not antonymic to resilience. The conceptual
overlap between the concepts in the context of this thesis is visualized in Figure 5 (cf.
also the interdisciplinary notions in Table 3).
Resilience is an internal property of the system (excluding exposure) and directly
related to (or even the same as) adaptive capacity (Gallopín, 2006). Interestingly, the
framework of Turner et al. (2003a) conceptualizes vulnerability as a function of
exposure, sensitivity, and resilience (including coping, impact/response, and
adjustment/adaptation), which are all linked to factors outside the system operating at
various scales. In the context of resilience, the term adaptive capacity is defined as the
Figure 5: Visualization of the overlap between vulnerability and resilience referring to the interdisciplinaryperspective within the project, the single vulnerability elements (exposure, sensitivity, and adaptive capacity) aswell as the social-ecological system (SES) approach.
knowledgegeneration andsocial learning
learning tolive withchange
Trans-formation
governancestructures
Adaptation
planning theorynonlinearity, self-organization
futuredevelopment ofclimate change
feedback tolocal
climate
STRUCTURAL andFUNCTIONAL PROPERTIES
of the SES
dynamics of future spatialdevelopment
perception ofadaptation
notions of change
SENSITIVITYEXPOSURE ADAPTIVECAPACITY

The Interdisciplinary Research Perspective
48
“capacity of actors in a system to influence resilience” (Folke et al., 2010, p. 3), which
in principle corresponds with the adaptive capacity definitions in the vulnerability
context (cf. Table 2, p. 19). However, the discussion on adaptive capacity in the
resilience (thinking) field could also include the notions of persistence, adaptability, and
transformation (Folke et al., 2010). Although, these could also be applied in the
vulnerability context, a practical application of them in the context of the thesis would
be unrealistic. Nevertheless, given the link to planning theory (cf. Figure 5 and Table 3),
the resilience concept could be seen as start and end point of the analysis. The start
point was the goal of the study to initiate long term, sustainable adaptation of the socio-
ecological system driven by the normative setting of resilient thinking. Hence, the
analytical framework particularly included system characteristics, describing the
structures and processes in the system not only related to ecosystem services, but also
different users and knowledge (see also section 5.2.2). Finally, again the more
normative setting of resilient thinking guided the discussion of adaptation measures in
the context of urban and regional planning. In addition, the implications derived through
the discussion of the resilience concept helped framing the analysis of the system to
deal with complexity and uncertainty, which are inherent to all three parts of the
visualization in Figure 5. The descriptions in Table 3 point at different forms of
uncertainty to be acknowledged: 1) the uncertainty about future climate change
development and the uncertainty intrinsic to the models describing the effects of climate
change, 2) the uncertainty about future development in the region and their implications
for urban and regional planning, 3) the uncertainty related to dynamic variables, such as
knowledge, and 4) the uncertainty about the social-ecological interdependencies
inherent to the system under consideration.
The identification of social-ecological feedbacks is essential to understand interactions
in social-ecological systems. Also, Turner et al. (2003a) stress the importance of
considering human and environmental conditions as well as their interaction, which
were placed in the sensitivity component of their framework. In fact, the resilience
perspective has a long history as an approach directed towards understanding the
dynamics of social-ecological systems (Folke, 2006). Although further method
development is required, one can find examples of empirical evidence in resilience
literature, whereas vulnerability assessments still face major challenges in this context
(Miller et al., 2010). Thus, the overlap between the concepts (Figure 5) does also

The Interdisciplinary Research Perspective
49
include the sensitivity component. Related to the sensitivity component, the description
of the social-ecological system by means of a spatial analysis of the ecosystem service
supply and demand in the urban region was the focus of this study.
Due to confusion in terms and conceptual challenges, the integration of the resilience
and the vulnerability concept is still at an early stage (Miller et al., 2010). A current
attempt to integrate them would unnecessarily add confusion to the vocabulary in the
development of the framework in this thesis. Consequently, this study focused on the
vulnerability assessment, while bearing in mind the achieved progress in the analysis of
system dynamics and social-ecological relations in resilience research, especially in
method development.
5.4 Key Findings
The interdisciplinary process resulted in an extensive exchange of disciplines, whereby
the initial conceptual precision of a social-ecological resilience definition facilitated the
uncovering of differences in language and meaning of terms as well as overlaps
between disciplines. Climate change impact is a global problem, which manifests
differently in different regions. Hence, the exposure was described here as the
manifestation of climate change impacts. This climate change manifestation could have,
depending on the individual sensitivity, effects on the population as well as on the
environment. Adaptive capacity represents not only the main overlap between the
vulnerability and the resilience concept, but was shown to be deeply rooted in various
disciplines. It was argued that in order to approach adaptive capacity (including the long
and short term aspects), it is essential to take governance and knowledge exchange into
consideration. For the development of an integrated vulnerability framework, this has
important implications for the definition of the social-ecological system, scales to be
considered, and the methods for the practical application.
In summary, although the resilience concept was not in the focus of this thesis, the
definition of key elements (e.g. essential structural and functional properties of the
social-ecological system) and methodological considerations (e.g. scales and the
definition of the urban region) were improved through the interdisciplinary perspective.
In the end, the focus of this thesis was the characterization of the social-ecological
system as a basis for vulnerability analysis, whereby the normative setting of resilient
thinking could be seen as a guiding principle.

Integrated Framework - The Social-ecological Vulnerability Loop
50
Figure 6: The Driver-Pressure-State-Impact-Response (DPSIR) framework adopted from EEA (1999).
State
Drivers
Impact
Responses
Pressures
“According to this systems analysis view,social and economic developments[Drivers] exert Pressure on theenvironment and, as a consequence, theState of the environment changes, such asthe provision of adequate conditions forhealth, resources availability andbiodiversity. Finally, this leads to Impactson human health, ecosystems and materialsthat may elicit a societal Response thatfeeds back on the Driving forces, or on thestate or impacts directly, through adaptationor curative action.” (EEA, 1999, p.6)
6 INTEGRATED FRAMEWORK - THE SOCIAL-ECOLOGICAL
VULNERABILITY LOOP
One of the main aims of vulnerability research is to inform practitioners to come up
with valuable adaptation strategies. Hence, vulnerability variables as well as cause-
effect-relationships need to be transparent to communicate the results in a
transdisciplinary context. The DPSIR (Driver-Pressure-State-Impact-Response)
framework (Figure 6) was developed to organize information, to provide a structure for
analyzing indicators, to identify targets, and to evaluate responses (EEA, 1999).
Moreover, it is an interdisciplinary tool with an inherent social-ecological approach, as
it assumes cause-effect-relationships between social, economic, and ecological systems
(EEA, 1999). As such, the DPSIR framework should be integrated taking a social-
ecological approach (Kluvánková-Oravská and Chobotová, 2007). In addition, Maxim
et al. (2009) proposed the use of the spheres of sustainability (economic, social,
political, and environmental). With the characterization of the interactions between
spheres, the DPSIR framework enables the discussion of possibilities of action and can
help clarifying the contributions of different scientific disciplines (Maxim et al., 2009).
Omann et al. (2009) give a good practical example of how the DPSIR approach might
be applied in the context of climate change. By identifying the links between climate
change, as a major threat to biodiversity, and the underlying socio-economic forces,
they formulated the resulting impacts in terms of ecosystem services. Furthermore,
Rounsevell et al. (2010) showed how the conflicts and tradeoffs between multiple
ecosystem services and service beneficiaries could be analyzed using the DPSIR
Integrated Framework - The Social-ecological Vulnerability Loop
51
framework. On the one hand, the DPSIR framework provides a good basis for social-
ecological system analysis and the integration of the ecosystem service concept. On the
other hand, there are many synergies between the DPSIR and the vulnerability
vocabulary (Maxim and Spangenberg, 2006) and it is a well-established and accepted
form of reporting results to practitioners. Therefore, the DPSIR framework offers a way
to gain conceptual clarification, as the literature on vulnerability itself is to some extent
inconsistent (cf. Chapter 3). Thus, combining the concepts could contribute to
interdisciplinary integration and transdisciplinary communication. Consequently, in
order to find a pragmatic way to overcome shortcomings in existing approaches, the
social-ecological vulnerability loop integrates the vulnerability concept and the concept
of ecosystem services within the DPSIR framework (Beichler et al., 2012).
6.1 The Social-ecological Vulnerability Loop
The social-ecological vulnerability loop (Figure 7) describes the system by untangling
the main features of the social system, the ecological system, and their inherent
interactions and feedbacks as well as their influence on the social-ecological system as a
whole. The use of the DPSIR framework allows for an analysis of the system in a
pragmatic and systematic way. To uncover feedbacks and interactions between the
elements, the pressure, state, and impact of both, the social and the ecological system
are approached separately.
Figure 7 shows the social system in red and the ecological system in green. Starting on
top, the framework understands climate change as a global problem outside the system
boundary, manifesting itself differently in different regions (cf. Chapter 5.2.1). The
manifestation of climate change effects, in vulnerability vocabulary the exposure (cf.
Chapter 3), is influenced by the external climate change, but acts within the system
boundaries. Hence, the climate change manifestation (e.g. drought) was defined as the
driver, which can take many forms.
The driver has an effect on both, the social and the ecological system, which was
represented by the pressure on the individual systems. Based on the ecosystem service
cascade principle (Haines-Young and Potschin, 2010), there are two objects of change:
population wellbeing as well as ecosystem structures and functions (cf. Chapter 4). The
pressure relates to limits and thresholds within the social and the ecological system,
respectively (Potschin, 2009). Here, the adaptive capacity definition by

Integrated Framework - The Social-ecological Vulnerability Loop
52
Brooks et al. (2005) was adopted differentiating between “coping capacity” for short-
term and “adaptation strategies” for long-term reactions (cf. Chapter 3). As such, the
value of the threshold or limit determines the coping capacity of the system.
The state variable embeds the ecosystem service concept (cf. Chapter 4) by means of
the supply-demand approach of Burkhard et al. (2012b). This includes a direct link
(small arrow in Figure 7) between the ecosystem service supply of the ecological system
and the ecosystem service demand of the social system. Thus, a change in the state of
the ecological system can also change the social system and vice versa. Equivalent to
the framework proposed by Rounsevell et al. (2010), the state variables represent the
sensitivity.
Figure 7: The social-ecological vulnerability loop. Visualization of the social (red) and the ecological (green) system and their interactions.

Integrated Framework - The Social-ecological Vulnerability Loop
53
The impact represents the resulting overall change in the state, which is synonymous to
the overall vulnerability (Maxim and Spangenberg, 2006). The impact was described
here as the change in ecosystem service demand and supply. There are diverse
ecosystem service assessment approaches (cf. Chapter 4). On the regional scale, studies
utilizing land use and land cover data offer potential indicators for the quantitative
application of the presented framework (cf. Chapter 5.2.3).
Climate adaptation strategies and potential measures involved have to be embedded
within a wider decision-making context (cf. Chapter 5.2.2) and are integrated as the
intervening variable in the social-ecological vulnerability loop, namely the response. In
the vulnerability loop, responses and impacts are taken into account as new drivers to
create a feedback loop (dotted line in Figure 7). This allows a reflection on system
dynamics and responses acting on different spatial and temporal scales (Beichler et al.,
2012).
6.2 Main Characteristics of the Proposed Framework
In existing applications of the DPSIR framework, the definitions of pressure differ with
respect to the object of change (land use, biodiversity), the relationship to change (e.g.
long-term climate change), and the character of the pressure (e.g. resources, intensity of
actions) (Maxim et al., 2009). Most DPSIR studies consider only anthropogenic factors
as drivers, following the EEA definition (EEA, 1999). These could be social or
economic developments, thus coming from the social system. Other conceptualizations
consider both anthropogenic and natural factors that cause a change in the ecosystem
(MEA, 2005), or include also political aspects arising for example from the relationship
between stakeholders, leading to an inadequate policy action (Maxim et al., 2009).
Climate change is a global problem, in which causes and impacts might be allocated
spatially and temporally (cf. Chapter 5.2.1). However, the related drivers are often
described rather general, for instance in human activities that cause greenhouse gas
emissions (Omann et al., 2009), which hinders a practical application. Although current
climate change research states that humans are the main source driving climate change,
they are affected at the same time. As such, in the context of climate change, the social
system does not essentially need to be the driver, as even climate neutral regions will be
affected by climate change impacts. Looking at studies in the vulnerability context, the
exposure component is more specific and spatially explicit for the region, e.g. an urban

Integrated Framework - The Social-ecological Vulnerability Loop
54
heat island effect (Lissner et al., 2012). The driver causing climate change (e.g. green
house gas emissions) is external to the system, but does not influence the system
directly, thus does not correspond to hazards or exposure in vulnerability literature. The
cause of the manifestation of climate change effects is also external, but it acts directly
within the system boundaries (cf. Chapter 5.2.1). It needs to be acknowledged that in
this regard the social-ecological vulnerability loop differs significantly from usual
DPSIR applications. It is argued here that, in order to evaluate adaptation measures,
these components need to be more specific and relevant in order to inform stakeholders.
The definition of pressures differs with respect to the object of change, the relationship
to changes (e.g. long term climate change), and the character of the pressure (e.g.
resources, intensity of actions), and is described either very general or narrowly (Maxim
et al., 2009). Stressing the fact that climate change is a driver for change in the social
and the ecological system, it has an effect on both systems. Thresholds are related to the
ecological system pressure, defining the point after which ecosystems change to
alternative stable states, which might be an irreversible structural and functional change
(Potschin, 2009). Thus, the value of the threshold determines the coping capacity of the
ecosystem. In contrast, limits are perceived by humans and depend on the context (e.g.
cultural, economic). This term is to some extent comparable to the term of acceptability
introduced by De Chazal et al. (2008). Depending on what is acceptable, the population
will reach limits, after which the wellbeing is compromised.
The state describes the conditions of the system, which can be understood by the
concept of dynamic stability (Kluvánková-Oravská and Chobotová, 2007). On the one
hand, there is a demand for ecosystem services in the social system. The ecosystem, on
the other hand, has a limited supply capacity for ecosystem services (Crossman et al.,
2012). The direct link between both systems can be seen in the supply-demand deficit,
which might be present even before climate change poses an additional driving force.
The ecosystem service supply capacity is related to the land cover, which has direct
implications for land use (demand) of the social system. This is however just a
theoretical differentiation, as spatial datasets (e.g. corine land cover) mostly do not
allow a distinction between land use and land cover (Breuste et al., 2013a). However,
both of them have direct implications for the local climate.
The impact can be seen as interaction leading to ecological and social change
(Kluvánková-Oravská and Chobotová, 2007). Hence, a change in the state of the

Integrated Framework - The Social-ecological Vulnerability Loop
55
ecological system can also change the social system, although the pressure was not
relevant to it. After a disturbance, the demand could be the same, but the impact might
refer to the change in the supply-demand deficit, which in turn could mean that the
demand can no longer be met by the ecological system. Here, the impact refers to the
ecosystem supply capacity and the social system demand after a disturbance. The state
variables refers to the sensitivity of the ecological and the social system, which is
equivalent to the model proposed by Rounsevell et al. (2010). The resulting overall
change in the ecosystem service supply and demand as well as their interrelations,
represented by the impact, is synonymous to the overall vulnerability.
Responses are usually defined as planned policy and management. As a response, actors
can apply different measures acting upon the social or the ecological system. Values,
perceptions, processes, and power structures within society influence climate adaptation
strategies and potential measures. Thus, they have to be embedded within a wider
decision-making context, as such, adaptation is essentially a governance issue (Adger et
al., 2009). Adaptations to climate change can be differentiated into autonomous
adaptation (reactive) and planned adaptation (proactive) (IPCC, 2007; Omann et al.,
2009). Feedbacks make it often hard to separate impacts from drivers (Potschin, 2009).
Here, responses but also impacts (that might relate to autonomous adaptations) are taken
as new drivers to create a feedback loop.
The framework proposed by Rounsevell et al.(2010) also define drivers and pressures
that effect ecosystem service beneficiaries and providers rather similar as presented
here, but quantify solely the impacts on ecosystem service provision. In contrast, the
DPSIR application of the ecosystem service cascade presented in chapter 4 (Müller and
Burkhard, 2012) focuses on the effect of social systems pressures on ecological
functions and resulting impacts on ecosystem services and thus human wellbeing. Here,
the ecosystem service approach is embedded into the vulnerability framework by
combining the ecosystem service cascade (Haines-Young and Potschin, 2010) and the
supply-demand approach after Burkhard et al. (2012b). which has a strong influence on
the interactions within the systems. Thereby, it is considered that on the one side, the
structures and functions of the ecological system are under pressure, leading to a change
in ecosystem service supply capacity. On the other side, climate change simultaneously
poses a pressure on the population’s well-being, leading to a change in ecosystem
service demand. Although the approach presented here differs from traditional DPSIR

Integrated Framework - The Social-ecological Vulnerability Loop
56
applications, this conceptualization enables the practical application of the ecosystem
service cascade in the vulnerability context. Nonetheless, the approach is in line with
the theory on social-ecological system as for instance proposed by Ostrom (2009) or in
the vulnerability framework of Turner et al. (2003a). Ostrom’s framework can be
applied using different theories and approaches and supports the process of
conceptualization (Schlüter and Hinkel, 2014). As such, it helped to identify important
factors to be included: a) The users are represented via the population (amount and
social-economic attributes). b) The resource units are ecosystems and their capacity to
provide services (including spatial distribution and interaction). c) The governance
aspect is integrated via the response element. d) The interactions are an important part
within the social-ecological vulnerability loop. In line with the social-ecological
framework of Ostrom (2009), not only users and resource units interact (supply-
demand), but also the governance responses feed back to the social and the ecological
parts of the system. With the feedback loop approach, it was also acknowledged that
drivers are formed by interdependent socio-economic and environmental processes
(Kluvánková-Oravská and Chobotová, 2007) and could arise from the relationship
between stakeholders, leading to inadequate policy action (Maxim et al., 2009).
6.3 Key Findings
The social-ecological vulnerability loop aims at describing the social-ecological system
under climate change. By identifying dynamics between the elements of the social and
the ecological system and linking responses to the consequences for the whole system,
it could serve as a tool to assess the vulnerability. Hereby, the DPSIR framework is a
valuable tool to organize the vulnerability elements, structure the steps of analysis, and
think about potential indicators. Herein, the implications of the previous three chapters
on vulnerability theory, ecosystem services, and the interdisciplinary process were
brought together. Hence, the framework refers to the basic vulnerability definition
(Chapter 3), the concept of ecosystem service supply and demand (Chapter 4) as well as
the interdisciplinary implications considering the scales of analysis as well as notions of
climate change impact and adaptive capacity (Chapter 5). The results contribute to
answering the questions of this thesis, as to which theoretical frameworks can be used
and how the different concepts can be integrated.

Integrated Framework - The Social-ecological Vulnerability Loop
57
In the following chapters, the described assessment approaches of the concepts will be
taken up, showing how the social-ecological vulnerability approach can be applied,
identifying the dynamics within the social-ecological system, and exploring potential
climate change adaptation measures.

Case Study and Methods
58
7 CASE STUDY AND METHODS
7.1 The Urban Region of Rostock (Germany)
The urban region of Rostock (Germany) is situated on the Baltic Sea coast. Coastal
cities are particularly interesting case studies in the context of climate change research.
There is a potentially high exposure to different extreme events (e.g. floods and heavy
rain) and gradually changing variables (e.g. sea level rise) (IPCC, 2007). Due to the
worldwide high population density along the coasts, coastal ecosystems are greatly
influenced and highly altered and hence susceptible to disturbances (Adger et al., 2005).
As such, the characteristics of cities, such as the high population density, multiple land
use conflicts (e.g. the contrast between urbanization and valuable coastal ecosystems),
and the specific climatic conditions (e.g. the urban heat island effect) need to be
considered in the context of climate change adaptation.
The urban region under consideration comprises a medium-sized city (199,380
inhabitants in 2009, Statistische Ämter des Bundes und der Länder (accessed 2013)) as
well as the surrounding rural communities (Figure 8a). The city comprises an area of
181 km2, whereas the overall urban region, which also includes all adjacent
Figure 8: The urban region of Rostock. a) Population per km2 living area b) Topographical map.
GeoBasis-DE/M-V <2011>Statistische Ämter des Bundes und der Länder, 20130 5 10 15 202.5
km
population/living area1449 - 23342335 - 34983499 - 59715972 - 1205712058 - 15440city districtmunicipality
a) b)

Case Study and Methods
59
municipalities, covers an area of about 553 km2 with an overall population of 245,981
in 2009 (Statistische Ämter des Bundes und der Länder (accessed 2013)).
Rostock is the largest city in Mecklenburg-West Pomerania. In recent decades, the
population has been growing, due to the area’s favourable conditions for families and
elderly people. The topographical map in Figure 8b gives an overview on the case study
region. The key economic sectors are the port, the associated maritime economy, and
tourism. In addition, Rostock is attractive as a university location and offers culture,
entertainment, and job opportunities. The urban region provides several possibilities for
recreation, with the most popular being long stretches of beach. From an ecological
perspective, the area is of interest because of its valuable coastal ecosystems, the
Warnow, and the Rostocker Heide. The river Warnow spans from the south of the study
area to the very north, where it flows into the sea (cf. Figure 8b). The Rostocker Heide
is an extensive forest area to the southeast of the urban region covering about 60 km2.
The spatial analysis was related to two main spatial scales. First, the administrative
borders, for which statistical data on the population was available, were used. Here, 21
city districts and 24 municipalities were distinguished (Figure 9). Second, the land use /
land cover information was based on the digital topographical map (DTK25,
Figure 9: Case study area division into city districts and rural municipalities.
GeoBasis-DE/M-V <2011>Statistische Ämter des Bundes und der Länder, 2013
0
1
2
34
567
8
910
1112
13
1415
16
171819
20
2122
23
24
25
26 2728
29
30
3132
33
34
35
36
3738
39
40
41
42
43
440 Rostock-Heide1 Rostock-Ost2 Brinckmansdorf3 Dierkow-Neu4 Dierkow-Ost5 Dierkow-West6 Toitenwinkel7 Schmarl8 Groß Klein9 Kröpeliner-Tor-Vorstadt10 Südstadt11 Stadtmitte12 Hansaviertel13 Gehlsdorf14 Biestow15 Gartenstadt/Stadtweide16 Reutershagen17 Seebad Warnemünde18 Lichtenhagen19 Lütten Klein20 Evershagen21 Mönchhagen22 Elmenhorst-Lichtenhagen
23 Admanshagen-Bargeshagen24 Lambrechtshagen25 Kritzmow26 Papendorf27 Kessin28 Roggentin29 Broderstorf30 Bentwisch31 Rövershagen32 Nienhagen33 Stäbelow34 Ziesendorf35 Börgerende-Rethwisch36 Pölchow37 Benitz38 Damm39 Kavelstorf40 Klein Kussewitz41 Steinfeld42 Poppendorf43 Gelbensande44 Graal-Müritz
city districtmunicipality
0 5 10 15 202.5km

Case Study and Methods
60
©GeoBasis-DE/M-V (2011), cf. Figure 8b). For a better representation and
comparability of results particularly of the ecosystem service demand, the population
data from the individual districts/municipalities was transferred to the available living
area in the districts/municipalities (as displayed in Figure 8a).
7.2 Inter- and transdisciplinary Knowledge Base
The urban region of Rostock was a prominent case study within the research project
plan B:altic. This enabled to draw from a broad interdisciplinary knowledge base
considering e.g. governance aspects or climate change effects (cf. Chapter 5). Moreover,
in the context of the project, transdisciplinary results were established throughout a
scenario planning process (Hagemeier-Klose et al., 2014, 2013). Three workshops
facilitated stakeholder participation and enabled the integration of specific local
knowledge from different perspectives. Stakeholders (from administration, politics
economy, science, and civil society) discussed key factors for future spatial
development as well as relationships between these factors and potential climate change
impacts (Hagemeier-Klose et al., 2014, 2013).
Throughout the process, detailed information on the case study area was derived: 1)
material and information obtained from the stakeholders; 2) the results of the process
itself, which refer to adaptation measures and strategies discussed by the participants of
the workshops (Hagemeier-Klose et al., 2012). Some of these have been included in the
official adaptation plan of the city of Rostock (Hansestadt Rostock, 2013); 3) the
observations made during the process including conflicting statements that were
mentioned. This information was used in this thesis establishing a reference to the
ongoing dialogue in the urban region of Rostock. Here, the exchange of knowledge was
reflected to approach adaptive capacity.
7.3 Participatory Assessment in the Urban Region of Rostock
The quantitative application of the framework was based on a participatory mapping
approach acquiring empirical data on perceived vulnerability and CES. A detailed
description of the approach is given in Beichler (2015)1, which will be summarized in
the following. In order to assure a reasonable time frame for the assessment, this thesis
focuses on CES, which were identified to be most suitable in this context as elaborated 1 Vorabveröffentlichung der Dissertation see page 1

Case Study and Methods
61
in Chapter 4.3. The list of CES to be assessed was compiled by comparing different
classifications systems (Burkhard et al., 2010a; Crossman et al., 2013; de Groot et al.,
2002; Hermann et al., 2011; MEA, 2005) as well as results and method discussions of
case studies using participatory approaches (Brown and Reed, 2012; Brown et al., 2012;
Bryan et al., 2010; Fagerholm et al., 2012; Koschke et al., 2012; Niemelä et al., 2010;
Raymond et al., 2009; Sherrouse et al., 2011). The final list of CES included aesthetics
and inspiration (aest), spiritual and religious (spirit), cultural heritage and identity (cult),
recreation (recr), knowledge and education (edu), and natural heritage and intrinsic
value of biodiversity (nat). The 36 participants filled in an extensive survey (adopted
from Brown et al., 2012; Fagerholm et al., 2012)(Appendix A, p. 119ff). The
participatory mapping was administered in six groups (as described in Hagemeier-Klose
et al., 2014) using printed topographical maps (adopted from Fagerholm and Käyhkö,
2009; Fagerholm et al., 2012). Referring to the CES by means of easily accessible
questions (Plieninger et al., 2013), the participants delineated the CES on the map and
indicated a quality value from 1 (very low quality) to 5 (very high quality) (cf. Figure
10). The mapping of the individual CES was followed by a ranking of the importance of
the service for personal wellbeing and the satisfaction with supply in the urban region
Rostock (cf. Appendix A, p. 119ff). For the participatory mapping of perceived
vulnerability, it was referred to areas that would be avoided during or after the extreme
events heat wave, extreme precipitation, or drought (Beichler, 2015; Hagemeier-Klose
et al., 2014).
Figure 10: Example of the participatory mapping

Case Study and Methods
62
7.4 Spatial Analysis
The empirical data derived through the participatory mapping was analyzed in several
steps. First, the individual CES areas mapped by the participants were correlated to land
use classes (database cf. Section 7.1) distinguishing areas with high (5-4) and medium
(3-2) values. In addition, the spatial overlaps between the different CES were
calculated. Second, the mapped data (individual areas in the raw data) and the clustered
data (dissolved according to the CES classes) were compared to reflect upon the
participatory method used. Moreover, the clustered CES maps served as a basis to
describe the CES in the urban region. In the subsequent steps (cf. Figure 11), the
Figure 11: Description of the spatial analysis methods conducted. Figure adopted from Beichler (2015)
spat
ial l
ink
in
put m
aps,
Eucl
idia
n di
stan
ce, d
iffer
ence
s ac
cord
ing
to so
cial
fact
ors,
CES
, val
ues,
wel
lbei
ng a
nd sa
tisfa
ctio
n
s u p p l yd e m a n d
supp
ly-d
eman
d ch
ange
s un
der c
limat
e ch
ange
inpu
t map
s, C
ES a
reas
ov
erla
ppin
g w
ith p
erce
ived
vu
lner
abili
ty e
xclu
ded
legend
cate
gori
cal l
ink
inpu
t sur
vey
data
and
ra
nkin
g (1
-5),
stat
istic
al
anal
ysis
(Kru
skal
Wal
lis)
input map
inte
grat
ed
supp
ly-d
eman
d id
entif
y ho
t and
co
ld sp
ots i
n th
e ur
ban
regi
on
loss of CES
participants home location
CES distribution
population distribution
CES values
perceived vulnerability to drought, heat wave, heavy rain
social factorsgender, children, age, marital status, garden,
house type, car, employment, income, education, residence
city/hinterland, property, duration of
residence,ecological knowledge,
local knowledge,time spend outdoors
CESeducation / knowledgeaesthetics / inspiration
recreationspiritual / religiousintrinsic value of
nature /natural heritage
cultural heritage / identity
wellbeing satisfaction
distance to home
result input
CEScountarea
diversity
CEScountarea
diversity
potential climate change impact
Case Study and Methods
63
categorical link between recorded social factors and CES as well as the spatial link
between supply and demand were analyzed as elaborated in detail in Beichler (2015).
The categorical link referred to relations between the ranking of wellbeing and
satisfaction, the 16 social factors (included in the survey), and the different CES. The
spatial link was analyzed based on the distance to home (DTH), which was reflected
considering various factors (cf. dashed arrows in Figure 11). The integrated supply-
demand map was derived through a neighborhood analysis using the critical distances
identified for the individual CES. To characterize the urban region, the results were
accumulated calculating the total supply area, the number of areas, and the
diversity/number of different CES. To illustrate potential changes under climate change
the neighborhood analysis was repeated excluding areas of perceived vulnerability.

Approaching Adaptive Capacity
64
8 APPROACHING ADAPTIVE CAPACITY
As pointed out in Chapter 3, for determining adaptive capacity, knowledge is a decisive
factor, which is highly dynamic. In order to gain a comprehensive picture of climate
change adaptation with a special focus on adaptive capacity, interdisciplinary and
transdisciplinary knowledge must be assessed and processed, integrating different kinds
of knowledge (Hagemeier-Klose et al., 2014). The different stages of interdisciplinary
and transdisciplinary work were structured by organizing and grouping the different
forms of knowledge and the interfaces of knowledge exchange in the knowledge loop.
The dynamic knowledge loop (Figure 12) was developed to explore inter- and
transdisciplinary knowledge generation; mechanisms of knowledge exchange; the
integration of different forms of knowledge, such as scientific, local, and practical
knowledge; and associated learning processes as described in detail in Hagemeier-Klose
et al. (2014)1. The knowledge of adaptation (blue box Figure 12) refers to the scientific
knowledge base. The first part of the loop represents the science–science knowledge
exchange that influences the knowledge of adaptation. The comprehensive social-
ecological system approach includes undertaking research in different disciplines (cf.
Chapter 5). Due to the exchange between disciplines, this feedback loop triggers the
adaptation of knowledge (red box in Figure 12). The second loop refers to practical
local knowledge transferred to scientists at this stage. This included data that was shared
and transdisciplinary methods to acquire empirical data. The third knowledge loop
refers to the two-sided science–practice exchange of knowledge. Here, the
transdisciplinary scenario process was examined. The combination of the different steps
(in Figure 12) showed the interplay between the knowledge of adaptation and the
adaptation of knowledge to approach the adaptive capacity of the overall system. A
detailed discussion of the application of the knowledge loop was given in Hagemeier-
Klose et al. (2014), which is summarized in the following.
1 Vorabveröffentlichung der Dissertation see page 1

Approaching Adaptive Capacity
65
8.1 First Knowledge Loop Science Science
The science-science loop (Figure 12) in the context of this thesis was related to the
reflection of literature on vulnerability theory and indicators (Chapter 3) and the social-
ecological system research perspective, particularly ecosystem services (Chapter 4) as
well as the interdisciplinary process (Chapter 5). These conceptual considerations
helped to understand the characteristics of a social-ecological system under climate
change and to integrate them into vulnerability analysis in order to uncover problems
concerning adaptive capacity measurements. In the science-science loop, the knowledge
of adaptation was adapted by combining information about the social-ecological system,
Figure 12: The dynamic knowledge loop adopted from Hagemeier-Klose et al. (2014). The application in the context of vulnerability research in social-ecological systems (SES) illustrates the interplay between the knowledge of adaptation (orange) and the adaptation of knowledge (red) influencing the adaptive capacity (dark red). Blue refers to scientific implications and green indicates implications for practitioners involved in the process.
SES,vulnerability concept
and indicators,climate change
problem framing
local knowledge on SES,
local characteristics, SES,climate change vulnerability
problem discussion
AD
AP
TA
TIO
N O
F K
NO
WL
ED
GE
practice science
practice science
KNOWLEDGE OF ADAPTATION
climate change - SES - vulnerability concepts
ADAPTIVECAPACITY
sciencescience
participatory mappingCES & perceived vulnerability

Approaching Adaptive Capacity
66
its constituents, and the interconnections and feedback that determine the vulnerability
of the system to climate change impacts. As a result, these aspects were integrated in the
social-ecological vulnerability loop (Chapter 6).
8.2 Second Knowledge Loop Practice Science
The one-way practice science loop describes the step of acquiring local knowledge,
which was integrated in scientific research. This referred to the determination of factors
relevant in the specific case study region (cf. Chapter 7.2.). Furthermore, a knowledge
transfer from practice to science took place through the participatory mapping of CES
and perceived vulnerability (cf. Chapter 7.3). The participatory mapping enabled to
bring local knowledge into the spatial context revealing a considerable amount of
valuable data. As such, the adaptation of knowledge in scientific terms included local
information about the characteristics of the social-ecological system considering e.g.
multifunctional hotspots (cf. Chapter 9.1). Moreover, it was revealed, how the
stakeholders perceived the climate conditions in the urban region (cf. Chapter 9.2).
Providing input for analysis, practitioners undertook problem framing by dealing with
the potential impacts of climate change.
8.3 Third Knowledge Loop Science Practice
In the third knowledge loop, the adaptation of knowledge is regarded as more far-
reaching than in the first and second loop. This is because cooperation between
scientists and practitioners led to knowledge exchange and joint knowledge generation
about the local characteristics of the social-ecological system, climate change impacts,
and vulnerability. In this regard, many participants stated that they have never
consciously thought about the spatial distribution of regional characteristics or how
climate change could affect them, and as such showed a great interest in the scientific
perspective. Moreover, the group environment positively influenced the mapping
process through the exchange of experiences among participants.
In the scenario planning process, 18 different factors for future development (climate
change impacts, social, economic, political, and environmental factors) were prepared
and evaluated considering spatial relevance and dynamic character (e.g. changing
rapidly) in the case study region in order to reveal potential impacts on spatial
development in the region. For some factors, opinions about their dynamic character

Approaching Adaptive Capacity
67
and spatial relevance differed within groups, leading to an exchange of knowledge
between scientists, practitioners, and disciplines (or sectors). For example, opposing to
the scientists perspective, during the discussion of key factors, the practitioners
considered only extreme weather events to be of very high importance and the other
climate change factors were thought to be of medium relevance. The practitioners
identified the demographic structure, transport infrastructure, and the development and
quality of free areas to be highly relevant for the future. Moreover, the evaluation
revealed the high importance of dealing with water resources in the region, which was
initially considered to have little relevance by scientists (Hagemeier-Klose et al., 2014).
Among the participants, problem discussion took place considering the key factors for
future spatial development and the various interdependencies among these factors and
climate change. Thus, knowledge on the social-ecological system was generated across
sectors. The practitioners were confronted with the complexity and uncertainty related
to climate change impacts and links to other factors (Hagemeier-Klose et al., 2014,
2013). The different weighting of scientists and practitioners indicated a potential
mismatch between the knowledge generated by science and the knowledge demanded
by practitioners. Scientists adapted their knowledge by learning more about the social-
ecological system, about the judgments of the local practitioners, the anticipated
impacts of climate change, and about the practitioner’s demands for vulnerability
assessment.
8.4 Key Findings
Summarizing, knowledge as a decisive variable of adaptive capacity is highly dynamic.
Here, the different dimensions of adaptive capacity of a social-ecological system were
approached interdisciplinarily from the knowledge of adaptation in terms of
vulnerability mapping to the transdisciplinary knowledge generation within the scenario
planning process. Adequate knowledge of adaptation is required to formulate and
implement an adaptation framework or strategy considering climate change, the
interconnections within the social-ecological system, and possible future developments
of very different aspects of spatial development. Through the inter- and
transdisciplinary research process, adaptation of knowledge took place (Hagemeier-
Klose et al., 2014), which led to the creation of a complex picture of the social-
ecological system under climate change enhancing the overall adaptive capacity.

Characterization of the Urban Region
68
9 CHARACTERIZATION OF THE URBAN REGION
This chapter gives an overview on the empirical findings of the thesis. In this regard, the
results concerning the spatial distribution of CES and perceived vulnerability, the
exploration of the categorical, and the spatial link between supply and demand, as well
as the integrated supply-demand analysis and the final vulnerability analysis are
presented. Whereas an in depth discussion of the results and the applied methods is
provided in Chapter 10.
The results of the participatory mapping in the urban region of Rostock have in part
been described in Beichler (2015) and Hagemeier-Klose et al. (2014). The raw data is
listed in Table 4 and Table 5, and illustrated in Figure 13 including the CES aesthetics
and inspiration (aest), spiritual and religious (spirit), cultural heritage and identity (cult),
recreation (recr), knowledge and education (edu), and natural heritage and intrinsic
value of biodiversity (nat). For the CES, 954 entries were delineated by the participants,
whereby aest accounted for the highest and spirit for the lowest number (Table 4). For
the perceived vulnerability 136 entries were mapped (grey striped areas in Figure 13),
whereby extreme precipitation accounted for the highest number and largest area of
entries delineated (Table 5).
Table 4: Results of the participatory mapping of cultural ecosystem services showing raw data and the data with overlap correction.
Cultural ecosystem services raw data overlap corrected
area km2 number area km2 number
spiritual and religious (spirit) 11 67 8 35
knowledge and education (edu) 49 124 19 45
cultural heritage and identity (cult) 566 172 136 21
aesthetics and inspiration (aest) 663 229 182 29
recreation (recr) 957 214 178 26
natural heritage and intrinsic value
of biodiversity (nat)
1247 148 186 26

Characterization of the Urban Region
69
As illustrated in Figure 13, the entries were so dense that the individual CES and
associated colors obscured each other, indicating that the entries of the different
participants coincided. For analysis, the areas delineated by the individual participants
were clustered by theme (dissolved according to the CES classes) aggregating all
overlapping areas that belong to the same CES. Comparing the final map with clearly
assigned areas for all individual CES (Figure 14) with the raw data (Figure 13), the total
area was considerably reduced. For example for nat, the raw data, which accounted for
1247 km2, was reduced to 186 km2. This holds true for almost all CES (Table 4) and the
areas of perceived vulnerability (Table 5) indicating that the entries were frequently
repeated in the same location and thus verified by different participants. Only for spirit,
very few entries were in the same location.
In the following, first, the spatial distribution of CES is described analyzing the relation
to land use classes and the overlap of the individual CES. Second, the results on
perceived vulnerability are presented including the overlap with CES in the urban
region.
Table 5: Results of the participatory mapping of perceived vulnerability to climate change showing raw data and the data with overlap correction.
perceived vulnerability raw data overlap corrected
area km2 number area km2 number
drought 255 12 106 7
heat wave 217 61 57 8
extreme precipitation 428 63 113 14

Characterization of the Urban Region
70
Figure 13: Map showing the individual entries of the participatory mapping of the cultural ecosystem services(CES) aesthetics and inspiration (aest), spiritual and religious (spirit), cultural heritage and identity (cult),recreation (recr), knowledge and education (edu), and natural heritage and intrinsic value of biodiversity (nat)in the urban region of Rostock. The results from the participatory mapping of the perceived vulnerability areindicated by the striped area. The topographical map is depicted in the background.
CES mappedspiriteducultaestrecrnatclimate change
GeoBasis-DE/M-V <2011>0 2.5 5 7.5 10km

Characterization of the Urban Region
71
Figure 14: Resulting cultural ecosystem service areas including quality ranks (5 very high – 1 very low) for a)aesthetics and inspiration (aest), b) cultural heritage and identity (cult), c) knowledge and education (edu), d)recreation (recr), e) natural heritage and intrinsic value of biodiversity (nat). Areas of perceived vulnerability todrought (D), heat wave (H) and extreme precipitation (S). (modified Source: Beichler, 2015)
a)b)
c) d)
e) f)
aest2345
cult2345
edu234
5
recr
345
nat345
climateDHS
0 5 10 15 202.5km GeoBasis-DE/M-V <2011>
Statistische Ämter des Bundes und der Länder, 2013

Characterization of the Urban Region
72
9.1 Supply of Cultural Ecosystem Services
The results of the land use classes (cf. Figure 8b, p. 58) that related to the different CES
areas (Figure 13) are visualized in Figure 15. These are complemented here by the
evaluation of the quality criteria for the CES (cf. Chapter 7.3, Figure 10, p. 61). For
high value areas of the CES nat, cult, recr, and aest, a similar picture was revealed
(Figure 15). For all of them, a high importance of forest was found and they were to
some extent related to the land use class pasture. In addition, for the CES nat and aest, a
high share of Baltic Sea was found. For nat, cult, and recr, areas valued high differed
considerably from areas values medium with regard to the related set of land use
classes.
For cult, the biggest difference between high and medium value areas was found. In this
CES class, medium value areas related mainly to the land use classes industrial and
inland water. In the description of the quality criteria for cult, the participants referred to
Figure 15: Visualization of the share of land use classes (see legend) related to the individual CES areas. Areasvalued high (5-4) and medium (3-2) are distinguished.
0% 10% 20% 30% 40% 50% 60% 70% 80% 90% 100%
high
medium
high
medium
high
medium
high
medium
high
medium
high
medium
aest
edu
recr
cult
nat
spiri
t
agriculture fellow land/wetland industrialhousing artificial green inland waterbaltic sea/beach forest/shrub pasture/cemeteryautobahn/highway main road road

Characterization of the Urban Region
73
the history and cultural identity of Rostock characterized by the maritime environment.
This was mainly related to natural places at the coastline (particularly Warnemünde) on
the one hand, and to the harbor areas and the river Warnow on the other hand.
For the medium value areas of recr, a mixture of the land use classes pasture, forest,
Baltic Sea, agriculture, and to some extent housing and artificial green was found. In the
descriptions of recr and aest, the participants referred mainly to nature experiences
including silence, view, and landscape character. Here, the coast and the Rostocker
Heide were frequently mentioned. For recr the participants also referred to outdoor
activities (cycling, walking, etc.) emphasizing possibilities for local recreation. Medium
value areas of nat were related to pasture, forest, inland water, artificial green, and
wetlands. In the context of nat, the participants referred to naturalness, pristine areas,
and specific ecosystems. The mix of land use for medium value nat areas was
comparable to the findings for high and medium value areas of edu. Yet, for edu, a
higher share of artificial green was observed. Concerning edu, the participants
mentioned experiences of nature and specific educational opportunities (e.g. zoo and
botanical garden) most frequently, but also education on history and culture related to
the landscape, architecture or specific facilities.
The class spirit included a high share of housing area. In addition, areas with high
values included a high share of Baltic Sea (Figure 15). The evaluation of the qualitative
description revealed that spirit related to very personal and intimate experiences of
individual participants as well as sacred buildings. That complemented the finding that
spirit areas were not verified (Table 4, p. 68). Consequently, spirit was excluded from
subsequent analysis.
The pairwise intersection between the CES areas is depicted in Figure 16 showing the
percentage of area of other CES within the total area of the individual CES. In this
regard, it has to be kept in mind that the smaller share of edu (7-9% of the area of the
other CES) represented a high overlap, as the total area of edu was much smaller (i.e.
ca. 10% of the total area of nat, Table 4). Interestingly, although the total area of edu
and cult was comparable, these CES classes overlapped only to a very small extent. In
general, a very high overlap of all CES was found. 76% of the area of aest and 84% of
the area of edu included nat. For recr 74% and for nat 75% of the area accounted also
for aest. For the areas of cult, 85% were also related to recr. Due to the very high
overlap of all CES, one might be led to assume that the participants were not able to

Characterization of the Urban Region
74
distinguish between the individual CES. This is contradicted by the different
descriptions with regard to quality criteria’s (see above) and the differences in the
spatial characteristics of the individual CES e.g. comparing the rather large areas for
recr (Figure 14d) and the more distinct smaller areas for cult (Figure 14d).
The maps of the CES (Figure 13 and Figure 14) enabled a description of the local
characteristics of the case study area. Multifunctional hotspots with different key uses
could be identified (cf. Beichler, 2015). At the Baltic Sea coast, three main areas could
be distinguished. First, the “Rostocker Heide” a large forested area in the northeast,
which has a high nature value for the overall region. Second, west of the river is
“Warnemünde”, a tourist hotspot area with sandy beach and many recreational facilities.
Third, in the more western part of the coastline, an area includes the nature reserve area
“Stolteraa”. Here, the coast is steeper and more activities close to nature are available
(e.g. hiking paths). In the middle of the map, many small areas with mostly medium
quality could be found, which are related to all kinds of different CES in the city centre.
Moreover, at the riverside in the south, overlapping areas of nat, aest, and recr could be
found. In the mid-north, the importance of the harbor for cult was highlighted. For edu,
rather small and more distinct areas could be found, that on the one hand relate to
specific places in the city. On the other hand, they relate to nature reserves in the rural
areas (e.g. far west), where edu and nat overlapped.
Figure 16: Overlap between the individual cultural ecosystem services aesthetics and inspiration (aest),knowledge and education (edu), recreation (recr), cultural heritage and identity (cult), natural heritage andintrinsic value of biodiversity (nat), and spiritual and religious (spirit).
0102030405060708090
100
aest edu recr cult nat spirit
% O
verl
ap o
f are
as
aest edu recr cult nat spirit

Characterization of the Urban Region
75
9.2 Perceived Vulnerability
The subsumed area of all areas associated with drought, extreme heat, and extreme
precipitation accounted for 146 km2 (cf. striped areas in Figure 13, Figure 14f).
Hotspots of perceived vulnerability to extreme heat could be found in the city and at the
coastline, particularly the beach area. For drought the participants identified mostly
larger areas in rural locations. For extreme precipitation, the participants delineated
several areas in the city and the hinterland, which highlight the same hotspots as for the
CES namely Warnemünde, the Rostocker Heide, parts of the riverside, and smaller
specific areas in the city centre. The overlay with the CES map revealed that 57-77% of
the CES areas are avoided during or shortly after extreme events (Table 6). In addition,
the number of CES areas was reduced, e.g. for edu from 45 (Table 5, p. 69) to 11 (Table
6).
9.3 Exploring the Categorical Link between Supply and Demand
In general, the importance of the individual CES for wellbeing and the satisfaction with
the supply in the urban region (Appendix A: Questionnaire participatory mapping,
p. 119) were ranked rather high by the participants (Figure 17a and b; cf. Beichler,
2015). For nat and recr (Figure 17a), the mean values for importance for wellbeing
(4.39; 4.64) were significantly higher (p<0.0001) compared to the other CES (aest 3.97;
Table 6: Areal statistics of the overlap between the cultural ecosystem services and perceived vulnerability (CC).
cultural ecosystem services
excluding CC CC overlap
% area
km2
number
knowledge and education (edu) 5 11 73
cultural heritage and identity (cult) 31 14 77
aesthetics and inspiration (aest) 76 25 58
recreation (recr) 70 16 60
natural heritage and intrinsic value of biodiversity (nat) 80 22 57

Characterization of the Urban Region
76
cult 3.91; edu 4.03), whereas the value for spirit (3.00) was significantly lower. The
mean for the satisfaction with supply (Figure 17b) was significantly higher for recr
(4.27; p<0.001) compared to the other CES. No direct relation between the number and
area of services delineated and the satisfaction or the importance for wellbeing was
found.
To test the influence of the social factors (included in the survey) with regard to the
importance for wellbeing and the satisfaction with supply of the individual CES, the 16
factors were grouped to ensure statistical testability (n≥8). The comparison of the social
factors was visualized using grouped boxplots for the importance for wellbeing (Figure
18) and the satisfaction with supply (Figure 17 and Appendix B, p. 126). No general
tendency for all CES regarding the relation between social factors and the importance
for wellbeing and satisfaction with supply was found. Considering the individual CES
and the importance for wellbeing, edu was ranked significantly lower (p<0.01), if the
income was more than 3000 € per month (Figure 18p). For wellbeing, trends (p<0.05)
were found for cult (Figure 18a-residence, l-ecological knowledge, g-house type, j-car
owner), aest (Figure 18f-marital status), and spirit (Figure 18n-education). Considering
the satisfaction with supply, older people (>50 years) ranked nat significantly higher
than younger (<35 years) and cult showed a similar trend (Figure 19c). Furthermore,
trends were found for nat regarding the duration of residence and females ranked the
satisfaction higher for edu and recr (Figure 17a and b). In the context of ecosystem
Figure 17: Ranking for the cultural ecosystem services aesthetics and inspiration (aest), cultural heritage andidentity (cult), knowledge and education (edu), natural heritage and intrinsic value of biodiversity (nat),recreation (recr), and spiritual and religious (spirit) according to a) the importance for wellbeing and b) thesatisfaction with supply. Source: Beichler, 2015.
a) b)

Characterization of the Urban Region
77
services, one could have expected a difference with regard to the living situation (house
type, access to garden, residential property) between people with children and without
children, considering car owners, and according to ecological knowledge or time spent
outdoors. Here, no significant differences were found (cf. Figure 18 and Appendix B)
indicating that no relevant social factors could be found that influenced the spatial
distribution of CES demand.
Figure 18: Comparison of importance for wellbeing (1, not important – 5, very important) for the individualcultural ecosystem services aesthetics and inspiration (aest), cultural heritage and identity (cult), knowledge andeducation (edu), natural heritage and intrinsic value of biodiversity (nat), recreation (recr), and spiritual andreligious (spirit) with regard to grouped social factors a) - p). Source: Beichler, 2015
a) b)
c) d)
e) f)

Characterization of the Urban Region
78
Figure 18: continued from page 77.
k) l)
m) n)
o) p)
g) h)
i) j)

Characterization of the Urban Region
79
9.4 Exploring the Spatial Link between Supply and Demand
In order to explore the spatial link between CES supply and demand, the distance to
home (DTH) was calculated for the individual CES areas delineated by the participants
(Figure 20). The mean value of the DTHs for nat (6.7 km), aest (4.9 km), edu (4.3 km),
recr (5.1 km), and cult (3.8 km) differed significantly (p<0.0001). As indicated in the
boxplots, the standard errors and deviations were rather high (e.g. for nat standard error:
0.4; standard deviation: 4.8), which indicated large fluctuations in the dataset. These
fluctuations could be explained by the methodological design favoring outliers, as
described in detail in Beichler (2015). On the one hand, zero values were related to
areas in the home district. On the other hand, the maximum values differed between the
individual participants. However, the maximum DTHs were around 20 km for each
CES.
Figure 19: Comparison of satisfaction with supply (1, not satisfied – 5, fully satisfied) for the individual cultural ecosystem services aesthetics and inspiration (aest), cultural heritage and identity (cult), knowledgeand education (edu), natural heritage and intrinsic value of biodiversity (nat), recreation (recr), and spiritualand religious (spirit) with regard to grouped social factors a) duration of residence, b) gender, c) age. Source: Beichler, 2015
a) b)
c)
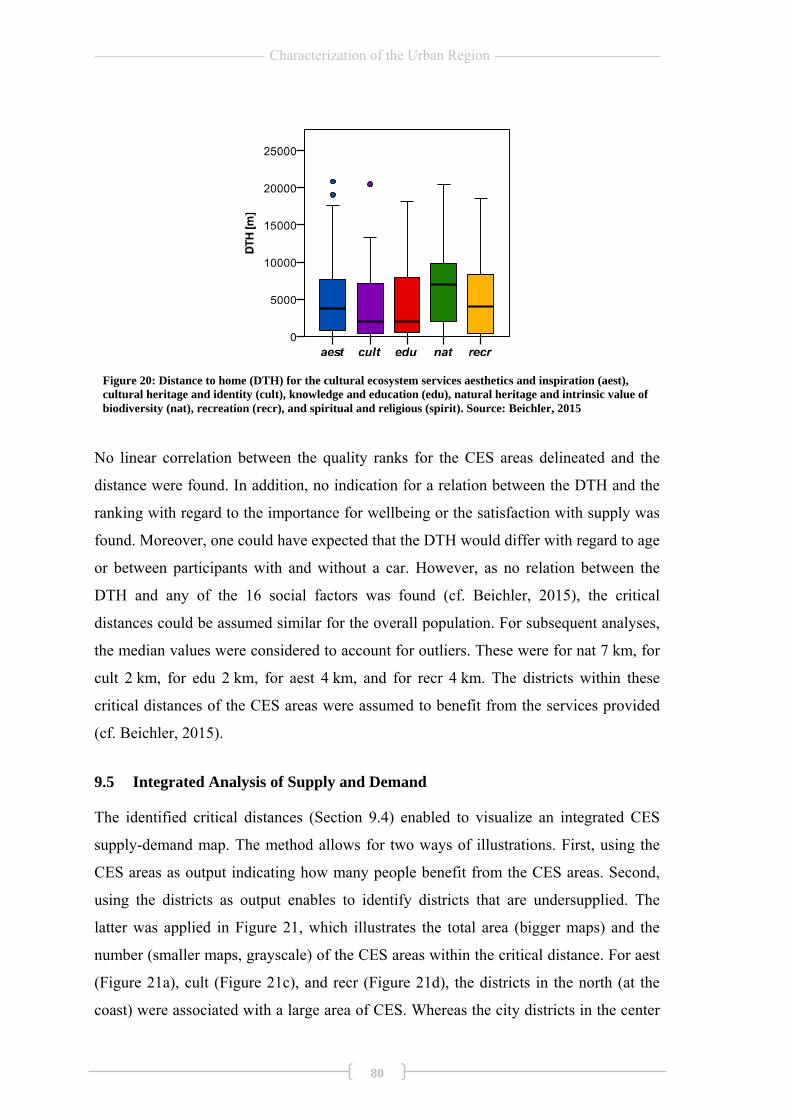
Characterization of the Urban Region
80
No linear correlation between the quality ranks for the CES areas delineated and the
distance were found. In addition, no indication for a relation between the DTH and the
ranking with regard to the importance for wellbeing or the satisfaction with supply was
found. Moreover, one could have expected that the DTH would differ with regard to age
or between participants with and without a car. However, as no relation between the
DTH and any of the 16 social factors was found (cf. Beichler, 2015), the critical
distances could be assumed similar for the overall population. For subsequent analyses,
the median values were considered to account for outliers. These were for nat 7 km, for
cult 2 km, for edu 2 km, for aest 4 km, and for recr 4 km. The districts within these
critical distances of the CES areas were assumed to benefit from the services provided
(cf. Beichler, 2015).
9.5 Integrated Analysis of Supply and Demand
The identified critical distances (Section 9.4) enabled to visualize an integrated CES
supply-demand map. The method allows for two ways of illustrations. First, using the
CES areas as output indicating how many people benefit from the CES areas. Second,
using the districts as output enables to identify districts that are undersupplied. The
latter was applied in Figure 21, which illustrates the total area (bigger maps) and the
number (smaller maps, grayscale) of the CES areas within the critical distance. For aest
(Figure 21a), cult (Figure 21c), and recr (Figure 21d), the districts in the north (at the
coast) were associated with a large area of CES. Whereas the city districts in the center
Figure 20: Distance to home (DTH) for the cultural ecosystem services aesthetics and inspiration (aest), cultural heritage and identity (cult), knowledge and education (edu), natural heritage and intrinsic value of biodiversity (nat), recreation (recr), and spiritual and religious (spirit). Source: Beichler, 2015

Characterization of the Urban Region
81
Figure 21: The integrated supply-demand map showing the supply of the individual districts in terms of number(small maps) and area for a) aest, b) edu, c) cult, d) recr, e) nat (see legend). The darker the color/grey, thebigger the values.
GeoBasis-DE/M-V <2011>
Statistische Ämter des Bundesund der Länder, 2013
0 5 10 15 202.5km
a) b)
c) d)
e)Area (km²) of ecosystem service (seeindividual legends) within the criticaldistance
a) aesthetics & inspiration (aest) -distance 4 kmb) cultural heritage & identity (cult) -distance 2 kmc) knowledge & education (edu) -distance 2 kmd) recreation (recr) - distance 4 kme) natural heritage & intrinsic valueof biodiversity (nat)- distance 7 km
aest_area0.0 - 32.933.0 - 67.367.4 - 103.2103.3 - 137.6137.7 - 170.5
edu_area0.0 - 0.10.2 - 0.30.4 - 1.01.1 - 2.93.0 - 8.1
cult_area0.0 - 3.33.4 - 4.04.1 - 7.37.4 - 25.825.9 - 127.8
recr_area0.0 - 26.426.5 - 111.3111.4 - 137.6137.7 - 145.8145.9 - 148.4
nat_area5.6 - 27.527.6 - 153.9154.0 - 175.8175.9 - 179.6179.7 - 180.2
Number of ecosystem service areas within the critical distance
0 - 34 - 67 - 910 - 1213 - 1516 - 1819 - 2122 - 24
0 10km
-

Characterization of the Urban Region
82
were associated with medium values in terms of area, but the highest values with regard
to the number of areas. Regarding edu (Figure 21b), the hotspots in terms of CES area
and number were equally distributed showing the highest values in the city centre. For
nat (Figure 21e), except for some rural ones, all districts were supplied with a high
number and area of nat. It needs to be acknowledged that the results for the outer rural
districts were not as reliable, as these districts are potentially supplied by CES areas
outside the area under consideration (Beichler, 2015).
9.6 Quantitative Application of the Social-ecological Vulnerability Loop
For the exemplary vulnerability assessment, first, the area and the number of all CES
was accumulated without weighting (Figure 22a and Figure 23a). Furthermore, the
diversity of services was determined for each district (Figure 23c) indicating, which of
the five CES were represented in the accumulated results. These maps served as a basis
for the vulnerability assessment, wherein the areas of perceived vulnerability (Section
9.2) were excluded (Beichler, 2015). The resulting area, number, and diversity of CES
indicate the current vulnerability of the population regarding a decreased supply of CES
(Figure 22b, Figure 23b and d). To enable the comparison of results, the same color
scheme and range was applied.
Figure 22: Integrated ecosystem service supply-demand map of a) the accumulated area in km2 of culturalecosystem services (CES) b) the remaining area of CES excluding areas of perceived vulnerability. Very highvalues are represented in red (hotspots) and very low values in blue (coldspots).
GeoBasis-DE/M-V <2011>Statistische Ämter des Bundes und der Länder, 20130 5 10 15 202.5
km
a) b)
CES area5.6 - 74.975.0 - 103.4103.5 - 223.7223.8 - 403.6403.7 - 546.3546.4 - 625.3

Characterization of the Urban Region
83
The accumulated area of CES (Figure 22a) pointed out hotspots at the Baltic Sea,
particularly in the city districts Rostock-Heide, Rostock Ost, Groß Klein, and
Warnemünde (for names cf. Figure 9, p. 59) as well as the surrounding municipalities in
the hinterland. The exclusion of areas of perceived vulnerability indicated a
considerable loss of CES area, as all hotspots disappeared (cf. Figure 22a and b).
Figure 23: Integrated ecosystem service supply-demand map of a) the accumulated number of culturalecosystem services (CES) within a critical distance, b) the remaining number of CES excluding areas ofperceived vulnerability, c) the diversity of CES, and d) the remaining CES diversity excluding areas ofperceived vulnerability.
GeoBasis-DE/M-V <2011>Statistische Ämter des Bundes und der Länder, 2013
a) b)
d)
CES count3 - 1415 - 2930 - 4344 - 5758 - 7172 - 93
aest_countedu_countrecr_countcult_countnat_count
c)
0 5 10 15 202.5km

Characterization of the Urban Region
84
Comparing the count of CES, the districts at the coast showed only a slight decline
(Figure 23a and b). Yet, the hotspot of the number of CES in the critical distance was in
the city centre, particularly surrounding the Kröpliner-Tor-Vorstadt. Here, a high
decline was indicated, as the number of CES areas halved (Figure 23b). For most of the
districts, areas of all individual CES were within the critical distance (Figure 23c).
However, for some districts at the boundary of the study area, nat was very prominent,
whereas edu and cult were missing.
The comparison considering the diversity of services revealed that particularly the share
of cult, edu, and to some extent recr decreased (Figure 23c and d). The largest changes
could be observed in the city centre, whereas for the districts at the coast, the full
diversity of services was retained (e.g. Graal-Müritz). As such, the population at the
coast seemed to be less vulnerable with regard to the low decrease of CES diversity and
number, although for the CES area a decrease was found. The population in the city
centre seemed to be more vulnerable considering the high decrease in CES number and
diversity as well as the low decrease in CES area.

Integrating Discussion
85
10 INTEGRATING DISCUSSION
This thesis’ objectives are investigating social-ecological system approaches regarding
climate change adaptation in the inter- and transdisciplinary context as well as
developing a method for the spatial characterization of the urban region as a basis for
vulnerability assessment. In this context, a reflection of literature (theoretical/conceptual
part, blue in Figure 1, p. 15) and the development of methods (qualitative and
quantitative application, orange and yellow in Figure 1) is ultimately intended to
contribute to an appropriate knowledge base for climate change adaptation. Therefore,
this section discusses the individual results of the thesis in an integrated manner. The
key findings of the thesis are on the one hand reflected in the light of method
development and related gaps in research. On the other hand, implications for practical
application regarding adaptation are identified.
Several case studies in the context of ecosystem service research have applied
participatory approaches focusing on specific areas, such as a nature reserve (Brown et
al., 2012), small villages (Fagerholm et al., 2012), rural areas (Plieninger et al., 2013) or
solely green areas in cities (Ståhle, 2006). The study presented here (Chapter 9) showed
that a participatory approach is also a valuable tool for a large urban region. The
integration of local knowledge has a high added value for indicator development, as the
results enabled to identify and reflect upon unique characteristics of the case study area.
Here, different groups were formed (environmental NGO, social NGO, planning, etc.)
that could be assigned to be experts. However, no differences between the groups were
found, since the group variability was comparable to the overall variance in the data.
Also from observations during the study, it became obvious that participants rather
referred to their role as citizens. Nevertheless, the group environment during the
mapping exercise positively influenced the results (Hagemeier-Klose et al., 2014). A
limitation of the presented study is that solely cultural ecosystem services were mapped,
not regulating, although regulating services play a crucial role in the context of climate
change (Chapter 4.3.1). However, on the one hand, the survey and the mapping of the
individual CES already took between 1.5-2h. On the other hand, it has been shown that
participants have difficulties to identify regulating services, since knowledge of the
ecological processes is required (Brown et al., 2012). Reflecting the participatory
mapping of perceived vulnerability in this context, it could be assumed that it is easier

Integrating Discussion
86
for people to map out areas, where regulating services are missing, as this can be
directly perceived. In addition, the mapping of regulating services can be done based on
literature, making best use of the knowledge available (de Groot et al., 2010). Here,
especially for cities, sound indicators and empirical studies have been established
(Haase et al., 2014). In contrast, for mapping of cultural ecosystem services, the
involvement of stakeholders is strongly recommended (Fagerholm et al., 2012;
Hernández-Morcillo et al., 2013). Hence, as signalized by means of the knowledge loop,
the integration of local knowledge in the research process enabled to reflect and validate
results. In the context of social-ecological systems theory, cultural ecosystem services
are particularly recommended to identify social-ecological linkages and bridge the gaps
between disciplines (Milcu et al., 2013). Besides the contributions to the scientific
understanding, due to their high societal relevance, cultural ecosystem services
represent the service group most effective for stakeholder engagement (Milcu et al.,
2013). Through the combined mapping of cultural ecosystem services and perceived
vulnerability in the presented study, the participants became aware of the potential value
of ecosystems and potential impacts of climate change. The recognition, framing, and
discussion of problems already present an adaptation, as the adaptive capacity increases
(Chapter 8).
The results of the land use analysis revealed that also streets, housing area, etc. were
included in the spatial units providing ecosystem services (Chapter 9.1). Thus, the
results are associated with the uncertainty, whether or not the participants referred to an
ecosystem. As discussed in Chapter 4.2, definitions of ecosystem vary and for the
assessment, the definition of an ecosystem depends essentially on the scale (Andersson
et al., 2015; Beichler et al., 2017). Interestingly, the size of the area and the quality
value were not correlated and no clear minimum size for the service providing unit was
found. Hence, for a participatory approach, it needs to be acknowledged that people do
not think in scales and the participants did the mapping based on personal experiences,
thus could have located e.g. a pocket park even though it was not displayed on the map,
because of its resolution. In order to validate the CES areas mapped, ground truthing
would be needed, which was here, due to the required investment of time and human
resources, not possible. Nevertheless, the results present a good starting point for future
research on the relative importance of different urban structures for the provision of
ecosystem services. This could help to close the research gap regarding underlying

Integrating Discussion
87
mechanisms that characterize the complex dynamic interactions between social and
ecological structures and processes (Alberti, 2005; Mörtberg et al., 2012; Reyers et al.,
2013). By this means, urban planning could be informed on the one hand with regard to
the potential interaction of green and grey infrastructure, influencing for example the
microclimate (Tiwary and Kumar, 2014). On the other hand, due to the scarcity of
ecosystems and the high population density in the urban centre, even very small
ecological elements such as street trees, green pavements, and green roofs provide
ecosystem services that are of relevance for urban planning (Gómez-Baggethun and
Barton, 2013). A recent study concluded that roadside vegetation contributes to the
provision of multiple ecosystem services with synergies between regulating, habitat,
and cultural ecosystem services (Säumel et al., 2016). Also novel or constructed
ecosystems, such as green roofs have the potential to deliver various ecosystem services
including local climate regulation and habitat (Oberndorfer et al., 2007). However, these
novel ecosystems should not be understood as substitute for natural ecosystems, but
rather as a potential measure in highly modified areas, where returning to the original
ecological status is not possible (Collier, 2014; Kowarik, 2011).
In the presented case study, many multifunctional areas were identified in the urban
region. Due to the overlap, the land use classes related to the single cultural services
need to be carefully examined. The high importance of forest for the provison of nat,
cult, recr, and aest goes in line with other studies on CES and on other groups of
ecosystem services (Burkhard et al., 2012b; van Berkel and Verburg, 2014).
Furthermore, the findings regarding agricultural area and recr are confirmed by a study
among European stakeholders, which revealed that agricultural food production relates
to recreation and tourism (Maes et al., 2011). In the European context, agriculture is
deeply rooted thus relates to tradition and self-image, which is also reflected in EU
policies on cultural landscapes. Yet, this relation depends on the type of agriculture,
since peoples preferences are associated rather with structurally divers cultural
landscapes than with monocultures (Maes et al., 2011). The link to similar land use
classes (especially for high value services) as well as the spatial overlap between
individual CES indicated that the CES occur in bundles and that there is no direct
spatial tradeoff between the individual CES. This holds true as long as the services are
complementary (e.g. nat and aest). However, at the same location, there could be
rivalry, for example in nature protection areas, where recreation possibilities are

Integrating Discussion
88
restricted. The differing land use mix for medium valued CES areas could be related to
the unique characteristics of urban areas (Haase, 2014). As such, with regard to the size,
the CES areas were considerably smaller in the city centre compared to the rural
surroundings. The relation of artificial green, inland water, and pasture to medium
valued areas of nat and cult as well as to edu in general, underlines the importance of
urban green and blue infrastructure for the provision of ecosystem services. This has
been demonstrated in other case studies in urban regions as well (Gómez-Baggethun
and Barton, 2013; McPhearson et al., 2013; Tzoulas et al., 2007). Moreover, the
different land use mix for high and medium valued areas might be explained by the
management related to the land use and its influence on the degree of naturalness. This
can be underlined by case studies on CES showing a clear preference for more natural
ecosystems (Boll et al., 2014; Peña et al., 2015). Furthermore, it could be assumed that
the diversity or the mix and pattern of land use classes could be more important than the
presence of a specific dominant land use type. As such, it could be that a specific land
use type (e.g. an elongated water body) must be present, even if it is just a small share
of the total area that is related to the CES. This connection between the composition of
the landscape and ecosystem services analyzed by means of landscape metrics can be
found in literature as well (Frank et al., 2013; Syrbe and Walz, 2012). Furthermore, the
occurrence of settlements and roads might to some extent be a characteristic factor in
the land use mix of the CES, as these land use classes indicate accessibility. Especially
for cultural ecosystem services, accessibility plays an important role in the assessment
(Maes et al., 2011).
The identification of land use classes associated with the supply of cultural ecosystem
services enables to relate them to local urban and regional development issues. The high
potential of the application of the ecosystem service concept in the context of urban and
regional planning has been highlighted by multiple studies (Hauck et al., 2013; La Rosa
et al., 2015; Martín-López et al., 2013). Thereby, the relation to land use is of high
interest, as related maps are already an inevitable part in the development of plans
(Hauck et al., 2013). The specific land use classes identified here could assist in the
identification of measures directed towards increasing the wellbeing of the population
by means of CES, e.g. promoting the development of urban green or forest areas. In
urban and regional planning, various competing interests, such as residential
development, nature conservation, economic interests, etc. need to be coupled with the

Integrating Discussion
89
need for climate change adaptation. In this regard, it is of high interest to identify
win-win opportunities. For tourism and recreation, a survey among European
stakeholders revealed synergies to biomass energy, flood protection, erosion prevention,
protection of species, and climate regulation (Maes et al., 2011). In addition, there is
already a lot of evidence showing the potential of urban blue and green areas to
contribute to local climate regulation (Breuste et al., 2013b; Larondelle et al., 2014).
The study presented here revealed that CES and regulating services relate to similar
land use classes, such as forest, pastures, artificial green, and inland water. The
development of measures directed towards climate regulation and other regulating
services in combination with CES cannot only deliver an additional argument for
management measures, but might also contribute to the social acceptance of climate
change adaptation.
Considering the analysis of the categorical link between ecosystem service supply and
demand, an innovative method was presented including several social factors and a
ranking according to the importance for wellbeing and the satisfaction with supply in
the urban region for the individual CES (Chapter 9.3). Although the need for research
on the link between ecosystem services and groups of the population or social factors
has been emphasized (Daily et al., 2009; Granek et al., 2010), case studies are rare. In
an attempt to address this research gap, the presented method was developed and tested.
Here, the importance for wellbeing, particularly subjective wellbeing, was assessed
alongside the satisfaction with supply, which turned out to be a valuable factor enabling
a better reflection of the results. From a methodological point of view, it was very
interesting that no direct relation between the number or area of services and the
importance for wellbeing or satisfaction with supply was found. That contradicts some
approaches, where e.g. the frequency of points is used as a measure of importance
(Brown et al., 2012). All values for the importance for wellbeing and the satisfaction
with supply were remarkably high. On the one hand, there could be a positive bias as
the people are proud of their home region. On the other hand, these results go in line
with the high happiness index found particularly for this city region (EEA, 2009).
Although the 5 point Likert scale is often used for participatory approaches (e.g.
Koschke et al., 2012; Scholte et al., 2015; van Berkel and Verburg, 2014; Voigt et al.,
2014), the results of this study suggest that a more detailed valuation scale would have
been preferable to be able to detect potential differences in the overall high values.

Integrating Discussion
90
In the presented study, no relevant differences in the importance for wellbeing or the
satisfaction with supply according to social factors were found (Chapter 9.3). It has to
be acknowledged that the number of participants was too low to be able to combine
social factors to form social groups. Another shortcoming of the study was that all
participants had a rather high education level, which is however often the case for
participatory studies as their interest in attending a study is probably higher. Thus,
further studies to verify the results are required. Thereby, the implications derived from
the explorative study could assist future research. The tendencies identified particularly
for income, residence, and age suggest factors that should definitely be considered.
Including the gender could assist in explaining some variance in the data, as woman had
the tendency to give a higher rating. The most interesting finding in the presented study
is that contrary to the general expectation, no differences between people with children
and without children, according to living situation (house type, access to garden, and
residential property), considering car owners, and according to ecological knowledge or
time spent outdoors were found.
Considering landscape ecology science, the prerequisites for knowledge to be relevant
for decision making are often not met. In this regard the information should allow for
interdisciplinary integration (e.g. between planning sectors) and should be useful for
target setting, discussion, and reflection (Termorshuizen & Opdam 2009). After the
spatial characterization in terms of CES supply (see above), the examination of the
categorical link, thus the demand side, is of high relevance, as it provides information
about who actually benefits from a specific service. Therewith, more specific targets
can be formulated, such as promoting the development of a family friendly
environment. At the same time, the results presented here suggest that other groups of
the population are likely to benefit as well. In the context of climate change, it should be
considered that in case of a shortage in ecosystem service supply, differences according
to social factors could emerge.
Regarding the differences between the individual CES, the low importance of spirit was
expected, as in Northern Germany particularly the religious values included do not play
a major role and besides are related to specific buildings rather than landscape
characteristics. Similar results have been found in the Dutch context (van Berkel and
Verburg, 2014). Nevertheless, it is important to include spirit in assessments as the
complexity of spirituality and religion could be underestimated (Daniel et al., 2012).

Integrating Discussion
91
The high importance of recreation for wellbeing can be found in literature too (van
Berkel and Verburg, 2014). Yet, it should be noted that recreation is also the most often
assessed cultural ecosystem services (Daniel et al., 2012; Milcu et al., 2013; Wolff et
al., 2015). Interestingly, for the urban region of Rostock, the results revealed that nat
and recr are equally important and both are more important for the wellbeing than the
other CES. In combination with the finding that the satisfaction with supply was higher
for recr than for nat, the results suggest that promoting the development of areas that
deliver nat would be beneficial for the population in the urban region. This finding
underlines the benefit of evaluating both importance for wellbeing and satisfaction with
supply, as it enables to identify fields of action in spatial planning. Taking up the
abovementioned topic of win-win opportunities, for the urban region of Rostock, the
requirements for climate change adaptation that relate to future demands could be
coupled with a development directed towards the current demand for nat areas.
In this thesis, a method that gives insights into the spatial link between ecosystem
service supply and demand was presented. The results clearly indicated that the spatial
interrelations of supply and demand by means of the distance to home differed between
individual CES (Chapter 9.4). Interestingly, no relation between the quality ranks of the
areas and the distances was found. As such, also medium valued areas could be in the
maximum distance. Furthermore, no differences according to the 16 social factors, for
example according to age or between people that own cars or not, were found.
However, as the results refer to distances, one limitation of the case study is that the
temporal dimension could not be assessed, as the participants did not specify how they
got to the CES area. Therefore, the Euclidian distance was used here in order to treat all
traveling possibilities equally (pedestrian, bicycle, car, etc.). Thus, the application of the
DTH in the context of ecosystem service research could be further developed by
including traveling aspects, which would enable to calculate the Manhattan distance
(through the network of roads, path, etc.) (Beichler, 2015). Such an approach would
however require a cutback of other factors in the participatory study presented here, due
to the time aspect.
Overall, the DTH results suggest that people accept a longer distance for nat (7 km),
medium distances for recr and aest (4 km), whereas edu and cult should be in shorter
distance (2 km). In line with the findings presented here, a study on city parks revealed
comparably long distances of more than 2 km for recreation, but the majority of park

Integrating Discussion
92
users were from a distance of less than 500 m (Breuste et al., 2013b). The findings of
the presented study considering the spatial link give important insights into the relations
between supply and demand or service-providing-units and service-benefiting-areas,
therewith contributing to filling a gap in research on ecosystem services (Bastian et al.,
2012a; Syrbe and Walz, 2012; Wolff et al., 2015). The spatial link is of particular
importance in the context of cultural ecosystem services, as the areas need to be visited
in order to have a benefit for the wellbeing. Often such specific distances are implicitly
assumed and implemented in studies by means of buffers (e.g. Niemelä et al., 2010).
The results of the presented study provide an empirical basis for such methods and
therefore give implications for future research. Moreover, the distances indicate, at
which point the areas that provide CES are still recognized and thus used. In the context
of urban planning, this information enables to reflect the effect of management
measures also regarding neighboring districts.
The integrated supply-demand maps indicated a difference between the city and the
more rural areas. Yet, for the satisfaction with supply, no significant differences
considering the residence (city or hinterland) were revealed. However, with regard to
importance for wellbeing, there was a trend suggesting that for people living in the city,
cult is more important than for people living in the hinterland. In the same context, a
tendency could be observed for edu (cf. Figure 18a). These findings are supported by
the spatial distribution of the CES that indicated that the city districts were supplied
with a comparably higher number and total area of edu and cult. Although the city
centre was characterized by a comparably lower total area of nat, recr, and aest, the
satisfaction with supply did not differ according to residence. In line with that, one
could assume that for people living in the city, the number of areas and the diversity of
services is essential rather than the total area. Considering nat, it should be noted that
due to the comparably high critical distance (7 km), more rural areas were included,
which also explained the overall high values in terms of total area for nat.
The integrated supply-demand map represents a useful complement to current studies
assessing both, supply and demand of ecosystem services separately (Casado-Arzuaga
et al., 2014; Kroll et al., 2012; Stürck et al., 2014). In contrast to other ecosystem
services, where the spatial link could be assessed by means of biophysical variables
(e.g. pollination, Schulp et al., 2014), for CES the link could be influenced by personal
preferences, the cultural context, and also by the supply-demand deficit itself (Breuste

Integrating Discussion
93
et al., 2013b). The understanding of the categorical and the spatial link for CES could
assist planning in prioritizing areas for management measures. The direct link opens up
many new analytical opportunities. As already noted in Chapter 9.5, the method allows
for two ways of illustration. Thus in order to indicate how many people benefit from a
specific area, the CES areas could be used as an output. To exemplify, as shown by
Palomo et al. (2013) for national parks, the social demand for ecosystem services of
nearby cities should be considered in management plans with regard to the
consequences for the protected area as well as the provision of diverse ecosystem
services required. Furthermore, the method presented in this thesis allows for
differentiating according to social factors (as discussed above) and enables to calculate
the CES per person, which was not done here in order to focus on the spatial
distribution. Such approaches based on distances are to some extent already
implemented in spatial planning, for example to evaluate the potential use of play- and
recreation-grounds, distances according to age groups are applied (Agde and Hünnekes.,
2013). Another example is the calculation of the green or open space provision per
capita, e.g. in a distance of 500 m for Berlin (Berlin, 2013) or 1 km for Munich
(München, 2005). In this regard, a differentiation according to social factors can gives
insights considering social inequities in ecosystem service supply as shown by Kabisch
and Haase (2014) and McPhearson et al. (2013). This is of particular importance given
that in the presented study no differences in the demand was found. Although inner city
CES areas cannot be replaced by areas outside the city (Boll et al., 2014; Breuste et al.,
2013b), based on the presented critical distances, longer distances should be considered
in order to emphasize urban-rural interrelations. It has been shown that there is no
typical rural-urban gradient in ecosystem service supply in European cities (Larondelle
and Haase, 2013). Cities in most cases exhibit a higher demand due to population
density, but despite the limited area, cities do not necessarily provide less ecosystem
services (Kroll et al., 2012; Larondelle and Haase, 2013; Radford and James, 2013).
This is supported by the findings presented here, suggesting that the provision of edu
and cult is higher in the city. In addition, the results suggested that not only the total
area, but also the number of CES areas could be a useful indicator for urban planning.
Thus, understanding ecosystem service supply and demand along rural-urban gradients
could assist urban planning in finding sustainable solutions in managing resources.

Integrating Discussion
94
Excluding the areas of perceived vulnerability enabled to illustrate the potential use of
the integrated supply-demand map in vulnerability assessments (Chapter 9.6). Based
on the results, it was assumed that the demand for CES as well as the critical distances
does not differ with regard to social factors, thus all districts were treated the same way.
Nonetheless, it should be noted that the developed method would allow differentiating
between social factors. As the perceived vulnerability refers to extreme events that
already occur today, the results indicate the current vulnerability to drought, heat wave,
and extreme precipitation. As such, the exposure variable was not future directed. Yet,
this could be extended by studies on climate change impacts. For example, even though
Rostock is a relatively small urban region, a considerable urban heat island effect up to
8°C, an overall increase in temperature, and a strong variability on annual precipitation
quantities were found (Richter et al., 2013). In this connection, the assessment of the
perceived vulnerability revealed that about 60 km2 in the urban region of Rostock are
avoided during heat waves. Especially for cultural ecosystem services, the perceived
vulnerability is crucial as the service benefit is lost, if the areas are not visited (Beichler,
2015). The overlay of the perceived vulnerability and the CES areas already suggested a
high vulnerability considering decreased CES supply. These findings underpin other
studies that showed the impact of climate change on ecosystem services supply
(Mooney et al., 2009; Schröter et al., 2005). Yet, through the integrated supply-demand
map presented here, it was also possible to visualize the consequences of the loss of
CES areas in a spatially explicit way. The results signalized that the vulnerability is
highest for the population in the city centre, especially regarding the loss in number of
CES areas and the diversity of services. For the coastal districts, a decline in CES area
was found, but the overall service diversity was retained. Considering all results
together, it is possible to identify not only where hotspots of vulnerability occur, but
also who is vulnerable, and where adaptation measures would be most efficient. This
information could also assist in prioritizing actions. Taking changes in land use as an
input could inform decision-makers about the potential impact of plans.
As discussed in Chapter 3 and 4, vulnerability and ecosystem service approaches differ
in the way they frame the problem. This discrepancy between studies focusing on
effects on the social system, e.g. different groups of the population, and studies focusing
on processes in the environmental system, e.g. consequences for functions and services
of ecosystems, has also been recognized in literature (Turner and Robbins, 2008).

Integrating Discussion
95
Vulnerability assessments are increasingly requested by decision makers in the context
of climate change adaptation (Hinkel, 2011), which is also the case in the urban region
of Rostock (Othengrafen, 2014). Whereas, the ecosystem service concept has rarely
been implemented in planning (Albert et al., 2014; Daily et al., 2009). It has been
proposed that ecosystem service studies should be more socially relevant, and user-
inspired taking the requirements of decision makers into account (Albert et al., 2014;
Cowling et al., 2008). Thus, the presented combination of the vulnerability approach
(identifying areas with the most urgent need for adaptation) and ecosystem service maps
(implying what might be enhanced) will facilitate the implementation of both of the
concepts into practice. As signalized by means of the first knowledge loop, this requires
an exchange and integration of scientific knowledge related to different disciplines.
Moreover, the transdisciplinary process can feed back into the scientific knowledge
base and enables a cross-fertilization of disciplines (Chapter 8).
Although the definitions related to vulnerability differ significantly, the assessment
approaches exhibit similarities (Chapter 3.2). It is proposed here that the discussion of
the elements of the social-ecological vulnerability loop (Figure 7, p. 52) makes the
theoretical definition of vulnerability elements more tangible, thinking directly of
spatial assessment methods (Chapter 6). In this regard, the results presented could be
complemented with additional data. Here, the perceived vulnerability was used to show
potential changes. Using exposure assessment or different scenarios from traditional
vulnerability assessments could reveal future directed results (Chapter 3). Moreover,
indicators related to sensitivity, such as demographic structure (Chapter 3.2) could be
used to describe the social system and thus to reveal potential changes in ecosystem
service demand (e.g. increased need for recreation). Insights into the potential change of
demand would be particularly interesting, as the scales of the societal demand influence
the spatial pattern of the landscape in a far less obvious way than ecosystem service
provision (Cumming et al., 2012). Raising awareness, teaching, and providing
knowledge about how ecological system function, can influence the demand for
ecosystem services, which might lead to a change in behavior as well as in the limits
related to the coping capacity. Such changes in the supply-demand feedback have
consequences for the overall social-ecological system. The potential for natural
adaptation is often very small in cities due to the high input and modification. In this
regard, as pointed out in Chapter 4.2, research is required to describe the status of the

Integrating Discussion
96
ecological system or its integrity, which would enable to describe the potential changes
in supply more precisely. Moreover, there is evidence that the change in land use could
have a higher effect than climate change (de Chazal and Rounsevell, 2009; Schröter et
al., 2005). Thus, the state of the social-ecological system, described here by means of
supply and demand, could be extended by development scenarios, for example
regarding population development. To conclude, such a set of potential indicators is
rather complex, but underlines the potential cross-fertilization between scientific
disciplines using the proposed framework.
The high added value of intensive interdisciplinary cooperation was also highlighted
reflecting the research process in the project plan B:altic (Chapter 5). For example, the
different disciplinary viewpoints uncovered the various dimensions of adaptive
capacity, which are at the same time related to vulnerability, resilience, and adaptation.
Knowledge, a decisive variable of adaptive capacity, is highly dynamic and thus
changes during the transdisciplinary part of the assessment (Chapter 3), therefore here, a
qualitative method to approach adaptive capacity was presented (Chapter 8). The
decision-makers’ knowledge about climate change and their understanding of the
social-ecological system relates to the adaptive capacity in the response element of the
proposed framework. This in turn is also associated with governmental bodies, the
instruments available, and investment possibilities. Often the administrative scales do
not fit to the ecological scales, where processes take place, which might lead to
mismatches between ecosystem service provision and societal demand (Cumming et al.,
2012). The so called “problem of fit” (Folke et al., 2007) was also discussed in the
context of plan B:altic considering governance aspects (based on the scales proposed by
Cash et al. (2006)) using the social-ecological vulnerability loop (Beichler et al., 2012).
The reflection of the adaptation measures that are under discussion in the urban region
of Rostock (Hansestadt Rostock, 2013) revealed the various jurisdictional levels
involved and potential shortcomings of the single measures proposed as opposed to
long-term strategies (management scale). In the context of another study in the urban
region of Rostock, the stakeholders expressed uncertainty concerning adaptation
options. Short-term measures that are mostly related to technical solutions are regarded
as more realistic, whereas for more long-term ecosystem based solutions, difficulties in
the implementation were pointed out (Othengrafen, 2014). Taking a social-ecological
approach could help to overcome recurring conflicts in the context of adaptation related

Integrating Discussion
97
to short-term needs and long-term vulnerability to climate change. Thereby, response
scenarios could help to identify shortcomings and prevent maladaptation. Different
synergies and conflicts could arise from sectoral adaptation, which underlines the need
for cross-sectoral approaches, an exploration of cross-sectoral impacts, and adaptation
linkages, as well as the importance of a comprehensive strategy taking a systemic
perspective (Hunt and Watkiss, 2011; Reyer et al., 2012).
For both, vulnerability and ecosystem services, the spatial assessment is accompanied
with high uncertainty and maps could be misinterpreted (Hauck et al., 2013; Metzger
and Schröter, 2006). However, the planning phase needs to be open for opportunities
and surprises including aspects of uncertainty and complexity (Cowling et al., 2008). In
this context, a knowledge exchange between science and practice (cf. Chapter 8)
enables a better understanding of the social-ecological system as well as knowledge
building parallel to decision-making process. In this connection, scenario planning has
been shown to be an effective tool considering climate change adaptation and
ecosystem services (Albert et al., 2012; Oteros-Rozas et al., 2015; Rosenberg et al.,
2014). In the context of plan B:altic, the scenario process initiated a stakeholder dialog
in urban region of Rostock offering a possibility to cope with challenges related to
uncertainty and complexity (Hagemeier-Klose et al., 2013). This process, however, was
conducted alongside the analysis presented in this thesis, thus the results could not be
implemented. Nonetheless, the process provided valuable information to reflect upon
the findings. It would be very interesting to further investigate the potential of the
integrated vulnerability assessment including ecosystem services as proposed here in a
transdisciplinary scenario process.

Conclusion
98
11 CONCLUSION
In order to unravel the complex characteristics of social-ecological systems and issues
related to climate change, an interdisciplinary research perspective as well as
transdisciplinary approaches are crucial. Against this background, the presented thesis
investigated approaches from various disciplines, while reflecting upon the
consideration of social-ecological aspects. This provided the basis for the development
of the integrated framework: the social-ecological vulnerability loop. Hereby, the
practical applicability was emphasized following the objective of developing a method
for the spatial characterization of the urban region. Based on the data derived through a
transdisciplinary process, methods directed towards the understanding of adaptive
capacity and the linkages between ecosystem service supply and demand were applied
in the urban region of Rostock. Finally, this overall research process enables to answer
the main research questions formulated in the beginning:
• Which theoretical frameworks can be used to describe the vulnerability of
social-ecological systems?
• How can the different concepts be integrated to describe the vulnerability of the
social-ecological system and its dynamics?
• Which methods can be used to characterize the social-ecological system
quantitatively as a basis for vulnerability assessment?
• How can the adaptive capacity of a social-ecological system be characterized
and evaluated in the face of climate change?
• Which interrelations between the social and the ecological system can be found
and what are implications regarding potential impacts of climate change?
11.1 Which theoretical frameworks can be used to describe the vulnerability of
social-ecological systems?
Many studies have looked into the subjects of vulnerability, ecosystem services, social-
ecological system, and resilience in the last years. Differing disciplinary dialects, which
became also apparent in the interdisciplinary process, complicate a comparison. It can
be concluded that all approaches conceptually overlap at some point, take inherently a
social-ecological approach, and are open for application in various fields, signalizing
the need for integration in order to exploit synergies. Focusing on the potential for

Conclusion
99
operationalization of the different approaches in an integrated manner, the definitions of
the vulnerability elements was taken rather generally considering their “everyday
language use” as suggested by Wolf (2012). This rather open notion enabled an open
process of interdisciplinary reflection. The comparison of vulnerability indicators
revealed that in the practical application, the differences in the conceptual approaches
become obscure. In this regard, a consistency among sensitivity approaches was found,
yet for adaptive capacity, one could conclude that a spatially explicit assessment is not
applicable at the local scale. Furthermore, through a detailed evaluation of the
ecosystem service concept, focusing on the complex horizontal and vertical urban
structures, valuable insights into the limits of the concept were derived. To overcome
these challenges, it was argued here that future applications should address the issues of
human modification and human input. Moreover, whereas vulnerability studies tend to
focus on people, the direct link to social factors has so far been understudied in
ecosystem service research. Here, two dimensions have been identified, the categorical
link referring to the importance of ecosystem services for wellbeing in relation to social
factors and the spatial link between the ecosystem service supply areas and the location
of the beneficiaries. Furthermore, the discussion of the individual elements of a
resilience definition enabled to identify disciplinary differences and boundaries, which
in scientific publications often remain unexpressed. In this regard, insights in the
ambiguous use of the word impact, the dimensions of adaptive capacity and uncertainty,
and the scales that relate to the comprehension of the social-ecological system’s
structural and functional properties were given. In conclusion, resilience opens up a
wide perspective to approach complex coupled social-ecological systems, which is
useful to reflect upon approaches. Yet at the same time, the openness hampers the
development of definite assessment methods.
11.2 How can the different concepts be integrated to describe the vulnerability of
the social-ecological system and its dynamics?
The DPSIR framework turned out to be a valuable tool to integrate the different
concepts, as it provides a pragmatically and straightforward way to organize the
vulnerability elements, structure the steps of analysis, and think about potential spatial
indicators. Although the resulting framework differs from traditional DPSIR
applications, due to the novel combination of concepts, it can be understood as an
operationalization of the vulnerability approach and the ecosystem service approach at

Conclusion
100
the same time. By untangling the main features of the social system, the ecological
system, and their interactions as well as feedbacks that influence the social-ecological
system as a whole, the proposed framework fosters a balanced focus on both systems.
As such, the development of the integrated approach enabled to recognize important
features within the existing frameworks and overcome some of the signalized problems.
By taking a systemic perspective, the social-ecological vulnerability loop opens up new
questions for research, wherein the concepts can mutually enrich one another.
In conclusion, the social-ecological vulnerability loop is an innovative approach to
describe complex social-ecological systems, combining the vulnerability concept and
the concept of ecosystem service supply and demand. It allows identifying the dynamics
between the elements of the social-ecological system and to link responses to
consequences for the whole system. Therewith, it creates an analytical framework for a
structured analysis of essential characteristics of social-ecological systems.
11.3 How can the adaptive capacity of a social-ecological system be characterized
and evaluated in the face of climate change.
Adaptive capacity has various dimensions, the short-term coping capacity related to the
pressure, the long-term adaptive capacity related to the state and the impact, and the
adaptive capacity in the response element. It has been highlighted that current mapping
approaches could be misleading, since adaptive capacity can hardly be separated from
the sensitivity factors and since knowledge, a decisive variable of adaptive capacity, is
highly dynamic. To overcome these challenges here, a novel combination of inter- and
transdisciplinary methods was presented. The dynamic knowledge loop explores the
process of knowledge generation and exchange as well as the integration of different
forms of knowledge such as scientific, local, and practical knowledge. The previous
sections already pointed at the importance of the science-science loop to combine the
knowledge of adaptation from different disciplines. The practice-science cooperation,
which was realized through participatory mapping, revealed not solely valuable local
data for analysis, but the process itself triggered reflections, discussions, and problem
framing with regard to the value of ecosystems and potential impacts of climate change.
The science-practice exchange of results during the scenario process in turn led in
addition to a problem discussion. In conclusion, the qualitative application formed a
complex picture enabling a qualitative description of the adaptive capacity, while at the
Conclusion
101
same time enhancing it through the increased understanding of social-ecological system
under climate change. As the adaptive capacity directly relates to the response element,
a follow up study investigating the transfer of knowledge into practice-practice
cooperation would be highly interesting.
11.4 Which methods can be used to characterize the social-ecological system
quantitatively as a basis for vulnerability assessment?
The innovative methods developed in this thesis enable to answer the questions, how
and where CES are produced and who benefits where. Just recently, this has been
acknowledged as a recurring gap in research on ecosystem services (Bennett et al.,
2015). It has been demonstrated that a participatory mapping can be applied in a large
urban region. The investigation of the relation to land use classes highlighted
differences between high and medium valued CES areas and the link to other groups of
ecosystem services. Moreover, it has been shown that an evaluation of the satisfaction
with supply is an important complement to evaluations of the importance for wellbeing.
The developed method enables to address the research gap in the direct link between
supply and demand. First, the relation between the importance for wellbeing and social
factors gave insights into the categorical link. Second, the spatial link between
population and CES areas was established by means of critical distances. This
methodological improvement on the one hand contributes to an enhanced understanding
of the supply-demand relationships. On the other hand, this comprehensive
characterization of the social-ecological system provides a basis for vulnerability
assessment. The quantitative application of the social-ecological vulnerability allowed
identifying, where hotspots of vulnerability occur, who is vulnerable, and thus where
adaptation measures would be most efficient.
11.5 Which interrelations between the social and the ecological system can be
found and what are implications regarding climate change adaptation?
Contrary to the initial assumption, no significant differences according to social factors
were found, neither for the importance for wellbeing nor for the spatial link between
supply and demand. Thus, in can be concluded that the loss of CES has the same
influence on the overall population. However, additional studies on this topic are
definitely needed, wherefore here, potential for improvement was suggested.

Conclusion
102
Assessing the spatial distribution of CES enabled to relate them to local urban and
regional development issues. In addition, through the integrated supply-demand map, it
was possible to visualize the consequences of the loss of CES areas in a spatially
explicit way. It has been highlighted that promoting the generation of CES is likely to
create win-win opportunities in the context of climate change adaptation. In this regard,
it was remarkable that recr and nat were both the highest valued CES regarding the
importance for wellbeing, whereas for nat a lower satisfaction with supply was
indicated. The high societal relevance of cultural ecosystem service can influence the
willingness to invest into measures aiming at a multi-functional landscape. In this
connection, critical distances for the individual CES as proposed here, enable to reflect
measure in terms of their effect on the population, which might also be more distant
(7 km for nat). In combination with the integrated supply-demand vulnerability maps,
the results allow prioritizing areas for management measures. Furthermore, the
integrated supply-demand map enabled to visualize differences between the city, the
hinterland, and coastal areas. Hereby, it was highlighted that the total area, the number,
and the diversity of services are key factors to characterize urban regions.
Understanding the linkages in the social-ecological system are crucial in the context of
climate change adaptation, as the detected differences along the urban-rural gradient
emphasized the importance of reflecting appropriate scales of governance. In addition,
changes in the supply-demand feedback (through an impact on the social or the
ecological system) have consequences for the overall social-ecological system.
In conclusion, the application of the social-ecological vulnerability loop presented in
this thesis can assist planning in formulating targets, identifying suitable areas,
reflecting the effect of measures, and identify potential shortcomings. Furthermore, the
social-ecological vulnerability loop can serve as a basis for interdisciplinary and
transdisciplinary discussions. This enabled to transparently report on limitations of the
study and showed, how the results of different scientific disciplines could feed into the
assessment emphasizing the potential for cross-fertilization of disciplines.

References
103
12 REFERENCES
Adger, W.N., 2006. Vulnerability. Global Environmental Change 16, 268–281.
Adger, W.N., Dessai, S., Goulden, M., Hulme, M., Lorenzoni, I., Nelson, D.R., Naess, L.O., Wolf, J.,Wreford, A., 2009. Are there social limits to adaptation to climate change ? Climatic Change 93, 335–354.
Adger, W.N., Hughes, T.P., Folke, C., Carpenter, S.R., Rockström, J., 2005. Social-ecological resilience to coastal disasters. Science 309, 1036–1039.
Agde, G., Hünnekes., H.D.A., 2013. Spielplätze und Freiräume zum Spielen: ein Handbuch für Planung und Betrieb. Deutsches Institut für Normung e.V, Beuth.
Ahern, J., 2012. Urban landscape sustainability and resilience : the promise and challenges of integrating ecology with urban planning and design. Landscape Ecology 28, 1203–1212.
Albert, C., Hauck, J., Buhr, N., von Haaren, C., 2014. What ecosystem services information do users want? Investigating interests and requirements among landscape and regional planners in Germany. Landscape Ecology 29, 1301–1313.
Albert, C., Zimmermann, T., Knieling, J., von Haaren, C., 2012. Social learning can benefit decision-making in landscape planning: Gartow case study on climate change adaptation, Elbe valley biosphere reserve. Landscape and Urban Planning 105, 347–360.
Alberti, M., 2005. The Effects of Urban Patterns on Ecosystem Function. International Regional Science Review 28, 168–192.
Andersson, E., McPhearson, T., Kremer, P., Gomez-Baggethun, E., Haase, D., Tuvendal, M., Wurster, D., 2015. Scale and context dependence of ecosystem service providing units. Ecosystem Services 12, 157–164.
Angelstam, P., Elbakidze, M., Axelsson, R., Dixelius, M., To, J., Törnblom, J., 2013. Knowledge Production and Learning for Sustainable Landscapes : Seven Steps Using Social – Ecological Systems as Laboratories. Ambio 42, 116–128.
Baró, F., Haase, D., Gómez-Baggethun, E., Frantzeskaki, N., 2015. Mismatches between ecosystem services supply and demand in urban areas: A quantitative assessment in five European cities. Ecological Indicators 55, 146–158.
Bastian, O., Grunewald, K., Syrbe, R.-U., 2012a. Space and time aspects of ecosystem services, using the example of the EU Water Framework Directive. International Journal of Biodiversity Science, Ecosystem Services & Management 8, 37–41.
Bastian, O., Haase, D., Grunewald, K., 2012b. Ecosystem properties, potentials and services – The EPPS conceptual framework and an urban application example. Ecological Indicators 21, 7–16.
Bastian, O., Syrbe, R.-U., Rosenberg, M., Rahe, D., Grunewald, K., 2013. The five pillar EPPS framework for quantifying, mapping and managing ecosystem services. Ecosystem Services 4, 15–24.

References
104
Beichler, S.A., 2015. Exploring the link between supply and demand of cultural ecosystem services – towards an integrated vulnerability assessment. International Journal of Biodiversity Science, Ecosystem Services & Management 11, 250–263.
Beichler, S.A., Bastian, O., Haase, D., Heiland, S., Kabisch, N., Müller, F., 2017. Does the Ecosystem Service Concept Reach its Limits in Urban Environments? Landscape online.
Beichler, S.A., Davidse, B.J., Deppisch, S., 2012. Dynamics of a social-ecological system under climate change – searching for a match with levels of governance, in: EURA Conference. Vienna, Austria.
Beichler, S.A., Hasibovic, S., Davidse, B.J., Deppisch, S., 2014. The role played by social-ecological resilience as a method of integration in interdisciplinary research. Ecology and Society 19, 1–8.
Bennett, E.M., Cramer, W., Begossi, A., Cundill, G., Díaz, S., Egoh, B.N., Geijzendorffer, I.R., Krug, C.B., Lavorel, S., Lazos, E., Lebel, L., Martín-López, B., Meyfroidt, P., Mooney, H.A., Nel, J.L., Pascual, U., Payet, K., Harguindeguy, N.P., Peterson, G.D., Prieur-Richard, A.H., Reyers, B., Roebeling, P., Seppelt, R., Solan, M., Tschakert, P., Tscharntke, T., Turner, B.L., Verburg, P.H., Viglizzo, E.F., White, P.C.L., Woodward, G., 2015. Linking biodiversity, ecosystem services, and human well-being: three challenges for designing research for sustainability. Current Opinion in Environmental Sustainability 14, 76–85.
Berlin, 2013. Berliner Senatsverwaltung für Stadtenwicklung und Umwelt: Versorgung mit öffentlichem wohnungsnahen Grünanlagen [WWW Document]. http://www.stadtentwicklung.berlin.de/umwelt/umweltatlas/da605_01.htm.
Bezák, P., Lyytimäki, J., 2011. Complexity of urban ecosystem services in the context of global change. Ekologia 30, 22–35.
Bhaskar, R., Frank, C., Høyer, K.G., Petter, N., Parker, J. (Eds.), 2010. Interdisciplinarity and climate change: Transforming knowledge and practice for our global future. Routledge, London, NewYork.
Birkmann, J., Dech, S., Gähler, M., Krings, S., Kühling, W., Meisel, K., 2010. Abschätzung der Verwundbarkeit gegenüber Hochwasserereignissen auf kommunaler Ebene. Bundesamt für Bevölkerungsschutz und Katastrophenhilfe (BBK), Praxis im Bevölkerungsschutz, Band 4, Bonn.
Boll, T., von Haaren, C., von Ruschkowski, E., 2014. The Preference and Actual Use of Different Types of Rural Recreation Areas by Urban Dwellers — The Hamburg Case Study. PloS one 9, 1–11.
Bolund, P., Hunhammar, S., 1999. Ecosystem services in urban areas. Ecological Economics 29, 293–301.
Breuste, J., Haase, D., Elmqvist, T., 2013a. Urban Landscapes and Ecosystem Services, in: Wratten, S., Sandhu, H., Cullen, R., Costanza, R. (Eds.), Ecosystem Services in Agricultural and Urban Landscapes. John Wiley & Sons, Oxford, pp. 83–104.
Breuste, J., Qureshi, S., Li, J., 2013b. Scaling down the ecosystem services at local level for urban parks of three megacities. Hercynia N. F. 46, 1–20.

References
105
Brooks, N., Adger, W.N., Kelly, P.M., 2005. The determinants of vulnerability and adaptive capacity at the national level and the implications for adaptation. Global Environmental Change 15, 151–163.
Brown, G., Montag, J.M., Lyon, K., 2012. Public Participation GIS: A Method for Identifying Ecosystem Services. Society & Natural Resources 25, 633–651.
Brown, G., Reed, P., 2012. Social Landscape Metrics : Measures for Understanding Place Values from PPGIS. Landscape Research 37, 73–90.
Brown, H., Spickett, J., Katscherian, D., 2014. A health impact assessment framework for assessing vulnerability and adaptation planning for climate change. International Journal of Environmental Research and Public Health 11, 12896–914.
Bruckmeier, K., 2012. Problems of cross-scale coastal management in Scandinavia. Regional Environmental Change 14, 2151–2160.
Bryan, B.A., Raymond, C.M., Crossman, N.D., Macdonald, D.H., 2010. Targeting the management of ecosystem services based on social values: Where, what, and how? Landscape and Urban Planning 97, 111–122.
Buller, H., 2008. The lively process of interdisciplinarity. Area 41, 395–403.
Burkhard, B., de Groot, R., Costanza, R., Seppelt, R., Jørgensen, S.E., Potschin, M., 2012a. Solutions for sustaining natural capital and ecosystem services. Ecological Indicators 21, 1–6.
Burkhard, B., Kandziora, M., Hou, Y., Müller, F., 2014. Ecosystem service potentials, flows and demands-concepts for spatial localisation, indication and quantification. Landscape Online 34, 1–32.
Burkhard, B., Kroll, F., Müller, F., Windhorst, W., 2010a. Landscapes‘ Capacities to Provide Ecosystem Services – a Concept for Land-Cover Based Assessments. Landscape Online 15, 1–22.
Burkhard, B., Kroll, F., Nedkov, S., Müller, F., 2012b. Mapping ecosystem service supply, demand and budgets. Ecological Indicators 21, 17–29.
Burkhard, B., Petrosillo, I., Costanza, R., 2010b. Ecosystem services – Bridging ecology, economy and social sciences. Ecological Complexity 7, 257–259.
Carpenter, S., Walker, B., Anderies, J.M., Abel, N., 2001. From Metaphor to Measurement: Resilience of What to What? Ecosystems 4, 765–781.
Casado-Arzuaga, I., Onaindia, M., Madariaga, I., Verburg, P.H., 2014. Mapping recreation and aesthetic value of ecosystems in the Bilbao Metropolitan Greenbelt (northern Spain) to support landscape planning. Landscape Ecology 29, 1393–1405.
Cash, D.W., Adger, W.N., Berkes, F., Garden, P., Lebel, L., Olsson, P., Pritchard, L., Young, O., 2006. Scale and Cross-Scale Dynamics: Governance and Information in a Multilevel World. Ecology and Society 11, art8.
Chan, K.M.A., Guerry, A.D., Balvanera, P., Klain, S., Satterfield, T., Basurto, X., Bostrom, A., Chuenpagdee, R., Gould, R., Halpern, B.S., Levine, J., Norton, B., Ruckelshaus, M., Russell, R., Tam, J., Hannahs, N., Woodside, U., 2012. Where are Cultural and Social in Ecosystem Services? A Framework for Constructive Engagement. BioScience 62, 744–756.

References
106
Collier, M.J., 2014. Novel ecosystems and the emergence of cultural ecosystem services. Ecosystem Services 9, 166–169.
Costanza, R., D’Arge, R., De Groot, R., Farber, S., Grasso, M., Hannon, B., Limburg, K., Naeem, S., O’Neill, R. V, Paruelo, J., Raskin, R.G., Sutton, P., Van den Belt, M., 1997. The Value of the World’ s Ecosystem Services and Natural Capital. Nature 387, 253–260.
Cowling, R.M., Egoh, B., Knight, A.T., O’Farrell, P.J., Reyers, B., Rouget, M., Roux, D.J., Welz, A., Wilhelm-Rechman, A., 2008. An operational model for mainstreaming ecosystem services for implementation. Proceedings of the National Academy of Sciences 105, 9483–9488.
Crossman, N.D., Burkhard, B., Nedkov, S., 2012. Quantifying and mapping ecosystem services. International Journal of Biodiversity Science, Ecosystem Services & Management 8, 37–41.
Crossman, N.D., Burkhard, B., Nedkov, S., Willemen, L., Petz, K., Palomo, I., Drakou, E.G., Martín-Lopez, B., McPhearson, T., Boyanova, K., Alkemade, R., Egoh, B., Dunbar, M.B., Maes, J., 2013. A blueprint for mapping and modelling ecosystem services. Ecosystem Services 4, 4–14.
Cumming, G.S., Olsson, P., Chapin III, F., Holling, C., 2012. Resilience, experimentation, and scale mismatches in social-ecological landscapes. Landscape Ecology 28, 1139-1150
Currie, W.S., 2011. Tansley review units of nature or processes across scales ? The ecosystem concept at age 75. New Phytologist 190, 21–34.
Daily, G.C., 1997. Nature’s services: societal dependence on natural ecosystems. Island Press, Washigton DC.
Daily, G.C., Polasky, S., Goldstein, J., Kareiva, P.M., 2009. Ecosystem services in decision making: time to deliver. Front. Ecol. Environ. 7, 21–28.
Daniel, T.C., Muhar, A., Arnberger, A., Aznar, O., Boyd, J.W., Chan, K.M.A., Costanza, R., Elmqvist, T., Flint, C.G., Gobster, P.H., Grêt-Regamey, A., Lave, R., Muhar, S., Penker, M., Ribe, R.G., Schauppenlehner, T., Sikor, T., Soloviy, I., Spierenburg, M., 2012. Contributions of cultural services to the ecosystem services agenda. Proceedings of the National Academy of Sciences 109, 8812–8819.
De Chazal, J., Quetier, F., Lavorel, S., Vandoorn, A., 2008. Including multiple differing stakeholder values into vulnerability assessments of socio-ecological systems. Global Environmental Change 18, 508–520.
De Chazal, J., Rounsevell, M.D.A., 2009. Land-use and climate change within assessments of biodiversity change: A review. Global Environmental Change 19, 306–315.
de Groot, R.S., Wilson, M.A., Boumans, R.M.J., 2002. A typology for the classification, description and valuation of ecosystem functions, goods and services. Ecological Economics 41, 393-408.
de Groot, R.S.S., Alkemade, R., Braat, L., Hein, L., Willemen, L., 2010. Challenges in integrating the concept of ecosystem services and values in landscape planning, management and decision making. Ecological Complexity 7, 260–272.

References
107
De Lange, H.J., Sala, S., Vighi, M., Faber, J.H., 2010. Ecological vulnerability in risk assessment--a review and perspectives. The Science of the Total Environment 408, 3871–9.
Deppisch, S., Hasibovic, S., 2013. Social-ecological resilience thinking as a bridging concept in transdisciplinary research on climate-change adaptation. Natural hazards 67, 117-127.
EEA, 1999. Environmental indicators : Typology and overview, Technical Report 25 European Environment Agency. Copenhagen.
EEA, 2009. Ensuring quality of life in Europe’s cities and towns - Tackling the environmental challenges driven by European and global change, Report No 5/2009 European Environment Agency. Copenhagen.
Ehrlich, P.R., Ehrlich, A., 1981. Extinction: The Causes and Consequences of the Disappearance of Species. Random House, New York.
Engle, N.L., 2011. Adaptive capacity and its assessment. Global Environmental Change 21, 647–656.
Fagerholm, N., Käyhkö, N., 2009. Participatory mapping and geographical patterns of the social landscape values of rural communities in Zanzibar, Tanzania. Fennia 187, 43–60.
Fagerholm, N., Käyhkö, N., Ndumbaro, F., Khamis, M., 2012. Community stakeholders’ knowledge in landscape assessments – Mapping indicators for landscape services. Ecological Indicators 18, 421–433.
Fekete, A., 2009. Validation of a social vulnerability index in context to river-floods in Germany. Natural Hazards and Earth System Science 9, 393–403.
Folke, C., 2006. Resilience: The emergence of a perspective for social–ecological systems analyses. Global Environmental Change 16, 253–267.
Folke, C., Carpenter, S., Walker, B., Scheffer, M., Chapin, T., Rockström, J., 2010. Resilience thinking: Integrating resilience, adaptability and transformability. Ecology and Society 15, art20.
Folke, C., Jr, L.P., Berkes, F., Colding, J., Svedin, U., 2007. The problem of fit between ecosystems and institutions: Ten years later. Ecology and Society 12, art30.
Frank, S., Fürst, C., Koschke, L., Witt, A., Makeschin, F., 2013. Assessment of landscape aesthetics - Validation of a landscape metrics-based assessment by visual estimation of the scenic beauty. Ecological Indicators 32, 222–231.
Füssel, H.-M., 2007. Vulnerability: A generally applicable conceptual framework for climate change research. Global Environmental Change 17, 155–167.
Füssel, H.-M., 2010. How inequitable is the global distribution of responsibility, capability, and vulnerability to climate change: A comprehensive indicator-based assessment. Global Environmental Change 20, 597–611.
Gallopín, G.C., 2006. Linkages between vulnerability, resilience, and adaptive capacity. Global Environmental Change 16, 293–303.
Gómez-Baggethun, E., Barton, D.N., 2013. Classifying and valuing ecosystem services for urban planning. Ecological Economics 86, 235–245.
References
108
Granek, E.F., Polasky, S., Kappel, C. V, Reed, D.J., Stoms, D.M., Koch, E.W., Kennedy, C.J., Cramer, L.A., Hacker, S.D., Barbier, E.B., Aswani, S., Ruckelshaus, M., Perillo, G.M.E., Silliman, B.R., Muthiga, N., Bael, D., Wolanski, E., 2010. Ecosystem services as a common language for coastal ecosystem-based management. Conservation Biology 24, 207–16.
Grimm, N.B., Faeth, S.H., Golubiewski, N.E., Redman, C.L., Wu, J., Bai, X., Briggs, J.M., 2008. Global change and the ecology of cities. Science 319, 756–760.
Gunderson, L.H., Holling, C.S., 2002. Panarchy: Understanding Transformations in Human and Natural Systems, Environmental management. Island Press.
Haase, D., 2014. How Is Urban Land Use Unique ?, in: Seto, K.C., Reenberg, A. (Eds.), Rethinking Global Land Use in an Urban Era. Cambridge, MA, pp. 299–311.
Haase, D., Larondelle, N., Andersson, E., Artmann, M., Borgström, S., Breuste, J., Gomez-Baggethun, E., Gren, Å., Hamstead, Z., Hansen, R., Kabisch, N., Kremer, P., Langemeyer, J., Rall, E.L., McPhearson, T., Pauleit, S., Qureshi, S., Schwarz, N., Voigt, A., Wurster, D., Elmqvist, T., 2014. A quantitative review of urban ecosystem service assessments: concepts, models, and implementation. Ambio 43, 413–33.
Hagemeier-Klose, M., Albers, M., Beichler, S., Davidse, B., Deppisch, S., Hasibovic, S., Richter, M., 2012. Ergebnisbericht des 3. Szenario-Workshops. https://www.hcu-hamburg.de/research/forschungsprojekte/ koordinierte-projekte/planbaltic/informationsmaterial/. Accessed 28 August 2013.
Hagemeier-Klose, M., Albers, M., Richter, M., Deppisch, S., 2013. Szenario-Planung als Instrument einer „klimawandelangepassten“ Stadt- und Regionalplanung – Bausteine der zukünftigen Flächenentwicklung und Szenarienkonstruktion im Stadt-Umland-Raum Rostock. Raumforschung und Raumordnung 71, 413–426.
Hagemeier-Klose, M., Beichler, S.A., Davidse, B.J., Deppisch, S., 2014. The Dynamic Knowledge Loop: Inter- and Transdisciplinary Cooperation and Adaptation of Climate Change Knowledge. International Journal of Disaster Risk Science 5, 21–32.
Haines-Young, R., Potschin, M., 2010. The links between biodiversity, ecosystem services and human well-being, in: David, G.R., Frid, C.L.J. (Eds.), Ecosystem Ecology: A New Synthesis. Cambridge University Press, Cambridge.
Haines-Young, R., Potschin, M., 2013. Common International Classification of Ecosystem Services (CICES, Version 4. 3 ), Consultation on Version 4. Report to the European Environment Agency, EEA Framework Contract No EEA/IEA/09/003.
Hansestadt Rostock, 2013. Rahmenkonzept zur Anpassung an den Klimawandel in der Hansestadt Rostock. Amt für Umweltschutz, Rostock, Germany.
Hauck, J., Görg, C., Varjopuro, R., Ratamäki, O., Maes, J., Wittmer, H., Jax, K., 2013. “Maps have an air of authority”: Potential benefits and challenges of ecosystem service maps at different levels of decision making. Ecosystem Services 4, 25–32.
Hermann, A., Schleifer, S., Wrbka, T., 2011. The Concept of Ecosystem Services Regarding Landscape Research: A Review. Living Reviews in Landscape Research 1, 1–37.

References
109
Hernández-Morcillo, M., Plieninger, T., Bieling, C., 2013. An empirical review of cultural ecosystem service indicators. Ecological Indicators 29, 434–444.
Hinkel, J., 2011. “Indicators of vulnerability and adaptive capacity”: Towards a clarification of the science–policy interface. Global Environmental Change 21, 198–208.
Hinkel, J., Klein, R.J.T., 2009. Integrating knowledge to assess coastal vulnerability to sea-level rise: The development of the DIVA tool. Global Environmental Change 19, 384–395.
Hobbs, R.J., Arico, S., Aronson, J., Baron, J.S., Bridgewater, P., Cramer, V.A., Epstein, P.R., Ewel, J.J., Klink, C.A., Lugo, A.E., Norton, D., Ojima, D., Richardson, D.M., Sanderson, E.W., Valladares, F., Vila, M., Zamora, R., Zobel, M., 2006. Novel ecosystems: theoretical and management aspects of the new ecological world order. Global Ecology and Biogeography 15, 1–7.
Hufschmidt, G., 2011. A comparative analysis of several vulnerability concepts. Natural Hazards 58, 621–643.
Hunt, A., Watkiss, P., 2011. Climate change impacts and adaptation in cities : a review of the literature. Climatic Change 104, 13–49.
Hutton, C.W., Kienberger, S., Amoako Johnson, F., Allan, A., Giannini, V., Allen, R., 2011. Vulnerability to climate change: people, place and exposure to hazard. Advances in Science and Research 7, 37–45.
Huutoniemi, K., Klein, J.T., Bruun, H., Hukkinen, J., 2010. Analyzing interdisciplinarity: Typology and indicators. Research Policy 39, 79–88.
IPCC, 2001. Climate Change 2001 : Impacts, Adaptation, and Vulnerability. University Press, Cambridge.
IPCC, 2007. Climate Change 2007 : Impacts, Adaptation and Vulnerability Working Group II Contribution to the Intergovernmental Panel on Climate Change Fourth Assessment Report of the Intergovernmental Panel on Climate Change, Intergovernmental Panel on Climate Change. Cambridge University Press, Cambridge, UK.
IPCC, 2012. Managing the Risks of Extreme Events and Disasters to Advance Climate Change Adaptation. A Special Report of Working Groups I and II of the Intergovernmental Panel on Climate Change. Cambridge University Press, Cambridge, UK, and New York, NY, USA.
IPCC, 2014. Climate Change 2014: Impacts, Adaptation, and Vulnerability. Part B: Regional Aspects. Contribution of Working Group II to the Fifth Assessment Report of the Intergovernmental Panel on Climate Change. Cambridge University Press, Cambridge, United Kingdom and New York, NY, USA.
Kabisch, N., Haase, D., 2014. Green justice or just green? Provision of urban green spaces in Berlin, Germany. Landscape and Urban Planning 122, 129–139.
Kandziora, M., Burkhard, B., Müller, F., 2013. Interactions of ecosystem properties, ecosystem integrity and ecosystem service indicators - A theoretical matrix exercise. Ecological Indicators 28, 54-78.

References
110
Kienberger, S., Contreras, D., Lang, S., 2010. Regions of vulnerability: Spatial modelling of different conceptual approaches. Proceedings of GIScience.
Kienberger, S., Lang, S., Zeil, P., 2009. Spatial vulnerability units – expert-based spatial modelling of socio-economic vulnerability in the Salzach catchment, Austria. Natural Hazards and Earth System Science 9, 767–778.
Kluvánková-Oravská, T., Chobotová, V., 2007. Exploring socio-ecological resilience for biodiversity conservation strategies in enlarged EU Theories and examples, Discussions papers No. 3 Institute for Forecasting Slovak Academy of Sciences.
Koschke, L., Fürst, C., Frank, S., Makeschin, F., 2012. A multi-criteria approach for an integrated land-cover-based assessment of ecosystem services provision to support landscape planning. Ecological Indicators 21, 54–66.
Kowarik, I., 1992. Das Besondere der städtischen Flora und Vegetation 1. Deutscher Rat für Landespflege 61, 33–47.
Kowarik, I., 2011. Novel urban ecosystems, biodiversity, and conservation. Environmental Pollution 159, 1974–1983.
Kroll, F., Müller, F., Haase, D., Fohrer, N., 2012. Rural–urban gradient analysis of ecosystem services supply and demand dynamics. Land Use Policy 29, 521–535.
Kropp, S., Holsten, A., Lissner, T., Roithmeier, O., Hattermann, F., Huang, S., Rock, J., Wechsung, F., Lüttger, A., Pompe, S., Kühn, I., Costa, L., Steinhäuser, M., Walther, C., Klaus, M., Ritchie, S., Metzger, M., 2009. Klimawandel in NRW. Regionale Abschätzung der Anfälligkeit ausgewählter Sektoren, Abschlussbericht des Potsdam-Instituts für Klimafolgenforschung (PIK) für das Ministerium für Umwelt und Naturschutz, Landwirtschaft und Verbraucherschutz Nordrhein-Westfalen (MUNLV). Potsdam.
Kubal, C., Haase, D., Meyer, V., Scheuer, S., 2009. Integrated urban flood risk assessment – adapting a multicriteria approach to a city. Natural Hazards and Earth System Science 9, 1881–1895.
La Rosa, D., Spyra, M., Inostroza, L., 2015. Indicators of Cultural Ecosystem Services for urban planning: A review. Ecological Indicators 61, 74–89.
Lamarque, P., Quétier, F., Lavorel, S., 2011. The diversity of the ecosystem services concept and its implications for their assessment and management. Comptes rendus biologies 334, 441–449.
Larondelle, N., Haase, D., 2013. Urban ecosystem services assessment along a rural – urban gradient: A cross-analysis of European cities. Ecological Indicators 29, 179–190.
Larondelle, N., Haase, D., Kabisch, N., 2014. Mapping the diversity of regulating ecosystem services in European cities. Global Environmental Change 26, 119–129.
Leidel, M., Kienberger, S., Lang, S., Zeil, P., 2009. Modelling the environmental dimension of vulnerability, in: European Landscapes in Transformation: Challenges for Landscape Ecology and Management Symposium 8: Open Symposium Modelling. pp. 477–480.

References
111
Lindley, S.J., Handley, J.F., Theuray, N., Peet, E., 2006. Adaptation Strategies for Climate Change in the Urban Environment: Assessing Climate Change Related Risk in UK Urban Areas. Journal of Risk Research 9, 543–568.
Lissner, T.K., Holsten, A., Walther, C., Kropp, J.P., 2012. Towards sectoral and standardised vulnerability assessments: the example of heatwave impacts on human health. Climatic Change 112, 687–708.
Luers, A.L., 2005. The surface of vulnerability: An analytical framework for examining environmental change. Global Environmental Change 15, 214–223.
Maes, J., Braat, L., Jax, K., Hutchins, M., Furman, E., Termansen, M., Luque, S., Paracchini, M.L., Chauvin, C., Williams, R., Volk, M., Lautenbach, S., Kopperoinen, L., Schelhaas, M., Weinert, J., Goossen, M., Dumont, E., Strauch, M., Dormann, C., Katwinkel, M., Zulian, G., Varjopuro, R., Ratamäki, O., Hauck, J., Forsius, M., Hengeveld, G., Perez-soba, M., Bouraoui, F., Scholz, M., Lepistö, A., Polishchuk, Y., Bidoglio, G., 2011. A spatial assessment of ecosystem services in Europe : Methods, case studies and policy analysis - phase 1, PEER Report No 3. Partnership for European Environmental Research, Ispra.
Martínez-Harms, M.J., Balvanera, P., 2012. Methods for mapping ecosystem service supply: a review. International Journal of Biodiversity Science, Ecosystem Services & Management 8, 17–25.
Martín-López, B., Gómez-Baggethun, E., García-Llorente, M., Montes, C., 2013. Trade-offs across value-domains in ecosystem services assessment. Ecological Indicators 37, 220–228.
Maxim, L., Spangenberg, J.H., 2006. Bridging the gap between two analytical frameworks, in: Ninth Biennial Conference of the International Society for Ecological Economics “Ecological Sustainability and Human Well-Being” December 15-18, New Delhi, India. p. 20.
Maxim, L., Spangenberg, J.H., Connor, M.O., 2009. An analysis of risks for biodiversity under the DPSIR framework. Ecological Economics 69, 12–23.
Maynard, S., James, D., Davidson, A., 2011. An adaptive participatory approach for developing an ecosystem services framework for South East Queensland, Australia. International Journal of Biodiversity Science, Ecosystem Services & Management 7, 182–189.
McPhearson, T., Kremer, P., Hamstead, Z.A., 2013. Mapping ecosystem services in New York City: Applying a social–ecological approach in urban vacant land. Ecosystem Services 5, e11–e26.
MEA, 2005. Ecosystems and Human Well-being : Millennium Ecosystem Assessment. World Health. Island Press, Washington DC.
Metzger, M.J., Leemans, R., Schröter, D., 2005. A multidisciplinary multi-scale framework for assessing vulnerabilities to global change. International Journal of Applied Earth Observation and Geoinformation 7, 253–267.
Metzger, M.J., Rounsevell, M.D.A., Acosta-Michlik, L., Leemans, R., Schröter, D., 2006. The vulnerability of ecosystem services to land use change. Agriculture, Ecosystems & Environment 114, 69–85.

References
112
Metzger, M.J., Schröter, D., 2006. Towards a spatially explicit and quantitative vulnerability assessment of environmental change in Europe. Regional Environmental Change 6, 201–216.
Milcu, A.I., Hanspach, J., Abson, D., Fischer, J., 2013. Cultural Ecosystem Services : A Literature Review and Prospects for Future Research. Ecology and Society 18, art44.
Miller, F., Osbahr, H., Boyd, E., Thomalla, F., Bharwani, S., Ziervogel, G., Walker, B., Birkmann, J., Leeuw, S. Van Der, Rockström, J., Hinkel, J., Downing, T., Folke, C., Nelson, D., 2010. Resilience and Vulnerability: Complementary or Conflicting Concepts? Ecology and Society 15, art11.
Mobjörk, M., 2010. Consulting versus participatory transdisciplinarity: A refined classification of transdisciplinary research. Futures 42, 866–873.
Moffatt, S., Kohler, N., 2008. Conceptualizing the built environment as a social- ecological system. Building Research & Information 36, 248–268.
Mooney, H., Larigauderie, A., Cesario, M., Elmquist, T., Hoegh-Guldberg, O., Lavorel, S., Mace, G.M., Palmer, M., Scholes, R., Yahara, T., 2009. Biodiversity, climate change, and ecosystem services. Current Opinion in Environmental Sustainability 1, 46–54.
Mörtberg, U., Haas, J., Zetterberg, A., Franklin, J.P., Jonsson, D., Deal, B., 2012. Urban ecosystems and sustainable urban development - analysing and assessing interacting systems in the Stockholm region. Urban Ecosystems 16, 763–782.
Müller, F., Burkhard, B., 2012. The indicator side of ecosystem services. Ecosystem Services 1, 26–30.
Müller, F., Burkhard, B., Hou, Y., Kruse, M., Ma, L., Wangai, P., 2016. Indicators for Ecosystem Services, in: Potschin, M., Haines-Young, R., Fish, R., Turner, R.K. (Eds.), Routledge Handbook of Ecosystem Services. Taylor & Francis, London, NewYork, pp. 157–169.
Müller, F., Burkhard, B., Kroll, F., 2010a. Resilience, Integrity and Ecosystem Dynamics: Bridging Ecosystem Theory and Management, in: Otto, J.-C., Dikau, R. (Eds.), Landform – Structure, Evolution, Process Control, Lecture Notes in Earth Sciences 115. Springer-Verlag, Berlin, Heidelberg, pp. 221–242.
Müller, F., de Groot, R., Willemen, L., 2010b. Ecosystem Services at the Landscape Scale: The Need for Integrative Approaches. Landscape Online 23, 1–11.
München, 2005. Grünplanung in München. Referat für Stadtplanung und Bauordnung, Abteilung Grünplanung, Landeshauptstadt München.
Naveh, Z., 2000. The Total Human Ecosystem: Integrating Ecology and Economics. BioScience 50, 357–361.
Nedkov, S., Burkhard, B., 2012. Flood regulating ecosystem services - Mapping supply and demand, in the Etropole municipality, Bulgaria. Ecological Indicators 21, 67–79.
Niemelä, J., Saarela, S.-R., Söderman, T., Kopperoinen, L., Yli-Pelkonen, V., Väre, S., Kotze, D.J., 2010. Using the ecosystem services approach for better planning and

References
113
conservation of urban green spaces: a Finland case study. Biodiversity and Conservation 19, 3225–3243.
O’Farrell, P.J., Anderson, P.M., 2010. Sustainable multifunctional landscapes: a review to implementation. Current Opinion in Environmental Sustainability 2, 59–65.
Oberndorfer, E., Lundholm, J., Bass, B., Coffman, R.R., Doshi, H., Dunnett, N., Gaffin, S., Köhler, M., Liu, K.K.Y., Rowe, B., 2007. Green Roofs as Urban Ecosystems: Ecological Structures, Functions, and Services. BioScience 57, 823–833.
Omann, I., Stocker, A., Jäger, J., 2009. Climate change as a threat to biodiversity : An application of the DPSIR approach. Ecological Economics 69, 1–8.
Ostrom, E., 2009. A general framework for analyzing sustainability of social-ecological systems. Science 325, 419–22.
Oteros-Rozas, E., Martín-López, B., Daw, T.M., Bohensky, E.L., Butler, J.R.A., Hill, R., Martin-Ortega, J., Quinlan, A., Ravera, F., Ruiz-Mallén, I., Thyresson, M., Mistry, J., Palomo, I., Peterson, G.D., Plieninger, T., Waylen, K.A., Beach, D.M., Bohnet, I.C., Hamann, M., Hanspach, J., Hubacek, K., Lavorel, S., Vilardy, S.P., 2015. Participatory scenario planning in place-based social-ecological research: Insights and experiences from 23 case studies, Ecology and Society 20, art32.
Othengrafen, M., 2014. Anpassung an den Klimawandel: Das formelle Instrumentarium der Stadt- und Regionalplanung. Verlag Dr. Kovač, Hamburg.
Palomo, I., Martín-López, B., Potschin, M., Haines-Young, R., Montes, C., 2013. National Parks, buffer zones and surrounding lands : Mapping ecosystem service flows. Ecosystem Services 4, 104–116.
Peña, L., Casado-Arzuaga, I., Onaindia, M., 2015. Mapping recreation supply and demand using an ecological and a social evaluation approach. Ecosystem Services 13, 108–118.
Pickett, S.T.A., Cadenasso, M.L., 2002. The ecosystem as a multidimensional concept: Meaning, model, and metaphor. Ecosystems 5, 1–10.
Plieninger, T., Dijks, S., Oteros-Rozas, E., Bieling, C., 2013. Assessing, mapping, and quantifying cultural ecosystem services at community level. Land Use Policy 33, 118–129.
Polsky, C., Neff, R., Yarnal, B., 2007. Building comparable global change vulnerability assessments: The vulnerability scoping diagram. Global Environmental Change 17, 472–485.
Potschin, M., 2009. Land use and the state of the natural environment. Land Use Policy 26, S170–S177.
Preston, B.L., Yuen, E.J., Westaway, R.M., 2011. Putting vulnerability to climate change on the map: a review of approaches, benefits, and risks. Sustain Science 6, 177–202.
Radford, K.G., James, P., 2013. Changes in the value of ecosystem services along a rural-urban gradient: A case study of Greater Manchester, UK. Landscape and Urban Planning 109, 117–127.

References
114
Raymond, C.M., Bryan, B.A., MacDonald, D.H., Cast, A., Strathearn, S., Grandgirard, A., Kalivas, T., 2009. Mapping community values for natural capital and ecosystem services. Ecological Economics 68, 1301–1315.
Reyer, C., Bachinger, J., Bloch, R., Hattermann, F.F., Ibisch, P.L., Kreft, S., Lasch, P., Lucht, W., Nowicki, C., Spathelf, P., Stock, M., Welp, M., 2012. Climate change adaptation and sustainable regional development: a case study for the Federal State of Brandenburg, Germany. Regional Environmental Change 12, 523–542.
Reyers, B., Biggs, R., Cumming, G.S.S., Elmqvist, T., Hejnowicz, A.P.P., Polasky, S., 2013. Getting the measure of ecosystem services: a social–ecological approach. Frontiers in Ecology and the Environment 11, 268–273.
Richter, M., Deppisch, S., von Storch, H., 2013. Observed Changes in Long-Term Climatic Conditions and Inner-Regional Differences in Urban Regions of the Baltic Sea Coast. Atmospheric and Climate Sciences 3, 165–176.
Rosenberg, M., Syrbe, R.U., Vowinckel, J., Walz, U., 2014. Scenario methodology for modelling of future landscape developments as basis for assessing ecosystem services. Landscape Online 33, 1–20.
Rounsevell, M.D.A., Dawson, T.P., Harrison, P.A., 2010. A conceptual framework to assess the effects of environmental change on ecosystem services. Biodiversity and Conservation 19, 2823–2842.
Sanchez-Rodriguez, R., 2009. Learning to adapt to climate change in urban areas . A review of recent contributions. Current Opinion in Environmental Sustainability 1, 201–206.
Säumel, I., Weber, F., Kowarik, I., 2016. Toward livable and healthy urban streets: Roadside vegetation provides ecosystem services where people live and move. Environmental Science & Policy 62, 24–33.
Schauser, I., Otto, S., Schneiderbauer, S., Harvey, A., Hodgson, N., Robrecht, H., Morchain, D., Schrander, J., Khovanskaia, M., Prutsch, A., Mccallum, S., 2010. Urban Regions : Vulnerabilities, Vulnerability Assessments by Indicators and Adaptation Options for Climate Change Impacts, ETC/ACC Technical Paper. European Topic Centre on Air and Climate Change, Bilthoven, Netherlands.
Schlüter, M., Hinkel, J., 2014. Application of the SES Framework for Model-based Analysis of the Dynamics of Social-Ecological Systems. Ecology and Society 19, art36.
Scholes, R., Reyers, B., Biggs, R., Spierenburg, M., Duriappah, A., 2013. Multi-scale and cross-scale assessments of social–ecological systems and their ecosystem services. Current Opinion in Environmental Sustainability 5, 16–25.
Scholte, S.S.K., Van Teeffelen, A.J.A., Verburg, P.H., 2015. Integrating socio-cultural perspectives into ecosystem service valuation : a review of concepts and methodologies. Ecological Economics 114, 1–39.
Schröter, D., Acosta-Michlik, L., Arnell, A.W., Araújo, M.B., Badeck, F., Bakker, M., Bondeau, A., Bugmann, H., Carter, T., De La Vega-Leinert, A.C., Erhar, M., Espiñeira, G.Z., Ewert, F., Fritsch, U., Friedlingstein, P., Glendining, M., Gracia, C.A., Hickler, T., House, J., Hulme, M., Kankaanpää, S., Klein, R.J.T., Krukenberg, B., Lavorel, S., Leemans, R., Lindner, M., Liski, J., Metzger, M.J.,

References
115
Meyer, J., Mitchell, T., Mohren, F., Morales, P., Moreno, J.M., Reginster, I., Reidsma, P., Rounsevell, M., Pla, E., Pluimers, J., Prentice, I.C., Pussinen, A., Sánchez, A., Sabaté, S., Sitch, S., Smith, B., Smith, J., Smith, P., Sykes, M.T., Thonicke, K., Thuiller, W., Tuck, G., Werf, G. van der, Vayreda, J., Wattenbach, M., Wilson, D.W., Woodward, F.I., Zaehle, S., Zierl, B., Zudin, S., Crame, W., 2004. Advanced Terrestrial Ecosystem Analysis and Modeling (ATEAM) final report. https://www.pik-potsdam.de/ateam/.
Schröter, D., Cramer, W., Leemans, R., Prentice, I.C., Araújo, M.B., Arnell, N.W., Bondeau, A., Bugmann, H., Carter, T.R., Gracia, C.A., de la Vega-Leinert, A.C., Erhard, M., Ewert, F., Glendining, M., House, J.I., Kankaanpää, S., Klein, R.J.T., Lavorel, S., Lindner, M., Metzger, M.J., Meyer, J., Mitchell, T.D., Reginster, I., Rounsevell, M., Sabaté, S., Sitch, S., Smith, B., Smith, J., Smith, P., Sykes, M.T., Thonicke, K., Thuiller, W., Tuck, G., Zaehle, S., Zierl, B., 2005. Ecosystem service supply and vulnerability to global change in Europe. Science 310, 1333–1337.
Schröter, M., van der Zanden, E.H., van Oudenhoven, A.P.E., Remme, R.P., Serna-Chavez, H.M., de Groot, R.S., Opdam, P., 2014. Ecosystem services as a contested concept : a synthesis of critique and counter-arguments. Conservation Letters 7, 514–523.
Schulp, C.J.E., Lautenbach, S., Verburg, P.H., 2014. Quantifying and mapping ecosystem services: Demand and supply of pollination in the European Union. Ecological Indicators 36, 131–141.
Seppelt, R., Fath, B., Burkhard, B., Fisher, J.L., Grêt-Regamey, A., Lautenbach, S., Pert, P., Hotes, S., Spangenberg, J., Verburg, P.H., Van Oudenhoven, A.P.E., 2012. Form follows function? Proposing a blueprint for ecosystem service assessments based on reviews and case studies. Ecological Indicators 21, 145–154.
Seto, K.C., Reenberg, A., Boone, C.G., Fragkias, M., Haase, D., Langanke, T., Marcotullio, P., Munroe, D.K., Olah, B., Simon, D., 2012. Urban land teleconnections and sustainability. Proceedings of the National Academy of Sciences 109, 7687–7692.
Sherrouse, B.C., Clement, J.M., Semmens, D.J., 2011. A GIS application for assessing, mapping, and quantifying the social values of ecosystem services. Applied Geography 31, 748–760.
Smit, B., Wandel, J., 2006. Adaptation, adaptive capacity and vulnerability. Global Environmental Change 16, 282–292.
Spangenberg, J.H., von Haaren, C., Settele, J., 2014. The ecosystem service cascade: Further developing the metaphor. Integrating societal processes to accommodate social processes and planning, and the case of bioenergy. Ecological Economics 104, 22–32.
Ståhle, A., 2006. Sociotope mapping – exploring public open space and its multiple use values in urban and landscape planning practice. Nordic Journal of Architectual Reseach 19, 59–71.
Stock, P., Burton, R.J.F., 2011. Defining Terms for Integrated (Multi-Inter-Trans-Disciplinary) Sustainability Research. Sustainability 3, 1090–1113.

References
116
Strunz, S., 2012. Is conceptual vagueness an asset? Arguments from philosophy of science applied to the concept of resilience. Ecological Economics 76, 112–118.
Stürck, J., Poortinga, A., Verburg, P.H., 2014. Mapping ecosystem services: The supply and demand of flood regulation services in Europe. Ecological Indicators 38, 198–211.
Summers, J.K., Smith, L.M., Case, J.L., Linthurst, R.A., 2012. A Review of the Elements of Human Well-Being with an Emphasis on the Contribution of Ecosystem Services. Ambio 41, 327–340.
Syrbe, R.-U., Walz, U., 2012. Spatial indicators for the assessment of ecosystem services: Providing, benefiting and connecting areas and landscape metrics. Ecological Indicators 21, 80–88.
Tapsell, S.M., Penning-Rowsell, E.C., Tunstall, S.M., Wilson, T.L., 2002. Vulnerability to flooding: health and social dimensions. Philosophical Transactions of the Royal Society of London A: Mathematical, Physical and Engineering Sciences 360, 1511–1525.
Termorshuizen, J.W., Opdam, P., 2009. Landscape services as a bridge between landscape ecology and sustainable development. Landscape Ecology 24, 1037–1052.
Tiwary, A., Kumar, P., 2014. Impact evaluation of green-grey infrastructure interaction on built-space integrity: An emerging perspective to urban ecosystem service. Science of the Total Environment 487, 350–60.
Transley, A.G., 1935. The Use and Abuse of Vegetational Concepts and Terms. Ecology 16, 284–307.
Turner, B.L., 2010. Vulnerability and resilience: Coalescing or paralleling approaches for sustainability science? Global Environmental Change 20, 570–576.
Turner, B.L., Kasperson, R.E., Matson, P. a, McCarthy, J.J., Corell, R.W., Christensen, L., Eckley, N., Kasperson, J.X., Luers, A., Martello, M.L., Polsky, C., Pulsipher, A., Schiller, A., 2003a. A framework for vulnerability analysis in sustainability science. Proceedings of the National Academy of Sciences 100, 8074–8079.
Turner, B.L., Matson, P. a, McCarthy, J.J., Corell, R.W., Christensen, L., Eckley, N., Hovelsrud-Broda, G.K., Kasperson, J.X., Kasperson, R.E., Luers, A., Martello, M.L., Mathiesen, S., Naylor, R., Polsky, C., Pulsipher, A., Schiller, A., Selin, H., Tyler, N., 2003b. Illustrating the coupled human-environment system for vulnerability analysis: three case studies. Proceedings of the National Academy of Sciences 100, 8080–8085.
Turner, B.L., Robbins, P., 2008. Land-Change Science and Political Ecology: Similarities, Differences, and Implications for Sustainability Science. Annual Review of Environment and Resources 33, 295–316.
Tzoulas, K., Korpela, K., Venn, S., Yli-Pelkonen, V., Kaźmierczak, A., Niemela, J., James, P., 2007. Promoting ecosystem and human health in urban areas using green infrastructure: A literature review. Landscape and Urban Planning 81, 167–178.
UNISDR, 2011. Global Assessment Report on Disaster Risk Reduction. United Nations International Strategy for Disaster Reduction, Geneva.

References
117
van Berkel, D.B., Verburg, P.H., 2014. Spatial quantification and valuation of cultural ecosystem services in an agricultural landscape. Ecological Indicators 37, 163–174.
Vignola, R., Locatelli, B., Martinez, C., Imbach, P., 2009. Ecosystem-based adaptation to climate change: what role for policy-makers, society and scientists? Mitigation and Adaptation Strategies for Global Change 14, 691–696.
Voigt, A., Kabisch, N., Wurster, D., Haase, D., Breuste, J., 2014. Structural diversity: A multi-dimensional approach to assess recreational services in urban parks. Ambio 43, 480–491.
Walker, B., Gunderson, L., Kinzig, A., Folke, C., Carpenter, S., Schultz, L., 2006. A Handful of Heuristics and Some Propositions for Understanding Resilience in Social-Ecological Systems. Ecology and Society 11, art13.
Walker, B., Holling, C.S., Carpenter, S.R., Kinzig, A., 2004. Resilience, Adaptability and Transformability in Social – ecological Systems. Ecology and Society 9, art5.
Wolf, S., 2012. Vulnerability and risk : comparing assessment approaches. Natural Hazards 61, 1099–1113.
Wolff, S., Schulp, C.J.E., Verburg, P.H., 2015. Mapping ecosystem services demand : A review of current research and future perspectives. Ecological Indicators 55, 159–171.

Appendix
118
13 APPENDIX
Appendix A: Questionnaire participatory mapping ...................................................... 119
Appendix B: Comparison of satisfaction with supply (1, not satisfied – 5, fully satisfied)
for the individual CES with regard to grouped social factors. Source: Beichler 2015. 126
Appendix C: Copyright and Permission Ecology and Society ..................................... 127
Appendix D: Copyright and Permission International Journal of Disasters Risk Science
....................................................................................................................................... 128
Appendix E: Copyright and Permission International Journal of Biodiversity Science,
Ecosystem Services & Management ............................................................................. 129

Appendix
119
Appendix A: Questionnaire participatory mapping

Appendix
120
Appendix A: Questionnaire participatory mapping

Appendix
121
Appendix A: Questionnaire participatory mapping

Appendix
122
Appendix A: Questionnaire participatory mapping

Appendix
123
Appendix A: Questionnaire participatory mapping

Appendix
124
Appendix A: Questionnaire participatory mapping

Appendix
125
Appendix A: Questionnaire participatory mapping

Appendix
126
Appendix B: Comparison of satisfaction with supply (1, not satisfied – 5, fully satisfied) for the individual CES withregard to grouped social factors. Source: Beichler 2015.
a) b) c)
e) f)d)
g) h) i)
k) l)j)
m) satisfaction with supply1 (not satisfied) to 5 (very satisfied)
cultural ecosystem servicesaest – aesthetics and inspirationcult – cultural heritage and identityedu – knowledge and educationnat – natural heritage and intrinsic value of biodiversityrecr – recreationspirit – spiritual and religious
1

Appendix
127
Appendix C: Copyright and Permission Ecology and Society

Appendix
128
Appendix D: Copyright and Permission International Journal of Disasters Risk Science

Appendix
129
Appendix E: Copyright and Permission International Journal of Biodiversity Science, Ecosystem Services & Management

S . A . B E I C H L E R 2 0 1 7 D I S S E R T A T I O N - H A F E N C I T Y U N I V E R S I T Ä T H A M B U R G