Vulnerability as a multi-faceted phenomenon: A GIS-based ...
291
Vulnerability as a multi-faceted phenomenon: A GIS-based data model for integrated development planning, environmental management and disaster risk reduction ID Jansen van Vuuren 22548580 Thesis submitted for the degree Doctor Philosophiae in Development and Management at the Potchefstroom Campus of the North-West University Promoter: Prof D van Niekerk October 2015
Transcript of Vulnerability as a multi-faceted phenomenon: A GIS-based ...
Vulnerability as a multi-faceted phenomenon: A GIS-based data model for
integrated development planning, environmental management and disaster
risk reduction
ID Jansen van Vuuren 22548580
Thesis submitted for the degree Doctor Philosophiae in Development and Management at the Potchefstroom Campus
of the North-West University
Promoter: Prof D van Niekerk October 2015

ACKNOWLEDGEMENTS
I thank the Lord Almighty for having given me the ability, insight and strength to undertake
the research and complete this thesis. Next, I owe my heartfelt thanks to my loving
family, to my lovely wife Ingrid who has always stood by me with encouragement, support
and understanding, and to my children, Nico and Yolande. To you I devote this thesis.
I wish to thank my promoter, prof. Dewald van Niekerk for encouraging me to undertake
this research. His willingness to listen to ideas, his wholehearted support, his comments
and positive feedback proved to be an enormous encouragement. Support was also
received from the African Centre for Disaster Studies, headed by prof. Van Niekerk.
Thank you Dewald, and colleagues from the ACDS, for involving me in your programmes,
as this provided me with a unique opportunity to expand my research horizon. I also wish
to thank prof. Per Becker from Lund University in Sweden, and the Swedish Foundation
for International Cooperation in Research and Higher Education for the grant given to
ACDS and Lund University for exchange of postgraduate students. This provided me with
the opportunity to conduct research at Lund University.
Recognition and thanks are due to my partner, Lourens du Plessis, for his encouragement
and for understanding when I was not in the office, writing this thesis. I was also
abundantly supported by business colleagues in my field of work. A special word of
gratitude goes to Ms Marieta Thornhill, environmental specialist, who was always willing
to share her knowledge and contribute to my study with her insights. To Mr Paul
Claassen, the father of Environmental Management Frameworks in South Africa – thank
you for the great deal of support I received from you, and for the books I could borrow
from you, Paul.
Lastly, my sincere thanks goes to Ms Isabel Claassen, who did the language editing of
this thesis. She did an excellent job, not only in correcting grammatical errors, but also in
improving the text.
i
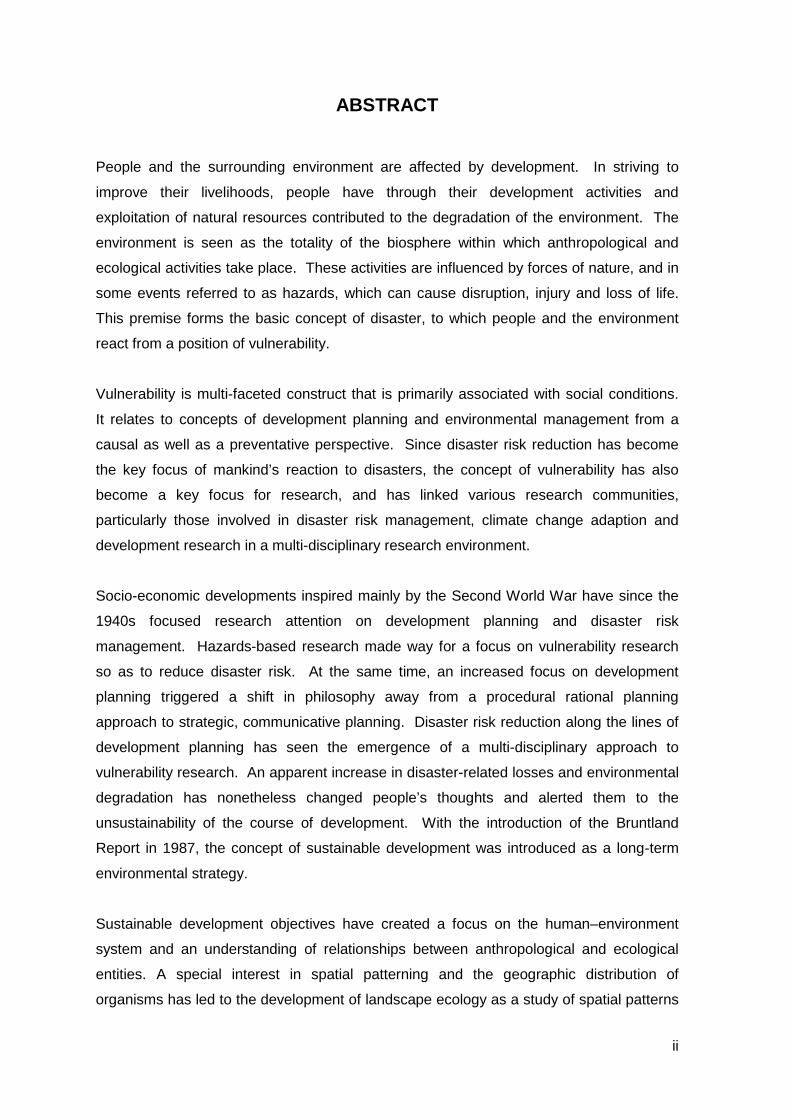
ABSTRACT
People and the surrounding environment are affected by development. In striving to
improve their livelihoods, people have through their development activities and
exploitation of natural resources contributed to the degradation of the environment. The
environment is seen as the totality of the biosphere within which anthropological and
ecological activities take place. These activities are influenced by forces of nature, and in
some events referred to as hazards, which can cause disruption, injury and loss of life.
This premise forms the basic concept of disaster, to which people and the environment
react from a position of vulnerability.
Vulnerability is multi-faceted construct that is primarily associated with social conditions.
It relates to concepts of development planning and environmental management from a
causal as well as a preventative perspective. Since disaster risk reduction has become
the key focus of mankind’s reaction to disasters, the concept of vulnerability has also
become a key focus for research, and has linked various research communities,
particularly those involved in disaster risk management, climate change adaption and
development research in a multi-disciplinary research environment.
Socio-economic developments inspired mainly by the Second World War have since the
1940s focused research attention on development planning and disaster risk
management. Hazards-based research made way for a focus on vulnerability research
so as to reduce disaster risk. At the same time, an increased focus on development
planning triggered a shift in philosophy away from a procedural rational planning
approach to strategic, communicative planning. Disaster risk reduction along the lines of
development planning has seen the emergence of a multi-disciplinary approach to
vulnerability research. An apparent increase in disaster-related losses and environmental
degradation has nonetheless changed people’s thoughts and alerted them to the
unsustainability of the course of development. With the introduction of the Bruntland
Report in 1987, the concept of sustainable development was introduced as a long-term
environmental strategy.
Sustainable development objectives have created a focus on the human–environment
system and an understanding of relationships between anthropological and ecological
entities. A special interest in spatial patterning and the geographic distribution of
organisms has led to the development of landscape ecology as a study of spatial patterns
ii
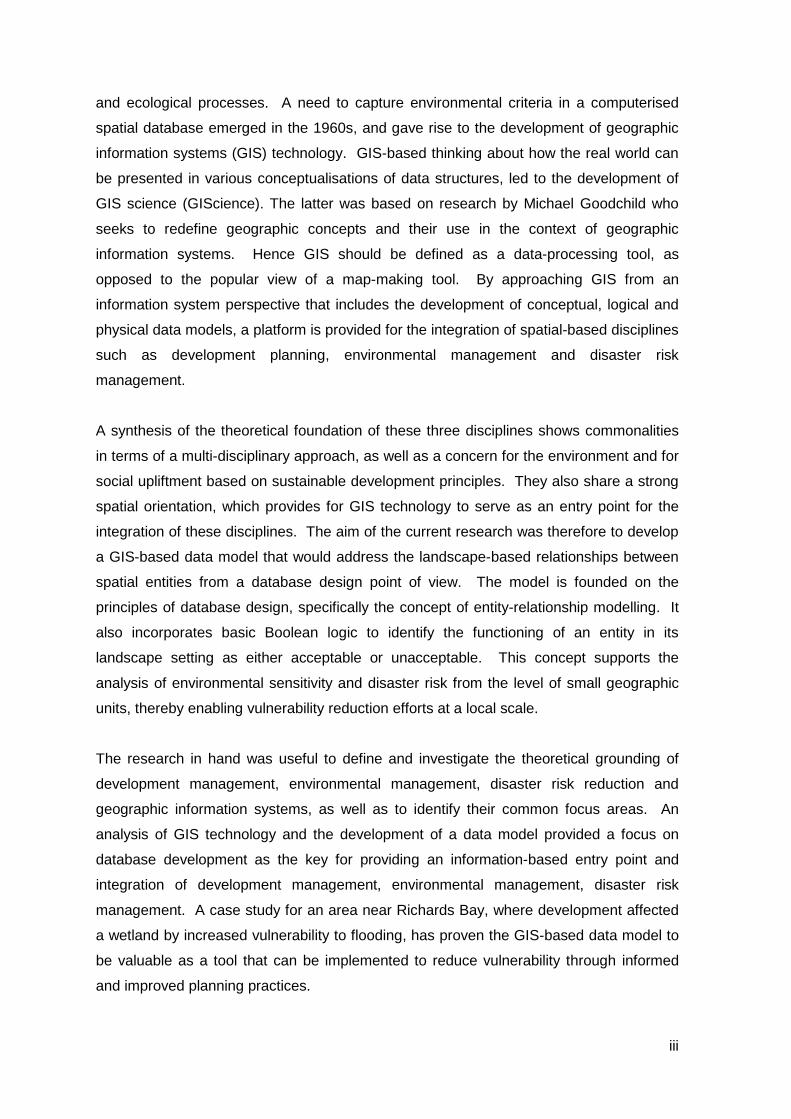
and ecological processes. A need to capture environmental criteria in a computerised
spatial database emerged in the 1960s, and gave rise to the development of geographic
information systems (GIS) technology. GIS-based thinking about how the real world can
be presented in various conceptualisations of data structures, led to the development of
GIS science (GIScience). The latter was based on research by Michael Goodchild who
seeks to redefine geographic concepts and their use in the context of geographic
information systems. Hence GIS should be defined as a data-processing tool, as
opposed to the popular view of a map-making tool. By approaching GIS from an
information system perspective that includes the development of conceptual, logical and
physical data models, a platform is provided for the integration of spatial-based disciplines
such as development planning, environmental management and disaster risk
management.
A synthesis of the theoretical foundation of these three disciplines shows commonalities
in terms of a multi-disciplinary approach, as well as a concern for the environment and for
social upliftment based on sustainable development principles. They also share a strong
spatial orientation, which provides for GIS technology to serve as an entry point for the
integration of these disciplines. The aim of the current research was therefore to develop
a GIS-based data model that would address the landscape-based relationships between
spatial entities from a database design point of view. The model is founded on the
principles of database design, specifically the concept of entity-relationship modelling. It
also incorporates basic Boolean logic to identify the functioning of an entity in its
landscape setting as either acceptable or unacceptable. This concept supports the
analysis of environmental sensitivity and disaster risk from the level of small geographic
units, thereby enabling vulnerability reduction efforts at a local scale.
The research in hand was useful to define and investigate the theoretical grounding of
development management, environmental management, disaster risk reduction and
geographic information systems, as well as to identify their common focus areas. An
analysis of GIS technology and the development of a data model provided a focus on
database development as the key for providing an information-based entry point and
integration of development management, environmental management, disaster risk
management. A case study for an area near Richards Bay, where development affected
a wetland by increased vulnerability to flooding, has proven the GIS-based data model to
be valuable as a tool that can be implemented to reduce vulnerability through informed
and improved planning practices.
iii
SAMEVATTING
In sy strewe na ontwikkeling beïnvloed die mens sy omgewing. Die omgewing word
beskryf as die omvattende biosfeer waarbinne menslike en natuurlike sisteme
funksioneer. Deur die ontrekking van natuurlike hulpbronne, en die voortdurende strewe
om sy lewenstandaard te verbeter, het daar reeds grootskaalse agteruitgang in die
omgewing begin plaasvind. Menslike aktiwiteite is onderhewig aan kragte in die natuur,
sommige waarvan as bedreigings beskou word, wat ontwrigting, besering en verlies van
lewe kan meebring. Hierdie beskouing vorm die basiese konsep van ‘n ramp. Die mens
en die omgewing se reaksie op rampe vind plaas vanuit ‘n posisie van kwesbaarheid.
Kwesbaarheid is ‘n veelvlakkige konsep wat hoofsaaklik met sosiale omstandighede
verband hou. Dit hou verband met ontwikkelingsbeplanning en omgewingsbestuur vanuit
‘n reaktiewe, sowel as ‘n voorkomende perspektief. Ramprisikobestuur is gefokus op die
vermindering van risiko, teenoor bloot voorkomende aksie om rampe af te weer. In die lig
hiervan is navorsing op die vermindering van mense se kwesbaarheid gefokus. Hierdie
benadering bring verskillende navorsingsgemeenskappe bymekaar, veral die in die veld
van klimaatsverandering en ontwikkelingsbestuur. ‘n Hoofkenmerk is die multi-
dissiplinêre aard van die navorsing.
Sedert die Tweede Wêreldoorlog word sosio-ekonomiese ontwikkeling met ‘n fokus op
onwikkelingsbeplanning en ramprisikobestuur vereenselwig. Waar navorsing eers op
bedreigings gefokus was, het die fokus na risikobestuur en die verlaging van die mens se
kwesbaarheid teenoor rampe verskuif. Terselfdertyd het daar in die
beplanningsgemeenskap ‘n fokusverskuiwing plaasgevind, weg van rasionele,
prosesgedrewe beplanning, na deelnemende strategiese beplanning. Dit het die multi-
dissiplinêre benadering tot navorsing oor kwesbaarheid verder versterk. Met die
toenemende bewustelikheid van die kwesbaarheid van die omgewing, en die agteruitgang
wat met ontwikkeling gepaard gaan, het die besef van die onvolhoubaarheid van
ontwikkelingspraktyke al hoe sterker geword. Met die bekenstelling van die
Bruntlandverslag in 1987, het die konsep van volhoubare ontwikkeling as ’n langtermyn
doelwit al hoe sterker geword.
Kennis van die onderliggende verwantskappe tussen menslike en natuurlike sisteme het
al hoe belangriker begin word, namate die doelwitte van volhoubare ontwikkeling tot die
voorgrond begin getree het. ‘n Spesifieke belangstelling in ruimtelike verwantskappe en
iv
patrone, en die verspreiding van organismes, het die die ontwikkeling van landskap-
ekologie aanleiding gegee. Dit fokus op die studie van ruimtelike patrone en ekologiese
prosesse. Die behoefte om hierdie prosesse en omgewingsaspekte in gerekenariseerde
ruimtelike databasisse vas te lê, het saam met die ontwikkeling van rekenaartegnologie
ontwikkel. Dit het tot die ontwikkeling van tegnologie rondom geografiese inligtingstelsels
(GIS) aanleiding gegee. ‘n GIS-gebaseerde benadering tot die voorstelling van
verskynsels op aarde, en verwante datastrukture, het tot die ontwikkeling van ‘n GIS
wetenskap aanleiding gegee. Die fondasie vir die ontwikkeling van die wetenskap is deur
die werk van Michael Goodchild gelê, wat daarop ingestel is om geografiese konsepte en
die toepassing daarvan in die konteks van GIS te herdefinieer. Gevolglik behoort GIS
eerder in terme van dataprosessering gedefinieer te word, as wat dit as ‘n werksmiddel
beskou word om bloot kaarte te maak. GIS behoort vanuit die perspektief van
inligtinstelsels benader te word. Hierdie perspektief sluit die ontwikkeling van
konsepsuele, logiese en fisiese datamodelle in, wat ‘n platvorm vir die integrasie van
ontwikkelingsbeplanning, omgewingsbestuur en ramprisikobestuur bied.
‘n Sintese van die teoretiese onderbou van die drie dissiplines dui op sekere
gemeenskaplikhede wat afgelei kan word uit die multi-dissiplinêre aard daarvan, sowel as
‘n gemeenskaplike benadering tot omgewingsbewaring en sosiale opheffing, wat in die
beginsels van volhoubare ontwikkeling saamgevat is. Daar is ook ‘n sterk verband ten
opsigte van ‘n ruimtelike oriëntering. Dit bepaal dat GIS tegnologie as ‘n vertrekpunt
beskou kan word, ter wille van die integrasie van die dissiplines. Die doel van hierdie
studie is om ‘n GIS gebaseerde data model te ontwikkel wat op die verwantskap tussen
menslike en natuurlike entiteite, soos dit in ‘n landskap funksioneer, ingestel is. Die
model dra ‘n sterk fokus op databasisteorie, spesifiek die konsep van
entiteitsverwantskap modellering. Dit steun ook op beginsels van Booleaanse logika, wat
die funksionering van entiteite in ‘n landskap as aanvaarbaar of onaanvaarbaar kan
aandui. Die koppeling word gemaak aan geografiese entiteite wat op die kleinste
moontlike skaal as ruimtelike eenhede vasgelê word. Op hierdie wyse kan die
kwesbaarheid van sosiale en ekologiese komponente as eenhede in die landskap
aangespreek word.
Die waarde van hierdie studie kan gesien word in die ondersoek van die teoretiese
fundering van ontwikkelingsbeplanning, omgewingsbestuur en ramprisikobestuur, sowel
as geogragiese inligtingstelsels. Die belangrikheid om onderliggende
gemeenskaplikehede te bepaal, word uitgelig. ‘n Beskrywing van GIS tegnologie, en die
ontwikkeling van ‘n datamodel, dui op databasisontwerp as die sleutel om ‘n
v

gemeenskaplike vertrekpunt tussen die drie dissiplines te bepaal. Die waarde van die
datamodel word deur ‘n gevallestudie in Richardsbaai geïlustreer. Die gebied word deur
‘n sensitiewe ekologie en blootstelling aan oorstromings gekenmerk, gepaardgaande met
die druk op ontwikkeling en uitbreiding van menslike aktiwiteite. In die opsig bewys die
datamodel as ‘n waardevolle hulpmiddel om die kwesbaarheid van menslike en
ekologiese sisteme uit te wys.
vi
KEYWORDS
Data model
Development
Development planning
Disaster risk
Disaster risk reduction
Ecology
Environmental management
Framework
Geographic Information systems (GIS)
Hazard
Landscape
Planning
Resilience
Sustainable development
Vulnerability
vii
ACRONYMS
ACDS African Centre for Disaster Studies
BSU Basic Spatial Units
CSD United Nations Commission on Sustainable Development
CSIR Council for Scientific and Industrial Research
DAEARD Department of Agriculture, Environmental Affairs and Rural Development.
DFID UK Department for International Development
DRR Disaster Risk Reduction
EAP Environmental Assessment Practitioner
EIA Environmental Impact Assessment
EMF Environmental Management Framework
EMP Environmental Management Plan
EU European Union
GIS Geographic Information Systems
GIScience Geographic Information Science
GAP Geospatial Analysis Platform
GDARD Gauteng Department of Agriculture and Rural Development
GVA Gross Geographic Value Added
IEM Integrated Environmental Management
IDP Integrated Development Planning
IDZ Industrial Development Zone
MAUP Modifiable Area Unit Problem
MCDA Multi-Criteria Decision Analysis
MDGs Millennium Development Goals
NEMA National Environmental Management Act (Act 107 of 1998)
NEPA (United States) National Environmental Policy Act
NFSD National Framework for Sustainable Development
NRC (United States) National Research Council
NSSD National Strategy for Sustainable Development and Action Plan
OED Oxford English Dictionary
RIA Rapid Impact Assessment
SANBI South African National Biodiversity Institute
SDF Spatial Development Framework
SEA Strategic Environmental Assessment
SoER State of the Environment Reports
viii

TFL Tobler’s First Law
UN United Nations
UNEP United Nations Environment Programme
UN/DESA United Nations Department of Economic and Social Affairs
UN/ISDR United Nations Inter-Agency Secretariat of the International Strategy for
Disaster Reduction
US United States of America
ix
TABLE OF CONTENTS
CHAPTER 1: ORIENTATION AND PROBLEM STATEMENT ....................................... 1
1.1 INTRODUCTION .................................................................................................... 1
1.2 ORIENTATION AND PROBLEM STATEMENT ...................................................... 3
1.2.1 Problem statement ................................................................................................. 10
1.2.2 Key research questions .......................................................................................... 11
1.3 RESEARCH OBJECTIVES .................................................................................. 12
1.4 CENTRAL THEORETICAL STATEMENT ............................................................ 13
1.5 RESEARCH METHOD ......................................................................................... 14
1.6 CONTRIBUTION MADE BY THE STUDY ............................................................ 17
1.7 CHAPTERS IN THE STUDY ................................................................................ 18
1.8 CONCLUSION ..................................................................................................... 20
CHAPTER 2: THEORY OF DEVELOPMENT PLANNING ........................................... 21
2.1 INTRODUCTION ...................................................................................................... 21
2.2 CONCEPTUALISATION OF DEVELOPMENT ......................................................... 23
2.2.1 Development theory .............................................................................................. 23
2.2.1.1 The 1940s .......................................................................................................... 23
2.2.1.2 The 1950s .......................................................................................................... 24
2.2.1.3 The 1960s .......................................................................................................... 24
2.2.1.4 The 1970s .......................................................................................................... 24
2.2.1.5 The 1980s .......................................................................................................... 24
2.2.1.6 The 1990s .......................................................................................................... 25
2.2.1.7 2000 and onward ............................................................................................... 25
2.2.2 Hegemony as a spatial construct ........................................................................... 26
2.2.3 Economic approaches to development ................................................................... 29
2.2.3.1 Modernisation theory ........................................................................................... 30
2.2.3.2 Dependency theory ............................................................................................. 31
x
2.2.3.3 Neo-liberalism ..................................................................................................... 33
2.2.3.4 Post-development ............................................................................................... 33
2.3 CONCEPTUALISATION OF PLANNING ................................................................. 35
2.3.1 Planning – a definition ............................................................................................ 37
2.3.2 The development of planning theory ...................................................................... 40
2.3.3 Blueprint planning .................................................................................................. 42
2.3.4 Rational planning ................................................................................................... 43
2.3.4 Strategic planning .................................................................................................. 44
2.3.5 Advocacy and a communicative planning in perspective ........................................ 45
2.3.6 Crisis planning ....................................................................................................... 46
2.3.7 Planning: an integrated process ............................................................................. 47
2.3.8 The planning theory dilemma ................................................................................. 51
2.3.8 Planning theory: Future perspectives ..................................................................... 52
2.4 DEVELOPMENT PLANNING – AN INTEGRATED ENDEAVOUR ............................ 54
2.4.1 Development planning and sustainable development ............................................. 56
2.4 INFORMATION AND DEVELOPMENT PLANNING .................................................. 58
2.5 CONCLUSION ......................................................................................................... 58
CHAPTER 3: THEORY OF ENVIRONMENTAL MANAGEMENT ................................ 60
3.1 INTRODUCTION .................................................................................................. 60
3.2 ENVIRONMENTAL MANAGEMENT .................................................................... 62
3.3 INTEGRATED ENVIRONMENTAL MANAGEMENT ............................................. 65
3.3.2.1 Environmental Impact Assessment (EIA) ............................................................ 68
3.3.2.2 Environmental Management Plans (EMPs) ........................................................ 71
3.3.2.3 Strategic Environmental Assessment (SEA) ........................................................ 72
3.3.2.4 Environmental Management Framework (EMF) .................................................. 75
3.4 ENVIRONMENTAL MANAGEMENT AND DEVELOPMENT ................................ 76
3.4.1 Sustainable development ....................................................................................... 77
3.5 LANDSCAPE ECOLOGY ..................................................................................... 81
xi
3.6 CONCLUSION ..................................................................................................... 84
CHAPTER 4: THEORY OF DISASTER RISK MANAGEMENT ................................... 86
4.1 INTRODUCTION .................................................................................................. 86
4.2 HISTORY OF DISASTER RISK MANAGEMENT ................................................. 87
4.3 THEORETICAL GROUNDING OF DISASTER RISK MANAGEMENT ................. 89
4.3.1 Defining disaster .................................................................................................... 90
4.3.1.1 Paradigm 1: The Patterns of War Approach ........................................................ 92
4.3.1.2 Paradigm 2: Disaster as Social Vulnerability ....................................................... 92
4.3.1.3 Paradigm 3: Disaster as Uncertainty ................................................................... 92
4.3.2 Research frameworks – Approaches to disaster study .......................................... 93
4.3.2.1 Human Ecology School ....................................................................................... 93
4.3.2.2 Disaster Research School ................................................................................... 94
4.3.3 The Disaster Phase Model ..................................................................................... 95
4.3.4 Critique of the Disaster Phase Model ..................................................................... 97
4.3.5 Propositions and principles of the Disaster Phase Model ..................................... 100
4.3.6 Concepts of vulnerability and hazard ................................................................... 102
4.3.6.1 Understanding hazards ..................................................................................... 104
4.3.6.2 Understanding vulnerability .............................................................................. 106
4.3.6.3 Understanding Resilience................................................................................. 110
4.3.6.4 Understanding risk ........................................................................................... 113
4.4 MULTI-DISCIPLINARY NATURE OF DISASTER ............................................... 113
4.4.1 Disaster risk in developmental context ............................................................ 115
4.4.2 Disaster management in a social and sustainability context ............................ 118
4.5 CONCLUSION ........................................................................................................ 120
CHAPTER 5: THEORY OF GEOGRAPHIC INFORMATION SYSTEMS (GIS) .......... 123
5.1 INTRODUCTION ................................................................................................ 123
5.2 AN OVERVIEW OF GIS HISTORY .................................................................... 124
xii
5.3 THE CONTEXT OF GIS AS AN INFORMATION SYSTEM ................................ 126
5.4 GEOGRAPHIC INFORMATION SCIENCE ......................................................... 133
5.4.1 The “GIS as a science” debate .................................................................... 133
5.4.2 What is geographic information science? .................................................... 134
5.5 FUNDAMENTAL GEOGRAPHIC CONCEPTS OF GISCIENCE .................. 137
5.5.1 The nature of geographic data and its modelling ............................................. 138
5.5.1.1 Fields .......................................................................................................... 139
5.5.1.2 Discrete objects ........................................................................................... 140
5.5.1.3 Geo-atoms .................................................................................................. 141
5.5.1 Representation of conceptual views: rasters and vectors ................................ 143
5.5.2 Human cognition of the spatial world .............................................................. 146
5.5.3 Abstraction and issues of accuracy, quality and uncertainty ............................ 147
5.5.4 Spatial relationships ........................................................................................ 150
5.5.5 GIS and relational database concepts............................................................. 151
5.5.6 The Relational Database Model ...................................................................... 152
5.5.6.1 The Entity Relationship Model ..................................................................... 154
5.5.7 Information and knowledge as a product of data ............................................. 156
5.6 GIS FUNCTIONS ............................................................................................... 161
5.7 CONCLUSION ................................................................................................... 163
CHAPTER 6: INDICATORS, FRAMEWORKS AND MODELS OF VULNERABILITY, SUSTAINABLE DEVELOPMENT AND THE ENVIRONMENT ..................................... 165
6.1 INTRODUCTION ................................................................................................ 165
6.1 INDICATORS AND FRAMEWORKS .................................................................. 166
6.2.1 Indicators ............................................................................................................. 166
6.2.2 Frameworks ......................................................................................................... 169
6.2 AN OVERVIEW OF INTEGRATED VULNERABILITY FRAMEWORKS AND
INDICATORS ................................................................................................................ 170
6.3.1 The Dual Structure of Vulnerability: Bohle (2001) ................................................. 171
xiii
6.3.2 The Coupled Human–Environment Framework: Turner et al. (2003b) and Birkmann
(2005) ........................................................................................................................... 172
6.3.3 Methods for the Improvement of Vulnerability Assessment in Europe (MOVE)
Framework: Birkmann et al. (2013) ............................................................................... 174
6.3.4 BBC conceptual framework: (Birkmann, 2006) ..................................................... 176
6.3.5 Land Use Intensity: Spangenberg (2002) ............................................................. 178
6.3.6 Social Vulnerability Index (SoVI): Cutter et al. (2003) ........................................... 179
6.3 AN OVERVIEW OF INTEGRATED DEVELOPMENT AND ENVIRONMENTAL
FRAMEWORKS ............................................................................................................ 181
6.3.1 The PSR and DPSIR Frameworks ....................................................................... 182
6.3.2 The DPSIR Framework ........................................................................................ 183
6.4 THE USE OF INDICATORS IN GIS IN RESPECT OF DEVELOPMENT,
ENVIRONMENTAL MANAGEMENT AND DISASTER RISK MANAGEMENT .............. 185
6.4.1 Multi-Criteria Decision Analysis: Georgetown Case Study (Cutter et al., 2000) .... 186
6.4.2 Geospatial Analysis Platform (Naudé et al., 2007) .............................................. 188
6.4.3 Environmental Sensitivity Analysis ...................................................................... 189
6.5 CONCLUSION ................................................................................................... 192
CHAPTER 7: INTEGRATING DEVELOPMENT PLANNING, ENVIRONMENTAL MANAGEMENT, DISASTER RISK MANAGEMENT AND GIS .................................... 193
7.1 INTRODUCTION ................................................................................................ 193
7.2 MAIN FINDINGS AND CHARACTERISTICS...................................................... 193
7.2.1 Development planning .................................................................................... 193
7.2.2 Environmental Management ........................................................................... 194
7.2.3 Disaster Risk Management ............................................................................. 194
7.2.4 Geographic information systems (GIS) ........................................................... 195
7.3 INFERENCE: COMMONALITIES BETWEEN DEVELOPMENT PLANNING,
ENVIRONMENTAL MANAGEMENT AND DISASTER RISK MANAGEMEN T ............. 196
7.4. CONCLUSION ................................................................................................... 200
xiv
CHAPTER 8: A GIS-BASED MODEL FOR INTEGRATING DEVELOPMENT PLANNING, ENVIRONMENTAL MANAGEMENT AND DISASTER RISK MANAGEMENT
8.1 INTRODUCTION ................................................................................................ 201
8.2 DATA MODELS .................................................................................................. 202
8.2 PROPOSED FRAMEWORK AND DATA MODEL .............................................. 204
8.3 VALUE OF THE GIS-BASED MODEL FOR INTEGRATING DEVELOPMENT
PLANNING, ENVIRONMENTAL MANAGEMENT AND DISASTER RISK MANAGEMENT
……………………………………………………………………………………………208
8.4 APPLICATION OF THE GIS-BASED MODEL: CASE STUDY ........................... 210
8.5 EXPANSION OF THE GIS-BASED MODEL ....................................................... 216
8.6 CONCLUSION ................................................................................................... 216
CHAPTER 9: CONCLUSIONS AND RECOMMENDATIONS .................................... 218
9.1 INTRODUCTION ................................................................................................ 218
9.2 KEY FINDINGS .................................................................................................. 219
9.2.1 Key findings of development planning ................................................................. 219
9.2.2 Key findings of environmental management ........................................................ 221
9.2.3 Key findings of disaster risk management ........................................................... 223
9.2.4 Key findings of geographic information systems .................................................. 224
9.2.5 A summary of key findings .................................................................................. 225
9.3 A GIS-BASED FRAMEWORK FOR THE INTEGRATION OF DEVELOPMENT
PLANNING, ENVIRONMENTAL MANAGEMENT AND DISASTER RISK MANAGEMENT
……………………………………………………………………………………………226
9.4 RELEVANCE AND VALUE OF THE STUDY ...................................................... 227
9.5 CONCLUSION AND RECOMMENDATIONS ..................................................... 228
ANNEXURES ANNEXURE 1 TO CHAPTER 3 .................................................................................... 229
Rostow’s Stages of Economic Growth (Sources: Potter et al., 2008:33; Hopper, 2012:31).
..................................................................................................................................... 229
xv

ANNEXURE 2 TO CHAPTER 3 .................................................................................... 230
A comprehensive framework for strategic planning (Dale, 2004:27) .............................. 230
ANNEXURE 3 TO CHAPTER 3 .................................................................................... 233
Sustainable development process: methodological framework of analysis and evaluation
(Vreeker & Nijkamp, 2006:169) ..................................................................................... 233
BIBLIOGRAPHY .......................................................................................................... 234
xvi
LIST OF FIGURES
Figure 1.1: Interaction of vulnerability factors .................................................................... 4
Figure 1.2: The integration of related disciplines conceptualised as different focus areas
and a single entry point ..................................................................................................... 8
Figure 1.3: The research focus shown as a triangle connecting the fields of interest ..... 10
Figure 1.4: A structural layout of the study method ........................................................ 17
Figure 1.5 A structural layout of the study illustrating the development of chapters ........ 19
Figure 2.1: Map showing the extent of the British Empire by the late 19th century in red . 28
Figure 2.2: Map showing the spatial conceptualisation of the Third World ...................... 28
Figure 2.3: Map showing the spatial conceptualisation of a developed North in blue, and a
developing South in red .................................................................................................. 29
Figure 2.4: Gunder Frank’s model of underdevelopment ................................................. 32
Figure 2.5: The decision-centred view of planning .......................................................... 39
Figure 2.6: The continuum of reality and abstraction ...................................................... 45
Figure 2.7: Finding the fit between goal, resources and context ..................................... 48
Figure 2.8: Different schemes of organisations’ collaboration in strategic planning ......... 50
Figure 2.9: Planning as a network of interrelated actions ................................................ 54
Figure 2.10: The four main disciplines in the interdisciplinary field of development studies
....................................................................................................................................... 56
Figure 3.1: A typical step-wise EIA process .................................................................... 70
Figure 3.2: The relationship between SEA, EIA and processes ....................................... 72
Figure 3.3: The range of SEA models ............................................................................. 73
Figure 3.4: A comparison of SEA and EIA processes indicating similarity, albeit on
different levels ................................................................................................................. 74
Figure 3.5: Hierarchy of IEM tools in relation to a typical development cycle .................. 76
Figure 3.6: Integrated objectives of sustainable development ......................................... 78
Figure 3.7: Holistic nature of sustainability – equilibrium by advancing on several fronts 79
Figure 3.8: Map indicating conflicting development and conservation priorities ............... 80
Figure 3.9: Framework for ecosystem and human system linkages ................................ 84
Figure 4.1: Core topics for research in disaster risk reduction ......................................... 91
Figure 4.2: Disaster Phase Model .................................................................................. 96
Figure 4.3: Continuum of disaster risk management activities within a time framework ... 99
Figure 4.4: Model of disaster impacts ........................................................................... 103
Figure 4.5: The Pressure and Release Model ............................................................... 109
Figure 4.6: Schematic representation of varying coping ranges .................................... 112
Figure 4.7: ‘Vicious spirals’ of disaster risk and development failure ............................. 118
xvii
Figure 4.8: The sustainable livelihoods framework ....................................................... 119
Figure 5.1: Value adding: progression from data to wisdom .......................................... 129
Figure 5.2: GIS and related information systems ........................................................... 131
Figure 5.3: Forming knowledge from conceptualisations of the real world ..................... 138
Figure 5.4: Representation of geographical entities in a topological database .............. 144
Figure 5.5: Example of pixel values stored in a matrix of rows and columns ................ 145
Figure 5.6: Visualisation representation of pixel values by colour (refer to Figure 5.5) .. 145
Figure 5.7: Visualisation of raster data (elevation) and vector data (roads) on a
topographical map ........................................................................................................ 146
Figure 5.8: The concept of extended entity as human cognition of spatial objects ......... 147
Figure 5.9: The anatomy of a relation ............................................................................ 153
Figure 5.10: Basic notation used in ER diagrams .......................................................... 154
Figure 5.11: Illustration of ER diagram development ..................................................... 156
Figure 5.12: The Information Process .......................................................................... 158
Figure 5.13: The cyclical process of information management ...................................... 159
Figure 5.14: Schema of organisational tasks and related GIS functions ........................ 162
Figure 6.1: The data / information pyramid .................................................................... 168
Figure 6.2: Conceptual Model for Vulnerability Analysis ................................................ 172
Figure 6.3: Vulnerability framework ............................................................................... 174
Figure 6.4: The MOVE framework ................................................................................. 176
Figure 6.5: The BBC conceptual framework for vulnerability ......................................... 178
Figure 6.6: The overlapping natural and anthropogenic regulation systems .................. 179
Figure 6.7: The Hazards-of-Place Model of Vulnerability .............................................. 180
Figure 6.8: Dimensions of social vulnerability ............................................................... 181
Figure 6.9: The PSR framework .................................................................................... 183
Figure 6.10: The DPSIR framework .............................................................................. 184
Figure 6.11: Spatial distribution of overall hazard vulnerability in Georgetown County .. 187
Figure 6.12: Gross Geographic Value-Added (GVA) map for Ekurhuleni, extracted from
mesozone data ............................................................................................................. 189
Figure 6.13: Sensitivity map for the EMF study area, created from facets data ............ 191
Figure 6.14: Ecological status retrieved from the sensitivity facets dataset .................. 191
Figure 7.1: The integration of development planning, environmental management and
disaster risk management through GIS as a data management platform ...................... 198
Figure 7.2: Integration of Geographical Information Systems with the RIA process ....... 199
Figure 7.3: Framework for GIS operation in a multi-disciplinary development planning
project ........................................................................................................................... 199
Figure 8.1: Levels of abstraction for database development.......................................... 204
xviii
Figure 8.2: The integration of anthropological and ecological activities in the functioning of
the landscape ............................................................................................................... 205
Figure 8.3: An ecosystem – human system framework expressed in the form of an ER
diagram ......................................................................................................................... 206
Figure 8.4: Entity relationships between anthropological and ecological units in the
landscape ..................................................................................................................... 207
Figure 8.5: Example of a compound table that can be joined with a spatial database ... 208
Figure 8.6: An example of the iterative process of data processing to create spatial data at
geo-atom level. ............................................................................................................. 212
Figure 8.7: Two iterations of the join table. .................................................................... 212
Figure 8.8: Extract of the attribute table of the land cover GIS feature, showing the join
table. ............................................................................................................................. 213
Figure 8.9: Map according to the values in table (a) of Figure 8.7. ................................ 214
Figure 8.10: Map according to the values in table (b) of Figure 8.7. .............................. 214
Figure 8.11: Map showing the results of a compound query with the land cover value
included. ....................................................................................................................... 215
Figure 9.1: Increased need for information sharing in planning models ......................... 221
Figure 9.2: A framework for GIS science ....................................................................... 225
Figure 9.3: A framework for the integration of development planning, environmental
management and disaster risk management ................................................................. 227
xix
LIST OF TABLES Table 5.1: The principle of set theory explained in terms of GIS datasets ..................... 151
Table 5.2: Conclusive list of universal analytical GIS operations ................................... 163
Table 6.1: Input data layers with illustrative weighting values ........................................ 190
Table 7.1: Integration matrix showing commonalities between development planning,
environmental management and disaster risk management.......................................... 197
Table 9.1: Summary of research objectives and related chapters ................................. 219
Table 9.2 Summary of key findings ............................................................................... 225
xx
CHAPTER 1: ORIENTATION AND PROBLEM STATEMENT
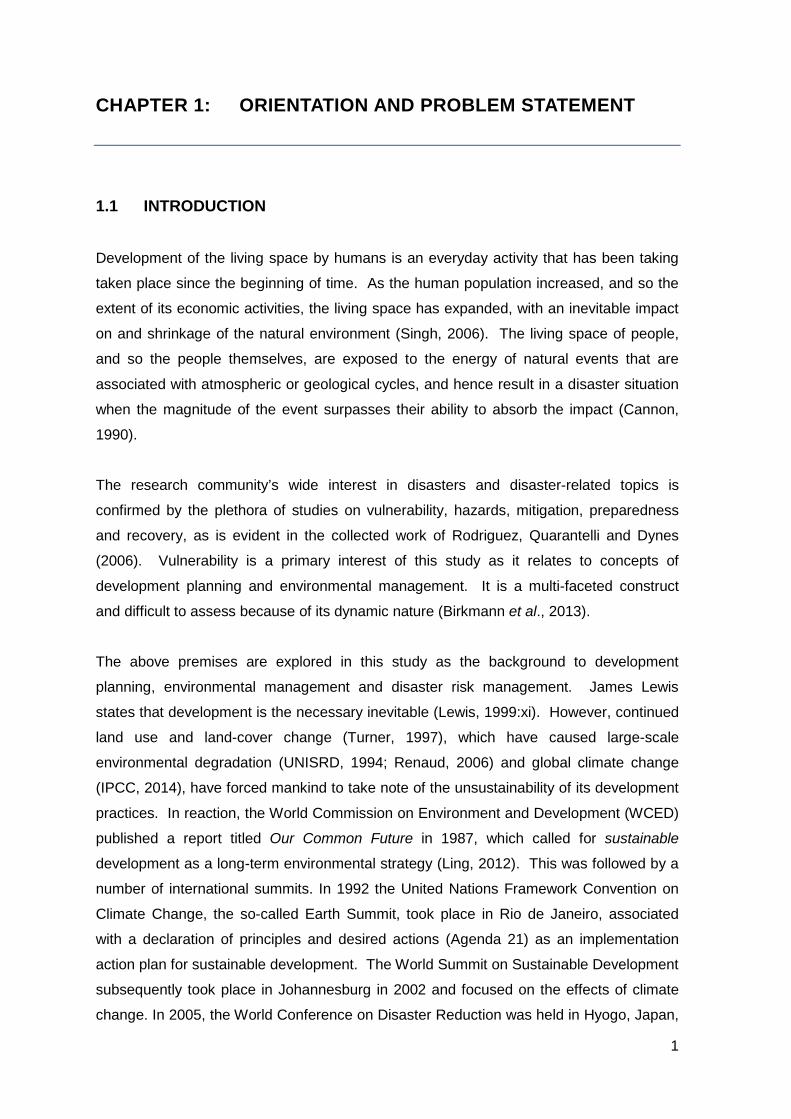
1.1 INTRODUCTION
Development of the living space by humans is an everyday activity that has been taking
taken place since the beginning of time. As the human population increased, and so the
extent of its economic activities, the living space has expanded, with an inevitable impact
on and shrinkage of the natural environment (Singh, 2006). The living space of people,
and so the people themselves, are exposed to the energy of natural events that are
associated with atmospheric or geological cycles, and hence result in a disaster situation
when the magnitude of the event surpasses their ability to absorb the impact (Cannon,
1990).
The research community’s wide interest in disasters and disaster-related topics is
confirmed by the plethora of studies on vulnerability, hazards, mitigation, preparedness
and recovery, as is evident in the collected work of Rodriguez, Quarantelli and Dynes
(2006). Vulnerability is a primary interest of this study as it relates to concepts of
development planning and environmental management. It is a multi-faceted construct
and difficult to assess because of its dynamic nature (Birkmann et al., 2013).
The above premises are explored in this study as the background to development
planning, environmental management and disaster risk management. James Lewis
states that development is the necessary inevitable (Lewis, 1999:xi). However, continued
land use and land-cover change (Turner, 1997), which have caused large-scale
environmental degradation (UNISRD, 1994; Renaud, 2006) and global climate change
(IPCC, 2014), have forced mankind to take note of the unsustainability of its development
practices. In reaction, the World Commission on Environment and Development (WCED)
published a report titled Our Common Future in 1987, which called for sustainable
development as a long-term environmental strategy (Ling, 2012). This was followed by a
number of international summits. In 1992 the United Nations Framework Convention on
Climate Change, the so-called Earth Summit, took place in Rio de Janeiro, associated
with a declaration of principles and desired actions (Agenda 21) as an implementation
action plan for sustainable development. The World Summit on Sustainable Development
subsequently took place in Johannesburg in 2002 and focused on the effects of climate
change. In 2005, the World Conference on Disaster Reduction was held in Hyogo, Japan,
1
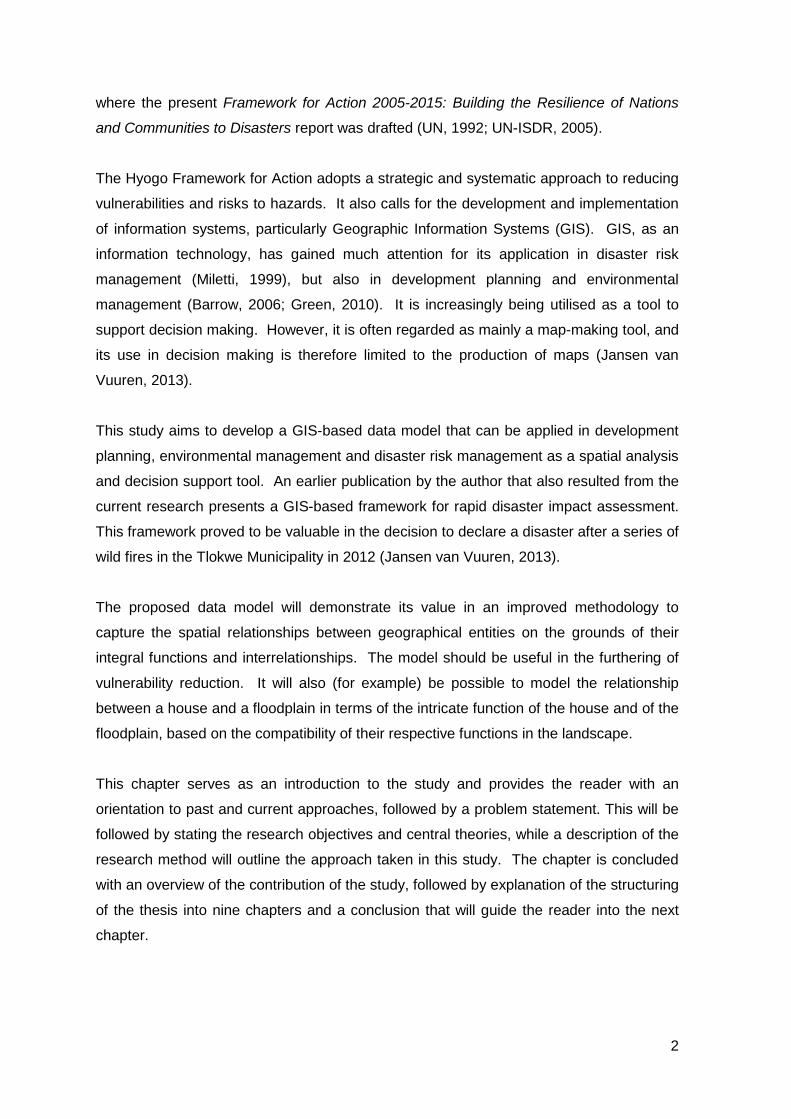
where the present Framework for Action 2005-2015: Building the Resilience of Nations
and Communities to Disasters report was drafted (UN, 1992; UN-ISDR, 2005).
The Hyogo Framework for Action adopts a strategic and systematic approach to reducing
vulnerabilities and risks to hazards. It also calls for the development and implementation
of information systems, particularly Geographic Information Systems (GIS). GIS, as an
information technology, has gained much attention for its application in disaster risk
management (Miletti, 1999), but also in development planning and environmental
management (Barrow, 2006; Green, 2010). It is increasingly being utilised as a tool to
support decision making. However, it is often regarded as mainly a map-making tool, and
its use in decision making is therefore limited to the production of maps (Jansen van
Vuuren, 2013).
This study aims to develop a GIS-based data model that can be applied in development
planning, environmental management and disaster risk management as a spatial analysis
and decision support tool. An earlier publication by the author that also resulted from the
current research presents a GIS-based framework for rapid disaster impact assessment.
This framework proved to be valuable in the decision to declare a disaster after a series of
wild fires in the Tlokwe Municipality in 2012 (Jansen van Vuuren, 2013).
The proposed data model will demonstrate its value in an improved methodology to
capture the spatial relationships between geographical entities on the grounds of their
integral functions and interrelationships. The model should be useful in the furthering of
vulnerability reduction. It will also (for example) be possible to model the relationship
between a house and a floodplain in terms of the intricate function of the house and of the
floodplain, based on the compatibility of their respective functions in the landscape.
This chapter serves as an introduction to the study and provides the reader with an
orientation to past and current approaches, followed by a problem statement. This will be
followed by stating the research objectives and central theories, while a description of the
research method will outline the approach taken in this study. The chapter is concluded
with an overview of the contribution of the study, followed by explanation of the structuring
of the thesis into nine chapters and a conclusion that will guide the reader into the next
chapter.
2
1.2 ORIENTATION AND PROBLEM STATEMENT
Vulnerability is an indicator of disaster risk (Blaikie et al., 1994; Lewis, 1999; Turner et al.,
2003a;2003b; Bankoff, Frerks & Hilhorst, 2004; ISDR, 2004; Kienberger, Lang & Zeil,
2009). It reflects the reality of what makes people and environmental assets susceptible
to hazards (ISDR, 2004). The concept of vulnerability has emerged from continuing
research on risks and hazards and has been brought to the fore by climate change
studies (Turner et al., 2003a; Kienberger et al., 2009; Prabhakar, Srinivasan & Shaw,
2009). It has emerged as a multi-faceted concept, realising the complexity of physical,
social, economic and environmental conditions at hand (Blaikie et al., 1994:21; Coppola,
2007:148; ISDR, 2002:46).
Vulnerability can be defined in many ways, but it mostly underpins aspects of
susceptibility of a receiving environment to the impacts of hazards (Blaikie et al., 1994:9;
Lewis, 1999:4; ISDR, 2002:46; Turner et al., 2003a; Wisner, Blaikie, Cannon & Davis,
2004:97). Oliver-Smith (2004:10) describes vulnerability as a political-ecological concept
that focuses on the relationship between people and the environment in which they live.
From a disaster risk perspective, he describes vulnerability as “the conceptual nexus that
links the relationship that people have with their environment to social forces and
institutions and the cultural values that sustain or contest them”. The concept of
vulnerability is therefore seen as providing a theoretical framework that encompasses the
multi-dimensionality of disasters.
Underlying vulnerability is the combination of relationships within a given situation, where
a combination of social conditions and environmental forces may or may not result in a
disaster (Oliver-Smith, 2004:10). Exploring the totality of relationships ultimately involves
related concepts between socio-economic (developmental) sciences on the one hand and
environmental sciences on the other hand, thereby promoting a strong interdisciplinary
approach. Research is therefore focused on the status of and relation between human
settlement and environmental (biophysical) systems, particularly referred to as a “coupled
human-environment system” (Turner et al., 2003a). This interaction is illustrated in Figure
1.1.
The concept of physical vulnerability is rooted in material goods and considers aspects of
location and the built environment (ISDR, 2004: 68). Linked to this is the aspect of social
and economic environments, where the social component is linked to the level of
wellbeing of individuals, communities and society. Such wellbeing, in turn, is influenced by
3
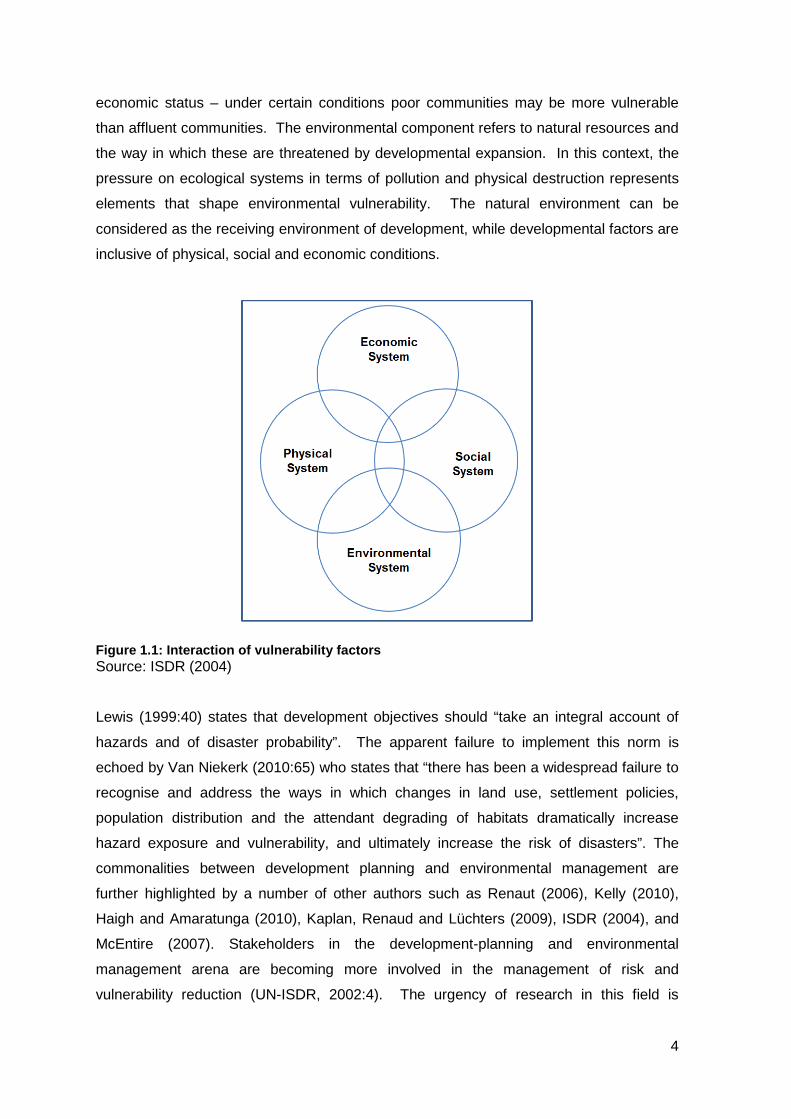
economic status – under certain conditions poor communities may be more vulnerable
than affluent communities. The environmental component refers to natural resources and
the way in which these are threatened by developmental expansion. In this context, the
pressure on ecological systems in terms of pollution and physical destruction represents
elements that shape environmental vulnerability. The natural environment can be
considered as the receiving environment of development, while developmental factors are
inclusive of physical, social and economic conditions.
Figure 1.1: Interaction of vulnerability factors Source: ISDR (2004)
Lewis (1999:40) states that development objectives should “take an integral account of
hazards and of disaster probability”. The apparent failure to implement this norm is
echoed by Van Niekerk (2010:65) who states that “there has been a widespread failure to
recognise and address the ways in which changes in land use, settlement policies,
population distribution and the attendant degrading of habitats dramatically increase
hazard exposure and vulnerability, and ultimately increase the risk of disasters”. The
commonalities between development planning and environmental management are
further highlighted by a number of other authors such as Renaut (2006), Kelly (2010),
Haigh and Amaratunga (2010), Kaplan, Renaud and Lüchters (2009), ISDR (2004), and
McEntire (2007). Stakeholders in the development-planning and environmental
management arena are becoming more involved in the management of risk and
vulnerability reduction (UN-ISDR, 2002:4). The urgency of research in this field is
4
highlighted by the UN-ISDR (2004:4), stating that "the relationships between human
actions, environmental stewardship, climate change, and disaster risks are becoming ever
more crucial".
Analysis of vulnerability considers a number of questions such as: who is vulnerable to
what and what is the spatial pattern thereof? To answer these questions, Turner et al.
(2003b) propose a conceptual framework that accounts for the vulnerability of coupled
human–environment systems. The emergence of vulnerability assessment within such a
framework is further described by Renaut (2006) and Kienberger et.al (2009) where the
use of geographical information systems as a spatial analysis tool in particular comes to
the fore.
Mora and Keipi (2006:157), Kaplan et al. (2009) and ISDR (2004) describe the link
between development planning, environmental management and disaster risk
management as functions where the one should take the other into consideration. This
holistic approach is imperative if healthy and safe environments are to be provided for
people wherever they live – in cities, towns or rural villages. In this regard, Hardoy, Mitlin
and Satterthwaite (2001:2) identify certain goals that settlements have to meet to be
successful in providing safe environments. These goals include the provision of water
supply, sanitation, waste management and health services as essential service delivery.
They also include the wider context of natural resources and exploitation thereof and the
demand for sustainable relationships between the demands of consumers to draw from
ecosystems and the way in which they draw their resources.
The goal of achieving an ecologically sustainable relationship between the built
environment and the natural environment puts development and conservation into the
equation of disaster risk reduction, meaning that disaster risk reduction becomes a
function of development planning and environmental management (Randolph, 2004:203).
This is echoed by Hardoy et al. (2001:3) who state that understanding the links between
the built environment and the physical environment is essential if environmental hazards
are to be minimised. Lewis (1999:xi) describes development as “the necessary
inevitable”, but also as an “appropriate vehicle for vulnerability and disaster reduction”.
Whereas disaster risk reduction is a function of government as well as communities
(Randolph, 2010; Haigh & Amaratunga, 2010), some institutional capacity is required to
act as a vehicle for communication and implementation. Hardoy et al. (2001:3) describe
the need for political and administrative systems that will take up the views and priorities
5
of communities, through which policies can be put into place and that will ensure that
actions are carried out in response to community needs. Such administrative
arrangements should also be imbedded in legal systems that safeguard citizens’ rights to
basic services and a healthy living environment. Lewis (1999:5) echoes this viewpoint by
referring to a social, institutional and political responsibility to protect communities from
the causes of disasters. Efforts to remove or alleviate those causes, give rise to the
concept of institutional capacity.
Otim (2006) links vulnerability to institutional capacity. According to him, the realities of
natural disasters such as hurricanes that occur regularly, and the way in which they are
managed, still reveal “institutional vulnerability and inadequacy of decision models to
confront large-scale disasters”. A key aspect of institutional capacity is the use of
information systems to inform decision makers and policy makers. Margetts (1999)
describes how information systems have brought government to the ‘ante-postmodernist’
era, becoming a vital part of the state. The power of information systems is demonstrated
in the fact that they can take over and reshape the organisational role of government.
Whereas this viewpoint is described from a Western perspective, referring to Britain and
America, Cavric (2002) describes the apparent failure of information systems and in
particular Geographical Information Systems (GIS) in developing countries. According to
him there is a dire need for research to address “the problem of human familiarisation and
organisational frameworks in which newly established GIS units [are] supposed to
function”.
The use of Geographic Information Systems (GIS) as a tool to analyse and visually
represent a range of variables, attributes and phenomena is described by Bankoff et al.
(2004:45). Van Deursen, Wesseling and Karssenberg (2000) sketch a picture of GIS and
Information Technology (IT) specialists who are regarded as technologists on the one
hand and end-users who are domain experts on the other hand. GIS specialists have
knowledge of and control over the technology to develop applications for users in various
fields. The end-users (domain experts) are allowed access to these applications to fulfil
various tasks, such as entering new data and retrieving information. This kind of access
is limited to the degree in which the application has been designed to allow for such
functions. Understanding the technical aspects of the technology, the GIS expert will
know how to exploit its powers to the full extent and will often try to allow for the maximum
functionality without knowledge of the application field (Van Deursen et al., 2000). Further
problems with regard to GIS applications relate to operational aspects such as data
6
capturing, visualisation and data management (Van Oosterom, Zlatanova & Fendel, 2005)
which often result in the technology not being implemented (Cavric, 2002).
On the other hand, domain experts study their particular problem areas and are not
directly involved in the development of GIS applications (Van Deursen et al., 2000). Due
to the described situation, GIS tools tend to become intimidating to the extent that users
will often revert back to their traditional methods. Instead of gaining access to these
technologies, domain experts will then continuously have to rely on the GIS experts to
make changes to or develop new tools (Van Deursen et al., 2000). In this regard,
McEntire (2004:17) warns against an over-reliance on computer technology since it “may
make us vulnerable to complicated and cascading disasters”.
These apparent problems with the use of GIS and the domain of information technology
at large require that further attention be given to the drivers of disaster risk reduction. The
Global Assessment Report on Disaster Risk Reduction (2009) describes three underlying
drivers of disaster risk, i.e. vulnerable rural communities, poor urban governance and
declining ecosystems. Recognising the inherent link between the environment and
disasters, the Disaster Environment Working Group for Asia (DEWGA) undertook a study
to identify available resources that link environmental management with disasters and risk
reduction efforts (Asian Disaster Management News, 2009). One of the objectives of the
study is to “[r]aise awareness of the intersections of environment, disasters and
development and thereby provide a practical and common basis for practitioners from
various sectors to discuss and agree on concrete plans and activities to advance
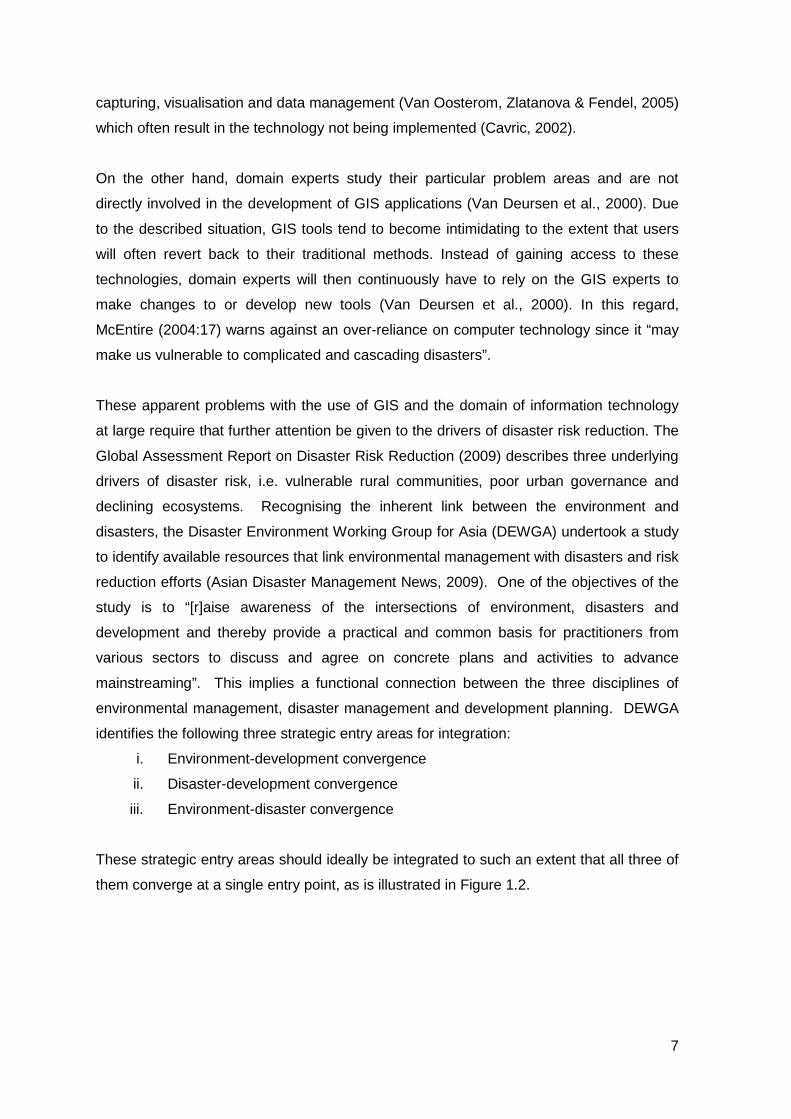
mainstreaming”. This implies a functional connection between the three disciplines of
environmental management, disaster management and development planning. DEWGA
identifies the following three strategic entry areas for integration:
i. Environment-development convergence
ii. Disaster-development convergence
iii. Environment-disaster convergence
These strategic entry areas should ideally be integrated to such an extent that all three of
them converge at a single entry point, as is illustrated in Figure 1.2.
7
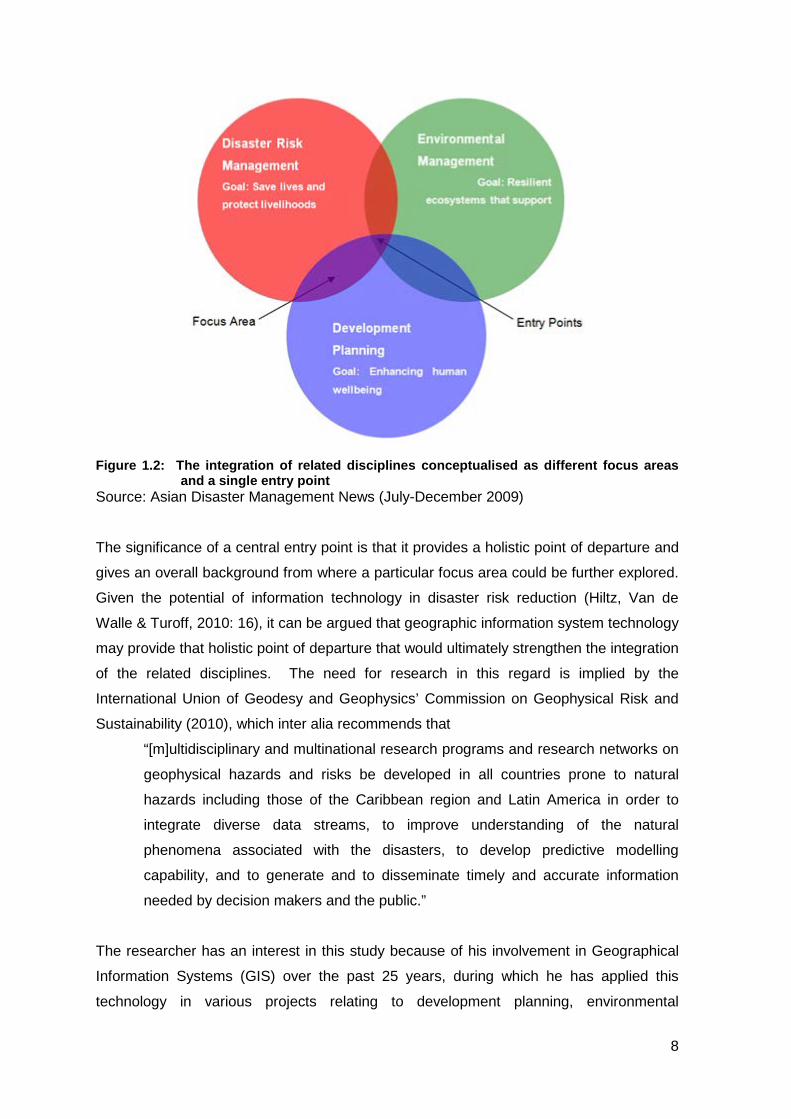
Figure 1.2: The integration of related disciplines conceptualised as different focus areas and a single entry point
Source: Asian Disaster Management News (July-December 2009)
The significance of a central entry point is that it provides a holistic point of departure and
gives an overall background from where a particular focus area could be further explored.
Given the potential of information technology in disaster risk reduction (Hiltz, Van de
Walle & Turoff, 2010: 16), it can be argued that geographic information system technology
may provide that holistic point of departure that would ultimately strengthen the integration
of the related disciplines. The need for research in this regard is implied by the
International Union of Geodesy and Geophysics’ Commission on Geophysical Risk and
Sustainability (2010), which inter alia recommends that
“[m]ultidisciplinary and multinational research programs and research networks on
geophysical hazards and risks be developed in all countries prone to natural
hazards including those of the Caribbean region and Latin America in order to
integrate diverse data streams, to improve understanding of the natural
phenomena associated with the disasters, to develop predictive modelling
capability, and to generate and to disseminate timely and accurate information
needed by decision makers and the public.”
The researcher has an interest in this study because of his involvement in Geographical
Information Systems (GIS) over the past 25 years, during which he has applied this
technology in various projects relating to development planning, environmental
8
management and disaster risk management. The type of projects include development
plans on a local and regional level, environmental management frameworks,
environmental impact studies and disaster risk assessments. The GIS component of
these projects includes two perspectives, i.e. design and application. It involves GIS
database design and a wide array of applications such data capture, data processing,
spatial analysis, and mapping. A further interest in education and research has also
inspired this study. The researcher is associated with the African Centre for Disaster
Studies at the North-West University and has published research work in the accredited
Jamba Journal of Disaster Risk Studies in 2006 and 2013. The research undertaken for
the latter publication forms part of the current research and informs components thereof.
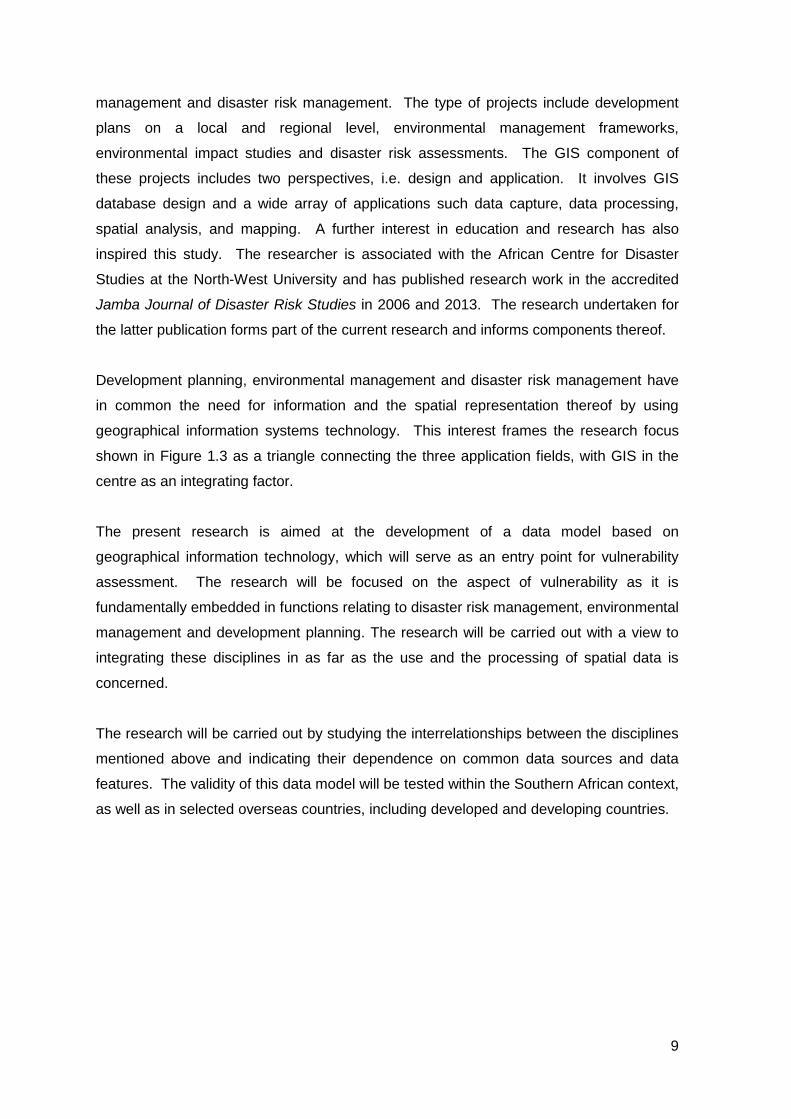
Development planning, environmental management and disaster risk management have
in common the need for information and the spatial representation thereof by using
geographical information systems technology. This interest frames the research focus
shown in Figure 1.3 as a triangle connecting the three application fields, with GIS in the
centre as an integrating factor.
The present research is aimed at the development of a data model based on
geographical information technology, which will serve as an entry point for vulnerability
assessment. The research will be focused on the aspect of vulnerability as it is
fundamentally embedded in functions relating to disaster risk management, environmental
management and development planning. The research will be carried out with a view to
integrating these disciplines in as far as the use and the processing of spatial data is
concerned.
The research will be carried out by studying the interrelationships between the disciplines
mentioned above and indicating their dependence on common data sources and data
features. The validity of this data model will be tested within the Southern African context,
as well as in selected overseas countries, including developed and developing countries.
9
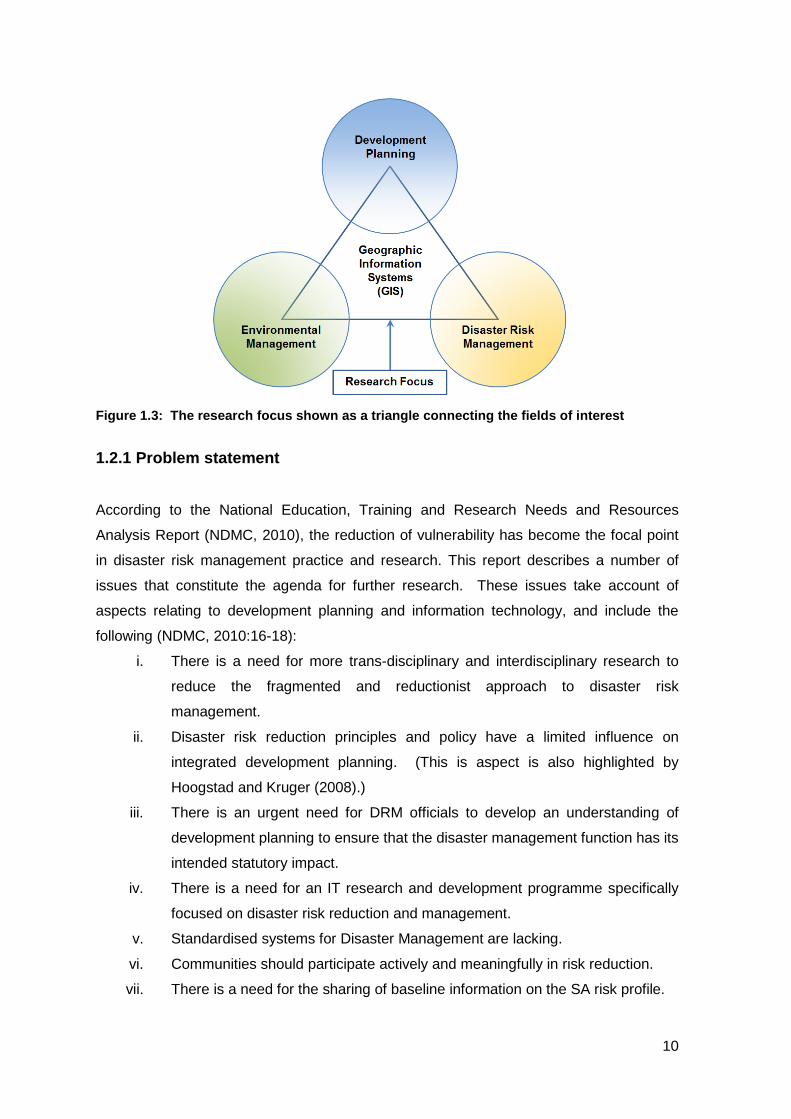
Figure 1.3: The research focus shown as a triangle connecting the fields of interest
1.2.1 Problem statement
According to the National Education, Training and Research Needs and Resources
Analysis Report (NDMC, 2010), the reduction of vulnerability has become the focal point
in disaster risk management practice and research. This report describes a number of
issues that constitute the agenda for further research. These issues take account of
aspects relating to development planning and information technology, and include the
following (NDMC, 2010:16-18):
i. There is a need for more trans-disciplinary and interdisciplinary research to
reduce the fragmented and reductionist approach to disaster risk
management.
ii. Disaster risk reduction principles and policy have a limited influence on
integrated development planning. (This is aspect is also highlighted by
Hoogstad and Kruger (2008).)
iii. There is an urgent need for DRM officials to develop an understanding of
development planning to ensure that the disaster management function has its
intended statutory impact.
iv. There is a need for an IT research and development programme specifically
focused on disaster risk reduction and management.
v. Standardised systems for Disaster Management are lacking.
vi. Communities should participate actively and meaningfully in risk reduction.
vii. There is a need for the sharing of baseline information on the SA risk profile.
10
These issues remind of the commonalities between development planning, environmental
management and disaster risk management, which have been described above. These
disciplines are characterised by a plethora of tools assisting in various activities relating to
planning, checking and acting (Nel & Kotze, 2009; Koua et al., (2010). For example,
development planning is assisted by Spatial Development Frameworks (SDFs),
Integrated Development Plans (IDPs), environmental management by Environmental
Impact Assessments (EIAs), strategic environmental assessments (SEAs), disaster risk
management by Disaster Management Plans (DMPs) and disaster risk assessments
(DRAs). The apparent failure to integrate these tools in disaster risk management – as
described by Hoogstad and Kruger (2008), the National Disaster Management Centre
(2010) and Van Niekerk (2010) – highlights the need for an alternative approach to
interdisciplinary research. Such an approach draws on the universal premises between
these disciplines and goes beyond close collaboration between domain specialists
(Barrow, 2006:4). One such universal premise or common theme is the use of
information. Given the challenges with regard to the use of information technology and in
particular GIS in disaster risk management, as described above, it is postulated that the
systematic integration of information technology in the processes relating to development
planning, environmental management and disaster risk reduction will assist in
understanding vulnerability as a multi-faceted phenomenon. Therefore, and in the light of
the above discussion, the problem under investigation is the integration of development
planning, environmental management and disaster risk management into a GIS-based
data model that captures the relationships between anthropological and ecological entities
in an interrelated database, which will be useful to analyse vulnerability in various facets.
1.2.2 Key research questions With reference to the problem statement above, the research will aim to answer the
following key research questions:
• What is the theoretical grounding of development management, environmental
management, disaster risk reduction and GIS?
• What common focus areas in development management, environmental
management and disaster risk reduction can be identified?
• What is model development and data modelling in GIS?
• What is the entry point for development management, environmental management
and disaster risk reduction to be integrated in a data model for vulnerability
reduction?
11
• What would a GIS-based data model for vulnerability reduction entail?
• What recommendations can be made for the implementation of a GIS-based data
model for vulnerability reduction?
1.3 RESEARCH OBJECTIVES
The primary objective of the study is to develop a GIS-based data model that will be
useful in development planning, environmental management and disaster risk
management. A specific focus is vulnerability, as it is influenced by policy and patterns in
each of these fields. The application of the model must be useful particularly in respect of
vulnerability reduction.
To reach this objective, a sequence of secondary objectives is identified which expands
the research topic into its underlying ontologies:
i. Define and investigate the theoretical grounding of development management,
environmental management, disaster risk reduction and geographical
information systems.
ii. Identify the common focus areas in development management, environmental
management and disaster risk reduction.
iii. Describe model development and data modelling in GIS.
iv. Determine the entry point for development management, environmental
management and disaster risk reduction to be integrated in a data model for
vulnerability reduction.
v. Provide recommendations for the implementation of a GIS-based data model
for vulnerability reduction.
12
1.4 CENTRAL THEORETICAL STATEMENT
This study looks at GIS as an overarching technology that supports development
planning, environmental management and disaster risk management. The following
theoretical statements that reflect views in these disciplines guide this study:
i. Disaster risk management is a multi-disciplinary field that is influenced by
disciplines such as environmental management and development planning
(McEntire, 2004; Randolph, 2004; Haigh & Anaratunga, 2010; Van Niekerk, 2010).
ii. Vulnerability is a complex aspect. In trying to understand this complex system, a
need for analysis arises which should bring together different interactions between
man, nature and society (Trim, 2004).
iii. Information is one of the elements that bring together the various disciplines that
are implied in disaster risk management by explaining the interactions between
man and the environment from within these disciplines (Haigh & Anaratunga,
2010; Charlton & Andras, 2003).
iv. A clear understanding of the perspectives and problems of these disciplines is
imperative for successful implementation of GIS technology. A GIS paradigm built
around these concepts and perspectives would enable systems that deliver the
power of GIS technology to the end user (Van Deursen et al., 2000).
v. The implementation of risk reduction policies requires interdisciplinary strategies,
tools and approaches to ensure proper management and resourcing of pre-
disaster, disaster and post-disaster efforts. There are strong calls for
interdisciplinary solutions to address the many and varied challenges that
disasters create (Haigh & Amaratunga, 2010).
vi. Information is fundamental to any system, irrespective of the discipline (Shastri,
Diwekar & Cabezas, 2008).
vii. The integration of environmental and social considerations is a challenge that
requires the development of methods, processes and data streams to create
capacity for sustainable development, with the aim of reducing vulnerability.
viii. Apart from vulnerability, there are a variety of other topics that have a bearing on
or a relation to disasters, such as attitudes about development and record keeping
(McEntire, 2008). Record keeping can include any aspect of development or
disaster events.
ix. Research that goes beyond disciplinary boundaries is core to understanding linked
phenomena, and to informing policy and management settings (Dovers, 2005).
13
1.5 RESEARCH METHOD
A qualitative research design is used to conduct the present research as it is useful in
exploring processes and links. This approach helps to interpret and better understand the
complex reality of how development planning, environmental management reduction and
disaster risk management are interlinked with one another. The design includes a
literature study and an empirical study, and is briefly highlighted as follows (the reader is
also referred to Figure 1.4 which gives a diagrammatic overview of the research method):
1.5.1 Literature study
A variety of literature is studied as the primary data source for this research. It includes
books, academic articles, reports, conference proceedings and research reports or
document that are focused on the theory of development planning, environmental
management and disaster risk management. The purpose of the literature study is to
discover commonalities between these disciplines and to identify interrelationships, as
these are central to the research topic.
1.5.2 Empirical study A synthesis of the literature study highlights commonalities and interrelationships between
development planning, environmental management and disaster risk management
(Chapters 6 and 7). By applying principles of database theory (described in Chapter 5), a
GIS-based data model is developed and tested in a case study. The method for
constructing the data model is based on grounded theory and described in the following
paragraphs.
1.5.2.1 Content analysis Content analysis is the main empirical method employed in this study. It is a research
technique that can be applied to data derived from texts for making replicable and valid
inferences in the context of the text (Krippendorff, 2004). Content analysis helps to
analyse data within a specific context, in view of the meanings that are attributed to it by a
person or a group. Theories for development planning, environmental management and
disaster risk management have developed over a relatively short period of time, and are
marked by changes and differences (Chapters 2, 3 and 4). Content analysis will not only
14
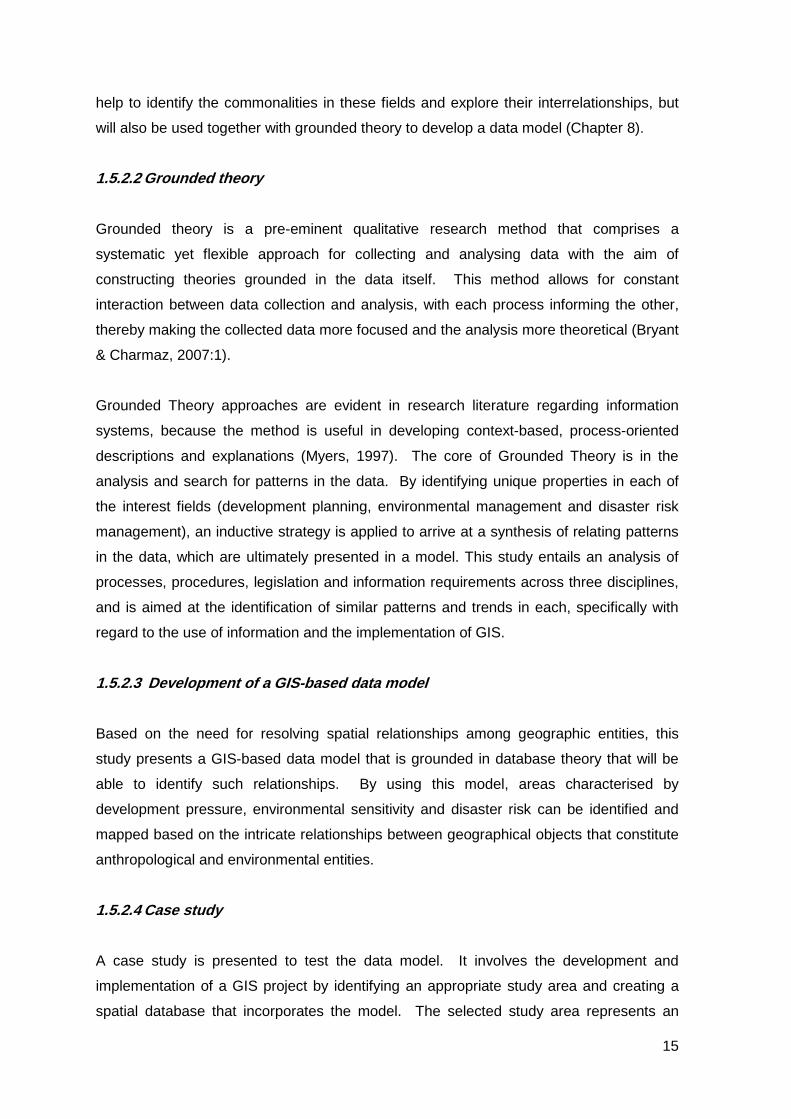
help to identify the commonalities in these fields and explore their interrelationships, but
will also be used together with grounded theory to develop a data model (Chapter 8).
1.5.2.2 Grounded theory
Grounded theory is a pre-eminent qualitative research method that comprises a
systematic yet flexible approach for collecting and analysing data with the aim of
constructing theories grounded in the data itself. This method allows for constant
interaction between data collection and analysis, with each process informing the other,
thereby making the collected data more focused and the analysis more theoretical (Bryant
& Charmaz, 2007:1).
Grounded Theory approaches are evident in research literature regarding information
systems, because the method is useful in developing context-based, process-oriented
descriptions and explanations (Myers, 1997). The core of Grounded Theory is in the
analysis and search for patterns in the data. By identifying unique properties in each of
the interest fields (development planning, environmental management and disaster risk
management), an inductive strategy is applied to arrive at a synthesis of relating patterns
in the data, which are ultimately presented in a model. This study entails an analysis of
processes, procedures, legislation and information requirements across three disciplines,
and is aimed at the identification of similar patterns and trends in each, specifically with
regard to the use of information and the implementation of GIS.
1.5.2.3 Development of a GIS-based data model Based on the need for resolving spatial relationships among geographic entities, this
study presents a GIS-based data model that is grounded in database theory that will be
able to identify such relationships. By using this model, areas characterised by
development pressure, environmental sensitivity and disaster risk can be identified and
mapped based on the intricate relationships between geographical objects that constitute
anthropological and environmental entities.
1.5.2.4 Case study A case study is presented to test the data model. It involves the development and
implementation of a GIS project by identifying an appropriate study area and creating a
spatial database that incorporates the model. The selected study area represents an
15
area in Richards Bay that is characterised by development pressure, environmental
sensitivity and communities’ vulnerability to flooding. The GIS database consists of
existing data, as well as a land cover-based dataset of spatial objects created for the
purpose of the study. By manipulating variables in the model, the researcher
demonstrates how different scenarios of vulnerability can be simulated without changing
the spatial data. Maps generated from spatial queries are included to illustrate the
functioning of the model.
1.5.3 In-depth interviews As a professional GIS Science Practitioner, the researcher is involved in multi-disciplinary
projects on a daily basis. His specialisation is in development planning, environmental
management and disaster risk management. During the course of this study he took the
opportunity to conduct in-depth interviews with professionals working in these fields and
to extract from their knowledge and experience. The information gained could be applied
to
i. triangulate findings from the literature study,
ii. determine the professionals’ perceptions on the use of GIS in their respective
fields, and
iii. test the applicability of the data model in the field.
Following a deductive approach, the research method is applied to develop a GIS-based
model based on the commonalities extracted from development planning, environmental
management and disaster risk management theories. These were applied according to
database principles that were extracted from the information systems theory. The reader
is next referred to Figure 1.4 which gives a visual presentation of the development of
chapters in this report.
16
Figure 1.4: A structural layout of the study method
1.6 CONTRIBUTION MADE BY THE STUDY
The orientation sketch above indicates that there is a strong link between the disciplines
of development planning, environmental management and disaster risk management.
The study provides a GIS-based data model for integrated database development, taking
into account the vulnerability of communities, the sensitivity of the environment and the
pressures of development in a sustainable planning context. The model is practical in
nature and can be used by practitioners in development planning, environmental
management and disaster risk management alike. It can also be incorporated in the day-
to-day functioning of government departments, municipal offices and other institutions
where information systems for disaster risk management are being used – specifically
where work is focused on the reduction of vulnerability. The study will therefore add value
to the body of knowledge within the disaster risk management fraternity and also inform
international best practices in so far as supranational disaster risk reduction measures are
concerned. This study will therefore contribute significantly to the integration of disaster
risk management, environmental management and development planning by developing
a GIS-based data model that provides a platform for the integration of these disciplines in
a practical manner.
17
In the end, the study may provide impetus towards further research, as it presents a
framework for integration whereby inter- and intradisciplinary approaches can be
facilitated.
1.7 CHAPTERS IN THE STUDY
The study is structured into nine chapters that render a thematic exposition of the topic.
The diagram in Figure 1.5 provides a graphical overview of the structure of the study.
The theme and purpose of each chapter is briefly indicated and discussed below:
Chapter 1 introduces the reader to the problem statement, key research questions, as
well as aim and objectives of this study. The idea and motivation for the study is
explained by placing development planning, environmental management and disaster risk
management into context. The research methodology is outlined and the contribution of
this study to the body of knowledge in the field of development management is described.
A theoretical grounding of the study is developed through examining three interrelated
disciplines: development planning, environmental management and disaster risk
management. Underlying these, is geographic information systems which, as a fourth
discipline, provides further grounding to this study. To effectively explore the theoretical
aspects that contributed to each field, their historical development and theoretical models
are described in three separate and consecutive chapters. Development planning is
explored in Chapter 2, environmental management in Chapter 3, disaster risk
management in Chapter 4, and geographic information systems in Chapter 5.
Chapters 6 and 7 are aimed at finding commonalities among development planning,
environmental management and disaster risk management. Chapter 6 focuses on
frameworks and models that have been developed in these three disciplines and provides
a bridge to the development of a data model that can integrate them. Chapter 7 serves to
identify the commonalities between the three disciplines and provides a framework for the
model to be developed in the next chapter.
Chapter 8 provides a background to the concept of data models and describes the
development of a GIS-based data model that integrates development planning,
environmental management and disaster risk reduction on the grounds of spatial
relationships.
18
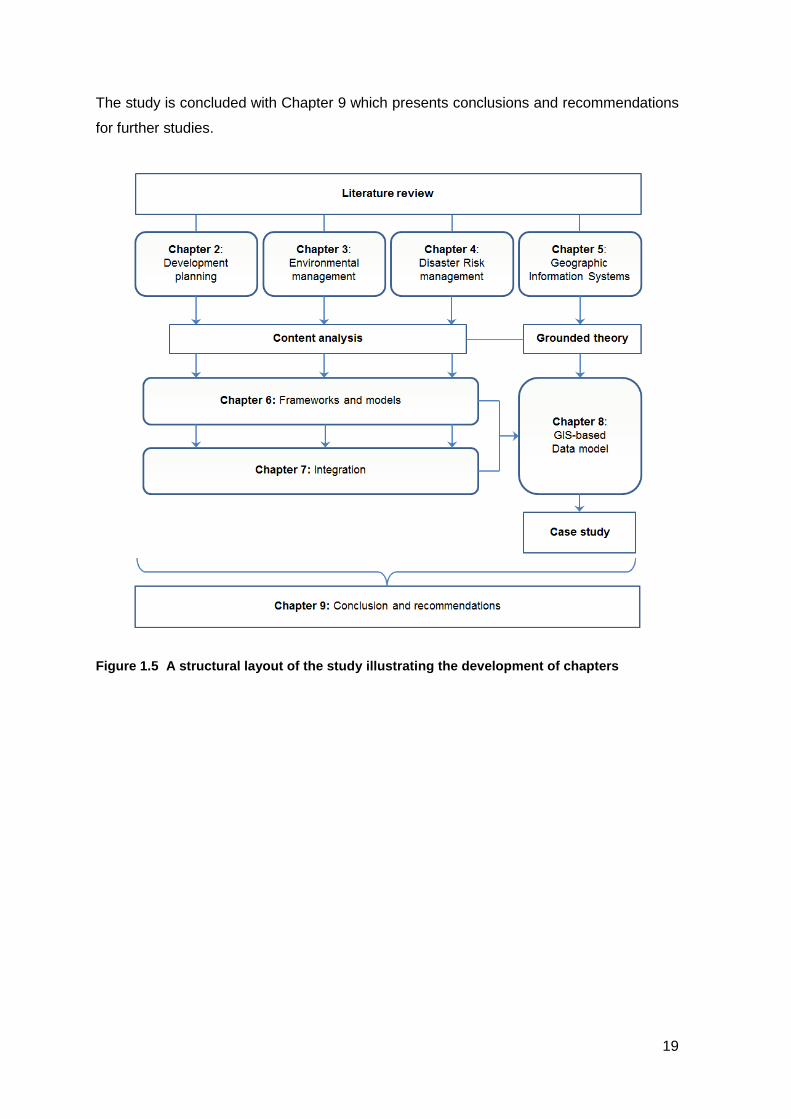
The study is concluded with Chapter 9 which presents conclusions and recommendations
for further studies.
Figure 1.5 A structural layout of the study illustrating the development of chapters
19
1.8 CONCLUSION
Chapter 1 provided an overview of the background to the study and explained the reason
for the author’s interest in the research. An orientation towards and the key concepts of
the four disciplines included in the study were followed by a statement of the research
problem. The central theoretical statements that will guide this study were listed and the
research method described in detail. A number of diagrams were used to give a visual
representation of the research focus, the study method and the development of chapters.
A clear understanding of the relationship between development planning, environmental
management and disaster risk management is important to deduce common aspects
between these fields. The spatial context of these commonalities provides further insight
into the requirements for a GIS-based data model, which in turn is informed by GIS
science theory. An in-depth study of the underlying theories is undertaken and described
in the four chapters that follow, starting with development planning in Chapter 2.
20
CHAPTER 2: THEORY OF DEVELOPMENT PLANNING
2.1 INTRODUCTION
Development planning is an activity undertaken by the state (Friedmann, 1998; Van
Niekerk, 2005; Marcellus, 2009; Oranje, 2010) to set in place visions, goals and means of
realising development through effective direction and control (Marcellus, 2009). Different
types of legislation in South Africa, such as the Municipal Systems Act (Act 32 of 2000),
and the Spatial Planning and Land Use Management Act (Act 16 of 2013) require organs
of state such as municipalities to have certain plans in place, for example Integrated
Development Plans (IDPs) and Spatial Development Plans (SDFs) (South Africa, 2000;
South Africa, 2013). One of the purposes of an IDP is to provide a vision for the long-
term development of a municipality with special emphasis on the municipality’s most
critical development and internal transformation needs. SDFs are required to guide
planning and development decisions across all sectors of government, and they represent
the spatial development vision of the responsible sphere of government. Other planning
instruments include special initiatives and government policy such as Spatial
Development Initiatives (SDIs), which are aimed at regional growth and development
(Oranje, 2010). Based on lessons learnt with regard to regional development in the
European Community, SDIs are focused on expenditure on social and economic
infrastructure in areas with the potential for economic growth. Lastly, the National
Development Plan is mentioned, which provides a developmental vision to eliminate
poverty and reduce inequality by 2030 (South Africa, 2011).
The integration of development plans with other government sectors such as disaster
management and environmental management is evident (van Wyk, 2003). Not only must
an IDP provide the vision for long-term development of a municipality, it must also include
an appropriate disaster management plan. This is reinforced by the Disaster
Management Act 57 of 2002, which prescribes that a disaster management plan must
form an integral part of a municipality’s IDP. Furthermore, the Environmental
Management Framework (EMF) Regulations of 2010 provide for the inclusion of SDFs
and IDPs in the preparation of an EMF (South Africa, 2012).
21
An integrative development planning process prescribed by legislation and policy is
emphasised above. In practice, commonalities between development planning,
environmental management and disaster risk management are also evident (ISDR, 2004;
Renaud, 2006; McEntire, 2007; Kaplan et al., 2009; Leidel et al., 2009; Haigh &
Amaratunga, 2010; Kelly, 2010).
Environmental, social and economic conditions can have positive and negative influences
on human health and wellbeing (Duhl & Sanchez, 1999), which in turn affect the
vulnerability of communities to hazards – whether natural or anthropogenic. Awareness
of human-induced conditions that increase vulnerability to natural disasters is frequently
raised on international platforms such as the UN. In the foreword to Living with Risk: A
Global Review of Disaster Reduction Initiatives (UN-ISDR, 2003), the then Secretary-
General of the UN, Kofi Annan, is quoted to have said:
“Destitution and demographic pressure have led more people than ever before to
live in flood plains or in areas prone to landslides. Poor land-use planning;
environmental management; and a lack of regulatory mechanisms both increase
the risk and exacerbate the effects of disasters.”
The interaction between development, vulnerability and disaster risk management is
evident. Lewis (1999:40) states that development objectives should “take an integral
account of hazards and of disaster probability”. The apparent failure to implement this is
echoed by Van Niekerk (2010:65) who believes that “there has been a widespread failure
to recognise and address the ways in which changes in land use, settlement policies,
population distribution and the attendant degrading of habitats dramatically increase
hazard exposure and vulnerability, and ultimately increase the risk of disasters”.
In order to understand the intersection between development planning, disaster risk
management, as well as environmental management, it is important to gain insight into
the development planning paradigm and its theoretical underpinnings. The objective of
this chapter is therefore to define and investigate the theoretical grounding of
development planning. The chapter is structured along two main lines: conceptualisation
of development, and conceptualisation of planning. It further looks at development
planning as in integrated endeavour, and lastly examines the link between development
planning and information.
22
2.2 CONCEPTUALISATION OF DEVELOPMENT
According to Pieterse (2010:8), development theory is influenced by its historical context
and political circumstances. Understanding development theory in its historical context
therefore means understanding it as a response to problems and arguments raised at the
time. Next, an overview of the history of development studies is given, followed by an
exposition of different theories.
2.2.1 Development theory
The formative period of ‘modern’ development economic theory was the first two decades
after the Second World War (Pieterse, 2010:41). The period was characterised by two
focus areas for development policy; firstly, economic development and reconstruction
after the war, and secondly, decolonisation and the development of new independent
countries. A decade-by-decade overview of advances in development theory is given in
the next paragraphs and demonstrates the change in views on development in recent
history by drawing on the work of Potter (2014).
2.2.1.1 The 1940s The inaugural speech of the United States’ newly elected President Truman on 20
January 1949 is generally regarded as the origin of development thoughts and practice,
as described by Esteva (1992), Sidaway (2012), and Potter (2014). Standing firm against
communism and with a focus on peace and recovery after World War II, Truman
announced four major courses of action as a post-war vision. The first involved support to
the United Nations; the second, programmes for world economic recovery; the third,
strengthening security against aggression, and the fourth, a programme of upliftment of
underdeveloped areas by making use of US-based scientific advances and industrial
progress. As mentioned above, the latter is cited most when defining development
studies. A shift away from imperialism further marked the speech in which Truman stated
that “[w]hat we envisage is a program of development based on the concepts of
democratic fair-dealing. All countries, including our own, will greatly benefit from a
constructive program for the better use of the world’s human and natural resources”. The
impact of this speech is summarised by Esteva (1992:7) as a “political and philosophical
proposition of Marx, packaged American-style as a struggle against communism …
succeeding in permeating both the popular and intellectual mind for the rest of the
century”.
23

2.2.1.2 The 1950s This decade saw continued post-war reconstruction and economic development.
Underdevelopment was regarded as an initial state beyond which Western industrialised
countries have managed to progress (Potter, 2014:51). In terms of scientific advances,
the concept of a “new geography” was formed, which searched for explanations of the
real world by means of development models and quantitatively derived generalisations
and laws. At the time, there was still not a separate field of development studies.
2.2.1.3 The 1960s This period saw the emergence of new political thoughts that started to reflect in
mainstream sociological sciences to a lesser or greater extent (Potter, 2014:51). The so-
called 'dependency theory' emerged, rooted in Latin American and Caribbean
development. It was argued that the Western model for development had served to keep
the poor world poor, rather than accelerating development in those countries.
Dependency theory further argued that it would be better for 'undeveloped' countries to
de-link from the Western-led development model and follow an alternative path. The
1960s also saw the emergence of interdisciplinary development studies, with the lead
taken by British institutions, as mentioned above. It was also during this time that the
quantitative revolution in Geography appeared as a new research methodology. The
emergence of GIS technology was also noted, as will be discussed in Chapter 5.
2.2.1.4 The 1970s The 1970s were marked by the emergence of a humanistic approach and a critique of
top-down neo-classical-inspired development policies that see economic growth as
contingent upon the accumulation of human capital and technological progress (Stone,
2004; Potter, 2014:51). The acceptance of political-economic approaches encouraged
the emergence of development geography as a distinct sub-discipline. Alternative and
humanistic-oriented approaches influenced thinking about development practice, and led
to the emergence of ‘another development’ thinking.
2.2.1.5 The 1980s Yet a new thinking on development practice and policy developed in the 1980s,
characterised by neo-conservatism. This gave rise to a neo-liberal agenda and the view
that liberal free trade and unregulated markets should be left to make their own economic
decisions, as reflected by policies introduced by Prime Minister Margaret Thatcher in the
24
UK and President Ronald Reagan in the US (Potter, 2014:52). Development studies
were by then firmly established as a distinct field, with a focus on Europe and North
America.
2.2.1.6 The 1990s At the start of this decade, postmodernism emerged as an alternative paradigm to the
social sciences. This paradigm suggested that emphasis should be placed on a wide
range of views and discourses, of which ‘development’ would be one of various meta-
narratives (big explanations) associated with modernising as the inevitable path to
development (Potter, 2014:52). The success of Western and Eurocentric approaches of
development as rooted in the advances of the 1940s and 1950s was questioned, and new
views such as ‘anti‘, ‘post‘ and ‘beyond’ development started to emerge.
2.2.1.7 2000 and onward The new millennium saw an increased focus on climate change and the impact of
development on the environment (Potter, 2014:53). Realities of the global financial crisis,
unregulated and unruly globalisation, and global conflict reflected novel issues that gave a
new face to development.
Since it was studied from various perspectives such as geographical division or economic
powers (Potter et al., 2008; Hopper, 2012; Sidaway, 2012), economic growth (Robbins,
1968; Woolcock & Narayan, 2000) and structural societal change (Sumner & Tribe, 2008),
thinking about development was characterised by debate and controversy, especially in
relation to development theory. Sumner and Tribe (2008:10) rightfully state that the
definition of ‘development’ has been controversial and unstable over time. The subject
has over time accrued many different approaches, areas of interest and theories and has
thus developed as a multi-faceted phenomenon (Hopper, 2012:11). This character is
reflected in two major theoretical approaches that define development, i.e. a geographical
and a historical-political perspective of development and economic growth. The first
examines development in terms of a geographical division of different regions or power
blocks that indicate different stages and types of economic growth in parts of the world.
The second examines major strands of thought such as modernisation theory,
dependency theory, structuralism, neo-liberalism, and post-development theory (Potter et
al., 2008; Hopper, 2012).
25
An overall, encapsulating view of development is that of ‘change’. Various authors agree
that change is a common theme within most definitions of what development
encompasses (Sumner & Tribe, 2008; Potter et al., 2008; Pieterse, 2010; Hopper, 2012).
Sumner and Tribe (2008:10) and Hopper (2012) refer to the concept of ‘good change’ and
‘bad change’, but admit that it is subject to the view of what constitutes ‘good’ and ‘bad’.
What all can agree on, is that mankind has developed from a primitive state of
subsistence living to a highly industrialised and modernised state, as is recorded in history
and archaeological research. In the process, however, inequalities emerged between rich
and poor, and distinct differences arose in development status between countries. Three
levels of inequality can be described (Hopper, 2012:18):
i. National inequality, referring to the distribution of income among people within a
country
ii. International inequality, referring to the economic disparity that exists between
countries
iii. Global inequality, referring to all individuals in the world, including national and
international inequality
A historical overview of ‘changes’ is given by Pieterse (2010) and summarised in Table
2.1. It is important to note that the concept of ‘development’, as it has been examined in
development studies, is a post-World War II concept, and that the term has not been used
before,as we see it today. In his attempt to make sense of the shift in meanings of
development over time, Pieterse (2010:8) refers to a “kind of archaeology of development
discourse as a deconstruction of development and as part of a development critique” as
one of three views. A second view is the examining of historical context, where the
meaning of development changes in relation to changing circumstances. A third view is
to combine the aforementioned views as dimensions of development, as a mosaic and
synthesis of components that offer “a Gestalt of development”, i.e. a total picture from
where development can be viewed from different angles. Pieterse concludes that
development theories offer a kaleidoscopic view into a collective mirror of changing
economic and social capacities, priorities and choices, and that the different meanings of
development relate to changing relations of power and hegemony. A theoretical overview
of development is further presented by looking at geographical and historic-economical
approaches.
2.2.2 Hegemony as a spatial construct
26
A well-known attempt at spatial division of the world in respect of development status has
been to describe the planet as consisting of three worlds (Hopper, 2012:25). This view
reflects a post-1940 perspective, which revealed international economic and political
turmoil after World War II and consists of a Western block (capitalist Europe and North-
America), an Eastern Block (Soviet-based communism), and the so-called Third World, or
‘developing countries’ (Hopper, 2012). The latter is a construct of post-colonial focus on
the development of countries where European colonial rule in Africa, Asia and the
Caribbean came to an end after 1945. The term ‘Third World’ was first used in 1952 by a
French journalist, Alfred Sauvy, to describe countries that were not part of the industrial
world (the First World) or the Communist block (the Second World) (Hay, 2008). At that
stage the British Empire was the largest formal empire that the world had known, with
colonies on each continent, including islands in all hemispheres (Roy Rosenzweig Center
for History and New Media, 2014). British influence on development in the post-colonial
era is, for example, reflected in the South African planning paradigm of the pre-1994
period (Jansen van Vuuren, 1992).
The use of economic classifications to demarcate world regions on the basis of their
levels of development is increasingly being disputed (Sidaway, 2012). In history, various
alternative groupings such as the Non-Aligned Movement (NAM) were formed in reaction
to the international influences of the Western-Soviet Cold War and owing to the desire of
member countries to remain outside of this grouping. The NAM was influential in the
establishment of the Group of 77 (G-77) in the UN that led to the practice of Southern
states as a block against issues like trade. A distinct North-South divide emerged
following the collapse of the Soviet bloc (post-Second World) in the early 1990s, and
together with that the use of the term ‘Third World’ became defunct (Hopper, 2012:26).
Recent economic groupings include the BRIC countries (Brazil, Russia, India, China) on a
global scale, SADEC (Southern African Development Community) and the EU (European
Union) on a regional scale. Despite dichotomies in the composition of ‘North’ and ‘South’,
such as problems with northern hemisphere countries in Africa and Asia labelled as
‘Southern’ countries, and southern hemisphere countries such as Australia and New
Zealand grouped with ‘Northern’ countries, the conceptualisation of a developed ‘North’
and a developing ‘South’ is common in development studies (Hopper, 2012:29).
The categorisation of countries according to colonial rule or economic development
blocks can be expressed in a spatial context, as is illustrated by the maps in Figures 2.2,
2.3 and 2.4. These maps are useful as a visualisation tool to illustrate the change from
political to economical hegemony. However, as such they remain static images of history,
27
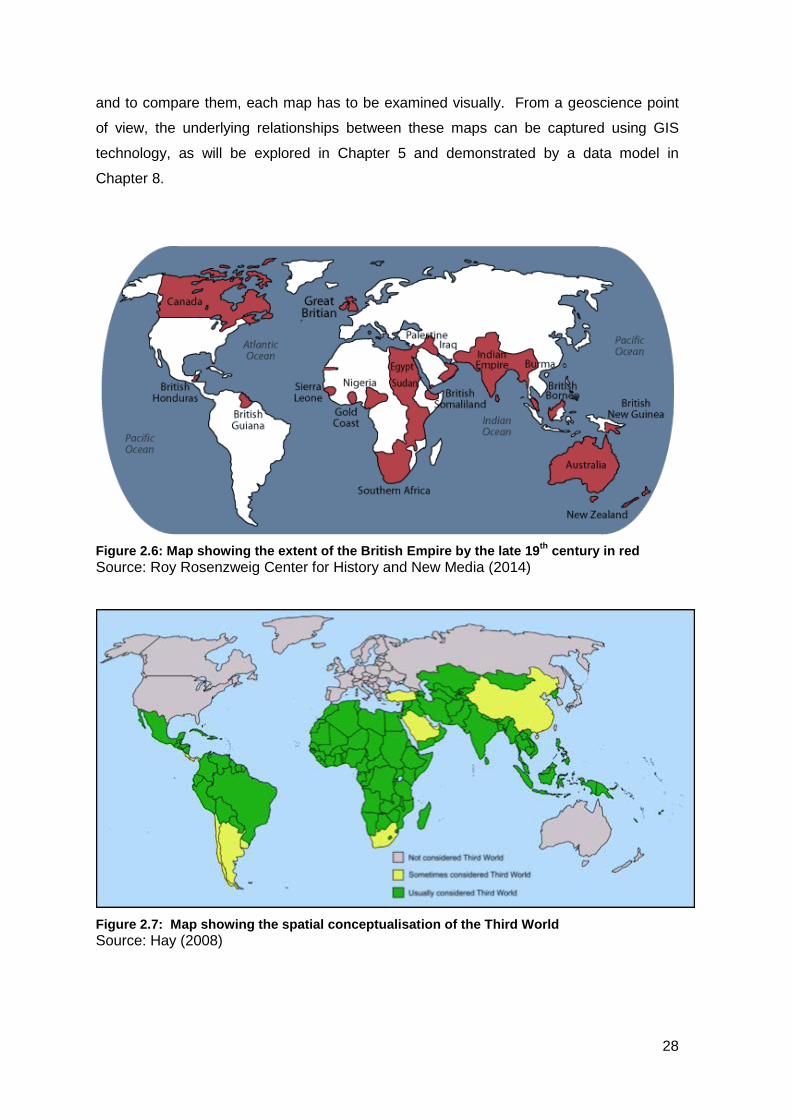
and to compare them, each map has to be examined visually. From a geoscience point
of view, the underlying relationships between these maps can be captured using GIS
technology, as will be explored in Chapter 5 and demonstrated by a data model in
Chapter 8.
Figure 2.6: Map showing the extent of the British Empire by the late 19th century in red Source: Roy Rosenzweig Center for History and New Media (2014)
Figure 2.7: Map showing the spatial conceptualisation of the Third World Source: Hay (2008)
28
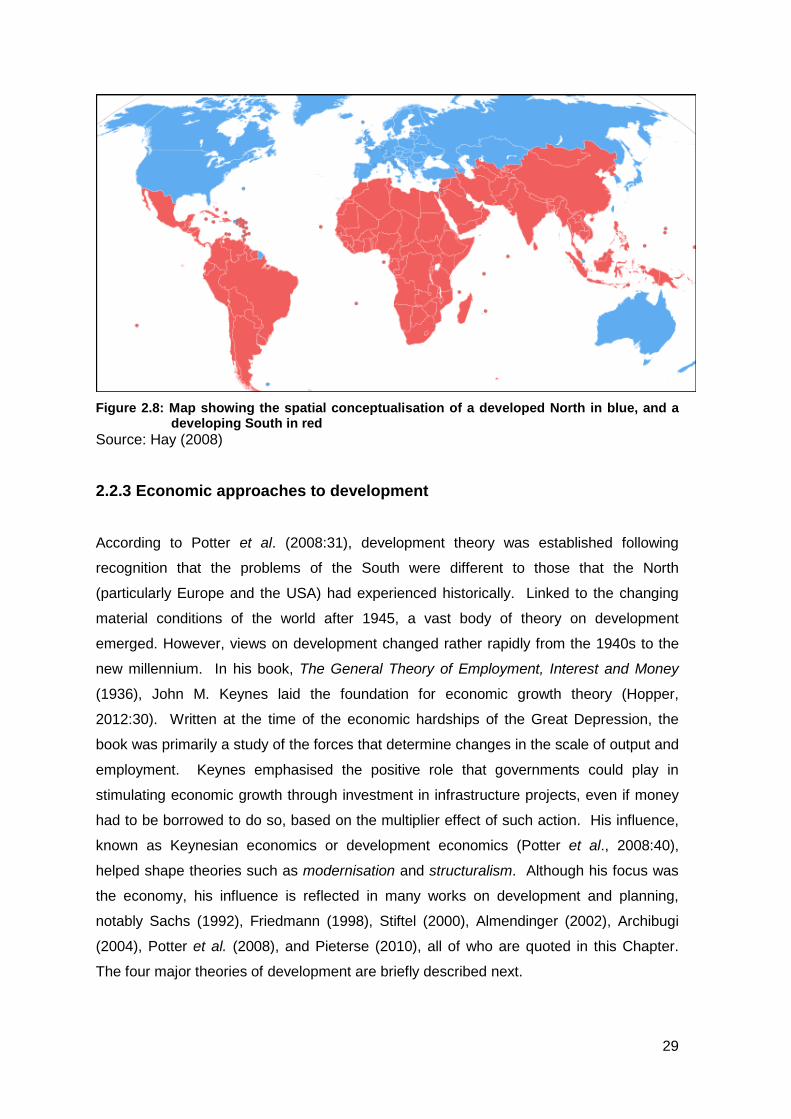
Figure 2.8: Map showing the spatial conceptualisation of a developed North in blue, and a
developing South in red Source: Hay (2008)
2.2.3 Economic approaches to development
According to Potter et al. (2008:31), development theory was established following
recognition that the problems of the South were different to those that the North
(particularly Europe and the USA) had experienced historically. Linked to the changing
material conditions of the world after 1945, a vast body of theory on development
emerged. However, views on development changed rather rapidly from the 1940s to the
new millennium. In his book, The General Theory of Employment, Interest and Money
(1936), John M. Keynes laid the foundation for economic growth theory (Hopper,
2012:30). Written at the time of the economic hardships of the Great Depression, the
book was primarily a study of the forces that determine changes in the scale of output and
employment. Keynes emphasised the positive role that governments could play in
stimulating economic growth through investment in infrastructure projects, even if money
had to be borrowed to do so, based on the multiplier effect of such action. His influence,
known as Keynesian economics or development economics (Potter et al., 2008:40),
helped shape theories such as modernisation and structuralism. Although his focus was
the economy, his influence is reflected in many works on development and planning,
notably Sachs (1992), Friedmann (1998), Stiftel (2000), Almendinger (2002), Archibugi
(2004), Potter et al. (2008), and Pieterse (2010), all of who are quoted in this Chapter.
The four major theories of development are briefly described next.
29
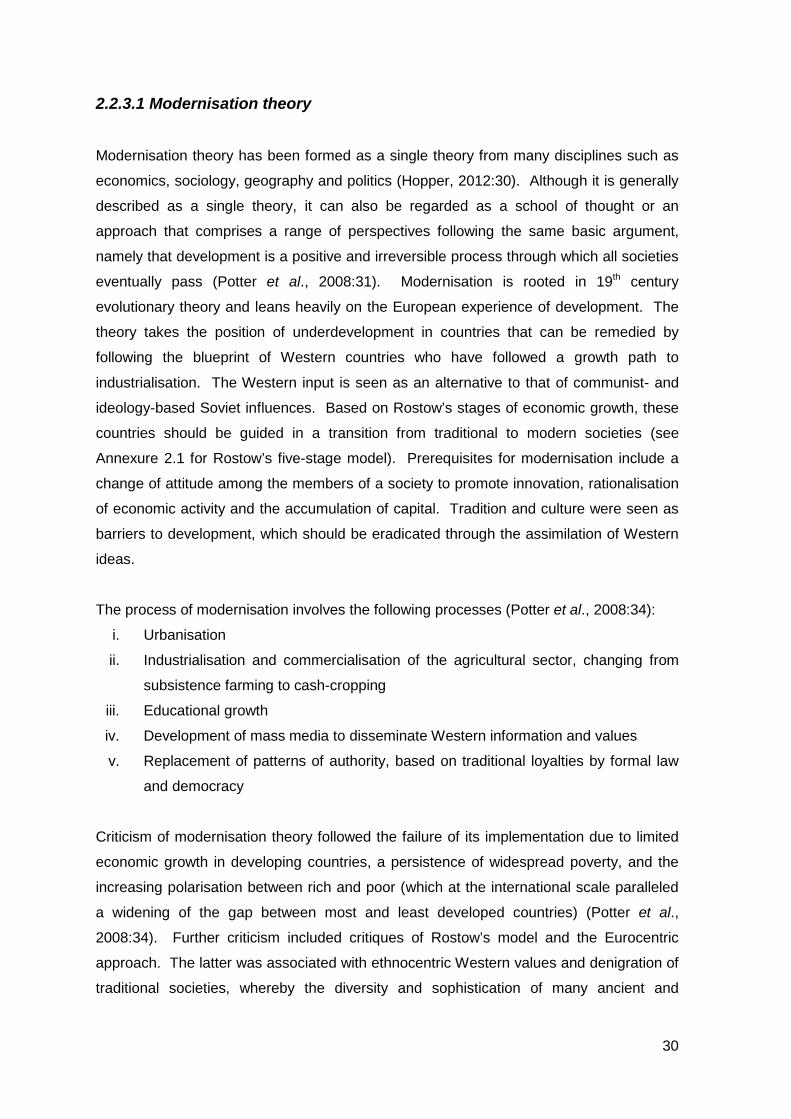
2.2.3.1 Modernisation theory
Modernisation theory has been formed as a single theory from many disciplines such as
economics, sociology, geography and politics (Hopper, 2012:30). Although it is generally
described as a single theory, it can also be regarded as a school of thought or an
approach that comprises a range of perspectives following the same basic argument,
namely that development is a positive and irreversible process through which all societies
eventually pass (Potter et al., 2008:31). Modernisation is rooted in 19th century
evolutionary theory and leans heavily on the European experience of development. The
theory takes the position of underdevelopment in countries that can be remedied by
following the blueprint of Western countries who have followed a growth path to
industrialisation. The Western input is seen as an alternative to that of communist- and
ideology-based Soviet influences. Based on Rostow’s stages of economic growth, these
countries should be guided in a transition from traditional to modern societies (see
Annexure 2.1 for Rostow’s five-stage model). Prerequisites for modernisation include a
change of attitude among the members of a society to promote innovation, rationalisation
of economic activity and the accumulation of capital. Tradition and culture were seen as
barriers to development, which should be eradicated through the assimilation of Western
ideas.
The process of modernisation involves the following processes (Potter et al., 2008:34):
i. Urbanisation
ii. Industrialisation and commercialisation of the agricultural sector, changing from
subsistence farming to cash-cropping
iii. Educational growth
iv. Development of mass media to disseminate Western information and values
v. Replacement of patterns of authority, based on traditional loyalties by formal law
and democracy
Criticism of modernisation theory followed the failure of its implementation due to limited
economic growth in developing countries, a persistence of widespread poverty, and the
increasing polarisation between rich and poor (which at the international scale paralleled
a widening of the gap between most and least developed countries) (Potter et al.,
2008:34). Further criticism included critiques of Rostow’s model and the Eurocentric
approach. The latter was associated with ethnocentric Western values and denigration of
traditional societies, whereby the diversity and sophistication of many ancient and
30
contemporary non-Western societies was overlooked. Lastly, the aspiration of ‘Southern’
countries to foster their own development goals and strategies was largely disregarded.
2.2.3.2 Dependency theory
Following the apparent failure of modernisation, views for an alternative approach were
open for more radical and neo-Marxist influences (Hopper, 2012:35). Critiques of the
modernisation theory emerged mostly from a Southern, Latin American perspective, and
were often written in Spanish. From a new school of thought referred to as the
dependencia school and scholars known as dependistas (Potter et al., 2008:35), the
dependency theory emerged as a reaction to widespread poverty in the Global South, and
in Latin America in particular. Scholars argued that the growth in the Northern countries
was only possible because of the active exploitation and sustained underdevelopment of
Southern countries. This theory also found its origins in colonialism, by virtue of the fact
that colonial economies developed around European markets. As a consequence, many
former colonial entities remained one-product economies, for example based on the
production of cocoa, bananas, sugar cane, etc. (Hopper, 2012:35). This would make
them extremely susceptible to price fluctuations on international markets, and thereby
increase their vulnerability to external shocks.
Thoughts on dependency were fed by structuralism, a strand of thought arguing that
development involves changes in underlying social and economic structures, and a
movement that was strong in Latin America (Potter et al., 2008:36; Hopper, 2012:33).
Rooted in the economic hardships of the Great Depression of the 1930s when Latin
American countries found it difficult to buy manufactured goods from raw material exports,
structuralists followed a Keynesian approach, which regarded governmental intervention
as a means of stimulating economic growth. Similarities with modernisation and trust in
industrialisation are apparent, although Western industries had the advantage of earlier
development and the opportunity to grow and mature without the degree of international
competition and constraints that emerging non-Western countries had to overcome
(Hopper, 2012:33).
The characteristics of dependency theory are best summarised by Gunder Frank (cited in
Benn (2004), Potter et al. (2008), Pienaar (2010) and Hopper (2012)), who argues that
development of the West depends on the exploitation and active underdevelopment of the
periphery (Latin America). This argument makes a direct link between development and
underdevelopment, which is perpetuated over time through the ‘development of
31
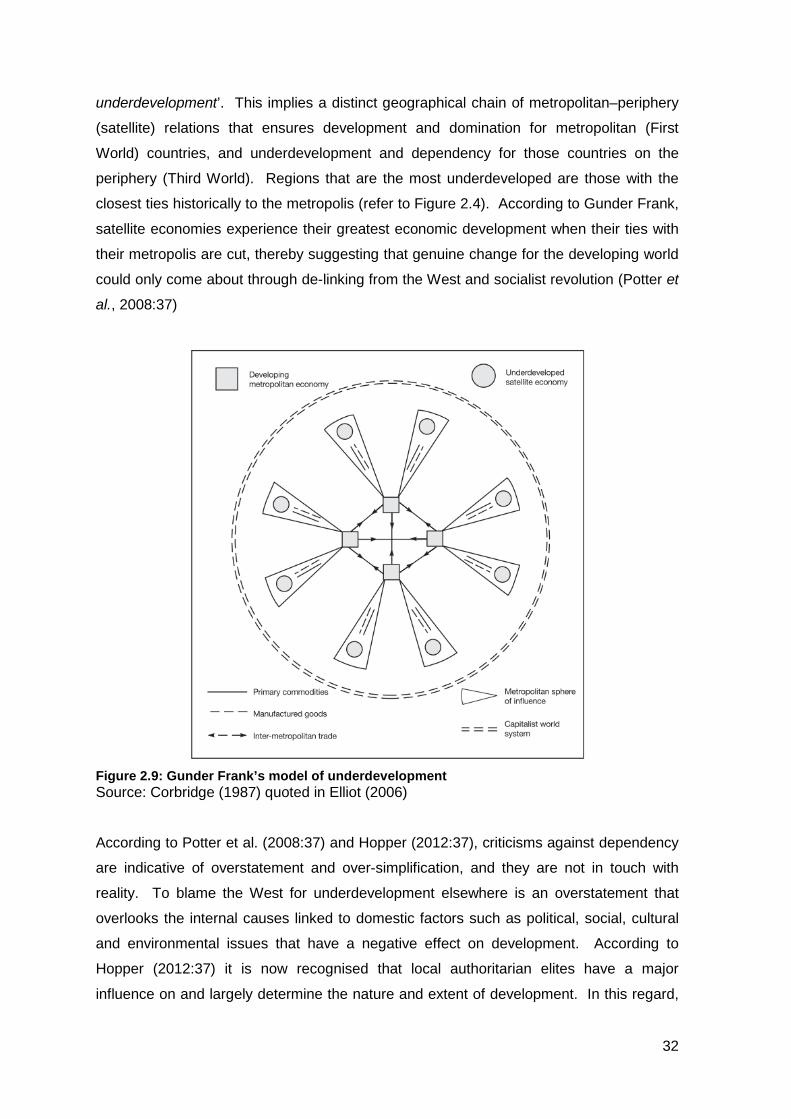
underdevelopment’. This implies a distinct geographical chain of metropolitan–periphery
(satellite) relations that ensures development and domination for metropolitan (First
World) countries, and underdevelopment and dependency for those countries on the
periphery (Third World). Regions that are the most underdeveloped are those with the
closest ties historically to the metropolis (refer to Figure 2.4). According to Gunder Frank,
satellite economies experience their greatest economic development when their ties with
their metropolis are cut, thereby suggesting that genuine change for the developing world
could only come about through de-linking from the West and socialist revolution (Potter et
al., 2008:37)
Figure 2.9: Gunder Frank’s model of underdevelopment Source: Corbridge (1987) quoted in Elliot (2006)
According to Potter et al. (2008:37) and Hopper (2012:37), criticisms against dependency
are indicative of overstatement and over-simplification, and they are not in touch with
reality. To blame the West for underdevelopment elsewhere is an overstatement that
overlooks the internal causes linked to domestic factors such as political, social, cultural
and environmental issues that have a negative effect on development. According to
Hopper (2012:37) it is now recognised that local authoritarian elites have a major
influence on and largely determine the nature and extent of development. In this regard,
32
underdevelopment is often linked to corruption and inappropriate strategies for achieving
economic growth. Lastly, it is argued that dependency theory does not offer an
alternative to development other than escaping from the cycle of exploitation when
dependency has ended, or else, when developing countries are disconnected from the
global economy.
2.2.3.3 Neo-liberalism
Neo-liberalism is seen as an economic and political approach that in essence seeks to
reduce the role of the state and deregulate markets as much as possible in order to
promote free trade (Benn, 2004:6; Potter et al., 2008:40; Pieterse, 2010:7). The central
objective – economic growth – is to be achieved through deregulation, liberalisation and
privatisation, where the focus shifts from government intervention to market forces.
During the 1980s this approach received strong support from the US and the UK
governments, as well as from institutions such as the World Bank.
One of the effects of neo-liberalism is the cost to the environment. According to Hopper
(2012:41), the shrinking of environmental resources of developing countries is notable, as
they have little to offer in terms of manufactured goods and have to rely on exports of
natural resources as they seek to compete in the global marketplace. This opens up
further debates around sustainable development and environmental impact, as will be
discussed in Chapter 4.
2.2.3.4 Post-development
Delusion and disappointment with the failures of development are highlighted by authors
such as Sachs (1992), Pieterse (1996, 1998), Sidaway (2007, 2014) and Potter et al.
(2008). Development has been associated with “loss of indigenous culture”, “destruction
of the environment”, a “set of worldviews and powers to intervene, to transform and to
rule”, and its origins are believed to be “bound up with Western power and strategy for the
Third world, enacted and implemented through local elites” (Sidaway, 2014:147). In
1992, Wolfgang Sachs wrote that the age of development is coming to an end. In 2008
Potter et al. declared the concept of development dead, and hence introduced an era of
‘post-development’ – summarised by Potter et al. (2008:48) as follows:
“Ideologically, post-development is rooted in the postmodern tradition. This
involves a rejection of notions of modernisation and modernity in favour of
33
highlighting diversity, context and alternative voices. There is a strong emphasis
on bottom-up, non-hierarchical growth strategies which consider each situation on
its own context-specific merits… In an attempt to move away from the ‘grand
narratives’ or ‘meta-theories’ (over-arching theories characterised by high levels of
generalisation and abstraction) of modernisation or dependency, some advocates
of post-development argue for abandoning the term ‘development’ altogether.”
Pieterse (1996) offers a strong argument against development theory as a homogenised,
coherent and consistent entity, “as if it were cut from a single cloth”. He exposes
development theory as “a plethora of competing and successive currents, schools,
paradigms, models, several of which claim to exclude one another”. In his summary of
development theory, Pieterse (1996:547) offers three arguments:
i. Development thinking has not been the single paradigm for which it is often taken.
It is “a heterogeneous set of approaches that has been not only variable over time
but highly diverse at any given time”.
ii. Development thinking is characterised by a “disparity and tension between
endogenous and exogenous dynamics in development”.
iii. All societies are developing as part of a global process. Development is a process
that is occurring in both developed and developing countries, which juxtaposes
development discourse and globalisation.
Within the framework of ‘development as change’, to criticise development does not
necessarily mean to reject the notion of change, but rather a criticism of the view that ‘all
change is development’ (Sidaway, 2014:150). Pieterse (1996:547) suggests that one
should take a step back and consider the underlying ideas of change, and not
development theory as such. According to Potter et al. (2008:47), post-development
lends itself to alternative visions of improvement (change) through considering various
views such as democracy, culture, resourcefulness and environmental impact. They
conclude that “there is no question that there is a need for development in the sense of
change for the better, the theoretical question remains of how this may best be achieved.”
In the context of the geography of development, post-development approaches demand
the use of spatial information technology to scrutinise relationships.
34
2.3 CONCEPTUALISATION OF PLANNING
The places where people live have always been planned in some way or another, being it
the management and organisation of space in the broad sense, or the controlling of land
use and property rights, or the provision of services (Healey, 1997:8). Planning is mostly
associated with the development of cities, which emphasises planning activity as the
management of an outcome, the morphology and spatial organisation of the urban region.
However, such initiatives are rooted in specific traditions that have evolved over centuries
and have been influenced by philosophical and social transformation – referred to by
Healey as an “intellectual sea which we now label in the history of Western thought as the
‘Enlightenment’”. Planning has been shaped by technological, political and economic
advances and events in history, and the reaction of society on these (Friedmann, 1987;
Healey, 1997; Stiftel, 2000; Allmendinger, 2002; Oranje 2002). From this perspective,
planning can be seen as deeply embedded in social theory (Allmendinger, 2002:3).
There are a multitude of perspectives on planning (Dale, 2004:4). Planning theory
addresses a whole range of issues that can be grouped as follows (Alexander, 1992:7):
i. Definitional – What is planning?
ii. Substantive – What do we know about what and whom we are planning for?
iii. Process – How does planning take place, and how are plans implemented?
iv. Normative – How do we plan, and why should we plan?
From a broad perspective, planning can be regarded as inclusive of all of the above.
Some theorists may, however, prefer to limit their view of planning to a particular aspect,
and three scholars are mentioned in this regard. Ernest R. Alexander asserts that the
core of planning is the planning process, as it applies to individuals, groups, firms and
governments. According to him, planning theory explores the planning process by looking
at its components and the way they relate and interact. It involves the context of planning
efforts and how they determine planning outcomes (Alexander, 1992:8). Patsy Healey
approaches planning from the view of planning traditions and takes a normative
approach. She argues that the culture of planning stands in relation to a particular
inheritance that emerged from three planning traditions, i.e. economic planning, physical
development and public administration (Healey, 1997:10). The first tradition aims to
manage productive forces of regions and nations, and is linked to social politics and the
framework of a “welfare state”. The second involves the management of cities from a
health and aesthetical point of view. The third aims to achieve effectiveness and
efficiency in meeting specific goals that are set for public agencies. John Friedmann
35
approaches planning from a socio-historical perspective and identifies the four traditions
of planning thought. He documents a typology of planning that spans two centuries, and
traces the origins of planning theory to as far back as 1789. Friedmann maps out the
intellectual influences that have shaped contemporary planning theory up to 1980, and
describes various intellectual influences such as neo-classical economics, public
administration, systems engineering, sociology and pragmatism, among others
(Alexander, 1992). He places key figures in the history of planning in the context of four
planning traditions, each of which meets three requirements, i.e. the same technical
language, philosophical outlook, and central questions that define each tradition. These
four groupings are Policy Analysis, Social Reform, Social Learning and Social
Mobilisation. According to Allmendinger (2002:81), this approach broke new ground in
that the four ‘traditions’ pointed to a much more disparate basis to planning knowledge
than had thus far been acknowledged. Departures from previous conceptions and the
degree of detail and understanding are briefly described as follows:
Policy Analysis is influenced by the work of Herbert Simon (Friedmann, 1987:78) whose
contribution to planning theory is rooted on the traditions of Public Administration. Based
on rational thinking, policy analysis is engaged in the concept of “what is best” and seeks
to identify the best possible decisions and courses of action within an organisation.
Bound by rational constraints such as resources, information and time, planners strive to
reach the ideal decision by means of the following distinct stages of action:
i. Formulation of goals and objectives
ii. Identification of alternatives for reaching these goals and objectives
iii. Evaluation of the consequences that would be expected from each alternative
iv. Decision making based on the information provided by the above preceding steps
v. Implementation of the decision
vi. Feedback by monitoring the results after implementation
Lacking a distinctive philosophical position (Friedmann, 1996:23), practitioners in the
tradition of Policy Analysis regard themselves as technicians by virtue of their application
of scientific theories and mathematical techniques in order to calculate the ultimate
solution.
Social Reform seeks to institutionalise planning practice and focuses on the role of the
state in planning. Planning is regarded as a scientific endeavour with non-planners
(citizens and politicians) regarded as “not sufficiently informed to be seriously engaged in
36
planning”. In this tradition, planning is seen as the application of scientific knowledge to
public affairs, and it seeks for the state’s intervention in three areas: economic growth,
employment and redistribution of income (Friedmann, 1996:20).
Social Learning: The tradition of Social Learning focuses on overcoming the
contradictions between theory and practice (Friedmann, 1996: 24). This concept
developed from two streams of thought, namely pragmatism as postulated by John
Dewey and his epistemology of learning by doing, and the revolutionary thoughts of
Marxism and its proposition concerning the unity of revolutionary theory and practice
(Friedmann, 1996:25). This tradition is a major departure from earlier planning theory
based on scientific knowledge. Social learning asserts that knowledge is derived from
experience that is validated in practice. New understanding that is obtained in this way is
applied in the continuing process of action and change. The tradition of Social Learning
further claims that social behaviour can be changed through social experimentation and
the observation of results. This presupposes the willingness to admit error and learn from
it.
Social Mobilisation: Social mobilisation developed as counter-movement of social
reform (Friedmann, 1987:225). It differs from the other traditions in having a radical
orientation toward existing social institutions, and in particular the state. Instead of social
guidance, this tradition is inclined towards social transformation, blending Marxism with
utopian and anarchist ideas (Alexander, 1992:7). When it emerged as a movement in
France and England around 1820, it was a response to the social upheaval and human
suffering that accompanied the Industrial Revolution, and is as such rooted in the ideology
of the dispossessed who are strengthened by social solidarity, an emphasis on political
rhetoric and determination to change existing relations of power. The tradition of Social
Mobilisation stands in stark contrast with the other traditions where planning tends to be
more of a political conduct, with no inclusion of scientific reasoning and analysis
(Friedmann, 1996:26).
Within this framework, the concept of ‘what is planning?’ is discussed by looking at a few
definitions of planning and giving a broad overview of planning theory development.
2.3.1 Planning – a definition
The above section describes theoretical underpinnings of planning by highlighting a
multitude of perspectives. This section looks at the meaning of the term from a more
37
practical point of view, and given the various approaches and traditions of planning, it
serves a purpose which in the context of this chapter relates to development. Dale
(2004:15) broadly defines development planning as “the planning of any organised
endeavour that aims at promoting development”.
According to Healey (2003:118), providing an objectively complete definition or a ‘full’-
range definition of planning is an impossibility. Banfield (1959:361) states that “[t]he word
“planning” is given a bewildering variety of meanings. To some it means socialism. To
others the layout and design of cities. To still others regional development schemes like
TVA (Tennessee Valley Authority), measures to control the business cycle, or “scientific
management” in industry”. Friedmann (1998:246) notes that theorists do not want to be
“fenced in” by any definition of planning discourse. However, a few definitions from
literature can be presented. Banfield puts planning in an action frame of reference, where
an actor (who can be a person or an organisation) is oriented towards the attainment of
ends. He thus defines planning as the process by which the actor selects a course of
action for the attainment of his ends (Banfield, 1959:361). Kroon (1990:125) describes
planning as a management task concerned with the goals and objectives of an
organisation, the activities involved and the implementation of a plan that aims at
achieving such goals and objectives. The same understanding of planning is maintained
by Conyers and Hills (1984:3), who see planning as a continuous process that involves
decision or choices about alternative ways of using available resources, with the aim of
achieving particular goals at some time in the future. Polydorides (1989:363) sees
planning as a task that deals with the management of spatial information for the purpose
of supporting the formulation and evaluation of policy on spatial problems, as well as the
implementation of plans for the change of spatial structure. According to Faludi
(2000:299), planning is about the coordination of what is going to happen – “it must make
the various agents that are normally shaping development according to priorities of their
own, fall into line”. From these definitions the following characteristics of planning are
evident:
i. Planning is a management activity. Planning is basically a management activity
that, together with other activities such as organisation and control of urban and
regional environments, forms part of a management process (Kroon, 1990;
Allmendinger & Tewdwr-Jones, 2002).
ii. Planning is concerned with achieving objectives and aimed at action. The
outcome of planned action must conform to what the plan says. Faludi (2000)
distinguishes between ‘project’ plans and ‘strategic’ plans. The former are
“blueprints” of the intended end-state of a proposed plan and the measures
38
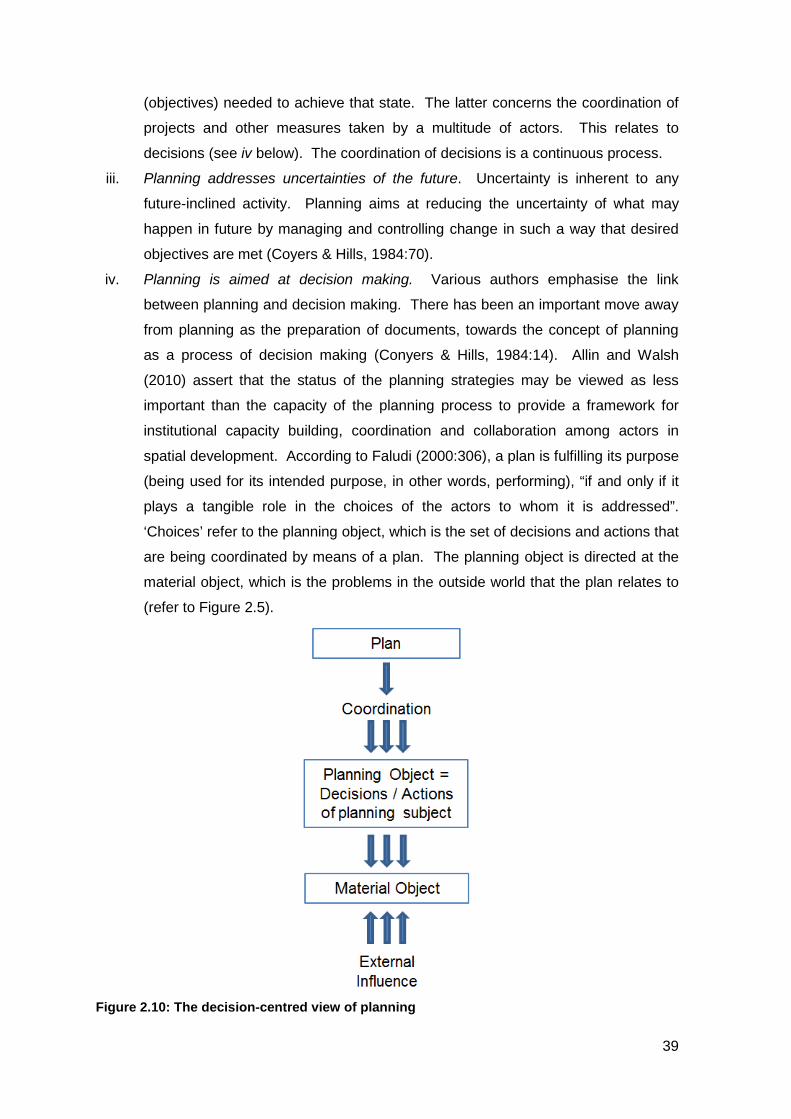
(objectives) needed to achieve that state. The latter concerns the coordination of
projects and other measures taken by a multitude of actors. This relates to
decisions (see iv below). The coordination of decisions is a continuous process.
iii. Planning addresses uncertainties of the future. Uncertainty is inherent to any
future-inclined activity. Planning aims at reducing the uncertainty of what may
happen in future by managing and controlling change in such a way that desired
objectives are met (Coyers & Hills, 1984:70).
iv. Planning is aimed at decision making. Various authors emphasise the link
between planning and decision making. There has been an important move away
from planning as the preparation of documents, towards the concept of planning
as a process of decision making (Conyers & Hills, 1984:14). Allin and Walsh
(2010) assert that the status of the planning strategies may be viewed as less
important than the capacity of the planning process to provide a framework for
institutional capacity building, coordination and collaboration among actors in
spatial development. According to Faludi (2000:306), a plan is fulfilling its purpose
(being used for its intended purpose, in other words, performing), “if and only if it
plays a tangible role in the choices of the actors to whom it is addressed”.
‘Choices’ refer to the planning object, which is the set of decisions and actions that
are being coordinated by means of a plan. The planning object is directed at the
material object, which is the problems in the outside world that the plan relates to
(refer to Figure 2.5).
Figure 2.10: The decision-centred view of planning
39
Source: Faludi (2000)
2.3.2 The development of planning theory
The development of a planning theory within which planners operate can be traced back
to the 1930s and the days of US president Roosevelt’s New Deal, when institutions like
the National Resources Board, the Resettlement Administration, and the Tennessee
Valley Authority attempted basic planning exercises, guided by emerging Keynesian
economic principles (Stiftel 2000:4). This included programmes that followed a basic
methodology involving the examination of data, the evaluation of alternative courses of
action and the creation of systems for implementation. A landmark publication by Karl
Mannheim in 1935, Man and Society in an Age of Reconstruction, triggered a series of
debates on scholarly and political level on the question of “who would plan”. Mannheim
envisioned the state’s participation in economic and social planning, and argued that if the
planning bureaucracy was subject to parliamentary control, it could apply its technical
expertise to the solution of social problems (Fainstein, 2005:122). This vision laid the
foundations for later theorising by describing a democratic planning process that would
enable experts to plan under the guidance of the public through their elected
representatives.
From these beginnings, various planning models developed, such as the Blueprint model
or Master Plan model, the Rational Planning model, the Strategic Planning model (seen
as an alternative to the Rational Planning model), the Pragmatic Planning model, and the
Communicative Planning model, which has dominated thinking by theorists since the
beginning of the new millennium (Jansen van Vuuren, 1994; Stiftel, 2000; Zhang, 2006).
Before these models are discussed, two significant developments in the way town
planning has been conceived, as detailed by Taylor (1999), are briefly discussed and
highlighted as background. Town planning, as a branch of the planning profession, has
significant linkages with development, and advances in this field are important to include
and understand further linkages with planning in its broader context.
Taylor (1999) identifies three distinct periods since World War II that are marked by
specific developments in planning theory. The changes in planning thoughts are seen as
theoretically significant, although not fundamentally enough to witness any paradigm
shifts (Taylor, 1999:341). From its conception in the 1940s, and for almost twenty years
onwards, town planning was essentially seen as an exercise in physical design. At the
time the function of town planning was assumed to be most appropriately carried out by
40
architects (refer to Glasson and Marshall, 2007:4), with a close connection between
architecture and town planning. The only distinction would be that planning was
architecture on the larger scale of a whole town or at least part of a town, as distinct from
individual buildings. This status quo remained until the 1960s, as is evident from the fact
that most planners in the post-war years were architects by training, and that aesthetic
considerations were regarded as central to town planning (Taylor, 1999:330).
A major shift from this view occurred in the 1963 with the introduction of the systems and
rational process views of planning, which represented a break with the old tradition. The
systems view introduced a new approach, seeing the town or a region as an object that
planning had to deal with. The rational process view of planning was concerned with the
method or process of planning itself. This new approach advanced an ‘ideal-type’
conception of planning as a procedure for making rational decisions (Taylor, 1999:332).
The most significant progression of this shift was the fact that, for the first time, theorists
of the systems and rational process described town planning as a science. This stood in
stark contrast with the design-based tradition which saw town planning primarily as an art.
It must be noted, however, that the shift in planning thought did not replace the physical
design view of planning, but rather added to that another facet, thereby advancing
planning theory to a new level. A most relevant development of the shift was that a
distinction was made between strategic and longer-term planning on the one hand, and
short-term planning on the other.
In relatively short succession, through the 1970s and 1980s, a new tradition of planning
theory emerged, which viewed the town planner’s role as one of identifying and mediating
between different interest groups involved in or affected by land development (Taylor,
1999:330). Referred to initially as advocacy planning, this tradition developed into
communicative planning theory, which was inspired by Habermas’s theory of
communicative action, as is detailed in Allmendinger and Tewdwr-Jones (2003) and in
Bolton (2005). Although not a primary function, the ‘facilitator’ role of the town planner
soon required the skills of interpersonal communication and negotiation.
The change in planning theory is consistent with the change from modernistic to post-
modernistic views after World War II, and is highlighted in the works of Allmendinger
(1998), Pieterse (2010), Healey (2003), Coetzee (2012) whose discussions of planning
theory are referenced in this chapter. Principles of planning theory as discussed above
are reflected in the development of planning models, which will be focused on next.
41
2.3.3 Blueprint planning
Based on the concept of urban design (Taylor, 1999; Fainstein, 2005), blueprint planning
(also known as master planning) was popular in the 1950s and 1960s and aimed at
setting a comprehensive framework for future development (Jansen van Vuuren, 1994:8).
It was, for example, particularly appropriate for the British New Town Programme in the
1950s (Healy, 2003). There are, however, two perspectives on blueprint planning. The
first sees it as a technocratic design that decides the future living conditions of people,
and the second as a course of action for the implementation of a plan. These
perspectives are briefly described as follows.
Design: As a technocratic ‘macro’ approach, blueprint planning is a predefined idea of
what should be done and how (Sachs, 1992:189). It provides a long-term vision of
development as an idealistic view of the future. In the late 20th century, the year 2000
was seen as a popular target date for achieving the objectives of a ‘development plan’
(Polydorides & Petropoulos, 1989:342). The disadvantage of this approach was the
rigidity of plans that made no provision for change or deviation, a situation which
Polydorides and Petropoulos refer to as “a static glimpse into a distant future”. Sachs
(1992) describes it as an “ideologically biased knowledge system” that requires the
transforming of everything to meet that blueprint, ignores the “living ‘nose’” of the people
who are directly concerned for what is appropriate and sensible to do, and has a
disregard for life designing its own course.
Coordination: From another perspective, blueprint planning is associated with
coordination during the implementation of plans (Faludi, 2000; Healey, 2003; Archibugi,
2008). It is a short-term vision that would steadily be translated into built form on the
ground (Healey, 2003). During the implementation of a plan, any action undertaken
independently by an institution without regard for actions simultaneously undertaken by
other institutions in the same environment is in danger of neutralising or annulling the plan
(Archibugi, 2008:70). As mentioned earlier, Faludi (2000) distinguishes between two
types of plans, project and strategic plans, which he regards as the two ideal types of
plans. A project plan, according to him, is a blueprint of the intended end-state of a
material object and the measures needed to achieve that state. It is a document “giving a
set of prescriptions for action, a blueprint for how to bring the desired state of affairs
about”. A strategic plan can also include various projects and is open ended in nature
(this aspect is further discussed below). Built into the project plan is a time element that
42
guides the implementation process in a phased approach, keeping it in line with the
requirements of producing the final outcome.
In terms of spatial expression, blueprint plans are associated with drawings produced by
architects and engineers, and have as such become the prototype project plan (Faludi,
2000:303). This would ultimately attenuate a plan to the status of a “static glimpse”, as
described above. Archibugi (2008:100) asserts that in carrying on the operations of
blueprint plans, the prospects of other ways to carry out plans are diminished. He states
that the “possibility is impugned, for instance, of deriving plans from intense analysis and
debating among the multiple policy-makers, a possibility that holds real promise,
especially if we start from the remark that in modern political societies, decision-making is
a fact so evident and “real” that it cannot be neglected without some elements of foolish
irrationality”. This shortfall highlights the need for rationalist and communicative thinking.
2.3.4 Rational planning
In reaction to the shortcomings of the master plan model, the rational planning model was
formulated by Edward Banfield in his work Note on a Conceptual Scheme (Banfield,
1955). This work gives a detailed account of a public housing project in Chicago, during
which Elizabeth Wood, the Executive Secretary of the Chicago Housing Authority (CHA)
played a substantial role in giving direction to the purpose and functioning of the CHA
Planning Division. Banfield describes a plan as “a course of action which can be carried
into effect, which can be expected to lead to the attainment of the ends sought, and which
someone (an effectuating organization) intends to carry into effect” (Banfield, 1955:312).
A course of action is seen as a sequence of prospective acts that are viewed as a unit of
action, that Banfield describes as a selected rationality, and that are aimed at the
attainment of ends. In this context Banfield views rational planning and efficient planning
to be the same. Based on the achievement of goals and objectives, this model indicates
a shift away from control to decision making (Landre, 1988(b):36). A rational decision is
made by firstly considering all of the alternatives (courses of action) open to the decision
maker. Second, he identifies and evaluates all of the consequences that would follow for
each alternative. He also predicts how a situation would be changed by each course of
action. Third, he selects the preferable alternative in terms of its most valued ends. This
framework reminds of the WHAT-IF analysis process, as discussed in Chapters 5 and 8.
From a spatial planning alternative, different courses of action and their possible
outcomes can be modelled using geographic information systems technology.
43
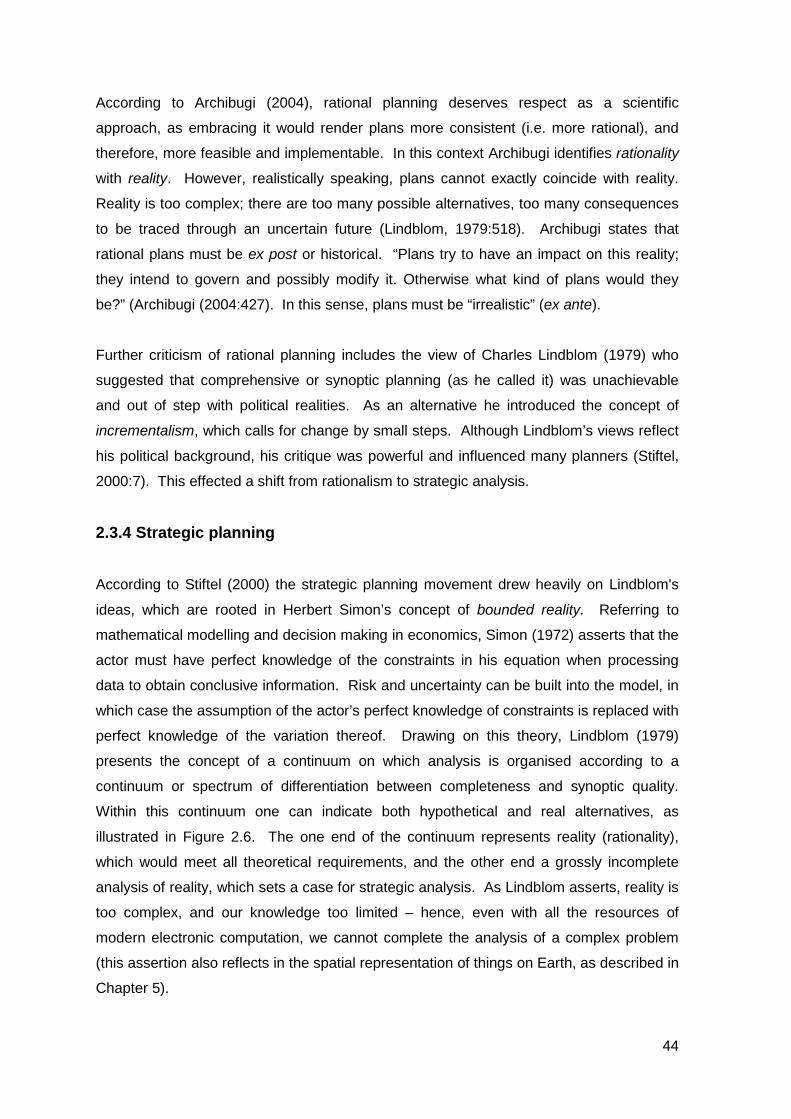
According to Archibugi (2004), rational planning deserves respect as a scientific
approach, as embracing it would render plans more consistent (i.e. more rational), and
therefore, more feasible and implementable. In this context Archibugi identifies rationality
with reality. However, realistically speaking, plans cannot exactly coincide with reality.
Reality is too complex; there are too many possible alternatives, too many consequences
to be traced through an uncertain future (Lindblom, 1979:518). Archibugi states that
rational plans must be ex post or historical. “Plans try to have an impact on this reality;
they intend to govern and possibly modify it. Otherwise what kind of plans would they
be?” (Archibugi (2004:427). In this sense, plans must be “irrealistic” (ex ante).
Further criticism of rational planning includes the view of Charles Lindblom (1979) who
suggested that comprehensive or synoptic planning (as he called it) was unachievable
and out of step with political realities. As an alternative he introduced the concept of
incrementalism, which calls for change by small steps. Although Lindblom’s views reflect
his political background, his critique was powerful and influenced many planners (Stiftel,
2000:7). This effected a shift from rationalism to strategic analysis.
2.3.4 Strategic planning
According to Stiftel (2000) the strategic planning movement drew heavily on Lindblom's
ideas, which are rooted in Herbert Simon’s concept of bounded reality. Referring to
mathematical modelling and decision making in economics, Simon (1972) asserts that the
actor must have perfect knowledge of the constraints in his equation when processing
data to obtain conclusive information. Risk and uncertainty can be built into the model, in
which case the assumption of the actor’s perfect knowledge of constraints is replaced with
perfect knowledge of the variation thereof. Drawing on this theory, Lindblom (1979)
presents the concept of a continuum on which analysis is organised according to a
continuum or spectrum of differentiation between completeness and synoptic quality.
Within this continuum one can indicate both hypothetical and real alternatives, as
illustrated in Figure 2.6. The one end of the continuum represents reality (rationality),
which would meet all theoretical requirements, and the other end a grossly incomplete
analysis of reality, which sets a case for strategic analysis. As Lindblom asserts, reality is
too complex, and our knowledge too limited – hence, even with all the resources of
modern electronic computation, we cannot complete the analysis of a complex problem
(this assertion also reflects in the spatial representation of things on Earth, as described in
Chapter 5).
44
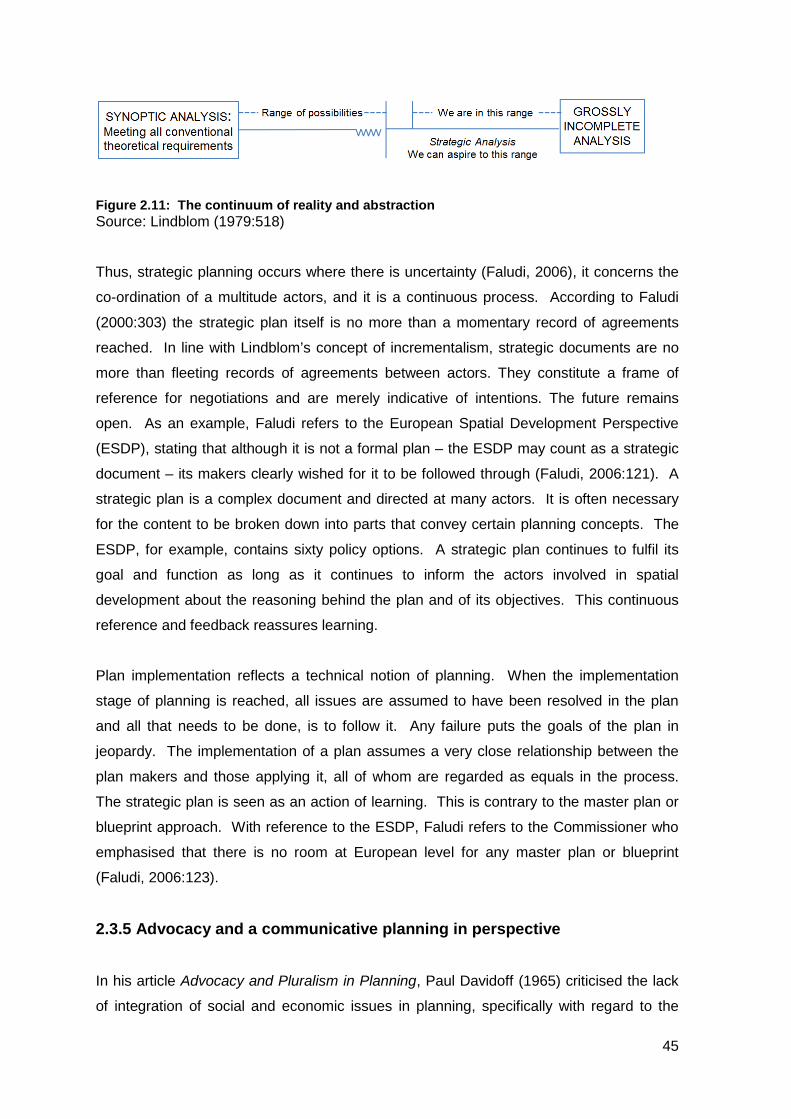
Figure 2.11: The continuum of reality and abstraction Source: Lindblom (1979:518)
Thus, strategic planning occurs where there is uncertainty (Faludi, 2006), it concerns the
co-ordination of a multitude actors, and it is a continuous process. According to Faludi
(2000:303) the strategic plan itself is no more than a momentary record of agreements
reached. In line with Lindblom’s concept of incrementalism, strategic documents are no
more than fleeting records of agreements between actors. They constitute a frame of
reference for negotiations and are merely indicative of intentions. The future remains
open. As an example, Faludi refers to the European Spatial Development Perspective
(ESDP), stating that although it is not a formal plan – the ESDP may count as a strategic
document – its makers clearly wished for it to be followed through (Faludi, 2006:121). A
strategic plan is a complex document and directed at many actors. It is often necessary
for the content to be broken down into parts that convey certain planning concepts. The
ESDP, for example, contains sixty policy options. A strategic plan continues to fulfil its
goal and function as long as it continues to inform the actors involved in spatial
development about the reasoning behind the plan and of its objectives. This continuous
reference and feedback reassures learning.
Plan implementation reflects a technical notion of planning. When the implementation
stage of planning is reached, all issues are assumed to have been resolved in the plan
and all that needs to be done, is to follow it. Any failure puts the goals of the plan in
jeopardy. The implementation of a plan assumes a very close relationship between the
plan makers and those applying it, all of whom are regarded as equals in the process.
The strategic plan is seen as an action of learning. This is contrary to the master plan or
blueprint approach. With reference to the ESDP, Faludi refers to the Commissioner who
emphasised that there is no room at European level for any master plan or blueprint
(Faludi, 2006:123).
2.3.5 Advocacy and a communicative planning in perspective
In his article Advocacy and Pluralism in Planning, Paul Davidoff (1965) criticised the lack
of integration of social and economic issues in planning, specifically with regard to the
45
poverty and discrimination that characterised American cities in the 1960s. At the time he
criticised the practice of what he called the “unitary plan”, which was the idea that one
agency, the city planning department, should be the only party in the community that
prepares a comprehensive plan. He rightfully asked the question “[w]hy is only one
agency concerned with establishing both general and specific goals for community
development, and with proposing the strategies and costs required to effect the goals?”
(Davidoff, 1965:332). He highlighted the compelling need for intelligent planning, for
specification of new social goals and for the means to achieve them. Davidoff advocated
the inclusion of communities in the planning process. Under his influence, planning
services were introduced in low-income neighbourhoods by means of advocate planners
who would be physically located in those neighbourhoods to represent the interests of
those residents in planning issues. He encouraged communities to appoint their own
advocates, and should that not be possible, it would be the duty of the local government
to appoint advocates on their behalf. This proved to be a popular move. Many advocate
planners would take this seriously and compete for dominant positions by openly acting
“in the best interest of the public” (Stiftel, 2000:8).
Communicative planning, also referred to as collaborative planning, interactive planning,
and participatory planning (Brömmelstroet, Hoetjes & Straatemeier, 2002), draws on
discontent among influential fractions of the population. Such disgruntlement becomes a
social force when mobilised by a set of ideas that seems to define a reason for feelings of
dissatisfaction (Fainstein, 2000). It includes mainly two aspects, namely social conditions
(as highlighted by Davidoff (1965)), and increased environmental awareness (Healy,
2003; Wenban-Smith, 2013). Built on the concept of community involvement and
realising the need for a more pragmatic approach towards planning (Fainstein, 2000:4;
Allmendinger, 2002:93), the concept of communicative planning developed from post-
modern ideas in planning. Communicative planning seeks to facilitate the active
interchange of ideas and issues between interested parties and is not necessarily
restricted to developmental issues such as land use (Huxley & Yiftachel, 2000:101). An
increasing awareness of planners not having all the answers and solutions to
developmental problems has shifted the focus to planning as a more democratic
endeavour that involves citizen participation (Huxley & Yiftachel, 2000:101;
Brömmelstroet et al., 2002:1).
2.3.6 Crisis planning
46
The increased complexity of modern-day life, with increased pressures of urbanisation
and environmental degradation, is a reality that leans toward crisis management. The
reality of rapid (and in places uncontrolled) development seems to be ahead of many
conceptions and models of a perceived reality (Brömmelstroet et al., 2002:1). As a result,
planners do not always have the luxury of time to adhere to a rational planning process,
but are forced to follow their planning instincts to solve a crisis situation (Jansen van
Vuuren, 1994:10). This is echoed by Leary (1989:286) who states that “[t]he present
trends in planning theory and practice are also away from rational towards pragmatic
planning or, in areas of greatest development pressure, towards crisis management”.
Planning has become selective in that specific issues can be addressed (Jansen van
Vuuren, 1994:11). In this tradition of project plans (Faludi, 2000), the concept of precinct
planning developed as a streamlined and strategic process aimed at improving efficiency,
reducing complexity and saving time and money. Precinct planning is effective in defining
desirable directions and indicating a localised system of actions, which in some cases
involve partnerships between the private and the public sector.
2.3.7 Planning: an integrated process
Planning has been described above as an activity. Aspects of management, control, plan
making and decision making are mentioned. Two distinct directions have developed in
planning practice: procedural planning (focusing on the planning process), and
substantive planning (focusing on the growth and development of cities) (Stiftel, 2000).
Faludi (2000) distinguishes many forms of “process”, to which he refers as soft processes.
This definition is inclusive of activities such as learning and negotiation, in which planners
are often involved. In this context, he sees the outcome of planning not always as the
production of material things (plans), but rather as a process of interaction between a
multitude of actors.
Drawing from various perspectives ranging from Banfield’s focus on the attainment of
ends to Faludi’s continuous planning process or Healey’s collaborative planning, planning
theory is conceptualised as extremely wide, as if no boundaries of a unified theory can be
drawn. Archibugi (2008) calls it an uneasiness, and a derangement of planning itself.
Such sentiments are discussed in the next section. However, the issue is addressed in
this section by looking at a framework for integrated planning.
47
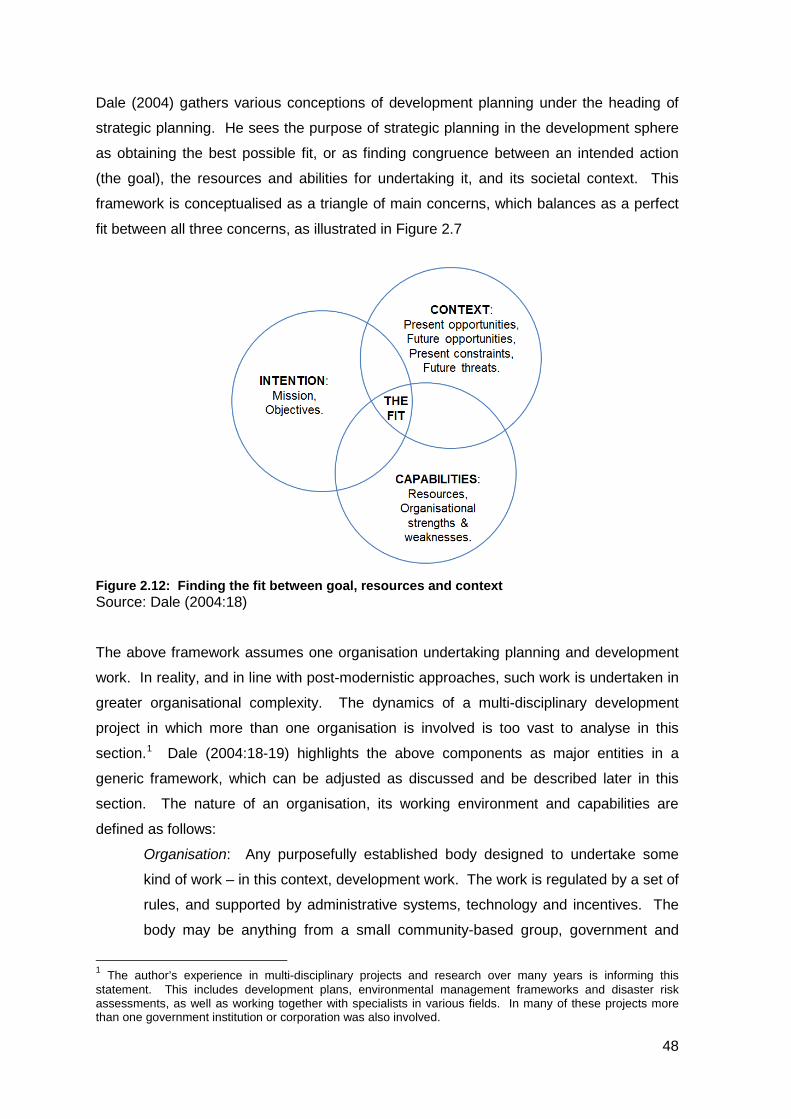
Dale (2004) gathers various conceptions of development planning under the heading of
strategic planning. He sees the purpose of strategic planning in the development sphere
as obtaining the best possible fit, or as finding congruence between an intended action
(the goal), the resources and abilities for undertaking it, and its societal context. This
framework is conceptualised as a triangle of main concerns, which balances as a perfect
fit between all three concerns, as illustrated in Figure 2.7
Figure 2.12: Finding the fit between goal, resources and context Source: Dale (2004:18)
The above framework assumes one organisation undertaking planning and development
work. In reality, and in line with post-modernistic approaches, such work is undertaken in
greater organisational complexity. The dynamics of a multi-disciplinary development
project in which more than one organisation is involved is too vast to analyse in this
section.1 Dale (2004:18-19) highlights the above components as major entities in a
generic framework, which can be adjusted as discussed and be described later in this
section. The nature of an organisation, its working environment and capabilities are
defined as follows:
Organisation: Any purposefully established body designed to undertake some
kind of work – in this context, development work. The work is regulated by a set of
rules, and supported by administrative systems, technology and incentives. The
body may be anything from a small community-based group, government and
1 The author’s experience in multi-disciplinary projects and research over many years is informing this statement. This includes development plans, environmental management frameworks and disaster risk assessments, as well as working together with specialists in various fields. In many of these projects more than one government institution or corporation was also involved.
48
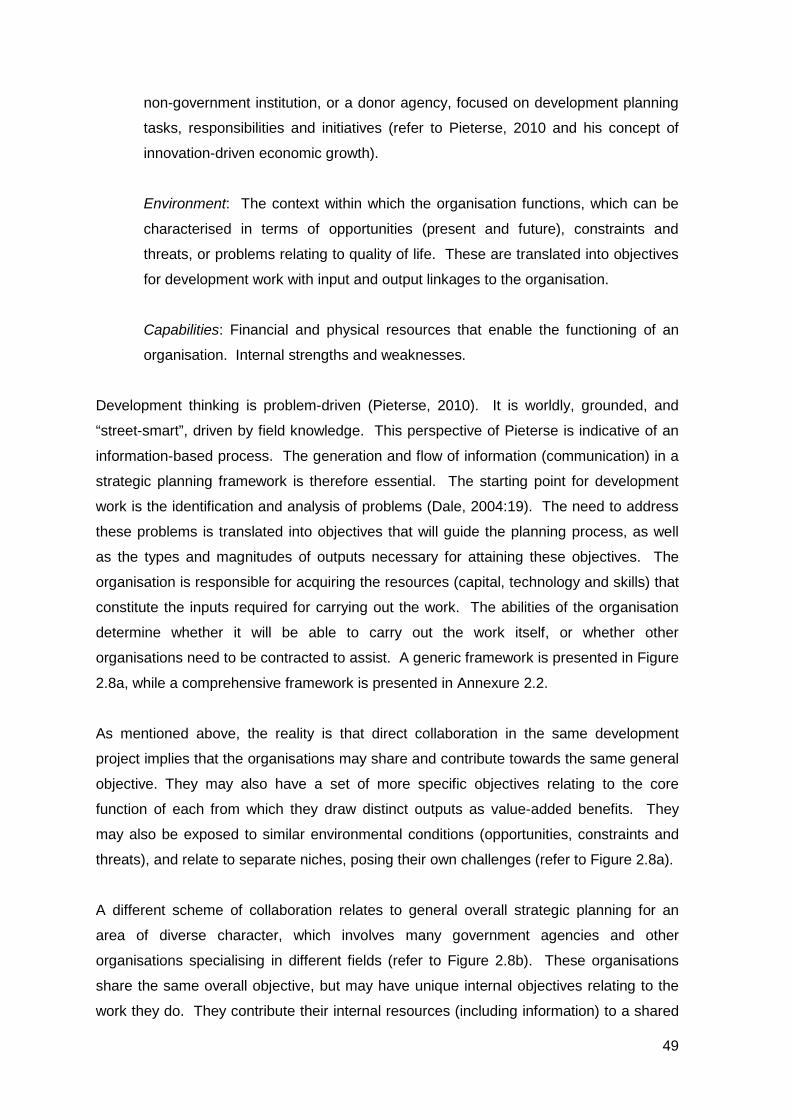
non-government institution, or a donor agency, focused on development planning
tasks, responsibilities and initiatives (refer to Pieterse, 2010 and his concept of
innovation-driven economic growth).
Environment: The context within which the organisation functions, which can be
characterised in terms of opportunities (present and future), constraints and
threats, or problems relating to quality of life. These are translated into objectives
for development work with input and output linkages to the organisation.
Capabilities: Financial and physical resources that enable the functioning of an
organisation. Internal strengths and weaknesses.
Development thinking is problem-driven (Pieterse, 2010). It is worldly, grounded, and
“street-smart”, driven by field knowledge. This perspective of Pieterse is indicative of an
information-based process. The generation and flow of information (communication) in a
strategic planning framework is therefore essential. The starting point for development
work is the identification and analysis of problems (Dale, 2004:19). The need to address
these problems is translated into objectives that will guide the planning process, as well
as the types and magnitudes of outputs necessary for attaining these objectives. The
organisation is responsible for acquiring the resources (capital, technology and skills) that
constitute the inputs required for carrying out the work. The abilities of the organisation
determine whether it will be able to carry out the work itself, or whether other
organisations need to be contracted to assist. A generic framework is presented in Figure
2.8a, while a comprehensive framework is presented in Annexure 2.2.
As mentioned above, the reality is that direct collaboration in the same development
project implies that the organisations may share and contribute towards the same general
objective. They may also have a set of more specific objectives relating to the core
function of each from which they draw distinct outputs as value-added benefits. They
may also be exposed to similar environmental conditions (opportunities, constraints and
threats), and relate to separate niches, posing their own challenges (refer to Figure 2.8a).
A different scheme of collaboration relates to general overall strategic planning for an
area of diverse character, which involves many government agencies and other
organisations specialising in different fields (refer to Figure 2.8b). These organisations
share the same overall objective, but may have unique internal objectives relating to the
work they do. They contribute their internal resources (including information) to a shared
49
pool, operate independently and their input is coordinated according specific
requirements2 (Dale, 2004:23). (a)
(b)
Figure 2.13: Different schemes of organisations’ collaboration in strategic planning Source: Dale (2004)
2 Here the author draws from Dale (2004) as well as his own experience, as mentioned in the previous footnote. The framework in Figure 2.8b bears a striking resemblance to his own framework as proposed in Jansen van Vuuren (2013), which he developed without knowledge of Dale at the time.
50
2.3.8 The planning theory dilemma The contributions of theorists such as Banfield, Faludi and Friedmann have received wide
recognition (Archibugi, 2008). However, following decades of debate on theories and
methodologies, theorists agree that consensus has still not been reached about a
planning paradigm. The nature of planning has always been contested and disagreement
on the meaning of planning is evident in many discourses (Glasson & Marshall, 2007:3).
According to Fainstein (2000: 51), planning theorists “have reframed their debates over
methods and programs to encompass issues of discourse and inclusiveness”.
Brömmelstroet et al. (2002:1) argue that there is not much left of modernist, rational, goal-
oriented planning in current planning practice and that planners have lost much of their
powers to “unilaterally realise their ideas”.
Alexander (1996:45) asserts that planning theory is “in a state of turmoil”, based on the
observation that “nothing is accepted; everything is questioned”. In his research briefing
Planning Theory: Reconstruction or Requiem for Planning, Franco Archibugi undertakes
an in-depth investigation into the causes of what he refers to as the “‘derangement’ of
planning itself, both as practice and profession” (Archibugi, 2004:425). He postulates that
there is a certain uneasiness about planning theory and that, in spite of the progression in
the quantity of scholars who have devoted themselves to theoretical reflections about
planning, this wide reflection and debate about planning theory has been made worse
instead of better. He uses a metaphor that he describes as follows: planning is a dark
pond “in which objects at the bottom can only be seen in an obscure, deformed way,
people would throw stones (planning theory) into the pond, in the hope of being able to
clarify and better define the objects. Instead, all they would accomplish would be to
muddy the situation further and make comprehension impossible. After continuing in this
manner for some time, these people would become discouraged and arrive at the
conclusion that either: (a) (for some people) it will never be possible to discern the objects
clearly; (b) (for others) the act of clarifying the pond creates new situations of darkness,
subject to analogous uncertainties; (c) (for some at last) there is no need to make the
pond any clearer” (Archibugi, 2004:425.)
Glasson and Marshall (2007) confirm that the nature and objectives of planning are being
contested, confirming a state of affairs noticeable from the previous century and that is
expected to remain the case in the coming decades. This is contributed to two major
tendencies: firstly, perhaps more specific to the European context, a limiting of the
ambition of planning by governments, attributed to widespread political ascendancy of
business interests in Europe and their influence in policy in most European countries.
51
Secondly, changes in the understanding of spatial planning as a physical land-use-
oriented concept, to consider social, economic and environmental objectives and impacts.
They conclude that “there is no such thing as an abstract ‘correct’ definition of planning
valid for any place or time” and see planning as an activity that focuses on control and
management of land use change within a comprehensive grasp of spatial changes in
society, economy and the environment. This integrated view is further explored below, as
well as in Chapter 6, Section 6, where the concept of landscape ecology is described.
2.3.8 Planning theory: Future perspectives
Planning activities are diverse by nature, covering a wide spectrum of land use control,
the design of change, and directing future development (Glasson & Marshall, 2007:3).
Attempting to define the turmoil in planning theory, Glasson and Marshall argue that the
different conceptualisations of planning are connected with the clashing of ideas in the
wider intellectual arena where different professional traditions are associated with
planning. This includes professionals such as engineers, architects and even public
health officials who have been performing planning functions in times before the
establishment of planning as a profession (Parnell, 1993:476; Duhl & Sanchez, 1999:1;
Glasson & Marshall, 2007:4).
In setting a new agenda for research in planning, theorists have realised the need for a
multidisciplinary approach involving disciplines concerned with environmental, economic
and social goals (Huxley & Yiftachel, 2000:104; Stiftel, 2000:8; Archibugi, 2003:436;
Bertolini et al., 2005:207). Understanding the multidisciplinary nature of planning, is seen
as “ … the foundation of a unitary and integrated corpus of methods, knowledge, and
know-how”, constituting the agenda for research on a new and integrated theory of
planning (Archibugi, 2004:436).
In joining together different disciplines that lie at the basis of planning as a science, it
must first be realised that these disciplines represent a large quantity of theoretical
studies from which an integrated theme must be developed. Archibugi (2004:437, 438)
foresees the integration of socio-economic planning with specific study areas, i.e.
technological forecasting, environmental planning, institutional organisation, political
coordination and information systems. This theme forms the focus of this research, as
explained in Chapter 1.
52
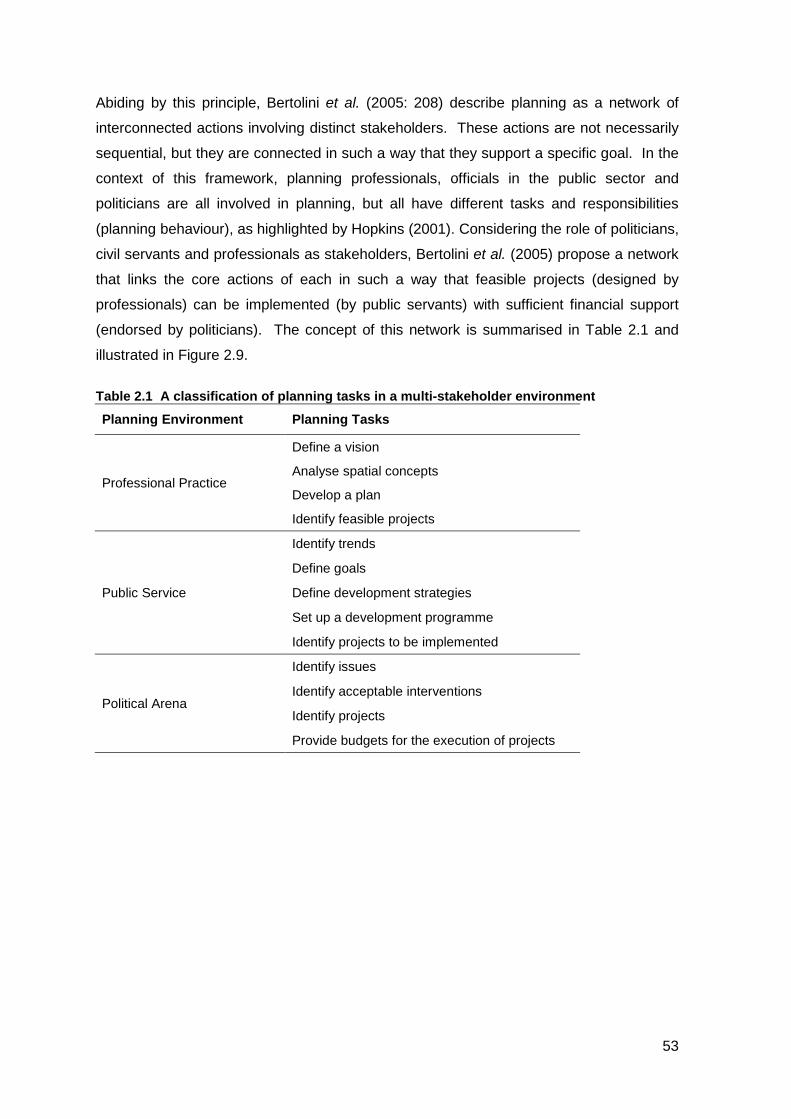
Abiding by this principle, Bertolini et al. (2005: 208) describe planning as a network of
interconnected actions involving distinct stakeholders. These actions are not necessarily
sequential, but they are connected in such a way that they support a specific goal. In the
context of this framework, planning professionals, officials in the public sector and
politicians are all involved in planning, but all have different tasks and responsibilities
(planning behaviour), as highlighted by Hopkins (2001). Considering the role of politicians,
civil servants and professionals as stakeholders, Bertolini et al. (2005) propose a network
that links the core actions of each in such a way that feasible projects (designed by
professionals) can be implemented (by public servants) with sufficient financial support
(endorsed by politicians). The concept of this network is summarised in Table 2.1 and
illustrated in Figure 2.9.
Table 2.1 A classification of planning tasks in a multi-stakeholder environment
Planning Environment Planning Tasks
Professional Practice
Define a vision
Analyse spatial concepts
Develop a plan
Identify feasible projects
Public Service
Identify trends
Define goals
Define development strategies
Set up a development programme
Identify projects to be implemented
Political Arena
Identify issues
Identify acceptable interventions
Identify projects
Provide budgets for the execution of projects
53

Figure 2.14: Planning as a network of interrelated actions Source: Bertolini et al. (2005:209)
A planning society where different sectors of planning are integrated through logical and
methodological connections, as well as its operative functioning, is seen by Archibugi
(2004:435) as the appropriate field of planning theory. He argues that planning theory
would be far more successful in the integration of different approaches, as it would try to
bring into the discussion scholars involved in many different types of planning (e.g.
agricultural, industrial, commercial, services, governmental). Included in this vision are
also different scales of planning – from urban, metropolitan and regional planning to
national, international and global. Interdisciplinary and intradisciplinary research is
strongly encouraged by Van Niekerk (2012) and Van der Waldt (2013), specifically with
regard to integration between development planning and disaster risk assessment. This
topic will be further highlighted in Chapters 3 and 4.
2.4 DEVELOPMENT PLANNING – AN INTEGRATED ENDEAVOUR
Sectoral theories, such as macro-economic governance that initially dominated
development studies, were marked by a gap between economic development on the one
hand and social and political development on the other (Archibugi, 2004). Failures in
54
development policies, emerging problems that require combined approaches, and
development crises and emergencies contributed to a gradual shift towards an
interdisciplinary approach (Pieterse, 2010:14). Discontent with the approach of the 1940s
and 1950s among a number of British economists and social scientists saw the
emergence of the so-called “new universities” in Britain and the establishment of the
Institute of Development Studies at the University of Sussex in 1966. They were
displeased with the traditional insights and quantitative approaches of social and
economic science at the time (Potter, 2014:48). Being largely influenced by Marxist
thoughts, new development studies brought together a number of disciplines in the study
of poverty and inequality as the central concern. This particular focus, which Esteva
(1992:6) refers to as “The Invention of Underdevelopment”, is rooted in the 1949
declaration of US president Harry Truman in his inauguration speech. This development
heralded the introduction of interdisciplinary approaches in development planning.
According to Potter (2014:49), development studies can make a strong claim to be cross-
disciplinary in nature, which implies that development theory cannot be tied to a single
discipline.
Main stream disciplines that have contributed to the rise of development studies include
politics, sociology, economics and geography, which led to the emergence of the sub-
disciplines ‘development economics’ and ‘development geography’ (Potter, 2014). These
fields are linked through commonalities in related disciplines such as demography,
international relations, anthropology, history, and urban and regional planning, adding to
the cross-disciplinary character of development studies (refer to Figure 2.10).
55
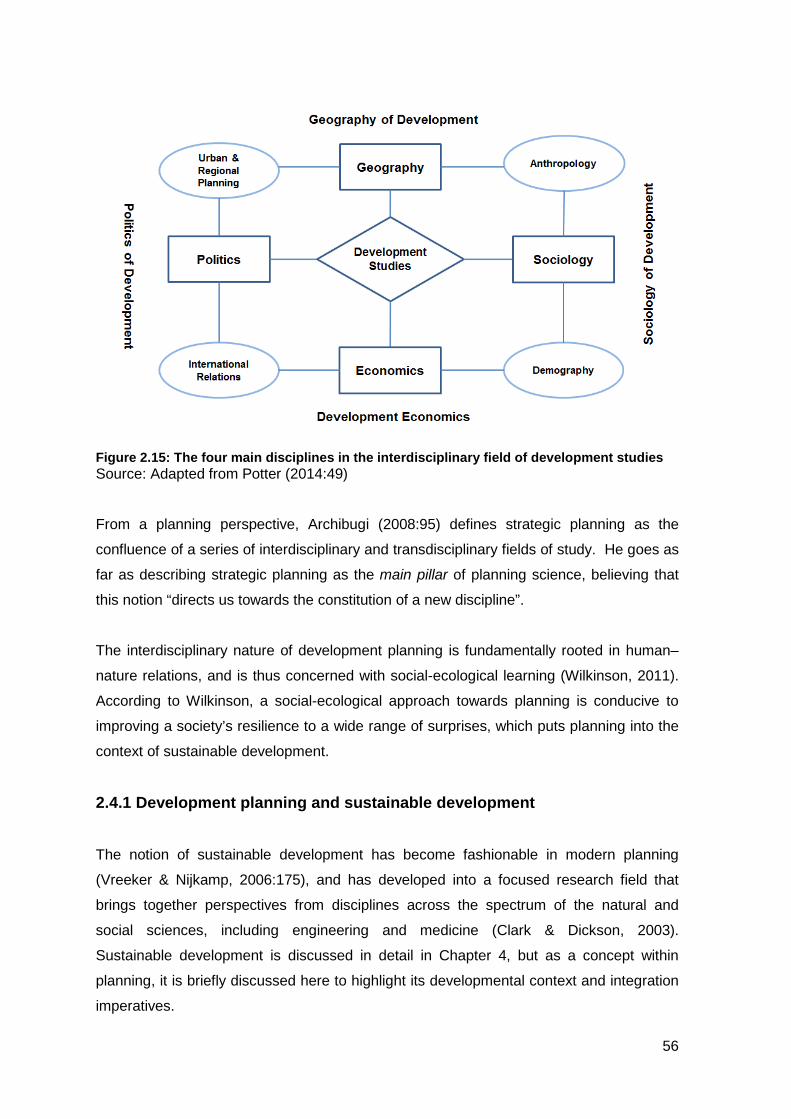
Figure 2.15: The four main disciplines in the interdisciplinary field of development studies Source: Adapted from Potter (2014:49)
From a planning perspective, Archibugi (2008:95) defines strategic planning as the
confluence of a series of interdisciplinary and transdisciplinary fields of study. He goes as
far as describing strategic planning as the main pillar of planning science, believing that
this notion “directs us towards the constitution of a new discipline”.
The interdisciplinary nature of development planning is fundamentally rooted in human–
nature relations, and is thus concerned with social-ecological learning (Wilkinson, 2011).
According to Wilkinson, a social-ecological approach towards planning is conducive to
improving a society’s resilience to a wide range of surprises, which puts planning into the
context of sustainable development.
2.4.1 Development planning and sustainable development
The notion of sustainable development has become fashionable in modern planning
(Vreeker & Nijkamp, 2006:175), and has developed into a focused research field that
brings together perspectives from disciplines across the spectrum of the natural and
social sciences, including engineering and medicine (Clark & Dickson, 2003).
Sustainable development is discussed in detail in Chapter 4, but as a concept within
planning, it is briefly discussed here to highlight its developmental context and integration
imperatives.
56
Vreeker and Nijkamp (2006) define sustainable development as the development of an
economy that has to take place within a set of pre-specified normative constraints or
pathways. They identify four attributes of sustainability constraints: (a) they are
expressed in measurable parameters that are linked to (b) sustainability targets. These
parameters have (c) a proper geographical scale and (d) a relevant time dimension.
Sustainable development, therefore, contains a strong element of information and related
data streams. In an earlier work, Nijkamp and Vreeker (2000) present a framework to
assess the sustainability of development strategies. This framework is based on a
systematic multi-criteria flag model under the heading Sustainability Assessment of
Development Scenarios. Moreover, the framework is developed with a view to dealing
with information, in particular uncertain information, but based on expert opinion and
scientific foundation. Development constraints are defined in various ways and may
include safe minimum standards, carrying capacity, maximum sustainable yield, eco-
capacity, critical loads, and vulnerability, all of which are encapsulated under the general
heading of critical threshold values (CTVs). The framework provides for a band of CTV
values from a minimum to a maximum value for a range of criteria. Exceeding a CTV
would impose an unacceptably high cost on the environment. The criteria cover a
number of sectors that are grouped into three main categories, i.e. economic, social and
environmental.
The imperative for integration stems from recognition of the interdependence of human
and natural systems (Dovers, 2005), which are discussed in Chapter 4. At this juncture
the need for integrated planning and decision making is highlighted. The integration of
environmental, social and economic considerations is a challenge that requires the
development of methods, processes and data streams to create integrative capacity.
Integration is challenged at two levels: first, integration in research, which combines
disciplinary perspectives that point to intra-disciplinary efforts, and second, integration in
policy making, which cuts across different agencies, issues and sectors. Integration is
thus approached from an informative and a decisive perspective, both of which appeal to
the development and use of information systems. (In this context, Chapter 6 deals with
the concept of indicators.) The next section takes a brief look at the general use of
geographic information systems (GIS) in development planning.
57
2.4 INFORMATION AND DEVELOPMENT PLANNING
The use of information systems, particularly GIS, is central to this research. An
observation from the above study of development and planning is the general lack of
reference to information and information systems, notably GIS. Yiftachel (2001) asserts
that most of the influential literature on planning treats planning as a generic, procedural
activity that focuses on issues of decision making and collaborative planning, while
ignoring the relationship between development and space. Calling it “spaceless
planning”, he makes a strong statement by comparing the lack of spatial processes in
planning theory with medical theory ignoring the human body, or legal theory overlooking
the impact of laws on human affairs. Brömmelstroet et al. (2002) make it clear that there
is a need for relevant, useful and understandable information in planning. The need for
processes of information gathering in the context of monitoring is highlighted by Wenban-
Smith (2010), while the aspect of information and its importance in communicative
planning is highlighted by Yiftachel (2001) and Healy (2003).
Friedmann (1998) refers to development processes that manifest in phenomena such as
urbanisation, regional economic growth and change, and the transformation of nature as
socio-spatial processes. In the context of a productivist view of the city, he refers to these
spaces as human habitat. Talking about the unique competence of planners, Friedmann
(1998:251) also states that planners should “have a grounding in knowledge about the
socio-spatial processes that, in interaction with each other, produce the urban habitat”.
The need for integrating information and planning theory is best summarised in the words
of Yiftachel (2001:8):
“It may be high time for a ‘spatial turn’ among other leading theorists, in order to
create a shared theoretical discourse directly relevant to the actual practice and
material consequences of planning.”
2.5 CONCLUSION
In order to understand the intersection between disaster risk management and
development planning, this chapter describes the origins of development planning in order
to understand its theory, claims and proclamations.
The history of planning shows that it is a reaction to socio-economic realities where it was
realised that intervention is required to improve the living conditions and prospects of
58
communities. In the aftermath of industrialisation and urbanisation, planning has
emerged as a profession supported by schools for research and for the training of
planners, specifically in Europe and the United States.
During decades of planning practice, theorists and scholars have been writing about the
roots of the planning profession and the paradigms within which it was practised. The first
observation is that the origins of planning are rooted in disciplines such as economics,
public administration and sociology. In the period after 1955, theorists have established a
distinct planning paradigm, which evolved from a blueprint-planning approach to
rationalism and a communicative approach where planning is seen as an inclusive
process that involves various stakeholders and disciplines.
In the next chapter the theoretical background of environmental management is described
as a discipline related to development planning.
59
CHAPTER 3: THEORY OF ENVIRONMENTAL MANAGEMENT
3.1 INTRODUCTION
Burton, Kates and White (1993) devote the first chapter of their book The environment as
hazard to answering the question: “Is the environment becoming more hazardous?”
According to their assessment, the natural environment is indeed becoming more
hazardous, but in a number of complex ways. They also conclude that the process is not
easy to reverse. The link between industrial-based development and global warming is
receiving increased international attention (Hopper, 2012) against the background of
unequivocal evidence of warming of the climate system (IPCC, 2014). In this context, the
commonalities between development, environmental change and disaster risk become
even more significant to explore.
The link between environmental degradation and disasters from a causation perspective
is well documented (Bankoff, 2001; Renaud, 2006; Labadie, 2007; Bacon 2012). The
growing impact of hazards and disaster on human society is seen as a consequence of
environmental degradation caused by overpopulation, unsustainable development
practices and economic development policies (Bankoff, 2001; Bacon 2012).
Environmental degradation is a broad concept that translates into the conscious
destruction of the three spheres of our planet that support life, i.e. land, air and water
(Thornhill, 2014). It manifests in seven major environmental problems (UNRISD, 1994):
water pollution and water scarcity; air pollution; solid and hazardous wastes; soil
degradation; deforestation;, loss of biodiversity. The effects of environmental degradation
are divergent for various social groups, and for different contexts (UNRISD, 1994). They
include reduced production opportunities due to erosion and contamination, health
problems related to pollution, and decline in the nutritional value of soils. Furthermore,
environmental damage caused by humans increases the vulnerability of communities and
the risk of disasters such as flooding and drought (Renaud, 2006).
On the other hand, the impact of disasters on the environment is also evident (Labadie,
2007). The Exxon Valdez oil spill in 1989 near Prince William Sound in Alaska, and the
Deepwater Horizon oil spill in the Gulf of Mexico in 2010 are mentioned as an example of
human-induced disasters that had large-scale effects, particularly on marine life and local
economies linked to the fishing industry and tourism (Picou & Martin, 2007; Norse &
60
Amos, 2010; Trannum & Bakke, 2012). Although the full impact on ecosystems in the
Gulf of Mexico could not be established due to a lack of field data (Trannum & Bakke,
2012), these two events are regarded as the most destructive technological disasters in
the history of North America. It is known that in Prince William Sound, only eight out of 22
affected species recovered from the effects of the Exxon Valdez oil spill (Picou & Martin,
2007).
Simon (2012:209) argues that creeping environmental changes have a cumulative effect
on environmental degradation, and causes the eroding of the quality of soils, water and
the atmosphere. These Creeping Environmental Problems and Changes (CEPs) caused
by human activity are seemingly accumulating and moving towards a threshold beyond
which major crises may evolve. The effects in terms of the Earth’s population are
described by Barrow (2006:68) as “… gradual or sudden, limited or catastrophic collapse
in numbers, a vacillation, or a cyclic boom-and-bust growth pattern”. Simon (2012) further
highlights the effect of global climate change (GCC), which is expected to increase both
the number of vulnerable people and the extent of their vulnerability. The Climate
Change 2014 Synthesis Report confirms that human influence on the climate system is
clear, and that recent anthropogenic emissions of greenhouse gases are the highest in
history (IPCC, 2014). The reduction of vulnerability and disaster risk needs a focus away
from natural hazards, and a shift towards environmental conservation. Bankoff (2001:20)
states that “[h]ow to mitigate the effects of hazards and relieve the consequences of
disasters seem destined to be major issues of academic enquiry in the new century if for
no other reason than that they are inseparably linked to questions of environmental
conservation, resource depletion and migration patterns in an increasingly globalised
world”. This remark places issues about environmental management in the domain of
disaster risk reduction research.
The theoretical grounding of environmental management is one of the key research
questions that would link this discipline with development management and disaster risk
reduction. Chapter 3 focuses on the theoretical underpinnings of environmental
management by looking at the development of the field, the methods of environmental
assessment and a brief analysis of sustainable development as a notion that stands
central to environmental management, disaster risk management and development
planning.
61
3.2 ENVIRONMENTAL MANAGEMENT
The concept of environmental management is broadly defined as the application of skills
and techniques to care for the Earth (Fuggle, 1992:3). As a practice it appeared in the
1970s as a problem-solving field, providing practical assistance mainly to state officials
(Barrow, 2006:20). The growth path, as described by Barrow (2006), shows similar
developments as was described in Chapter 2 in respect of development planning.
Environmental management developed in the 1970s as a reactive, policy-based
endeavour that was carried out largely by experts trained in the natural sciences in a top-
down manner, and that was implemented and enforced by coercion. This approach soon
shifted to a multi-disciplinary undertaking, addressing social and economic issues and
incorporating public consultation. From a management perspective, it relates to the
execution of planned controls so as to achieve a desired outcome. These controls are
linked to goals associated with the principles of sustainable development. Barrow (2006)
and Labadie (2007) see environmental management as a mixture of objective and
subjective scientific approaches that encapsulates environmental science, environmental
engineering, ecology, and related disciplines. It involves policy making, planning and
management. However, it lacks a widely adopted framework to shape its application.
This leads to ad hoc and problem-solving approaches in reaction to specific situations
(Barrow, 2006:25). From these two broad definitions, the concepts of ‘environment’ and
‘management’ are taken as constituting the foundation for an understanding of
environmental management.
The scope and nature of the environment is vast (Glasson & Marshall, 2007). The literary
meaning of ‘environment’ is the surrounding external conditions that influence
development or growth of people, animal or plants. In short, it is the living and/or working
conditions of living things (Singh, 2006). The term is widely used and means various
things to different people. It is normally used in the context of a particular premise, for
example a town planner may see environment as the spatial structure of a city, whereas
an architect will relate to the fabric of buildings, and an ecologist will see it in the context
of faunal and floral habitat (Fuggle, 1992). Hence it has become common to speak of the
‘built environment’, the ‘natural environment’, and also the ‘social’ or ‘cultural’ environment
to distinguish different settings. The National Environmental Management Act (Act 107 of
1998) defines environment as
“the surroundings within which humans exist and that are made up of -
(i) the land, water and atmosphere of the earth;
(ii) micro-organisms, plant and animal life;
62
(iii) any part or combination of (i) and (ii) and the interrelationships among
and between them; and
(iv) the physical, chemical, aesthetic and cultural properties and conditions
of the foregoing that influence human health and wellbeing” (South Africa,
1998).
Barrow (2006:378) defines environment as
“the sum total of conditions within which organisms live; the result of the
interaction between non-living (abiotic) physical and chemical, and, where present,
living (biotic) components”.
From the above definitions it is clear that the environment is constituted by interacting
systems of physical, biological and cultural elements that are interrelated in various ways.
These elements constitute the landscape within which interaction between these
elements takes place. The concept of landscape ecology defines the interaction between
humans and the environment, and is described in more detail in Chapter 7. At this
juncture, the environment is described as consisting of three main elements: physical,
biological and cultural (anthropogenic) (Singh, 2006:3; Nhamo & Inyang, 2011):
i. Physical elements: atmosphere, landforms, water, climate, rocks and minerals,
soils, etc. These elements determine the variable character of the human
habitat, its opportunities and constraints.
ii. Biological elements: plants, animals, micro-organisms and man, constituting
the biosphere.
iii. Cultural (anthropogenic) elements: economic, social and political constructs
that are essentially anthropogenic features.
Environmental science, therefore, is a multi-disciplinary field comprising various branches
of study such as ecology, zoology, agriculture, archaeology, and public health (Fuggle,
1992:4; Singh, 2006:1). From an anthropological and physical perspective, it also relates
to sociology and geography.
The ‘management’ component is briefly described to establish the context of
environmental management. Dale (1960:4), after considering various definitions from
literature, defines management as
“the process by which a manager of an organisation efficiently utilizes resources to
achieve its overall goals at minimum cost and maximum profit. When used
63
collectively, the term management refers to the group of people who are
responsible and accountable for directing the work force and seeing to it that the
organization meets its goals or objectives”.
Weihrich (1993) defines management as
“the process of designing and maintaining an environment in which individuals,
working together in groups, accomplish efficiently selected aims”.
The definition of management, and its functions, highlights important features of the
concept. First, management is a process, a systematic way of doing things, involving
skilled people. Second, it utilises resources efficiently, including materials, time, effort
and money. Third, management actions work toward a stated goal. Dale (1960) and
Weihrich (1993) identify five functions of management, namely planning, organisation,
staffing, leading (motivating) and controlling. In all of these functions, two essential
processes occur: decision making and communicating, which imply the creation,
administration and dissemination of information. Data acquisition and processing is seen
as the starting point and a key aspect of environmental management (Barrow, 2006).
This includes qualitative and quantitative data and implies the involvement of specialists
such as statisticians and GIS practitioners.
Applying these principles means that environmental management is a concerted effort to
plan, organise, implement and control actions that are aimed at caring for the Earth. The
question “who is responsible for environmental management?” brings the issue of
environmental governance to the fore. Environmental governance refers to an inclusive
process of decision making regarding the control and management of the environment
(Fakier, Stephens & Tholin, 2005). Governance is a function of public administration and
refers to the system of values, polices and institutions by which a society manages its
economic, political and social affairs through interactions within and among the state, civil
society and the private sector (Fakier et al., 2005; Feris, 2010). In view of global issues
such as climate change, the concept of global environmental governance builds on
international environmental cooperation that dates from even before the 1972 Stockholm
Conference on the Human Environment (Biermann, 2004) (refer to Section 3.3.1 with
regard to the significance of this conference). Global environmental governance is
described as the sum of organisations, policy instruments, financing mechanisms, rules,
procedures and norms that regulate the processes of global environmental protection
(Najam, Papa & Taiyab, 2006:3), and focuses on transboundary issues relating to human
64
activity and natural processes. Transboundary human activities include issues such as
food production, loss of biodiversity, water resource problems, nuclear energy, HIV/AIDS,
and malaria. Natural processes that involve international cooperation include climate
change, stratospheric ozone damage, major volcano eruptions, tsunamis, epidemic
diseases, and ocean/atmospheric circulation shifts (Barrow, 2006).
Frameworks for environmental governance are further discussed in the context of
integrated environmental management, which provides an outline for environmental
management practices.
3.3 INTEGRATED ENVIRONMENTAL MANAGEMENT
As a theory, environmental management can be structured under the paradigm of
integrated environmental management (IEM). IEM has developed to be “an underlying
philosophy and set of principles supported by a range of environmental assessment and
management tools that are aimed at promoting sustainability” (DEAT, 2004:8). As such,
IEM cannot be defined in terms of processes. It provides a way of thinking that can be
used to underpin a stand-alone process such as environmental impact assessment, or it
can be integrated into complementary processes such as comprehensive regional
planning (Barrow, 2006) or integrated development planning (IDP), as described in
Chapter 2.
IEM developed from a growing awareness of the adverse impacts of development on the
environment, which gave rise to the need to understand and deal with those impacts
(Preston, Robins & Fuggle, 1992:748). Developments in the international arena, followed
by the institutionalisation of environmental law in many countries, saw the emergence of
increased concern about the environment, and frameworks within which issues could be
addressed (Elliot, 2006:126). These frameworks are briefly assessed in the setting of
international initiatives and environmental management tools that were developed in
response.
65
3.3.1 International initiatives
Certain global initiatives mark the emergence of environmental governance (Rabie &
Fuggle, 1992; Nhamo & Inyang, 2011). These include the promulgation of legislation in
various countries, as well as international summits.
The United States was the first country to enact the requirement of environmental impact
assessment of proposed developments with its promulgation of the National
Environmental Policy Act in 1969 (Aucamp, 2009:4). Furthermore, international concern
about the environment, particularly acid rain and critical air pollution in Western Europe
(Nhamo & Inyang, 2011:9), led to the United Nations’ Conference on the Human
Environment in Stockholm in June 1972. This was regarded as the most successful
international conference at the time (Sohn, 1973:423). The success was in the so-called
Stockholm Declaration, which contained a set of principles to inspire and guide the
preservation and enhancement of the human environment. The resolution also included
institutional and financial agreements and recommendations that would make it an
ambitious action plan. The Action Plan inter alia recommended that the UN General
Assembly formulate an inter-agency Environmental Co-ordinating Board that would
ensure cooperation and coordination among major bodies involved in the implementation
of environmental programmes within the UN systems. This gave rise to the formation of
the United Nations Environment Programme (UNEP). The success of these initiatives is
also reflected in the fact that the environment was placed firmly as a matter of concern on
most government agendas (Nhamo & Inyang, 2011:11).
Increased environmental degradation, as well as divisions between developed countries
of the North and emerging and developing countries of the South, contributed to the
United Nations General Assembly initiating an independent body, the World Commission
on Environment and Development (WCED) (Ling, 2012:2). The aim of the commission
was to find practical ways of addressing the environmental and developmental problems
of the world (WCED, 1987). From this initiative emerged a report “Our Common Future”,
also referred to as the Bruntland Report (named after the Norwegian Prime Minister and
chairman of the commission), which inter alia called for ‘sustainable development’ as a
long-term environmental strategy. Key issues that would require urgent action included
population and human resources, food security, the urban challenge, energy, industry,
species and ecosystems, managing the commons, and conflict and environmental
degradation (Nhamo & Inyang, 2011:12).
66
A Heads-of-State conference followed in June 1992, with a large contingent of NGOs,
community, government and citizens’ groups gathering in Rio de Janeiro. During this
conference, the North-South conflict surfaced again. Whereas governments from the
North had an agenda to solve environmental issues, the South was focused on
industrialisation, development and poverty alleviation (Nhamo & Inyang, 2011; Ling 2012).
The concept of sustainable development was debated in depth and after long and difficult
deliberations, the Rio Declaration on Environment and Development, containing 27
principles on the general rights and obligations of states, was adopted. This set a new
course in development thinking and became a central theme in the mission of
organisations and institutions (NRC, 1999:22).
Environmental management gained increased importance on socio-political agendas all
over the world (Hart, 1992:53). Concerted international efforts following the Rio de
Janeiro summit include the Millennium Summit (UN General Assembly, 2000), which saw
the formulation of the Millennium Development Goals, and the World Summit on
Sustainable Development in Johannesburg, 2002 (Nhamo & Inyang, 2011:23; UN, 2014)
– all of which furthered the objectives of sustainable development. As a unifying concept,
the latter is further explored in Section 3.4.1.
3.3.2 Environmental management tools
Emerging environmental awareness in the 1960s resulted in the adoption of two major
approaches and tools for environmental management, i.e. environmental impact
assessment (EIA) and strategic environmental assessment (SEA). The concept of EIA
was institutionalised in the US under the National Environmental Policy Act (NEPA) in
1969 (Smith, Richardson & McNab, 2010:10), and for the first time environmental
evaluations were introduced into the realm of public policy (Preston, Robins & Fuggle,
1992:748; Barrow, 2006:20). Following the US lead, EIAs became widely
institutionalised, with at least 100 countries having adopted some kind of EIA legislation,
system or guideline (Aucamp, 2009:8). Shortcomings of an EIA identified in the 1970s led
scholars and practitioners to seek alternative approaches and tools, eventually resulting in
the establishment of SEA as a policy-based tool. In addition, the concept of
environmental management frameworks emerged as an activity-based tool in support of
an EIA (South Africa, 2010). A description of these tools provides an understanding of
decision making with regard to environmental issues.
67
3.3.2.1 Environmental Impact Assessment (EIA)
An EIA forms part of an array of tools and techniques for environmental assessment.
Porter and Fittipaldi (eds.) (1998) compiled a comprehensive volume on tools and
techniques for environmental assessment and impact assessment, which includes
domain-orientated assessments such as social, economic, public health, risk, ecological,
and climate impact and adaptation assessments. This points to the interdisciplinary
nature of environmental assessment.
Aucamp (2009:5) states that environmental quality is preserved and improved through
proactive and reactive measures. The first strives to prevent degradation and promote
conservation. The main tools in this respect are environmental impact assessment (EIA)
and strategic environmental assessment (SEA). Reactive measures are focused on
existing impacts and strive to mitigate their effects through measures such as
rehabilitation of degraded areas, reducing of emissions, and a general clean-up of the
environment. The tools used in this regard are specific legislation with compliance and
enforcement powers, using international standards such as ISO 14001 (Labadie, 2007).
There is no universal definition of what an EIA is, and it is best treated as a generic term
for a process that seeks to integrate administration, planning, analysis and public
involvement in an assessment that precedes decision making (Barlow, 2006:205). In
South Africa EIAs are enforced by law through the National Environmental Management
Act (Act 107 of 1998), generally referred to as the NEMA, and the Environmental Impact
Assessment Amendment Regulations, 2010 (South Africa, 1998; South Africa, 2010).
EIAs are undertaken on a project level, and are specific to a particular project design and
development application. Aucamp (2009:5) defines an EIA as a systematic process of
examining the potential impacts of a proposed development on the environment
(biophysical, socio-economic and cultural). As an integrated process, an EIA involves
public consultation and review in a range of steps that are prescribed in the regulations.
A generic framework for EIA is presented in Figure 3.1.
An EIA is conducted through a number of steps or phases, which starts with an initial
proposal for development of a specific activity. In South Africa the NEMA provides for the
listing of activities that require an EIA and the identification of competent authorities
responsible for granting environmental authorisations in respect of those activities. A
screening process of the proposed activity and the appropriate legislation ensures that
there is no uncertainty as to whether an EIA should be carried out or not. If not, a
68
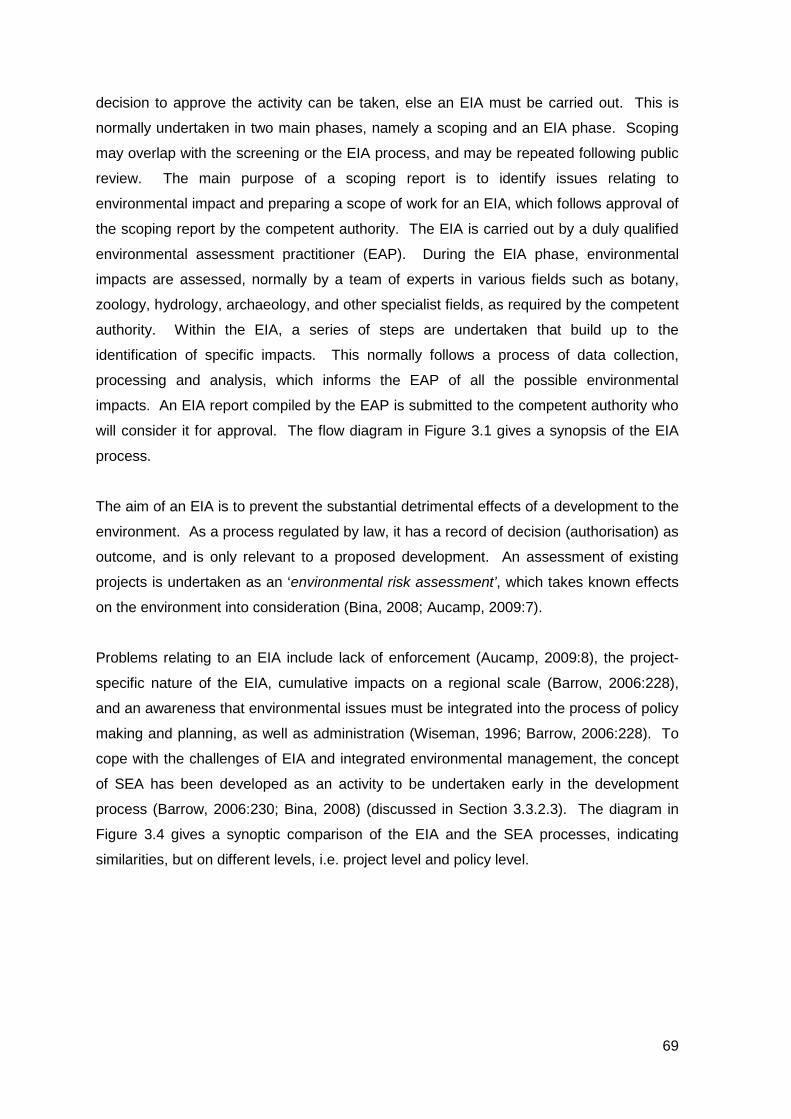
decision to approve the activity can be taken, else an EIA must be carried out. This is
normally undertaken in two main phases, namely a scoping and an EIA phase. Scoping
may overlap with the screening or the EIA process, and may be repeated following public
review. The main purpose of a scoping report is to identify issues relating to
environmental impact and preparing a scope of work for an EIA, which follows approval of
the scoping report by the competent authority. The EIA is carried out by a duly qualified
environmental assessment practitioner (EAP). During the EIA phase, environmental
impacts are assessed, normally by a team of experts in various fields such as botany,
zoology, hydrology, archaeology, and other specialist fields, as required by the competent
authority. Within the EIA, a series of steps are undertaken that build up to the
identification of specific impacts. This normally follows a process of data collection,
processing and analysis, which informs the EAP of all the possible environmental
impacts. An EIA report compiled by the EAP is submitted to the competent authority who
will consider it for approval. The flow diagram in Figure 3.1 gives a synopsis of the EIA
process.
The aim of an EIA is to prevent the substantial detrimental effects of a development to the
environment. As a process regulated by law, it has a record of decision (authorisation) as
outcome, and is only relevant to a proposed development. An assessment of existing
projects is undertaken as an ‘environmental risk assessment’, which takes known effects
on the environment into consideration (Bina, 2008; Aucamp, 2009:7).
Problems relating to an EIA include lack of enforcement (Aucamp, 2009:8), the project-
specific nature of the EIA, cumulative impacts on a regional scale (Barrow, 2006:228),
and an awareness that environmental issues must be integrated into the process of policy
making and planning, as well as administration (Wiseman, 1996; Barrow, 2006:228). To
cope with the challenges of EIA and integrated environmental management, the concept
of SEA has been developed as an activity to be undertaken early in the development
process (Barrow, 2006:230; Bina, 2008) (discussed in Section 3.3.2.3). The diagram in
Figure 3.4 gives a synoptic comparison of the EIA and the SEA processes, indicating
similarities, but on different levels, i.e. project level and policy level.
69
Figure 3.16: A typical step-wise EIA process Source: Barrow (2006:207)
The EIA process, as described above, is indicative of a large information component. The
use of geographic information systems technology is implied in the NEMA, Section 24(3),
which stipulates as follows (South Africa, 1998):
“The Minister, or an MEC with the concurrence of the Minister, may compile
information and maps that specify the attributes of the environment in particular
geographical areas, including the sensitivity, extent, interrelationship and
significance of such attributes which must be taken into account by every
competent authority.”
70
A geographical area is a spatial unit determined by the unique combination of
environmental attributes in which specified activities may not commence without
environmental authorisation from the competent authority (NEMA, Section 24(2)). The
expansion of this concept into a data model is proposed in Chapter 8.
The approval of an EIA means the proposed activity can be implemented. This is the last
phase in the EIA process and requires monitoring of the development activity in terms of
an environmental management plan (EMP), which is briefly described below.
3.3.2.2 Environmental Management Plans (EMPs)
Mitigation measures to avoid or minimise damage to the environment that may be caused
by a development project are prescribed within an EIA (Aucamp, 2009). Environmental
management plans (EMPs) outline the mitigation, monitoring and institutional measures to
be taken during project implementation and operation to avoid or control adverse
environmental impacts, and the actions needed to implement these measures (World
Bank, 1999; DEAT 2004b). There is no standard format for EMPs. The format needs to fit
the circumstances in which the EMP is being developed and the requirements which it is
designed to meet, and it should be formulated in such a way that it is easy to use. The
South African Department of Environmental Affairs and Tourism provides for three broad
categories of EMPs in the lifecycle of a development project and distinguishes between
construction, operation and decommissioning. Each of these phases presents different
types of activity that require specific mitigation and monitoring measures (DEAT, 2004b).
According to the World Bank (1999), an EMPs should contain the following components:
i. A summary of the predicted negative environmental impacts for which mitigation is
required.
ii. Detailed description of feasible and cost effective mitigation measures to reduce
significant negative environmental impacts to acceptable and legal levels.
Mitigation measures should be accompanied by designs, equipment descriptions
and operating procedures.
iii. Description of a monitoring programme to ensure that mitigation measures are
implemented. The monitoring programme should clearly indicate the linkages
between impacts, indicators to be measured, measurement methods and
definition of thresholds that will signal the need for corrective actions.
iv. A clear definition of responsibilities and institutional arrangements for mitigation
and monitoring actions.
71
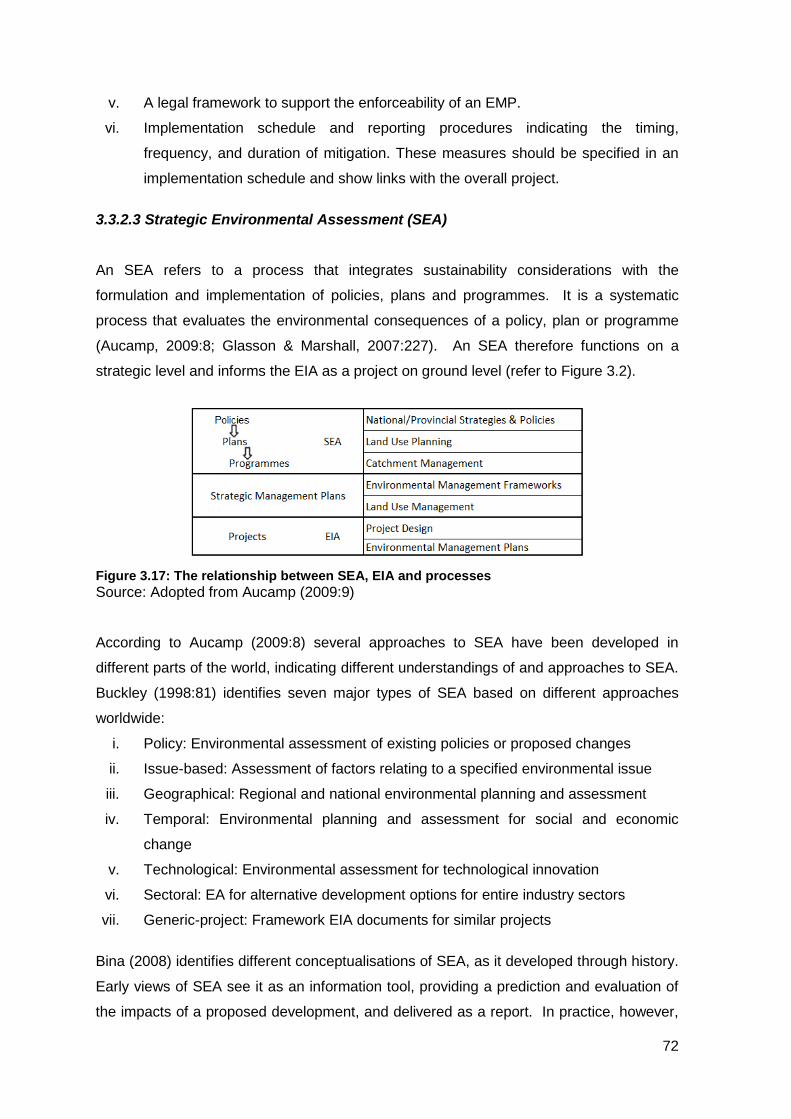
v. A legal framework to support the enforceability of an EMP.
vi. Implementation schedule and reporting procedures indicating the timing,
frequency, and duration of mitigation. These measures should be specified in an
implementation schedule and show links with the overall project.
3.3.2.3 Strategic Environmental Assessment (SEA)
An SEA refers to a process that integrates sustainability considerations with the
formulation and implementation of policies, plans and programmes. It is a systematic
process that evaluates the environmental consequences of a policy, plan or programme
(Aucamp, 2009:8; Glasson & Marshall, 2007:227). An SEA therefore functions on a
strategic level and informs the EIA as a project on ground level (refer to Figure 3.2).
Figure 3.17: The relationship between SEA, EIA and processes Source: Adopted from Aucamp (2009:9)
According to Aucamp (2009:8) several approaches to SEA have been developed in
different parts of the world, indicating different understandings of and approaches to SEA.
Buckley (1998:81) identifies seven major types of SEA based on different approaches
worldwide:
i. Policy: Environmental assessment of existing policies or proposed changes
ii. Issue-based: Assessment of factors relating to a specified environmental issue
iii. Geographical: Regional and national environmental planning and assessment
iv. Temporal: Environmental planning and assessment for social and economic
change
v. Technological: Environmental assessment for technological innovation
vi. Sectoral: EA for alternative development options for entire industry sectors
vii. Generic-project: Framework EIA documents for similar projects
Bina (2008) identifies different conceptualisations of SEA, as it developed through history.
Early views of SEA see it as an information tool, providing a prediction and evaluation of
the impacts of a proposed development, and delivered as a report. In practice, however,
72
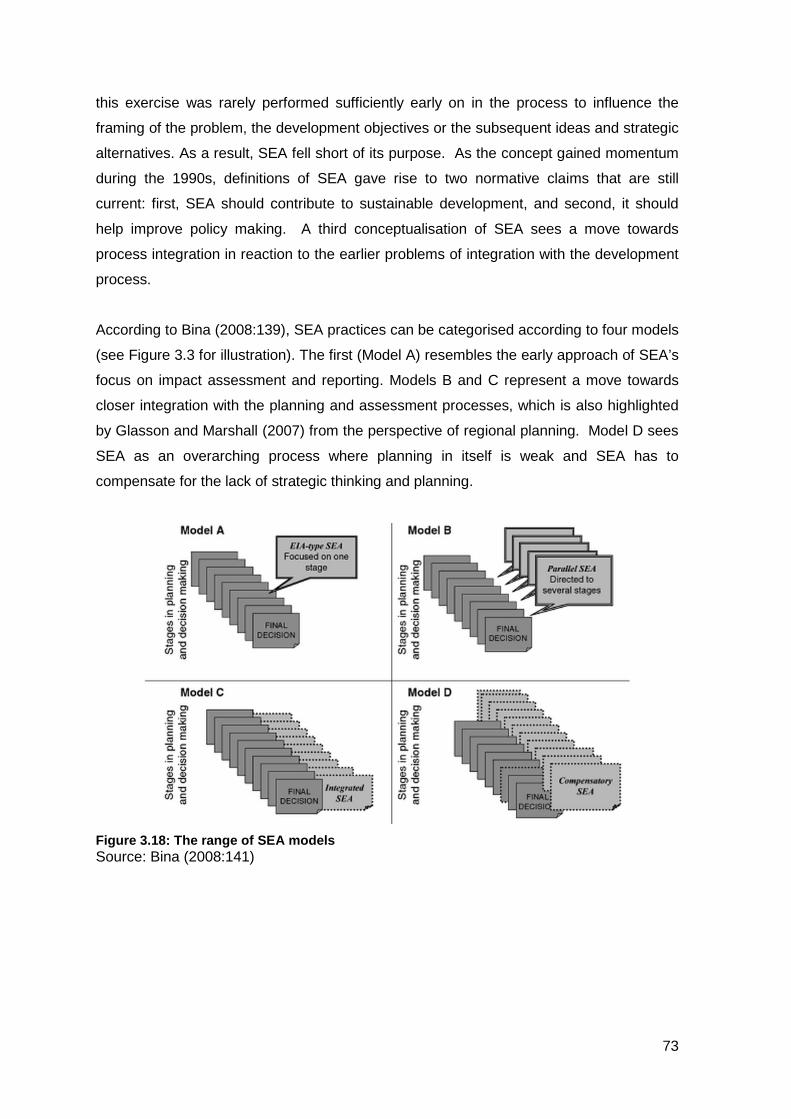
this exercise was rarely performed sufficiently early on in the process to influence the
framing of the problem, the development objectives or the subsequent ideas and strategic
alternatives. As a result, SEA fell short of its purpose. As the concept gained momentum
during the 1990s, definitions of SEA gave rise to two normative claims that are still
current: first, SEA should contribute to sustainable development, and second, it should
help improve policy making. A third conceptualisation of SEA sees a move towards
process integration in reaction to the earlier problems of integration with the development
process.
According to Bina (2008:139), SEA practices can be categorised according to four models
(see Figure 3.3 for illustration). The first (Model A) resembles the early approach of SEA’s
focus on impact assessment and reporting. Models B and C represent a move towards
closer integration with the planning and assessment processes, which is also highlighted
by Glasson and Marshall (2007) from the perspective of regional planning. Model D sees
SEA as an overarching process where planning in itself is weak and SEA has to
compensate for the lack of strategic thinking and planning.
Figure 3.18: The range of SEA models Source: Bina (2008:141)
73
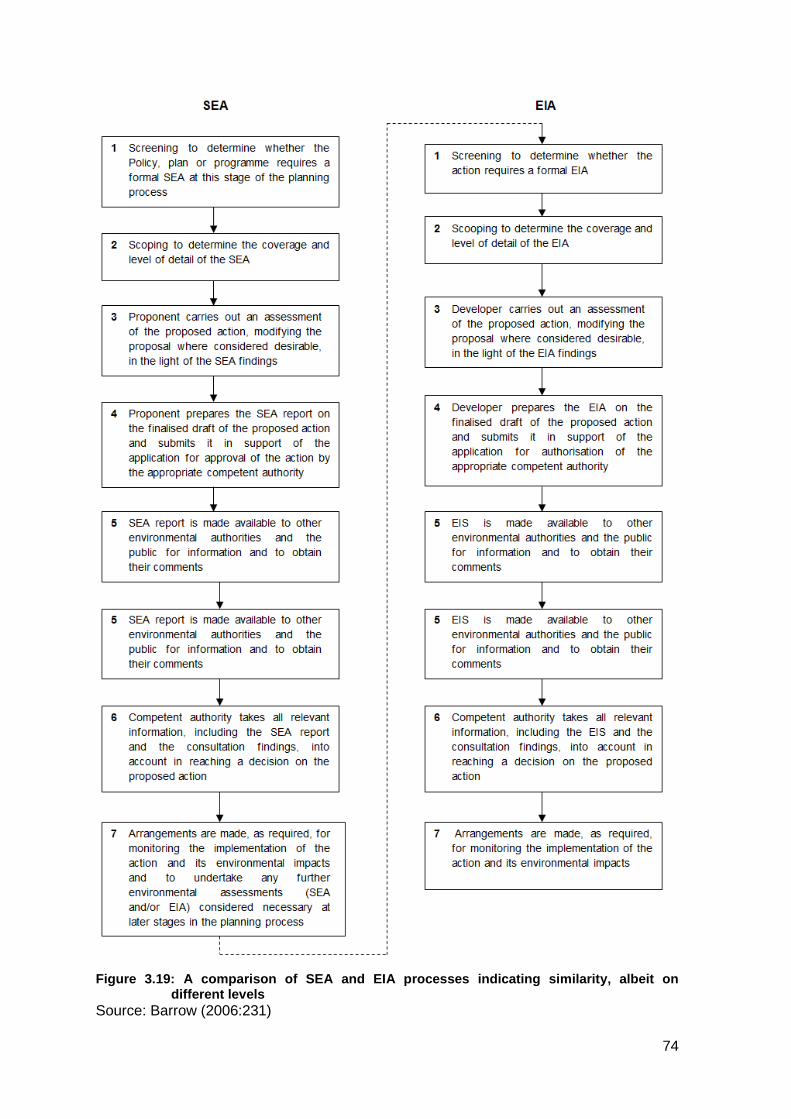
Figure 3.19: A comparison of SEA and EIA processes indicating similarity, albeit on
different levels Source: Barrow (2006:231)
74
From a planning perspective, Glasson and Marshall (2007:210) acknowledge that the
environment is under increasing threat of development actions. They see SEA as an
important component of regional planning, as it provides the framework for planning and
development activity. It is seen as an important activity that should be carried out
concurrently with the plan-making process, and not as an add-on at the end of the
process, thereby highlighting the integration of processes as suggested by Bina’s Models
B and C.
One of the disadvantages SEA is the lack of legal status (Bina, 2008:146). As legal a
structures on strategic level, environmental management frameworks (EMF) seem to fill
the gap between SEA and EIA.
3.3.2.4 Environmental Management Framework (EMF)
Apart from the US and EU, where SEA enjoys strong legal requirements (Bina,
2008:146), it is mostly undertaken as a principle of best practice in other parts of the world
(Buckley, 1998:80). In South Africa environmental management frameworks (EMF) have
been established as an environmental management tool, promulgated under the
Environmental Management Framework Regulations, Regulation 547 of the National
Environmental Management Act, 1998 (Act 107 of 1998). EMF is defined as
“a study of the biophysical and socio-cultural systems of a geographically defined
area to reveal where specific land uses may best be practiced and to offer
performance standards for maintaining appropriate use of such land” (South
Africa, 2010:190).
EMFs assist authorities responsible for the environment and other government decision
makers to make informed decisions on environmental matters (EMM, 2007). The
development of an EMF is a geo-spatially oriented process aimed at the identification of
environmental sensitivity, development constraints and the spatial demarcation of
environmental management zones. These are linked to management guidelines and a
list of development activities, indicating preferred use of land in specific management
zones (South Africa, 2012:213).
Integration with planning practice is emerging slowly, with EMFs providing input into the
development of spatial development frameworks (Thornhill, 2014). This development is
75
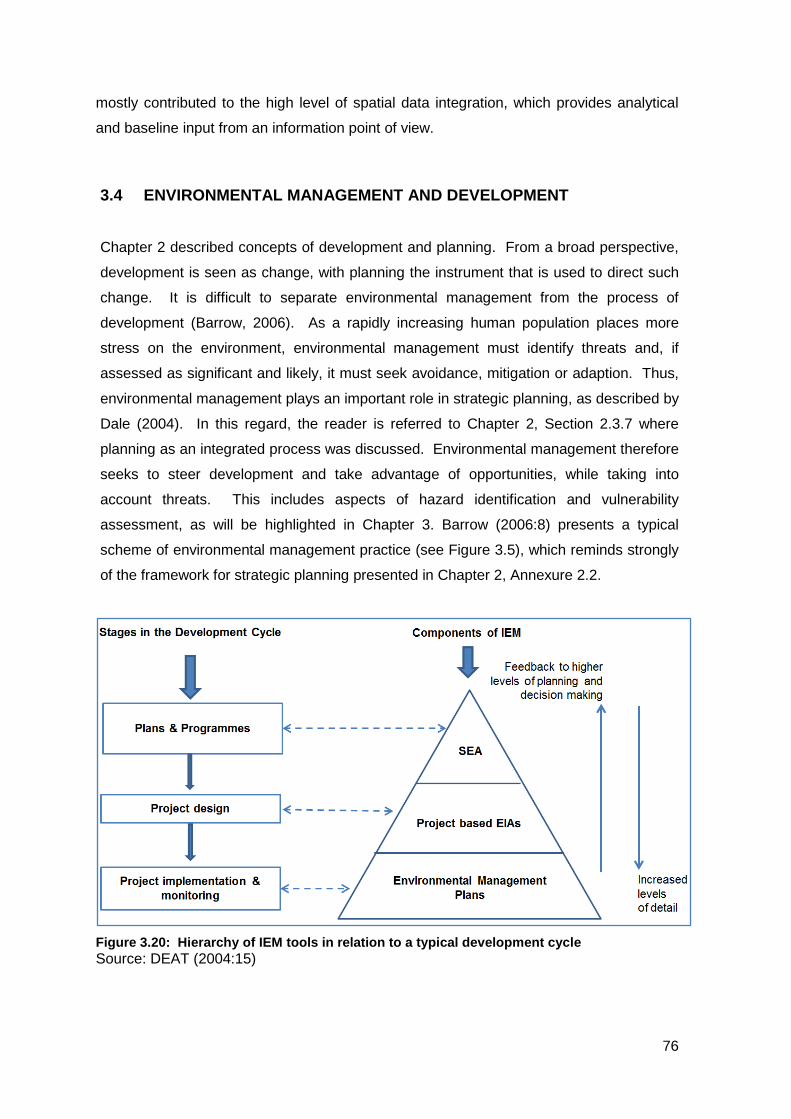
mostly contributed to the high level of spatial data integration, which provides analytical
and baseline input from an information point of view.
3.4 ENVIRONMENTAL MANAGEMENT AND DEVELOPMENT
Chapter 2 described concepts of development and planning. From a broad perspective,
development is seen as change, with planning the instrument that is used to direct such
change. It is difficult to separate environmental management from the process of
development (Barrow, 2006). As a rapidly increasing human population places more
stress on the environment, environmental management must identify threats and, if
assessed as significant and likely, it must seek avoidance, mitigation or adaption. Thus,
environmental management plays an important role in strategic planning, as described by
Dale (2004). In this regard, the reader is referred to Chapter 2, Section 2.3.7 where
planning as an integrated process was discussed. Environmental management therefore
seeks to steer development and take advantage of opportunities, while taking into
account threats. This includes aspects of hazard identification and vulnerability
assessment, as will be highlighted in Chapter 3. Barrow (2006:8) presents a typical
scheme of environmental management practice (see Figure 3.5), which reminds strongly
of the framework for strategic planning presented in Chapter 2, Annexure 2.2.
Figure 3.20: Hierarchy of IEM tools in relation to a typical development cycle Source: DEAT (2004:15)
76
Environmental management is concerned with human-environment interactions and
seeks what is environmentally desirable, bearing in mind physical, economic, social and
technological constraints (Turner, 1997; Turner et al., 2003a; Barrow, 2006:5; Renaud,
2006; Strange & Bayley, 2008). This integration points to the concept of sustainable
development which aims at achieving benefits for the widest range of sectors through
development (Strange & Bayley, 2008:24).
3.4.1 Sustainable development Sustainable development has become an imperative for environmental management,
disaster reduction and development planning. Living with Risk (UNISDR, 2004:20) states
that disaster risk reduction has emerged as “an essential requisite for sustainable
development”. A publication by the World Commission on Environment and
Development, Our common world (WCED, 1987) calls for humanity to make development
sustainable “to ensure that it meets the needs of the present without compromising the
ability of future generations to meet their own needs”. Planners recognise the fact that
economic development and environmental degradation can be a causal downward spiral
that can be hard to reverse (Glasson & Marshall, 2007:80).
It is generally accepted that there is no easy solution to ensure a balanced approach to
sustainable development, as suggested by WCED (1987), and that action will have to
proceed simultaneously on several fronts (Fuggle, 1992:2). Despite the global
acceptance of the concept, however, its nature and scope is confused territory (Glasson &
Marshall, 2007:82). Furthermore, the meaning of the term has evolved and changed in
public debate and scholarly literature (NRC, 1999; Faber, Jorna & Van Engelen, 2005).
From the static perspective that development should meet the needs of the present
without compromising the ability of future generations to meet their own needs (WCED,
1987), the definition of sustainability changed to a relative and dynamic perspective:
“Sustainability no longer targets an ultimate sustainable state, but instead becomes a
process of constant improvement of the sustainability of artefacts” (Faber et al., 2005:27).
Building on the advances of the Bruntland report, and one year before the Rio de Janeiro
summit, Caring for the Earth, a strategy for sustainable was published in 1991 as a
partnership between The World Conservation Union (IUCN), the United Nations
Environmental Programme (UNEP) and the World Wide Fund For Nature (WWF).
Regarded as a significant contribution to fostering human responsibility for the earth
(Fuggle, 1992:2), nine principles for building a sustainable society are proposed:
77
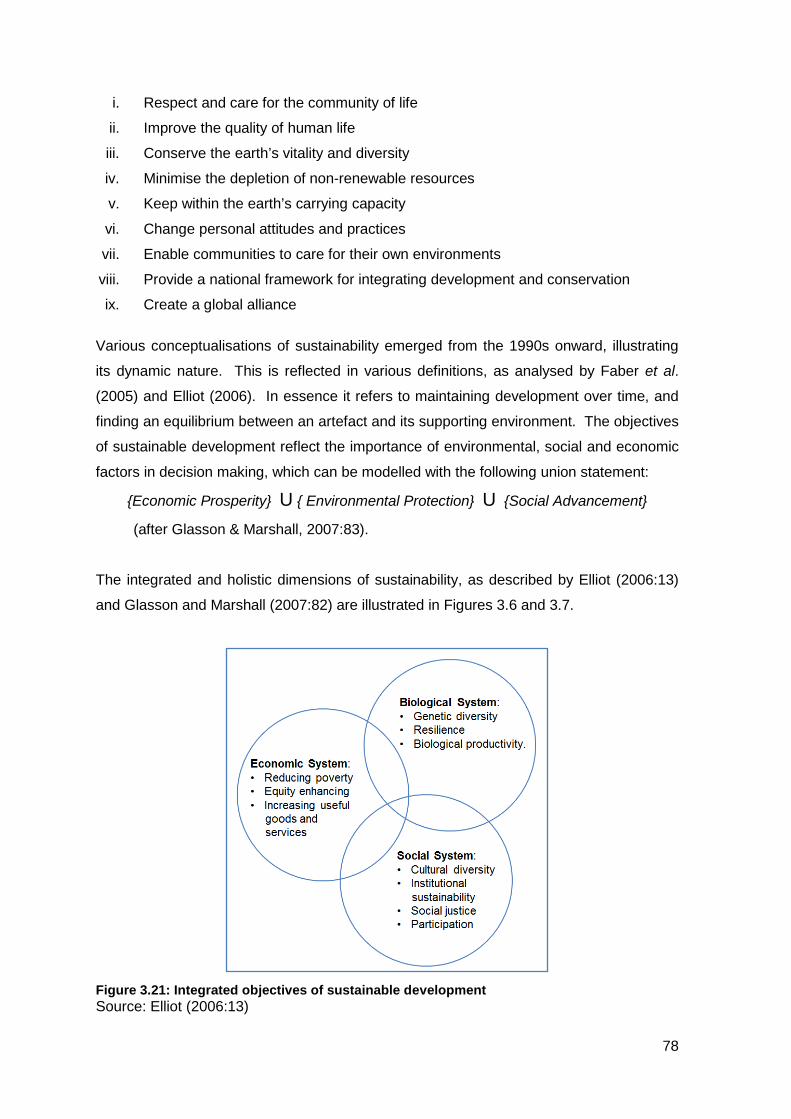
i. Respect and care for the community of life
ii. Improve the quality of human life
iii. Conserve the earth’s vitality and diversity
iv. Minimise the depletion of non-renewable resources
v. Keep within the earth’s carrying capacity
vi. Change personal attitudes and practices
vii. Enable communities to care for their own environments
viii. Provide a national framework for integrating development and conservation
ix. Create a global alliance
Various conceptualisations of sustainability emerged from the 1990s onward, illustrating
its dynamic nature. This is reflected in various definitions, as analysed by Faber et al.
(2005) and Elliot (2006). In essence it refers to maintaining development over time, and
finding an equilibrium between an artefact and its supporting environment. The objectives
of sustainable development reflect the importance of environmental, social and economic
factors in decision making, which can be modelled with the following union statement:
{Economic Prosperity} U { Environmental Protection} U {Social Advancement}
(after Glasson & Marshall, 2007:83).
The integrated and holistic dimensions of sustainability, as described by Elliot (2006:13)
and Glasson and Marshall (2007:82) are illustrated in Figures 3.6 and 3.7.
Figure 3.21: Integrated objectives of sustainable development Source: Elliot (2006:13)
78
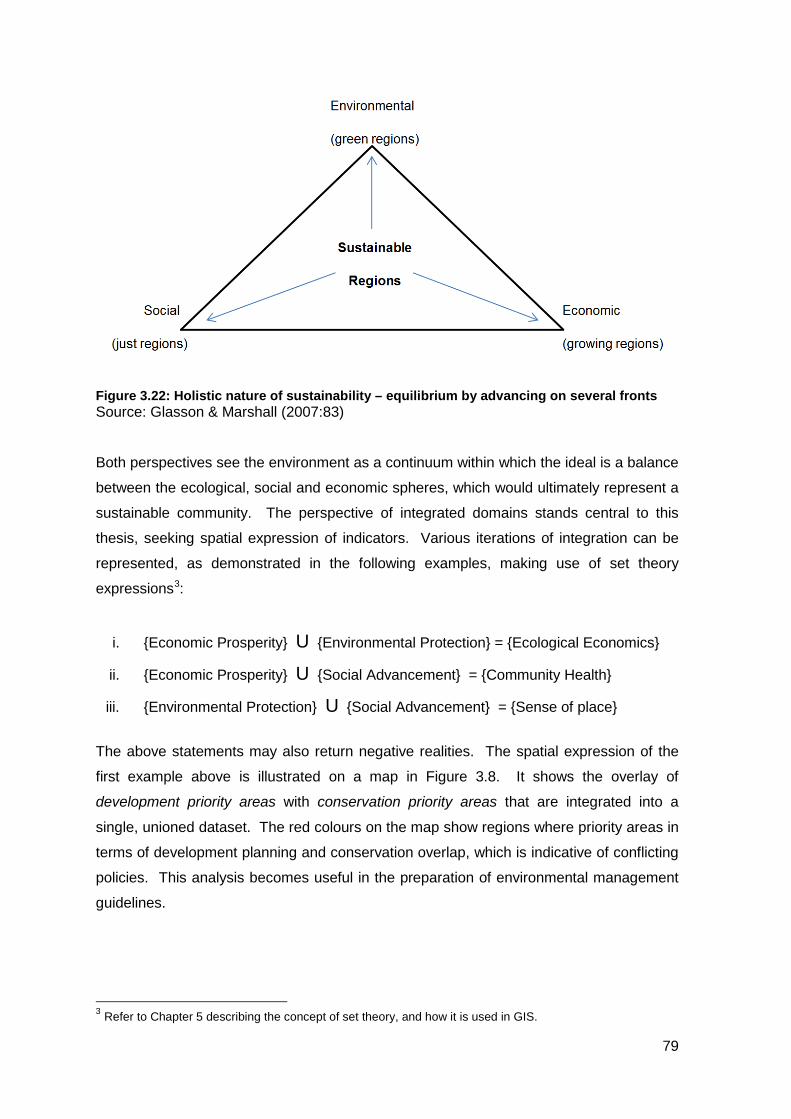
Figure 3.22: Holistic nature of sustainability – equilibrium by advancing on several fronts Source: Glasson & Marshall (2007:83)
Both perspectives see the environment as a continuum within which the ideal is a balance
between the ecological, social and economic spheres, which would ultimately represent a
sustainable community. The perspective of integrated domains stands central to this
thesis, seeking spatial expression of indicators. Various iterations of integration can be
represented, as demonstrated in the following examples, making use of set theory
expressions3:
i. {Economic Prosperity} U {Environmental Protection} = {Ecological Economics}
ii. {Economic Prosperity} U {Social Advancement} = {Community Health}
iii. {Environmental Protection} U {Social Advancement} = {Sense of place}
The above statements may also return negative realities. The spatial expression of the
first example above is illustrated on a map in Figure 3.8. It shows the overlay of
development priority areas with conservation priority areas that are integrated into a
single, unioned dataset. The red colours on the map show regions where priority areas in
terms of development planning and conservation overlap, which is indicative of conflicting
policies. This analysis becomes useful in the preparation of environmental management
guidelines.
3 Refer to Chapter 5 describing the concept of set theory, and how it is used in GIS.
79
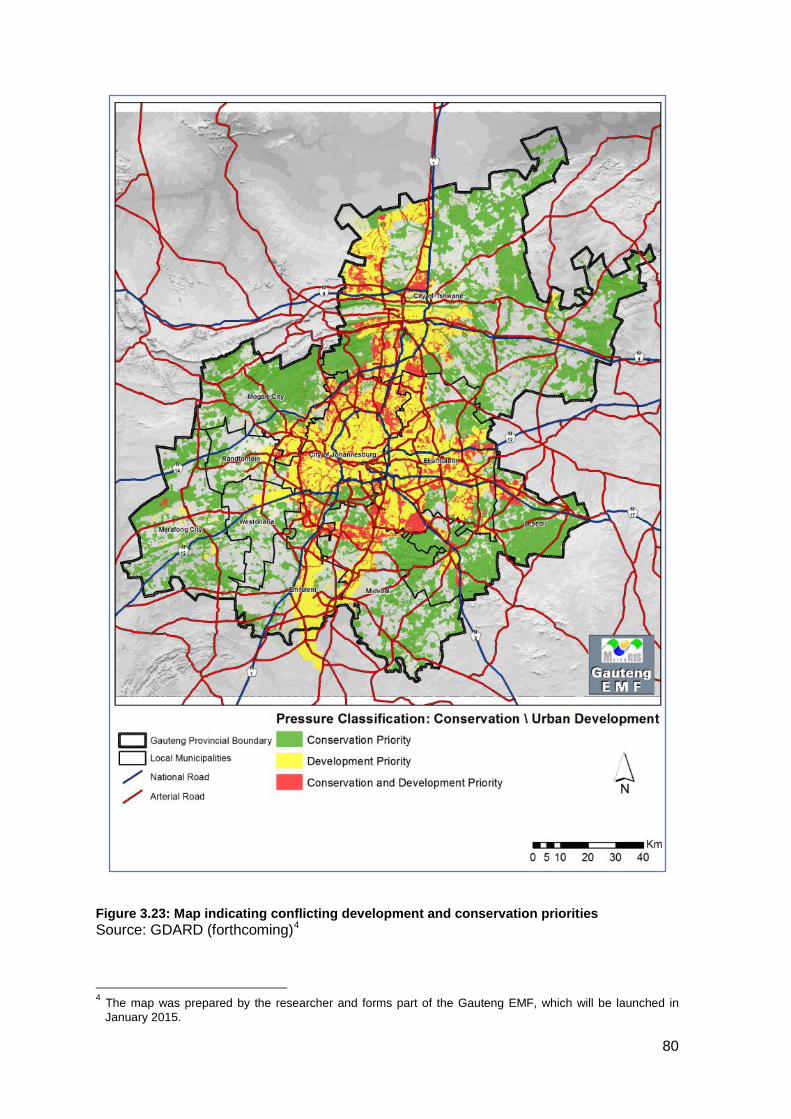
Figure 3.23: Map indicating conflicting development and conservation priorities Source: GDARD (forthcoming)4
4 The map was prepared by the researcher and forms part of the Gauteng EMF, which will be launched in January 2015.
80
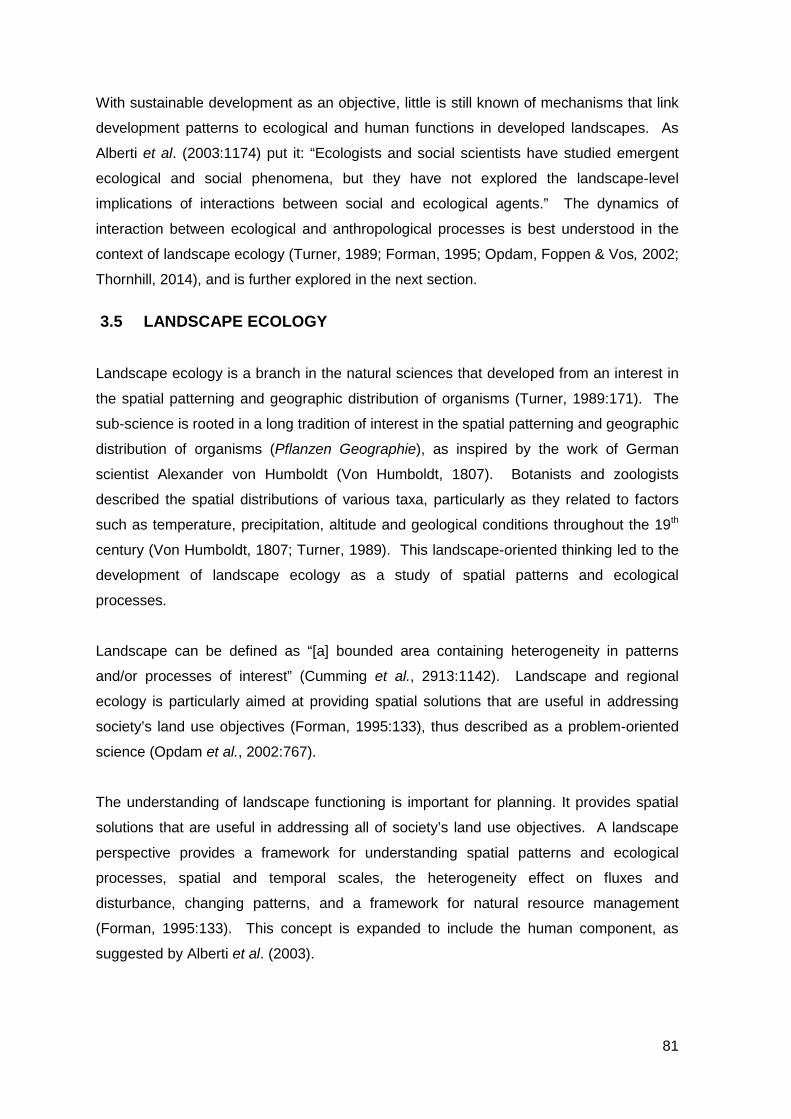
With sustainable development as an objective, little is still known of mechanisms that link
development patterns to ecological and human functions in developed landscapes. As
Alberti et al. (2003:1174) put it: “Ecologists and social scientists have studied emergent
ecological and social phenomena, but they have not explored the landscape-level
implications of interactions between social and ecological agents.” The dynamics of
interaction between ecological and anthropological processes is best understood in the
context of landscape ecology (Turner, 1989; Forman, 1995; Opdam, Foppen & Vos, 2002;
Thornhill, 2014), and is further explored in the next section.
3.5 LANDSCAPE ECOLOGY
Landscape ecology is a branch in the natural sciences that developed from an interest in
the spatial patterning and geographic distribution of organisms (Turner, 1989:171). The
sub-science is rooted in a long tradition of interest in the spatial patterning and geographic
distribution of organisms (Pflanzen Geographie), as inspired by the work of German
scientist Alexander von Humboldt (Von Humboldt, 1807). Botanists and zoologists
described the spatial distributions of various taxa, particularly as they related to factors
such as temperature, precipitation, altitude and geological conditions throughout the 19th
century (Von Humboldt, 1807; Turner, 1989). This landscape-oriented thinking led to the
development of landscape ecology as a study of spatial patterns and ecological
processes.
Landscape can be defined as “[a] bounded area containing heterogeneity in patterns
and/or processes of interest” (Cumming et al., 2913:1142). Landscape and regional
ecology is particularly aimed at providing spatial solutions that are useful in addressing
society’s land use objectives (Forman, 1995:133), thus described as a problem-oriented
science (Opdam et al., 2002:767).
The understanding of landscape functioning is important for planning. It provides spatial
solutions that are useful in addressing all of society’s land use objectives. A landscape
perspective provides a framework for understanding spatial patterns and ecological
processes, spatial and temporal scales, the heterogeneity effect on fluxes and
disturbance, changing patterns, and a framework for natural resource management
(Forman, 1995:133). This concept is expanded to include the human component, as
suggested by Alberti et al. (2003).
81
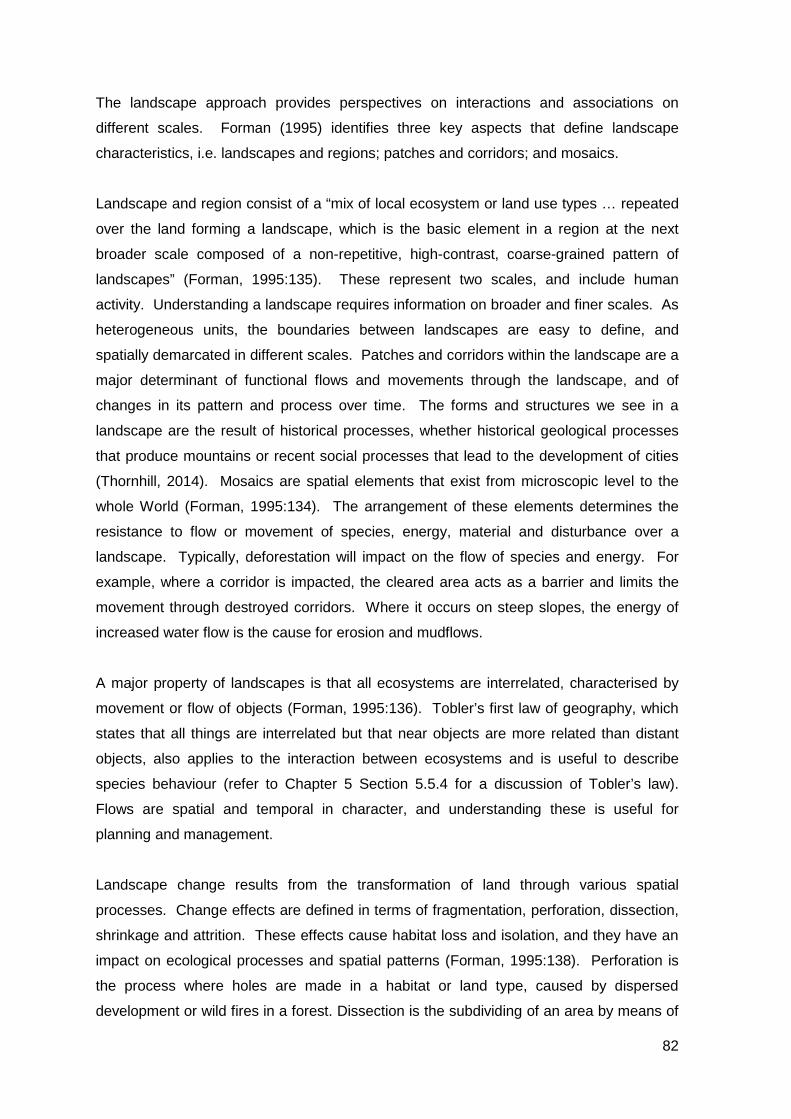
The landscape approach provides perspectives on interactions and associations on
different scales. Forman (1995) identifies three key aspects that define landscape
characteristics, i.e. landscapes and regions; patches and corridors; and mosaics.
Landscape and region consist of a “mix of local ecosystem or land use types … repeated
over the land forming a landscape, which is the basic element in a region at the next
broader scale composed of a non-repetitive, high-contrast, coarse-grained pattern of
landscapes” (Forman, 1995:135). These represent two scales, and include human
activity. Understanding a landscape requires information on broader and finer scales. As
heterogeneous units, the boundaries between landscapes are easy to define, and
spatially demarcated in different scales. Patches and corridors within the landscape are a
major determinant of functional flows and movements through the landscape, and of
changes in its pattern and process over time. The forms and structures we see in a
landscape are the result of historical processes, whether historical geological processes
that produce mountains or recent social processes that lead to the development of cities
(Thornhill, 2014). Mosaics are spatial elements that exist from microscopic level to the
whole World (Forman, 1995:134). The arrangement of these elements determines the
resistance to flow or movement of species, energy, material and disturbance over a
landscape. Typically, deforestation will impact on the flow of species and energy. For
example, where a corridor is impacted, the cleared area acts as a barrier and limits the
movement through destroyed corridors. Where it occurs on steep slopes, the energy of
increased water flow is the cause for erosion and mudflows.
A major property of landscapes is that all ecosystems are interrelated, characterised by
movement or flow of objects (Forman, 1995:136). Tobler’s first law of geography, which
states that all things are interrelated but that near objects are more related than distant
objects, also applies to the interaction between ecosystems and is useful to describe
species behaviour (refer to Chapter 5 Section 5.5.4 for a discussion of Tobler’s law).
Flows are spatial and temporal in character, and understanding these is useful for
planning and management.
Landscape change results from the transformation of land through various spatial
processes. Change effects are defined in terms of fragmentation, perforation, dissection,
shrinkage and attrition. These effects cause habitat loss and isolation, and they have an
impact on ecological processes and spatial patterns (Forman, 1995:138). Perforation is
the process where holes are made in a habitat or land type, caused by dispersed
development or wild fires in a forest. Dissection is the subdividing of an area by means of
82
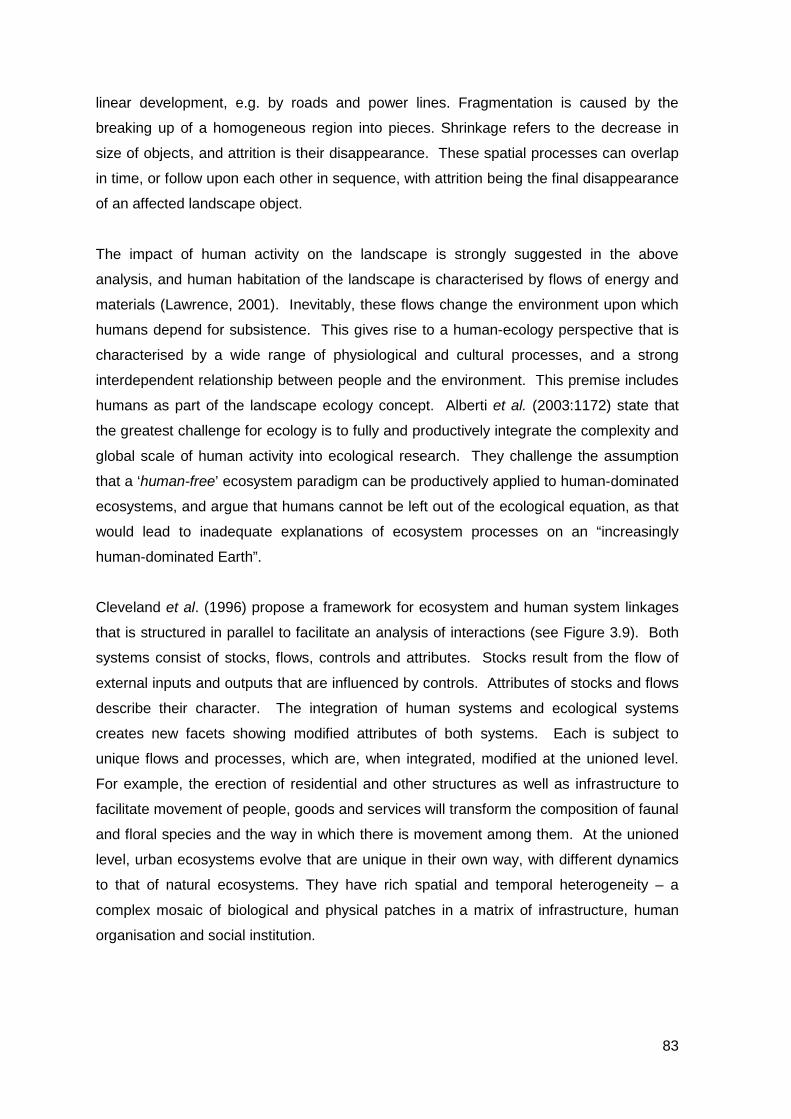
linear development, e.g. by roads and power lines. Fragmentation is caused by the
breaking up of a homogeneous region into pieces. Shrinkage refers to the decrease in
size of objects, and attrition is their disappearance. These spatial processes can overlap
in time, or follow upon each other in sequence, with attrition being the final disappearance
of an affected landscape object.
The impact of human activity on the landscape is strongly suggested in the above
analysis, and human habitation of the landscape is characterised by flows of energy and
materials (Lawrence, 2001). Inevitably, these flows change the environment upon which
humans depend for subsistence. This gives rise to a human-ecology perspective that is
characterised by a wide range of physiological and cultural processes, and a strong
interdependent relationship between people and the environment. This premise includes
humans as part of the landscape ecology concept. Alberti et al. (2003:1172) state that
the greatest challenge for ecology is to fully and productively integrate the complexity and
global scale of human activity into ecological research. They challenge the assumption
that a ‘human-free’ ecosystem paradigm can be productively applied to human-dominated
ecosystems, and argue that humans cannot be left out of the ecological equation, as that
would lead to inadequate explanations of ecosystem processes on an “increasingly
human-dominated Earth”.
Cleveland et al. (1996) propose a framework for ecosystem and human system linkages
that is structured in parallel to facilitate an analysis of interactions (see Figure 3.9). Both
systems consist of stocks, flows, controls and attributes. Stocks result from the flow of
external inputs and outputs that are influenced by controls. Attributes of stocks and flows
describe their character. The integration of human systems and ecological systems
creates new facets showing modified attributes of both systems. Each is subject to
unique flows and processes, which are, when integrated, modified at the unioned level.
For example, the erection of residential and other structures as well as infrastructure to
facilitate movement of people, goods and services will transform the composition of faunal
and floral species and the way in which there is movement among them. At the unioned
level, urban ecosystems evolve that are unique in their own way, with different dynamics
to that of natural ecosystems. They have rich spatial and temporal heterogeneity – a
complex mosaic of biological and physical patches in a matrix of infrastructure, human
organisation and social institution.
83
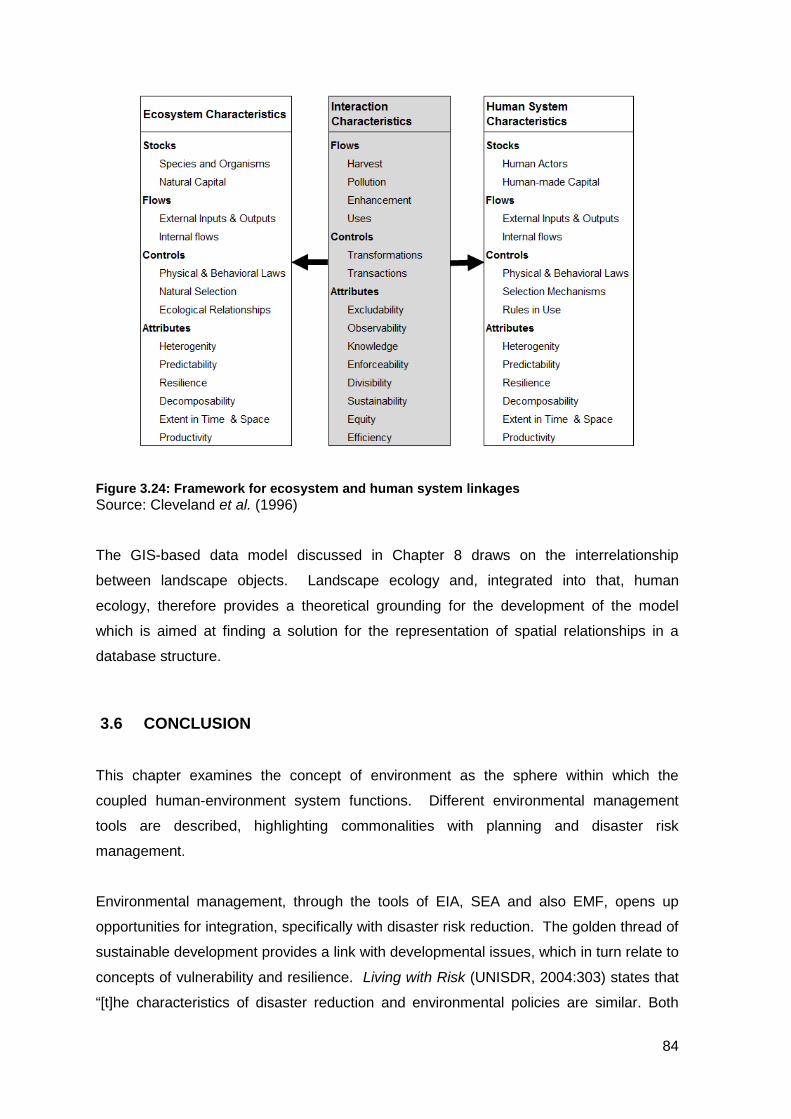
Figure 3.24: Framework for ecosystem and human system linkages Source: Cleveland et al. (1996)
The GIS-based data model discussed in Chapter 8 draws on the interrelationship
between landscape objects. Landscape ecology and, integrated into that, human
ecology, therefore provides a theoretical grounding for the development of the model
which is aimed at finding a solution for the representation of spatial relationships in a
database structure.
3.6 CONCLUSION
This chapter examines the concept of environment as the sphere within which the
coupled human-environment system functions. Different environmental management
tools are described, highlighting commonalities with planning and disaster risk
management.
Environmental management, through the tools of EIA, SEA and also EMF, opens up
opportunities for integration, specifically with disaster risk reduction. The golden thread of
sustainable development provides a link with developmental issues, which in turn relate to
concepts of vulnerability and resilience. Living with Risk (UNISDR, 2004:303) states that
“[t]he characteristics of disaster reduction and environmental policies are similar. Both
84
must meet local needs and sustainable development requirements and produce multiple
benefits. Both rely on extensive participation of the public, relevant sectors and
stakeholders.” These commonalities are highlighted in terms of the following eight
features of integrated environmental and disaster reduction policies:
i. Assessment of environmental causes of hazards’ occurrence and vulnerability
ii. Assessment of environmental actions that can reduce vulnerability
iii. Assessment of the environmental consequences of disaster reduction actions
iv. Consideration of environmental services in decision-making processes
v. Interdisciplinary approaches that will ensure the use of natural and social sciences
in disaster reduction planning and decision making
vi. Partnerships and regional approaches to land use and nature conservation
vii. Reasonable alternatives to conflicts concerning alternative uses of resources
viii. Advice and information to involve actors in enhancing the quality of the
environment
With regard to point (v) above, Chapter 8 will demonstrate how GIS science is used to
develop a data model that connects spatial objects of the coupled human-environment on
the basis of sustainable relationships. This model can be used to support the decision-
making process mentioned in point (iv) with regard to land use planning, with the goal of
reducing the vulnerability of communities, as well as enhancing the quality of the
environment, as mentioned under point (viii).
85
CHAPTER 4: THEORY OF DISASTER RISK MANAGEMENT
4.1 INTRODUCTION All throughout time, mankind has been challenged to deal with disasters (Quarantelli,
2000; Wilson & Oyola-Yemaiel, 2001). Examples of extreme disaster events in history
are numerous and include events such as the destruction of Pompeii by volcanic activity
from Mount Vesuvius in AD79, the great fire of London in 1666, and the eruption of
Krakatoa that caused great tsunamis claiming some 36 000 lives in 1883 (Wilson &
Oyola-Yemaiel, 2001). Events in modern times include devastating tropical cyclones
such as the Bhola cyclone that struck East Pakistan (now Bangladesh) and India's West
Bengal in November 1970 (Burton et al., 1993); the South Asian tsunamis of December
2004 (Birkmann, 2005); Hurricane Katrina that struck the Gulf Coast and the city of New
Orleans in August 2005 (Alexander, 2001; Lewis & Kelman, 2012); and the devastating
earthquake in Haiti in 2010 (Alexander & Davis, 2012).
Adding to the above are disasters that result from technological development. Examples
include the September 11, 2001 attacks on the World Trade Center in New York
(McEntire, 2004:1) and the Chernobyl nuclear disaster (Boin, 2005) that caused radiation
fallout that affected many countries in Europe, including pollution of the Rhine River.
Extreme events occur as part of the natural cycles of Earth, or as the result of
technological failure. Some of these events result in physical and social impacts at a
scale and intensity that overwhelm response capacity, and are thus referred to as
disasters (Copolla, 2007:25). As these events continue to occur, the above list of
disasters will expand accordingly.
According to observations, climatic and environmental changes will increase the intensity
and frequency of events such as storms and cyclones, and human and material losses
resulting from disasters are increasing (Bankoff, 2004:26; Wisner et al., 2004:83).
Furthermore, the increase in the world’s population is likely to further increase the
frequency of major events as described above (Trim, 2004:218). The reduction of
disaster risk calls for disaster management and planning to be approached holistically and
to address the ways in which changes in land use, settlement policies, population
distribution and the resultant degrading of habitats increase the risk of disasters (Van
Niekerk, 2010:65). This premise is a key focus of this study. Chapter 4 builds further on
86
the exposition of development planning in Chapter 2 and focuses on the concept of
disaster risk reduction within the wider context of disaster risk management.
Disaster risk reduction is defined as follows:
“The concept and practice of reducing disaster risks through systematic efforts to
analyse and manage the causal factors of disasters, including through reduced
exposure to hazards, lessened vulnerability of people and property, wise
management of land and the environment, and improved preparedness for adverse
events” (UN-ISDR, 2009).
The above definition focuses disaster risk reduction (DRR) efforts on two terrains: socio-
related management of causal factors, and technical design to mitigate impact. The
Hyogo Framework for Action promotes a development agenda aimed at the management
of risks and knowledge, and the promotion of preparedness and education (UN-ISDR,
2005). Technical design as a DRR function can be traced back in history, studying cases
such as ancient Chinese measures to protect cities from flooding (Alexander & Davis,
2012) and the design of earthquake resistant buildings in ancient Greece and Armenia
(Quarantelli, 2009).
The development of disaster risk reduction as a concept, therefore, is rooted in a long
history of mankind reacting to the challenges of natural and social forces. The meaning of
disaster risk reduction is further explored in this chapter in terms of its history, looking at
the development of concepts such as ‘disaster’ and ‘risk’.
Chapter 4 begins with an overview of the history of disaster risk management, followed by
a description of the theoretical grounding of disaster studies. A specific focus on hazard
and vulnerability highlights the theme of this research. To link this chapter with Chapter 2,
the multi-disciplinary nature of disaster studies is highlighted by specific reference to
disaster risk management in a developmental and social context.
4.2 HISTORY OF DISASTER RISK MANAGEMENT
Before the institutionalisation of disaster management as a profession and the
establishment of a field of research, disasters have mostly been dealt with on an ad-hoc
basis (Wilson, 2001:39; Dilling, 2009:18). The delineation of a separate body of
knowledge that is commonly referred to as Disaster Management or Emergency
Management is a recent undertaking. The literature on the history of Disaster
87
Management reflects a rather short time period in which the discipline has been
institutionalised and professionalised, and the concepts of Disaster Management have
been established (Quarantelli & Dynes, 1977:23). Whereas in the past Disaster
Management was associated with emergency operations such as firefighting, it now
functions as a discipline with its own research agenda and as a profession with
coordinated programmes, employing a variety of resources, techniques and skills (Wilson,
2001:46). In support of these fields stands a well-established contingent of academics
and professionals who have contributed to the development of Disaster Management
theories and practice (McEntire, 2004:1).
The development history of this field shows a singular path of growth in incremental
stages where large-scale events or shocks such as the First and Second World War
(Wilson, 2001:50; McEntire, 2003:120; Van Niekerk, 2006:99; Alexander, 2007:50) and
the September 11, 2001 attacks on the World Trade Center (McEntire, 2004:1) have
resulted in a significant reformulation of the purpose and the role of Emergency / Disaster
Management. The impetus of large- scale devastating disasters is also evident in this
development, particularly in as far as it has drawn attention to issues of vulnerability, for
example the events that unfolded in New Orleans after Hurricane Katrina.
The air raids and bombings of civilian targets in Europe during the Second World War
heralded a new era in warfare, bringing war from the battlefield closer to home. This
prompted the establishment of civil protection measurements and institutions. The
bombings of Hiroshima and Nagasaki with nuclear weapons further opened up a new kind
of threat that continued throughout the Cold War. When a series of research projects on
human behaviour during natural disasters was undertaken in the USA in the 1950s, those
studies were more inclined towards the civilian population’s reaction to extreme stresses
in war-time than towards the disasters themselves (Wilson, 2001).
It was not until the late 1960s and early 1970s that the focus returned to natural disasters.
Inadequacies of protection programmes against disasters and nuclear threats prompted
social scientists to give more attention to the effects of devastating disasters. During this
time the nomenclature of disaster management began to appear as a field of study
(Wilson, 2001:63). A body of knowledge began to appear and a new field for skilled
practitioners in disaster management emerged. Since inadequacies were recognised in
responding to disasters, new efforts were made to enact legislation and employ new
mechanisms. An increasing number of planning experts became involved in a
proliferation of programmes. With each disaster new lessons were learnt, leading to
88
incremental advances in the improvement of disaster management. Wilson and Oyola-
Yemaiel (2001:118) offer the following definition of Disaster Management:
“Emergency management is the discipline and profession of applying science,
technology, planning, and management to deal with extreme events that can injure
or kill large numbers of people, do extensive damage to property, and disrupt
community life.”
Disaster research historically focused on response and recovery, but the focus has
gradually shifted to societal aspects of vulnerability, mitigation and preparedness. The
United States National Research Council (NRC) views these five topics as central to
disaster research, but combined in an integrated framework, with vulnerability and
mitigation related to hazard, and response and recovery related to disaster as
phenomena. The above concepts of disaster are further explored within a framework of
theoretical grounding.
4.3 THEORETICAL GROUNDING OF DISASTER RISK MANAGEMENT
The fundamental motive for our concern with disasters is that they cause human suffering
and social disruption (Bates, Dynes & Quarantelli, 1991:288). Understanding the factors
that underlie disasters is central to the efforts to reduce disaster risk. However, the
research agenda in this field is characterised by different viewpoints on the disaster
construct. Cutter (2001:16) asserts that terms such as disaster, hazard and risk are used
interchangeably to indicate harm. Looking beyond the lexicon of disaster at a
phenomenon described as “losses stemming from unexpected events” (Mileti, 1999b), or
as “a moment of materialization” (Birkmann et al., 2014:4), concepts of hazard,
vulnerability and resilience emerge as key determinants of disaster risk (Alexander, 2012;
Lewis & Kelman, 2012; Birkmann et al., 2014). Knowledge of these concepts would be
essential to explain and understand disaster, and to apply it to successful disaster risk
reduction (Bates et al., 1991:288).
There is currently not an overarching theory that is adhered to in disaster management
(McEntire, 2004; Van der Waldt, 2013). Different conceptualisations of ‘disaster’ indicate
a historical development from an association with bad luck (Khan et al., 2008:43) to Acts
of God (Quarantelli, 1987:9) and the development of disaster sociology as a “sub-science” of sociology (Dombrowsky, 2005:80). The conceptualisations of disaster are influenced by
the individual ontologies and epistemologies that academics contribute to the academic
literature (Dilling, 2009:8). Dombrowsky (1995:242) quotes Quarantelli (1981) who states
89
that “[w]e all have a habitual way of looking at disaster phenomena”. This statement
underpins the different approaches to disaster and the diversity of meanings – as
Dombrowsky puts it: “Those who declare, defines what they intend to do with … disaster.”
Different conceptualisations of disaster are also highlighted by Hewitt (2013), ranging
from an environmental perspective with the focus on environmental degradation, to a
developmental perspective with the focus on urbanisation and related concepts of
poverty, disease and malnutrition, and the perspective of conflict and insecurity with
related aspects of refugees. These are all too wide to be discussed in depth, hence
disaster is further defined in the context of three main paradigms that have developed in
history.
4.3.1 Defining disaster
A central issue related to theoretical development of disaster pertains to what the field of
study defines and understands as disaster (Neal, 1997:239). In their attempt to define
disasters, Jennifer Wilson and Arthur Oyola-Yemaiel ask questions such as “Is disaster
the disruption of natural ecosystems? Is it the destruction of property? Is it the loss of
human life? Is it the loss of vital human resources? Or is it a combination of these
things?” (Wilson & Oyola-Yemaiel, 2001:40). Whereas it is argued that if people and
people’s assets are not affected, it is not a disaster (Alexander, 2005:27), the inclusion of
the natural environment as an affected party in the definition of disaster (South Africa,
2003:6) may contradict this. When contemplating the meaning of disaster, the student is
indeed entwined in an epistemological conundrum (McEntire & Marshall, 2003:119).
The causes of disaster do not simply lie in the processes by which energy of natural
phenomena such as hurricanes, landslides and earthquakes is released in the
atmosphere, on the earth's surface or below. The fact that people reside and establish
their social environments within natural environments that have been formed by natural
processes (Wilson, 2001:39), and that these processes may cause harm, highlights the
premise that disaster is primarily a social phenomenon and thus identifiable in social
terms (Quarantelli & Dynes, 1977:24).
Since the mid-1970s, scientists from various disciplines such as geography, sociology,
political science, psychology, economics, decision science, regional science and
planning, public health, and anthropology have continuously contributed to the
development of knowledge about societal response to hazards and disasters (NRC,
2006:1). The forming of a unified theory was, however, hampered by a rapid and
90
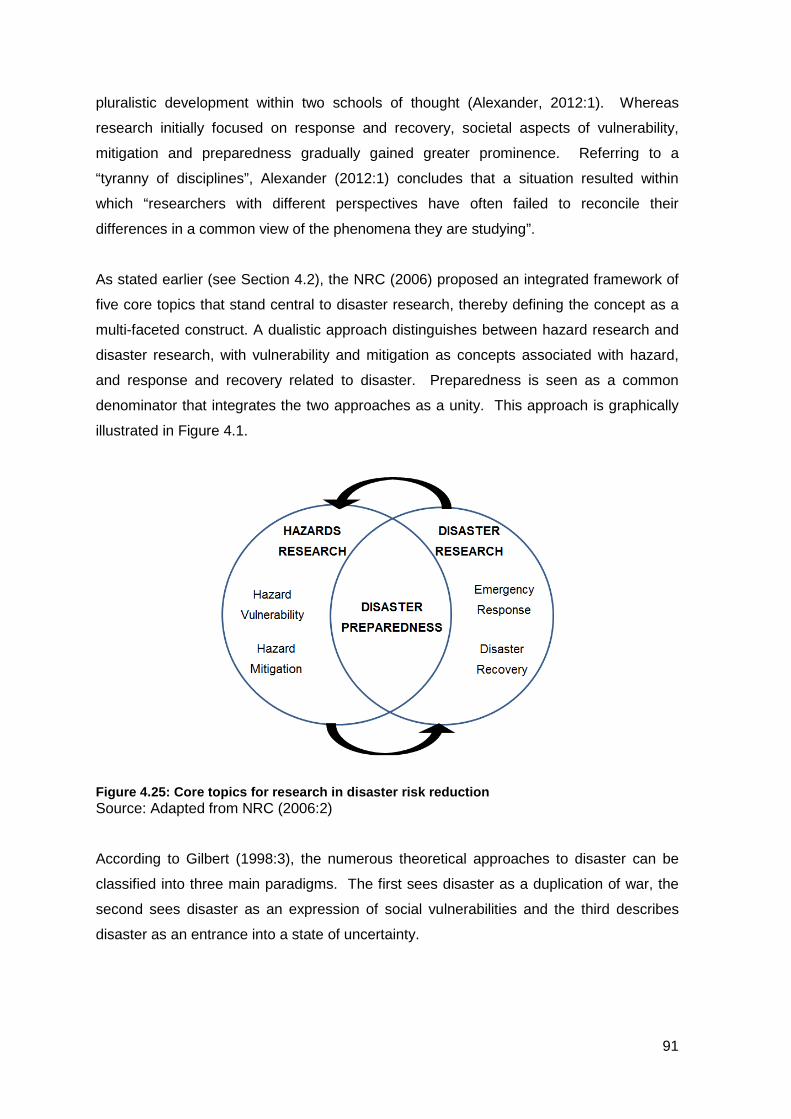
pluralistic development within two schools of thought (Alexander, 2012:1). Whereas
research initially focused on response and recovery, societal aspects of vulnerability,
mitigation and preparedness gradually gained greater prominence. Referring to a
“tyranny of disciplines”, Alexander (2012:1) concludes that a situation resulted within
which “researchers with different perspectives have often failed to reconcile their
differences in a common view of the phenomena they are studying”.
As stated earlier (see Section 4.2), the NRC (2006) proposed an integrated framework of
five core topics that stand central to disaster research, thereby defining the concept as a
multi-faceted construct. A dualistic approach distinguishes between hazard research and
disaster research, with vulnerability and mitigation as concepts associated with hazard,
and response and recovery related to disaster. Preparedness is seen as a common
denominator that integrates the two approaches as a unity. This approach is graphically
illustrated in Figure 4.1.
Figure 4.25: Core topics for research in disaster risk reduction Source: Adapted from NRC (2006:2)
According to Gilbert (1998:3), the numerous theoretical approaches to disaster can be
classified into three main paradigms. The first sees disaster as a duplication of war, the
second sees disaster as an expression of social vulnerabilities and the third describes
disaster as an entrance into a state of uncertainty.
91
4.3.1.1 Paradigm 1: The Patterns of War Approach According to Wilson (2001:40) the first serious effort to conceptualise the term ‘disaster’
comes from Fritz (1961:655) whose definition has been the standard for many years in
the field of disaster research (quoted in Wilson, 2001:40 and Dilling, 2009:17):
“A disaster is an event, concentrated in time and space, in which a society, or a
relative self-sufficient subdivision of a society, undergoes severe danger and
incurs such losses to its members and physical appurtenances that the social
structure is disrupted and the fulfillment of all or some of the essential functions of
the society is prevented.”
Fritz’s definition was grounded in the bombing events of World War II, the event in history
that marks the establishment of civil defence organisations, which is widely recognised as
the roots of Disaster Management (McEntire, 2003:120; Van Niekerk, 2006:99;
Alexander, 2007:50; Grist 2007:3). The idea of harmful attacks brought against people in
acts of war is described by Gilbert (1998:3) as particularly relevant to the field of disaster
studies. The resemblance between disaster and war is the cause of the emergency being
sought outwardly, leaving the community harmless to the mercy of fate. The enemy,
loaded with arms, becomes the agent, resembling the hazard as an external factor. In
this view, people organise themselves to react in terms of defence (planning) and
response (emergency aid).
4.3.1.2 Paradigm 2: Disaster as Social Vulnerability The second paradigm follows a critical review of the patterns of war, which were seen as
related to external destructive agents. This paradigm considers the causes of disaster on
structural and contextual grounds. Disaster is therefore closely associated with social
vulnerability (Gilbert, 1995:234).
This paradigm is developed on the tendency that disasters are considered crises that
develop in a community as a result of an event. It takes away the focus from physical
reaction following an event to the underlying factors within the community that caused its
susceptibility to physical impact (Gilbert, 1995:234).
4.3.1.3 Paradigm 3: Disaster as Uncertainty The third paradigm breaks away from tendencies to consider disasters as crises that
develop in a community as a result of an event. It represents a turning point that defines
disaster as chaos built on uncertainty, following upon a break in communication.
92
Uncertainty is caused by the absence of communication, which is a sudden change in the
situation where information was flowing freely. According to Gilbert (1988:8), uncertainty
is at the core of disaster theory, highlighting three aspects: (1) uncertainty arises when a
community is threatened by danger; (2) uncertainty results from complex modern
societies; and (3) uncertainty results from the loss of capacity in modern societies to
identify and define a situation that they see as serious. Weichselgartner (2001:86)
confirms the role of uncertainty, and states: “The only certain thing is uncertainty”.
4.3.2 Research frameworks – Approaches to disaster study
The field of disaster research has grown in close association with the applied natural and
social sciences, and is characterised by fragmentation through specialisation that
threatens the development of a separate identity (Alexander, 1993:12). Two distinct
schools of thought have emerged since the beginning of the 1900s – the Human Ecology
School, and the Disaster Research School (Mileti, 1999).
4.3.2.1 Human Ecology School
The association of disaster research with the natural sciences gave rise to the birth of
human ecology as a concept that marks out a distinctive field for geography (Barrows,
1923:3) and sociology (Hawley, 1969:68). The ecologist viewpoint is developed as a
distinctive approach in the study of society (Duncan & Schnore, 1969:70). It defines
social structure in terms of behaviour relations and seeks to explain it by referring to
phenomena that are imposed on the social structure by non-human environments
(Hawley, 1969).
With its roots in geography5 (Mileti, 1999:39), in studies of contemporary urban life
(Duncan & Schnore, 1969:71) and in ecological conceivements of life as a subject for
investigation (Hawley, 1969:64), human ecology has emerged as an approach of studying
the form and the development of the community of human populations (Hawley, 1969:64).
Tenets of human ecology have subsequently been used to study disaster, as they
represent an environmental imperative to society (Alexander, 1993:12). From this
5 There seems to be some controversy as to the foundation of human ecology in geography vs. sociology. Hawley (1969:68) maintains that human ecology emerged as a sociological concern, since it deals with the development and organisation of the community. On the other hand, Barrows (1923:3) who describes geography as the mother of sciences, states that geography is the science of human ecology, as it focuses on the relationships between natural environments and the activities of man.
93
perspective, human ecology denotes “the prevailing techniques of adjustment by which a
population maintains itself in its habitat” (Hawley, 1969:66).
The ecological perspective of the environment originated in the natural sciences. The
term 'ecology’ was first used in 1866 by Ernst Haeckel (Lawrence, 2001:676; Williams,
Roberts & McIntosh, 2007:2). The term is derived from the ancient Greek oikos and logos
which means the science of home or habitat. As the founder of a new science
“oekologie”, Haeckel was influenced by the work of Charles Darwin and Alexander von
Humboldt (Egerton, 2013:222). In today’s terms, ecology refers to the study of the
interrelationships between organisms and their surroundings (Bodini & Klotz, 2002).
The human ecology perspective was philosophically explored by John Dewey who stated
that people live in a natural world that is intrinsically hazardous – hence resulting in
insecurity (Mileti, 1999:38). According to Browne (2007), Dewey considered all human
endeavours to be one with the natural world. His conception of environment includes
both the natural and the anthropogenic. This thought provides a key to help us
understand the role of human cultures in the environment, and lays the foundation for the
emergence of human ecology, which developed as a sub-discipline in sociology and
geography (Mileti, 1999:38). Dewey’s contribution to the development of thoughts on the
relationship between disasters and social forces is supported by a generation of social
scientists who have been shaped by his influence – in particular, the geographer Gilbert
F. White who is recognised as the father of natural hazards research and management
(Peek & Mileti, 2002:512).
Following White, the concept of human ecology was further explored in sociology by
MacIver (1931) who focused on adaptation and described it as a physical, biological and
social adjustment of society to the natural environment (cited in Mileti, 1999:39-40).
Although his ideas were subsequently expanded by other sociologists, the human ecology
school became nearly dormant by the 1960s.
4.3.2.2 Disaster Research School
Grounded in the work of the NRC during the 1950s, the Disaster Research School
developed as an alternative in sociology independently from the human ecology heritage
(Mileti, 1999:20) by focusing on the social impact of disaster. Thoughts of this school are
rooted in the anxiety over the Cold War and directed by aspects of calamity and “social
disorganization” (Mileti, 1999:40). Since it would be heavily funded by government,
94
disaster research was initiated “to be current with the post World War II phenomena of
social science research” (Quarantelli, 1988:27) and to improve disaster preparedness.
Research investigates scenarios of nuclear war from a civil defence perspective and
focuses on people’s behaviour during a disaster by analysing their response to
emergencies, disasters and catastrophes (Metzger & Robert, 2014:29).
Being modelled on the Cold War scenario and focused on aspects of early warning,
recovery and reconstruction (Mileti, 1999:41), this way of thinking lacks consideration of
essential social problems such as poverty and disparities, which limits the effectiveness of
disaster risk reduction (Metzger & Robert, 2014:29). Metzger and Robert highlight the
Hurricane Katrina disaster as an example of where emergency management was
perfectly planned from a technical point of view, but failed to anticipate the social impact
of the disaster.
4.3.3 The Disaster Phase Model
Codification and taxonomies are part of the scientific process. The use of phases, and
organising these in sequence of ‘life cycles’, is common in social science and research
(Neal, 1997:240). The temporal character of disaster, which in many instances occurs as
an unexpected event, and the human reaction to respond by means of aid, relief, re-
development and planning to reduce the magnitude of impact of the next event, represent
a series of subsequent activities that can be recorded in terms of a time scale. It
therefore becomes understandable to categorise the type of activities that relate to a
specific situation in unique phases. It further provides coherence to an analysis that is
otherwise not possible (Drabek, 2006:224).
The disaster phase model is a popular framework used in literature to describe concepts
of disaster (Kendra & Wachtendorf, 2006). It is, however, complex to understand and
difficult to apply in practice (Coetzee & Van Niekerk, 2012). The origins of the model are
traced back to the work of Samuel Henry Prince who was the first to categorise various
responses to disaster. Based on the historic event of a massive explosion following the
collision of two ships in Halifax harbour, Prince (1920) identifies three stages of societal
response. The first stage is referred to as an emergency period, characterised by general
panic and confusion. The second stage is a transition period during which emergency
relief is provided. The third phase is a rehabilitation period. However, Prince’s thesis is
only concerned with the post-disaster situation, as he limits his investigation to “those
95
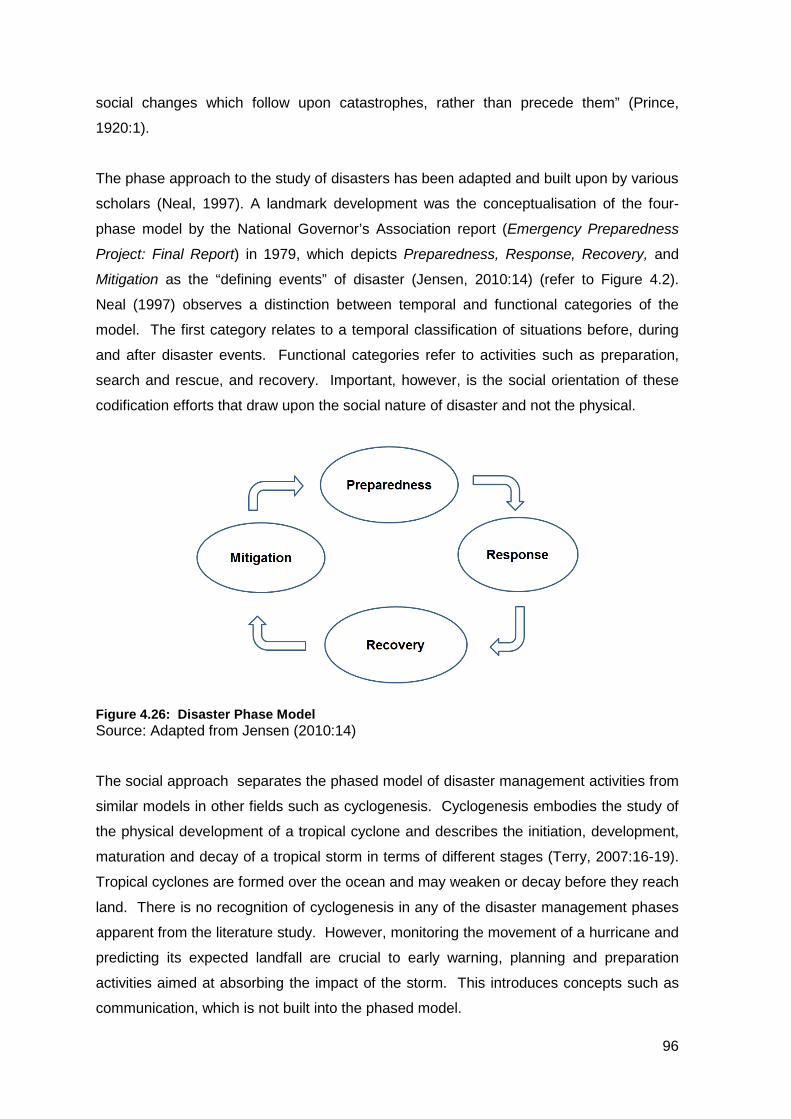
social changes which follow upon catastrophes, rather than precede them” (Prince,
1920:1).
The phase approach to the study of disasters has been adapted and built upon by various
scholars (Neal, 1997). A landmark development was the conceptualisation of the four-
phase model by the National Governor’s Association report (Emergency Preparedness
Project: Final Report) in 1979, which depicts Preparedness, Response, Recovery, and
Mitigation as the “defining events” of disaster (Jensen, 2010:14) (refer to Figure 4.2).
Neal (1997) observes a distinction between temporal and functional categories of the
model. The first category relates to a temporal classification of situations before, during
and after disaster events. Functional categories refer to activities such as preparation,
search and rescue, and recovery. Important, however, is the social orientation of these
codification efforts that draw upon the social nature of disaster and not the physical.
Figure 4.26: Disaster Phase Model Source: Adapted from Jensen (2010:14)
The social approach separates the phased model of disaster management activities from
similar models in other fields such as cyclogenesis. Cyclogenesis embodies the study of
the physical development of a tropical cyclone and describes the initiation, development,
maturation and decay of a tropical storm in terms of different stages (Terry, 2007:16-19).
Tropical cyclones are formed over the ocean and may weaken or decay before they reach
land. There is no recognition of cyclogenesis in any of the disaster management phases
apparent from the literature study. However, monitoring the movement of a hurricane and
predicting its expected landfall are crucial to early warning, planning and preparation
activities aimed at absorbing the impact of the storm. This introduces concepts such as
communication, which is not built into the phased model.
96
4.3.4 Critique of the Disaster Phase Model Whereas the four-phase model has been adopted widely as a standard disaster
management framework (Jensen, 2010:13; De Smet et al., 2011:2) and is considered a
cornerstone in disaster management practice throughout the United States by the
National Governor’s Association (Carr, 1997:245; Jensen, 2010:13; Drabek & Evans,
2004:3), researchers and practitioners experience problems with the use of disaster
phases, especially those in other fields such as geography, civil defence and
development planning (Carr, 1997:246; Coetzee & Van Niekerk, 2012:7). Problems are
mostly experienced when the concept is applied in practice, since the phases are not
discrete events. Phases overlap with one another and activities within the one may have
an impact on those of a subsequent phase (Neal, 1997:247). Phases are also
characterised by sub-phases that are not strictly discerned either (De Smet et al., 2011:5).
Weichselgartner and Obersteiner (2002:74) state that the disaster cycle model creates
false assumptions about the appropriate response to disaster. The division of phases
does not match the perceptions of individuals in communities who tend to regard their
own responses as part of a personal coping strategy. According to McEntire (2004:4), the
organising of disaster management functions into phases is useful, but overly simplified.
It is also important to realise that “a single perspective can limit understanding and
explanation”. This is illustrated by the inability of the model to capture “the wider political,
economic and cultural explanations of disasters”. Bankoff (2004:28) describes the
disaster management cycle as a schematic of an open-ended process that “barely
distinguishes between a pre-disaster risk-reducing phase and a post-disaster recovery
one”.
Rather than being seen as individual phases, the conceptions of the Disaster Phase
Model are captured as a collection of ideas that become managerial functions and are
commonly referred to as “Comprehensive Emergency Management” (Drabek & Evans,
2004:3). Haddow et al. (2011) describe these as “disciplines of disaster management”.
This framework allows for disaster management activities to be undertaken across the
boundaries of phases, and in places simultaneously (Bankoff, 2004:28; Gurtner et al.,
2011:13).
According to Gurtner et al. (2011:15), reality depicts a pre-disaster and post-disaster
situation, with activities that are associated with different modes of action, as illustrated by
Figure 4.3. This can be interpreted as a continuum of periods within which primary
97
activities are focused on achieving specific goals, being it the preparation of contingency
plans, the education of communities or response to a disaster event. This continuum
incorporates phases as proposed by the Disaster Phase Model, but with the distinct
characteristic that the one period may flow into the next. This may happen abruptly (as in
the case of initiating response) or gradually, as in the event of the withdrawal of relief
agencies. James Lewis not only expands the concept of a continuum to include
development, but also recognises the significance of development in the sequence of
disaster response, specifically with regard to the negative impact that disasters have on
development (Lewis, 1999:134). This idea is further explored in Section 4.5.1, where the
interrelationship between development and disaster risk management is examined.
The pre-crisis period is associated with normal day-to-day social and economic activities.
Disaster risk management programmes are focused on the collection and dissemination
of information and the assessment of hazards and risks. During this period individuals
and organisations can prepare for any event by building management and emergency
response capability to facilitate an effective response when it is needed (Mileti, 1999:22).
It includes programmes and services that enable individuals and organisations to make
physical preparations with the aim of reducing loss of life, injury and destruction of
property when a disaster event occurs (Borgia et al., 2008:5).
Early warning systems allow for to the detection of potential hazards (e.g. the detection of
a tropical cyclone from satellite images). During this period, information with regard to the
magnitude of the approaching event is communicated by issuing alerts and public
warnings. Contingency plans are put into place and, if needed, people are evacuated
from high-risk areas.
Following the onset of a disaster event, immediate response action is undertaken by
mandated authorities and organisations in order to preserve lives, limit damage and end
the emergency. This includes the provision of short-term assistance in the form of food,
clothing, blankets, and temporary shelter, and the search and rescue of the wounded and
dead. Recovery and relief programmes that provide longer-term assistance for people
who have suffered injuries or incurred losses are also introduced. Amongst it all, an initial
rapid impact assessment is undertaken and information is exchanged as an ongoing
activity (Borgia et al., 2008:5).
98
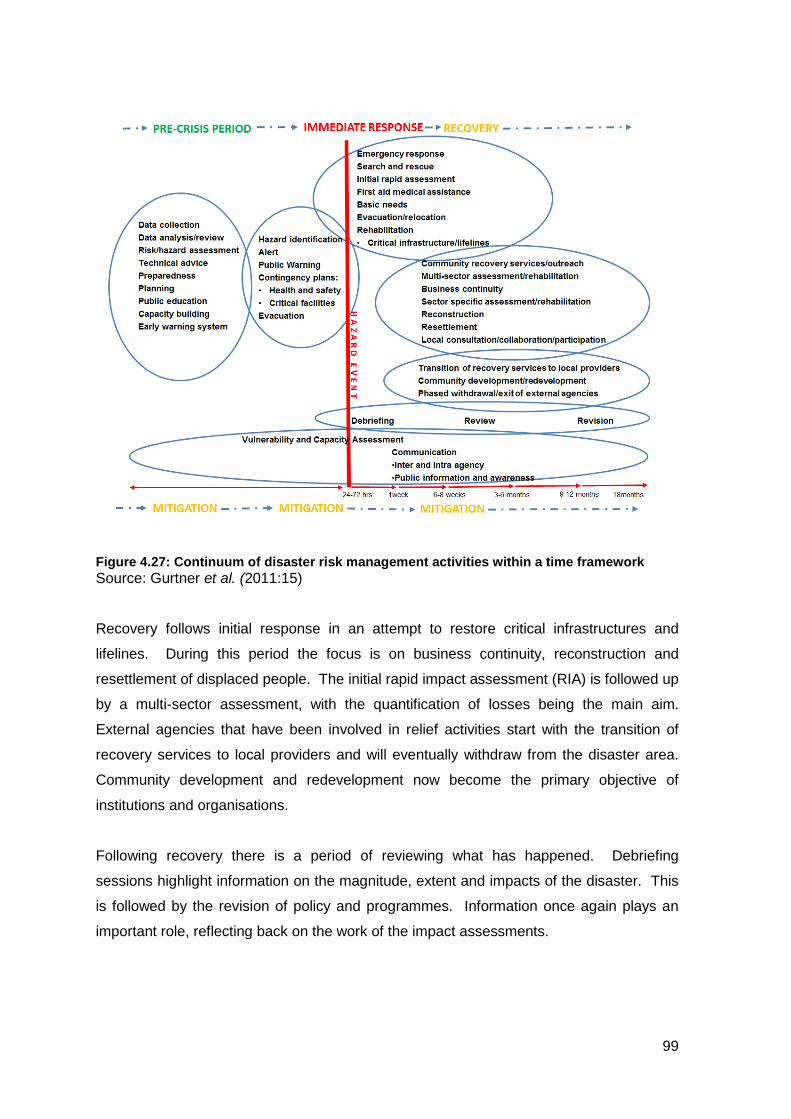
Figure 4.27: Continuum of disaster risk management activities within a time framework Source: Gurtner et al. (2011:15)
Recovery follows initial response in an attempt to restore critical infrastructures and
lifelines. During this period the focus is on business continuity, reconstruction and
resettlement of displaced people. The initial rapid impact assessment (RIA) is followed up
by a multi-sector assessment, with the quantification of losses being the main aim.
External agencies that have been involved in relief activities start with the transition of
recovery services to local providers and will eventually withdraw from the disaster area.
Community development and redevelopment now become the primary objective of
institutions and organisations.
Following recovery there is a period of reviewing what has happened. Debriefing
sessions highlight information on the magnitude, extent and impacts of the disaster. This
is followed by the revision of policy and programmes. Information once again plays an
important role, reflecting back on the work of the impact assessments.
99

The task of vulnerability and capacity assessment spans over all the phases or periods of
activity. Not only is it functional in disaster risk assessment during pre-disaster periods, it
also focuses relief efforts during response operations.
The theoretical context of disaster risk management has mostly been described in terms
of strict phases and conceptualisations of hazards and vulnerability. Traditionally, impact
assessments have been associated with response and recovery, with little to no guidance
on and integration with risk reduction activities (Treadgold, 2006). By shifting the focus to
a continuum of disaster risk management activity, a holistic approach can be embraced,
allowing for expanding the knowledge base of disaster risk management, promoting inter-
and intra-agency communication, improving public awareness, and enhancing response
planning and the level of overall preparedness within communities.
4.3.5 Propositions and principles of the Disaster Phase Model
Propositions are components of theory that are already used explicitly and implicitly in
research, teaching and practice (Jensen, 2010:15). Several propositions of the Disaster
Phase Model have been tested by empirical research. Jensen (2010:14) lists these as
follows:
• “There are periods before, during and after a disaster when human beings can
engage in various types of activity related to disaster events.
• Certain types of activities are suited to specific phases.
• Actions taken in one phase have an impact on the outcomes of other phases.
• Meeting the needs generated by disasters requires activity in all the phases.
• Use of the phase approach will improve the ability of humans to adapt to
disasters.”
When propositions derived from repeated research efforts are generally accepted as the
truth, they may be formalised as principles promoted by academics (Drabek, 2007:19;
Jensen, 2010:16). One such principle is that preparedness is a continuous process
(Drabek, 2007:20). This implies that planning and other activities related to risk
assessment and mitigation are not once-off achievements and should therefore not be
constrained to a specific phase.
The disaster phase model provides a framework to categorise multi-disciplinary activities
related to different components within the continuum of disaster risk management
activities (Lewis, 1999; Drabek, 2006). This includes ecological modelling (Beaton et al.,
100
2008), adaptation strategies for communities (Kendra & Wachtendorf, 2006), and
government performance analysis (Drabek, 2006). In the case of geographic information
systems (GIS), this framework is used to provide an overview of GIS applications in
disaster risk management (Thomas et al., 2006:87), and it is illustrated in Table 4.1.
Mapping constitutes a core component of GIS, such as the mapping of hazard zones to
assess which populations are at risk for a variety of hazards. However, the functionality
of GIS reaches beyond mapping functions and includes value-adding functions such as
analysis (e.g. in risk assessments and early warning), decision support (e.g. prioritising
actions), and data sourcing and processing throughout the continuum of disaster
management activities.
The need for a framework that integrates GIS activities with disaster risk management
tasks is demonstrated by Jansen van Vuuren (2013). He highlights the fact that GIS is
not fully integrated in activities such as rapid disaster impact assessment and provides a
framework for GIS integration across process phases. Kendra and Wachtendorf (2006)
demonstrate how the disaster phase model can be modified innovatively to develop
adaptation strategies by proposing a pre-disaster, trans-disaster, and a post-disaster
framework.
101
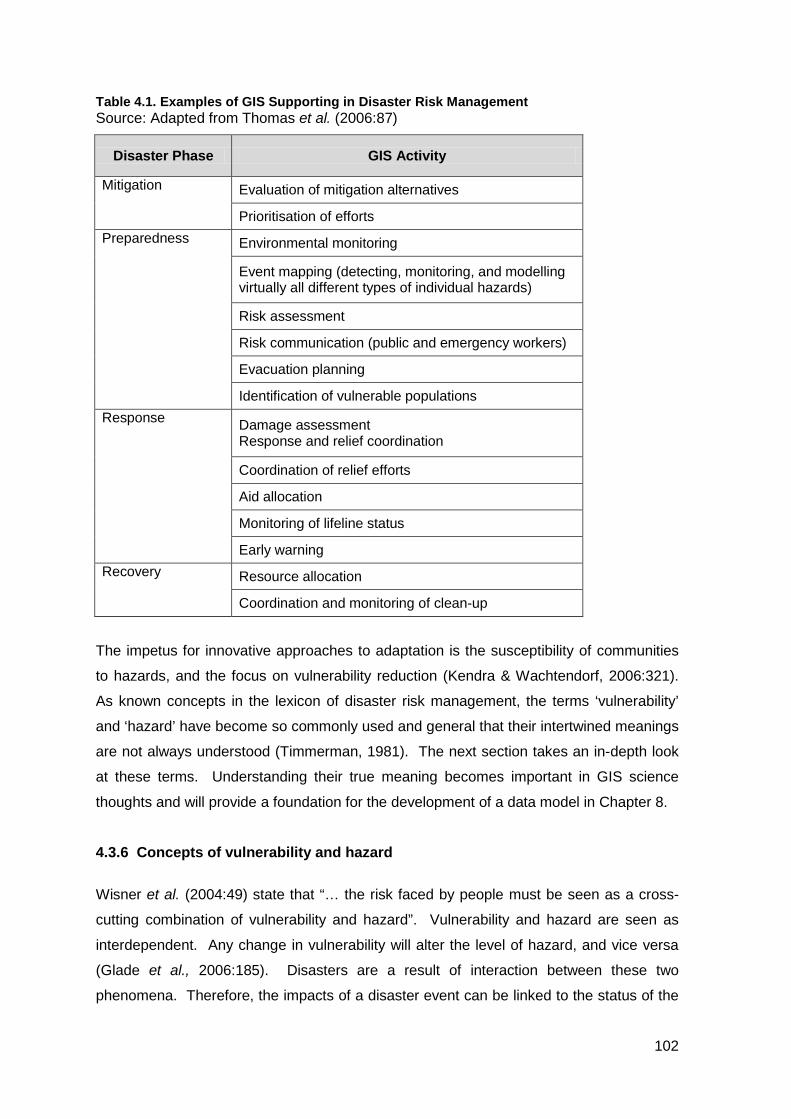
Table 4.1. Examples of GIS Supporting in Disaster Risk Management Source: Adapted from Thomas et al. (2006:87)
Disaster Phase GIS Activity
Mitigation Evaluation of mitigation alternatives
Prioritisation of efforts Preparedness Environmental monitoring
Event mapping (detecting, monitoring, and modelling virtually all different types of individual hazards)
Risk assessment
Risk communication (public and emergency workers)
Evacuation planning
Identification of vulnerable populations Response Damage assessment
Response and relief coordination
Coordination of relief efforts
Aid allocation
Monitoring of lifeline status
Early warning Recovery Resource allocation
Coordination and monitoring of clean-up
The impetus for innovative approaches to adaptation is the susceptibility of communities
to hazards, and the focus on vulnerability reduction (Kendra & Wachtendorf, 2006:321).
As known concepts in the lexicon of disaster risk management, the terms ‘vulnerability’
and ‘hazard’ have become so commonly used and general that their intertwined meanings
are not always understood (Timmerman, 1981). The next section takes an in-depth look
at these terms. Understanding their true meaning becomes important in GIS science
thoughts and will provide a foundation for the development of a data model in Chapter 8.
4.3.6 Concepts of vulnerability and hazard Wisner et al. (2004:49) state that “… the risk faced by people must be seen as a cross-
cutting combination of vulnerability and hazard”. Vulnerability and hazard are seen as
interdependent. Any change in vulnerability will alter the level of hazard, and vice versa
(Glade et al., 2006:185). Disasters are a result of interaction between these two
phenomena. Therefore, the impacts of a disaster event can be linked to the status of the
102
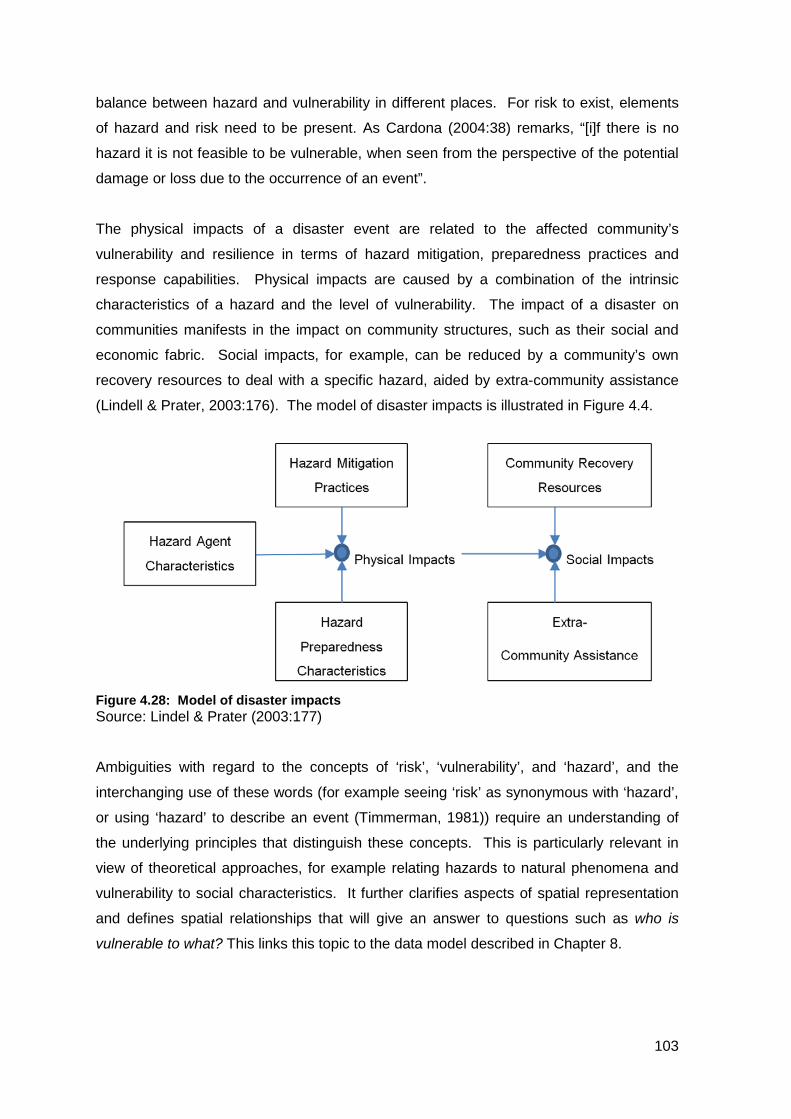
balance between hazard and vulnerability in different places. For risk to exist, elements
of hazard and risk need to be present. As Cardona (2004:38) remarks, “[i]f there is no
hazard it is not feasible to be vulnerable, when seen from the perspective of the potential
damage or loss due to the occurrence of an event”.
The physical impacts of a disaster event are related to the affected community’s
vulnerability and resilience in terms of hazard mitigation, preparedness practices and
response capabilities. Physical impacts are caused by a combination of the intrinsic
characteristics of a hazard and the level of vulnerability. The impact of a disaster on
communities manifests in the impact on community structures, such as their social and
economic fabric. Social impacts, for example, can be reduced by a community’s own
recovery resources to deal with a specific hazard, aided by extra-community assistance
(Lindell & Prater, 2003:176). The model of disaster impacts is illustrated in Figure 4.4.
Figure 4.28: Model of disaster impacts Source: Lindel & Prater (2003:177)
Ambiguities with regard to the concepts of ‘risk’, ‘vulnerability’, and ‘hazard’, and the
interchanging use of these words (for example seeing ‘risk’ as synonymous with ‘hazard’,
or using ‘hazard’ to describe an event (Timmerman, 1981)) require an understanding of
the underlying principles that distinguish these concepts. This is particularly relevant in
view of theoretical approaches, for example relating hazards to natural phenomena and
vulnerability to social characteristics. It further clarifies aspects of spatial representation
and defines spatial relationships that will give an answer to questions such as who is
vulnerable to what? This links this topic to the data model described in Chapter 8.
103
4.3.6.1 Understanding hazards Hazards can be described as events that have potentially harmful outcomes (Birkmann,
2005:1) and are regarded as a causal factor or a trigger for disaster (Wisner et al.,
2004:7). Although hazards have been known to mankind since the beginning of time,
broad-based research into natural hazards did not begin until almost the middle of the 20th
century. Before then, hazards had been viewed as isolated events that were being dealt
with reactively, mostly by means of engineering intervention, for example the building of
dams or levees to mitigate flood risk (Smith, 2013:4).
Traditionally, natural hazards are listed as hurricanes, earthquakes, volcanoes, floods,
tsunamis, etc. Referring to these as trigger events or hazard agents, Lindell and Prater
(2003:176) characterise hazards in terms of particular threats that are the actual causes
of damage. For example, tropical cyclones may cause casualties and damage through
wind, rain, storm surge, and inland flooding. The characteristics of a hazard are therefore
determined by the nature of these events, the probability of occurrence, the speed of
onset and the ability to mobilise early warning. Together with knowledge of community
resilience and the capacity to deal with events, authorities can pro-actively model the
extent of casualties among the population and the degree of damage to structures in the
affected area (Lindell & Prater, 2003:176). A hazard is thus best viewed “as a naturally
occurring or human-induced process, or event, with the potential to create loss, that is, a
general source of future danger” (Smith, 2013:6).
Based on the notion that hazard is not the natural event itself, but the risk encountered in
occupying a place that is subject to an event, such as a floodplain (Burton et al., 1993:31),
hazard presents a strong spatial connotation. As Smith (2013:22) puts it, “hazard
exposure is created by people and property being in the wrong place at the wrong time”.
This allows for the mapping of hazard zones in terms of the natural concentration of geo-
physical phenomena such as volcanoes, earthquakes, tsunamis and severe storms
(Smith, 2013:23).
Being physical phenomena, hazards present with distinct physical attributes. Scales of
measurement have been developed for certain events such as earthquakes (Richter and
Mercalli scale) and hurricanes (Category classes, USA). The following broad index of
measurement for the different characteristics is proposed by Burton et al. (1993:41):
104

Magnitude is the maximum force of an event that can be measured
by instruments and in terms of calibrated scales. For example,
floods are measured by the maximum height (elevation) reached by
the flood waters. Earthquakes are measured in terms of the Richter
or the Mercalli scale. Hurricanes are measured in terms of wind
speed and classified in Categories 1 - 5.
Frequency asserts how often an event is expected to occur, e.g.
once every year or once in ten years.
Duration describes the length of time over which the effects of an
event persist. This is different from the speed of onset. Duration can
be days (flood), weeks (earthquakes) or years (drought).
Areal extent is an indication of the space (footprint) occupied by an
event. A tornado has a narrow swath and short distance, whereas a
drought may cover thousands of square kilometres. Remote
sensing and GPS technology is often used to delineate the extent
that can be presented in spatial context on maps.
Speed of onset refers to the length of time between the first
noticeable or recorded appearance of an event and its peak.
Examples of slow onset are drought and soil erosion. Examples of
fast onset events are earthquakes and snow or mud slides.
Spatial dispersion depicts the pattern of spatial distribution.
Droughts are widespread, whereas floods can be dispersed, in
accordance with the topography of an area. As with areal extent,
spatial dispersion can also be mapped.
Temporal spacing refers to the sequence of events. Volcanoes, for
example, approximate a random time distribution, whereas as
tropical storms are seasonal.
The significance of measuring the seven dimensions of hazardous events is linked to the
type of response each requires in terms of mitigation and readiness. The more powerful
an event (magnitude), the less adequate the technology to control it. The more frequent,
105
the more steps are needed to respond effectively, and the larger the area being affected,
the broader the segment of society that is likely to be subjected to loss or disruption.
Preparedness and early warning is influenced by the speed of onset, and duration
determines the range of possible responses (Burton et al., 1993:35).
4.3.6.2 Understanding vulnerability
The concept of vulnerability is central to this research. It stands in relation to constructs
of hazard and resilience, which holistically determine disaster risk (Wisner et al., 2004).
According to Birkmann et al. (2014), vulnerability is a core concept that links various
research communities, particularly those involved in disaster risk management, climate
change adaption and development research. Vulnerability assessment is also seen as a
key endeavour within disaster risk reduction. The approaches to vulnerability research are
rooted in political economy, social ecology, and climate change science. In as far as
there is general consensus that vulnerability translates into disaster, this concept is further
explored as a construct.
The focus on vulnerability demonstrates the evolution of disaster paradigms from the
Patterns of War approach, where the emphasis was centred on the technocratic
knowledge of hazards, to Disaster as Vulnerability, where social theory became a central
viewpoint for disaster research. Whereas the former was useful as a first theoretical
framework to understand and deal with disasters, the vulnerability approach looks for
answers in a socio-political environment (McEntire, 2005:207). This supports
Weichselgartner’s alternative definition that states disaster as “a product of a cumulative
set of decisions taken by humans over long periods”, and changes the focus from
physical-natural drivers to aspects of policy and governance. Anthony-Smith (2004:10)
states that vulnerability is fundamentally a political-ecological concept focusing on the
relationship between people and their environment. Political and economic forces shape
the environment that people live in, which present a particular characteristic of the
condition of that relationship. According to Anthony-Smith, vulnerability provides a
theoretical framework that encompasses the multidimensionality of disasters by
combining elements of environment, society and culture in various proportions.
It is generally accepted that vulnerability is a property of human society, coupled with the
natural environment. It is regarded as the key to understanding the cause and impact of
disaster (Turner, 2003a; Hilhorst & Bankoff, 2004; Birkmann et al., 2014). It is a multi-
faceted construct that is difficult to define (Birkmann, 2005:3). It also means different
106
things to different people (Timmerman, 1981; Cutter, 1996). Researchers such as Greg
Bankoff, Jörn Birkmann, Piers Blaikie, Terry Cannon, Susan Cutter, Ian Davis, Anthony
Oliver-Smith, Ben Wisner, and others have published widely on this topic and introduced
various conceptualisations of vulnerability. Four publications are highlighted for their
contribution to conceptualise vulnerability and develop thoughts on the modelling and
representation thereof:
Vulnerability, Resilience and the Collapse of Society: A Review of Models and
Possible Climatic Applications. Environmental Monograph No. 1 by Timmerman
(1981). This work is noted for its conceptualisation of vulnerability, shifting the focus
from hazard and disaster impact to the relationship between climatic fluctuations and
social systems (refer to Weichselgartner, 2001).
At Risk: Natural Hazards, people’s vulnerability and disasters by Wisner, Blaikie,
Cannon and Davis (two editions, in 1994 and 2004). This work is widely referenced,
and particularly noted for the Pressure and Release Model of Disaster.
Measuring Vulnerability to Natural Hazards: towards disaster resilient societies,
edited by Björn Brinkmann (2006). This work is noted for its evaluation of and
contribution to vulnerability frameworks. (Refer to Chapter 7 for an overview of
various frameworks.)
Vulnerability to environmental hazards by Susan Cutter (1996). In this work the
Hazard of Place Model of Vulnerability is introduced, which expands the geographical
context of vulnerability. This work forms the basis for further work by the author, such
as the development of the GIS-based Social Vulnerability Index (SoVI), which is
discussed in Chapter 7.
Vulnerability describes concepts of susceptibility, weakness and exposure in the context
of being prone to damage or injury (Wisner et al., 2004:11). It implies an inherent or
innate susceptibility to harm and is the antithesis of the ability to resist or withstand and
cope with the impact of disaster. It represents the inability of societal processes to cope,
neutralise or overcome harm when it threatens people and helps to clarify the concepts of
risk and disaster (Wisner et al., 2004; Cordona, 2003; Birkmann et al., 2014).
The work of Wisner et al. (2004) is acknowledged as the foundation of vulnerability theory
(Zakour & Gillespie, 2013:37). Grounded in systems theory (Zakour & Gillepsie, 2013:10;
107
Birkmann et al., 2014:25) the vulnerability framework is embedded in processes
beginning with root causes that set up dynamic pressures and further translate effects
from the root causes into unsafe conditions. Within this framework, vulnerability functions
in combination with hazard to produce risk (Wisner et al., 2004:49). Disasters are seen
as the result of the interaction of both; the one presupposes the other. Theoretically there
can be no disaster if a hazard exists, but there is no vulnerability. Likewise, if there is a
vulnerable community, but no hazard event, there will also be no disaster. From this
assertion, Wisner et al. (2004) develop two models; first a pseudo-equation that disaster
risk is a compound function of hazard and the number of people, characterised by a
specific level of vulnerability, and second a model of the progression of vulnerability. The
equation is expressed as:
R = H x V,
where R = risk, H = hazard, and V = Vulnerability
The above equation is developed as the Access Model which explains the state of normal
life of a community and explains how livelihoods differ in terms of access to material,
social and political resources (Wisner et al., 2004:89).
The second model is the Pressure and Release Model (PAR) (Wisner et al., 2004:50),
which describes the progression of vulnerability and the existence of a hazard as two
forces that meet at the moment of impact – i.e. the occurrence of a disaster. In other
words, a disaster occurs when the energy of a hazard is released at a time and place
when unsafe conditions of a vulnerable community are at such a low level that they can
neither resist the force, nor cope with the consequences of the event. In this model,
vulnerability is defined as a process characterised by the progression of root causes,
coupled with dynamic pressures that result in unsafe conditions. The root causes of
vulnerability exist as exogenous and endogenous factors, the first being socio-political
systems, and the second limited access to resources, which is a unique characteristic of a
community. This viewpoint highlights the fact that not all communities facing the same
hazard at the same location and time will suffer the same level of damage and loss. The
PAR model is illustrated in Figure 4.5.
108
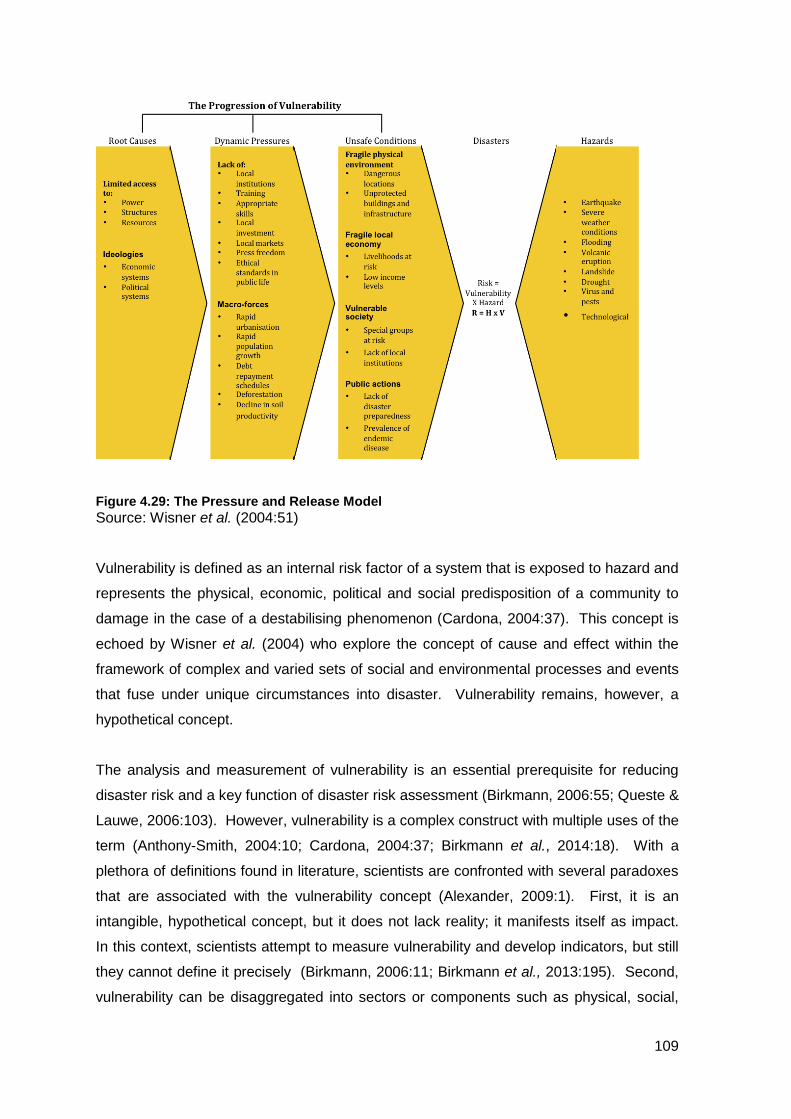
Figure 4.29: The Pressure and Release Model Source: Wisner et al. (2004:51)
Vulnerability is defined as an internal risk factor of a system that is exposed to hazard and
represents the physical, economic, political and social predisposition of a community to
damage in the case of a destabilising phenomenon (Cardona, 2004:37). This concept is
echoed by Wisner et al. (2004) who explore the concept of cause and effect within the
framework of complex and varied sets of social and environmental processes and events
that fuse under unique circumstances into disaster. Vulnerability remains, however, a
hypothetical concept.
The analysis and measurement of vulnerability is an essential prerequisite for reducing
disaster risk and a key function of disaster risk assessment (Birkmann, 2006:55; Queste &
Lauwe, 2006:103). However, vulnerability is a complex construct with multiple uses of the
term (Anthony-Smith, 2004:10; Cardona, 2004:37; Birkmann et al., 2014:18). With a
plethora of definitions found in literature, scientists are confronted with several paradoxes
that are associated with the vulnerability concept (Alexander, 2009:1). First, it is an
intangible, hypothetical concept, but it does not lack reality; it manifests itself as impact.
In this context, scientists attempt to measure vulnerability and develop indicators, but still
they cannot define it precisely (Birkmann, 2006:11; Birkmann et al., 2013:195). Second,
vulnerability can be disaggregated into sectors or components such as physical, social,
109
economic or psychological, but it is essentially a holistic concept – harm is linked to the
whole construct (Alexander, 2009:1). Perhaps one should simplify the concept and
consider vulnerability as a useful rhetoric; in other words, use the idea and not the term,
as stated by Timmerman (1981:17).
4.3.6.3 Understanding Resilience
The concept of resilience originated within the engineering field where the Scottish
engineer William Rankine employed the term to describe the strength and ductility of steel
beams (Alexander, 2013:2710). The resilience property of a steel beam indicates its
ability to withstand a force applied to it by virtue of its strength (rigidity) and its flexibility or
ductility (ability to deform under stress). Subsequently the term entered the fields of
natural ecology and human ecology, as an analogy of the concept of dynamic equilibrium,
the persistence of systems and their ability to absorb change and disturbance under
stress (Alexander, 2013:2710). In the context of social systems, resilience refers to the
‘state space’ where a system would tend to remain in the absence of strong perturbations
(Gallopín, 2006:297). The state of a system can change in time, which can be followed
by the trajectory from its initial state to its current state. The successive changes of state
through time can be measured as a trajectory. If the variables of a system are known,
and the trajectory of change can be interpreted, the future state of a system can also be
projected.
At origin, resilience had different meanings. Alexander (2013) provides a detailed
overview of the etymology of the term, tracing it from the middle ages through various
disciplines to the social context of disaster studies. Gallopín (2006) analyses resilience in
the context of socio-ecological systems and explores the concept of dynamic changes in
the state of systems. The core definition of resilience indicates the ability of communities
to cope with external stress, showing strength to absorb an impact or recover from it
(Holling, 1973:17; Timmerman, 1981:21; Gallopín, 2006:297; UN-ISDR, 2009:24;
Weichselgartner & Kelman, 2014:2).
Resilience is often used in association with vulnerability. Timmerman (1981) and Twigg
(2007), for example, see resilience and vulnerability as the opposite sides of the same
coin. However, this distinction is not so clear. In terms of the ‘capacity to cope’, as
described by the MOVE framework of Birkmann et al. (2013), resilience is by definition
included in the framework. Weichselgartner and Kelman (2014:1), on the other hand,
state that “‘resilience’ has been replacing ‘vulnerability’ and ‘sustainability’ as a currency
110
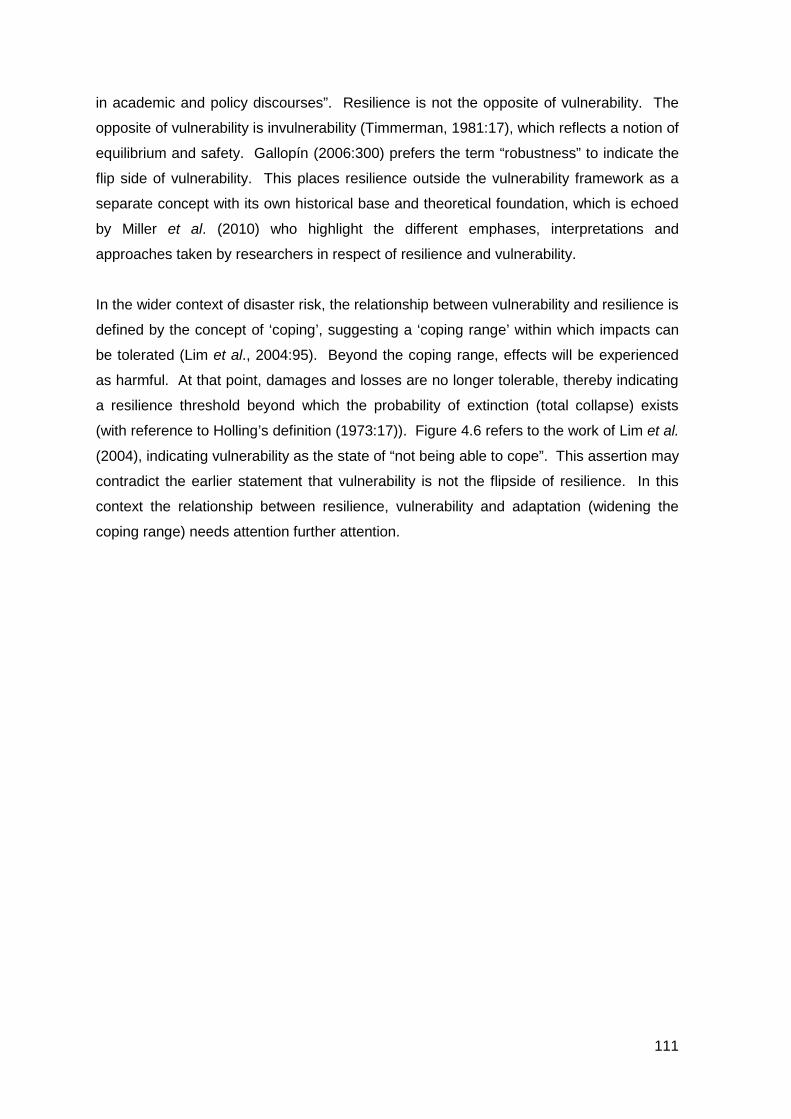
in academic and policy discourses”. Resilience is not the opposite of vulnerability. The
opposite of vulnerability is invulnerability (Timmerman, 1981:17), which reflects a notion of
equilibrium and safety. Gallopín (2006:300) prefers the term “robustness” to indicate the
flip side of vulnerability. This places resilience outside the vulnerability framework as a
separate concept with its own historical base and theoretical foundation, which is echoed
by Miller et al. (2010) who highlight the different emphases, interpretations and
approaches taken by researchers in respect of resilience and vulnerability.
In the wider context of disaster risk, the relationship between vulnerability and resilience is
defined by the concept of ‘coping’, suggesting a ‘coping range’ within which impacts can
be tolerated (Lim et al., 2004:95). Beyond the coping range, effects will be experienced
as harmful. At that point, damages and losses are no longer tolerable, thereby indicating
a resilience threshold beyond which the probability of extinction (total collapse) exists
(with reference to Holling’s definition (1973:17)). Figure 4.6 refers to the work of Lim et al.
(2004), indicating vulnerability as the state of “not being able to cope”. This assertion may
contradict the earlier statement that vulnerability is not the flipside of resilience. In this
context the relationship between resilience, vulnerability and adaptation (widening the
coping range) needs attention further attention.
111
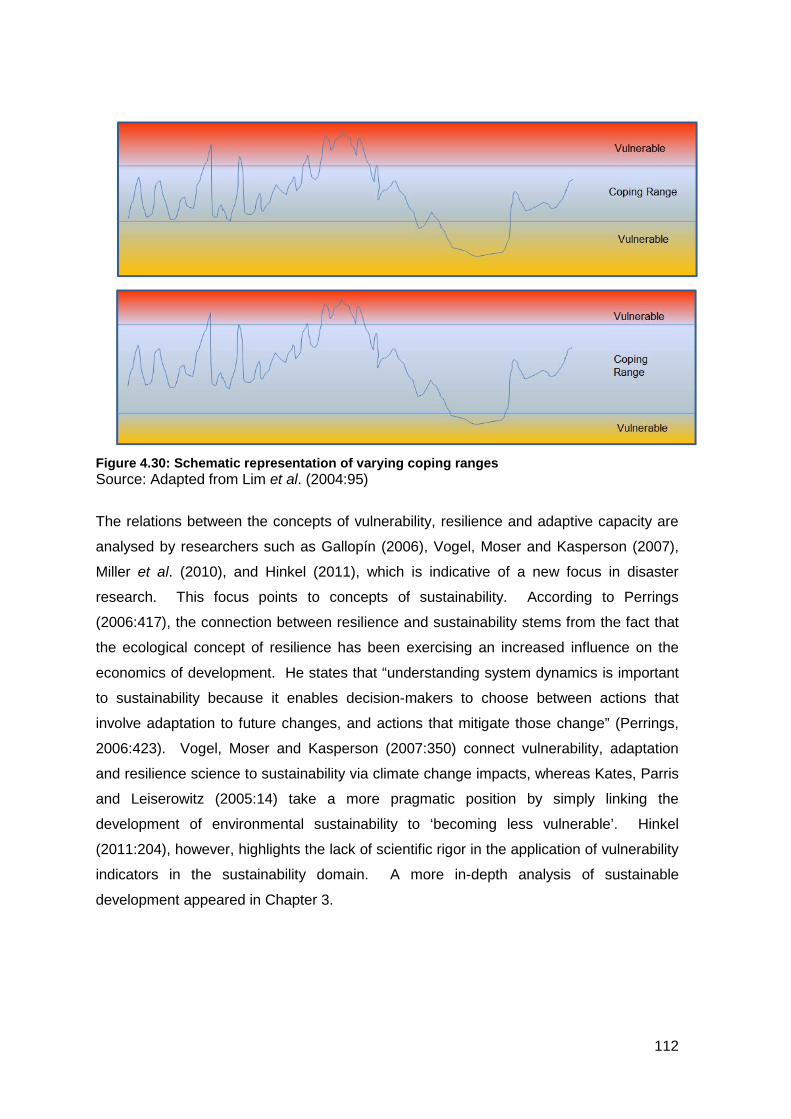
Figure 4.30: Schematic representation of varying coping ranges Source: Adapted from Lim et al. (2004:95)
The relations between the concepts of vulnerability, resilience and adaptive capacity are
analysed by researchers such as Gallopín (2006), Vogel, Moser and Kasperson (2007),
Miller et al. (2010), and Hinkel (2011), which is indicative of a new focus in disaster
research. This focus points to concepts of sustainability. According to Perrings
(2006:417), the connection between resilience and sustainability stems from the fact that
the ecological concept of resilience has been exercising an increased influence on the
economics of development. He states that “understanding system dynamics is important
to sustainability because it enables decision-makers to choose between actions that
involve adaptation to future changes, and actions that mitigate those change” (Perrings,
2006:423). Vogel, Moser and Kasperson (2007:350) connect vulnerability, adaptation
and resilience science to sustainability via climate change impacts, whereas Kates, Parris
and Leiserowitz (2005:14) take a more pragmatic position by simply linking the
development of environmental sustainability to ‘becoming less vulnerable’. Hinkel
(2011:204), however, highlights the lack of scientific rigor in the application of vulnerability
indicators in the sustainability domain. A more in-depth analysis of sustainable
development appeared in Chapter 3.
112
4.3.6.4 Understanding risk
To arrive at an understanding of disaster risk reduction, the concept of risk is examined.
The Oxford English Dictionary (OED) defines risk as a "hazard, danger; exposure to
mischance or peril". People can be put ‘at risk’ by means of voluntary or involuntary
participation in an activity or event that could lead to injury, damage or loss. Some people
will choose knowingly to live and work in such places in spite of risks, threats or hazards.
The factors that influence these decisions are embedded in the way our societies are
organised and in the beliefs that sustain and perpetuate the system (Oliver-Smith,
2013:1).
To imply that risk is the same as hazard, as quoted from the OED above, can be
confusing. As described earlier, hazard is a source of potential harm or damage, and has
properties such as intensity. Hazard exists in the potential of an event occurring, and
needs a trigger mechanism to occur. Risk, on the other hand, is the chance or probability
that a person or a community will suffer harm as a result of the hazard.
As indicated above, risk develops from the way societies are organised. Risk is,
according to Oliver-Smith (2013:2), a social construct associated with socio-cultural
processes. It is seen as a symptom of a deeper problem that is rooted in culture and
political economy, particularly in respect of nature–society relations and interactions.
Alexander and Davis (2012:1) identify five underlying factors that together constitute the
problem of risk:
i. The human right to hazard information
ii. Explosive population growth
iii. Corruption
iv. People being placed at risk by the actions of governments
v. Discrimination
In terms of the Hyogo Framework for Action 2005-2015 (UN-ISDR, 2005), risk is being
addressed in conjunction with sustainable development, which highlights the multi-
disciplinary approach to disaster risk reduction.
4.4 MULTI-DISCIPLINARY NATURE OF DISASTER
There is a growing consensus that multi- and interdisciplinary approaches are needed to
analyse and understand complex problems of our day (McEntire, 2007). McEntire
113
(2004:12) lists not less than eleven disciplines that have a close relationship with and
contribute to disaster risk management in some way or another. Apart from having a long
history of studying hazards, Geography looks at vulnerability in terms of land use and
hazard-prone areas. Engineering is concerned with structures that cannot withstand the
forces of hazards, environmental sciences with sensitivity of the environment, and
sociology with the behaviour of people reacting to a disaster.
The multi- and interdisciplinary approaches to the study of disaster and disaster
management practice are reflected in pre- and post-disaster activities (McEntire, 2007:3).
Researchers from various disciplines study hazards, vulnerability and resilience, as is
reflected in the large number of publications on these topics (Alexander, 2012:1). In post-
disaster situations, numerous actors from various disciplines converge on the disaster
scene to contribute to the protection of life and alleviation of human suffering (McEntire,
2007:3). Jensen (2010:15) argues for a multi-disciplinary approach to higher education in
disaster studies, stating that “a growing complexity of the body of knowledge that one has
to know to be competent in emergency management is vast, specialized, and separate
from any one other discipline”.
The value of multi- and interdisciplinary approaches, according to McEntire (2007), is
found in various applications, such as the following:
i. Understanding and effectively dealing with complex problems
ii. Synthesising knowledge and bridging gaps across functional areas
iii. Widening the knowledge base of practitioners
iv. Establishing collective research methodologies internationally
McEntire’s edited publication, Disciplines, Disasters and Emergency Management: The
Convergence and Divergence of Concepts, Issues and Trends in the Research Literature
(2007), with contributions from various fields, points to the need for multi- and
interdisciplinary research. He concludes in his introductory chapter that they “are
exploring unchartered waters, and that there are undoubtedly stormy seas, misty views,
and jagged rocks posing a threat to the multi- or interdisciplinary vessel” (McEntire,
(2007:13). The ensuing challenge is hopefully addressed to some extent by the current
research. The multi-disciplinary nature of disaster risk studies was further explored in
Chapter 3, with special reference to the relationship between development planning and
environmental management.
114
4.4.1 Disaster risk in developmental context Development was described in Chapter 2 as ‘change’. Lewis (1999:xi) describes
development as “the necessary inevitable”, referring to the imperative of producing goods
and services and maintaining livelihoods. From a more holistic perspective, disaster risk
is seen in the context of changes of the human-environment system (Turner et al.,
2003a). Oliver-Smith (1994) highlights the perspective that disasters do not simply
happen; they are caused, and the causal factors lie primarily in the domain of
development. Thus, events such as earthquakes, volcanoes and tsunamis are all part of
natural processes that bring about change in some form or other. When such changes
affect and disrupt people’s lives, they manifest as disasters. This premise was addressed
in detail earlier (see Section 4.3.1).
An analysis of disaster risk and development based on the available literature shows five
conceptualisations of their interrelationships, namely:
i. Development is the root cause of disasters.
ii. Disasters have a negative impact on development.
iii. Development plays an important role in disaster risk reduction.
iv. Disasters can provide development opportunities.
v. Disaster risk is exacerbated by improper disaster management policies combined
with development failure.
The origins of vulnerability are firstly linked to developmental factors, as illustrated by
Anthony Oliver-Smith in his chapter Peru's Five Hundred Year Earthquake: Vulnerability
in Historical Context (Oliver-Smith, 1994). He traces the vulnerability of the Peruvian
people back to a multitude of ‘natural’ hazards during the Spanish conquest and
colonisation of the region some 500 years ago. People were forced to transform their
traditional way of living and indigenous systems to conform to the economic and social
systems of a developing world, the conditions and context of which were far beyond their
control. With no knowledge or regard of indigenous systems, the Spanish conquerors
developed towns in potentially hazardous areas that were previously avoided by the local
people. The forced migration and concentration of people in larger settlements resulted in
the change of spatial development patterns from dispersed, small rural communities to an
urbanised setting with a grid-like spatial pattern of narrow streets. Houses were built
according to the Spanish style of tall double-storey structures with tiled roofs, making
them more dangerous in a collapse (Fordham, 2006). When an earthquake struck Peru
on 31 May 1970, registering 7.7 on the Richter scale, the north-central coastal and
115
Andean regions of Peru were devastated, making this the worst historic 'natural' disaster
in the Western hemisphere at the time (Oliver-Smith, 1994).
A more recent and modern example of the link between development and vulnerability is
demonstrated by the effect of globalisation, and the world-wide effect of a disaster event
in a single location. The earthquake in Kyoto, Japan, in 2011 and the ensuing tsunami
led to the closure of two Japanese plants accounting for 25% of the world’s supply of
silicon wafers used in computer manufacturing. This led to a world-wide shortage of
supply from this location for some time (Barrow, 2006; Nanto, Cooper & Donnelly, 2011).
This elevates disaster risk and vulnerability assessment from a local and national
perspective to a global scale.
In the context of the PAR model, as described in Section 4.3.3.2, development is a root
cause for disaster. This is, however, a one-sided perspective as disasters in turn also
have a negative impact on development. This dualistic view is highlighted by the
Department for International Development (DFID) (2005) and Fordham (2006). According
to the DFID (2005), major disasters not only have negative long-term consequences for
economic growth, development and poverty reduction, but also undermine efforts to
achieve the Millennium Development Goals (MDGs). The DFID (2005:20) identifies a
number of direct and indirect impacts against each of the eight MDGs, as shown in
Annexure 4.1.
A third view is the role development plays in disaster risk reduction. Describing
development as “the necessary inevitable”, Lewis (1999) sees it as an appropriate vehicle
for vulnerability and disaster reduction, stating that development objectives should take
account of hazards and of disaster probability. By informing the development process of
the nature of hazards, avoidance and mitigation strategies can be incorporated in
strategic planning and in the design of infrastructure, for example by avoiding hazard
zones and constructing earthquake-resistant housing (Oliver-Smith, 1994; Lewis, 1999;
Fordham, 2006).
A fourth view on the link between disaster and development is the fact that disasters can
also provide development opportunities (Fordham, 2006:339). The extension of relief
operations into post-disaster livelihood development programmes increases the ability of
households and communities not only to rebuild what was lost in the disaster, but also to
enhance their everyday coping capacities and household incomes.
116
The lack of integration between disaster risk management and development planning is
rooted in what Lewis (1999) refers to as the self-centric disaster cycle (see the discussion
of the disaster cycle in Section 4.4.1). He criticises the exclusion of the development
process in the traditionally viewed ‘disaster cycle’ and the multi-sectoral approach to
disaster risk management which is rarely co-ordinated or objectively interrelated. Lewis
uses the analogy of a bicycle with disaster risk management and development planning
seen as the two wheels, and which is (ideally) steered by one person. This view points to
inter- and intra-disciplinary concepts, as described by Van Niekerk (2012).
The DFID (2005) adds another conceptualisation to the analysis, with what they call the
‘Vicious spirals’ of disaster risk and development failure. The failure of development and
government policy to reduce disaster risk, combined with increased vulnerabilities, stalled
economic development, reduced capacity to cope with or adapt to risk, and increased
exposure to hazard and susceptibility to harm, constitutes a vicious spiral of disaster risk
and development failure. The anticlockwise spiral in Figure 4.7 shows how development
failures undermine the capacity to cope and increase exposure to hazard. In the
clockwise spiral, failed development is seen to undermine national capacity to respond
strategically to disaster impacts, which means development resources are redirected
towards humanitarian assistance or emergency coping (DFID, 2005:31). The
developmental context of disaster risk management is best summarised by Lewis
(1999:134) who states that “[d]evelopment continues to be regarded as the goal when
everything else has been accomplished; relief, and rehabilitation are expected to modify
so as to integrate with and not to impede or counter development”.
117
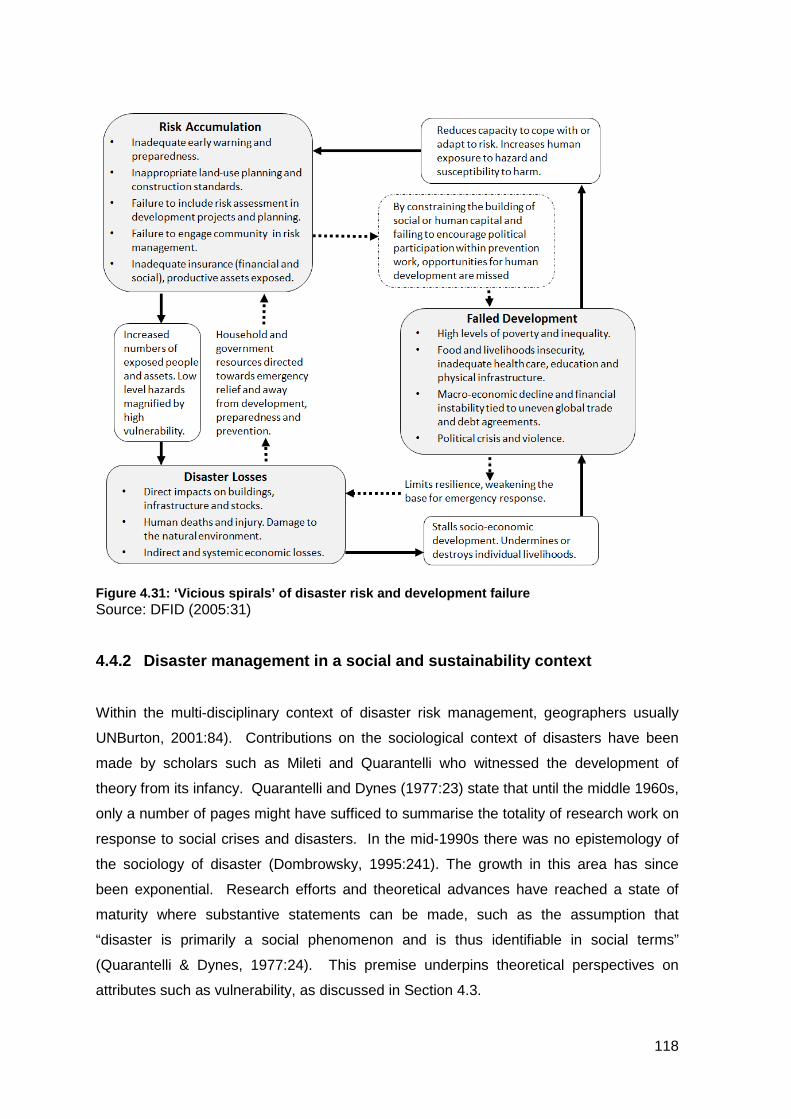
Figure 4.31: ‘Vicious spirals’ of disaster risk and development failure Source: DFID (2005:31)
4.4.2 Disaster management in a social and sustainability context
Within the multi-disciplinary context of disaster risk management, geographers usually
UNBurton, 2001:84). Contributions on the sociological context of disasters have been
made by scholars such as Mileti and Quarantelli who witnessed the development of
theory from its infancy. Quarantelli and Dynes (1977:23) state that until the middle 1960s,
only a number of pages might have sufficed to summarise the totality of research work on
response to social crises and disasters. In the mid-1990s there was no epistemology of
the sociology of disaster (Dombrowsky, 1995:241). The growth in this area has since
been exponential. Research efforts and theoretical advances have reached a state of
maturity where substantive statements can be made, such as the assumption that
“disaster is primarily a social phenomenon and is thus identifiable in social terms” (Quarantelli & Dynes, 1977:24). This premise underpins theoretical perspectives on
attributes such as vulnerability, as discussed in Section 4.3.
118
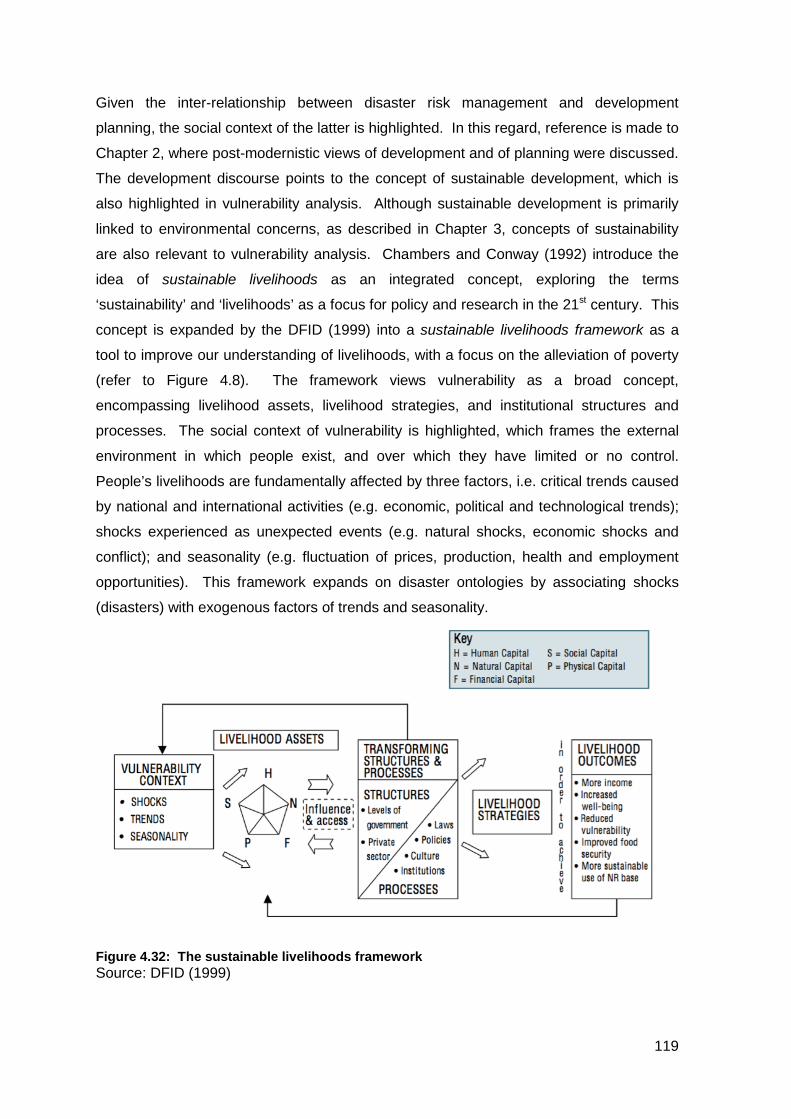
Given the inter-relationship between disaster risk management and development
planning, the social context of the latter is highlighted. In this regard, reference is made to
Chapter 2, where post-modernistic views of development and of planning were discussed.
The development discourse points to the concept of sustainable development, which is
also highlighted in vulnerability analysis. Although sustainable development is primarily
linked to environmental concerns, as described in Chapter 3, concepts of sustainability
are also relevant to vulnerability analysis. Chambers and Conway (1992) introduce the
idea of sustainable livelihoods as an integrated concept, exploring the terms
‘sustainability’ and ‘livelihoods’ as a focus for policy and research in the 21st century. This
concept is expanded by the DFID (1999) into a sustainable livelihoods framework as a
tool to improve our understanding of livelihoods, with a focus on the alleviation of poverty
(refer to Figure 4.8). The framework views vulnerability as a broad concept,
encompassing livelihood assets, livelihood strategies, and institutional structures and
processes. The social context of vulnerability is highlighted, which frames the external
environment in which people exist, and over which they have limited or no control.
People’s livelihoods are fundamentally affected by three factors, i.e. critical trends caused
by national and international activities (e.g. economic, political and technological trends);
shocks experienced as unexpected events (e.g. natural shocks, economic shocks and
conflict); and seasonality (e.g. fluctuation of prices, production, health and employment
opportunities). This framework expands on disaster ontologies by associating shocks
(disasters) with exogenous factors of trends and seasonality.
Figure 4.32: The sustainable livelihoods framework Source: DFID (1999)
119
4.5 CONCLUSION
Chapter 4 follows on two previous chapters that described development planning and
environmental management. It defines and investigates the theoretical grounding of
disaster risk reduction, with a strong supposition that disasters are primarily the result of
development and environmental degradation. Although efforts of disaster risk reduction
are evident in ancient history, disaster risk management as a science is a recent
development that (as in the case of development planning), follows a post-modern
development pattern.
The multi-disciplinary nature of disaster risk management is highlighted in this chapter. It
provides a background for various frameworks that aim to explain disaster risk
management in terms of content analysis. A number of selected frameworks that are
presented in Chapter 6 highlight the use of information – specifically geographic
information systems (GIS) technology. An exposition of GIS will be presented in
Chapter 5.
120
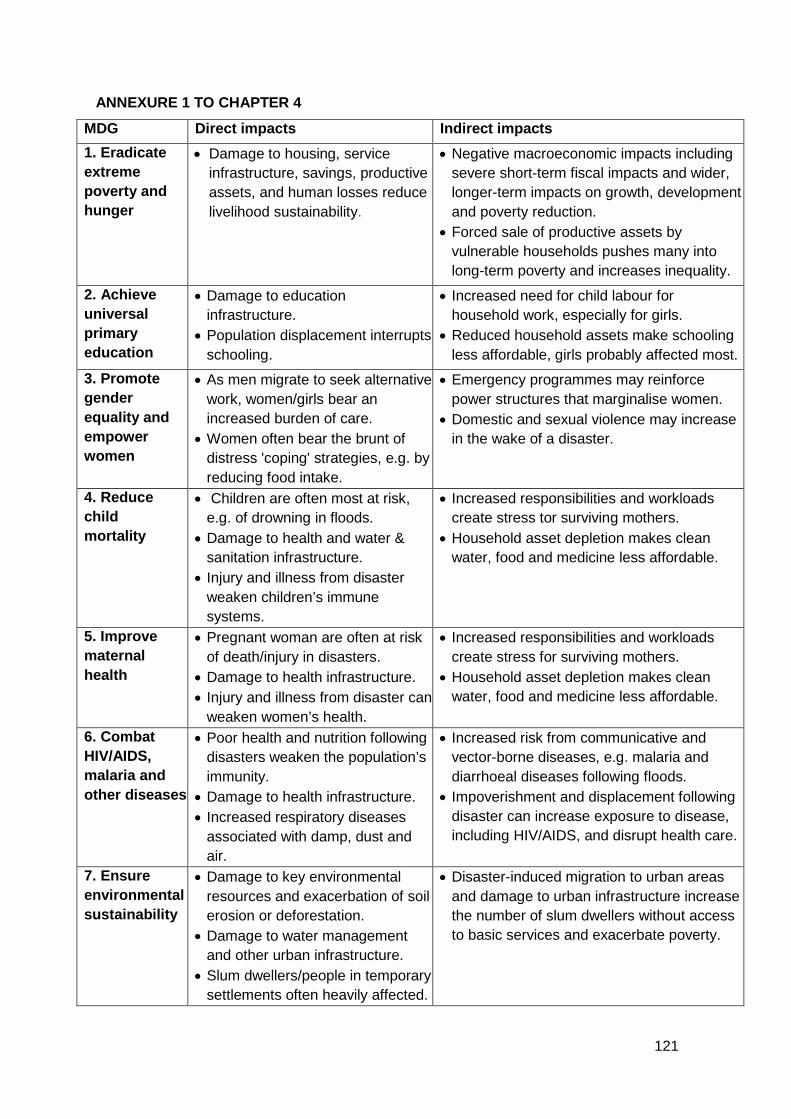
ANNEXURE 1 TO CHAPTER 4
MDG Direct impacts Indirect impacts 1. Eradicate extreme poverty and hunger
• Damage to housing, service infrastructure, savings, productive assets, and human losses reduce livelihood sustainability.
• Negative macroeconomic impacts including severe short-term fiscal impacts and wider, longer-term impacts on growth, development and poverty reduction.
• Forced sale of productive assets by vulnerable households pushes many into long-term poverty and increases inequality.
2. Achieve universal primary education
• Damage to education infrastructure.
• Population displacement interrupts schooling.
• Increased need for child labour for household work, especially for girls.
• Reduced household assets make schooling less affordable, girls probably affected most.
3. Promote gender equality and empower women
• As men migrate to seek alternative work, women/girls bear an increased burden of care.
• Women often bear the brunt of distress 'coping' strategies, e.g. by reducing food intake.
• Emergency programmes may reinforce power structures that marginalise women.
• Domestic and sexual violence may increase in the wake of a disaster.
4. Reduce child mortality
• Children are often most at risk, e.g. of drowning in floods.
• Damage to health and water & sanitation infrastructure.
• Injury and illness from disaster weaken children’s immune systems.
• Increased responsibilities and workloads create stress tor surviving mothers.
• Household asset depletion makes clean water, food and medicine less affordable.
5. Improve maternal health
• Pregnant woman are often at risk of death/injury in disasters.
• Damage to health infrastructure. • Injury and illness from disaster can
weaken women’s health.
• Increased responsibilities and workloads create stress for surviving mothers.
• Household asset depletion makes clean water, food and medicine less affordable.
6. Combat HIV/AIDS, malaria and other diseases
• Poor health and nutrition following disasters weaken the population’s immunity.
• Damage to health infrastructure. • Increased respiratory diseases
associated with damp, dust and air.
• Increased risk from communicative and vector-borne diseases, e.g. malaria and diarrhoeal diseases following floods.
• Impoverishment and displacement following disaster can increase exposure to disease, including HIV/AIDS, and disrupt health care.
7. Ensure environmental sustainability
• Damage to key environmental resources and exacerbation of soil erosion or deforestation.
• Damage to water management and other urban infrastructure.
• Slum dwellers/people in temporary settlements often heavily affected.
• Disaster-induced migration to urban areas and damage to urban infrastructure increase the number of slum dwellers without access to basic services and exacerbate poverty.
121
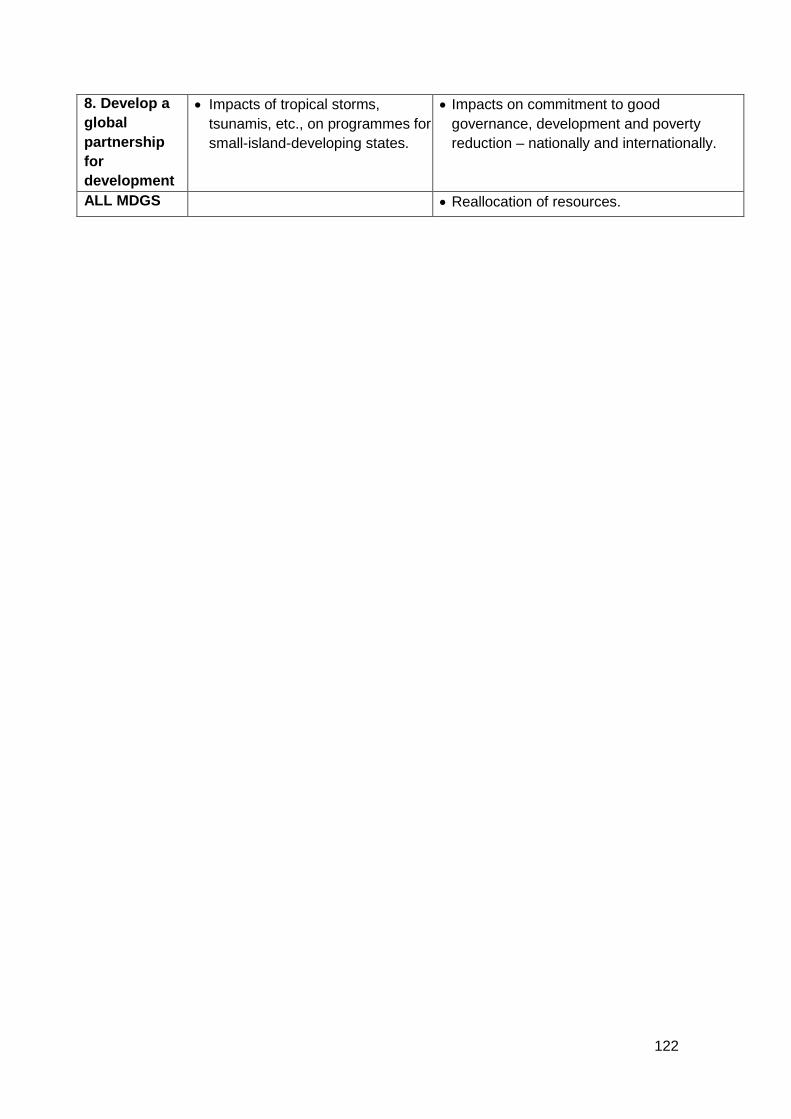
8. Develop a global partnership for development
• Impacts of tropical storms, tsunamis, etc., on programmes for small-island-developing states.
• Impacts on commitment to good governance, development and poverty reduction – nationally and internationally.
ALL MDGS • Reallocation of resources.
122
CHAPTER 5: THEORY OF GEOGRAPHIC INFORMATION SYSTEMS (GIS)
5.1 INTRODUCTION
From the available literature it is evident that a substantial amount of attention is given to
the use of geographic information systems (GIS) in disaster management (Thomas et al.,
2003; Reitsma, 2004; Longley et al., 2005; MacFarlane, 2005; Van Vuuren, 2006; NRC,
2007; Goodchild, 2009; Jansen van Vuuren, 2013; Metzger & Robert, 2014). Extreme
events become topics for research and documentation of the use of geo-information
technology, specifically in respect of response. One such example is Thomas et al. (2003)
who described the use of spatial data and geographic technologies in response to the
September 11 attack on the World Trade Center in New York. Driven by the magnitude of
Hurricane Katrina’s impact in 2005, the US National Research Commission evaluated the
use of geospatial data and tools in emergency management and made recommendations
to improve the use thereof (NRC, 2007). Baldwin (2010) documented the use of GIS in
city, state and federal agencies during the response and recovery efforts of the same
event, and made special reference to the role of participatory GIS (PPGIS) and
partnerships from the disaster response community. Guidelines are developed for the
application of GIS that can be used by managers and end-users in the civil protection
environment (MacFarlane, 2005). Research on the development of models and
frameworks is reflected in dissertations and journals, for example those of Reitsma (2004)
and Jansen van Vuuren (2013). Seeing that the application field of GIS is growing and
society is becoming more spatially enabled (Schmitz, 2008) as a result of technological
advances such as the worldwide streaming of remotely sensed images of Earth by
Google Earth™ (NRC, 2007), an understanding of the theoretical underpinnings of GIS is
important – especially as this will guide the development of a GIS data model as
proposed in this thesis.
The relevance of a focus on information – and on GIS in particular – is rooted in the fact
that those involved in development planning, environmental management and disaster
risk management activities have a need for information, most of which has spatial
connotations (Longley et al., 2005; MacFarlane, 2005; Goodchild & Glennon, 2010). The
need for information is the key driver behind the development and implementation of GIS
(MacFarlane, 2005:7). However, the demand for information is often met only partially
when it is most needed, with negative effects in respect of outcomes and decision
123
making. This problem is illustrated by a comment made by a local authority Chief
Executive in speaking about the Lockerbie disaster in 1988: “The quality of the response
is only as effective as the reliability of the information which is available” (quoted by
MacFarlane, 2005:7).
Although the processing of data – from its initial collection to the production of maps –
receives much attention, there is far more to GIS than just the production of maps
(Jansen van Vuuren, 2013). This premise requires the examining of the deeper context of
GIS to establish a deeper understanding of what GIS is, and why it has experienced
“explosive growth” and “pervasive spread throughout the sciences”, as stated by
Blaschke, Strobl and Donert (2011:140).
Michael F. Goodchild is one of the great exponents of GIS science and has played a key
role in establishing the foundations of this new research field (Raper, 2000; Mark, 2003;
Kavouras & Kokla, 2008; Blaschke & Merschdorf, 2014). Following his work, a variety of
scholars have since published in books and journals, and delivered conference papers, as
will be shown through references in this chapter. The growth and interest in GIS science
is acknowledged on an academic level by Blaschke et al. (2011), who argue for the
establishment of more structured education and training in GIS science at a doctoral level.
The dependency on GIS in the social sciences is evident (Anselin, 1999; Janelle &
Goodchild, 2011). Since the need for a deeper scientific understanding was briefly
described above, this chapter begins with an overview of GIS history, and further explains
the context of GIS within the domain of information systems. The theoretical background
of GIS, with specific focus on the development of a GIS science, provides a background
for the description of fundamental GIS concepts and GIS functions. In its totality, Chapter
5 provides an important background to the development of a GIS data model, as will be
described in Chapter 8.
5.2 AN OVERVIEW OF GIS HISTORY
GIS started off as a computer-based technology and a modern extension of traditional
(analogue) cartography (Longley et al., 2005; Morais, 2012). In November 1962, Roger
F. Tomlinson submitted a report entitled An introduction to the use of electronic
computers in the storage, compilation and assessment of natural and economic data for
the evaluation of marginal lands (Tomlinson, 1962) to the National Land Capability
Inventory Seminar held under the direction of the Agricultural Rehabilitation and
124
Development Administration of the Canadian Department of Agriculture. Considering the
capability of computers to store, compile and assess soil survey data to assess and
evaluate marginal agricultural lands, he concluded that “computers have a definite
capability that may be applied to the immediate tasks of the Agricultural Rehabilitation and
Development Administration.” He further proposed “that this capability should be
thoroughly investigated in relation to the specific data available for the study concerned
and with direct application to the assessments that have to be made” (Tomlinson, 1962).
In 1963 Tomlinson produced a follow-up report entitled Feasibility Report of Computer
Mapping System which specifies a series of maps that can be captured in a digital form
for the Canadian Land Inventory project. The report suggested four types of transcription
devices for data capturing, i.e. tracing (by hand), optical tracing, line following and
scanning devices. It also specified data file organisation as a critical factor in the system,
and a coordinate system to reference all common data in the system. Lastly, it identified
tabular and graphic outputs (Tomlinson, 1963). Conforming to the components of an
information system, Tomlinson prepared the specifications for a ‘geographic information
system’, although this term would only be used for the first time a few years later.
Implementation of the system, named the Canada Geographic Information System
(CGIS), began in 1965 and was completed in 1967. In his publication, An Introduction to
the Geo-Information System of the Canada Land Inventory, Tomlinson (1967) gave an
overview of the development and implementation of the system and for the first time used
the term ‘geographic information system’. In his conclusion he prophetically stated that
“[t]he system can be of inestimable value to a country such as Canada in providing a
sound basis on which decisions on planning and development of resources can be made,
particularly in the context of regional rehabilitation and project planning. The system is
basic to a geographical understanding of the country and has application in any nation
where the developing economy is concerned with the natural resources” (Tomlinson,
1967:21).
Parallel developments in this direction occurred in North America, Europe and Australia
(Longley et al., 2005:16). In the late 1960s the US Bureau of the Census developed the
Dual Independent Map Encoding System, and created a digital record of all streets in the
US as a tool for the purposes of the 1970 population census. Further development by the
Harvard University’s Laboratory for Computer Graphics and Spatial Analysis led to the
development of a general-purpose GIS – the ODYSSEY GIS of the late 1970s. During
the same time, the UK Experimental Cartography Unit (ECU) developed high-quality
125
computer mapping and published the world’s first computer-made regular map series, in
cooperation with the British Geological Survey. The ECU also pioneered GIS work in
education. Government departments in the US, the UK and France, including the military,
began to investigate the use of computers to support the production and editing of maps,
in order to avoid the expensive and slow process of hand correction and redrafting.
Nevertheless, the Canada Geographic Information System (CGIS), as described above, is
lauded as the first real GIS (Longley et al., 2005:16-18).
Notwithstanding a massive effort by federal and provincial governments in Canada,
CGIS’s main success was the measurement of area, and the production of tabular
information. From the 1980s onwards, however, GIS technology has shown rapid growth,
with strong development as a spatial analysis and modelling tool (Gatrell, 1991:119). GIS
also expanded into various modern technologies, notably the internet (Goodchild, 2009).
Coppock and Rhind (1991) provide a detailed overview of the history of GIS and classify
developments in four overlapping phases. The first is the period between the 1950s to
about 1975, earmarked by research and pioneering work in North America and Europe.
From 1973 to the early 1980s, formal experiment and government-funded research was
the norm, with less innovation by individuals. With the release of ArcInfo as the first major
commercial GIS software in 1981 (Longley et al., 2005:19), a rapidly growing commercial
phase took off, marked by strong competition among vendors. The fourth phase saw the
emergence of a strong GIS user base that required systems with more efficient and
speedy handling capabilities of large quantities of geographical data (Coppock & Rhind,
1991:39). GIS developed into a technology that is distinguished from other spatial data-
handling activity by virtue of its spatial analysis capability (Goodchild, 1987:327).
Tomlinson (1967) introduced his report by referring to the concept of information
systems, and was clear about his intention to associate with the emerging computer-
based information systems technology. Half a century later GIS has developed into an
industry with more than a million core users, five million casual users (Longley et al.,
2005:21), and a multi-disciplinary research field (Blaschke & Merschdorf, 2014:196). The
association of GIS with information systems theory is further described in the next
section.
5.3 THE CONTEXT OF GIS AS AN INFORMATION SYSTEM
An information system is “an arrangement of people, data, processes, and information
technology that interact to collect, process, store and provide as output the information
126
needed to support an organisation” (Bentley & Whitten, 2007:6). Palmius (2005) sees an
information system as all within an organisation that contributes to the distribution of
information. This includes ‘nodes’ of information storage, ‘channels’ of distributing
information, and ‘users’ (actors) that act and re-act upon that information. By including
the human component, Palmius’ definition of an information system is characterised as “a
human activity system … engaged in the function of the organisation, its people and its
technological artifacts”. The terms information and system define the context within which
the target area information systems is further clarified.
To define the meaning of information, the difference between ‘information’ and ‘data’ must
first be clarified, as these terms are sometimes used interchangeably. Classically, ‘data’
is stated as having the meaning ‘raw facts’, which indicates that the facts are unorganised
and have not been processed to reveal real meaning (Rob & Coronel, 2009:5).
‘Information’ is the result of processing raw data to reveal its meaning (Rob & Coronel,
2009:6). The activity of processing data into information relates to the meaning of
‘system’, which Bentley and Whitten (2007:6) describe as “a group of interrelated
components that function together to achieve a desired result”. Alexander (2002) and
Palmius (2005) next provide a more in-depth analysis of ‘data’ and ‘information’.
5.3.1 Data
Alexander (2002:61) identifies three aspects of data that correspond with the ontologies of
realism, nominalism and social reality, and that emphasise different roles of data, i.e.
i. Record “objective facts which will be understood in exactly the same way by
everyone”
ii. Record “absolutely any type of concept, with no guarantees as to its accuracy
or validity, which will be interpreted in all sorts of different ways by individuals”
iii. “Use agreed structures and conventions for representing information,
recording it and transmitting it, all in order to communicate it”
The objective view of data assumes that data is explicit, recorded from measurable
events or objects, and is factual as a result. In this view, data can be true to reality if
measured and recorded accurately (Alexander, 2002:61). An example would be the
demographics of a region.
The subjective view of data assumes that data is not necessarily true or accurate since
not all errors can be detected, or it consists of subjective opinion that cannot be measured
127
and does not constitute facts (Alexander, 2002:62). An example would be the results
from interviews conducted with individuals after a disaster event.
The third view of data, the intersubjective point of view, focuses on communication and
assumes the following (Alexander, 2002:63):
i. Data is extracted from information, in other words, the information exists
before the data is created.
ii. Data must be recorded in a formalised structure. Knowledge of this structure
must be shared as prior shared meaning.
iii. Data is represented using agreed characters, codes, syntax and structure.
Knowledge of these properties by all actors is a prerequisite for all to be able
to use and decode the data.
iv. The data stands in relation to context and a history. The capture of data
supposes a pre-defined purpose.
An example of this view would be data collected during a rapid impact assessment after a
disaster event, which is based on the event (historical context) and focused on immediate
assessments and communication of data for further relief and reconstruction purposes
(refer to Jansen van Vuuren, 2014).
5.3.2 Information
In order to define ‘information’, Palmius (2005) identifies a number of concepts that are
related to (but not the same thing as) information in order to obtain a deeper
understanding of the term:
i. Data: As per the previous definition, data is a key concept, without which
information cannot exist. Whereas data is tangible (measurable), information
is not. Information is generated from data, and carries meaning. This notion is
further related to the next concept of human understanding.
ii. Human understanding: Information contains some form of meaning that is
humanly attributed. This characteristic is the main attribute that differentiates
information from data. Human understanding implies concepts of
interpretation and pre-understanding, which are expanded into knowledge and
experience (wisdom) (refer to Figure 5.1). The latter further relate to the
concept of cognition, as described in Section 4.3.3.
128
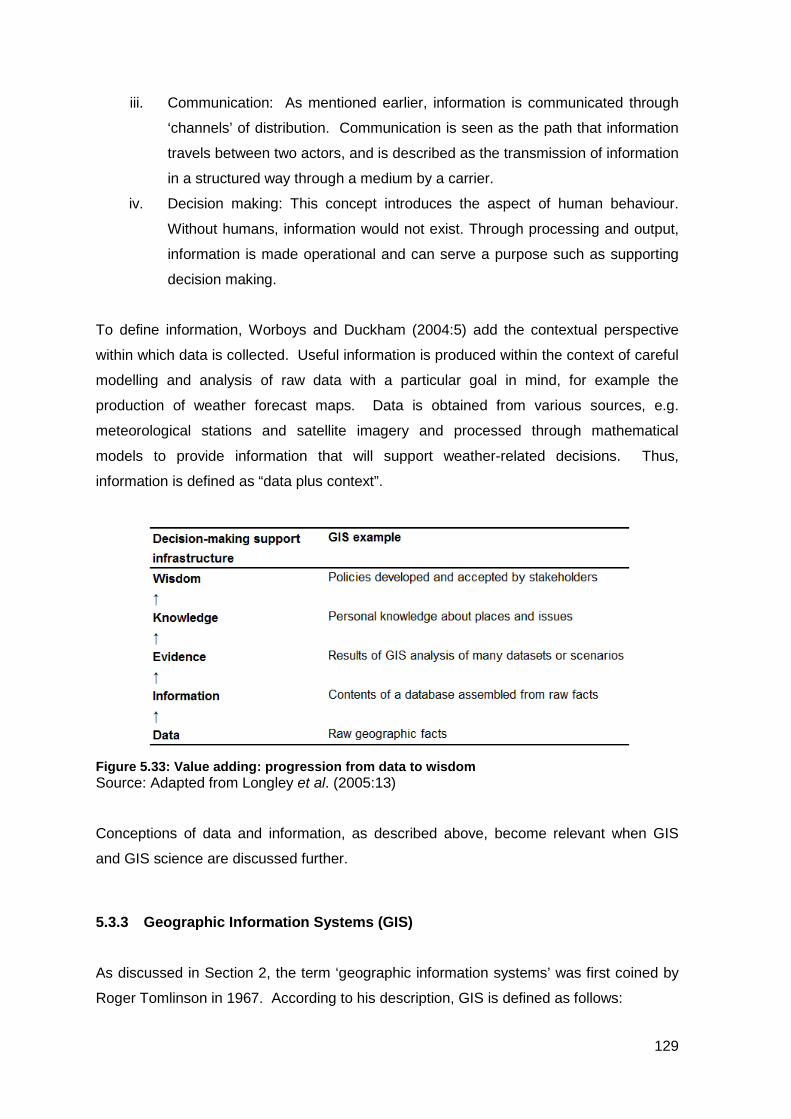
iii. Communication: As mentioned earlier, information is communicated through
‘channels’ of distribution. Communication is seen as the path that information
travels between two actors, and is described as the transmission of information
in a structured way through a medium by a carrier.
iv. Decision making: This concept introduces the aspect of human behaviour.
Without humans, information would not exist. Through processing and output,
information is made operational and can serve a purpose such as supporting
decision making.
To define information, Worboys and Duckham (2004:5) add the contextual perspective
within which data is collected. Useful information is produced within the context of careful
modelling and analysis of raw data with a particular goal in mind, for example the
production of weather forecast maps. Data is obtained from various sources, e.g.
meteorological stations and satellite imagery and processed through mathematical
models to provide information that will support weather-related decisions. Thus,
information is defined as “data plus context”.
Figure 5.33: Value adding: progression from data to wisdom Source: Adapted from Longley et al. (2005:13)
Conceptions of data and information, as described above, become relevant when GIS
and GIS science are discussed further.
5.3.3 Geographic Information Systems (GIS)
As discussed in Section 2, the term ‘geographic information systems’ was first coined by
Roger Tomlinson in 1967. According to his description, GIS is defined as follows:
129
“A system whereby the map and related data could be stored in a form
suitable for processing by a computer, which is also a computer- oriented
system capable of rapid measurement and comparison of the data, is
clearly desirable” (Tomlinson, 1967:2).
By examining Tomlinson’s previous reports in motivation for the Canada Land Inventory
System, it becomes clear that the initial focus was on the capturing of existing hard copy
maps into a digital format by using different hardware devices. As technology grew,
various definitions developed, to the effect that a precise definition of a GIS does not exist
(Grimshaw, 1996:547; Harvey, 2008:262).
In discussing a taxonomy of GIS, Grimshaw (1996) highlights different perspectives on
the definition of GIS in literature and cites the definition from the UK-based Chorley
Report of 1987 as the most widely used definition at that time:
“A system for capturing, storing, checking, manipulating, analysing, and
displaying data which are spatially referenced to the Earth” (Grimshaw,
1996:547)
This definition is criticised for placing undue emphasis on geographic data, stating that
“GIS is simply an information system where the data have a geographical dimension.”
Grimshaw examines GIS in relationship to other information systems such as computer-
aided design (CAD); cadastral or land information systems; automated mapping and
facilities management (AM/FM); global positioning systems (GPS); spatial information
systems; geo-data systems; and remote sensing, which all have a geo-spatial
connotation. He also includes database management systems (DBMS) and transaction-
processing systems that are non-spatial.
The diagram in Figure 5.2 depicts a matrix with two variables; a spatial data component,
and a non-spatial (attribute data) component. These are placed on two axes indicating
increasing intensity from the origin. GIS is placed in the segment where both components
indicate a high ranking, whereas other systems are high in either the spatial or the
attribute category. An interpretation of the matrix returns two observations: first, GIS is a
subset of the Information Systems domain. Second, a system with the ability to handle
intense amounts of both spatial and attribute data, would qualify as a GIS. In this sense
GIS is strongly associated with software capabilities. In his paper, Grimshaw (1996:548)
quotes his own definition as follows:
130
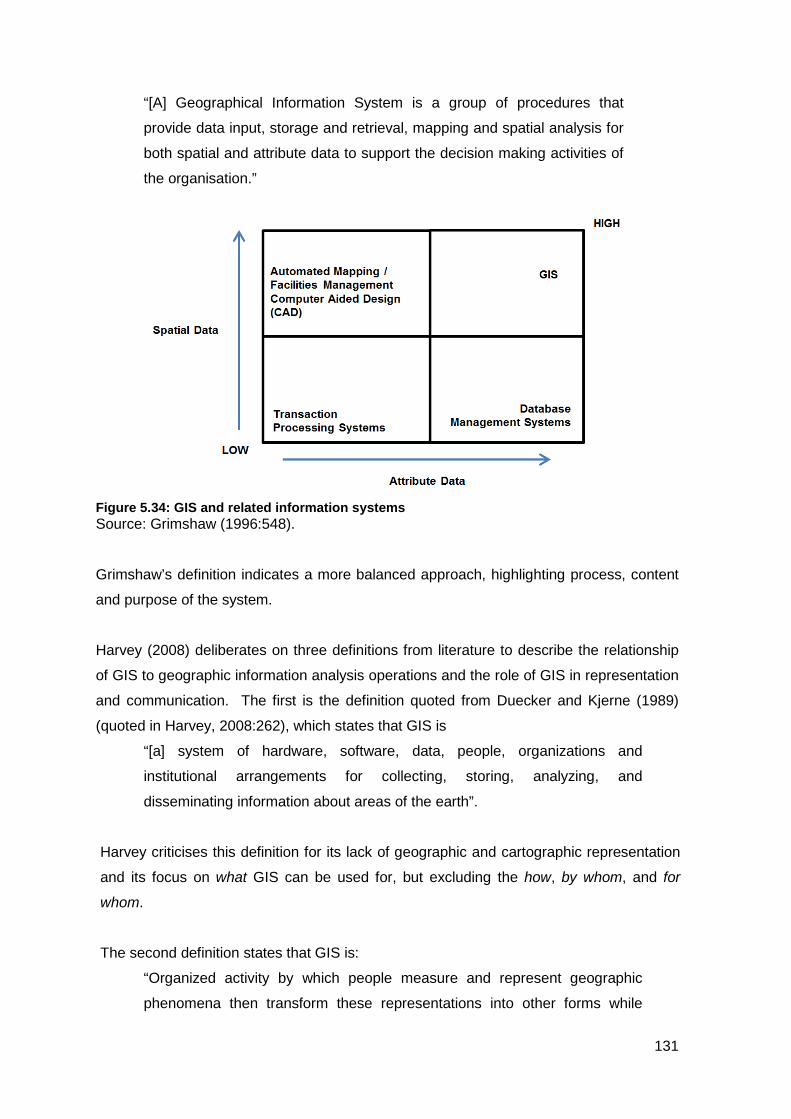
“[A] Geographical Information System is a group of procedures that
provide data input, storage and retrieval, mapping and spatial analysis for
both spatial and attribute data to support the decision making activities of
the organisation.”
Figure 5.34: GIS and related information systems Source: Grimshaw (1996:548).
Grimshaw’s definition indicates a more balanced approach, highlighting process, content
and purpose of the system.
Harvey (2008) deliberates on three definitions from literature to describe the relationship
of GIS to geographic information analysis operations and the role of GIS in representation
and communication. The first is the definition quoted from Duecker and Kjerne (1989)
(quoted in Harvey, 2008:262), which states that GIS is
“[a] system of hardware, software, data, people, organizations and
institutional arrangements for collecting, storing, analyzing, and
disseminating information about areas of the earth”.
Harvey criticises this definition for its lack of geographic and cartographic representation
and its focus on what GIS can be used for, but excluding the how, by whom, and for
whom.
The second definition states that GIS is:
“Organized activity by which people measure and represent geographic
phenomena then transform these representations into other forms while
131
interacting with social structures” (Chrisman, 1999, quoted in Harvey,
2008:263).
This definition is formulated in reaction to the previous one by Duecker and Kjerne, and
focuses on the activities of measuring and representing in the context of social structures.
Chrisman’s definition addresses the “for whom” and how GIS is used. The aspect of data
processing (transformations) points to GIS operations that are commonly used, taking
into account the goals of GIS.
The third definition is quoted from an internet source by Harvey (http://www.-
extension.umn.edu/distribution/naturalresources/components/DD6097ag.html), which
states that GIS is a
“[s]ystem of computer hardware, software, and procedures designed to support the
compiling, storing, retrieving, analyzing, and display of spatially referenced data for
addressing planning and management problems. In addition to these technical
components, a complete GIS must also include a focus on people, organizations,
and standards” (in Harvey, 2008:264).
This definition combines the previous two into one, and includes the general purpose of
GIS. It takes the emphasis away from technology and includes a focus on people. An
interesting characteristic is the inclusion of standards, which points to interoperability
between different systems.
A synthesis of GIS definitions highlights the geographical component, which points to the
special characteristics of spatial data (Grimshaw, 1996:548; Longley et al., 2005:8). It
further highlights the value added to data, progressing from conceptualisations of reality
(data) to information, knowledge and even wisdom, as illustrated by Longley et al.
(2005:13) (refer to Figure 5.2 above). Lastly, it highlights a particular goal of GIS, as it
functions in a particular domain. Since its inception in the environmental field (Tomlinson,
1962), GIS has been adopted slowly in many other fields, specifically the social sciences
(Anselin, 1992; 1999).
One of the major advances in GIS is the emergence of a geographic information science,
which was basically non-existent until the end of the 1980s. In 1987, Michael Goodchild
wrote that at that time academic focus was on technical issues, with no supporting theory:
"To some, this may be interpreted as indicative of the lack of significance of the field as a
whole; to others, it is more a matter of the field's novelty, as theory and philosophy
132
traditionally lag behind basic research activity" (Goodchild, 1987:327). How this situation
came to be changed, is discussed further in the next section.
5.4 GEOGRAPHIC INFORMATION SCIENCE
Geographic information science (GISc, or GIScience) is a new field of study that has
emerged from an awareness and observation that there is more to GIS than the mere
application of software (Goodchild, 1999; Raper, 2000). This section gives an overview of
the emergence of a GIScience by starting with earlier debates on the issue and looking at
the questions: What is GIScience? What are the fundamental geographical concepts?
5.4.1 The “GIS as a science” debate
During the 1990s, lively debates around GIS as a ‘tool’ or a ‘science’ arose from
uncertainties around what was meant by ‘doing GIS’ (Wright, Goodchild & Proctor, 1997).
In their article, Demystifying the Persistent Ambiguity of GIS as ‘Tool’ versus ‘Science’,
Wright et al. take the position that the science of GIS provides a sufficient condition for
science. At the time ‘doing GIS’ seemed to be simply nothing more than interacting with a
particular class of software. The ‘GIS community’ was seen as no more than a group of
individuals with an interest in GIS software, and ‘GIS research’ seemed an oxymoron
(Wright et al., 1997:346).
The question, ‘does it matter if GIS is a science or not?’, first received attention from
Wright et al. (1997) and more than a decade later from Reitsma (2013). Wright and
colleagues concluded that the two positions of GIS as a tool or a science constituted an
oversimplification of the problem and suggested that it be viewed as a continuum from
tool to science. They focused on the meaning of ‘doing GIS’ rather than ‘GIS’ alone and
identified three positions: (1) GIS as a tool; (2) GIS as tool making; and (3) the science of
GIS.
‘GIS as a tool’ is seen as the use of a particular software platform and associated
hardware tools such as digitisers, scanners and GPS devices that are used to create
digital data. The tool itself is inherently neutral. Being technology driven, its development
is largely independent of its use. As such, the tool does not drive the research (Wright et
al., 1997:353). ‘Tool making’ refers to an academic setting that is concerned with
advancing the tool’s capabilities and ease of use through education, thus ensuring its
133
responsible use. The ‘science-of-GIS’ approach involves research on a set of basic
problems that exist independently from GIS as technology and that become relevant
because of the technology (i.e. the modelling of geographical space).
According to Wright et al. (1997:354), GIS is widely viewed as a subset of geographical
science. Just as development of the digital computer has led to the discipline of computer
science, it may also have lead to the development of the discipline of geographic
information science (GISc).
Femke Reitsma approaches the question about GIS as a science by reflecting on certain
criteria to be met by a science such as simplicity, predictive accuracy, the ability to give
rise to successor theories as new experimental evidence (fertility), coherence, unified
theory, and testability. Taking a cautious approach as to how science is defined, she
concludes that GIScience can indeed be considered a science. What makes it different
from other sciences is the fact that the GISc practitioner does not study the world, but
rather the representations of that world (Reitsma, 2013:219).
5.4.2 What is geographic6 information science?
Geographic information science emerged as the study of applied research issues
involving geospatial information (Montello, 2005:61). It is a multi-disciplinary field with its
foundations in geography, cartography, surveying, mathematics and computer science
(Raper, 2000:4). It emerged as a science concerned with the handling of data, and the
analysis and modelling thereof (Mark, 2000; Timf, 2003; Blaschke, 2011, 2012). The
impetus for the development of GIS theory was the landmark paper by Michael Goodchild
(1992) in which the term ‘geographical information science’ was first introduced. It
developed as a research field that investigates scientific questions about geographic
information and GIS (Montello, 2009:1825). Reflecting on all the developments in the GIS
field over three decades, including research and training, Goodchild (1992) concludes that
there ought to be more to it than just enthusiasm and excitement. With the focus on the
unique characteristics and modelling of spatial data, he claims that the underlying
technical problems of GIS were largely solved at that time, and that attention has moved
“from primitive algorithms and data structures to the much more complex problems of
6 The terms ‘geographic’ and ‘geographical’ are used interchangeably to denote the ‘g’ in ‘GIS’; for example, Goodchild refers to ‘geographical’ and Montello to ‘geographic’ when writing about GIScience. Since it has the same meaning in each case, a decision was made to use the term ‘geographic’ in this thesis.
134
database design, and the issues surrounding the use of GIS technology in real
applications” (Goodchild, 1992:33). The key issues representing substantial scientific
questions relate to the following aspects of geo-spatial data management:
i. Data collection and measurement: An understanding of complex structures of
spatial dependence and the nature of spatial variation, which relate to aspects
of generalisation, abstraction and approximation associated with data
collection, compilation and interpretation.
ii. Data modelling and theories of spatial data: Frameworks that are used to
represent geographical variation in digital databases.
iii. Data structures, algorithms and processes: Various breakthroughs with regard
to internal representations of data and the algorithms that operate on them
were achieved. Whereas generic problems have been solved, for example the
modelling of terrain by means of Triangular Irregular Network (TIN), more
advanced methods to distinguish landforms (mountains, plains, valleys, etc.)
may add intelligence to data structures.
iv. Display: The relationship between geo-spatial objects stored in a database
and their display on a map requires more attention. This includes advances
such as animated displays, three-dimensional display, and multimedia.
v. Spatial analysis: A host of geometrical operations have been developed and
are included as standard algorithms in GIS software. However, some loosely
coupled analysis modules (functioning outside of the standard software
interface) lack integration structures such as topology, object identity and
metadata.
Goodchild (1992) provides a framework for the expanding of GIScience into a wider
research agenda, particularly in the field of data modelling. With regard to technological
advances, it must be appreciated that, at that time, most GIS software was functioning on
mainframe computers, Unix workstations and in a Disk Operating System (DOS)
environment on IBM compatible personal computers.
Goodchild (1992) did not provide a definition for GIScience, but rather outlined the scope
of the field as indicated above. In December 1994, a group of academics met to establish
an organisation – the University Consortium for Geographic Information Science (UCGIS)
– to represent the GIS research community. A full definition of GIScience was
subsequently formulated at a workshop in January 1999 (Mark, 2003:3). In an article,
Geographic Information Science: Critical Issues in an Emerging Cross-Disciplinary
135

Research Domain, David Mark highlighted the research agenda for GIScience and
provided the following definition:
"Geographic Information Science (GIScience) is the basic research field that
seeks to redefine geographic concepts and their use in the context of geographic
information systems. GIScience also examines the impacts of GIS on individuals
and society, and the influences of society on GIS. GIScience re-examines some of
the most fundamental themes in traditional spatially oriented fields such as
geography, cartography, and geodesy, while incorporating more recent
developments in cognitive and information science. It also overlaps with and
draws from more specialized research fields such as computer science, statistics,
mathematics, and psychology, and contributes to progress in those fields. It
supports research in political science and anthropology, and draws on those fields
in studies of geographic information and society" (Mark, 2000:51).
Mark (2000) distinguishes two distinct, but deeply interconnected research areas:
Geographic Information Science research, and research using Geographic Information
Systems. The latter sees GIS as a tool to conduct scientific research, supporting both
inductive and deductive approaches. Like statistical packages, GIS software is used both
within and outside the research community. GIScience research, on the other hand, is
the basic research field that seeks to redefine geographic concepts and their use in the
context of geographic information systems, and that seeks to provide a theoretical
foundation for GIS. It addresses complex problems that require multidisciplinary
solutions, a topic that was explored extensively by Thomas Blaschke and his fellow
researchers in Salzburg, Austria (Blaschke et al., 2011; Blaschke & Merschdorf, 2014).
Reflecting many of the key issues identified by Goodchild (1992), the challenges that
motivate research are summarised by Mark (2000) as follows:
i. Representation: Finding ways to express the spatio-temporal continuum of the
geographical world in the discrete code of a digital computer.
ii. Uncertainty: Geospatial data include uncertainty that stems from measurement
error; errors due to imperfect interpolation between measurements gaps in the
data (incomplete data); artifacts of graphic or digital processing, and human
error. This affects the way in which the real world is represented. Research
can find ways in which the differences between GIS-based representation and
real world phenomena can be modelled.
iii. Cognition: Cognitive representation of real-world phenomena through
processes of symbolisation, abstraction, and generalisation on maps are fused
136
with the judgement of human operators. The challenge is to achieve better
transitions between cognitive and computational representations and the
manipulations of geographic information.
iv. Simulation: The simulation of geographic phenomena provides a way to
understand geographic processes. Through research, improved simulations of
geographic phenomena that are indistinguishable from their real counterparts
can be created on a GIS platform.
Having established the foundation for GIScience in 1992, Michael Goodchild continued to
reflect on its growth and highlighted various conceptualisations of GIScience in various
publications. He emphasised process (Goodchild, 2004), stating that GIS remains poorly
equipped to handle dynamic data, and warned that the persistent use of the ‘map’
metaphor to conceptualise GIS resulted in a focus on static data (also an observation by
Jansen van Vuuren, 2013). This caused problems with regard to modelling changes over
time, and simulated the actions of physical and social processes. He subsequently
reflected on significant discoveries in GIScience – discoveries being a characteristic of
science (Goodchild, 2009) – which included theories of representation that postulate the
ways in which humans conceive of the geographic world around them. The
conceptualisations of discrete objects, continuous fields and the geo-atom as geographic
abstraction are some of the discoveries that will receive more attention in this thesis. In
2010, reflecting on two decades of development, Goodchild acknowledges the
contributions of other researchers, introducing concepts such as fuzzy data (Burrough &
Frank, 1995).
Raper (2000:4) highlights the developing nature of the field and proposes a more holistic
understanding that is based on the view of GIScience as both the process and product of
representation. This approach goes beyond the traditional cartographic perspective of
GIS and is concerned with human cognition of geo-spatial objects and the flow of
information.
5.5 FUNDAMENTAL GEOGRAPHIC CONCEPTS OF GISCIENCE
One of the most fundamental questions about GIScience is how we conceptualise
geographic reality and how the formed conceptions represent the world as well as our
knowledge of that world (Kavouras & Kokla, 2007:3). The schema in Figure 5.3 below
reminds of the fact that knowledge comes from information, which in turn is created from
137
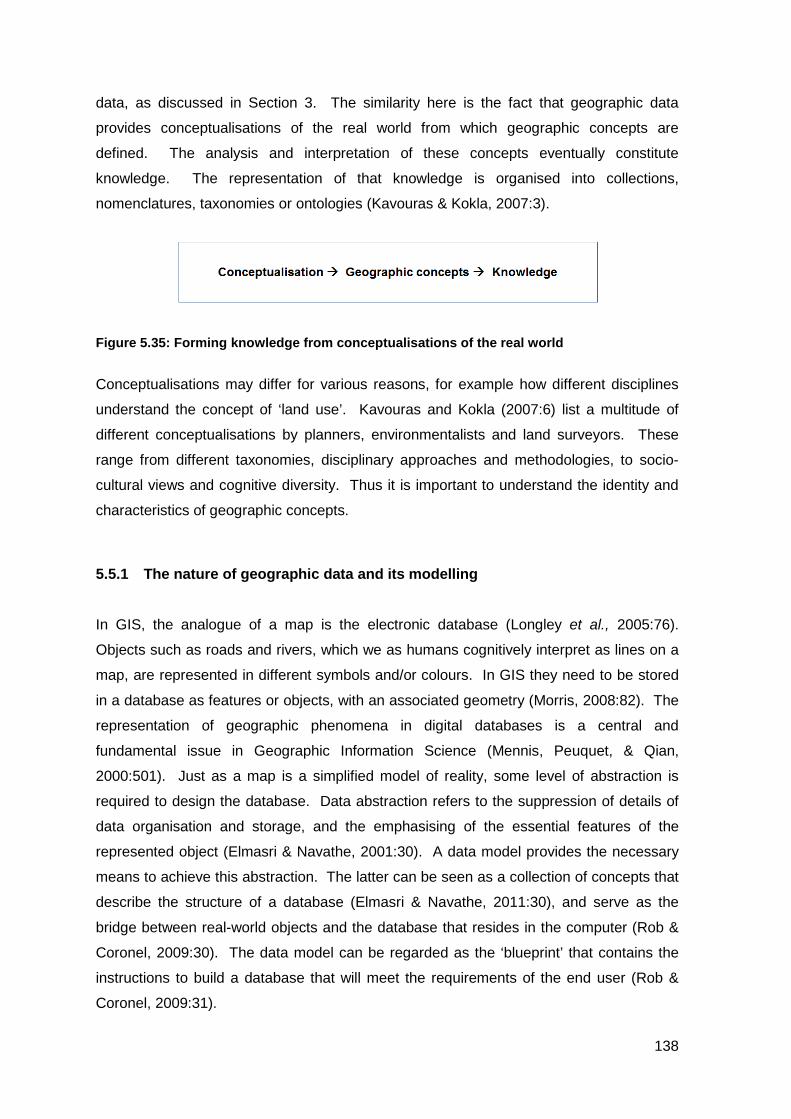
data, as discussed in Section 3. The similarity here is the fact that geographic data
provides conceptualisations of the real world from which geographic concepts are
defined. The analysis and interpretation of these concepts eventually constitute
knowledge. The representation of that knowledge is organised into collections,
nomenclatures, taxonomies or ontologies (Kavouras & Kokla, 2007:3).
Figure 5.35: Forming knowledge from conceptualisations of the real world
Conceptualisations may differ for various reasons, for example how different disciplines
understand the concept of ‘land use’. Kavouras and Kokla (2007:6) list a multitude of
different conceptualisations by planners, environmentalists and land surveyors. These
range from different taxonomies, disciplinary approaches and methodologies, to socio-
cultural views and cognitive diversity. Thus it is important to understand the identity and
characteristics of geographic concepts.
5.5.1 The nature of geographic data and its modelling
In GIS, the analogue of a map is the electronic database (Longley et al., 2005:76).
Objects such as roads and rivers, which we as humans cognitively interpret as lines on a
map, are represented in different symbols and/or colours. In GIS they need to be stored
in a database as features or objects, with an associated geometry (Morris, 2008:82). The
representation of geographic phenomena in digital databases is a central and
fundamental issue in Geographic Information Science (Mennis, Peuquet, & Qian,
2000:501). Just as a map is a simplified model of reality, some level of abstraction is
required to design the database. Data abstraction refers to the suppression of details of
data organisation and storage, and the emphasising of the essential features of the
represented object (Elmasri & Navathe, 2001:30). A data model provides the necessary
means to achieve this abstraction. The latter can be seen as a collection of concepts that
describe the structure of a database (Elmasri & Navathe, 2011:30), and serve as the
bridge between real-world objects and the database that resides in the computer (Rob &
Coronel, 2009:30). The data model can be regarded as the ‘blueprint’ that contains the
instructions to build a database that will meet the requirements of the end user (Rob &
Coronel, 2009:31).
138
Geographic data requires a scientific understanding of the key geographic characteristics
of real-world systems. This includes the state of objects, their behaviour, and the
relationships between them (Longley et al., 2003:196), which is an imperative for
endowing spatial analysis capabilities in GIS (Gatrell, 1991:119). With reference to the
geographic information model as described by Jansen van Vuuren (2013:4), a further
understanding of how this relates to the goals and tasks of the GIS application is required,
since the choice of the type of data model determines how that data can be represented
and which operations can be performed. In this regard, the relationship between data,
GIS operations, tasks and goals is important. The choice of data model is determined by
factors such as the format in which existing data is presented, the time and effort required
to convert data if necessary, and the nature of the geographic features involved. Longley
et al. (2003:196) distinguish between rich and simple feature models. An example of a
rich type is a water distribution network that consists of a collection of pipes, valves,
meters and pumps, which are related to each other in a unique configuration to establish
a network. The implementation and operation of the network (object class) is dependent
on the functioning of each component (object).
The role of data modelling is to represent the key aspects of the real world in a structured
spatial database for management, analysis and display purposes. Due to the complexity
of the real world, geographical units must be abstracted, generalised or approximated in
the process of creating the database (Goodchild, 1992b:401). Data models are based on
two main conceptualisations of geographical reality (Goodchild, 1992a:405): as infinite
sets of tuples approximated by regions and segments and referred to as fields, and as
planes scattered with independent objects, referred to as discrete objects. These are
outlined below.
5.5.1.1 Fields
According to Goodchild (1992b:402), the fundamental element of geographical reality can
be defined as a tuple
T= <x, y, z1, z2, …, zn>,
where (x,y) represents location, and (z) a set of variables with descriptive values of that
location. By adding a vertical dimension (h), and a time component (t), the tuple can be
extended to
T= <x, y, h, t, z1, z2, …, zn>.
139
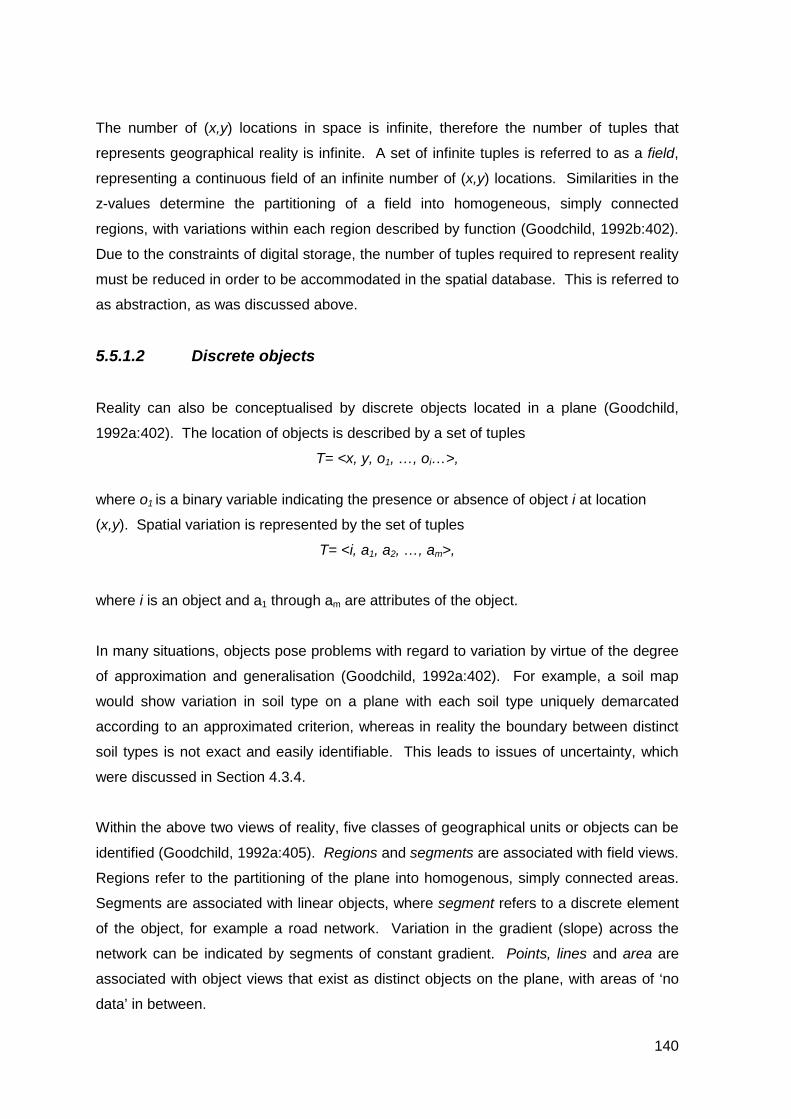
The number of (x,y) locations in space is infinite, therefore the number of tuples that
represents geographical reality is infinite. A set of infinite tuples is referred to as a field,
representing a continuous field of an infinite number of (x,y) locations. Similarities in the
z-values determine the partitioning of a field into homogeneous, simply connected
regions, with variations within each region described by function (Goodchild, 1992b:402).
Due to the constraints of digital storage, the number of tuples required to represent reality
must be reduced in order to be accommodated in the spatial database. This is referred to
as abstraction, as was discussed above.
5.5.1.2 Discrete objects
Reality can also be conceptualised by discrete objects located in a plane (Goodchild,
1992a:402). The location of objects is described by a set of tuples
T= <x, y, o1, …, oi…>,
where o1 is a binary variable indicating the presence or absence of object i at location
(x,y). Spatial variation is represented by the set of tuples
T= <i, a1, a2, …, am>,
where i is an object and a1 through am are attributes of the object.
In many situations, objects pose problems with regard to variation by virtue of the degree
of approximation and generalisation (Goodchild, 1992a:402). For example, a soil map
would show variation in soil type on a plane with each soil type uniquely demarcated
according to an approximated criterion, whereas in reality the boundary between distinct
soil types is not exact and easily identifiable. This leads to issues of uncertainty, which
were discussed in Section 4.3.4.
Within the above two views of reality, five classes of geographical units or objects can be
identified (Goodchild, 1992a:405). Regions and segments are associated with field views.
Regions refer to the partitioning of the plane into homogenous, simply connected areas.
Segments are associated with linear objects, where segment refers to a discrete element
of the object, for example a road network. Variation in the gradient (slope) across the
network can be indicated by segments of constant gradient. Points, lines and area are
associated with object views that exist as distinct objects on the plane, with areas of ‘no
data’ in between.
140

The above distinction reminds of the raster and vector data concept. Raster and vector
refer to data types that are handled differently by different GIS software packages and
that are often stored in proprietary formats. Goodchild (1992a:406) highlights issues of
ambiguity from a data-modelling perspective, concluding that “neither ‘vector’ nor ‘raster’
provide unambiguous information on how the data represents reality”, and, therefore, “do
not provide an adequate and sound basis for a discussion of data modelling”. In general,
a line feature such as a road network can be captured in both vector and raster data
formats. Likewise, an area feature such as soil type can also be captured in both data
formats. As Couclelis (1992:71) puts it: “Lakes may be polygons, and coastlines may be
lines, but the contour lines of topography only work in concert, as in a field: they are not
independent objects, slices to be sorted, stacked and manipulated, and checked for illegal
overlaps.” The choice of data format will depend on the level of abstraction, considering
processing requirements such as data integration and spatial analysis.
According to Couclelis (1992), the ‘raster’ vs ‘vector’ debate relates to technical
considerations, whereas ontologies of ‘object’ and ‘field’ views are useful from a
philosophical point of view to conceptualise geographic space. She argues that
“[h]uman cognition had sorted out the basic properties of [the] world long before
digital spatial databases came about, and (unlike what is the case with the next
law in quantum electro-dynamics), it probably has little to learn from the next
spatial data model that is built. Thus, in applied geography – the geography that
GIS is supposed to serve – the question of whether an object or field view is more
correct, is neither a philosophical nor a theoretical issue, but largely an empirical
one: how is the geographic world understood, categorized, and acted in by
humans?” (Couclelis, 1992:70).
The choice of raster or vector is determined by the application and the scale of
representation. This aspect is further explored in Chapter 7.
5.5.1.3 Geo-atoms
The primitives of geographic representation are further explored by Goodchild, Yuan and
Cova (2007), who introduce the concept of a geo-atom as the most primitive form of
geographic information. The geographic domain not only includes space; it also includes
the dimension of time. The concept of change detection, for example, suggests variation
in space over time. Yuan, Nara and Bothwel (2014:2) define the geo-atom as follows:
141
“A geo-atom is a space–time point with semantic properties and associated
values for the properties. When geo-atoms are bounded by the same
identity over space and time, these geo-atoms represent a geo-object.
When geo-atoms are bounded by the same property over space and time,
these geo-atoms represent a geo-field. Various means of aggregation and
agglomeration of geo-atoms in space and time form representations of
complex geographic phenomena.”
Referring to this concept as ‘bottom-up thinking’, it forms the basis for exploring the
problem of time-representation in GIS. Goodchild et al. (2007:243) define the geo-atom
as an association between a point location in space–time and a property, denoting it as a
tuple
<x,Z,z(x)>
where x defines a point in space–time, Z identifies a property, and z(x) defines the
particular value of the property at that point. They give the following example to illustrate:
“For example, a geo-atom might indicate that at 120uW, 34uN, at 0m
above mean sea level, and at local noon on 11 July 2005 (a four-
dimensional definition of x), the Celsius temperature (the property Z) was
20u (the value z(x)).”
Geo-atoms are aggregated into geo-fields and geo-objects. A geo-field aggregates geo-
atoms over space by the property Z, irrespective of its value. An example is a coverage
(field) of elevation data, where all points represent the property ‘elevation’ in two-
dimensional space, with the value (x) denoting elevation as the third dimension of space.
Geo-objects are defined as an aggregation of points in space–time whose geo-atoms
meet certain requirements, such as having specified values for certain properties. An
example is ‘Johannesburg City’, where all geo-atoms have the value (Johannesburg City)
for the property [City]. In terms of GIS practice, a geo-object would constitute a feature
represented as a point, line or area/polygon.
Goodchild et al. (2007) extend the geo-atom concept into a three-dimensional framework
that has three key characteristics: (1) a geo-object may be static or may move; (2) it may
change shape through time; and (3) it contains internal structure, indicating whether an
object is internally uniform, or whether it has heterogeneous and evolving internal
characteristics. In combination, it produces eight possible iterations, as described below:
i. Uniform + Stationary + Rigid: buildings and streets in a city.
142
ii. Uniform + Stationary + Elastic: the seasonal expansion or contraction of a lake
when only the extent of the lake is considered.
iii. Uniform + Moving + Rigid: moving vehicles, and the lifelines through space
created by human life histories.
iv. Uniform + Moving + Elastic: a spreading wildfire when only the burn scar is
considered.
v. Evolving + Stationary + Rigid: soils in a watershed and digital elevation models.
vi. Evolving + Stationary + Elastic: heat-island effects in an urban area, and
vegetation cover during desertification.
vii. Evolving + Moving + Rigid: changing landscapes on moving, rigid tectonic plates.
viii. Evolving + Moving + Elastic: oil spills and hurricanes.
The above conceptualisations of continuous fields and discrete objects represent theory
of world abstraction (the way in which we think about geographic phenomena), but do not
solve the problem of digital representation and storage of data. In a digital database,
geographical data is stored in either raster or vector data format. These two formats are
exchangeable by using algorithms to convert from the one to the other, bearing in mind
the effect it will have on storage capacity and processing speed (as will be discussed in
the next section).
5.5.1 Representation of conceptual views: rasters and vectors
Geographic phenomena can be stored in two types of database structures, namely
rasters and vectors. These are extensively described in Burrough (1986), Melnick (2002)
and Longley et al. (2005). GIS is distinguished from other spatially orientated systems,
such as graphic design or computer-aided design (CAD) by virtue of its topological data
structure and database orientation. Topology is the ability of GIS to define spatial
relationships between adjacent or neighbouring features (Theobald, 2001:689). This is
achieved through a set of rules and behaviours that interpret the coordinates in a
database in such a way that it models how points, lines and polygons share geometry. It
represents the way in which the human eye would interpret lines and points on a map as
specific features according to a legend on the map, and simultaneously construe the
spatial relationships between entities. This concept is illustrated in Figure 5.4, showing
the definition of a road and a village as a series of connected points, and the spatial
relationship between these two features where they share the same line segment.
143

Topology is fundamentally used to guarantee the quality of geographical data and to aid
in data compilation. Further advantages of GIS topology include the following:
i. Data integrity rules are enforced (e.g. no gaps should exist between adjacent
polygons, there should be no overlapping features, the junction of lines must be
solid (not overshooting or undershooting), and so on).
ii. Relationship dependent queries are supported (e.g. shortest route analysis).
iii. Features are constructed from unstructured geometry (e.g. to construct polygons
from lines).
ENTITY TYPE SEQUENCE START END
Road Line 7,6,2,1 7 1
Village Polygon 2,3,5,6,2 2 2
Borehole Point 4 4
Figure 5.36: Representation of geographical entities in a topological database Source: Adapted from Aronoff (1989:175)
The basic structure of a raster dataset consists of a matrix of rows and columns, the
combination of which presents an array of cells (see Figure 5.5). Also referred to as
pixels, these cells represent a field of values representing a geographic phenomenon.
Each pixel carries a specific value in terms of the feature that it represents and the distinct
combination of pixels in terms of individual or grouped values will return strings of
connected cells as lines, or aggregated cells as a surface or an area. The illustration in
Figure 5.6 shows the visualisation of values in the raster by means of a distinct colour for
each value.
1
2 3
4
5 6
7
- Points 2 & 6 are classified as nodes. A
node is a point that is shared by two or more
entities.
- Points 2 & 6 are being shared topologically
by the road and the village.
- Points 1 - 7 are stored as geographical or
projected coordinates in a database.
144
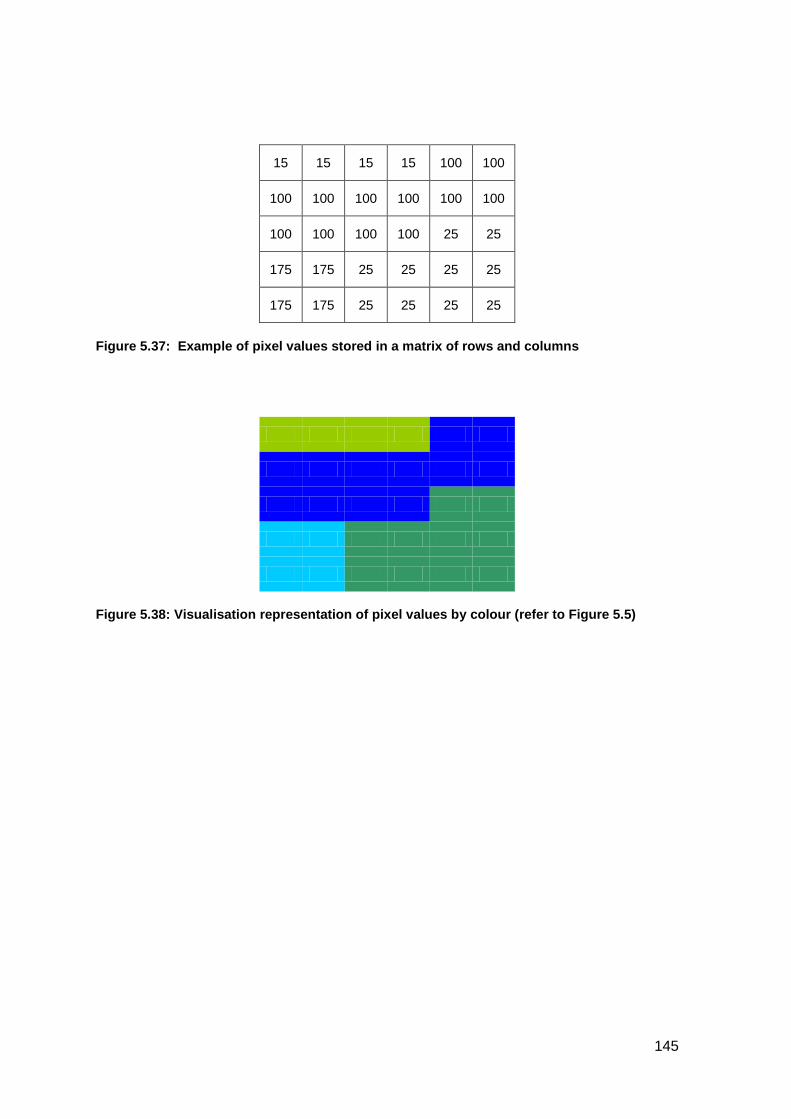
15 15 15 15 100 100
100 100 100 100 100 100
100 100 100 100 25 25
175 175 25 25 25 25
175 175 25 25 25 25
Figure 5.37: Example of pixel values stored in a matrix of rows and columns
Figure 5.38: Visualisation representation of pixel values by colour (refer to Figure 5.5)
145
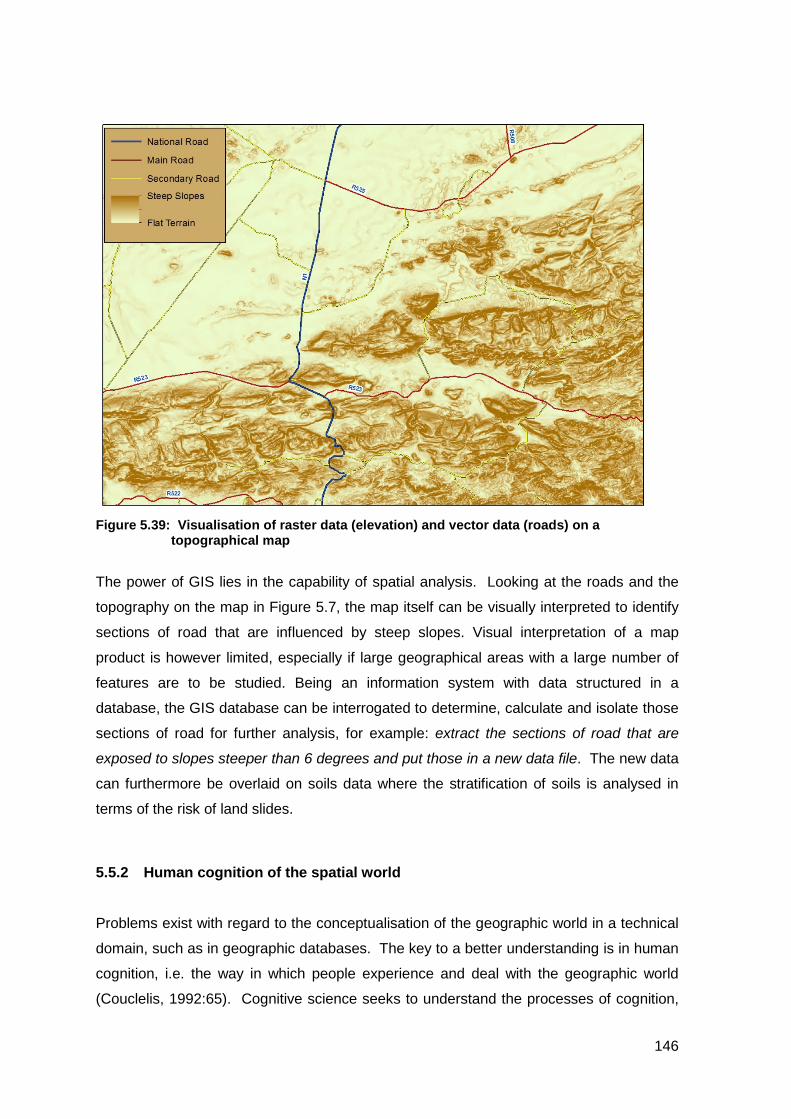
Figure 5.39: Visualisation of raster data (elevation) and vector data (roads) on a
topographical map
The power of GIS lies in the capability of spatial analysis. Looking at the roads and the
topography on the map in Figure 5.7, the map itself can be visually interpreted to identify
sections of road that are influenced by steep slopes. Visual interpretation of a map
product is however limited, especially if large geographical areas with a large number of
features are to be studied. Being an information system with data structured in a
database, the GIS database can be interrogated to determine, calculate and isolate those
sections of road for further analysis, for example: extract the sections of road that are
exposed to slopes steeper than 6 degrees and put those in a new data file. The new data
can furthermore be overlaid on soils data where the stratification of soils is analysed in
terms of the risk of land slides.
5.5.2 Human cognition of the spatial world
Problems exist with regard to the conceptualisation of the geographic world in a technical
domain, such as in geographic databases. The key to a better understanding is in human
cognition, i.e. the way in which people experience and deal with the geographic world
(Couclelis, 1992:65). Cognitive science seeks to understand the processes of cognition,
146
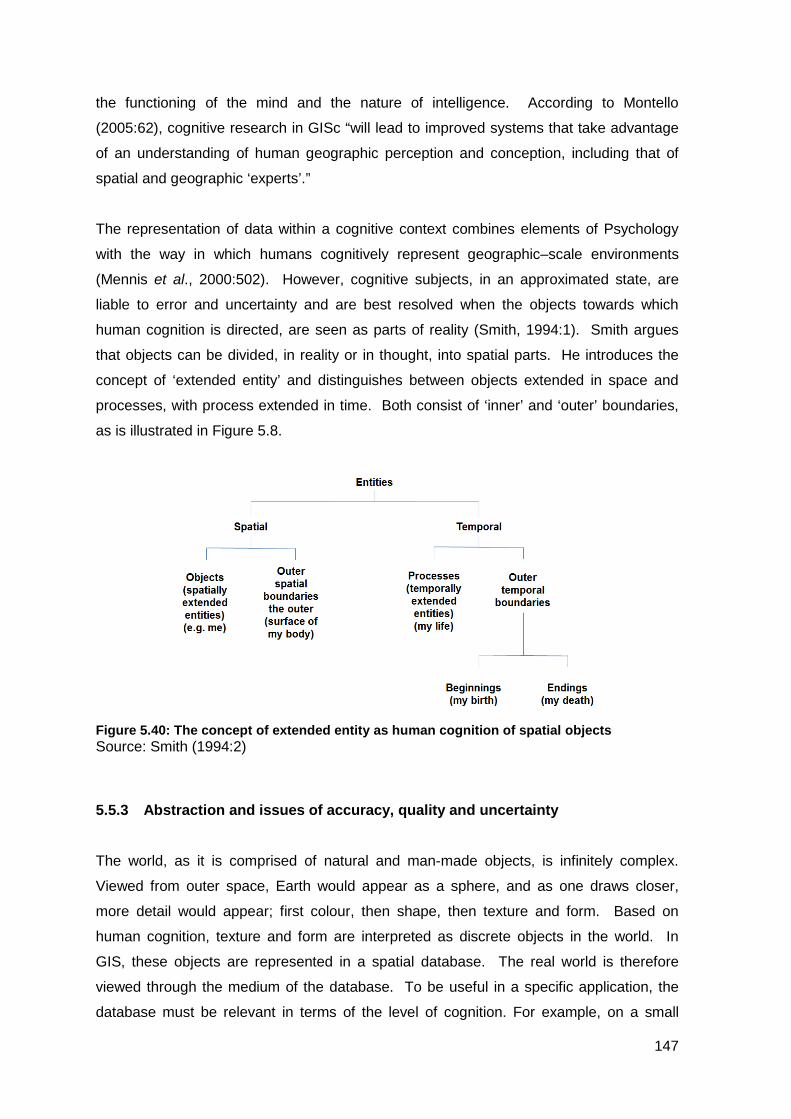
the functioning of the mind and the nature of intelligence. According to Montello
(2005:62), cognitive research in GISc “will lead to improved systems that take advantage
of an understanding of human geographic perception and conception, including that of
spatial and geographic ‘experts’.”
The representation of data within a cognitive context combines elements of Psychology
with the way in which humans cognitively represent geographic–scale environments
(Mennis et al., 2000:502). However, cognitive subjects, in an approximated state, are
liable to error and uncertainty and are best resolved when the objects towards which
human cognition is directed, are seen as parts of reality (Smith, 1994:1). Smith argues
that objects can be divided, in reality or in thought, into spatial parts. He introduces the
concept of ‘extended entity’ and distinguishes between objects extended in space and
processes, with process extended in time. Both consist of ‘inner’ and ‘outer’ boundaries,
as is illustrated in Figure 5.8.
Figure 5.40: The concept of extended entity as human cognition of spatial objects Source: Smith (1994:2)
5.5.3 Abstraction and issues of accuracy, quality and uncertainty
The world, as it is comprised of natural and man-made objects, is infinitely complex.
Viewed from outer space, Earth would appear as a sphere, and as one draws closer,
more detail would appear; first colour, then shape, then texture and form. Based on
human cognition, texture and form are interpreted as discrete objects in the world. In
GIS, these objects are represented in a spatial database. The real world is therefore
viewed through the medium of the database. To be useful in a specific application, the
database must be relevant in terms of the level of cognition. For example, on a small
147
scale, a city would be expected to be modelled by its outline, and not by a point symbol.
This highlights the fact that Euclidean points, lines and polygons do not exist in the
natural, full-scale geographic world (Couclesis, 1992:66).
GIS ontologies are concerned with the boundaries of geographic objects, as these are
subject to vagueness, which complicates their representation (Galton, 2003: 156;
Kavouras & Kokla, 2008). Features such as mountains and rivers are intuitively reckoned
as geographic features, but how are their boundaries defined? (Duckham, Goodchild &
Worboys, 2003; Smith & Mark, 2003). Cognitive conceptions such as mountains exist
because of human partition, based on the recognition of some form and dimension.
Smith (1994) introduces the concept of ‘fiat’ and ‘bona fide’ objects, based on the
conception of boundaries. Earth, as an object, has the qualitative of heterogeneity, of
material constitution (Smith, 1994), and is demarcated from its surroundings
independently of human partitioning activity (Bittner & Smith, 2003). On this basis, it exists
as a bona fide object. The partitioning of Earth into a northern and southern hemisphere,
or the demarcation of land into political borders or districts, presupposes imaginary lines
that are regarded as fiat boundaries (Smith, 1996:104; Bittner & Smith, 2003:119). Fiat
objects, therefore, only exist because of human partitioning activity.
On this distinction, Galton (2003) creates a classification of ‘physical’ and ‘institutional’
boundaries (albeit different in some respect from Smith). According to Galton (2003:152)
“[a]ll boundaries exist by virtue of the distribution of matter and energy in space and time,
but boundaries may differ as to just how their existence depends on such distribution”.
Arbitrary boundaries created intentionally by individual or collective human activity, are
institutional boundaries. All other boundaries are physical boundaries.
Galton (2003) further classifies physical boundaries into material and epiphenomenal
boundaries. The first is composed of matter. The second exists by virtue of the
distribution of matter in space and time, but is in itself not made of matter. An example is
a woodland and an adjacent grassland. The boundary between the two exists solely by
virtue of the distribution of woodland and grassland, and how it is cognitively observed –
hence it is an epiphenomenal boundary. If a stone wall is built on the division between
the woodland and grassland, the wall is a material boundary, cognitively associated with
the division between the two types of land (Galton, 2003:153).
Material boundaries are further classified into ‘separation zones’ and ‘transition zones’.
Separation zones are characterised by distinct differentiations between two adjacent
148
zones, which would easily define the location of the wall, as mentioned in the above
example. A transition zone is characterised by gradation between the regions on each
side and the separation zone itself, where elements of both sides occur in the separation
zone (Galton, 2003:154). An example is the separation of climate zones.
Couclelis (1992:65) states that “the technical question of the most appropriate data
structure for the representation of geographic phenomena begs the philosophical question
of the most appropriate conceptualization of the geographic world.” The above analysis
illustrates the complexity of modelling the real world. In terms of data management, it
raises issues of accuracy, error, quality and uncertainty, which are defined by Messina et
al. (2008:14) as follows:
“accuracy: a general term for the degree to which a spatial data set conforms
to the idealized phenomenon, as specified by the conceptual model. The
means by which this may be quantified depends on various factors, including
the conceptual model itself, the application domain, associated data quality
specifications, and the type of available reference information, if any.
Error: the difference between the actual condition of the measured spatial
phenomenon and its representation in the data set. ‘Actual condition’ implies
an independently collected reference measure to compare against a portion of
the data set. The comparison may be complicated by mismatches between
the ontological bases for the spatial data set and the reference data set (Bishr
1998; Fonseca, Davis, and Camara 2003), inaccuracies in the reference, and
the relatively restricted set of sampled locations over which reference
information are typically available.
Quality: synonymous with accuracy, but more applied in data production and
distribution. Generally describes a variety of specified factors with possibly
quite different quality measures. Much government produced or funded spatial
data must meet particular quality specifications in order to be approved for
distribution (FGDC 1998). For US federal government data, documented data
quality components are positional and attribute accuracy, logical consistency
(such as topological characteristics), completeness, and the source materials,
or lineage (Veregin 1999). Increasingly data quality is couched in fitness for
use terminology; however, it remains unclear how this mandate is to be met.
Uncertainty: for spatial data, this is the degree to which the fidelity of the data
to the phenomenon at a location is open to question. In the words of Unwin
(1995), it is a measure of doubt. Employing a stochastic conceptual model of
the phenomenon of interest, uncertainty is the degree of variability we attach
149
to data values. Spatial data may also be subject to uncertainty due to
vagueness in category definitions such as land cover classes (Fisher 1999).”
5.5.4 Spatial relationships
Longley et al. (2005:8) ask the question ‘why is spatial special?’ In the context of GIS,
space relates to location on the Earth’s surface, i.e. geographic space. Hence, the term
‘geospatial’ is often used. But why is it special? Human activity and decisions involve
space, hence providing a geographical component. Furthermore, geographic entities
have spatial associations or relationships. Waldo Tobler is quoted extensively in
geography (Miller, 2004:284) for what he calls “the first law of geography: everything is
related to everything else, but near things are more related than distant things” (Tobler,
1970:236). Tobler used this principle in the development of urban growth simulation
models, a principle which has become known as Tobler’s First Law (TFL). It is used to
indicate that the attributes of places that are near to each other tend to be more similar
than attributes of places that are far apart (Janelle & Goodchild, 2011:34). This concept is
a core aspect of neighbourhood analysis.
Miller (2004) undertakes an in-depth analysis of TFL and highlights three core
applications with regard to spatial analysis. First, it reveals the spatial associations
among geographic entities – a concept called spatial autocorrelation. This is a quantitative
technique for analysing correlation relative to distance or connectivity relationships.
Second, TFL is used as an analytic technique to undertake spatial interpolation, which is
a technique for generating unknown values between two known locations. An example is
the interpolation of elevation values between two contour lines, to create a Digital
Elevation Model (DEM) (refer to the field view, as discussed above). Lastly, TFL is useful
for guiding research specifically with regard to future development, as is noted from its
use in temporal GIS (space–time) analysis.
The aspects of spatial relationships and database structures have been a key research
area since the establishment of the University Consortium for Geographic Information
Science (UCGIS) in 1994 (Goodchild, 2004), and is a key aspect of the development of a
data model in Chapter 8.
Connectivity relationships are mathematically related to set theory (Kainz, 2010). Spatial
features represented as points, lines or polygons can be regarded as sets. Overlay
150
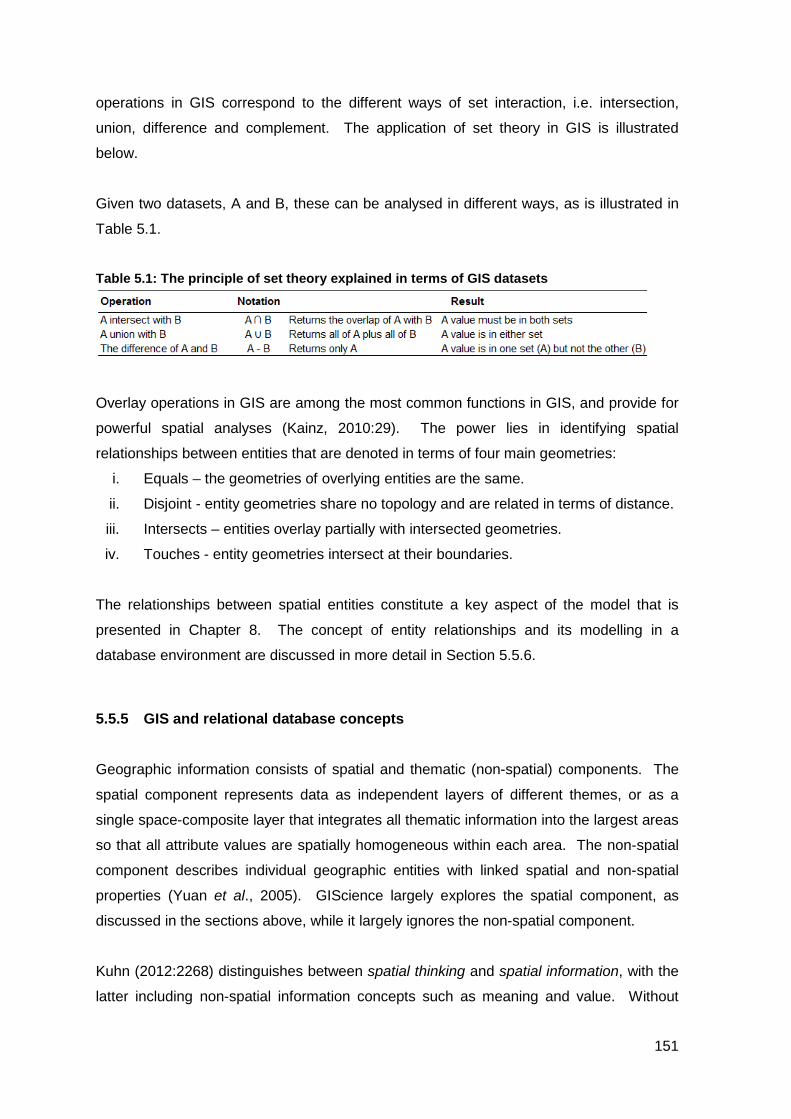
operations in GIS correspond to the different ways of set interaction, i.e. intersection,
union, difference and complement. The application of set theory in GIS is illustrated
below.
Given two datasets, A and B, these can be analysed in different ways, as is illustrated in
Table 5.1.
Table 5.1: The principle of set theory explained in terms of GIS datasets
Overlay operations in GIS are among the most common functions in GIS, and provide for
powerful spatial analyses (Kainz, 2010:29). The power lies in identifying spatial
relationships between entities that are denoted in terms of four main geometries:
i. Equals – the geometries of overlying entities are the same.
ii. Disjoint - entity geometries share no topology and are related in terms of distance.
iii. Intersects – entities overlay partially with intersected geometries.
iv. Touches - entity geometries intersect at their boundaries.
The relationships between spatial entities constitute a key aspect of the model that is
presented in Chapter 8. The concept of entity relationships and its modelling in a
database environment are discussed in more detail in Section 5.5.6.
5.5.5 GIS and relational database concepts
Geographic information consists of spatial and thematic (non-spatial) components. The
spatial component represents data as independent layers of different themes, or as a
single space-composite layer that integrates all thematic information into the largest areas
so that all attribute values are spatially homogeneous within each area. The non-spatial
component describes individual geographic entities with linked spatial and non-spatial
properties (Yuan et al., 2005). GIScience largely explores the spatial component, as
discussed in the sections above, while it largely ignores the non-spatial component.
Kuhn (2012:2268) distinguishes between spatial thinking and spatial information, with the
latter including non-spatial information concepts such as meaning and value. Without
151
location, data would be regarded as non-spatial or aspatial (Longley et al., 2005:110) and
is only of value outside of GIS. However, once such data is geo-coded, or geo-
referenced, it becomes part of the spatial domain. In other words, all data that relates to
defined geographical places or features (points, lines or areas in vector format data or
grid-cells or pixels in raster format data) can be integrated within GIS, irrespective of their
origin (MacFarlane, 2005:32). The spatial-aspatial link of data relates the concept of
relationships and relational databases, as defined in database theory.
Within the context of information systems, all data is stored in one or more files and
managed by a database management system (DBMS) (Shekhar & Vatsavai, 2008:111;
Rob & Coronel, 2009:6). Shekhar and Vatsavai rightfully comment that “[d]atabases and
the software which manages them are the silent success story of the information age”. A
database is a shared, integrated computer structure that stores a collection of data (Rob
& Coronel, 2009:6). A database management system (DBMS) is a collection of programs
that manages the database structure and controls access to the data stored in the
database (Rob & Coronel, 2009:7). Throughout history, a number of database file
systems were developed, notably the network, hierarchical and relational DBMSs. Of
these, relational database management systems (RDBMS) have gained widespread
popularity (Shekhar & Vatsavai, 2008:111). The database management systems
approach enforces certain rules that protect the integrity of the data (Yuan et al.,
2005:129) and provide structure, which is necessary to query and process the data. In
this regard, database design becomes important, as it focuses on the design of the
database structure that will be used to store and manage the data for the use, as intended
by the information system (Rob & Coronel, 2009:10). In view of relationships, which are
key to understanding GIS, two related concepts deserve attention: the relational database
model and the entity relationship model.
5.5.6 The Relational Database Model
The relational database model is an important concept in database theory, as it appeals
to the notion of relationships between things (Darwen, 2009:18). The model was
introduced in 1970 by E.F. Codd, and represented a breakthrough for both users and
designers at the time (Rob & Coronel, 2009:38). The model is founded in the
mathematical concept known as a relation (refer to Figure 5.9). In its simplest form, it can
be described as a matrix or a table (relation) composed of intersecting rows (tuples) and
columns (attributes). The cardinality is the number of tuples in a relation, and the degree,
152
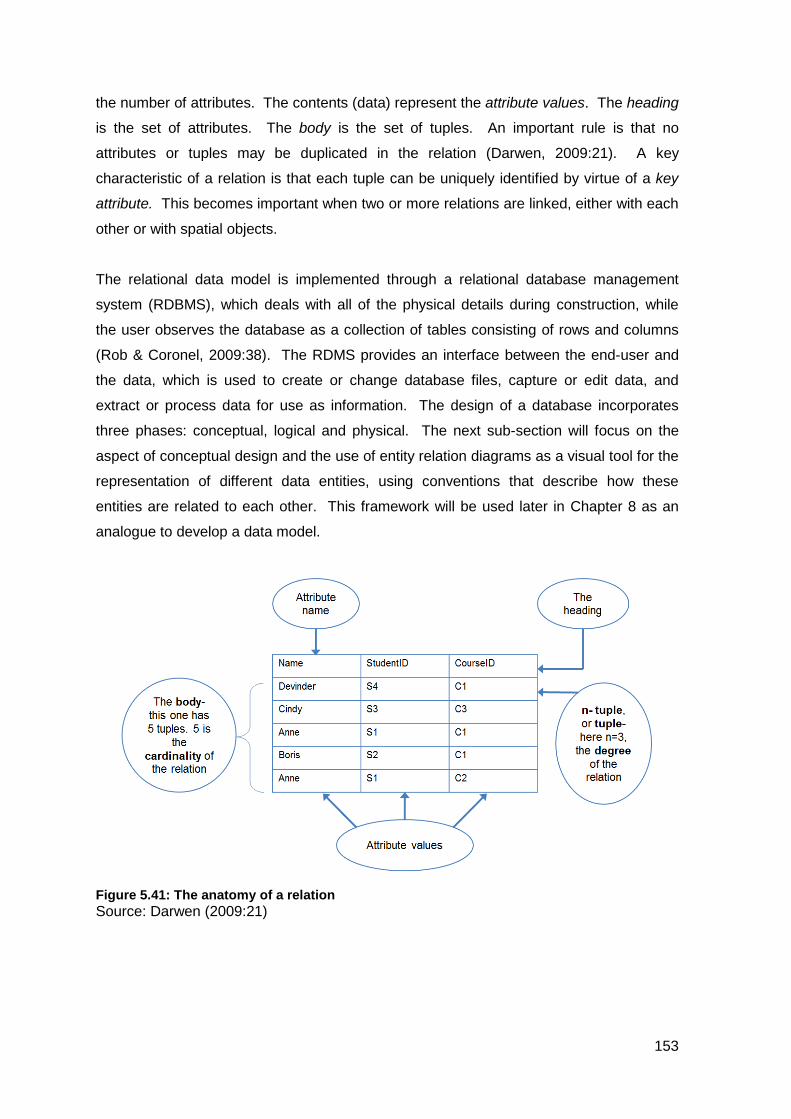
the number of attributes. The contents (data) represent the attribute values. The heading
is the set of attributes. The body is the set of tuples. An important rule is that no
attributes or tuples may be duplicated in the relation (Darwen, 2009:21). A key
characteristic of a relation is that each tuple can be uniquely identified by virtue of a key
attribute. This becomes important when two or more relations are linked, either with each
other or with spatial objects.
The relational data model is implemented through a relational database management
system (RDBMS), which deals with all of the physical details during construction, while
the user observes the database as a collection of tables consisting of rows and columns
(Rob & Coronel, 2009:38). The RDMS provides an interface between the end-user and
the data, which is used to create or change database files, capture or edit data, and
extract or process data for use as information. The design of a database incorporates
three phases: conceptual, logical and physical. The next sub-section will focus on the
aspect of conceptual design and the use of entity relation diagrams as a visual tool for the
representation of different data entities, using conventions that describe how these
entities are related to each other. This framework will be used later in Chapter 8 as an
analogue to develop a data model.
Figure 5.41: The anatomy of a relation Source: Darwen (2009:21)
153

5.5.6.1 The Entity Relationship Model
To examine database structures and assist in the design, Peter Chen introduced the
Entity Relationship Model (ERM) in 1976. It is a graphical representation of entities and
their relationships in a database structure, and functions on the conceptual level of data
abstraction. A relationship is an association between two or more entities. Attributes
describe characteristic values of entities and relationships (Kainz, 2004:32; Rob &
Coronel, 2009:38, 48). Three main types of relationships exist: one-to-one (1:1), one-to-
many (1:M), and many-to-many (M:N). In terms of database design, the M:N relationship
is not supported as this may lead to duplicate tuples, which is not allowed. This should be
dissolved through a dual 1:M structure. On the conceptual level, connectivity labels are
used in an entity relationship diagram (ER diagram) to visualise relationships (Rob &
Coronel, 2009). (Refer to Figure 5.10.)
Figure 5.42: Basic notation used in ER diagrams
Standard notations in the ER diagram are used to conceptualise entities, their attributes
and relationships in such a manner that it defines the database as a schema (Kainz,
2004:32). The ER diagrams in Figure 5.11 demonstrate the progression of an ER
diagram from its first conception to the final relational database model. The schemas
represent the following hypothetical scenario:
One community, identified by its name and the number of households, utilises certain
forests, identified by their size, to extract medicinal plants from certain vegetation
types, identified by the vegetation types that grow in the forests. A database must be
154
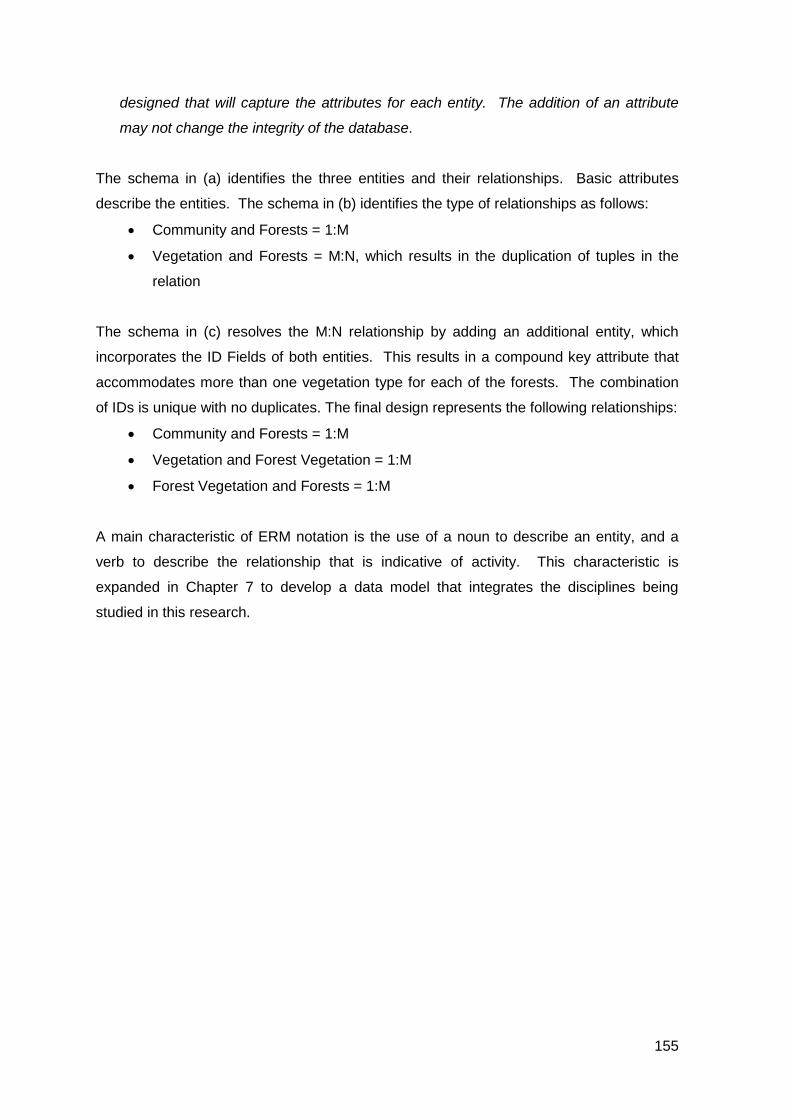
designed that will capture the attributes for each entity. The addition of an attribute
may not change the integrity of the database.
The schema in (a) identifies the three entities and their relationships. Basic attributes
describe the entities. The schema in (b) identifies the type of relationships as follows:
• Community and Forests = 1:M
• Vegetation and Forests = M:N, which results in the duplication of tuples in the
relation
The schema in (c) resolves the M:N relationship by adding an additional entity, which
incorporates the ID Fields of both entities. This results in a compound key attribute that
accommodates more than one vegetation type for each of the forests. The combination
of IDs is unique with no duplicates. The final design represents the following relationships:
• Community and Forests = 1:M
• Vegetation and Forest Vegetation = 1:M
• Forest Vegetation and Forests = 1:M
A main characteristic of ERM notation is the use of a noun to describe an entity, and a
verb to describe the relationship that is indicative of activity. This characteristic is
expanded in Chapter 7 to develop a data model that integrates the disciplines being
studied in this research.
155
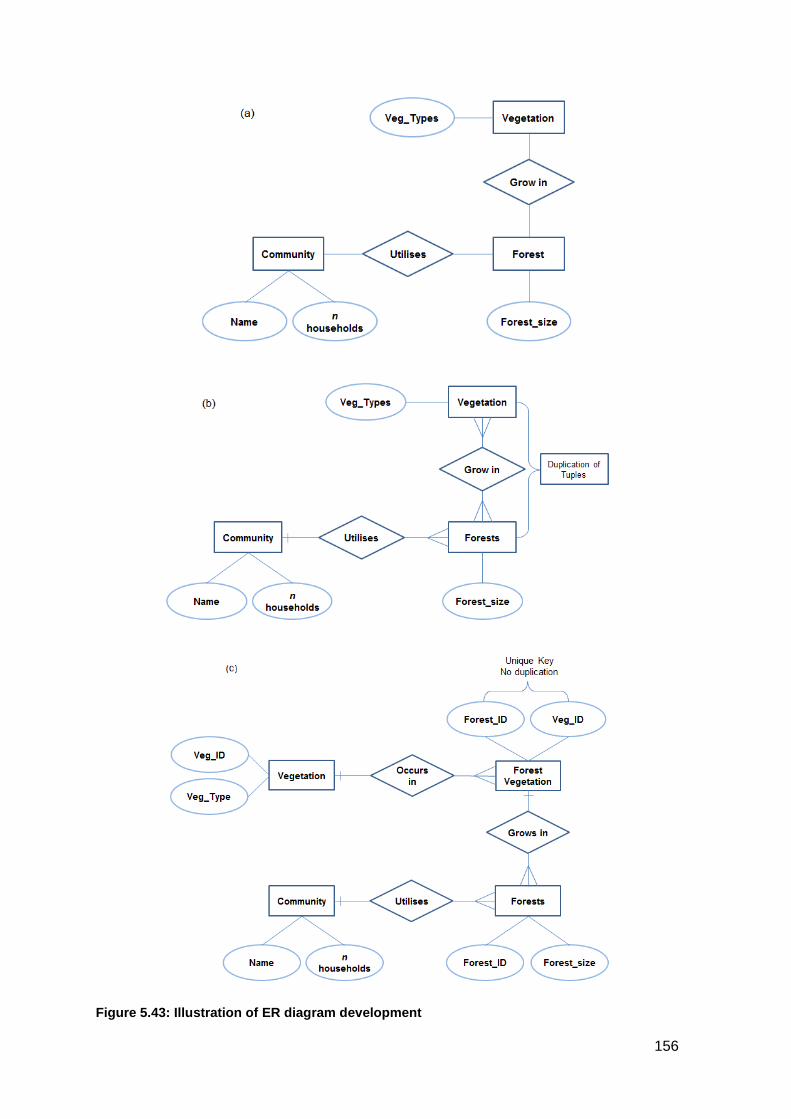
Figure 5.43: Illustration of ER diagram development
156
5.5.7 Information and knowledge as a product of data
The meaning of data, information and information systems was explored in Section 3.
The fundamentals of these concepts are further applied in respect of GIS. Data does not
exist by itself, and needs to be created as an abstraction of reality (Comber, Fisher &
Wadsworth, 2005; Longley et al., 2005; Harvey, 2008). Comber et al. (2005) define data
as “the result of measurement of some agreed phenomenon”. Data needs to be
contained as text or numeric values in a database, designed for the specific purpose to
host the data in a particular structure. For it to become useful, it needs to be processed.
The fundamentals of information systems are anchored in the concept of data processing.
As was mentioned in Section 5.3, data may be described as raw facts, which, when
arranged in a meaningful manner, become information. Information is therefore a
collection of specifically organised facts that have additional meaning beyond the value of
the facts themselves (Stair & Reynolds, 2009:5).
An information system is the link between the providers of data on the one hand, and the
users of data on the other hand (Willis, 1974). The question is, how can data become
useful to the user and what should be the role of an information system? According to
Stair and Reynolds (2009:6), information is the result of a process where data is
transformed into information. This requires a set of logically related tasks that are
performed (with the aid of computer technology) to achieve a defined outcome.
Understanding these tasks, and the relation between data items, requires knowledge.
This knowledge is domain specific and in terms of disaster risk management it implies
knowledge about an array of related fields such as development planning, community
health, infrastructure design, etc. Stair and Reynolds (2008:6) define knowledge as “the
awareness and understanding of a set of information that can be made useful to support a
specific task or reach a decision”. The relationship between data, knowledge and
information is illustrated in Figure 5.12.
157
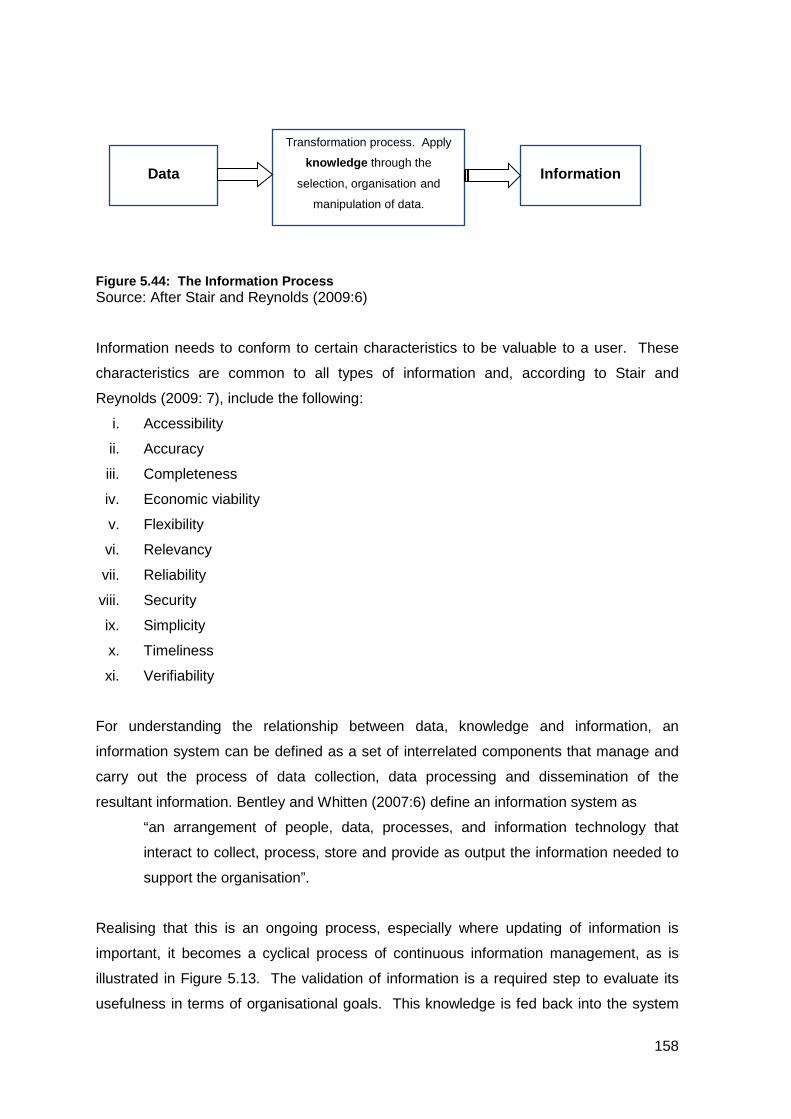
Figure 5.44: The Information Process Source: After Stair and Reynolds (2009:6)
Information needs to conform to certain characteristics to be valuable to a user. These
characteristics are common to all types of information and, according to Stair and
Reynolds (2009: 7), include the following:
i. Accessibility
ii. Accuracy
iii. Completeness
iv. Economic viability
v. Flexibility
vi. Relevancy
vii. Reliability
viii. Security
ix. Simplicity
x. Timeliness
xi. Verifiability
For understanding the relationship between data, knowledge and information, an
information system can be defined as a set of interrelated components that manage and
carry out the process of data collection, data processing and dissemination of the
resultant information. Bentley and Whitten (2007:6) define an information system as
“an arrangement of people, data, processes, and information technology that
interact to collect, process, store and provide as output the information needed to
support the organisation”.
Realising that this is an ongoing process, especially where updating of information is
important, it becomes a cyclical process of continuous information management, as is
illustrated in Figure 5.13. The validation of information is a required step to evaluate its
usefulness in terms of organisational goals. This knowledge is fed back into the system
Data
Transformation process. Apply
knowledge through the
selection, organisation and
manipulation of data.
Information
158
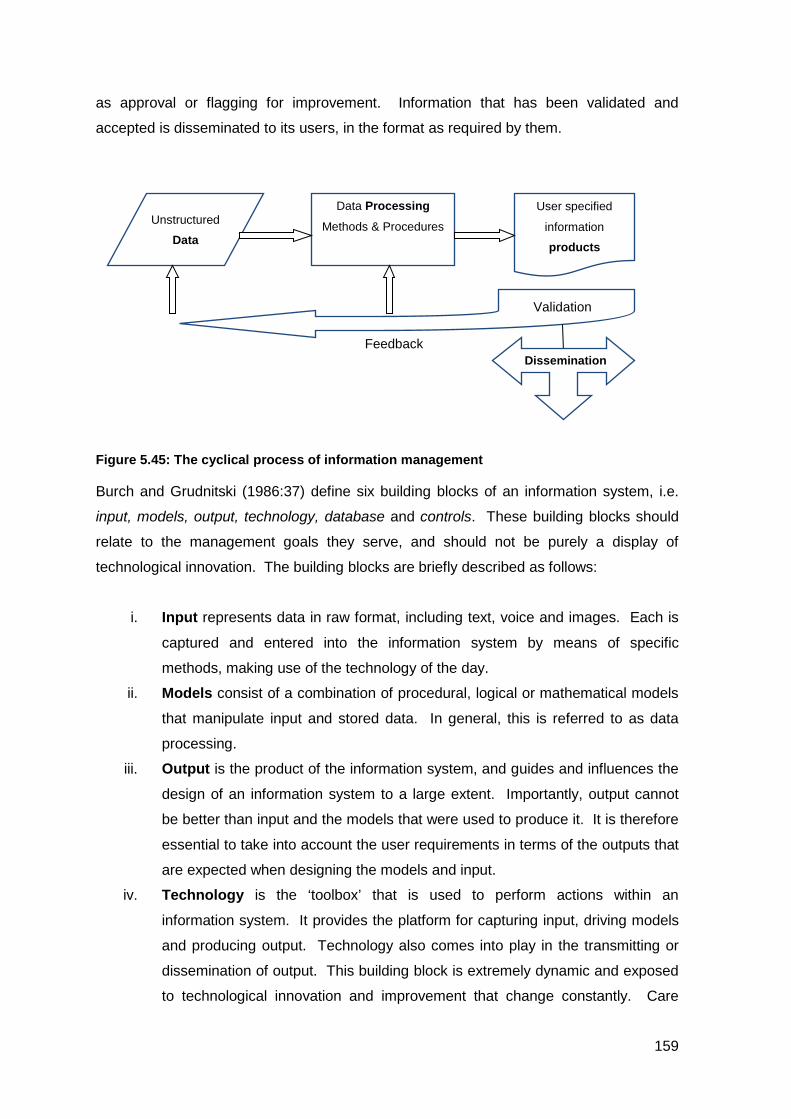
as approval or flagging for improvement. Information that has been validated and
accepted is disseminated to its users, in the format as required by them.
Figure 5.45: The cyclical process of information management Burch and Grudnitski (1986:37) define six building blocks of an information system, i.e.
input, models, output, technology, database and controls. These building blocks should
relate to the management goals they serve, and should not be purely a display of
technological innovation. The building blocks are briefly described as follows:
i. Input represents data in raw format, including text, voice and images. Each is
captured and entered into the information system by means of specific
methods, making use of the technology of the day.
ii. Models consist of a combination of procedural, logical or mathematical models
that manipulate input and stored data. In general, this is referred to as data
processing.
iii. Output is the product of the information system, and guides and influences the
design of an information system to a large extent. Importantly, output cannot
be better than input and the models that were used to produce it. It is therefore
essential to take into account the user requirements in terms of the outputs that
are expected when designing the models and input.
iv. Technology is the ‘toolbox’ that is used to perform actions within an
information system. It provides the platform for capturing input, driving models
and producing output. Technology also comes into play in the transmitting or
dissemination of output. This building block is extremely dynamic and exposed
to technological innovation and improvement that change constantly. Care
Unstructured
Data
Data Processing
Methods & Procedures
User specified
information
products
Feedback
Validation
Dissemination
159
must be taken not to regard technological products as ‘information systems’ in
themselves. Such an approach is fatal, especially where budgets provide only
for the acquisition of hardware and software (failing to recognise the cost of
data), and the training or appointment of staff to manage and operate the
system.
v. The database is the structural element where all the data is stored. Database
design is crucial and incorporates two basic elements: physical and logical
design. The physical component involves the storage media such as disks,
magnetic cards and chips. How to access the data, search for and retrieve
selected entities is a matter of logical design. If designed and structured
correctly, the timely, relevant and accurate retrieval of information is achieved.
vi. An often neglected part is the safeguarding of an information system.
Information systems are vulnerable to a variety of hazards and threats, from
natural events such as fire, to malicious or careless actions of people. The
threat of viruses, hacking, inadequate operational procedures and incompetent
personnel requires the implementation of controls to ensure the protection,
integrity and smooth operation of an information system.
Within an organisation, information systems provide output on two levels, i.e. the
management and operational level. On an operational level, individuals send and receive
data in accordance with their organisational tasks. On a managerial level, decision
makers converge to interpret data in response to a problem (Daft & Lengel, 1986).
Likewise, on a top organisational level, managers/directors will interpret data in response
to strategic planning challenges. On the basis of this division, a typology of information
systems is described by McLeod (1990:302, 340, 411) and Van der Vlugt (1989:462).
The following types of information systems are mentioned:
i. Transaction Processing Systems
ii. Decision Support Systems
iii. Management Information Systems
iv. Expert Systems
A transaction processing system is used in day-to-day operational tasks of an
organisation and is focused on data processing. This would entail the capturing of new
data or the retrieval of standard information, e.g. a list of names. The information is used
in the preparation of reports for management purposes.
160
The purpose of a decision support system is to assist with decision making and it is
focused on finding solutions for particular problems. Essentially, these types of systems
are used on a management level and are designed for particular aspects within an
organisation.
Management information systems refer to a wider continuum of coordinated
subsystems that are integrated to transform data in a variety of ways. The focus is on
specific outcomes requiring specific criteria for data processing and analysis. A typical
example in the disaster management domain would be the integrated use of GIS and an
Incident Command System.
Marksjo (1986:266) describes an expert system as “a piece of computer software giving
the illusion of being a human expert within a restricted field of competence”. This type of
information system includes artificial intelligence and is pre-programmed with expert
knowledge and experience in a particular field. By applying a set of rules, it is able to fulfil
the tasks of human operators. A typical example of expert systems is weather forecasting
systems.
The above typology of information systems is indicative of their association with specific
tasks on different levels within an organisation, informing a wide range of users. Given
the multi-disciplinary nature of disaster risk management, where functions and
responsibilities lie across a spectrum of agencies, units and departments, it can be
concluded that different types of information systems are needed, where these have
specific functionalities for specific objectives in mind. It is also concluded that the
development of these systems should be firmly based on the fundamentals of information
systems as described above.
5.6 GIS FUNCTIONS
The interface between the user of GIS and the GIS technology functions as the user’s
expression of a task within the context of an activity and the sequence of operations
within a GIS (Timpf, 2003:241). In this context, GIS is briefly defined as having in place
computer hardware components with sufficient storage and processing power, software
with the ability to undertake spatial operations, a database of spatially referenced and
linked attribute data contained in the computer storage medium, skilled personnel, and a
proper organisational context (Fischer, 1994:2). The organisational context defines the
tasks and activities that need to be undertaken by the user. The interface with the GIS
161
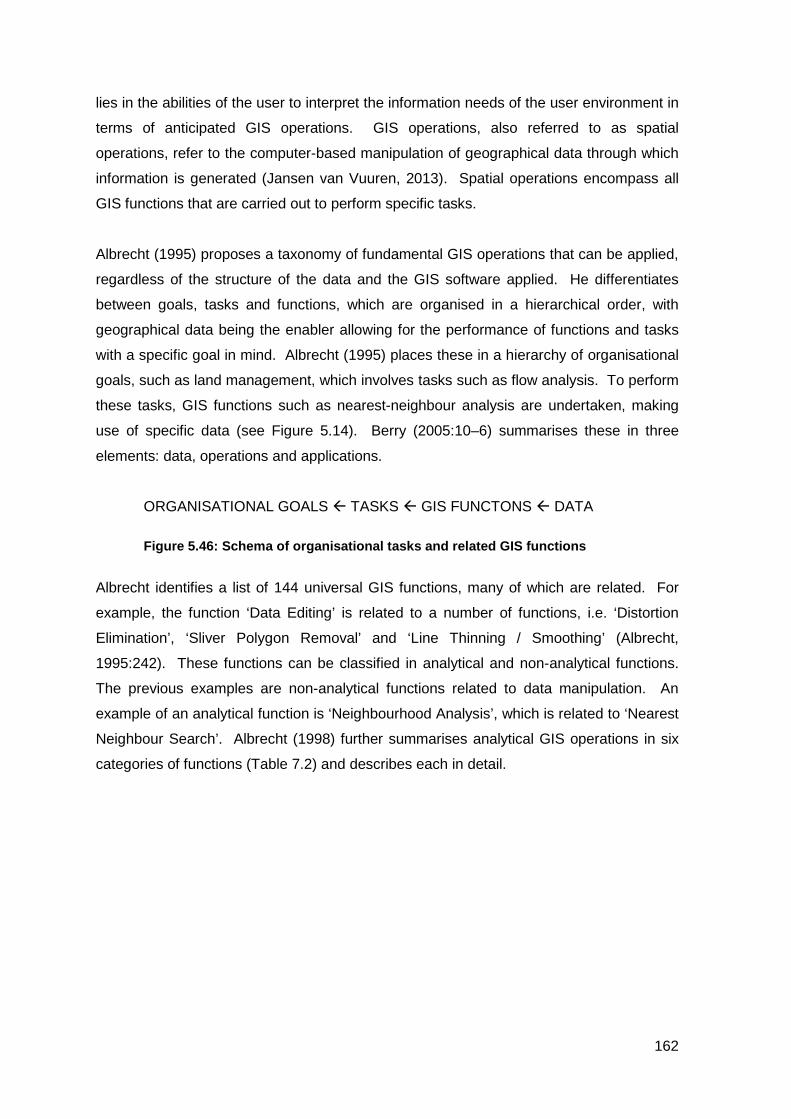
lies in the abilities of the user to interpret the information needs of the user environment in
terms of anticipated GIS operations. GIS operations, also referred to as spatial
operations, refer to the computer-based manipulation of geographical data through which
information is generated (Jansen van Vuuren, 2013). Spatial operations encompass all
GIS functions that are carried out to perform specific tasks.
Albrecht (1995) proposes a taxonomy of fundamental GIS operations that can be applied,
regardless of the structure of the data and the GIS software applied. He differentiates
between goals, tasks and functions, which are organised in a hierarchical order, with
geographical data being the enabler allowing for the performance of functions and tasks
with a specific goal in mind. Albrecht (1995) places these in a hierarchy of organisational
goals, such as land management, which involves tasks such as flow analysis. To perform
these tasks, GIS functions such as nearest-neighbour analysis are undertaken, making
use of specific data (see Figure 5.14). Berry (2005:10–6) summarises these in three
elements: data, operations and applications.
ORGANISATIONAL GOALS TASKS GIS FUNCTONS DATA Figure 5.46: Schema of organisational tasks and related GIS functions
Albrecht identifies a list of 144 universal GIS functions, many of which are related. For
example, the function ‘Data Editing’ is related to a number of functions, i.e. ‘Distortion
Elimination’, ‘Sliver Polygon Removal’ and ‘Line Thinning / Smoothing’ (Albrecht,
1995:242). These functions can be classified in analytical and non-analytical functions.
The previous examples are non-analytical functions related to data manipulation. An
example of an analytical function is ‘Neighbourhood Analysis’, which is related to ‘Nearest
Neighbour Search’. Albrecht (1998) further summarises analytical GIS operations in six
categories of functions (Table 7.2) and describes each in detail.
162
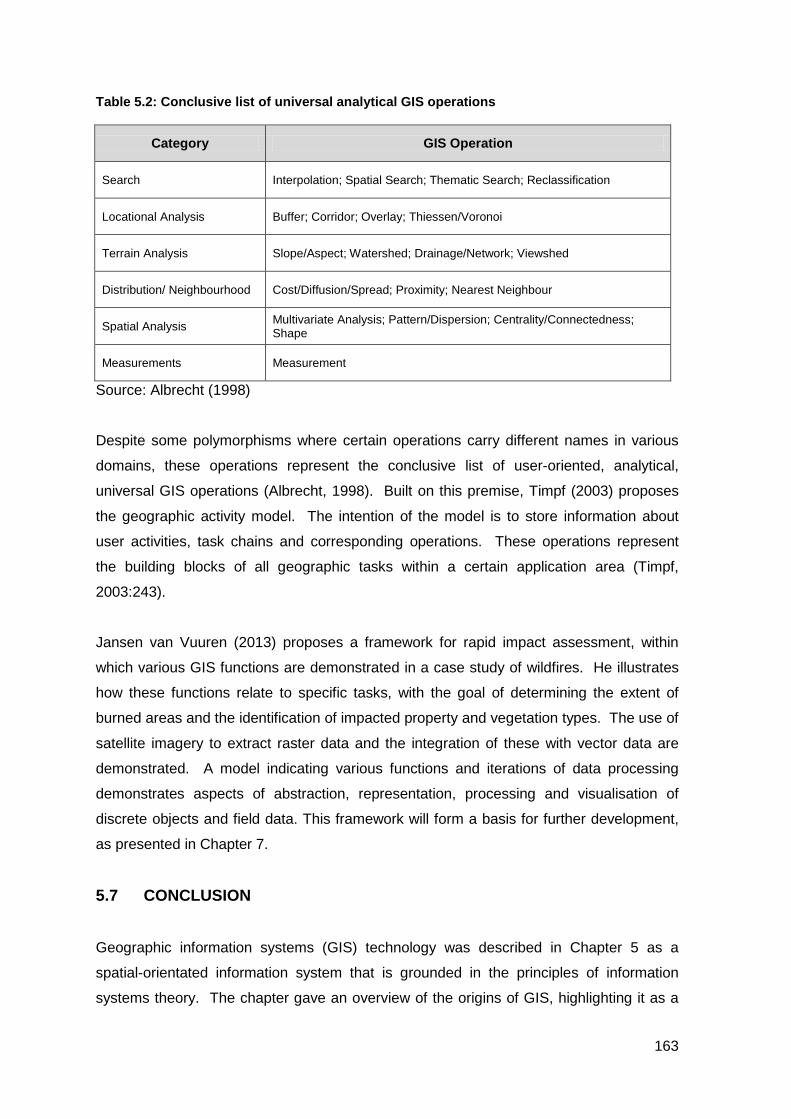
Table 5.2: Conclusive list of universal analytical GIS operations
Category GIS Operation
Search Interpolation; Spatial Search; Thematic Search; Reclassification
Locational Analysis Buffer; Corridor; Overlay; Thiessen/Voronoi
Terrain Analysis Slope/Aspect; Watershed; Drainage/Network; Viewshed
Distribution/ Neighbourhood Cost/Diffusion/Spread; Proximity; Nearest Neighbour
Spatial Analysis Multivariate Analysis; Pattern/Dispersion; Centrality/Connectedness; Shape
Measurements Measurement
Source: Albrecht (1998)
Despite some polymorphisms where certain operations carry different names in various
domains, these operations represent the conclusive list of user-oriented, analytical,
universal GIS operations (Albrecht, 1998). Built on this premise, Timpf (2003) proposes
the geographic activity model. The intention of the model is to store information about
user activities, task chains and corresponding operations. These operations represent
the building blocks of all geographic tasks within a certain application area (Timpf,
2003:243).
Jansen van Vuuren (2013) proposes a framework for rapid impact assessment, within
which various GIS functions are demonstrated in a case study of wildfires. He illustrates
how these functions relate to specific tasks, with the goal of determining the extent of
burned areas and the identification of impacted property and vegetation types. The use of
satellite imagery to extract raster data and the integration of these with vector data are
demonstrated. A model indicating various functions and iterations of data processing
demonstrates aspects of abstraction, representation, processing and visualisation of
discrete objects and field data. This framework will form a basis for further development,
as presented in Chapter 7.
5.7 CONCLUSION
Geographic information systems (GIS) technology was described in Chapter 5 as a
spatial-orientated information system that is grounded in the principles of information
systems theory. The chapter gave an overview of the origins of GIS, highlighting it as a
163
relatively new computer-based technology. The context of GIS as an information system
and the focus on the representation of geo-spatial objects in a spatial database (using
various models of conceptualisation) are emphasised. This chapter also explored the
development of the concept of GIS science and defined its theoretical grounding.
The functioning of GIS relates to specific goals in the field of application, which is an
imperative for database design and incorporates identified relationships. The notion of
spatial relationships is a key aspect of this study and its understanding is necessary for
the development of the GIS-based data model in Chapter 8.
GIS technology supports development planning, environmental management and disaster
risk reduction. It can be regarded as an entry point where these disciplines meet in an
intra-relationship. To further examine this premise, the next chapter examines various
frameworks that describe the functioning of these disciplines, with examples of GIS
implementation.
164
CHAPTER 6: INDICATORS, FRAMEWORKS AND MODELS OF VULNERABILITY, SUSTAINABLE DEVELOPMENT AND THE ENVIRONMENT
6.1 INTRODUCTION
Development increases vulnerability to disaster through unintentional consequences that
have an impact on and weaken the social, ecological or economic fabric of a society that
allows systems to absorb and rebound from disaster events (Brett & Oviatt, 2013:60).
The 2011 Global Assessment Report on Disaster Risk Reduction (GAP, 2011:6) states
that “[e]xtensive risk exists wherever development occurs, and it is directly constructed by
risk drivers such as badly planned and managed urbanization, environmental degradation
and poverty”. The connection between disaster risk, poor development planning and
environmental degradation has been described in previous chapters (Chapters 2, 3 and
4). The recognition that disaster is predominantly an indicator of unsustainable
development, points to a shift in focus from reduction efforts to addressing the drivers of
development that lead to the intensification of disaster risk in the first place (Lavell &
Maskrey, 2014). The concept of risk drivers deserves more attention, specifically the way
in which these can be measured from different perspectives. Mitchell (1996) states that,
in the field of sustainable development, the debate has moved from the issue of definition
to one of measurement. The same is true in respect of vulnerability, where the
development of frameworks and indicators indicate a paradigm shift from quantification
and analysis of hazards to the identification, assessment and ranking of vulnerabilities
(Birkmann, 2006b:9). This highlights the need to assess and measure the various
dimensions and dynamic nature of vulnerabilities, as suggested by Birkmann, Kienberger
and Alexander (2014:19). The use of frameworks and indicators allows for valuable
comparative analysis to take place and provides insight into the many ways a country,
state or region could be vulnerable (Malone, 2009:9).
Various frameworks and indexes have been developed to model vulnerability and
sustainable development as elements of a conceptual cluster for integrative human–
environment research (Newell et al., 2005; Füssel, 2007). This includes the Pressure-
State-Response (PSR) model of environmental impact (OECD, 1993), which reminds of
the PAR model; the Expanded-Vulnerability Framework (Turner et al., 2003b); the Social
Vulnerability Index (SoVI) developed by Cutter et al. (2003); the CSD indicators and DSR
framework for sustainable development by UN-DESA (2007); the disaster resilience of
165
place (DROP) model by Cutter et al. (2008); the SeVI model by Holland (2011), and the
MOVE framework by Birkmann et al. (2013). Vulnerability frameworks are also developed
for specific hazards, such as the Extreme Heat vulnerability framework developed by
Wilhelmi and Hayden (2010) and vulnerability indicators for flood disasters by Kuhlicke et
al. (2011). These models and frameworks are contextualised by authors such as
Birkmann (2006b), Lundgren and Jonsson (2012), and Arma ș and Gavriș (2013).
An overview of a selected few is useful to draw from current approaches and provide a
bridge to the development of a data model in Chapter 8. This chapter gives an overview
of indicators and frameworks described in literature for the purpose of identifying
commonalities between disaster risk management, environmental management and
development planning. It provides a structuralist view of the elements that define
vulnerability and environmental sensitivity, and helps to identify the underlying
relationships with the larger, overarching socio-environmental system.
Chapter 6 first defines the meaning of ‘indicators’ and ‘frameworks’, to highlight their
importance in science and practice. Thereafter, three groups of frameworks are explored:
vulnerability, sustainable development, and environmental frameworks. This will be
followed by a description of GIS-based frameworks to provide a focus on different spatial-
orientated approaches, and a conclusion.
6.1 INDICATORS AND FRAMEWORKS
The theoretical grounding of indicators and frameworks are discussed in the next sub-
sections.
6.2.1 Indicators
The interest in measurement and indicators in social science developed in the early
1970s is described in depth by the editors and co-authors of the volume Toward a metric
of science: The Advent of Science Indicators (Elkana et al., 1973). They advocate the
use of quantitative measurements in the science of sociology. This development
introduces an inter-disciplinary approach, as reflected by the representation of different
disciplines in this volume, including mathematics, economics and statistics.
166
An indicator can be defined as “a parameter or a value derived from parameters, which
provides information about a phenomenon” (OECD, 1993:5). According to Jörn Birkmann
(2006a), indicators are defined differently by different authors. Within the discourse of
measuring sustainable development, for example, it is defined as “a sign that summarises
information relevant to a particular phenomenon”. Vulnerability or hazard indicators, on
the other hand, are defined as “a variable which is an operational representation of a
characteristic or quality of a system able to provide information regarding the
susceptibility, coping capacity and resilience of a system to an impact of an albeit ill-
defined event linked with a hazard of natural origin” Birkmann (2006a:57). Indicators, and
in general scientific indicators, are a necessary part of the stream of information we use to
understand the world (Meadows, 1998:1). They serve as modes that shape knowledge
and order values (Yehuda et al., 1973:5) and can be used to make a particular statement
with regard to a particular issue (Birkmann, 1999:121).
In science there is a large body of literature on indicators and their use in decision making
(Turnhout, Hisschemöller & Eijsackers, 2007:216). Indicators are used widely to monitor
complex systems (Elkana et al., 1978:1; Meadows, 1998:1). For example, in an aircraft,
the air speed indicator monitors the speed of airflow over the wings, which is required to
maintain flight. Medical personnel use a thermometer to monitor the body temperature of
a patient. In both examples the particular indicator values are not just an indicator of
speed or body temperature, but an indicator of state, i.e. safety or health (refer to
Niemeijer and De Groot, 2008:15 in respect of health indicator). Furthermore, they are
also indicative of thresholds below or above which life-threatening situations can evolve.
Indicators have significance that extends beyond the properties directly associated with
the parameter value. Indicators therefore possess a synthetic meaning and are
developed for a specific purpose (OECD, 1993; Stevens, 2005; Boulanger, 2008).
Indicators are not only used to describe, but also to undertake comparative analysis and
assessments (Birkmann, 1999:122).
The primary function of indicators is to communicate. As such it demands simplicity to
reduce the complexity of reality and provide critical information about the condition of
something. Indicators also have the defining character of quantifying information so that
its significance is more readily apparent (Hammond & Woodward, 1995; Smeets &
Weterings, 1999:5). Hammond & Woodward (1995:1) state that indicators “communicate
information about progress toward social goals such as sustainable development”. They
present a means of communication by reducing the number of measurements and
parameters that normally would be required to give an exact presentation of a situation,
167
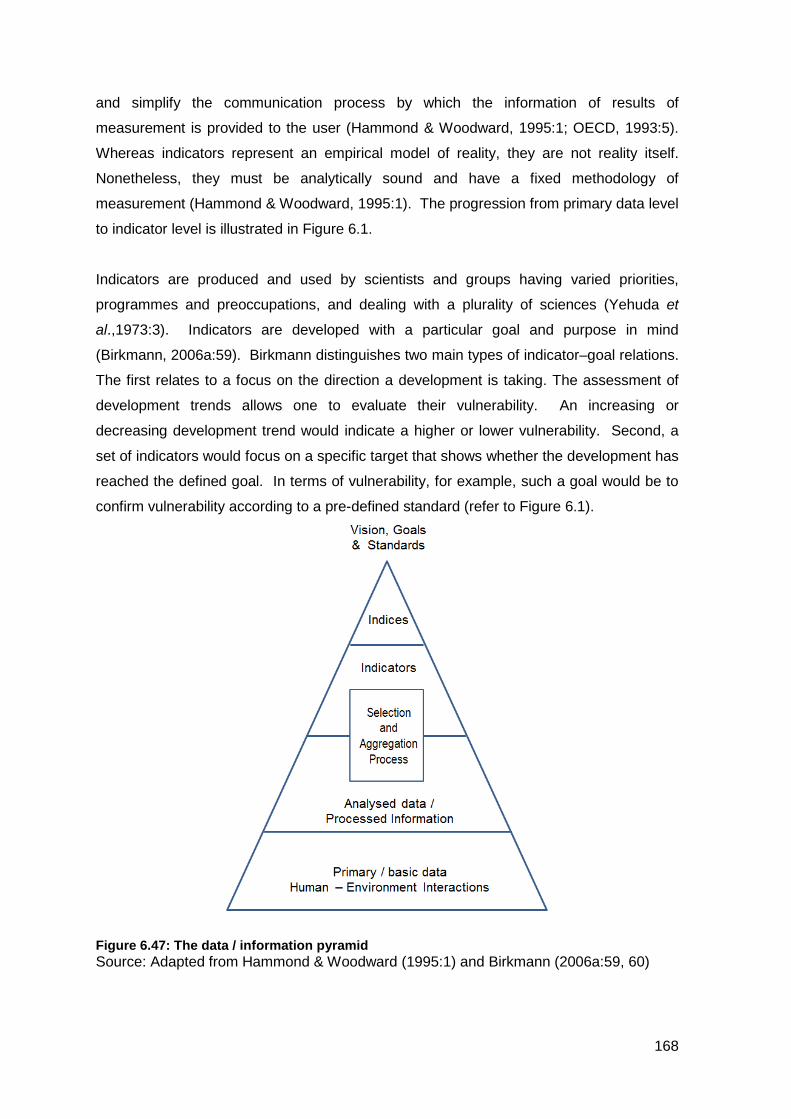
and simplify the communication process by which the information of results of
measurement is provided to the user (Hammond & Woodward, 1995:1; OECD, 1993:5).
Whereas indicators represent an empirical model of reality, they are not reality itself.
Nonetheless, they must be analytically sound and have a fixed methodology of
measurement (Hammond & Woodward, 1995:1). The progression from primary data level
to indicator level is illustrated in Figure 6.1.
Indicators are produced and used by scientists and groups having varied priorities,
programmes and preoccupations, and dealing with a plurality of sciences (Yehuda et
al.,1973:3). Indicators are developed with a particular goal and purpose in mind
(Birkmann, 2006a:59). Birkmann distinguishes two main types of indicator–goal relations.
The first relates to a focus on the direction a development is taking. The assessment of
development trends allows one to evaluate their vulnerability. An increasing or
decreasing development trend would indicate a higher or lower vulnerability. Second, a
set of indicators would focus on a specific target that shows whether the development has
reached the defined goal. In terms of vulnerability, for example, such a goal would be to
confirm vulnerability according to a pre-defined standard (refer to Figure 6.1).
Figure 6.47: The data / information pyramid Source: Adapted from Hammond & Woodward (1995:1) and Birkmann (2006a:59, 60)
168
In the context of this research, the development and use of indicators in disaster risk
management and environmental management is explored to highlight its value for
assessment, and particularly how it is used to represent reality by using GIS technology.
6.2.2 Frameworks
The goal of a conceptual framework is to categorise and describe the concepts relevant to
the topic of a specific study (Miles & Huberman, 1944; Rocco & Plakhotnik 2009:122). It
explains the main things to be studied: the key factors, constructs or variables, and the
relationships among them. Relevant theory and empirical research that help to organise
the conceptual framework are incorporated by qualitative researchers to view overlaps,
contradictions, refinements or qualifications. Rocco and Plakhotnik (2009) highlight the
relevance of frameworks in scientific study by stating that all empirical studies, both
qualitative and quantitative, are connected to a framework of literature that binds its ‘big
ideas’. The main ideas and the network of relationships between them are demonstrated
in conceptual frameworks.
Frameworks are useful in content analysis, and are used to reduce and summarise text
(the main source of data in qualitative research) (Krippendorf, 2004). According to Miles
and Huberman (1944:22), conceptual frameworks are best done graphically, rather than
in text. This way discrete phenomena can be visualised in ‘bins’, the relationships among
them can be mapped, and variables that are functionally distinct can be divided. As a
graphic illustration, the researcher works with all the information at once at the inference
level. This functionality of frameworks is illustrated by its use throughout this thesis.
Frameworks are used extensively to illustrate the underpinnings of concepts such as
vulnerability and sustainable development. The next section gives an overview of
frameworks and indicators described in literature that have been developed to analyse
and describe vulnerability, sustainable development and environmental status. Lastly, the
use of indicators in GIS illustrates the integration abilities of structured data models.
169
6.2 AN OVERVIEW OF INTEGRATED VULNERABILITY FRAMEWORKS AND INDICATORS
It is widely accepted that vulnerability is multidimensional, and often difficult to define and
be observed (Cutter et al., 2003; Clichevsky, 2003; Cardona, 2004; Birkmann, 2006:56;
Tate, 2012:325). Cutter (1996) identifies three distinct themes in vulnerability studies:
i. Vulnerability is a pre-existing condition.
ii. It is a social construct.
iii. It is conceived as a biophysical risk and social response within a specific
geographic space.
As a pre-existing condition, vulnerability is perceived as an internal risk factor of the
subject or system that is exposed to a hazard (Cardona, 2004). Furthermore, vulnerability
implies a specific disciplinary focus, as in social vulnerability, or economic vulnerability, or
structural engineering vulnerability, etc. (Wisner, 2004:183). Therefore, the analysis of
vulnerability relates to multiple aspects arising from physical, social, economic and
environmental factors that are interacting in space and time (Ciurean et al., 2013:3). As
an ontology, this premise constitutes the foundation for the development of vulnerability
frameworks that range from simplistic (e.g. Bohle, 2001) to multi-faceted
conceptualisations (e.g. Birkmann et al., 2013).
As vulnerability is a major aspect of this study, a selection of vulnerability frameworks has
been chosen to describe its components as viewed from different perspectives. To
choose from the abundance of models in literature is difficult. Birkmann (2005:4) states
that it is impossible to include every approach towards the measurement of vulnerability,
and concludes that by examining selected representative approaches, their differences
and similarities can be analysed and their differences and similarities be understood. The
frameworks chosen for analysis in this chapter are representative of different approaches,
and are also indicative of advances in theory and technological development. They are
first summarised as follows, and then described in further detail.
i. The dual structure of vulnerability (Bohle, 2001).
ii. The coupled human–environment nature of vulnerability (Turner et al., 2003a;
Birkmann, 2005).
iii. The multi-faceted nature of vulnerability (Birkmann et al., 2013).
170
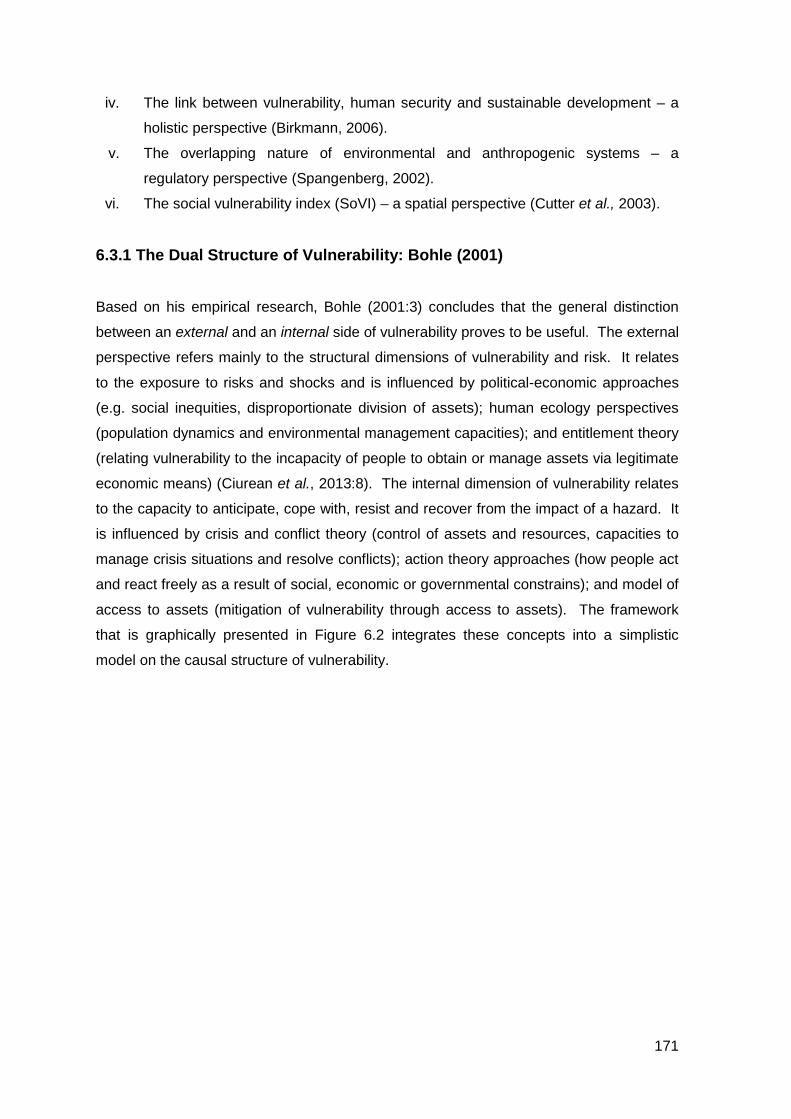
iv. The link between vulnerability, human security and sustainable development – a
holistic perspective (Birkmann, 2006).
v. The overlapping nature of environmental and anthropogenic systems – a
regulatory perspective (Spangenberg, 2002).
vi. The social vulnerability index (SoVI) – a spatial perspective (Cutter et al., 2003).
6.3.1 The Dual Structure of Vulnerability: Bohle (2001)
Based on his empirical research, Bohle (2001:3) concludes that the general distinction
between an external and an internal side of vulnerability proves to be useful. The external
perspective refers mainly to the structural dimensions of vulnerability and risk. It relates
to the exposure to risks and shocks and is influenced by political-economic approaches
(e.g. social inequities, disproportionate division of assets); human ecology perspectives
(population dynamics and environmental management capacities); and entitlement theory
(relating vulnerability to the incapacity of people to obtain or manage assets via legitimate
economic means) (Ciurean et al., 2013:8). The internal dimension of vulnerability relates
to the capacity to anticipate, cope with, resist and recover from the impact of a hazard. It
is influenced by crisis and conflict theory (control of assets and resources, capacities to
manage crisis situations and resolve conflicts); action theory approaches (how people act
and react freely as a result of social, economic or governmental constrains); and model of
access to assets (mitigation of vulnerability through access to assets). The framework
that is graphically presented in Figure 6.2 integrates these concepts into a simplistic
model on the causal structure of vulnerability.
171
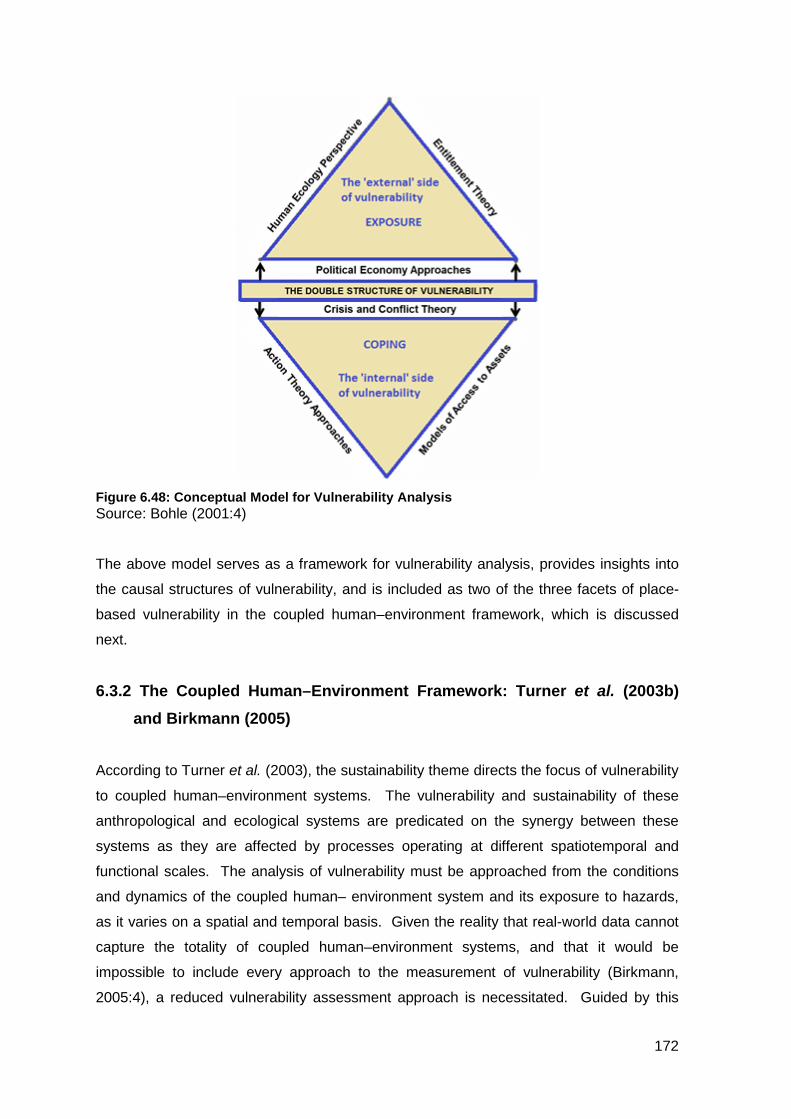
Figure 6.48: Conceptual Model for Vulnerability Analysis Source: Bohle (2001:4)
The above model serves as a framework for vulnerability analysis, provides insights into
the causal structures of vulnerability, and is included as two of the three facets of place-
based vulnerability in the coupled human–environment framework, which is discussed
next.
6.3.2 The Coupled Human–Environment Framework: Turner et al. (2003b) and Birkmann (2005)
According to Turner et al. (2003), the sustainability theme directs the focus of vulnerability
to coupled human–environment systems. The vulnerability and sustainability of these
anthropological and ecological systems are predicated on the synergy between these
systems as they are affected by processes operating at different spatiotemporal and
functional scales. The analysis of vulnerability must be approached from the conditions
and dynamics of the coupled human– environment system and its exposure to hazards,
as it varies on a spatial and temporal basis. Given the reality that real-world data cannot
capture the totality of coupled human–environment systems, and that it would be
impossible to include every approach to the measurement of vulnerability (Birkmann,
2005:4), a reduced vulnerability assessment approach is necessitated. Guided by this
172
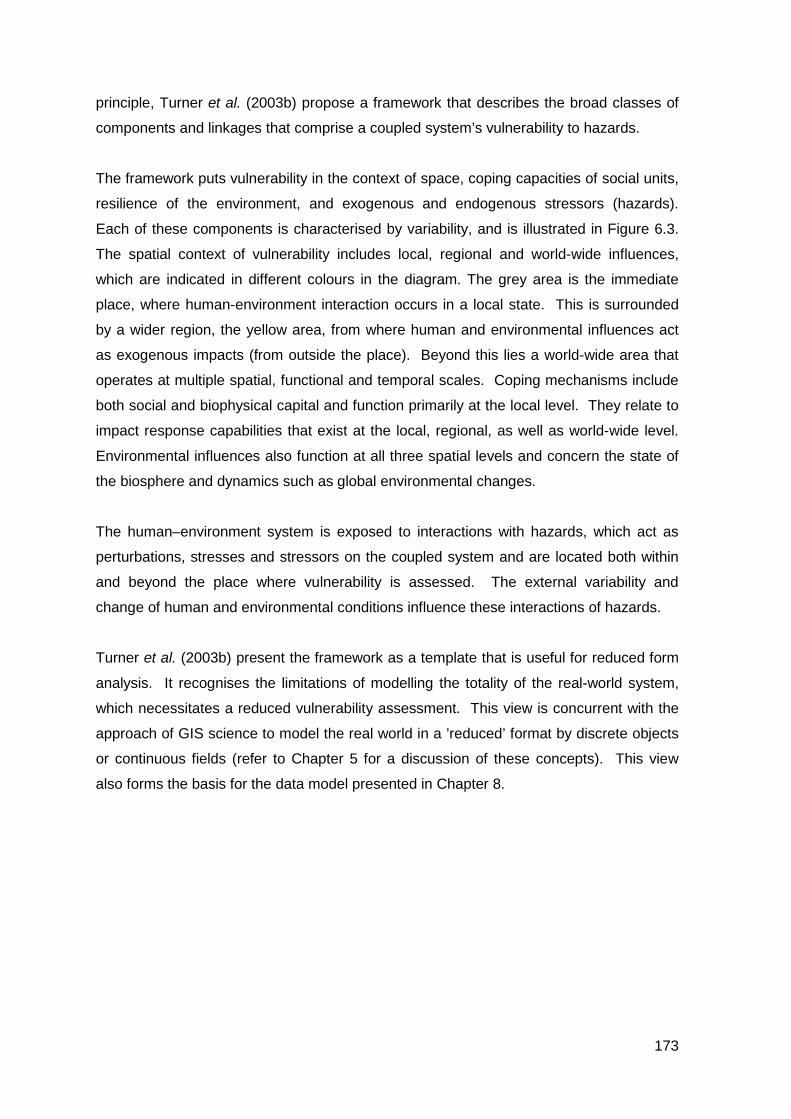
principle, Turner et al. (2003b) propose a framework that describes the broad classes of
components and linkages that comprise a coupled system’s vulnerability to hazards.
The framework puts vulnerability in the context of space, coping capacities of social units,
resilience of the environment, and exogenous and endogenous stressors (hazards).
Each of these components is characterised by variability, and is illustrated in Figure 6.3.
The spatial context of vulnerability includes local, regional and world-wide influences,
which are indicated in different colours in the diagram. The grey area is the immediate
place, where human-environment interaction occurs in a local state. This is surrounded
by a wider region, the yellow area, from where human and environmental influences act
as exogenous impacts (from outside the place). Beyond this lies a world-wide area that
operates at multiple spatial, functional and temporal scales. Coping mechanisms include
both social and biophysical capital and function primarily at the local level. They relate to
impact response capabilities that exist at the local, regional, as well as world-wide level.
Environmental influences also function at all three spatial levels and concern the state of
the biosphere and dynamics such as global environmental changes.
The human–environment system is exposed to interactions with hazards, which act as
perturbations, stresses and stressors on the coupled system and are located both within
and beyond the place where vulnerability is assessed. The external variability and
change of human and environmental conditions influence these interactions of hazards.
Turner et al. (2003b) present the framework as a template that is useful for reduced form
analysis. It recognises the limitations of modelling the totality of the real-world system,
which necessitates a reduced vulnerability assessment. This view is concurrent with the
approach of GIS science to model the real world in a ’reduced’ format by discrete objects
or continuous fields (refer to Chapter 5 for a discussion of these concepts). This view
also forms the basis for the data model presented in Chapter 8.
173
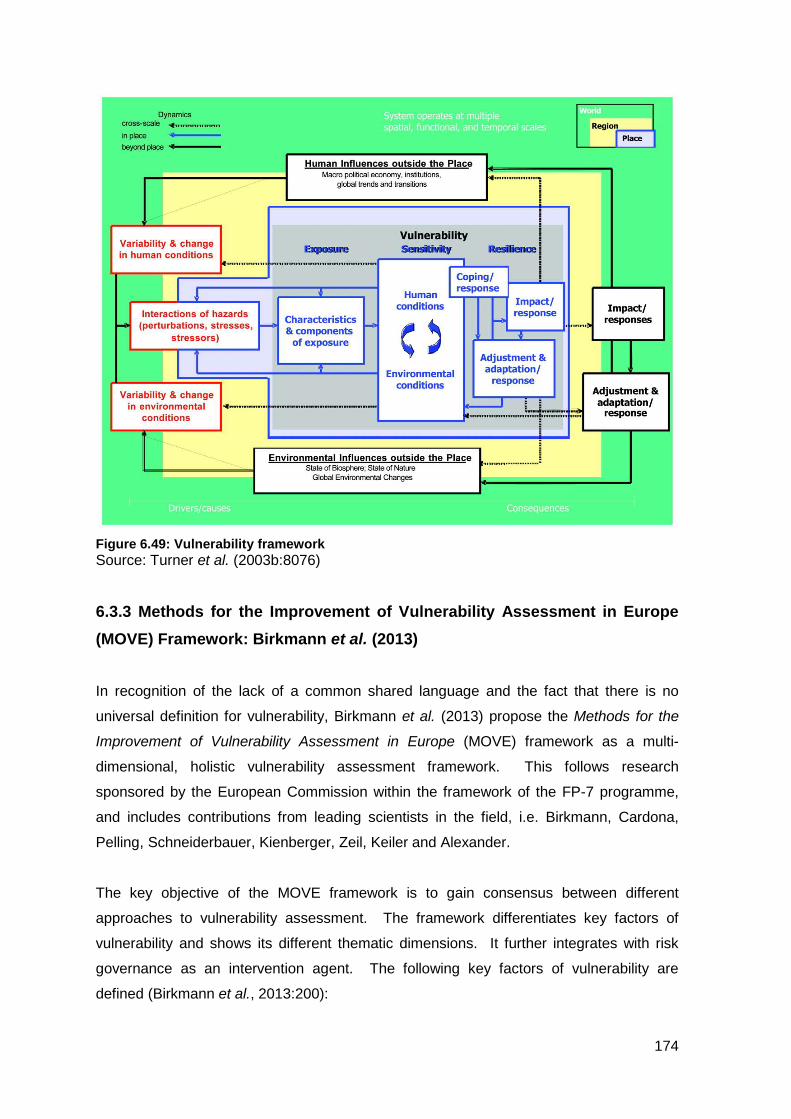
Figure 6.49: Vulnerability framework Source: Turner et al. (2003b:8076)
6.3.3 Methods for the Improvement of Vulnerability Assessment in Europe (MOVE) Framework: Birkmann et al. (2013)
In recognition of the lack of a common shared language and the fact that there is no
universal definition for vulnerability, Birkmann et al. (2013) propose the Methods for the
Improvement of Vulnerability Assessment in Europe (MOVE) framework as a multi-
dimensional, holistic vulnerability assessment framework. This follows research
sponsored by the European Commission within the framework of the FP-7 programme,
and includes contributions from leading scientists in the field, i.e. Birkmann, Cardona,
Pelling, Schneiderbauer, Kienberger, Zeil, Keiler and Alexander.
The key objective of the MOVE framework is to gain consensus between different
approaches to vulnerability assessment. The framework differentiates key factors of
vulnerability and shows its different thematic dimensions. It further integrates with risk
governance as an intervention agent. The following key factors of vulnerability are
defined (Birkmann et al., 2013:200):
174
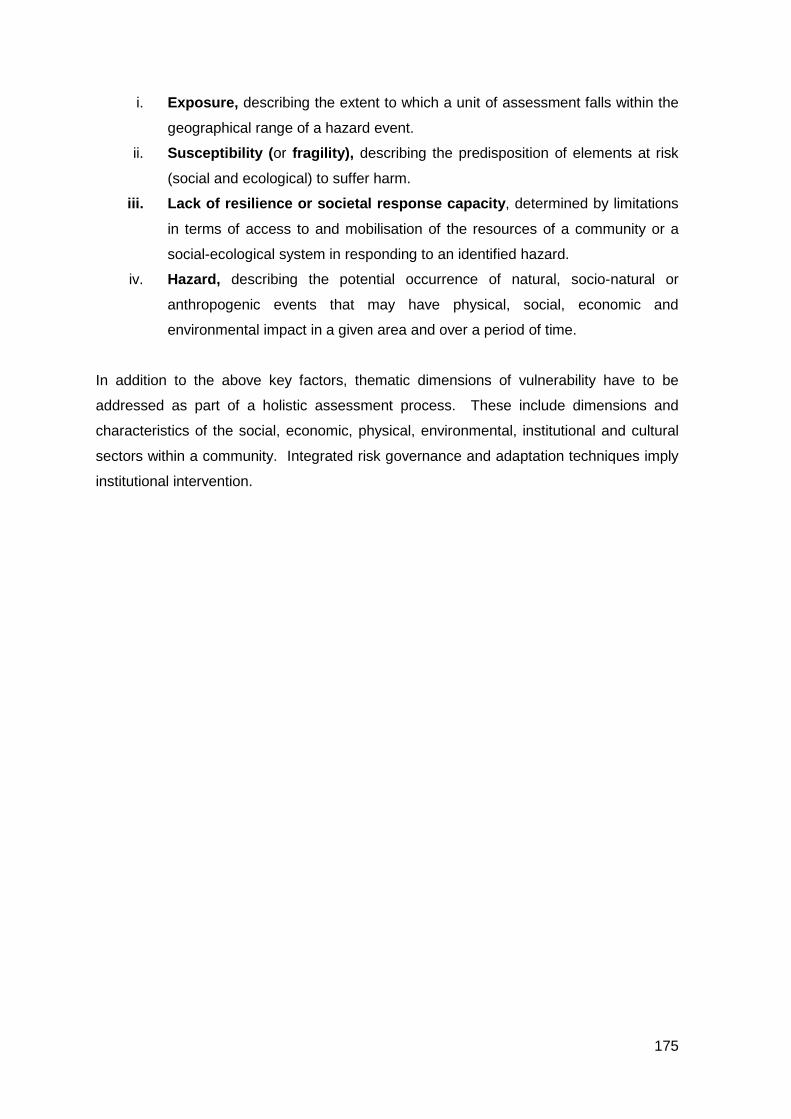
i. Exposure, describing the extent to which a unit of assessment falls within the
geographical range of a hazard event.
ii. Susceptibility (or fragility), describing the predisposition of elements at risk
(social and ecological) to suffer harm.
iii. Lack of resilience or societal response capacity, determined by limitations
in terms of access to and mobilisation of the resources of a community or a
social-ecological system in responding to an identified hazard. iv. Hazard, describing the potential occurrence of natural, socio-natural or
anthropogenic events that may have physical, social, economic and
environmental impact in a given area and over a period of time.
In addition to the above key factors, thematic dimensions of vulnerability have to be
addressed as part of a holistic assessment process. These include dimensions and
characteristics of the social, economic, physical, environmental, institutional and cultural
sectors within a community. Integrated risk governance and adaptation techniques imply
institutional intervention.
175
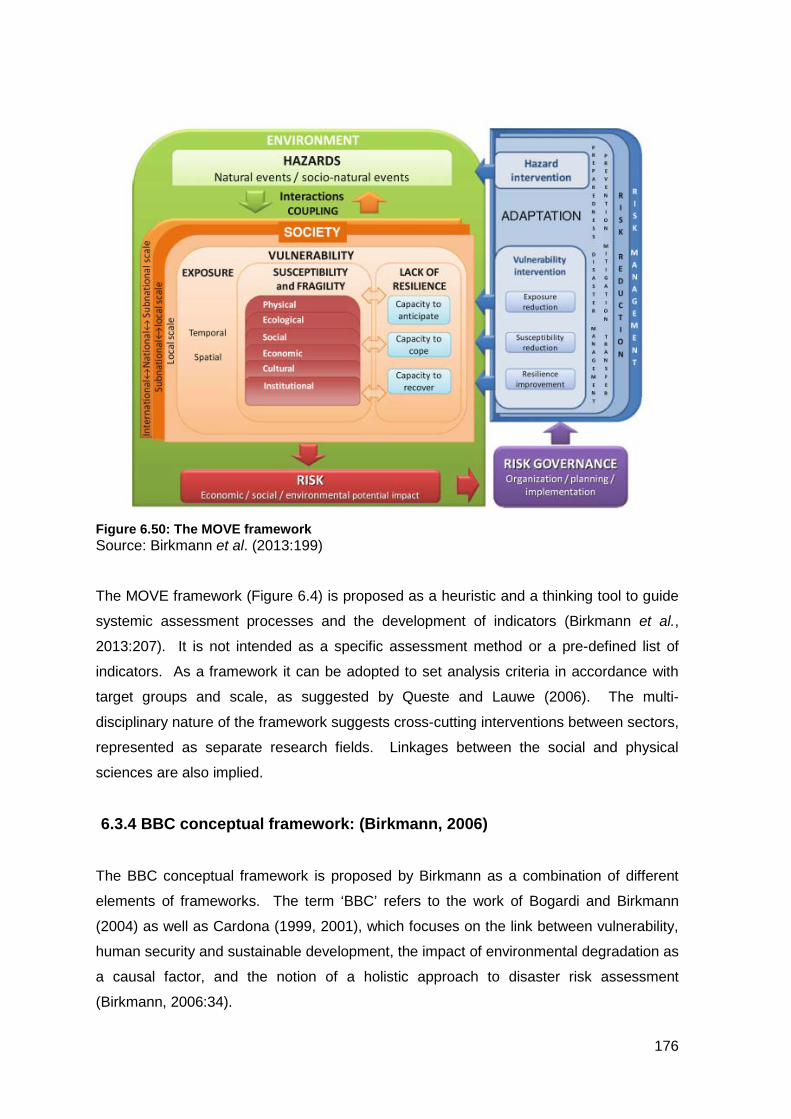
Figure 6.50: The MOVE framework Source: Birkmann et al. (2013:199)
The MOVE framework (Figure 6.4) is proposed as a heuristic and a thinking tool to guide
systemic assessment processes and the development of indicators (Birkmann et al.,
2013:207). It is not intended as a specific assessment method or a pre-defined list of
indicators. As a framework it can be adopted to set analysis criteria in accordance with
target groups and scale, as suggested by Queste and Lauwe (2006). The multi-
disciplinary nature of the framework suggests cross-cutting interventions between sectors,
represented as separate research fields. Linkages between the social and physical
sciences are also implied.
6.3.4 BBC conceptual framework: (Birkmann, 2006)
The BBC conceptual framework is proposed by Birkmann as a combination of different
elements of frameworks. The term ‘BBC’ refers to the work of Bogardi and Birkmann
(2004) as well as Cardona (1999, 2001), which focuses on the link between vulnerability,
human security and sustainable development, the impact of environmental degradation as
a causal factor, and the notion of a holistic approach to disaster risk assessment
(Birkmann, 2006:34).
176
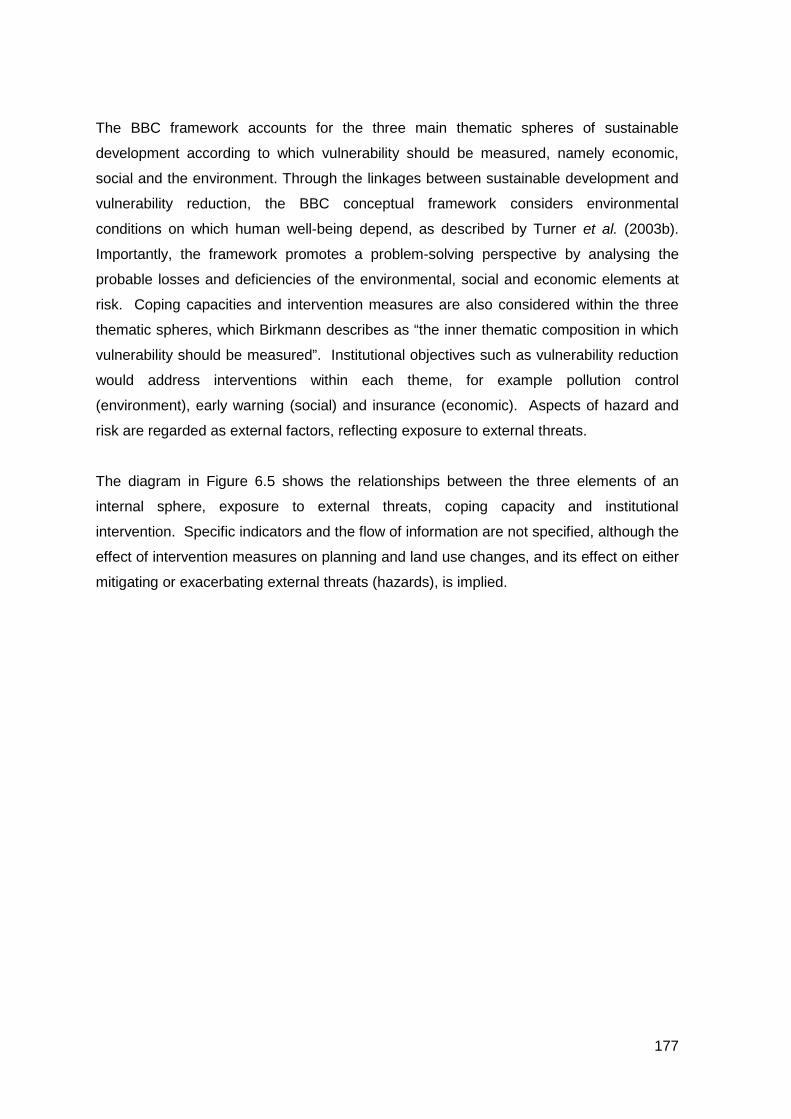
The BBC framework accounts for the three main thematic spheres of sustainable
development according to which vulnerability should be measured, namely economic,
social and the environment. Through the linkages between sustainable development and
vulnerability reduction, the BBC conceptual framework considers environmental
conditions on which human well-being depend, as described by Turner et al. (2003b).
Importantly, the framework promotes a problem-solving perspective by analysing the
probable losses and deficiencies of the environmental, social and economic elements at
risk. Coping capacities and intervention measures are also considered within the three
thematic spheres, which Birkmann describes as “the inner thematic composition in which
vulnerability should be measured”. Institutional objectives such as vulnerability reduction
would address interventions within each theme, for example pollution control
(environment), early warning (social) and insurance (economic). Aspects of hazard and
risk are regarded as external factors, reflecting exposure to external threats.
The diagram in Figure 6.5 shows the relationships between the three elements of an
internal sphere, exposure to external threats, coping capacity and institutional
intervention. Specific indicators and the flow of information are not specified, although the
effect of intervention measures on planning and land use changes, and its effect on either
mitigating or exacerbating external threats (hazards), is implied.
177
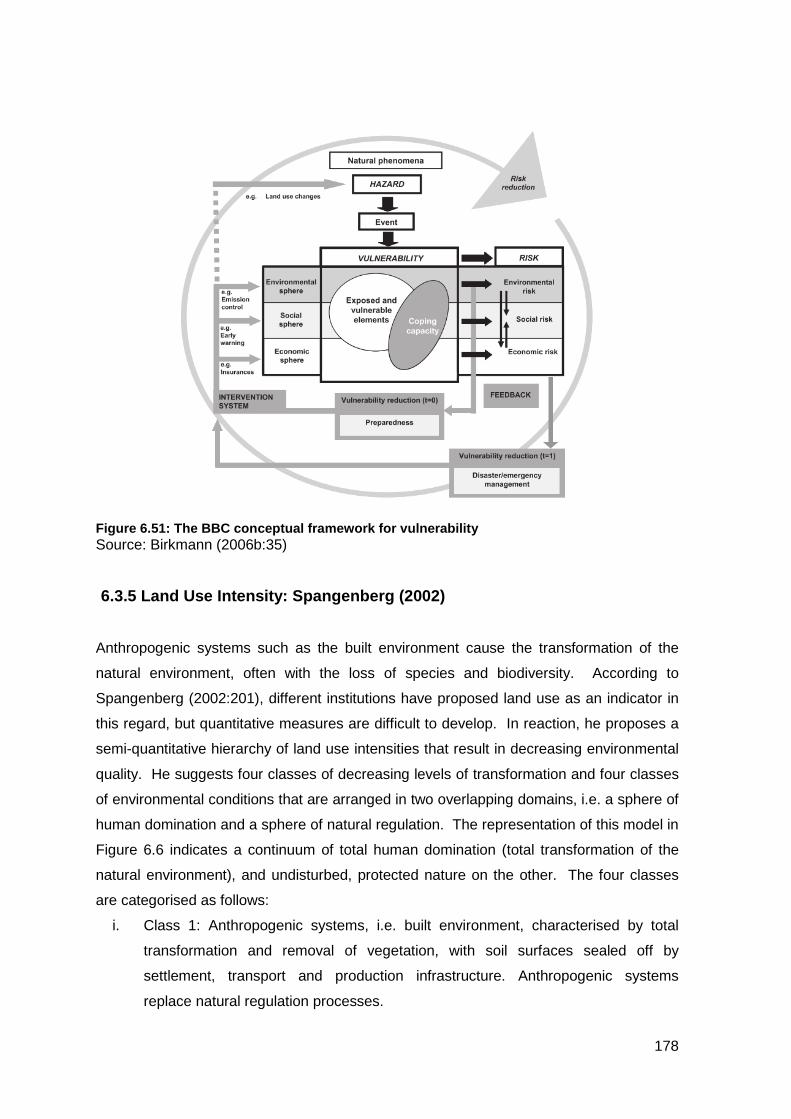
Figure 6.51: The BBC conceptual framework for vulnerability Source: Birkmann (2006b:35)
6.3.5 Land Use Intensity: Spangenberg (2002)
Anthropogenic systems such as the built environment cause the transformation of the
natural environment, often with the loss of species and biodiversity. According to
Spangenberg (2002:201), different institutions have proposed land use as an indicator in
this regard, but quantitative measures are difficult to develop. In reaction, he proposes a
semi-quantitative hierarchy of land use intensities that result in decreasing environmental
quality. He suggests four classes of decreasing levels of transformation and four classes
of environmental conditions that are arranged in two overlapping domains, i.e. a sphere of
human domination and a sphere of natural regulation. The representation of this model in
Figure 6.6 indicates a continuum of total human domination (total transformation of the
natural environment), and undisturbed, protected nature on the other. The four classes
are categorised as follows:
i. Class 1: Anthropogenic systems, i.e. built environment, characterised by total
transformation and removal of vegetation, with soil surfaces sealed off by
settlement, transport and production infrastructure. Anthropogenic systems
replace natural regulation processes.
178
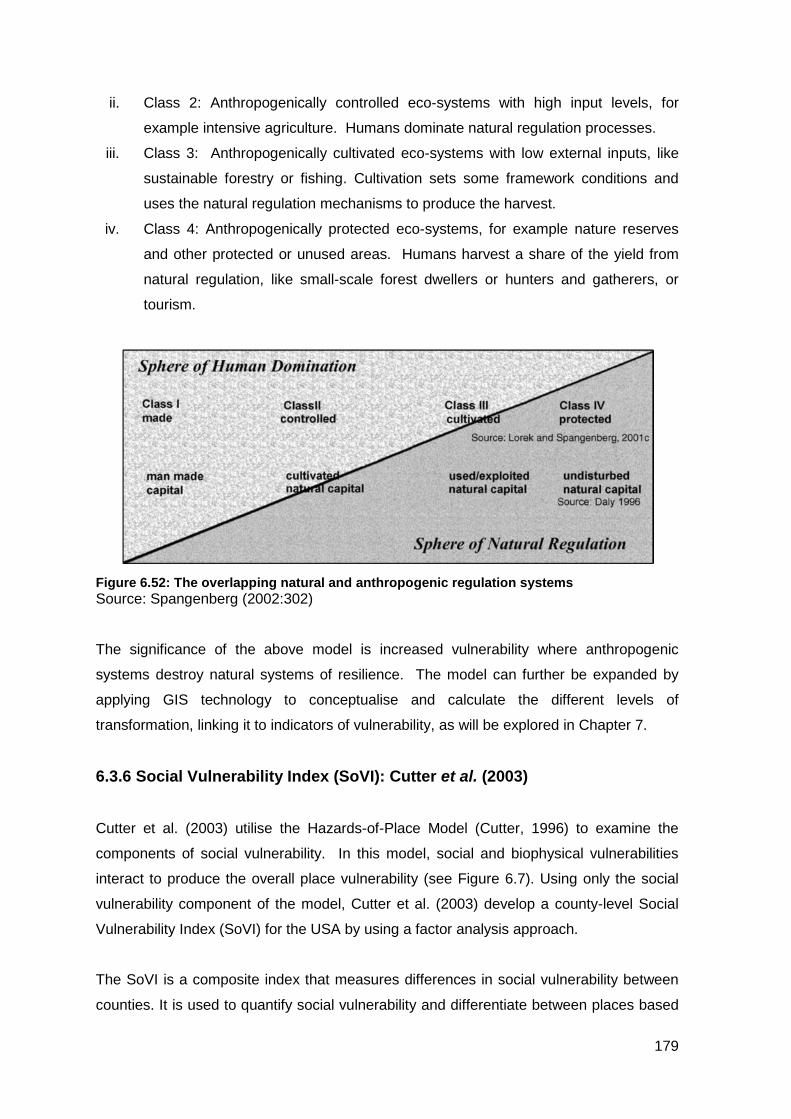
ii. Class 2: Anthropogenically controlled eco-systems with high input levels, for
example intensive agriculture. Humans dominate natural regulation processes.
iii. Class 3: Anthropogenically cultivated eco-systems with low external inputs, like
sustainable forestry or fishing. Cultivation sets some framework conditions and
uses the natural regulation mechanisms to produce the harvest.
iv. Class 4: Anthropogenically protected eco-systems, for example nature reserves
and other protected or unused areas. Humans harvest a share of the yield from
natural regulation, like small-scale forest dwellers or hunters and gatherers, or
tourism.
Figure 6.52: The overlapping natural and anthropogenic regulation systems Source: Spangenberg (2002:302)
The significance of the above model is increased vulnerability where anthropogenic
systems destroy natural systems of resilience. The model can further be expanded by
applying GIS technology to conceptualise and calculate the different levels of
transformation, linking it to indicators of vulnerability, as will be explored in Chapter 7.
6.3.6 Social Vulnerability Index (SoVI): Cutter et al. (2003)
Cutter et al. (2003) utilise the Hazards-of-Place Model (Cutter, 1996) to examine the
components of social vulnerability. In this model, social and biophysical vulnerabilities
interact to produce the overall place vulnerability (see Figure 6.7). Using only the social
vulnerability component of the model, Cutter et al. (2003) develop a county-level Social
Vulnerability Index (SoVI) for the USA by using a factor analysis approach.
The SoVI is a composite index that measures differences in social vulnerability between
counties. It is used to quantify social vulnerability and differentiate between places based
179
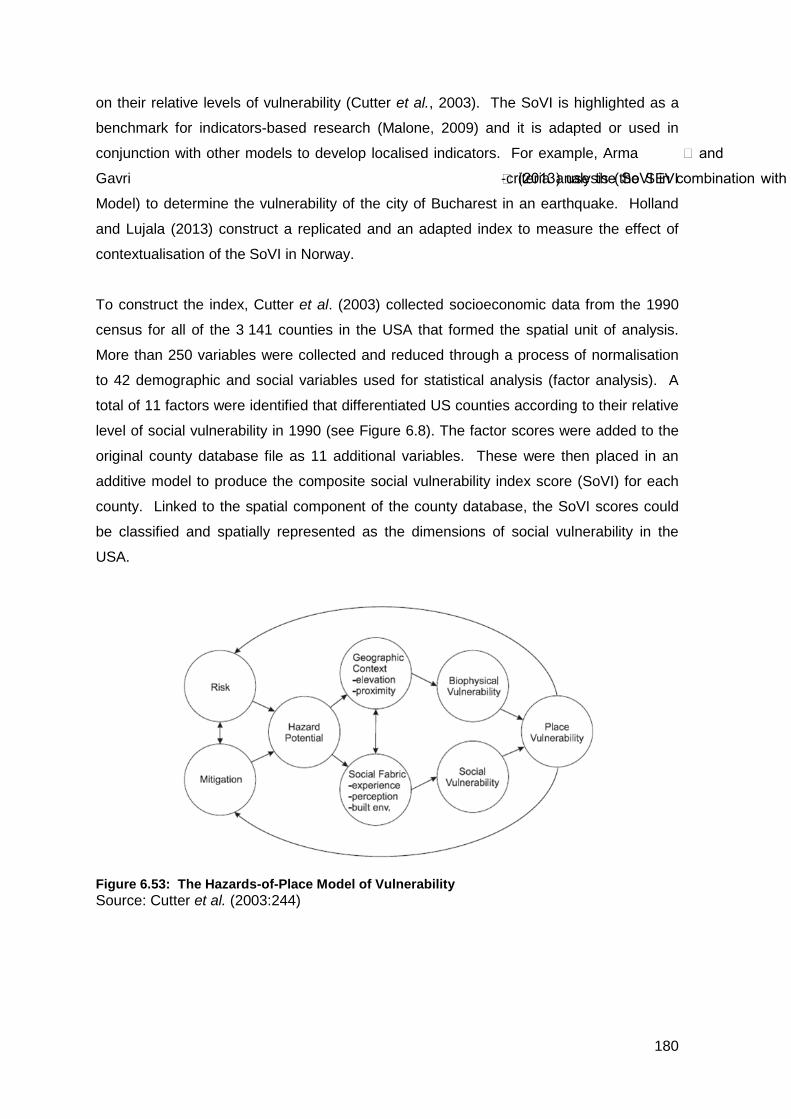
on their relative levels of vulnerability (Cutter et al., 2003). The SoVI is highlighted as a
benchmark for indicators-based research (Malone, 2009) and it is adapted or used in
conjunction with other models to develop localised indicators. For example, Arma ș and
Gavri ș (2013) use the SoVI in combination with -criteria analysis (the SEVI
Model) to determine the vulnerability of the city of Bucharest in an earthquake. Holland
and Lujala (2013) construct a replicated and an adapted index to measure the effect of
contextualisation of the SoVI in Norway.
To construct the index, Cutter et al. (2003) collected socioeconomic data from the 1990
census for all of the 3 141 counties in the USA that formed the spatial unit of analysis.
More than 250 variables were collected and reduced through a process of normalisation
to 42 demographic and social variables used for statistical analysis (factor analysis). A
total of 11 factors were identified that differentiated US counties according to their relative
level of social vulnerability in 1990 (see Figure 6.8). The factor scores were added to the
original county database file as 11 additional variables. These were then placed in an
additive model to produce the composite social vulnerability index score (SoVI) for each
county. Linked to the spatial component of the county database, the SoVI scores could
be classified and spatially represented as the dimensions of social vulnerability in the
USA.
Figure 6.53: The Hazards-of-Place Model of Vulnerability Source: Cutter et al. (2003:244)
180
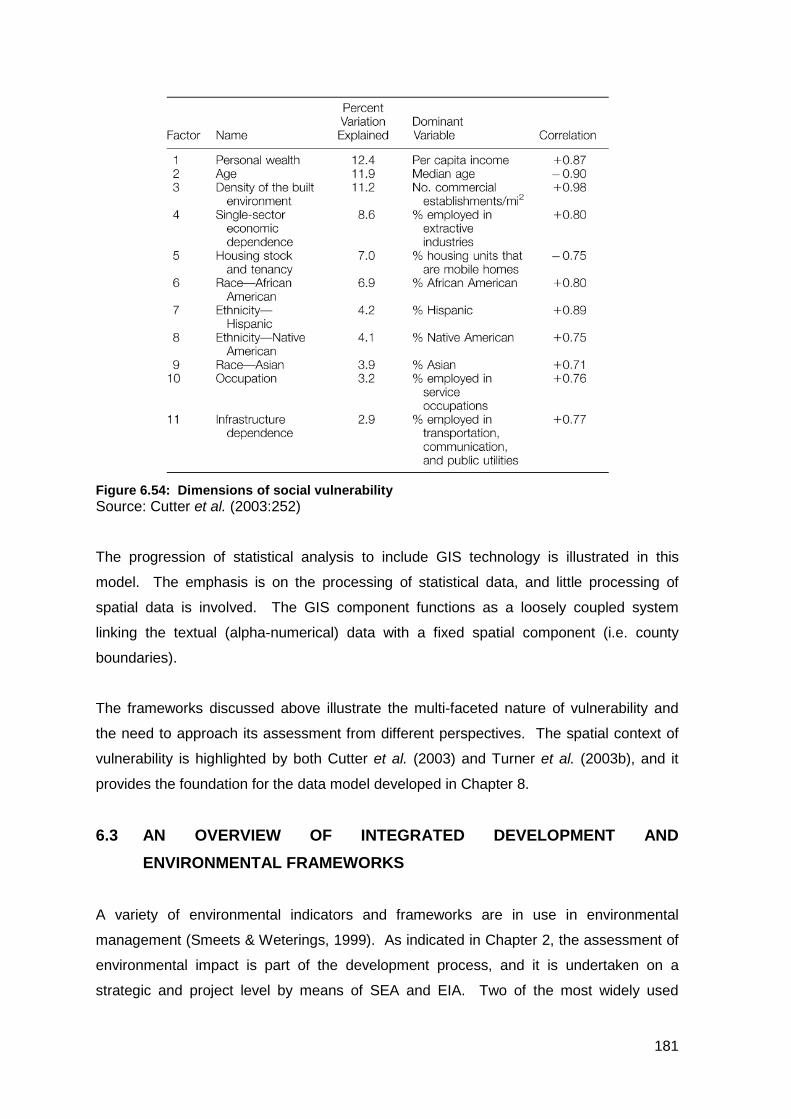
Figure 6.54: Dimensions of social vulnerability Source: Cutter et al. (2003:252)
The progression of statistical analysis to include GIS technology is illustrated in this
model. The emphasis is on the processing of statistical data, and little processing of
spatial data is involved. The GIS component functions as a loosely coupled system
linking the textual (alpha-numerical) data with a fixed spatial component (i.e. county
boundaries).
The frameworks discussed above illustrate the multi-faceted nature of vulnerability and
the need to approach its assessment from different perspectives. The spatial context of
vulnerability is highlighted by both Cutter et al. (2003) and Turner et al. (2003b), and it
provides the foundation for the data model developed in Chapter 8.
6.3 AN OVERVIEW OF INTEGRATED DEVELOPMENT AND ENVIRONMENTAL FRAMEWORKS
A variety of environmental indicators and frameworks are in use in environmental
management (Smeets & Weterings, 1999). As indicated in Chapter 2, the assessment of
environmental impact is part of the development process, and it is undertaken on a
strategic and project level by means of SEA and EIA. Two of the most widely used
181
frameworks to assess the interaction between environment and development are the
Pressure-State-Response (PSR) and the Drivers-Pressure-State-Impact-Response
(DPSIR) frameworks (Tapio & Williamo, 2008; Thornhill, 2014). The PSR model is used
in state of the environment reports (SoER) and environmental education, while the DPSIR
framework is used by the European Environment Agency (EEA) and its member states in
reporting activities. A brief overview of these two frameworks provides further context to
vulnerability assessment as discussed in the previous section, notably the coupled
human–environment framework.
6.3.1 The PSR and DPSIR Frameworks The Pressure-State-Response (PSR) framework was initially developed by the
Organisation for Economic Co-operation and Development (OECD) in the 1980s to
provide an overview of the pressures of human activities on the environment, the state of
the environment, and natural resources, and to structure its work on environmental
policies and reporting (OECD, 2003:21; Tapio & Willamo, 2008:125). The model
highlights these cause-effect relationships and provides a means of selecting and
organising indicators. The most frequently used version of the framework is presented in
Figure 6.9.
Environmental pressures describe the pressures that human activities exert on the
environment and on natural resources. This includes direct pressures (e.g. the use of
resources and the discharge of pollutants and waste materials) and indirect pressures
(related to human activities and trends of environmental significance). Indicators of
environmental pressures are closely related to production and consumption patterns; they
often reflect emission or resource use intensities, along with related trends and changes
over a given period (OECD, 2003:21).
Environmental conditions relate to the quality of the environment and the quality and
quantity of natural resources, and they reflect the impact of environmental policies.
Indicators of environmental conditions are designed to give an overview of the situation
(the state) concerning the environment. Examples of indicators include the concentration
of pollutants in the air, soil or water, the exceedance of critical loads, and the status of
wildlife and ecosystems (OECD, 2003:21).
Societal responses show the extent to which society responds to environmental concerns.
They refer to individual and collective actions and reactions intended to mitigate, adapt to
182
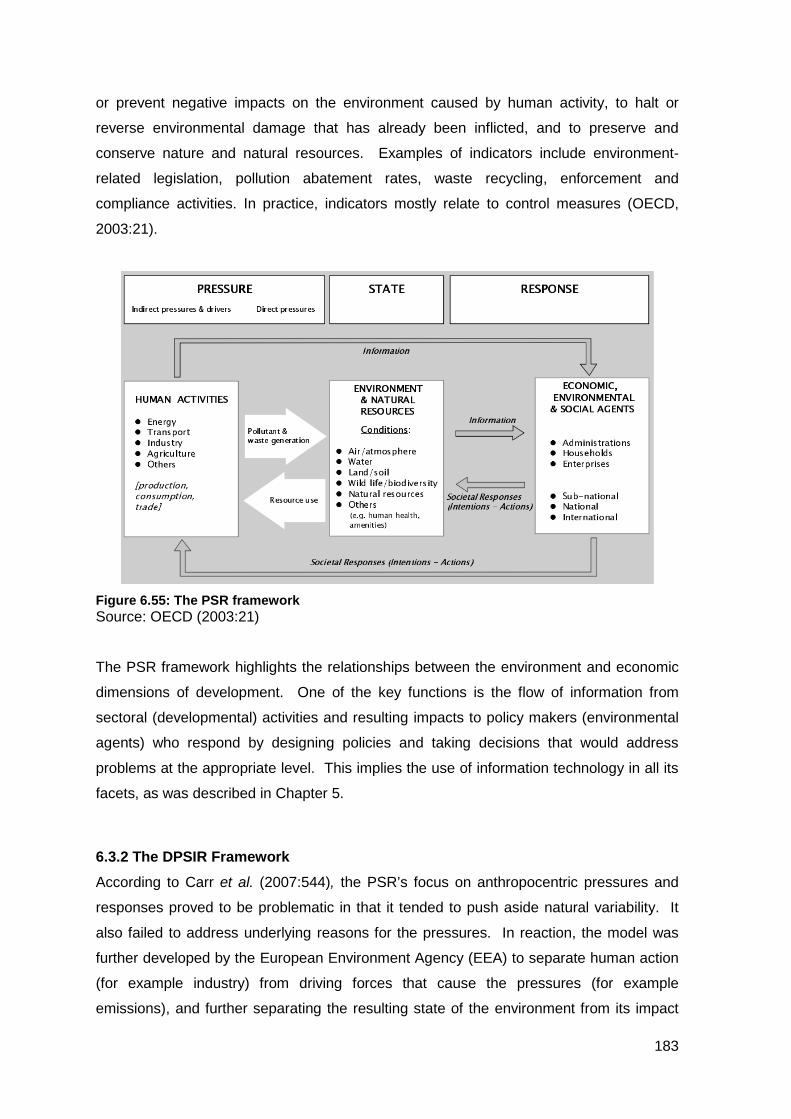
or prevent negative impacts on the environment caused by human activity, to halt or
reverse environmental damage that has already been inflicted, and to preserve and
conserve nature and natural resources. Examples of indicators include environment-
related legislation, pollution abatement rates, waste recycling, enforcement and
compliance activities. In practice, indicators mostly relate to control measures (OECD,
2003:21).
Figure 6.55: The PSR framework Source: OECD (2003:21)
The PSR framework highlights the relationships between the environment and economic
dimensions of development. One of the key functions is the flow of information from
sectoral (developmental) activities and resulting impacts to policy makers (environmental
agents) who respond by designing policies and taking decisions that would address
problems at the appropriate level. This implies the use of information technology in all its
facets, as was described in Chapter 5.
6.3.2 The DPSIR Framework According to Carr et al. (2007:544), the PSR’s focus on anthropocentric pressures and
responses proved to be problematic in that it tended to push aside natural variability. It
also failed to address underlying reasons for the pressures. In reaction, the model was
further developed by the European Environment Agency (EEA) to separate human action
(for example industry) from driving forces that cause the pressures (for example
emissions), and further separating the resulting state of the environment from its impact
183
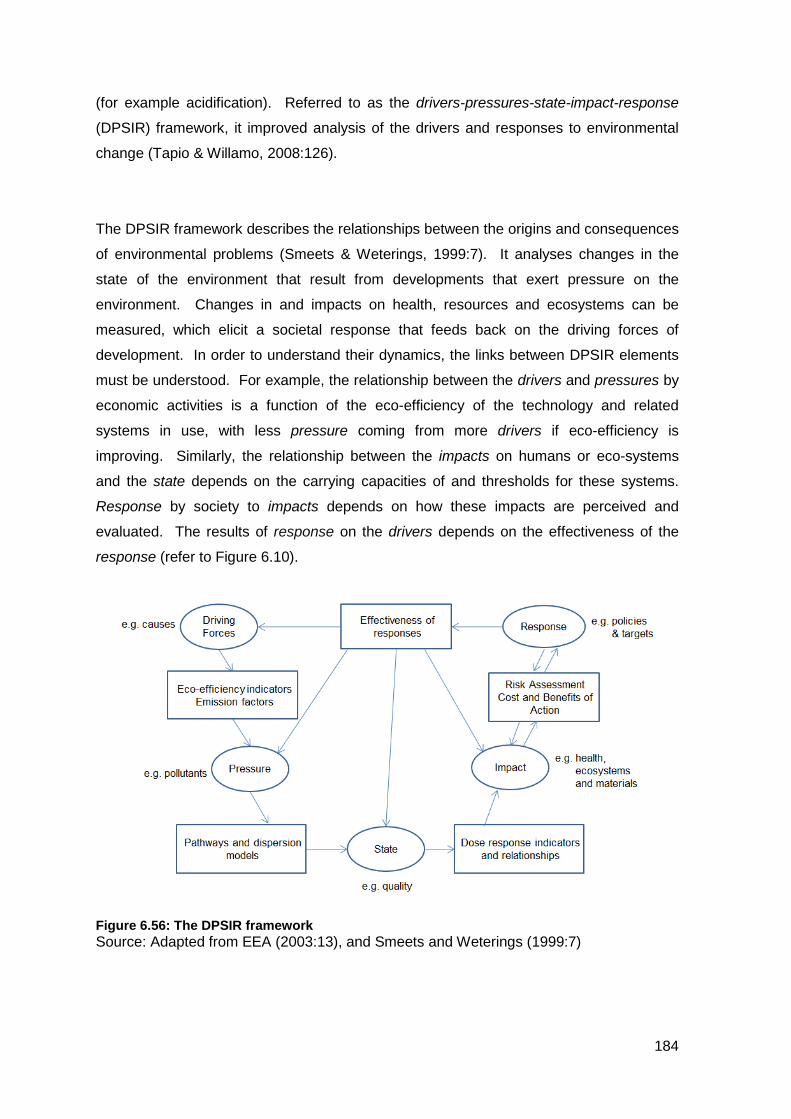
(for example acidification). Referred to as the drivers-pressures-state-impact-response
(DPSIR) framework, it improved analysis of the drivers and responses to environmental
change (Tapio & Willamo, 2008:126).
The DPSIR framework describes the relationships between the origins and consequences
of environmental problems (Smeets & Weterings, 1999:7). It analyses changes in the
state of the environment that result from developments that exert pressure on the
environment. Changes in and impacts on health, resources and ecosystems can be
measured, which elicit a societal response that feeds back on the driving forces of
development. In order to understand their dynamics, the links between DPSIR elements
must be understood. For example, the relationship between the drivers and pressures by
economic activities is a function of the eco-efficiency of the technology and related
systems in use, with less pressure coming from more drivers if eco-efficiency is
improving. Similarly, the relationship between the impacts on humans or eco-systems
and the state depends on the carrying capacities of and thresholds for these systems.
Response by society to impacts depends on how these impacts are perceived and
evaluated. The results of response on the drivers depends on the effectiveness of the
response (refer to Figure 6.10).
Figure 6.56: The DPSIR framework Source: Adapted from EEA (2003:13), and Smeets and Weterings (1999:7)
184
Further developments of the PSR and DPSIR were undertaken, but these frameworks
became the most widely used by institutions to assess the interaction between
environment and development (Smeets & Weterings, 1999; Carr et al., 2007; Thornhill,
2014).
6.4 THE USE OF INDICATORS IN GIS IN RESPECT OF DEVELOPMENT, ENVIRONMENTAL MANAGEMENT AND DISASTER RISK MANAGEMENT
Many demands to GIScience arise from the need to collect and analyse large amounts of
data on nature-society systems, and to present results in a meaningful way (Davis,
Fonseca & Camara, 2011). This premise indicates that the use and application of GIS
lies deeper than the need to present information on maps. In describing the role of
Geographic Information Science in the integration of people and nature, Davis, Fonseca &
Camara (2011) state that there is a need to improve our modelling skills in order to
analyse more complex systems and the interaction between human actions and natural
systems. They identify four main topics for a GIScience research agenda: modelling, data
collection, knowledge discovery, and support for policy making. Models are used to
simplify and approximate aspects of reality by reflecting on particular views thereof. In
terms of GIS, the intention of a model is therefore not to create a “mini Earth”, but to give
a spatial representation of some aspect. Data is collected for a particular use, linked to
spatial operations and the need to achieve a specific goal, as highlighted in Chapter 5.
Cutter et al. (2000:731) state that “hazard exposure and social susceptibility to hazards
must be understood within a geographic framework, that is, the hazardousness of a
specific place. This uniquely geographical concept considers the threat from all hazards in
a given place and provides the opportunity to mitigate several hazards concurrently”. The
concept of a place-based metric and measurement of environmental sensitivity, economic
growth and disaster risk has been extensively explored in literature, and forms a central
theme of this thesis. As an analogue of the above statement, it can be argued that
hazard exposure and social susceptibility to hazards, as well as environmental
susceptibility to development, are all interrelated concepts and that these
interrelationships must be understood within a geographic framework. The question is
how to meet the needs for spatial analysis in the context of GIS. Openshaw (1996:65)
asserts that much of the information that requires spatial analysis is zonal in nature.
Different types of zonal data are used to represent statistically processed data, for
example census blocks (Cutter et al., 2000), district boundaries (Cutter et al., 2003),
185

hexagonal tessellations (Game & Grantham, 2010; Nhancale & Smith, 2011), land facets
(Totte & Henquin, 1993; Beier & Brost, 2010), and Thiessen polygons (Longley et al.,
2005). These represent administrative boundaries, regular geometrical shapes, and
irregular geometrical shapes. The key characteristics of zonal data are that, being
polygon data, they do not overlap and there are no gaps in between. This is indicative of
a field data approach. Three case studies next describe the use of indicators in GIS to
spatially represent vulnerability, environmental sensitivity and economic status.
6.4.1 Multi-Criteria Decision Analysis: Georgetown Case Study (Cutter et al., 2000)
Cutter et al. (2000) describe the use of GIS to establish areas of vulnerability based on
twelve environmental threats and eight social characteristics for Georgetown County,
South Carolina, in the USA. They use a non-compensatory conjunctive method (Greene
et al., 2011:417) to combine various layers of spatial data representing different hazard
zones and vulnerability zones. Based on the hazards-of-place model of vulnerability
(Cutter, 1996) and primary tasks for hazard and vulnerability assessment as described in
Cutter et al. (1997), they produced an integrated dataset consisting of land facets and
census block boundaries, with indexed attribute values.
The process entailed an iterative process of data capture and integration. More than 25
different data layers of different hazard zone were created. All the layers were combined
into a single composite of intersecting polygons. Rating scores (based on the rate of
occurrence) were stored for each polygon. These were subsequently classed into deciles
and mapped to produce an integrated geospatial database and a visual display of
biophysical hazards.
The SoVI approach was used to calculate social vulnerability index values. Once the
index values were computed, they were assigned to each census block and entered into a
spatial data layer. The same procedure used to develop the composite biophysical hazard
dataset was used to create a social vulnerability dataset. The index values for each
variable were summed to arrive at a composite index score for each census block, which
represents an aggregate measure of social vulnerability. These values were also placed
into deciles.
By further combining the hazard and social vulnerability components, an overall
assessment of the vulnerability of Georgetown County was produced. The work of Cutter
186
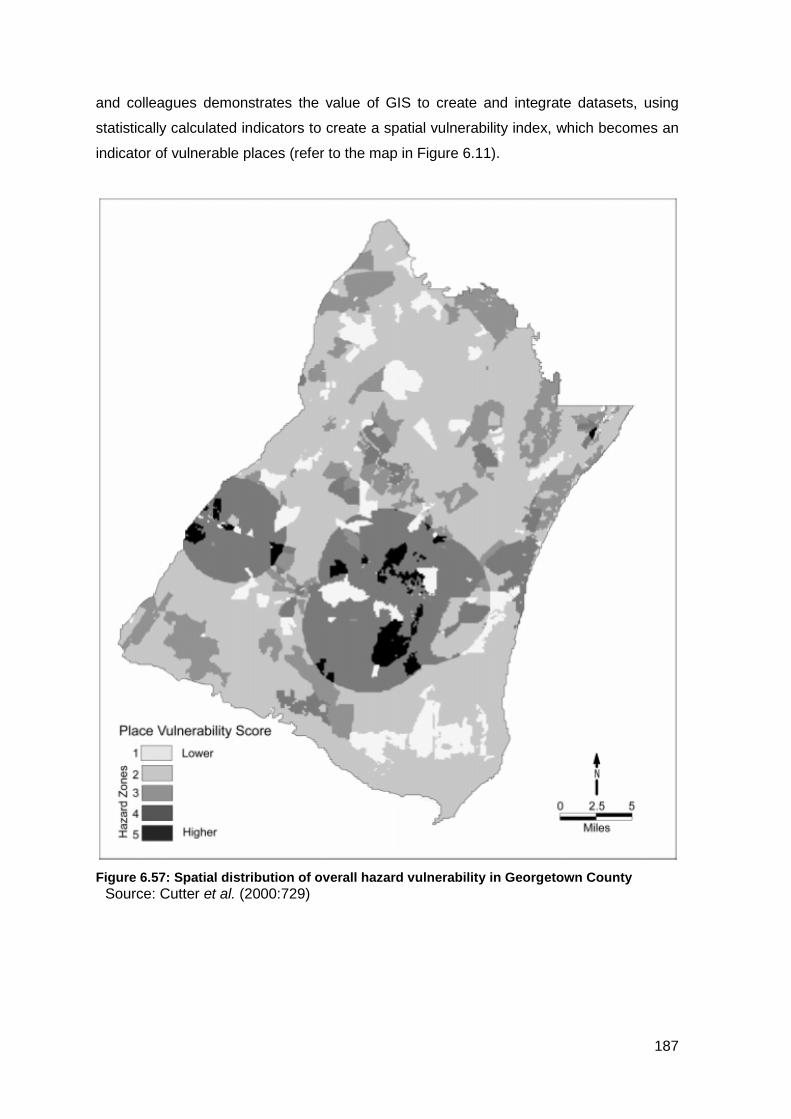
and colleagues demonstrates the value of GIS to create and integrate datasets, using
statistically calculated indicators to create a spatial vulnerability index, which becomes an
indicator of vulnerable places (refer to the map in Figure 6.11).
Figure 6.57: Spatial distribution of overall hazard vulnerability in Georgetown County
Source: Cutter et al. (2000:729)
187
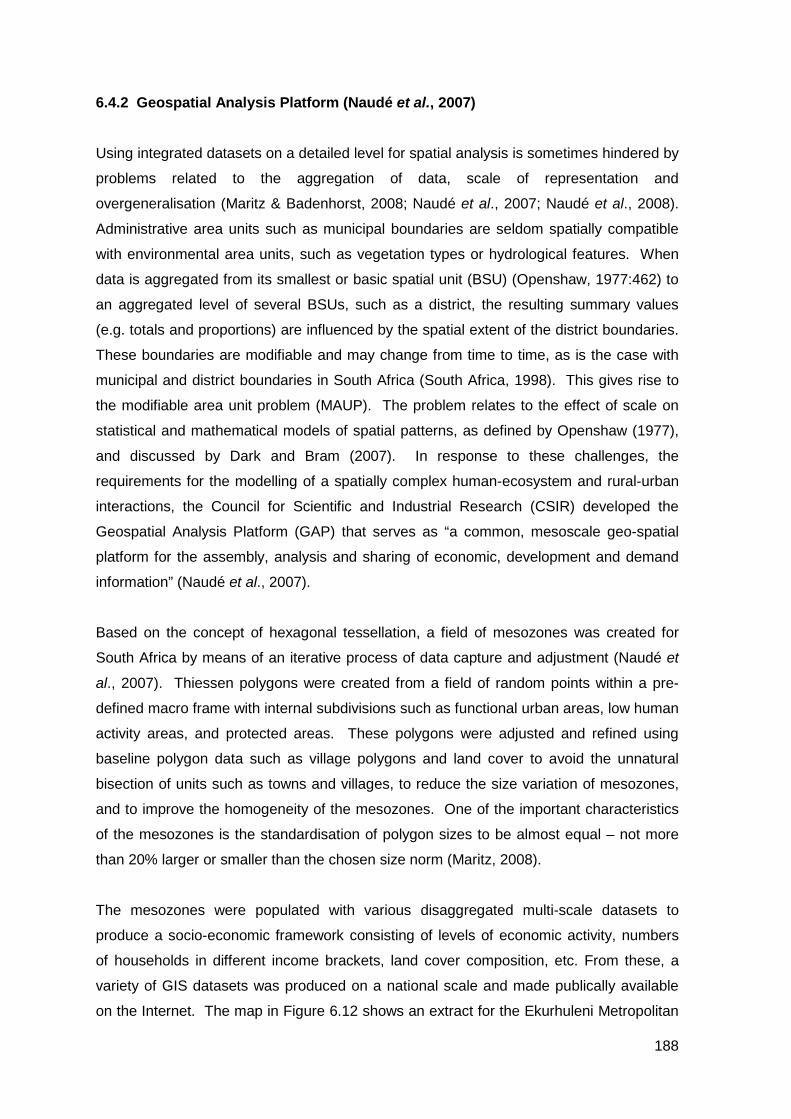
6.4.2 Geospatial Analysis Platform (Naudé et al., 2007)
Using integrated datasets on a detailed level for spatial analysis is sometimes hindered by
problems related to the aggregation of data, scale of representation and
overgeneralisation (Maritz & Badenhorst, 2008; Naudé et al., 2007; Naudé et al., 2008).
Administrative area units such as municipal boundaries are seldom spatially compatible
with environmental area units, such as vegetation types or hydrological features. When
data is aggregated from its smallest or basic spatial unit (BSU) (Openshaw, 1977:462) to
an aggregated level of several BSUs, such as a district, the resulting summary values
(e.g. totals and proportions) are influenced by the spatial extent of the district boundaries.
These boundaries are modifiable and may change from time to time, as is the case with
municipal and district boundaries in South Africa (South Africa, 1998). This gives rise to
the modifiable area unit problem (MAUP). The problem relates to the effect of scale on
statistical and mathematical models of spatial patterns, as defined by Openshaw (1977),
and discussed by Dark and Bram (2007). In response to these challenges, the
requirements for the modelling of a spatially complex human-ecosystem and rural-urban
interactions, the Council for Scientific and Industrial Research (CSIR) developed the
Geospatial Analysis Platform (GAP) that serves as “a common, mesoscale geo-spatial
platform for the assembly, analysis and sharing of economic, development and demand
information” (Naudé et al., 2007).
Based on the concept of hexagonal tessellation, a field of mesozones was created for
South Africa by means of an iterative process of data capture and adjustment (Naudé et
al., 2007). Thiessen polygons were created from a field of random points within a pre-
defined macro frame with internal subdivisions such as functional urban areas, low human
activity areas, and protected areas. These polygons were adjusted and refined using
baseline polygon data such as village polygons and land cover to avoid the unnatural
bisection of units such as towns and villages, to reduce the size variation of mesozones,
and to improve the homogeneity of the mesozones. One of the important characteristics
of the mesozones is the standardisation of polygon sizes to be almost equal – not more
than 20% larger or smaller than the chosen size norm (Maritz, 2008).
The mesozones were populated with various disaggregated multi-scale datasets to
produce a socio-economic framework consisting of levels of economic activity, numbers
of households in different income brackets, land cover composition, etc. From these, a
variety of GIS datasets was produced on a national scale and made publically available
on the Internet. The map in Figure 6.12 shows an extract for the Ekurhuleni Metropolitan
188
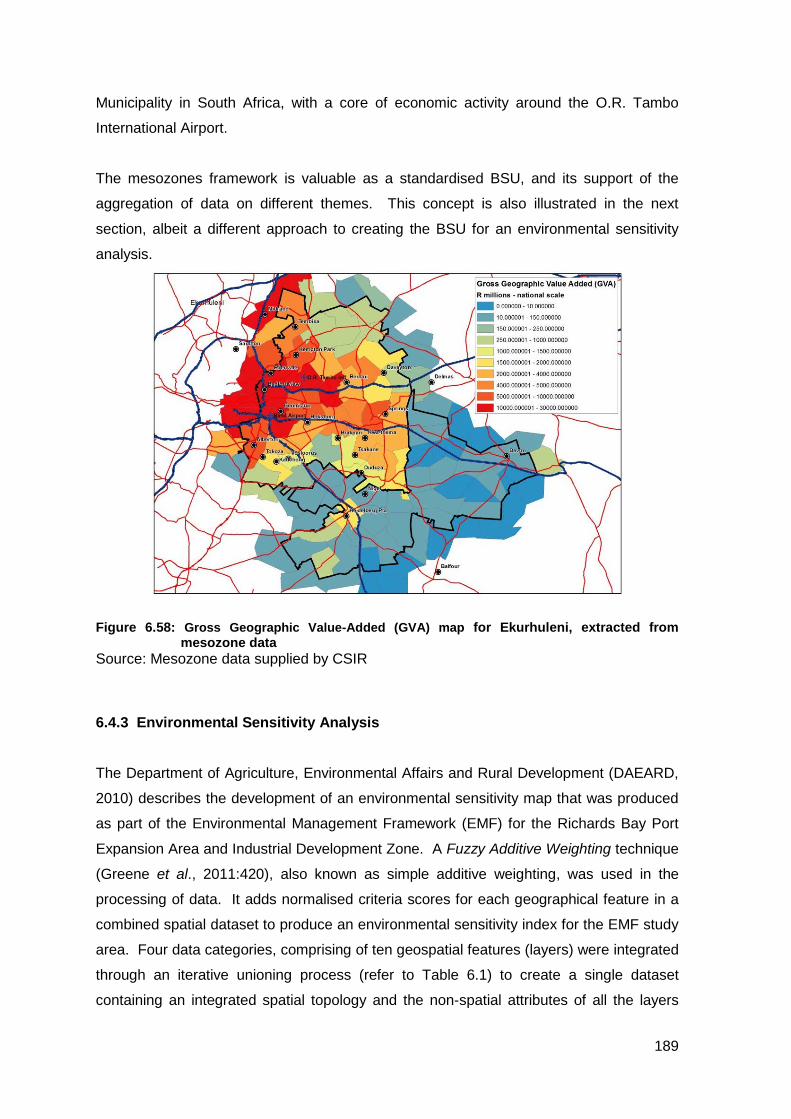
Municipality in South Africa, with a core of economic activity around the O.R. Tambo
International Airport.
The mesozones framework is valuable as a standardised BSU, and its support of the
aggregation of data on different themes. This concept is also illustrated in the next
section, albeit a different approach to creating the BSU for an environmental sensitivity
analysis.
Figure 6.58: Gross Geographic Value-Added (GVA) map for Ekurhuleni, extracted from
mesozone data Source: Mesozone data supplied by CSIR
6.4.3 Environmental Sensitivity Analysis
The Department of Agriculture, Environmental Affairs and Rural Development (DAEARD,
2010) describes the development of an environmental sensitivity map that was produced
as part of the Environmental Management Framework (EMF) for the Richards Bay Port
Expansion Area and Industrial Development Zone. A Fuzzy Additive Weighting technique
(Greene et al., 2011:420), also known as simple additive weighting, was used in the
processing of data. It adds normalised criteria scores for each geographical feature in a
combined spatial dataset to produce an environmental sensitivity index for the EMF study
area. Four data categories, comprising of ten geospatial features (layers) were integrated
through an iterative unioning process (refer to Table 6.1) to create a single dataset
containing an integrated spatial topology and the non-spatial attributes of all the layers
189
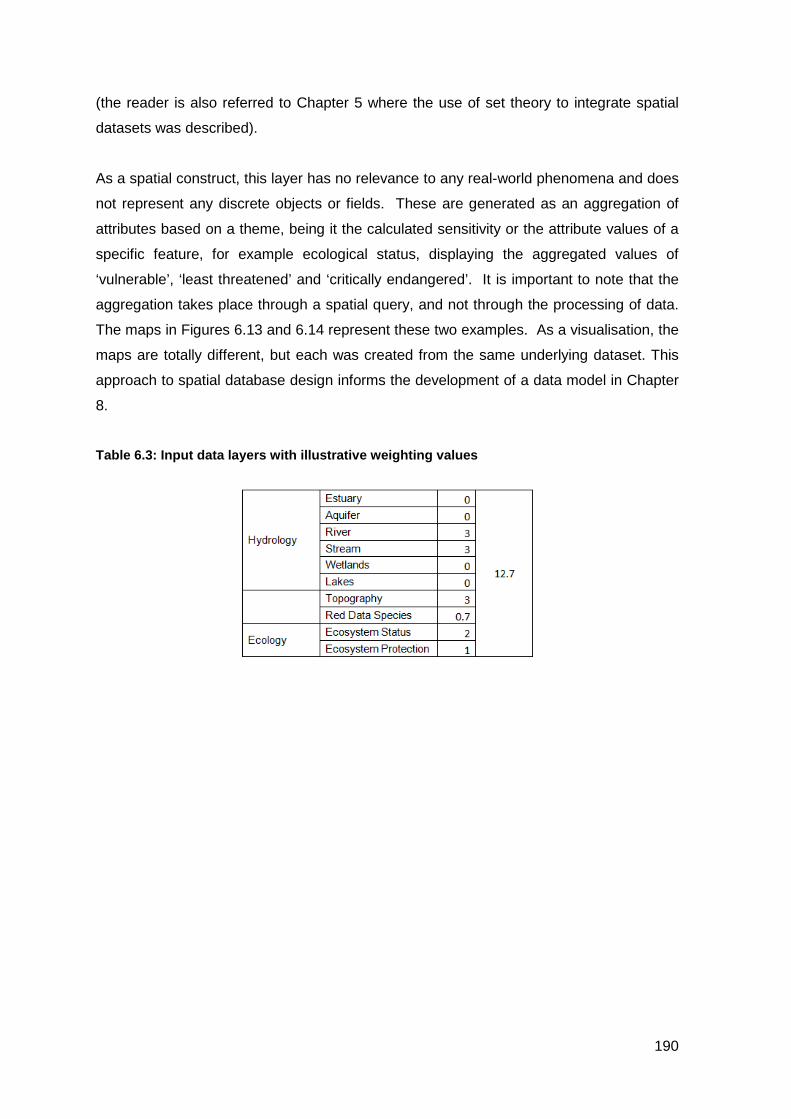
(the reader is also referred to Chapter 5 where the use of set theory to integrate spatial
datasets was described).
As a spatial construct, this layer has no relevance to any real-world phenomena and does
not represent any discrete objects or fields. These are generated as an aggregation of
attributes based on a theme, being it the calculated sensitivity or the attribute values of a
specific feature, for example ecological status, displaying the aggregated values of
‘vulnerable’, ‘least threatened’ and ‘critically endangered’. It is important to note that the
aggregation takes place through a spatial query, and not through the processing of data.
The maps in Figures 6.13 and 6.14 represent these two examples. As a visualisation, the
maps are totally different, but each was created from the same underlying dataset. This
approach to spatial database design informs the development of a data model in Chapter
8.
Table 6.3: Input data layers with illustrative weighting values
190

Figure 6.59: Sensitivity map for the EMF study area, created from facets data
Figure 6.60: Ecological status retrieved from the sensitivity facets dataset
191
6.5 CONCLUSION Chapter 6 provided an overview of the theoretical grounding of indicators and
frameworks, and how these have been applied in various ways to conceptualise
vulnerability, sustainable development and environmental sensitivity. Frameworks such
as the coupled human–environment system, the PSR and the DPSIR framework
demonstrate the multidimensional, and interrelated character of concepts such as
vulnerability and sustainable development. This gives answers to key research questions
by identifying the common focus areas in development management, environmental
management and disaster risk reduction, and by highlighting information as the common
entry point that will integrate development management, environmental management and
disaster risk management in a data model for vulnerability reduction.
At this juncture, the theoretical grounding of development planning, environmental
management, disaster risk management and geographic information systems has been
described. A synthesis of theories, and attempts to find commonalities between these
disciplines, are discussed next in Chapter 7.
192

CHAPTER 7: INTEGRATING DEVELOPMENT PLANNING, ENVIRONMENTAL MANAGEMENT, DISASTER RISK MANAGEMENT AND GIS
7.1 INTRODUCTION
The first part of this thesis focused on the exploration of theories that describe
development planning, environmental management, disaster risk management and
geographic information systems (Chapters 2, 3, 4 and 5). These disciplines are regarded
as relatively young, with a strong post-modernistic development tradition. Their
integration is explored along commonalities that are rooted in their ontological premises,
as the existence and development of their theories have been greatly debated, especially
in the development planning and disaster risk management fields.
This chapter serves to identify the commonalities between development planning,
environmental management and disaster risk management with the view to developing a
data model that provides the structure for integrating these fields from a spatial
information perspective. The findings are then drawn together in a matrix to get a visual
perspective of the degree of similarities, along the lines of which integration should be
explored. Finally, a GIS-based integration platform is presented, showing how
development planning, environmental management and disaster risk management can be
integrated through the flow of data and information.
7.2 MAIN FINDINGS AND CHARACTERISTICS
The main findings and characteristics of development planning, environmental
management, disaster risk management and geographic information science are
summarised in the sections below.
7.2.1 Development planning
Development planning is conceptualised in terms of development and planning.
Development thoughts are centred around economic growth, land use change and social
change, and they are rooted in mainly Western (First World) thoughts. Planning reflects
193
activities that aim to manage and control the development process. It is focused on
decision making in a post-modern tradition, with an emphasis on cooperative planning.
Development planning displays the following characteristics:
i. It is a multi-disciplinary field.
ii. It is spatially orientated.
iii. It concerns environmental degradation.
iv. It concerns social upliftment.
v. It is focused on sustainable development principles.
From a governance perspective, the principles of sustainable development are
entrenched in integrated development planning (IDP). Spatial development frameworks
provide a strategic and spatial context, whereas project plans direct development on a
project basis.
7.2.2 Environmental Management
In short, environmental management is concerned with caring for the Earth, and it focuses
on the mitigation or avoidance of environmental degradation. It is influenced by a strong
international agenda that is spearheaded by sustainable development objectives.
Strategic environmental assessment (SEA), environmental impact assessments (EIA) and
environmental management frameworks (EMF) have been developed as tools to support
environmental management.
Environmental management displays the following characteristics, which are identical to
those of development planning:
i. It is a multi-disciplinary field.
ii. It is spatially orientated.
iii. It addresses environmental degradation.
iv. It concerns social upliftment.
v. It is strongly focused on sustainable development principles.
7.2.3 Disaster Risk Management
The field of disaster risk management is relatively young and follows a history of strong
theoretical and practical development, from a hazard- and response-oriented discipline to
194
a pro-active field where the focus is on disaster risk reduction. Research is focused on
vulnerability reduction and the building of resilience. Information and communication play
an important role in disaster risk management, with GIS being a primary tool in modelling
vulnerability, monitoring the onset of possible hazardous events and assisting in post-
disaster assessments.
Disaster risk management displays the following characteristics, which show a close
resemblance to those of both development planning and environmental management:
i. It is a multi-disciplinary field.
ii. It is spatially orientated.
iii. It is directly influenced by environmental degradation.
iv. It largely concerns social upliftment.
v. Is directly influenced by development planning policy and systems.
7.2.4 Geographic information systems (GIS)
GIS developed as a relatively young science from early computer-based technology to
transform analogue maps into geo-spatial data. As a science, it is concerned with the
representation of spatial features as fields or discrete objects in a spatial database. As a
technology, it is concerned with providing decision support in a vast array of disciplines,
notably development planning, environmental management and disaster risk
management.
The main characteristics of GIS are the following:
i. It draws from information and database theory.
ii. It integrates spatial and non-spatial data.
iii. It deals with spatial relationships.
iv. It provides strong mapping capabilities.
v. It provides strong spatial analysis capabilities.
vi. It supports decision making.
195
7.3 INFERENCE: COMMONALITIES BETWEEN DEVELOPMENT PLANNING, ENVIRONMENTAL MANAGEMENT AND DISASTER RISK MANAGEMENT
Development planning, environmental management and disaster risk management mainly
have to deal with problem solving, and the same problem is often presented in each of
these disciplines, albeit in different ways. Phenomena such as urbanisation,
environmental pollution, depletion of resources, disasters, and social problems such as
poverty, are just symptoms of problems. Underneath these issues that are being sensed,
perceived and observed, lie complexities that define the development context and the real
challenges of an area. The causes of vulnerability in certain communities in South Africa,
for example, may be rooted in past apartheid-planning policies that segregated
communities and exposed them to environmental hazards. However, current-day policy
measures that have been introduced to address past injustices may very well facilitate
choices with inefficient attention to the environmental constraints of particular locations,
thereby increasing community vulnerability.
GIS has the capability to integrate information on vulnerable communities with areas of
hazard, and to create a better context for decision makers. The principle that information
is generated from data is a key aspect of information systems, and understanding the
concepts thereof provides insight into the integration of various fields along common
relationships. The outputs of GIS can therefore improve the development decision
capacity that causes vulnerability through planning and development projects by making
information available in a practical and usable format.
Integration possibilities between development planning, environmental planning and
disaster risk management are found in commonalities with regard to theoretical
approaches, theoretical grounding, interrelated planning mechanisms, integrative
governance, a shared developmental perspective (sustainable development) and,
importantly, the spatial contextualisation of problems and opportunities. The matrix in
Table 7.1 provides a synopsis of how these integration possibilities are structured.
196
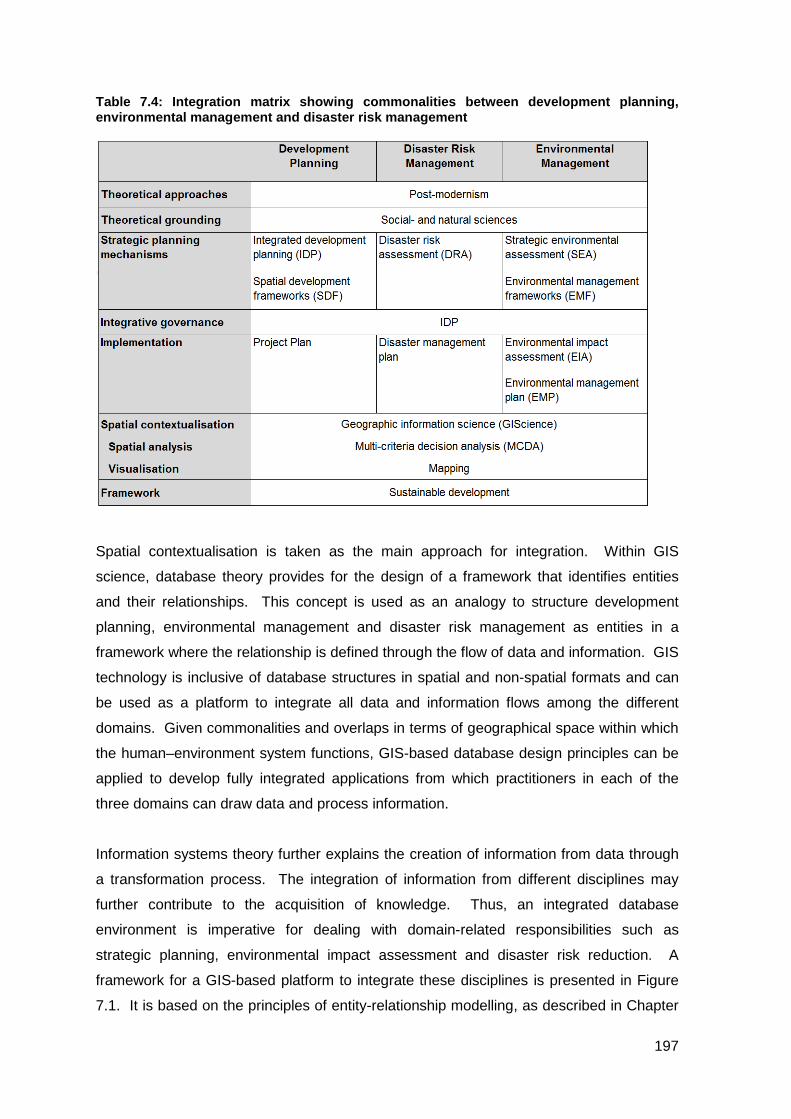
Table 7.4: Integration matrix showing commonalities between development planning, environmental management and disaster risk management
Spatial contextualisation is taken as the main approach for integration. Within GIS
science, database theory provides for the design of a framework that identifies entities
and their relationships. This concept is used as an analogy to structure development
planning, environmental management and disaster risk management as entities in a
framework where the relationship is defined through the flow of data and information. GIS
technology is inclusive of database structures in spatial and non-spatial formats and can
be used as a platform to integrate all data and information flows among the different
domains. Given commonalities and overlaps in terms of geographical space within which
the human–environment system functions, GIS-based database design principles can be
applied to develop fully integrated applications from which practitioners in each of the
three domains can draw data and process information.
Information systems theory further explains the creation of information from data through
a transformation process. The integration of information from different disciplines may
further contribute to the acquisition of knowledge. Thus, an integrated database
environment is imperative for dealing with domain-related responsibilities such as
strategic planning, environmental impact assessment and disaster risk reduction. A
framework for a GIS-based platform to integrate these disciplines is presented in Figure
7.1. It is based on the principles of entity-relationship modelling, as described in Chapter
197
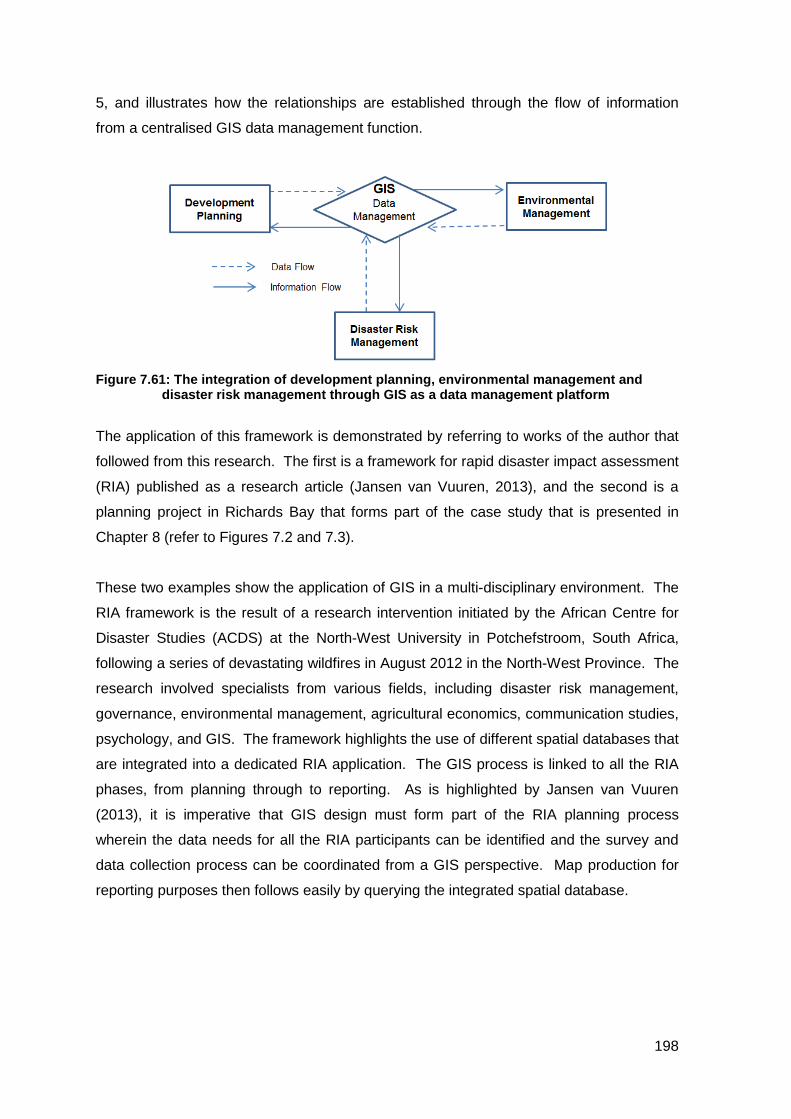
5, and illustrates how the relationships are established through the flow of information
from a centralised GIS data management function.
Figure 7.61: The integration of development planning, environmental management and
disaster risk management through GIS as a data management platform
The application of this framework is demonstrated by referring to works of the author that
followed from this research. The first is a framework for rapid disaster impact assessment
(RIA) published as a research article (Jansen van Vuuren, 2013), and the second is a
planning project in Richards Bay that forms part of the case study that is presented in
Chapter 8 (refer to Figures 7.2 and 7.3).
These two examples show the application of GIS in a multi-disciplinary environment. The
RIA framework is the result of a research intervention initiated by the African Centre for
Disaster Studies (ACDS) at the North-West University in Potchefstroom, South Africa,
following a series of devastating wildfires in August 2012 in the North-West Province. The
research involved specialists from various fields, including disaster risk management,
governance, environmental management, agricultural economics, communication studies,
psychology, and GIS. The framework highlights the use of different spatial databases that
are integrated into a dedicated RIA application. The GIS process is linked to all the RIA
phases, from planning through to reporting. As is highlighted by Jansen van Vuuren
(2013), it is imperative that GIS design must form part of the RIA planning process
wherein the data needs for all the RIA participants can be identified and the survey and
data collection process can be coordinated from a GIS perspective. Map production for
reporting purposes then follows easily by querying the integrated spatial database.
198
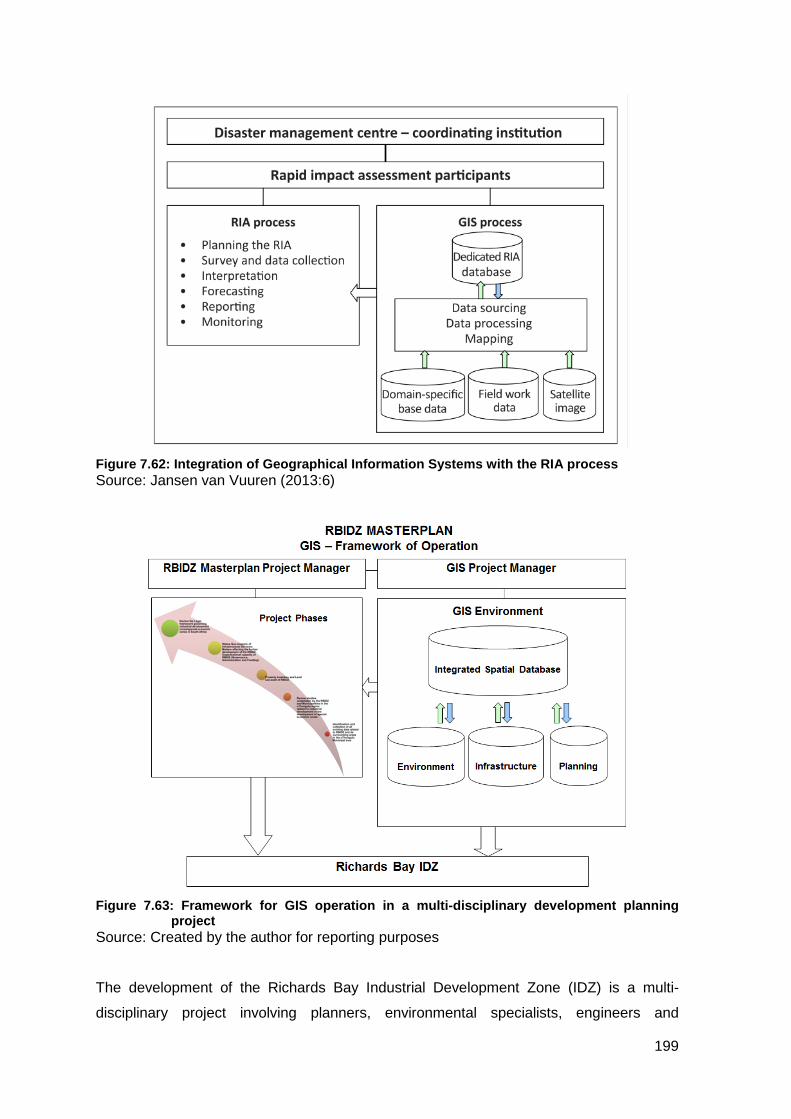
Figure 7.62: Integration of Geographical Information Systems with the RIA process Source: Jansen van Vuuren (2013:6)
Figure 7.63: Framework for GIS operation in a multi-disciplinary development planning
project Source: Created by the author for reporting purposes
The development of the Richards Bay Industrial Development Zone (IDZ) is a multi-
disciplinary project involving planners, environmental specialists, engineers and
199
economists. GIS functionality exists within each of these fields at different levels of
expertise. The author was appointed to coordinate the GIS operations and conduct a
multi-criteria decision analysis (MCDA) to identify the location for developing a new
industrial area in Richards Bay. His knowledge based on this research was applied to
establish a framework for operations on a project management level. He assisted
specialists in the different fields and drew from various spatial databases to establish an
integrated spatial database for the project. This approach facilitated GIS support in all the
phases of the project and a location for industrial development was identified in an area
with the least environmental impact.
7.4. CONCLUSION
The commonalities between development planning, environmental management and
disaster risk management are found in their nature as multi-disciplinary fields, their spatial
orientation, concerns with environmental degradation and social upliftment, a focus on
sustainable development principles, and post-modern approaches. The use of GIS as the
entry point for development management, environmental management and disaster risk
reduction to be integrated in a data model for vulnerability reduction has been
demonstrated from the inference of theory and the implementation of the approach in
practice.
Although the development of inter- and intra-disciplinary theory is not the objective of this
thesis, the voices of scholars such as Van Niekerk (2012), Van der Waldt (2013), and
Lavell and Maskrey (2014) are noted from within the disaster risk management field to
change views towards theory integration. Chapter 7 clearly demonstrated that a platform
for integration exists in GIS science. The next chapter aims to establish a GIS-based
data model that is focused on resolving inter-relationships along database theory
principles, and that could possibly serve as a point of departure for theory integration.
200
CHAPTER 8: A GIS-BASED MODEL FOR INTEGRATING DEVELOPMENT PLANNING, ENVIRONMENTAL MANAGEMENT AND DISASTER RISK MANAGEMENT
8.1 INTRODUCTION
Vulnerability mapping models such as proposed by Cutter et al. (2000), and GIS-based
reports such as the South African Vulnerability Atlas (Archer et al., 2010), present
indicator values at the aggregated level, which restrict its use for local planning to the
level of strategic thinking. The concept of disaster has been linked to different human–
environment interactions. Simplified representations, however, do not discriminate among
such interactions. Decision making with regard to development frameworks and the
spatial location of different economic activities requires analyses of the coupled human–
environment system on a local level, taking into account environmental sensitivity and
disaster risk.
Various spatial operations in GIS are used to create datasets from different inputs. Aerial
photography or satellite images, for example, are typically used to create land cover data.
Contour lines are used to extrapolate and create a field of elevation values. From these,
various processing techniques can be used to create other value-added datasets. A
visualisation perspective (making maps) of GIS restricts its power of cognition of what is
presented on the map. From a database perspective, however, the processing power of
GIS can be used to create data on a scaleless and seamless manner – in other words the
creation of basic spatial units close to the geo-atom level that reference features in the
real world upon which further spatial operations can be performed to generate datasets
and visualisations at any aggregated level. The question is, how can this be applied to
model the coupled human–environment system?
The entity-relationship (ER) model was described in Chapter 5 as a conceptual data
model that uses primitives like entity type to describe independently existing entities,
relationship type to define relationships between entities, and attributes to describe
characteristic values of entities and relationships. This model lends itself to resolving the
relationship between entities in space. Chapter 3 described the landscape-ecology
201
framework that provides for the integration of human and ecological activities and the
analysis of interactions between socioeconomic and biophysical processes. Based on
these concepts, Chapter 8 now proposes a framework and conceptual model that
identifies and solves the many-to-many relationship problem that exists in the coupled
human–environment system. It uses Boolean logic and database theory, as described in
Chapter 5, to model relationships between anthropological and ecological entities within
the ecological landscape. The model is then applied and tested in a case study, and the
possibilities for expanding the model are highlighted.
8.2 DATA MODELS
The process of abstraction of real-world phenomena into a spatial database is called
spatial modelling, and is one of the most useful tools for database design (Kainz, 2004).
Worboys and Duckham (2004:19) assert that the choice of an appropriate data model is a
critical factor for the success or failure of an information system, and that it is fundamental
to the database idea. The understanding of a data model is, however, expressed
differently by GIS scholars, and confusion exists in this regard (Maguire & Dangermond,
1991:320). For example, the raster / vector representation of space is a recurring view of
data modelling in literature. Another view is the field–object data model (Goodchild,
1992), which provides a particular perspective on data models from a geographic reality.
Peuquet (1984) and Harvey (2008) distinguish between data modelling from a geographic
or cartographic perspective, and a database perspective. These perspectives view data
models from the viewpoint of a physical schema, i.e. the data structures (rasters, points,
lines and polygons) as described in Chapter 5. Another perspective of data modelling is
design (Longley et al., 2005), the process that begins with a view of the real world,
followed by a sequence of steps from a conceptual schema to the physical design of the
database. It is this view of data modelling that informs the development of a data model
for the integration of development planning, environmental management and disaster risk
management.
Built on the premise that a map (and by implication a spatial database) is a model of
reality, the process of developing an information system can essentially be seen as a
process of model building (Worboys & Duckham, 2004:19). Given the complexity of
reality, it is impossible to design a general-purpose data model that is useful in all
situations (Peuquet, 1984:71). Therefore, a design and abstraction that serve the
purpose of the intended use of the system are important. According to Peuquet (1984),
there are two main approaches to designing spatial data models, i.e. the phenomenon-
202
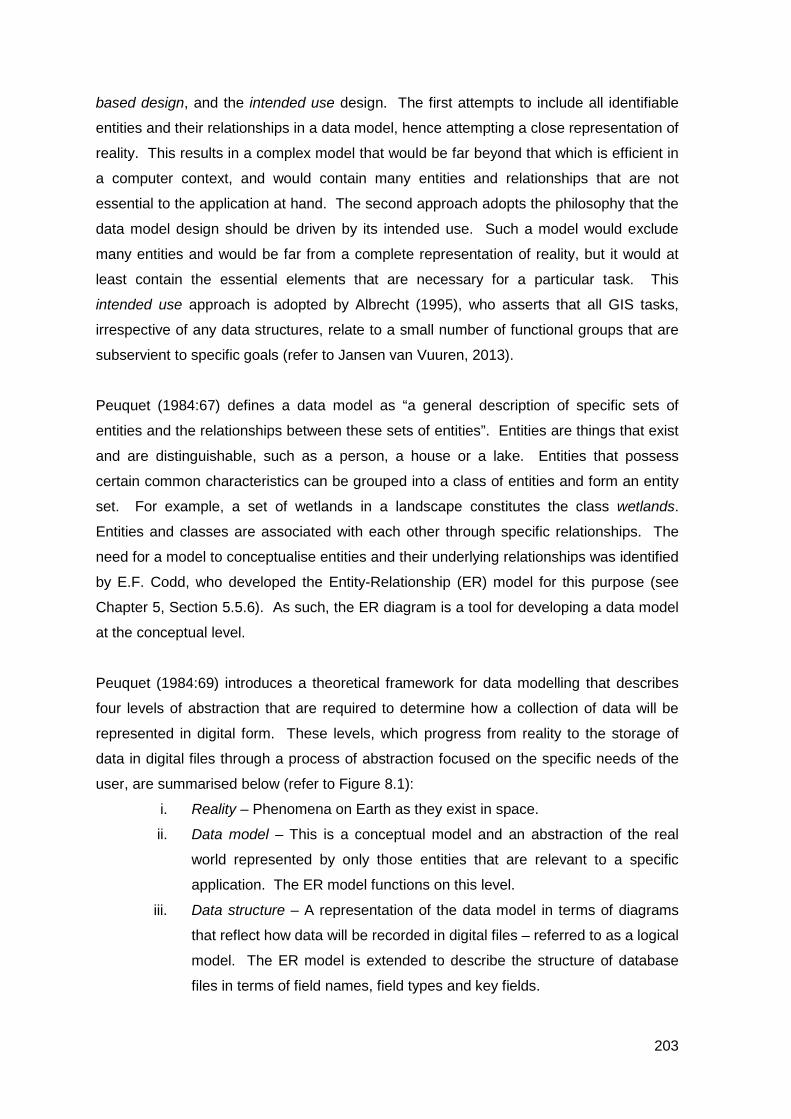
based design, and the intended use design. The first attempts to include all identifiable
entities and their relationships in a data model, hence attempting a close representation of
reality. This results in a complex model that would be far beyond that which is efficient in
a computer context, and would contain many entities and relationships that are not
essential to the application at hand. The second approach adopts the philosophy that the
data model design should be driven by its intended use. Such a model would exclude
many entities and would be far from a complete representation of reality, but it would at
least contain the essential elements that are necessary for a particular task. This
intended use approach is adopted by Albrecht (1995), who asserts that all GIS tasks,
irrespective of any data structures, relate to a small number of functional groups that are
subservient to specific goals (refer to Jansen van Vuuren, 2013).
Peuquet (1984:67) defines a data model as “a general description of specific sets of
entities and the relationships between these sets of entities”. Entities are things that exist
and are distinguishable, such as a person, a house or a lake. Entities that possess
certain common characteristics can be grouped into a class of entities and form an entity
set. For example, a set of wetlands in a landscape constitutes the class wetlands.
Entities and classes are associated with each other through specific relationships. The
need for a model to conceptualise entities and their underlying relationships was identified
by E.F. Codd, who developed the Entity-Relationship (ER) model for this purpose (see
Chapter 5, Section 5.5.6). As such, the ER diagram is a tool for developing a data model
at the conceptual level.
Peuquet (1984:69) introduces a theoretical framework for data modelling that describes
four levels of abstraction that are required to determine how a collection of data will be
represented in digital form. These levels, which progress from reality to the storage of
data in digital files through a process of abstraction focused on the specific needs of the
user, are summarised below (refer to Figure 8.1):
i. Reality – Phenomena on Earth as they exist in space.
ii. Data model – This is a conceptual model and an abstraction of the real
world represented by only those entities that are relevant to a specific
application. The ER model functions on this level.
iii. Data structure – A representation of the data model in terms of diagrams
that reflect how data will be recorded in digital files – referred to as a logical
model. The ER model is extended to describe the structure of database
files in terms of field names, field types and key fields.
203
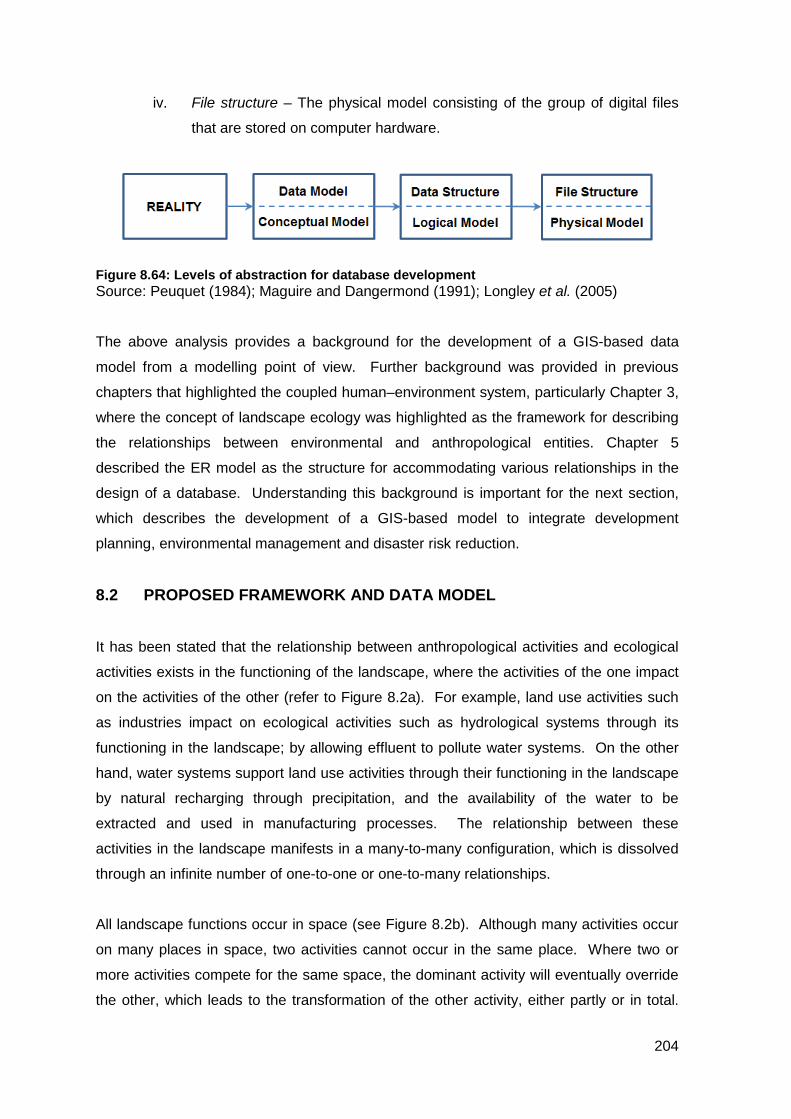
iv. File structure – The physical model consisting of the group of digital files
that are stored on computer hardware.
Figure 8.64: Levels of abstraction for database development Source: Peuquet (1984); Maguire and Dangermond (1991); Longley et al. (2005)
The above analysis provides a background for the development of a GIS-based data
model from a modelling point of view. Further background was provided in previous
chapters that highlighted the coupled human–environment system, particularly Chapter 3,
where the concept of landscape ecology was highlighted as the framework for describing
the relationships between environmental and anthropological entities. Chapter 5
described the ER model as the structure for accommodating various relationships in the
design of a database. Understanding this background is important for the next section,
which describes the development of a GIS-based model to integrate development
planning, environmental management and disaster risk reduction.
8.2 PROPOSED FRAMEWORK AND DATA MODEL
It has been stated that the relationship between anthropological activities and ecological
activities exists in the functioning of the landscape, where the activities of the one impact
on the activities of the other (refer to Figure 8.2a). For example, land use activities such
as industries impact on ecological activities such as hydrological systems through its
functioning in the landscape; by allowing effluent to pollute water systems. On the other
hand, water systems support land use activities through their functioning in the landscape
by natural recharging through precipitation, and the availability of the water to be
extracted and used in manufacturing processes. The relationship between these
activities in the landscape manifests in a many-to-many configuration, which is dissolved
through an infinite number of one-to-one or one-to-many relationships.
All landscape functions occur in space (see Figure 8.2b). Although many activities occur
on many places in space, two activities cannot occur in the same place. Where two or
more activities compete for the same space, the dominant activity will eventually override
the other, which leads to the transformation of the other activity, either partly or in total.
204
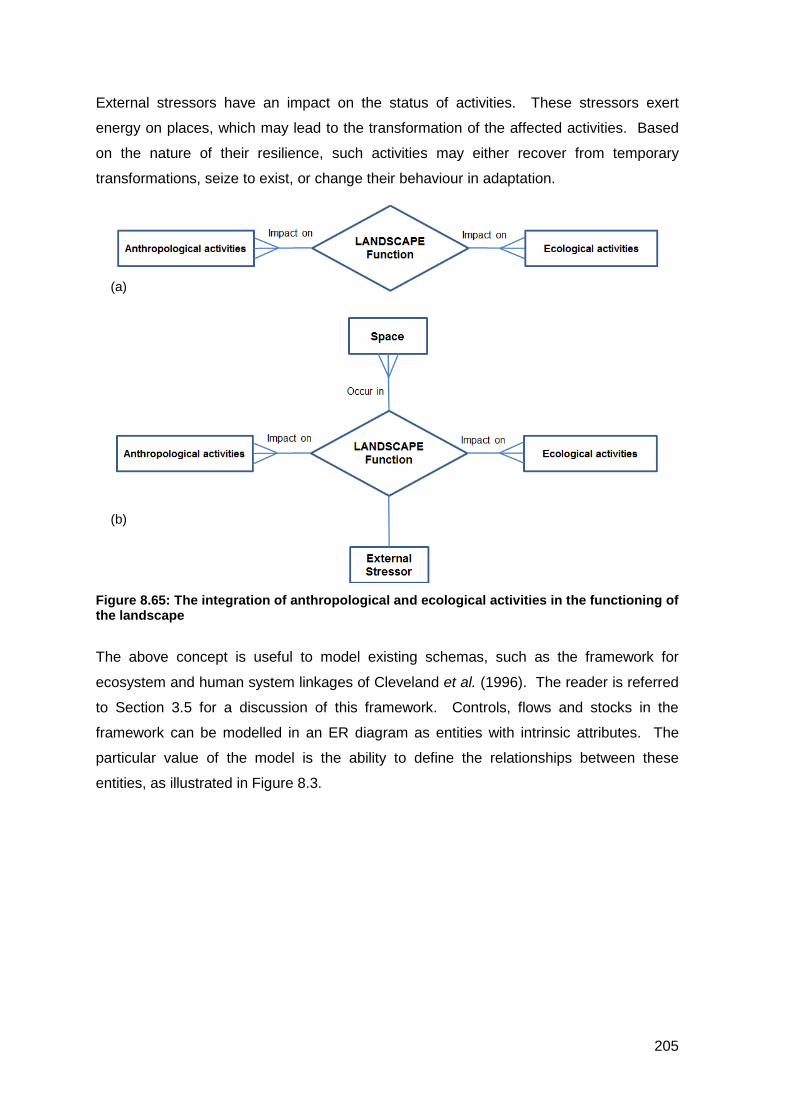
External stressors have an impact on the status of activities. These stressors exert
energy on places, which may lead to the transformation of the affected activities. Based
on the nature of their resilience, such activities may either recover from temporary
transformations, seize to exist, or change their behaviour in adaptation.
Figure 8.65: The integration of anthropological and ecological activities in the functioning of the landscape
The above concept is useful to model existing schemas, such as the framework for
ecosystem and human system linkages of Cleveland et al. (1996). The reader is referred
to Section 3.5 for a discussion of this framework. Controls, flows and stocks in the
framework can be modelled in an ER diagram as entities with intrinsic attributes. The
particular value of the model is the ability to define the relationships between these
entities, as illustrated in Figure 8.3.
(a)
(b)
205
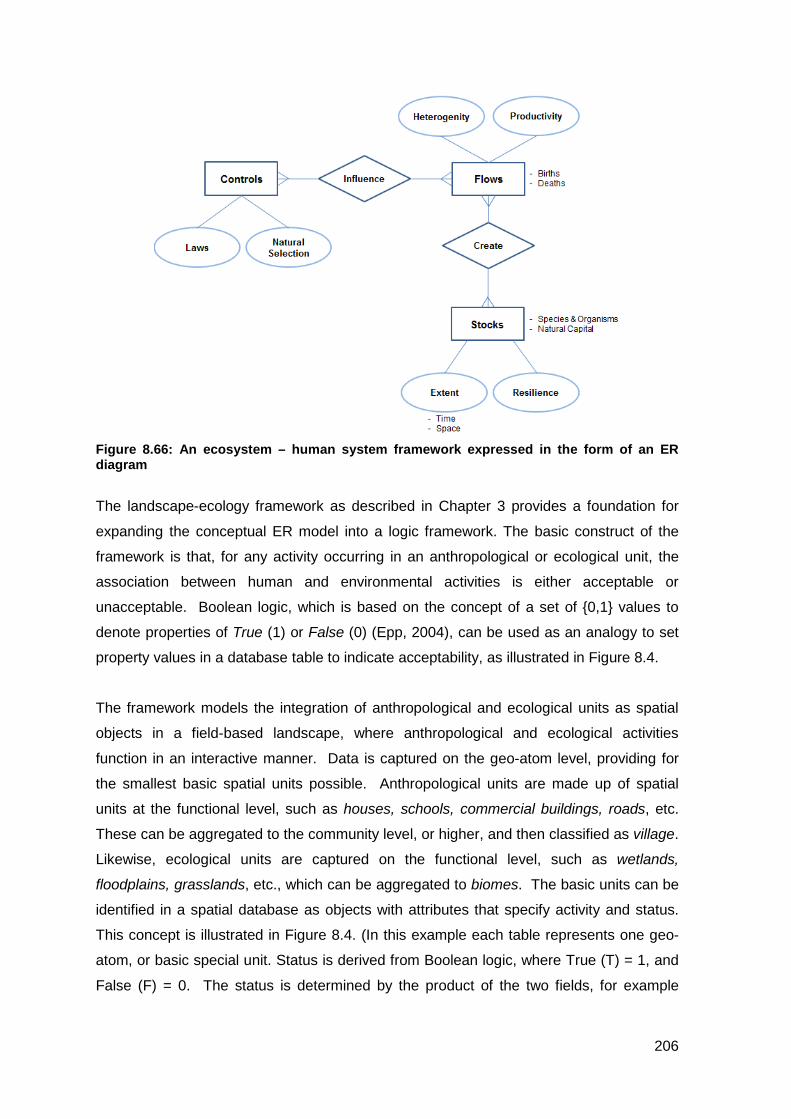
Figure 8.66: An ecosystem – human system framework expressed in the form of an ER diagram
The landscape-ecology framework as described in Chapter 3 provides a foundation for
expanding the conceptual ER model into a logic framework. The basic construct of the
framework is that, for any activity occurring in an anthropological or ecological unit, the
association between human and environmental activities is either acceptable or
unacceptable. Boolean logic, which is based on the concept of a set of {0,1} values to
denote properties of True (1) or False (0) (Epp, 2004), can be used as an analogy to set
property values in a database table to indicate acceptability, as illustrated in Figure 8.4.
The framework models the integration of anthropological and ecological units as spatial
objects in a field-based landscape, where anthropological and ecological activities
function in an interactive manner. Data is captured on the geo-atom level, providing for
the smallest basic spatial units possible. Anthropological units are made up of spatial
units at the functional level, such as houses, schools, commercial buildings, roads, etc.
These can be aggregated to the community level, or higher, and then classified as village.
Likewise, ecological units are captured on the functional level, such as wetlands,
floodplains, grasslands, etc., which can be aggregated to biomes. The basic units can be
identified in a spatial database as objects with attributes that specify activity and status.
This concept is illustrated in Figure 8.4. (In this example each table represents one geo-
atom, or basic special unit. Status is derived from Boolean logic, where True (T) = 1, and
False (F) = 0. The status is determined by the product of the two fields, for example
206
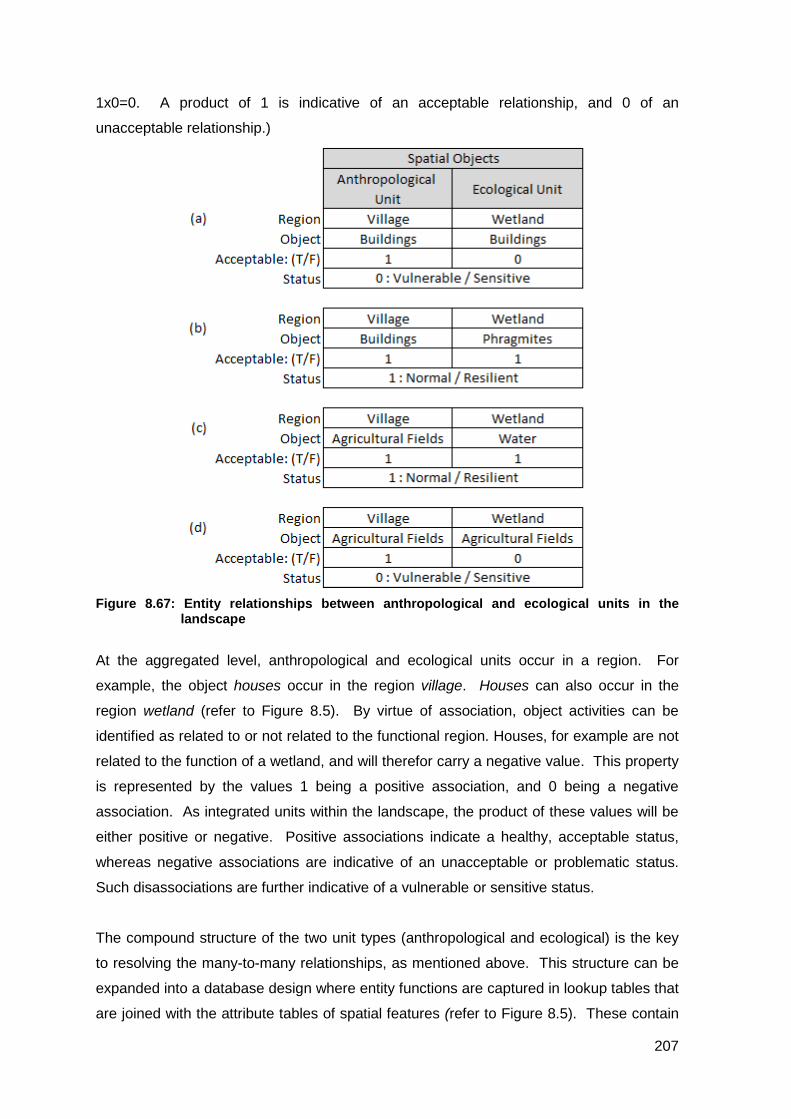
1x0=0. A product of 1 is indicative of an acceptable relationship, and 0 of an
unacceptable relationship.)
Figure 8.67: Entity relationships between anthropological and ecological units in the
landscape
At the aggregated level, anthropological and ecological units occur in a region. For
example, the object houses occur in the region village. Houses can also occur in the
region wetland (refer to Figure 8.5). By virtue of association, object activities can be
identified as related to or not related to the functional region. Houses, for example are not
related to the function of a wetland, and will therefor carry a negative value. This property
is represented by the values 1 being a positive association, and 0 being a negative
association. As integrated units within the landscape, the product of these values will be
either positive or negative. Positive associations indicate a healthy, acceptable status,
whereas negative associations are indicative of an unacceptable or problematic status.
Such disassociations are further indicative of a vulnerable or sensitive status.
The compound structure of the two unit types (anthropological and ecological) is the key
to resolving the many-to-many relationships, as mentioned above. This structure can be
expanded into a database design where entity functions are captured in lookup tables that
are joined with the attribute tables of spatial features (refer to Figure 8.5). These contain
207
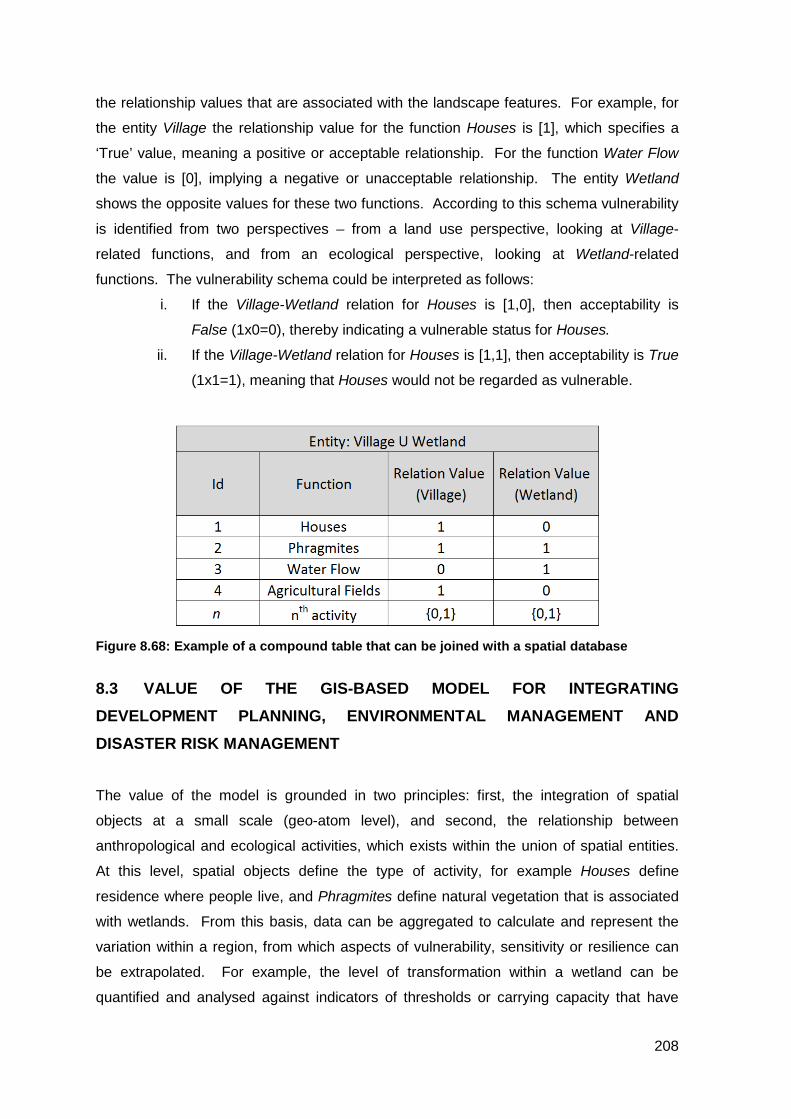
the relationship values that are associated with the landscape features. For example, for
the entity Village the relationship value for the function Houses is [1], which specifies a
‘True’ value, meaning a positive or acceptable relationship. For the function Water Flow
the value is [0], implying a negative or unacceptable relationship. The entity Wetland
shows the opposite values for these two functions. According to this schema vulnerability
is identified from two perspectives – from a land use perspective, looking at Village-
related functions, and from an ecological perspective, looking at Wetland-related
functions. The vulnerability schema could be interpreted as follows:
i. If the Village-Wetland relation for Houses is [1,0], then acceptability is
False (1x0=0), thereby indicating a vulnerable status for Houses.
ii. If the Village-Wetland relation for Houses is [1,1], then acceptability is True
(1x1=1), meaning that Houses would not be regarded as vulnerable.
Figure 8.68: Example of a compound table that can be joined with a spatial database
8.3 VALUE OF THE GIS-BASED MODEL FOR INTEGRATING DEVELOPMENT PLANNING, ENVIRONMENTAL MANAGEMENT AND DISASTER RISK MANAGEMENT
The value of the model is grounded in two principles: first, the integration of spatial
objects at a small scale (geo-atom level), and second, the relationship between
anthropological and ecological activities, which exists within the union of spatial entities.
At this level, spatial objects define the type of activity, for example Houses define
residence where people live, and Phragmites define natural vegetation that is associated
with wetlands. From this basis, data can be aggregated to calculate and represent the
variation within a region, from which aspects of vulnerability, sensitivity or resilience can
be extrapolated. For example, the level of transformation within a wetland can be
quantified and analysed against indicators of thresholds or carrying capacity that have
208
been determined scientifically to maintain resilience. From the disaggregated level,
impacts can be extrapolated to determine the level of fragmentation, perforation,
dissection, shrinkage or attrition of a region (refer to Section 3.5 for a discussion of these
terms). This approach shifts the focus away from the demography-related profiling of
communities at census level to infer and differentiate levels of vulnerability in a
community. To illustrate, the following hypothetical example is offered:
In a landscape where a river (classified as a wetland to include the riparian zone and
floodplain as part of the wetland) intersects a village, the village and the river represent
two regions within the landscape. Various objects in each region indicate specific activity.
With each activity captured as a spatial object (including attributes that define properties
such as the object type, its status, and its extent), the association of the activity in relation
to the region where it is located is captured in terms of the proposed model. The
database is designed to join external lookup tables (as described above) with the attribute
tables of the GIS feature classes. A scientific evaluation of the wetland would provide a
classification of resilience thresholds in terms of the extent (area) of transformation.
Hypothetically, the thresholds could be determined as follows:
If Rv > 0.5, Resilience = Low
If Rv >= 0.25 and R <= 0.5, Resilience = Moderate
If Rv < 0.25, Resilience = High
The following formula can be applied to calculate Rv:
Rv = (∑ 𝐻𝑛𝑖=1 +∑ 𝐹𝑛
𝑖=1 ) / ∑ 𝑊1𝑖=1
Where Rv = Resilience value; H = Area of Houses, F = Area of
Agricultural fields; and W = Area of Wetland (in which houses and
agricultural fields occur).
The vulnerability of the community in terms of flooding is determined in two ways. First,
the houses located within the wetland are exposed to a higher risk of flooding than those
outside the wetland. Second, the community uses certain parts of the wetland to plant
crops. As a sustainable farming practice, these fields are also at risk of flooding. The
destruction of these fields in case of extensive rains and flooding of the wetland may
increase the vulnerability of the community in terms of food security.
The value of the model can also be demonstrated by research interventions, where field
work is undertaken among community members. By approaching the research design
from a spatial data management perspective, the survey can be structured to capture the
209
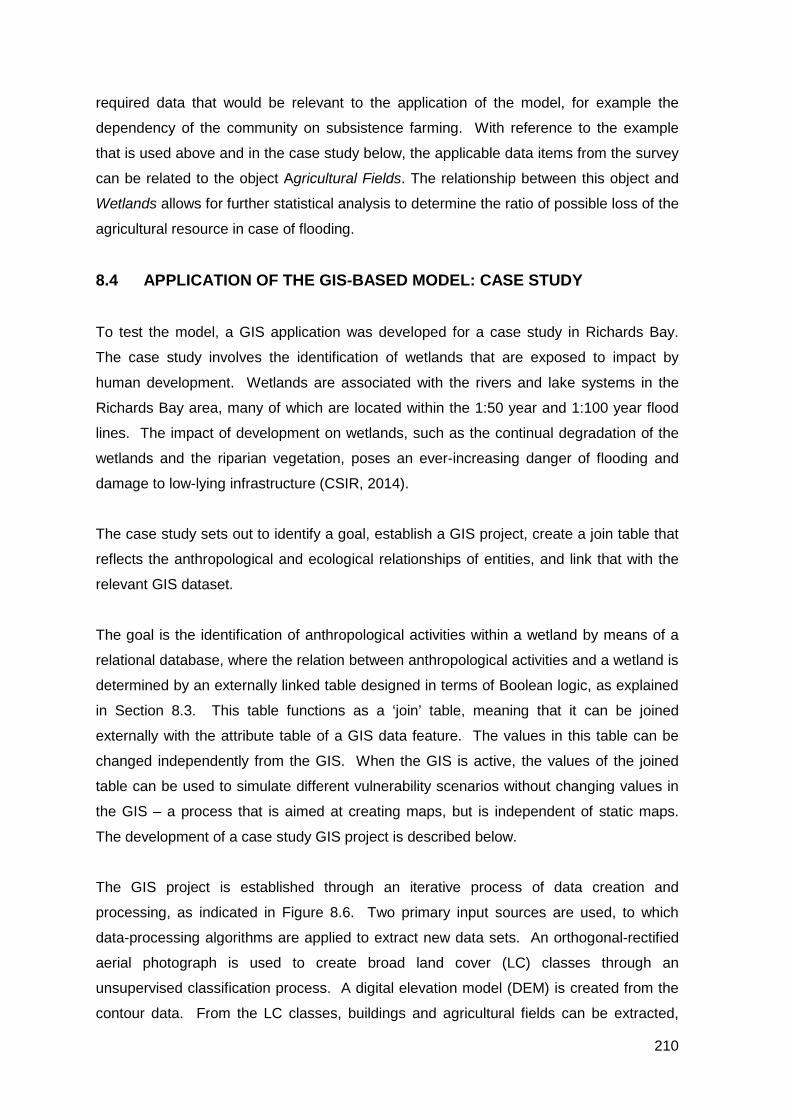
required data that would be relevant to the application of the model, for example the
dependency of the community on subsistence farming. With reference to the example
that is used above and in the case study below, the applicable data items from the survey
can be related to the object Agricultural Fields. The relationship between this object and
Wetlands allows for further statistical analysis to determine the ratio of possible loss of the
agricultural resource in case of flooding.
8.4 APPLICATION OF THE GIS-BASED MODEL: CASE STUDY
To test the model, a GIS application was developed for a case study in Richards Bay.
The case study involves the identification of wetlands that are exposed to impact by
human development. Wetlands are associated with the rivers and lake systems in the
Richards Bay area, many of which are located within the 1:50 year and 1:100 year flood
lines. The impact of development on wetlands, such as the continual degradation of the
wetlands and the riparian vegetation, poses an ever-increasing danger of flooding and
damage to low-lying infrastructure (CSIR, 2014).
The case study sets out to identify a goal, establish a GIS project, create a join table that
reflects the anthropological and ecological relationships of entities, and link that with the
relevant GIS dataset.
The goal is the identification of anthropological activities within a wetland by means of a
relational database, where the relation between anthropological activities and a wetland is
determined by an externally linked table designed in terms of Boolean logic, as explained
in Section 8.3. This table functions as a ‘join’ table, meaning that it can be joined
externally with the attribute table of a GIS data feature. The values in this table can be
changed independently from the GIS. When the GIS is active, the values of the joined
table can be used to simulate different vulnerability scenarios without changing values in
the GIS – a process that is aimed at creating maps, but is independent of static maps.
The development of a case study GIS project is described below.
The GIS project is established through an iterative process of data creation and
processing, as indicated in Figure 8.6. Two primary input sources are used, to which
data-processing algorithms are applied to extract new data sets. An orthogonal-rectified
aerial photograph is used to create broad land cover (LC) classes through an
unsupervised classification process. A digital elevation model (DEM) is created from the
contour data. From the LC classes, buildings and agricultural fields can be extracted,
210
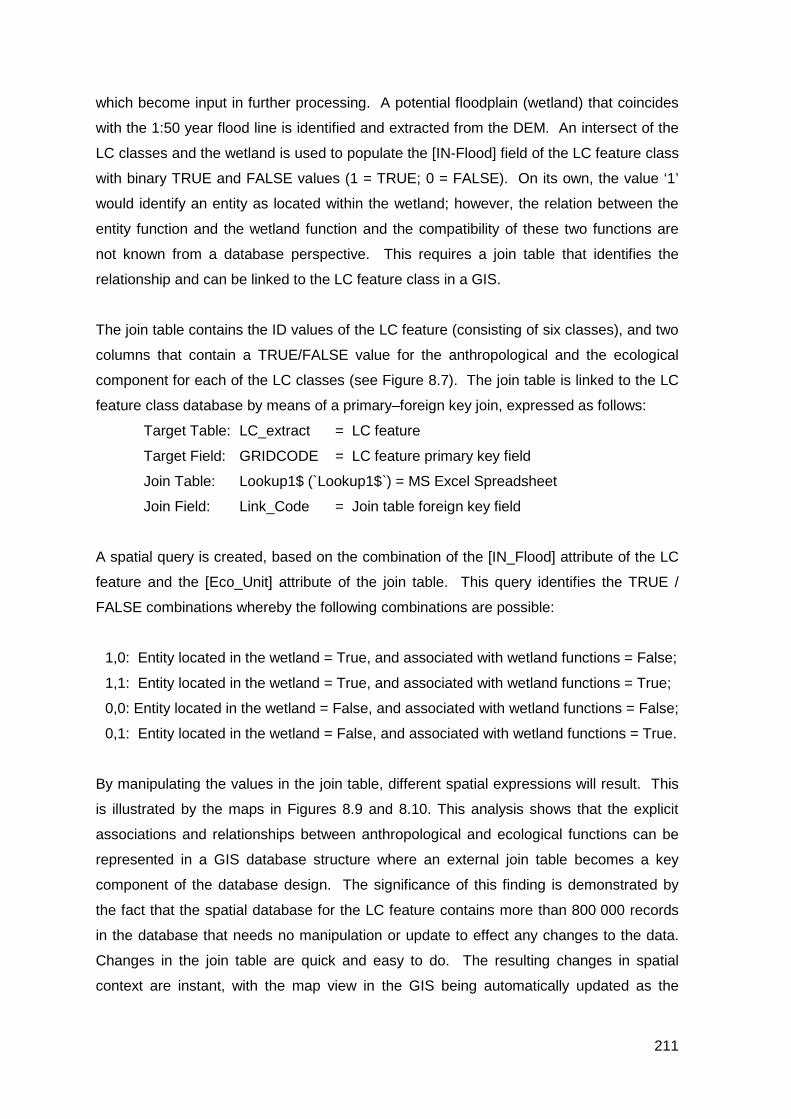
which become input in further processing. A potential floodplain (wetland) that coincides
with the 1:50 year flood line is identified and extracted from the DEM. An intersect of the
LC classes and the wetland is used to populate the [IN-Flood] field of the LC feature class
with binary TRUE and FALSE values (1 = TRUE; 0 = FALSE). On its own, the value ‘1’
would identify an entity as located within the wetland; however, the relation between the
entity function and the wetland function and the compatibility of these two functions are
not known from a database perspective. This requires a join table that identifies the
relationship and can be linked to the LC feature class in a GIS.
The join table contains the ID values of the LC feature (consisting of six classes), and two
columns that contain a TRUE/FALSE value for the anthropological and the ecological
component for each of the LC classes (see Figure 8.7). The join table is linked to the LC
feature class database by means of a primary–foreign key join, expressed as follows:
Target Table: LC_extract = LC feature
Target Field: GRIDCODE = LC feature primary key field
Join Table: Lookup1$ (`Lookup1$`) = MS Excel Spreadsheet
Join Field: Link_Code = Join table foreign key field
A spatial query is created, based on the combination of the [IN_Flood] attribute of the LC
feature and the [Eco_Unit] attribute of the join table. This query identifies the TRUE /
FALSE combinations whereby the following combinations are possible:
1,0: Entity located in the wetland = True, and associated with wetland functions = False;
1,1: Entity located in the wetland = True, and associated with wetland functions = True;
0,0: Entity located in the wetland = False, and associated with wetland functions = False;
0,1: Entity located in the wetland = False, and associated with wetland functions = True.
By manipulating the values in the join table, different spatial expressions will result. This
is illustrated by the maps in Figures 8.9 and 8.10. This analysis shows that the explicit
associations and relationships between anthropological and ecological functions can be
represented in a GIS database structure where an external join table becomes a key
component of the database design. The significance of this finding is demonstrated by
the fact that the spatial database for the LC feature contains more than 800 000 records
in the database that needs no manipulation or update to effect any changes to the data.
Changes in the join table are quick and easy to do. The resulting changes in spatial
context are instant, with the map view in the GIS being automatically updated as the
211
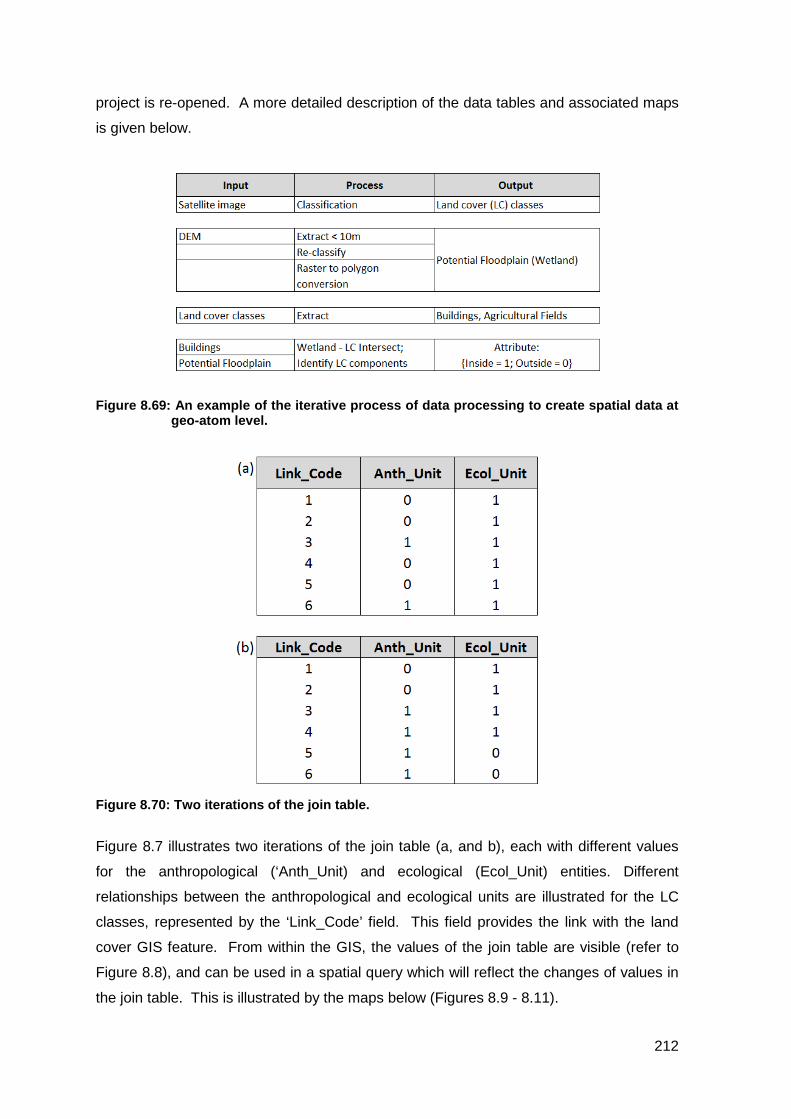
project is re-opened. A more detailed description of the data tables and associated maps
is given below.
Figure 8.69: An example of the iterative process of data processing to create spatial data at
geo-atom level.
Figure 8.70: Two iterations of the join table.
Figure 8.7 illustrates two iterations of the join table (a, and b), each with different values
for the anthropological (‘Anth_Unit) and ecological (Ecol_Unit) entities. Different
relationships between the anthropological and ecological units are illustrated for the LC
classes, represented by the ‘Link_Code’ field. This field provides the link with the land
cover GIS feature. From within the GIS, the values of the join table are visible (refer to
Figure 8.8), and can be used in a spatial query which will reflect the changes of values in
the join table. This is illustrated by the maps below (Figures 8.9 - 8.11).
212

Figure 8.71: Extract of the attribute table of the land cover GIS feature, showing the join
table.
The legend of the maps in Figures 8.9 and 8.10 shows the compound values for the two
fields [IN-flood] and [Ecol_Unit], representing a field from the GIS attribute table and a
field from the join table respectively. The [IN-Flood] values indicate the location status of
features in relation to the floodplain, where 1=True and 0=False. The [Ecol_Unit] values
indicate the acceptability status in terms of the ecological function, where 1=True
(acceptable) and 0=False (unacceptable).
The blue colour in the maps represent a wetland associated with a floodplain, which is
susceptible to flooding. This reflect the compound value [1,1], indicating a ‘True’ or
‘Acceptable’ status. The red colours in the blue region represent the compound value
[1,0], indicating a ‘False’ or ‘Unacceptable’ status.
213

Figure 8.72: Map according to the values in table (a) of Figure 8.7.
Figure 8.73: Map according to the values in table (b) of Figure 8.7.
214
Changes in the join table were made for land cover values representing anthropological
land uses, such as houses and agricultural fields. By adding the land cover field to the
compound query, a finer resolution of results can be obtained, as is illustrated by the map
in Figure 8.11. The total number of unique combinations of values on this map is 11, as
opposed to 4 in the previous maps.
Figure 8.74: Map showing the results of a compound query with the land cover value included.
GIS query capabilities allow for the inclusion of a third attribute in a compound query. The
map in Figure 8.11 above shows the results of a query where the first value represents a
land use code (refer to the legend in the map). The code is not a Boolean value and is
part of the set {1,2,3,4,5,6}, which includes all land use categories for the case study. The
second and third values represent the [in wetland] and [ecological function] Boolean
values, similar to the maps in Figures 8.8 and 8.9. This example shows 11 unique
combinations of compound values, and a higher level of differentiation.
The Richards Bay case study demonstrates the value of the proposed integrated GIS
data model. As a physical data model based on the conceptual design described in
Section 8.2, the spatial database built for the case study shows how spatial relationships
215
can be established in terms of entity attribute modelling, providing an alternative
perspective to the topological-based spatial data model.
8.5 EXPANSION OF THE GIS-BASED MODEL
This model can be expanded in various ways. First, it should be expanded to include
other entities that define a landscape, such as landform and habitats from an ecological
perspective, and elements of economic activity and infrastructure from an anthropological
perspective. Second, the model can be expanded to develop rule-based “IF…THEN”
statements and knowledge systems (Smith & Jian, 1991). Sustainability development
objectives command that development in potentially hazardous zones should be avoided.
Spatial analyses based on this model should thus prove useful, not only to identify risk
zones, but to quantify risk in terms of possible losses and relative vulnerability on a
landscape level.
Third, the model can be expanded to include the concept of process and flows, as
described in Chapter 7. Worboys and Hornsby (2004) distinguish between two types of
entities that define our world, i.e. continuants and occurrents. Continuant entities
describe features that remain in the landscape over an extended time period, such as
buildings, roads and cities. Occurrent entities happen over a short period of time, and
include processes such as the construction of buildings, roads and cities. Occurrents can
also happen repetitively, such as the ongoing development of new cities, or the expansion
thereof. In terms of the disaster framework, an event can also be seen as an occurrent.
In terms of landscape ecology, continuants and occurrents exist in both the
anthropological and the ecological domain. The relationship between continuants in
these domains has been described above. The proposed model should also be able to
describe the relationship between occurrents.
Lastly, the model can be expanded to include a third dimension, such as time. Both
continuants and occurrents are influenced by time, in terms of beginning, end and
duration, within which their status may change.
8.6 CONCLUSION
This chapter described the concept of data modelling in GIS, making a clear distinction
between data structures as models, and modelling in terms of database design. A
216
conceptual data model was presented based on the principles of ER modelling and
Boolean logic, demonstrating the possibility to model the relationships between
anthropological and ecological entities through their functioning in a landscape.
The value of the model was demonstrated by a case study that implemented the
proposed conceptual model in the physical design of a GIS application. It showed how
the relationship between entities of the coupled human–environment system can be
spatially represented, and how the model can be used to undertake different ‘WHAT-IF’
analyses. It was further demonstrated how, through this model, GIS can function as the
entry point for the integration of development management, environmental management,
and disaster risk management in a data model for vulnerability reduction.
Chapter 8 concluded with suggestions on how the model can be expanded in different
ways. The next chapter concludes this thesis with a framework for the implementation of
the data model in the wider context of integrated development management,
environmental management and disaster risk management.
217

CHAPTER 9: CONCLUSIONS AND RECOMMENDATIONS
9.1 INTRODUCTION
A key concept of disaster risk is vulnerability. It is a phenomenon that is not restricted to
social patterns, and is also reflected in environmental sensitivity. It is a multi-faceted
concept that has inspired wide research in sociology and development studies.
Vulnerability is also a concept that relies on geo-spatial information for its assessment.
From this perspective, the title for this study was chosen to read: Vulnerability as a multi-
faceted phenomenon: A GIS-based data model for integrated development planning,
environmental management and disaster risk reduction.
This study has been structured according to three main objectives: the exploring of
grounding theories, the identification of commonalities in theories and approaches, and
the development of a GIS-based data model. To guide the study, five research objectives
were formulated, which were addressed in the chapters of this thesis. Table 9.1 contains
a summary of the objectives and the relevant chapters addressing these.
Chapter 9 serves as a conclusion and presents the key findings gleaned from the
literature study, as well as a framework for the implementation of the data model that was
developed. A summarising statement and recommendations for further research are
presented in the concluding section.
218
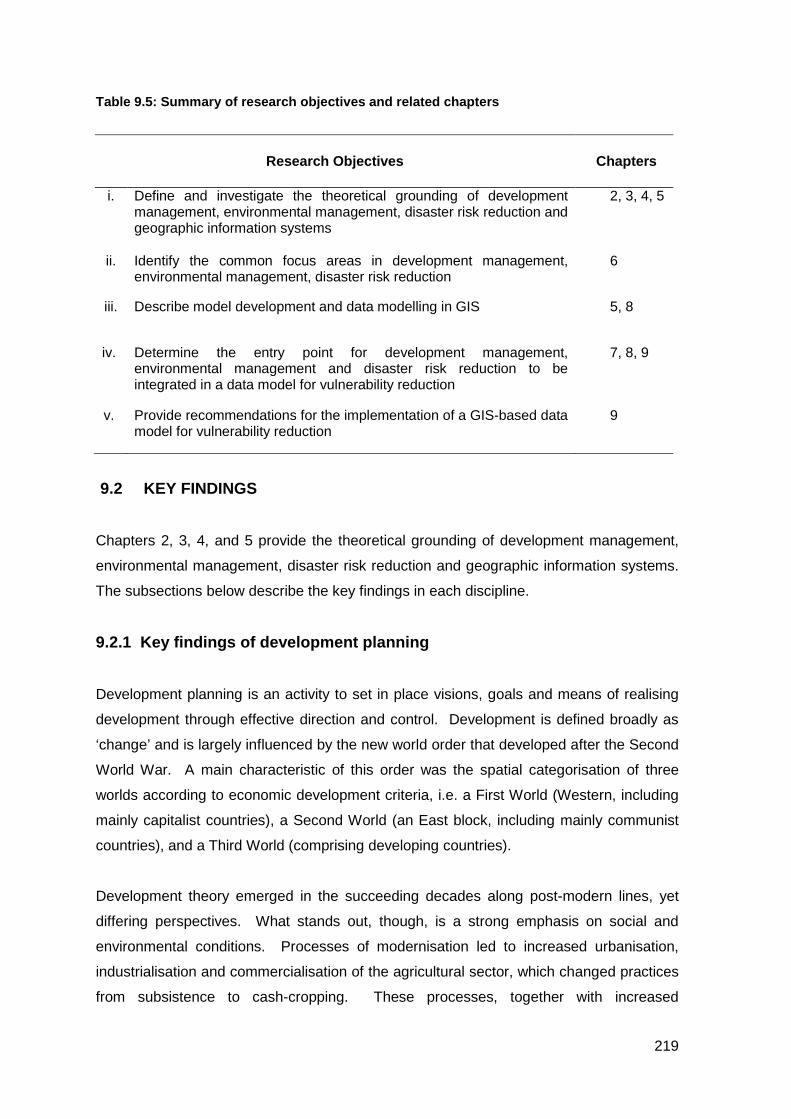
Table 9.5: Summary of research objectives and related chapters
Research Objectives Chapters
i. Define and investigate the theoretical grounding of development management, environmental management, disaster risk reduction and geographic information systems
2, 3, 4, 5
ii. Identify the common focus areas in development management, environmental management, disaster risk reduction
6
iii. Describe model development and data modelling in GIS 5, 8
iv. Determine the entry point for development management, environmental management and disaster risk reduction to be integrated in a data model for vulnerability reduction
7, 8, 9
v. Provide recommendations for the implementation of a GIS-based data model for vulnerability reduction
9
9.2 KEY FINDINGS
Chapters 2, 3, 4, and 5 provide the theoretical grounding of development management,
environmental management, disaster risk reduction and geographic information systems.
The subsections below describe the key findings in each discipline.
9.2.1 Key findings of development planning
Development planning is an activity to set in place visions, goals and means of realising
development through effective direction and control. Development is defined broadly as
‘change’ and is largely influenced by the new world order that developed after the Second
World War. A main characteristic of this order was the spatial categorisation of three
worlds according to economic development criteria, i.e. a First World (Western, including
mainly capitalist countries), a Second World (an East block, including mainly communist
countries), and a Third World (comprising developing countries).
Development theory emerged in the succeeding decades along post-modern lines, yet
differing perspectives. What stands out, though, is a strong emphasis on social and
environmental conditions. Processes of modernisation led to increased urbanisation,
industrialisation and commercialisation of the agricultural sector, which changed practices
from subsistence to cash-cropping. These processes, together with increased
219
exploitation of natural resources, have a causal effect on the increased vulnerability of
communities and the degradation of the environment, and they bring aspects of planning
to the fore.
Planning is seen as a diverse activity that has largely been influenced by changes in
political and scientific thoughts, and that may mean different things to different people. As
a vision and objective-driven activity, planning is broadly defined as the coordination of
development activities. Planning is driven from within four main perspectives:
(i) Planning is a management activity.
(ii) Planning is concerned with achieving objectives and aimed at action.
(iii) Planning addresses uncertainties of the future.
(iv) Planning is aimed at decision making.
Different models for planning have been identified through history. Blueprint planning was
aimed at setting a comprehensive framework for future development and was the main
approach during the 1950s and 1960s. As an autocratic measure, the disregard for social
needs created a need for more rationalist and communicative thinking. Rational planning
introduced the concept of decision making in planning, and saw it as a process where
goals and objectives are achieved by considering various alternatives and courses of
action open to the decision maker. This model created a shift away from control to
decision making, and is indicative of the need to collect data and process information.
Criticism levelled at the concept of rational planning involved the difficulty to model reality
in all its diversity and the need to consider various planning options in a lengthy decision-
making process. A shift to strategic planning was initiated by drawing from Simon’s
concept of bounded reality and further developments by Lindblom who introduced the
concept of a continuum of reality and abstraction. Within the context of an abstraction of
reality, it is possible to prepare strategic plans and set courses of action that follow the
vision and objectives of such plans, but with an openness to allow changes and re-
alignments of plans based on mutual agreement between the actors in the planning
process, which is dictated by the changing circumstances of reality. This approach further
advanced towards the development of communicative and participatory approaches in
planning, with an associated increase in the need for sharing information.
Development planning thinking is problem-driven and is concerned with what is
happening in the world. It is worldly, grounded, and driven by field knowledge. This
perspective is indicative of an information-based process. The focus on information has
220
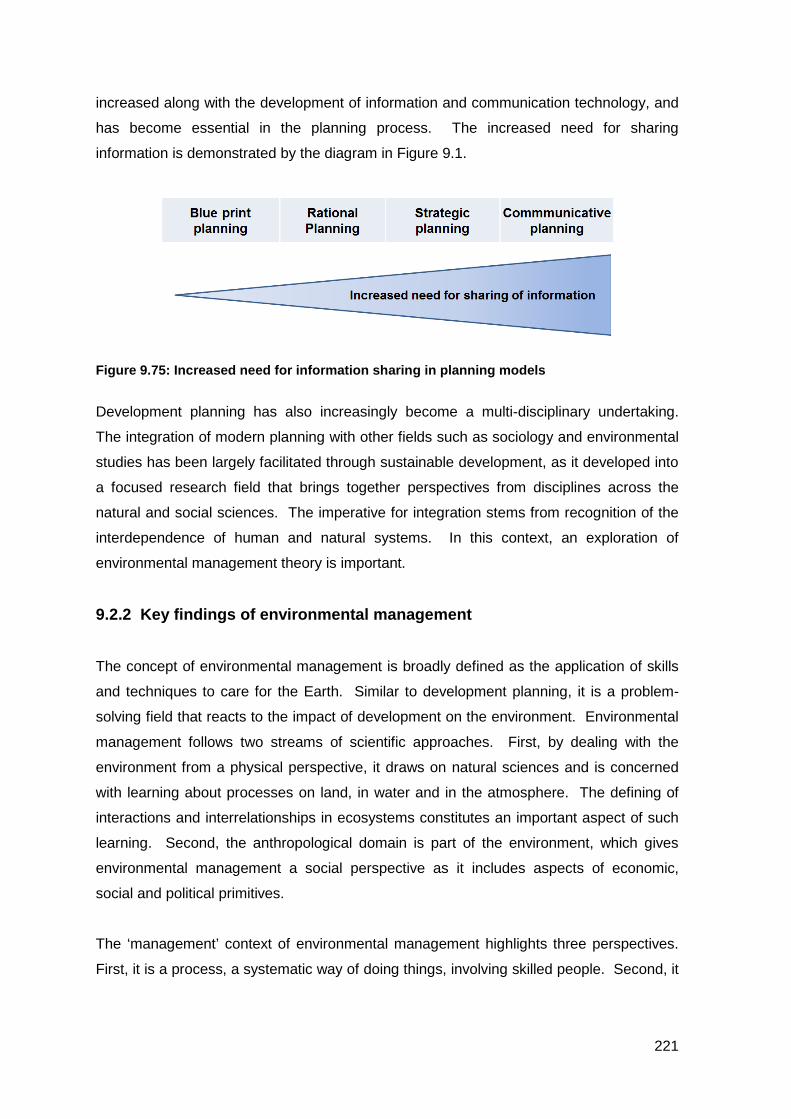
increased along with the development of information and communication technology, and
has become essential in the planning process. The increased need for sharing
information is demonstrated by the diagram in Figure 9.1.
Figure 9.75: Increased need for information sharing in planning models
Development planning has also increasingly become a multi-disciplinary undertaking.
The integration of modern planning with other fields such as sociology and environmental
studies has been largely facilitated through sustainable development, as it developed into
a focused research field that brings together perspectives from disciplines across the
natural and social sciences. The imperative for integration stems from recognition of the
interdependence of human and natural systems. In this context, an exploration of
environmental management theory is important.
9.2.2 Key findings of environmental management
The concept of environmental management is broadly defined as the application of skills
and techniques to care for the Earth. Similar to development planning, it is a problem-
solving field that reacts to the impact of development on the environment. Environmental
management follows two streams of scientific approaches. First, by dealing with the
environment from a physical perspective, it draws on natural sciences and is concerned
with learning about processes on land, in water and in the atmosphere. The defining of
interactions and interrelationships in ecosystems constitutes an important aspect of such
learning. Second, the anthropological domain is part of the environment, which gives
environmental management a social perspective as it includes aspects of economic,
social and political primitives.
The ‘management’ context of environmental management highlights three perspectives.
First, it is a process, a systematic way of doing things, involving skilled people. Second, it
221
utilises resources, including materials, time, effort and money. Third, it is a goal-
orientated objective that sets targets for the protection of species and biodiversity.
Environmental management takes place within the framework of integrated environmental
management (IEM). The latter provides an underlying philosophy and a set of principles
that are aimed at promoting the sustainability of development projects. As a management
function, it is seen as a public administration function that is directed nationally and
internationally by legislation, agreements and policy, and through which various tools
have been developed to steer decision making. Two important environmental
management tools are environmental Impact assessment (EIA) and strategic
environmental assessment (SEA). The aim of EIA is to prevent substantial detrimental
effects of a development on the environment. It is normally carried out in phases (a
scoping and an EIA phase) by a team of experts in various fields, such as botany,
zoology, hydrology, archaeology and other specialist fields. Each of these experts is
involved in a process of data acquisition and processing, most of it in a GIS environment.
The integration of data is a primary function, which is required to undertake a sensitivity
analysis (as was demonstrated in Chapter 6).
SEA is a systematic process that evaluates the environmental consequences of a policy,
plan or programme. It forms part of strategic planning and provides an environmental
framework for development. In terms of spatial planning, SEA functions on a regional to
national level. As in the case of EIA, information is a crucial component of SEA,
specifically GIS, albeit at a coarser scale.
Sustainable development is a key objective of environmental management and is aimed
at achieving equilibrium between social, biological and economic systems. Despite
challenges to maintain the principles of sustainable development, it remains an important
goal to achieve economic prosperity, environmental protection and social advancement.
This is reflected in the wide body of research on sustainable development, and the
development of indicators that are published regularly to monitor progress on achieving
sustainability targets.
The spatial context of sustainable development is reflected in landscape ecology, which is
aimed at defining the functioning of anthropological and ecological systems in a
landscape. A landscape perspective provides a framework for understanding spatial
patterns and ecological processes, and provides inputs for development planning and
222
environmental management. This finding is key to the development of the data model in
this study, as it is grounded in spatial relationships that exist in patterns and processes.
9.2.3 Key findings of disaster risk management
Disaster risk management provides the wider context within which disaster risk reduction
is undertaken. The theoretical development of this field is characterised by changes in
approaches and, similar to development planning, follows a post-modern development
pattern that is rooted in the post-World War II developments. Approaches to disaster risk
management seek to define concepts of disaster, hazard, vulnerability and resilience.
Disaster is clearly defined as a multi-faceted construct, with a strong social component
that conceptualises response to disaster. Disaster risk management includes a
continuum of activities that relate to two main lines of activity, i.e. risk reduction and
disaster response. This study has focused on the first line and is mainly concerned with
aspects of vulnerability. Vulnerability is a property of human society, and is coupled with
two conditions: the status of development and the natural environment, referred to as the
coupled human-environment system, which is further linked to planning and management.
From this perspective, vulnerability studies contribute to the understanding of the cause
and impact of disaster.
Disaster risk management is a multi-disciplinary undertaking and is strongly connected to
development planning. An analysis of disaster risk and development shows five
conceptualisations of their interrelationships:
(i) Development is the root cause of disasters.
(ii) Disasters have a negative impact on development.
(iii) Development plays an important role in disaster risk reduction.
(iv) Disasters can provide development opportunities.
(v) Disaster risk is exacerbated by improper disaster management policies combined
with development failure.
The interrelationships of vulnerability and the coupled human–environment system
provide a foundation for the spatial representation of disaster risk. Just as vulnerability is
a multi-faceted concept, so is its spatial representation. Just as disaster risk management
calls for an integrated approach, so should the associated information management
systems also function in an integrated environment. The framework that is presented in
Figure 9.3 illustrates how data collection activities in the domains of disaster risk
223
management and development planning should be approached with a view to integration,
and not to different isolated GIS applications.
9.2.4 Key findings of geographic information systems
Geographic information systems (GIS) developed from a computer-based technology to
capture analogue maps into a science that is concerned with the representation of geo-
spatial phenomena in an electronic database format, and the processing, analysis and
visualisation of the data. Its use has expanded to include a wide variety of applications,
notably development planning, environmental management and disaster risk
management.
As an information system, GIS is grounded in information systems theory. The
development of a GIS application is primarily concerned with database issues. The
design of the system is informed by different levels of abstraction, starting with a
conceptual model of reality in which geo-spatial objects and their interrelationships are
identified. These relationships are determined by their functioning in the landscape, as
was highlighted in Section 6.2.2. The design is further informed by the goals of the
application field, which direct activities along tasks and related functions. These goals will
determine the scale of representation, which in turn informs the level of data abstraction.
In this context, the concepts of geo-atoms and basic spatial units are important to
understand, as these present the smallest spatial units from where the aggregation of
data can take place.
GIS science is concerned with the collection and processing of spatial data. The analysis
of data occurs within a decision-making framework, where the outputs of the system are
visualised in various formats ranging from statistics presented in tables to spatial features
on maps. At this juncture, it must be emphasised that the analytical power of GIS lies in
its data-processing abilities, and not in the visual interpretation of maps. The cognitive
analysis of the information that is presented on maps generated from GIS is the same as
any other kind of map, which could have been generated by hand or any other type of
image-based computer software. The major difference is that any changes in reality that
affect the modelled objects, or changes in the analysis requirements of the application
field, are best handled in a GIS, as is demonstrated by the data model in Chapter 8. A
framework for GIS science is next presented in Figure 9.2.
224

Figure 9.76: A framework for GIS science
9.2.5 A summary of key findings
A summary of key findings is presented in Table 9.2. It indicates the high level of
commonalities that exist between development planning, environmental management,
and disaster risk management, as was highlighted in Chapter 7. The dependence on GIS
technology can be emphasised, as it supports the concept of GIS as a central and
integrating factor. This is demonstrated by the GIS-based model presented in Chapter 8,
which provides grounding for a framework for the integration of development planning,
environmental management and disaster risk management.
Table 9.6 Summary of key findings
Development planning
Environmental management
Disaster risk management
i Multi-disciplinary field ● ● ● ii Spatial orientation ● ● ● iii Concerned with environmental degradation ● ● ● iv Concerned with social upliftment ● ● ● v Focus on sustainable development ● ● ● vi Influenced by development planning ● ● vii Influenced by environmental management ● ● viii Dependent on GIS technology ● ● ●
225
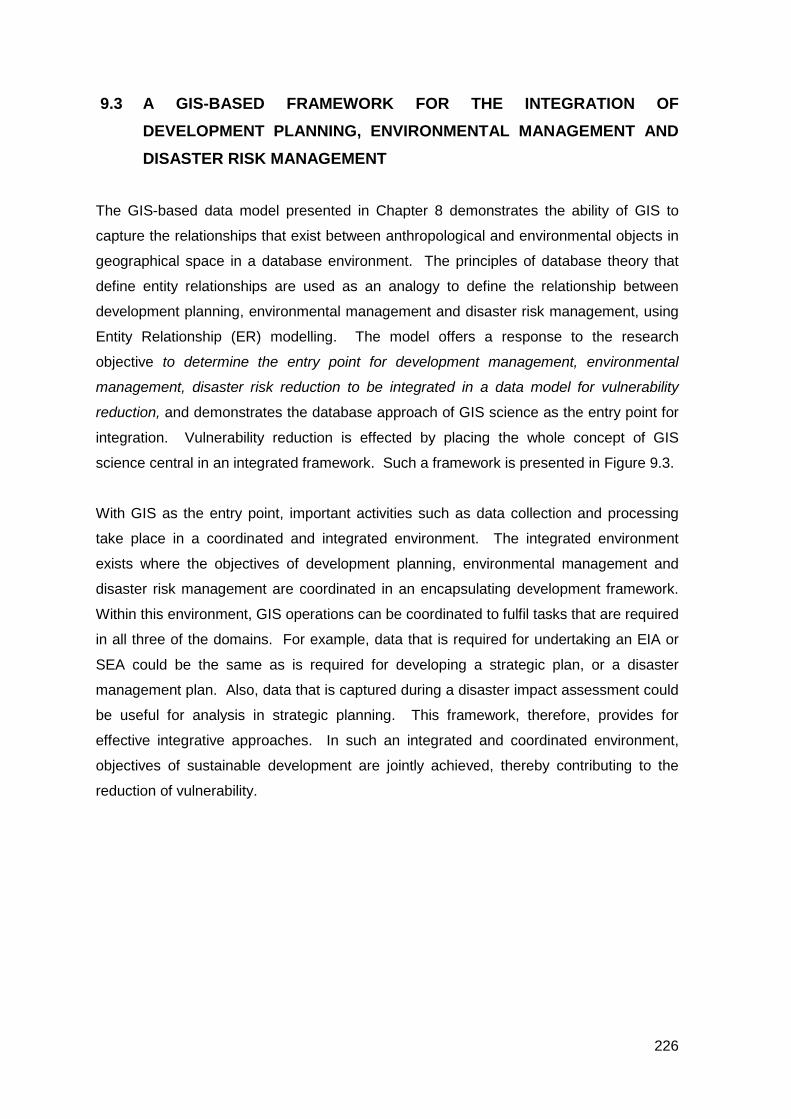
9.3 A GIS-BASED FRAMEWORK FOR THE INTEGRATION OF DEVELOPMENT PLANNING, ENVIRONMENTAL MANAGEMENT AND DISASTER RISK MANAGEMENT
The GIS-based data model presented in Chapter 8 demonstrates the ability of GIS to
capture the relationships that exist between anthropological and environmental objects in
geographical space in a database environment. The principles of database theory that
define entity relationships are used as an analogy to define the relationship between
development planning, environmental management and disaster risk management, using
Entity Relationship (ER) modelling. The model offers a response to the research
objective to determine the entry point for development management, environmental
management, disaster risk reduction to be integrated in a data model for vulnerability
reduction, and demonstrates the database approach of GIS science as the entry point for
integration. Vulnerability reduction is effected by placing the whole concept of GIS
science central in an integrated framework. Such a framework is presented in Figure 9.3.
With GIS as the entry point, important activities such as data collection and processing
take place in a coordinated and integrated environment. The integrated environment
exists where the objectives of development planning, environmental management and
disaster risk management are coordinated in an encapsulating development framework.
Within this environment, GIS operations can be coordinated to fulfil tasks that are required
in all three of the domains. For example, data that is required for undertaking an EIA or
SEA could be the same as is required for developing a strategic plan, or a disaster
management plan. Also, data that is captured during a disaster impact assessment could
be useful for analysis in strategic planning. This framework, therefore, provides for
effective integrative approaches. In such an integrated and coordinated environment,
objectives of sustainable development are jointly achieved, thereby contributing to the
reduction of vulnerability.
226
Figure 9.77: A framework for the integration of development planning, environmental
management and disaster risk management
9.4 RELEVANCE AND VALUE OF THE STUDY
This study is relevant to development planning, environmental management and disaster
risk management as established disciplines. It provides a GIS-based model that can be
applied in practice in any of these disciplines. The integrative approach of this study is
also relevant to the ideas of developing a unified theory that incorporates disaster risk
reduction, development planning and environmental management. In this regard, the
framework presented in Section 6.3 above provides an outline for further research.
The implementation of the integration framework provides an opportunity to inform
thoughts on inter-disciplinary approaches in disaster risk management practice. It also
offers an opportunity for innovative thinking, for example a view that disaster events are
part of reality. Hence, they could be approached as special projects, where response
activities can inform the planning process through the interface of spatial information and
communicative planning. Within this framework, sector-based activities such as strategic
planning, disaster risk assessments, SEA, EIA, EMFs, IDPs, SDFs and RIAs form part of
the goals and objectives of holistic development planning approaches.
227
9.5 CONCLUSION AND RECOMMENDATIONS
This chapter presented the key findings of a literature study that described the theoretical
grounding of development planning, environmental management, disaster risk
management and geographic information systems. It then presented a framework for the
integration of these disciplines through a GIS-based data model, indicating the latter’s
value for developing new approaches towards disaster risk reduction.
In conclusion, it is recommended that the data model be further explored with a view to
expansion and testing in a research environment.
228
ANNEXURE 1 TO CHAPTER 3
Rostow’s Stages of Economic Growth (Sources: Potter et al., 2008:33; Hopper, 2012:31).
Stage 1: Traditional societies The initial stage in which society and economy are relatively static. Characterised by the
primitive nature of science or technology, people’s values being fatalistic, and production
and trade based on custom and barter.
Stage 2: Conditions for take-off Industrialisation becomes possible through the development of entrepreneurship, capital
investment, educational expansion and centralisation of nation states.
Stage 3: Take-off Take-off occurs when the manufacturing sector lifts away from its economic base.
Characterised by removal of traditional barriers to economic growth, increased
investment, growth of economic elites, rapid economic growth and commercialisation of
agriculture. This is the most important stage when net investment and savings as a ratio
to national income grow from 5 to 10 per cent, which nominally facilitates industrialisation.
Stage 4: Drive to maturity
This stage follows take-off and enters a lengthy phase of up to six decades or more.
Characterised by the economy taking its place in the international order, a move away
from heavy industry, diversification of industrial and agricultural sectors, investment
increases to between 10 and 20 per cent of national income.
Stage 5: Age of high mass consumption Characterised by increasing importance of consumer goods and services, and
development of a welfare state.
229
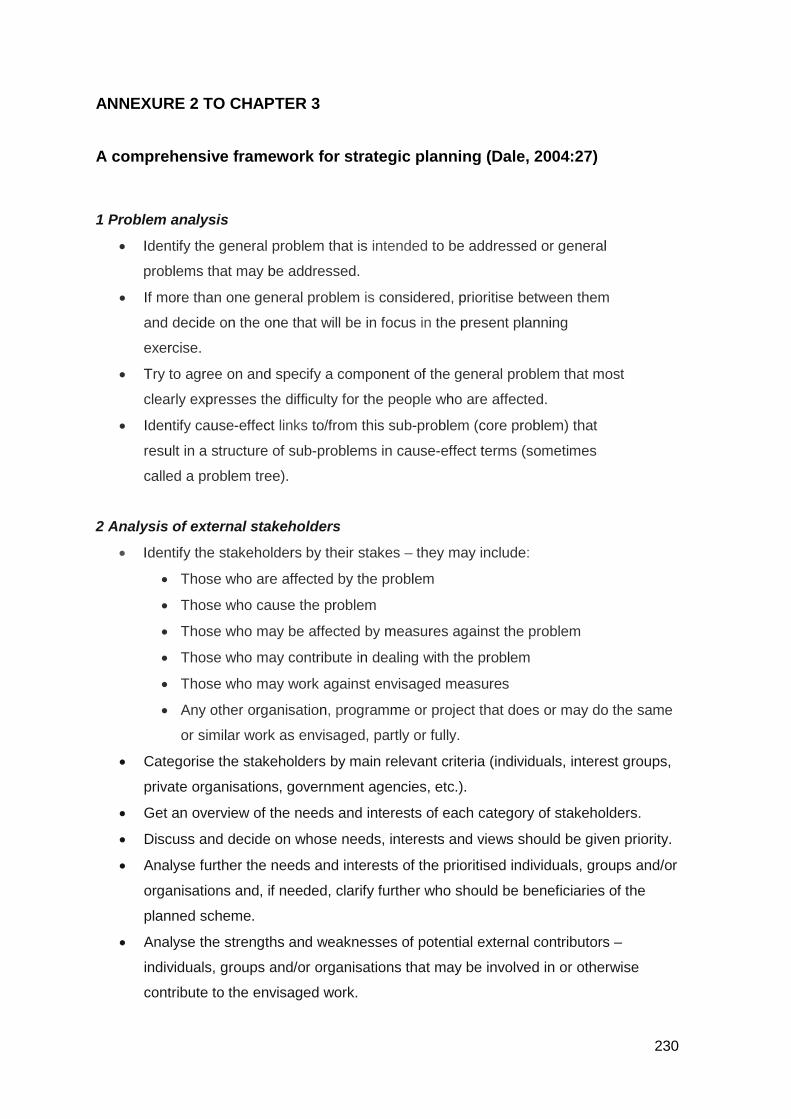
ANNEXURE 2 TO CHAPTER 3
A comprehensive framework for strategic planning (Dale, 2004:27) 1 Problem analysis
• Identify the general problem that is intended to be addressed or general
problems that may be addressed.
• If more than one general problem is considered, prioritise between them
and decide on the one that will be in focus in the present planning
exercise.
• Try to agree on and specify a component of the general problem that most
clearly expresses the difficulty for the people who are affected.
• Identify cause-effect links to/from this sub-problem (core problem) that
result in a structure of sub-problems in cause-effect terms (sometimes
called a problem tree).
2 Analysis of external stakeholders
• Identify the stakeholders by their stakes – they may include:
• Those who are affected by the problem
• Those who cause the problem
• Those who may be affected by measures against the problem
• Those who may contribute in dealing with the problem
• Those who may work against envisaged measures
• Any other organisation, programme or project that does or may do the same
or similar work as envisaged, partly or fully.
• Categorise the stakeholders by main relevant criteria (individuals, interest groups,
private organisations, government agencies, etc.).
• Get an overview of the needs and interests of each category of stakeholders.
• Discuss and decide on whose needs, interests and views should be given priority.
• Analyse further the needs and interests of the prioritised individuals, groups and/or
organisations and, if needed, clarify further who should be beneficiaries of the
planned scheme.
• Analyse the strengths and weaknesses of potential external contributors –
individuals, groups and/or organisations that may be involved in or otherwise
contribute to the envisaged work.
230
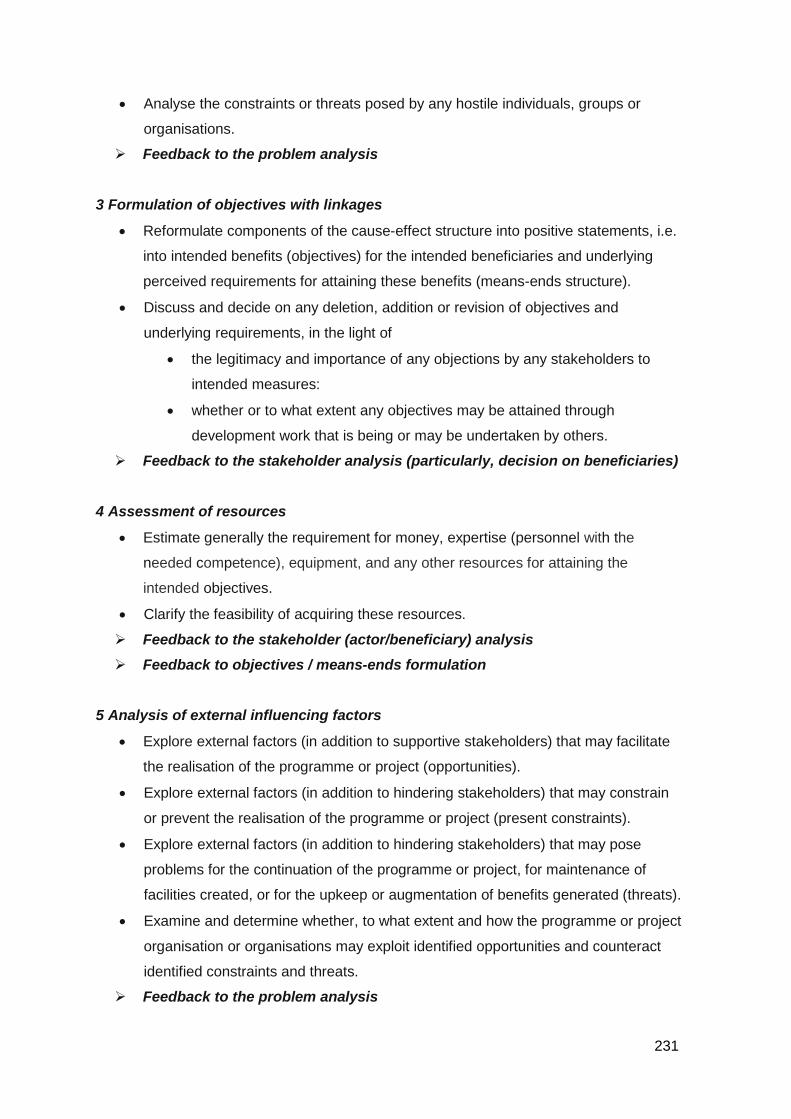
• Analyse the constraints or threats posed by any hostile individuals, groups or
organisations.
Feedback to the problem analysis
3 Formulation of objectives with linkages
• Reformulate components of the cause-effect structure into positive statements, i.e.
into intended benefits (objectives) for the intended beneficiaries and underlying
perceived requirements for attaining these benefits (means-ends structure).
• Discuss and decide on any deletion, addition or revision of objectives and
underlying requirements, in the light of
• the legitimacy and importance of any objections by any stakeholders to
intended measures:
• whether or to what extent any objectives may be attained through
development work that is being or may be undertaken by others.
Feedback to the stakeholder analysis (particularly, decision on beneficiaries)
4 Assessment of resources
• Estimate generally the requirement for money, expertise (personnel with the
needed competence), equipment, and any other resources for attaining the
intended objectives.
• Clarify the feasibility of acquiring these resources.
Feedback to the stakeholder (actor/beneficiary) analysis Feedback to objectives / means-ends formulation
5 Analysis of external influencing factors
• Explore external factors (in addition to supportive stakeholders) that may facilitate
the realisation of the programme or project (opportunities).
• Explore external factors (in addition to hindering stakeholders) that may constrain
or prevent the realisation of the programme or project (present constraints).
• Explore external factors (in addition to hindering stakeholders) that may pose
problems for the continuation of the programme or project, for maintenance of
facilities created, or for the upkeep or augmentation of benefits generated (threats).
• Examine and determine whether, to what extent and how the programme or project
organisation or organisations may exploit identified opportunities and counteract
identified constraints and threats.
Feedback to the problem analysis
231
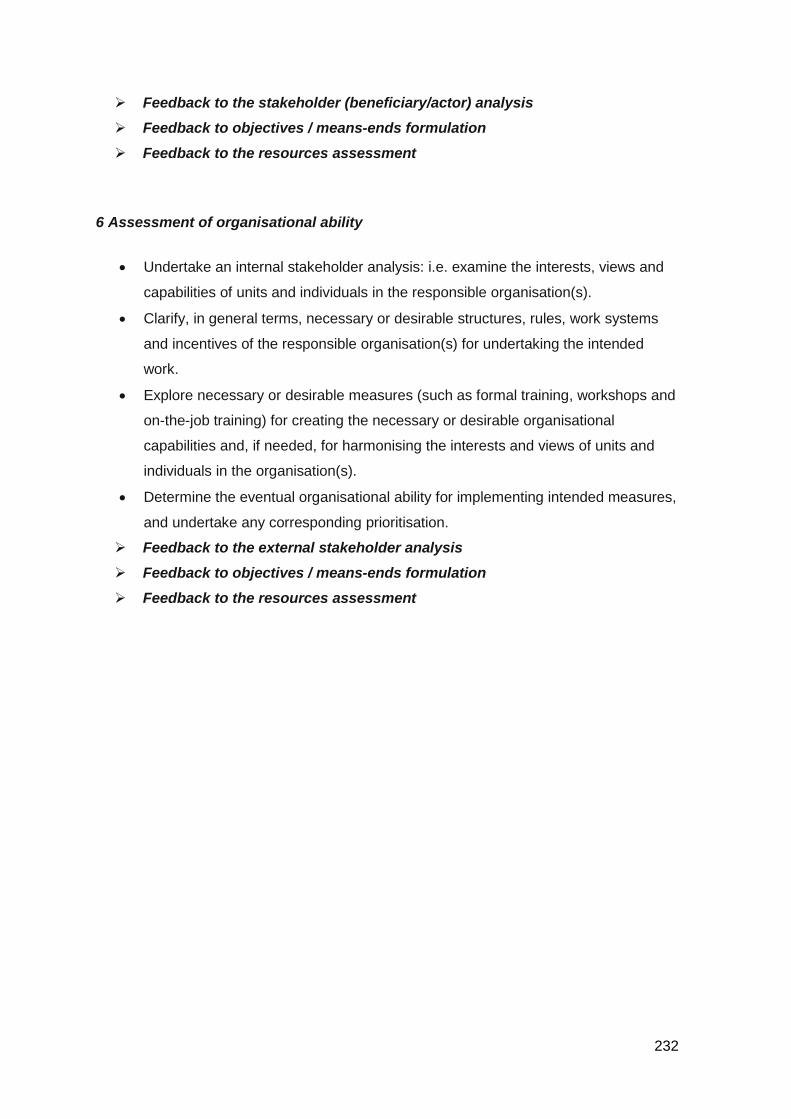
Feedback to the stakeholder (beneficiary/actor) analysis Feedback to objectives / means-ends formulation Feedback to the resources assessment
6 Assessment of organisational ability
• Undertake an internal stakeholder analysis: i.e. examine the interests, views and
capabilities of units and individuals in the responsible organisation(s).
• Clarify, in general terms, necessary or desirable structures, rules, work systems
and incentives of the responsible organisation(s) for undertaking the intended
work.
• Explore necessary or desirable measures (such as formal training, workshops and
on-the-job training) for creating the necessary or desirable organisational
capabilities and, if needed, for harmonising the interests and views of units and
individuals in the organisation(s).
• Determine the eventual organisational ability for implementing intended measures,
and undertake any corresponding prioritisation.
Feedback to the external stakeholder analysis Feedback to objectives / means-ends formulation Feedback to the resources assessment
232
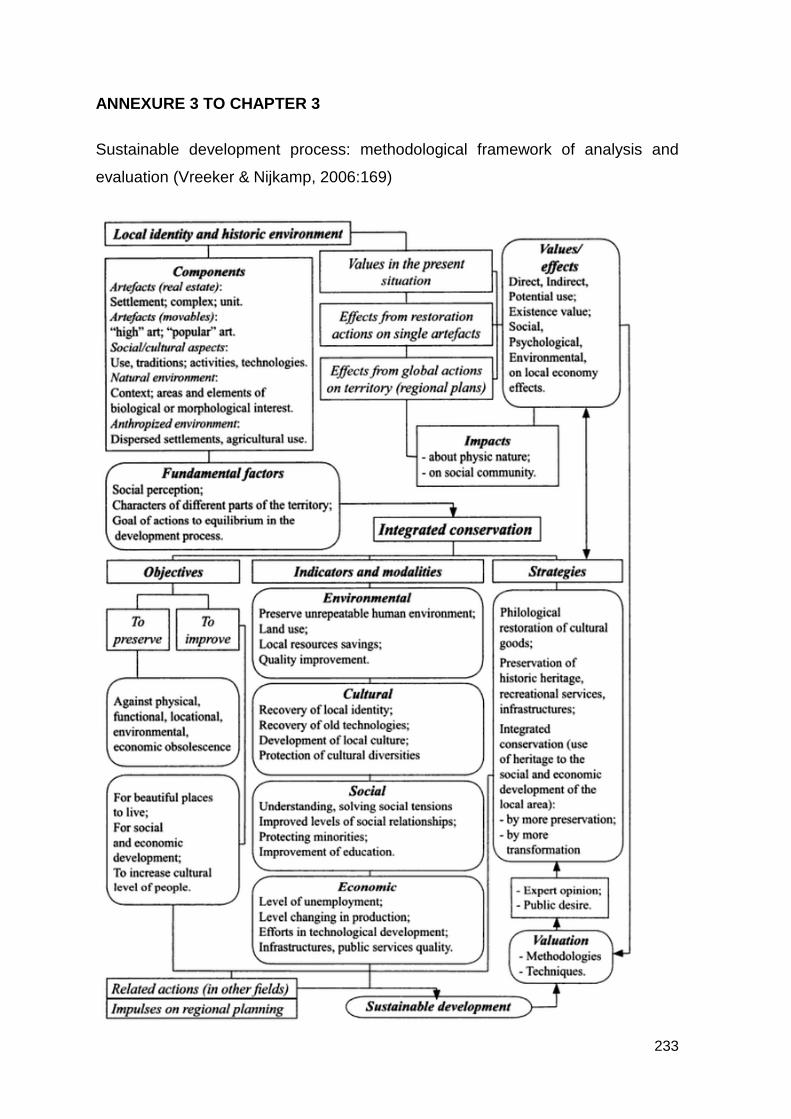
ANNEXURE 3 TO CHAPTER 3 Sustainable development process: methodological framework of analysis and
evaluation (Vreeker & Nijkamp, 2006:169)
233
BIBLIOGRAPHY
ALBERTI, M., MARZLUFF, J.M., SHULENBERGER, E., BRADLEY, G. & RYAN, C. &
ZUMBRUNNEN, C. 2003. Integrating humans into ecology: Opportunities and
challenges for studying urban ecosystems. BioScience, 53(12):1169-1179.
ALBRECHT, J. 1995. Semantic net of universal elementary GIS functions. In
Proceedings ACSM/ASPRS Annual Convention and Exposition Technical Papers, 4:235-
244.)
ALBRECHT, J. 1998. Universal analytical GIS operations: a task-oriented
systematization of data structure-independent GIS functionality. (In Craglia, M. & Harlan,
O. eds. Geographic Information Research: Transatlantic perspectives. London: Taylor &
Francis, p.531-544.)
ALEXANDER, D.E. 1991. Disasters. The Journal of Disaster Studies and Management.
Disasters, 15(3):209-226.
ALEXANDER, D. 2005. An interpretation of disaster in terms of changes in culture,
society and international relations. (In Perry, R.W. & Quarantelli, E. eds. What is a
disaster? New Answers to Old Questions. International Research Committee on
Disasters. p. 153-172).
ALEXANDER, D. 2007. Disaster Management: From theory to implementation. Journal
of Seismology and Earthquake Engineering, 9(1):49-59.
ALEXANDER, D.E. 2009. Theoretical notes on vulnerability to disaster. Disaster
planning and emergency management. http://emergency-
planning.blogspot.com/2009/01/theoretical-notes-on-vulnerability-to.html. Date of access:
25 May 2014.
ALEXANDER, D.E. 2012. Our starting point. International Journal of Disaster Risk
Reduction, 1(2012):1-4.
ALEXANDER, D.E. 2013. Resilience and disaster risk reduction: an etymological
journey. Natural Hazards and Earth System Science, 13(11):2707-2716.
234
ALEXANDER, D. & DAVIS, I. 2012. Disaster risk reduction: An alternative viewpoint.
International Journal of Disaster Risk Reduction, 2(2012):1-5.
ALEXANDER, E.R. & FALUDI, A. 1989. Planning and plan implementation - notes on
evaluation criteria. Environment and Planning B: Planning and Design, 16(2):127-140.
ALLIN, S. & WALSH, C. 2010. Strategic spatial planning in European city-regions:
Parallel processes or divergent trajectories? Maynooth. (NIRSA Working Paper Series
No 60 – September 2010).
ALLMENDINGER, P. 1998. Planning practice and the post‐modern debate. International
Planning Studies. 3(2):227-248.
ALLMENDINGER, P. 2002. Towards a post-positivist typology of planning theory.
Planning Theory, 1(1), pp.77-99.
ALLMENDINGER, P. & TEWDWR-JONES, M. 2002. Planning futures new directions for
planning theory. London: Routledge
ANSELIN, L. 1999. The future of spatial analysis in the social sciences. Geographic
Information Sciences, 5(2):67-76.
ARCHER, E., ENGELBRECHT, F., LANDMAN, W., LE ROUX, A., VAN HUYSSTEEN, E.,
FATTI, C., VOGEL, C., AKOON, I., MASERUMULE, R., COLVIN, C., LE MAITRE, D.,
LOTTER, D., OLWOCH, J., WRIGHT, C., MEYER, AA., THERON, A., DIEDERICKS, G.,
MAHERRY, A., ROSSOUW, M., MIDGLEY, G., DAVIS, C., STEVENS, N., SINDEN, L-A.,
WARBURTON, M., NKAMBULE, C. 2010. South African Risk and Vulnerability Atlas.
Pretoria: Department of Science and Technology.
ARCHIBUGI, F. 2008. Planning Theory. From the political debate to the methodological
reconstruction. Milan: Springer-Verlag.
ARCHIBUGI, F. 2004. Planning theory: reconstruction or requiem for planning?
European Planning Studies, 12(3):425-444.
ARMA ș, I. & GAVRIș, A. 2013. Social vulnerability assessment using spatial multi-
criteria analysis (SEVI model) and the Social Vulnerability Index (SoVI model) – a case
study for Bucharest, Romania. Natural Hazards and Earth System Science, 13(6):1481-
1499.
235
BALDWIN, B. 2010. The role of Geographic Information Systems in post-disaster
neighborhood recovery: Lessons from Hurricanes Katrina and Rita. New Orleans:
University of New Orleans. (Thesis - Master of Urban and Regional Planning).
BANFIELD, E.C. 1959. Ends and means in planning. International Social Science
Journal. XI(3):361-368.
BANKOFF, G. 2001. Rendering the world unsafe: “vulnerability” as western discourse.
Disasters, 25(1):19-35.
BANKOFF, G. 2004. Time is of the essence: Disasters, vulnerability and history.
International Journal of Mass Emergencies, 22(3):23-42.
BARROWS, H.H. 1923. Geography as human ecology. Annals of the Association of
American Geographers, 13:1-14.
BATES, F.L., DYNES, R,R. & QUARANTELLI, E.L. 1991. The Importance of the Social
Sciences to the International Decade for Natural Disaster Reduction. Disasters,
15(3):288-289.
BEATON, R., BRIDGES, E., SALAZAR, M.K., OBERLE, M.W., STERGACHIS, A.,
THOMPSON, J. AND BUTTERFIELD, P. 2008. Ecological model of disaster
management. Official Journal of the American Association of Occupational Health Nurses,
56(11):471-478.
BEIER, P. & BROST, B. 2010. Use of land facets to plan for climate change: conserving
the arenas, not the actors. Conservation Biology, 24(3):701-10.
BENN, D. 2004. Development policy. Changing Perspectives and Emerging Paradigms.
Keynote address presented at the Framework for Caribbean Investigation and Analysis
conference in Trinidad and Tobago, 24-25 May 2004.
http://www.cepal.org/portofspain/noticias/noticias/8/14868/benn1dev.pdf. Date of access:
31 October 2014.
BERRY, J.K. 2004. Bridging GIS and map analysis: Identifying and utilizing spatial
relationships. (Paper delivered at ASPRS Annual Conference, 23-28May, Denver,
Colorado). (Unpublished).
236
BERRY, J.K. 1993. Beyond mapping: Concepts, algorithms and issues in GIS. Fort
Collins: GIS World Books.
BERTOLINI, L., LE CLERCQ, F. & KAPOEN, L. 2005. Sustainable accessibility: a
conceptual framework to integrate transport and land use plan-making. Two test-
applications in the Netherlands and a reflection on the way forward. Transport Policy,
12(3):207-220.
BIERMANN, F. 2004. Global Environmental Governance. Conceptualization and
examples. Global Governance Working Paper No 12. Amsterdam, Berlin, Oldenburg,
Potsdam: The Global Governance Project. http:// www.glogov.org. Date of access: 8 Nov.
2014.
BINA, O. 2008. Innovation in Environmental Policy? Integrating environment for
sustainability. (In A. Jordan & Lenschow, A. eds. Innovation in Environmental Policy?
Integrating the environment for sustainability. Cheltenham: Edward Elgar Publishing.
p.134-156.)
BIRKMANN, J. 1999. Indikatoren für eine nachhaltige Entwicklung. Raumforschung und
Raumordnung, 57(2-3):120-131.
BIRKMANN, J. 2005. Danger need not spell disaster. But how vulnerable are we?
United Nations University Brief No 1. http://www.ehs.unu.edu/article:175. Date of access:
7 May 2014.
BIRKMANN, J. 2006a. Indicators and criteria for measuring vulnerability: Theoretical
bases and requirements. (In Birkmann, J. ed. Measuring vulnerability to promote disaster-
resilient societies: Conceptual frameworks and definition. New Delhi: TERI Press. p.55-
77.)
BIRKMANN, J. 2006b. Measuring vulnerability to promote disaster-resilient societies:
Conceptual frameworks and definitions. (In Birkmann, J. ed. Measuring vulnerability to
natural hazards: Towards disaster resilient societies. New Delhi: TERI Press. p.9-54.)
BIRKMANN, J., CARDONA, O.D., CARREÑO, M.L., BARBAT, A.H., PELLING, M.,
SCHNEIDERBAUER, S. KIENBERGER, S., KEILER, M., ALEXANDER, D., ZEIL, P. AND
WELLE, T. 2013. Framing vulnerability, risk and societal responses: the MOVE
framework. Natural Hazards, 67(2):193-211.
237
BIRKMANN, J., KIENBERGER, S. & ALEXANDER, D. 2014. Assessment of vulnerability
to natural hazards: A European perspective. San Diego: Elsevier.
BLASCHKE, T. & MERSCHDORF, H. 2014. Geographic information science as a
multidisciplinary and multiparadigmatic field. Cartography and Geographic Information
Science, 41(3):196-213.
BLASCHKE, T., STROBL, J. & DONERT, K. 2011. Geographic Information Science:
Building a doctoral programme integrating interdisciplinary concepts and methods.
Procedia - Social and Behavioral Sciences. 21:139-146.
BLASCHKE, T., STROBL, J., SCHROTT, L., MARSCHALLINGER, R. & NEUBAUER, F.,
KOCH, A., BEINAT, E., HEISTRACHER, T., REICH, S., LEITNER, M. AND DONERT, K.
2012. Geographic Information Science as a common cause for interdisciplinary research.
(In Gensel J., Josselin, D. & Vandenbroucke, D. eds. Bridging the Geographic Information
Sciences. Lecture Notes in Geo-information and Cartography. Berlin: Springer. p. 411-
427.)
BODINI, A. & KLOTZ, S. 2002. The science of ecology for a sustainable world. (In
Knowledge for Sustainable Development: An Insight into the Encyclopaedia of Life
Support Systems, 11:15-733.)
BOHLE, H-G. 2001. Vulnerability and criticality: Perspectives from social geography.
IHDP Update 2/2001, Newsletter of the International Human Dimensions Programme on
Global Environmental Change. p.1-7.
BOIN, A. 2005. Towards An Integrative Perspective. (In Perry, R.W. & Quarantelli, E.
eds. What is a disaster? New Answers to Old Questions. International Research
Committee on Disasters. p. 153-172).
BOLTON, R. 2005. Habermas’s theory of communicative action and the theory of social
capital. Paper read at meeting of Association of American Geographers, Denver,
Colorado, April 2005. http//www.williams.edu/Economics/papers/Habermas.pdf. Date of
access: 3 Nov. 2014.
BOULANGER, P. 2008. Sustainable development indicators a scientific challenge, a
democratic issue. Surveys and perspectives integrating environment and society.
http://sapiens.revues.org/166. Date of access: 5 Oct. 2014.
238
BRÖMMELSTROET, M. HOETJES, P. & STRAATEMEIER, T. 2002. Linking information
to strategic planning processes. (In International Workshop Modeling and Decision
Support for Urban Planning held at the School of Urban Design, Wuhan University. China.
p. 21-23.)
BROWNE, N.W. 2007. The world in which we occur. Tuscaloosa: The University of
Alabama Press.
BURROUGH, P.A. 1986. Principles of geographical information systems for land
resources assessments. New York: Oxford University Press.
BURROUGH, P.A. & FRANK, A. 1995. Concepts and paradigms in spatial information:
are current geographic information systems truly generic? International Journal of
Geographical Information Systems, 9(2):101-116.
BURTON, I. KATES, R.W. & WHITE, G.F. 1968. The human ecology of extreme
geophysical events. http://scholarcommons.usf.edu/fmhi_pub/78. Date of access: 12 Jul.
2014.
BURTON, I., KATES, R.W. & WHITE, G.F. 1993. The environment as hazard. 2nd ed.
New York: The Guilford Press.
CANNON, T. 1990. A hazard need not a disaster make: Rural vulnerability and the
causes of “natural” disasters”. (In Merriman, C.W.A. & Browitt, P.A. ed. Natural Disasters:
Protecting Vulnerable Communities. London: Redwood Books. p.92-105).
CARDONA, O.D. 2004. The need to rethink holistically concepts of vulnerability and risk.
A critique and revision needed to management. (In D. Bankoff, G., Frerks, G. & Hilhorst,
eds. Mapping Vulnerability: Disasters, Development and People. London: Earthscan.
p.37-51).
CARR, E.R., WINGARD, P.M., YORTY, S.C., THOMPSON, M.C., JENSEN, N.K. &
ROBERSON, J. 2007. Applying DPSIR to sustainable development. International
Journal of Sustainable Development & World Ecology, 14(6):543-555.
CHAMBERS, R. & CONWAY, G. 1992. Sustainable Rural Livelihoods: Practical
Concepts for the 21st Century. Institute of Development Studies (IDS). Discussion Paper
296, Brighton: Institute of Development Studies, University of Sussex.
239
CIUREAN, R.L. & SCHRÖTER, D. 2013. Conceptual frameworks of vulnerability
assessments for natural disasters reduction. (In Tiefenbacher, J. ed. Approaches to
Disaster Management - Examining the Implications of Hazards, Emergencies and
Disasters.) http://www.intechopen.com/books/approaches-to-disaster-management-
examining-the-implications-of-hazards-emergencies-and-disasters/conceptual-
frameworks-of-vulnerability-assessments-for-natural-disasters-reduction. Date of access:
14 Oct. 2014.
CLARK, W.C. & DICKSON, N.M. 2003. Sustainability science: the emerging research
program. Proceedings of the National Academy of Sciences of the United States of
America, 100(14):8059-61.
CLEVELAND, C., COSTANZA, R., EGGERTSSON, T., FORTMANN, L., LOW, B.,
MCKEAN, M., OSTROM, E., WILSON, J., YOUNG, O. 1996. A Framework for modelling
the linkages between ecosystems and human systems. Stockholm: Beijer International
Institute of Ecological Economics (Beijer Discussion Paper Series No. 76).
CLICHEVSKY, N. 2003. Floods in Argentina’s Cities. (In Kreimer, A., Arnold, A. & Carlin,
M. eds. Building Safer Cities: The Future of Disaster Risk. Washington, D.C.: The World
Bank Disaster Management Facility, p. 165-180).
CODD, E.F. 1970. A relational model of data for large shared data banks.
Communications of the ACM, 13(6):378-387.
COETZEE, J. 2012. The transformation of municipal development planning in South
Africa (post-1994): Impressions and impasse. Stads- en Streeksbeplanning = Town and
Regional Planning, (61):10-20.
COETZEE, C. & VAN NIEKERK, D. 2012. Tracking the evolution of the disaster
management cycle: A general system theory approach. Jàmbá: Journal of Disaster Risk
Studies, 4(1):1-9.
COMBER, A., FISHER, P. & WADSWORTH, R. 2005. What is land cover? Environment
and Planning B: Planning and Design, 32(2):199-209.
COPPOCK, J. T. & RHIND, D.W. 1991. The history of GIS. (In Maguire, D.J., Goodchild,
M. & Rhind, D.W. eds. Geographical information systems: Principles and applications.
Volume 1. New York: John Wiley and Sons. p.21-43).
240
COPPOLA, D.P. 2007. Introduction to international disaster management. New York:
Elsevier.
COUCLELIS, H. 1992. People manipulate objects (but cultivate fields): Beyond the
raster-vector debate in GIS. (In Frank, A.U., Campari, I. & Formentini, eds. Theory and
Methods of Spatio-Temporal Reasoning in Geographic Space. Berlin: Springer, p.65-77).
CUMMING, G.S., OLSSON, P., CHAPIN, F.S. & HOLLING, C.S. 2013. Resilience,
experimentation, and scale mismatches in social-ecological landscapes. Landscape
Ecology, 28(6):1139-1150.
CUTTER, S.L. 1996. Vulnerability to environmental hazards. Progress in Human
Geography, 20(4):529-539.
CUTTER, S.L. 2001. The changing nature of risks and hazards. (In Cutter, S.L. ed.
American hazardscapes. The regionalization of hazards and disasters. Washington, D.C.:
Joseph Henry Press, p.15-26).
CUTTER, S.L., BARNES, L., BERRY, M., BURTON, C., EVANS, E., TATE, E., WEBB, J.
2008. A place-based model for understanding community resilience to natural disasters.
Global Environmental Change, 18(4):598-606.
CUTTER, S.L., BORUFF, B.J. & SHIRLEY, W.L. 2003. Social vulnerability to
environmental hazards. Social Science Quarterly, 84(2):242-261.
CUTTER, S.L., MITCHELL, J.T. & SCOTT, M.S. 1997. Handbook for conducting a GIS-
based hazards assessment at the county level. (Report prepared for South Carolina
Emergency Preparedness Division Office of the Adjutant General).
CUTTER, S.L., MITCHELL, J.T. & SCOTT, M.S. 2000. Revealing the vulnerability of
people and places: A case study of Georgetown. Annals of the Association of American
Geographers, 90(4):713-737.
DARK, S.J. & BRAM, D. 2007. The modifiable areal unit problem (MAUP) in physical
geography. Progress in Physical Geography, 31(5):471-479.
DARWEN, H. 2009. An introduction to relational database theory. Hugh Darwin &
Ventus Publishing.
241
DAVIDOFF, P. 1965. Advocacy and pluralism in planning. Journal of the American
Institute of Planners, 31(4):331-338.
DAVIS, C.A., FONSECA, F.T. & CAMARA, G. 2011. Environmental sustainability: The
role of Geographic Information Science and SDI in the integration of people and nature.
(In Nyerges, R., Couclelis, T. & McMaster, H. eds. The SAGE handbook of GIS and
society. London: SAGE Publications, p.123-138).
DE SMET, H., LEYSEN, J. & LAGADEC, P. 2011. The Response Phase of the Disaster
Life Cycle Revisited. (In Proceedings of the 2011 Industrial Engineering Research
Conference, edited by T. Doolen and E. Van Aken.)
DEPARTMENT FOR INTERNATIONAL DEVELOPMENT (DFID). 1999. Sustainable
Livelihood Guidance Sheets. http://www.livelihoods.org/ info/info_guidancesheets.html.
Date of access: 12 Nov. 2014.
DEPARTMENT FOR INTERNATIONAL DEVELOPMENT (DFID). 2005. Disaster risk
reduction: a development concern. ODG: DFID.
DOMBROWSKY, W.R. 1995. Is a disaster what we call a disaster? International Journal
of Mass Emergencies and Disasters, 13(3):241-254.
DOMBROWSKY, W.R. 2005. Not every move is a step forward: A critique of David
Alexander, Susan L. Cutter, Rohit Jigyasu and Neil Britton. (In Perry, E. & Quarantelli,
D.A., eds. What is a disaster? New Answers to Old Questions. Bloomington: Xlibris, p.79-
96).
DOVERS, S. 2005. Clarifying the imperative of integration research for sustainable
environmental management. Journal of Research Practice, 1(2).
http://jrp.icaap.org/index.php/jrp/issue/view/2. Date of access: 29 Apr. 2014.
DRABEK, T.E. 2006. Community processes: coordination. (In Rodriguez, H.,
Quarantelli, E.L., Dynes , R.R., eds. Handbook of Disaster Research. New York:
Springer, p.217-233).
DRABEK, T.E. 2007. Sociology, disasters and emergency management: History,
contributions, and future agenda. (In D.A. McEntire, ed. Disciplines, disasters and
emergency management: The convergence and divergence of concepts, issues and
trends in the research literature. Springfield: Charles C Thomas Publisher, p.61-74).
242
DRABEK, T.E. & EVANS, J. 2004. Theories relevant to emergency management versus
a theory of emergency management. (A paper presented at the annual Emergency
Management Higher Education Conference, National Emergency Training Center,
Emmitsburg, Maryland, June 2004). http://training.fema.gov. Date of access: 1 Jun. 2014.
DUHL, L.J. & SANCHEZ, A.K. 1999. Healthy cities and the city planning process. A
background document on links between health and urban planning. (Report for the World
Health Organisation, Copenhagen).
EGERTON, F.N. 2013. History of Ecological Sciences, Part 47: Ernst Haeckel’s Ecology
Frank. Contributions. Bulletin of the Ecological Society of America, p.222-244.
http://esapubs.org/bulletin/current/history_links_list.htm. Date of access: 4 Aug. 2014.
EISER, J. R., BOSTROM, A., BURTON, I., JOHNSTON, D.M., MCCLURE ,J., PATON,
D., VAN DER PLIGT, J. & WHITE, M.P. 2012. Risk interpretation and action: A
conceptual framework for responses to natural hazards. International Journal of Disaster
Risk Reduction, 1:5-16.
ELLIOTT, J. 2006. An introduction to sustainable development. 3rd ed. London:
Routledge.
EKURHULENI METROPOLITAN MUNICIPALITY (EMM). 2007. Environmental
Management Framework for Ekurhuleni. Kempton Park: EMM.
ESTEVA, G. 1992. Development. (In Sachs, W. ed. The Development Dictionary.
London: Zed. p.6-25).
EPP, S.S. 2004. Discrete mathematics: with applications. 3rd ed. Belmont: Cengage
Learning.
FABER, N., JORNA, R. & VAN ENGELEN, J. 2005. The sustainability of “sustainability”
– a study into the conceptual foundations of the notion of “sustainability”. Journal of
Environmental Assessment Policy and Management, 7(1):1-33.
FAINSTEIN, S.S. 2000. New Directions in Planning Theory. Urban Affairs Review,
35(4):451-478.
FAINSTEIN, S.S. 2005. Planning theory and the city. Journal of Planning Education and
Research, 25(2):121-130.
243
FAKIER, S., STEPHENS, S. & THOLIN, J. 2005. National state of the environment
project. Environmental governance. (Background Research Paper produced for the South
Africa Environment Outlook report on behalf of the Department of Environmental Affairs
and Tourism). http://soer.deat.gov.za. Date of access: 8 Nov. 2014.
FALUDI, A. 2000. The performance of spatial planning. Planning Practice and Research,
15(4):299-318.
FERIS, L.A. 2010. The role of good environmental governance in the sustainable
development of South Africa. Potchefstroom Electronic Law Journal, 13(1):72-99.
FISCHER, M.M. 1994. From conventional to knowledge-based Geographical Information
Systems. (Discussion paper WSG 35/94. Department of Economic and Social
Geography, Vienna University of Economics and Business Administration.)
FORDHAM, M. 2006. Disaster and development research and practice: A necessary
eclecticism? (In Rodriguez, H., Quarantelli, E.L. & Dynes , R.R. eds. Handbook of
Disaster Research. New York: Springer. p.335-346.)
FORMAN, R.T.T. 1995. Some general principles of landscape and regional ecology.
Landscape Ecology, 10(3):133-142.
FRIEDMANN, J. 1987. Planning in the public domain: from knowledge to action.
Princeton: Princeton University Press.
FRIEDMANN, J. 1996. The core curriculum in planning revisited. Journal of Planning
Education and Research, 15(2):89-104.
FRIEDMANN, J. 1998. Planning theory revisited. European Planning Studies, 6(3):245-
253.
FÜSSEL, H. 2007. Vulnerability: A generally applicable conceptual framework for climate
change research. Global Environmental Change, 17(2):155-167.
GALLOPÍN, G.C. 2006. Linkages between vulnerability, resilience, and adaptive
capacity. Global Environmental Change, 16(3):293-303.
244
GALTON, A. 2003. On the ontological status of geographical boundaries. (In Duckham,
M., Goodchild, M.F. & Worboys, M.F. eds. Foundations of geographic information
science. London: Taylor & Francis. p.151-171).
GATRELL, A.C. 1991. Concepts of space and geographical data. (In Maguire, D.J.,
Goodchild, M.F. & Rhind, D.W. eds. Geographical Information Systems: Principles and
Applications. New York: John Wiley and Sons. p.119-134).
GAUTENG DEPARTMENT OF AGRICULTURE AND RURAL DEVELOPMENT
(GDARD). Forthcoming. Gauteng provincial environmental management framework.
Johannesburg: GDARD
GILBERT, C. 1995. Studying disaster: A review of main conceptual tools. International
Journal of Mass Emergencies and Disasters, 13(3):231-240.
GILBERT, C. 1998. Studying disaster: Changes in the main conceptual tools. (In
Quarantelli, E.L. ed. What is a disaster? Perspectives on the question. London:
Routledge. p.3-12).
GOODCHILD, M.F. 1987. A spatial analytical perspective on GIS. International Journal
of Geographical Information Systems, 1(4):327-334.
GOODCHILD, M.F. 1992a. Geographical information science. International Journal of
Geographical Information Science, 6(1):31-45.
GOODCHILD, M.F. 1992b. Geographical data modelling. Computers & Geosciences,
18(4):401-408.
GOODCHILD, M.F. 1999. Future directions in Geographic Information Science.
Geographic Information Sciences, 5(1):1-8.
GOODCHILD, M.F. 2004. GIScience, geography, form, and process. Annals of the
Association of American Geographers, 94(4):709-714.
GOODCHILD, M.F. 2009. Geographic information systems and science: today and
tomorrow. Annals of GIS, 15(1):3-9.
GOODCHILD, M.F. & GLENNON, J.A. 2010. Crowdsourcing geographic information for
disaster response: a research frontier. International Journal of Digital Earth, 3(3):231-241.
245
GOODCHILD, M.F., YUAN, M. & COVA, T.J. 2007. Towards a general theory of
geographic representation in GIS. International Journal of Geographical Information
Science, 21(3):239-260.
GREENE, R., DEVILLERS, R., LUTHER, J.E. & EDDY, B.G. 2011. GIS-based multiple-
criteria decision analysis. Geography Compass, 5(6):412-432.
GRIMSHAW, D.J. 1996. Towards a taxonomy of Geographical Information Systems. (In
Proceedings of the 29th Annual Hawaii International Conference on System Sciences,
vol. 3:547-556.)
GRIST, R.E. 2007. The changing paradigm of emergency management: Improving
professional development for the emergency manager. Portland: Portland State
University. (Dissertation – PhD.)
GURTNER, Y., COTTRELL, A. & KING, D. 2011. Pre & rapid: community impact
assessment for disaster recovery. Report for the Queensland Department of Communities
prepared by the Centre for Disaster Studies at James Cook University.
http://www.jcu.edu.au/cds/. Date of access: 22 Feb. 2014.
HADDOW, G.D., BULLOCK, J.A. & COPPOLA, D.P. 2011. Introduction to Emergency
Management. 4th ed. New York: Elsevier.
HAMMOND, A., ADRIAANSE, A., RODENBURG, E., BRYANT, D. & WOODWARD, R.
1995. Environmental indicators: a systematic approach to measuring sustainable
development. New York: World Resources Institute.
HARVEY, F. 2008. A primer of GIS. Fundamental geographic and cartographic
concepts. New York: The Guilford Press.
HAWLEY, A.H. 1969. Human ecology. (In Wallace, W.L.. ed. Social theory: an
introduction. Chicago: Aldine Pub.Co. p.64-70)
HAYS, J. 2008. History in the developing world (Third World). Facts and details.
http://factsanddetails.com/world/cat57/sub378/item2181.html. Date of access: 1 Nov.
2014.
HEALEY, P. 1997. Collaborative Planning: Shaping places in fragmented societies.
Vancouver: UBC Press.
246
HEALEY, P. 2003. Collaborative planning in perspective. Planning Theory, 2(2):101-123.
HEWITT, K. 2013. Disasters in “development” contexts : Contradictions and options for a
preventive approach. Jàmbá: Journal of Disaster Risk Studies, 5(2):1-22.
HILHORST, D. & BANKOFF, G. 2004. Introduction: Mapping Vulnerability. (In Bankoff,
G., Frerks, G. & Hilhorst, D. eds. Mapping vulnerability disasters, development, and
people. London: Earthscan. p.1-9.)
HINKEL, J. 2011. Indicators of vulnerability and adaptive capacity: Towards a
clarification of the science–policy interface. Global Environmental Change, 21(1):198-208.
HOLAND, I.S. & LUJALA, P. 2013. Replicating and Adapting an Index of Social
Vulnerability to a New Context: A Comparison Study for Norway. The Professional
Geographer, 65(2):312-328.
HOLLING, C.S. 1973. Resilience and stability of ecological systems. Annual Review of
Ecology and Systematics, 4(1973):1-23.
HUXLEY, M. & YIFTACHEL, O. 2000. New paradigm or old myopia? Unsettling the
communicative turn in planning theory. Journal of Planning Education and Research,
19(4):101-110.
JANELLE, D.G. & GOODCHILD, M.F. 2011. Concepts, principles, tools, and challenges
in spatially integrated social science. (In Nyerges, T.L., Couclelis, H. & McMaster, R.B.
eds. The SAGE Handbook of GIS and Society. Thousand Oaks, CA: Sage. p.27-45.)
JANSEN VAN VUUREN, I.D. 2013. A Framework for Rapid Impact Assessment with
special reference to wildfires. Jàmbá: Journal of Disaster Risk Studies, 5(2):1-8.
JENSEN, J. 2010. Emergency Management Theory: Unrecognised, underused, and
underdeveloped. (In Hubard, J.A. ed. Integrating Emergency Management Studies in
Higher Education: Ideas, Programs, and strategies. Fairfax: Public Entity Risk Institute.
p.7-24.)
KAINZ, W. 2004. Geographic Information Science (GIS). Version 2.0.
http://www.geografie.webzdarma.cz/GIS-skriptum.pdf. Date of access: 12 Oct. 2014.
247
KAINZ, W. 2010. The Mathematics of GIS. Version 2.1.
http://homepage.univie.ac.at/wolfgang.kainz/Lehrveranstaltungen/15th_Nordic_Summer_
School/The_Mathematics_of_GIS_Draft.pdf. Date of access: 7 Oct. 2014.
KATES, R.W., PARRIS, T.M. & LEISEROWITZ, A.A. 2005. What is sustainable
development? Goals, Indicators Values and Practice, 47(3):8-21.
KENDRA, J.M. & WACHTENDORF, T. 2006. Community innovation and disasters. (In
Rodriguez, H., Quarantelli, E.L. & Dynes, R.R. eds. Handbook of Disaster Research.
New York: Springer. p.316-334.)
KHAN, A., VASILESCU, L. & KHAN, H. 2008. Disaster management cycle - a theoretical
approach. Management & Marketing - Craiova, (1):43-50.
KIENBERGER, S., LANG., S., & ZEIL, P. 2009. Spatial vulnerability units – expert-based
spatial modelling of socio-economic vulnerability in the Salzach catchment, Austria.
Natural Hazards and Earth System Sciences, 9:767–778.
KRIPPENDORF, K. 2004. Content Analysis: An Introduction to its Methodology. London:
SAGE Publications.
KUHLICKE, C., SCOLOBIG, A., TAPSELL, S. & STEINFÜHRER, A. 2011.
Contextualizing social vulnerability: findings from case studies across Europe. Natural
Hazards, 58(2):789-810.
KUHN, W. 2012. Core concepts of spatial information for transdisciplinary research.
International Journal of Geographical Information Science, 26(12):2267-2276.
LABADIE, J.R. 2007. Environmental Management and Disasters: Contributions of the
discipline to the profession and practice of emergency management. (In McEntire, D.A.
ed. Disciplines, disasters and emergency management: The convergence of concepts
issues and trends from the research literature. Springfield: Charles C Thomas Publisher,
pp. 260-271).
LAVELL, A. & MASKREY, A. 2014. The future of disaster risk management.
Environmental Hazards, 13(4):267-280.
LAWRENCE, R.J. 2001. Human Ecology. (In Tolba M. ed. Our Fragile World.
Challenges and Opportunities for Sustainable Development. pp. 675-693.)
248
LEVINE, J., LANDIS, J.D. & KLOSTERMAN, R. 2007. Geographic Information Systems
for Local Planning, Journal of the American Planning Association, 55(2):209-220
LEWIS, J. & KELMAN, I. 2012. The Good, the Bad and the Ugly: Disaster Risk
Reduction (DRR) versus Disaster Risk Creation (DRC). PLOS Currents Disasters, (1):1-
24.
LIM, B., SPANGER-SIEGFRIED, E., BURTON, I., MALONE, E.L. & HUQ, S. 2004.
Adaptation policy frameworks for climate change: Developing strategies, policies and
measures. In Lim, B. & Spanger-Soegfried, E. eds. Cambridge: Cambridge University
Press.
LINDBLOM, C.E. 1979. Still muddling, not yet through. Public Adminstration Review,
39:517-526.
LINDELL, M.K. & PRATER, C.S. 2003. Assessing community impacts of natural
disasters. Natural Hazards Review, 4(4):176-185.
LING, C.Y. 2012. The Rio Declaration on Environment and Development: An
Assessment. Penang: Third World Network.
LIU, Y., GOODCHILD, M.F., GUOC, Q., TIANA, Y. & WU, L. 2008. Towards a General
Field model and its order in GIS. International Journal of Geographical Information
Science, 22(6):623-643.
LONGLEY, P.A., GOODCHILD, M.F., MAGUIRE, D.J. & RHIND, D.W. 2005.
Geographical Information Systems and Science. 2nd ed. Chichester: John Wiley & Sons.
LOW, B., COSTANZA, R., OSTROM, E., WILSON, J. & SIMON, C.P. 1999. Human–
ecosystem interactions: a dynamic integrated model. Ecological Economics, 31(2):227-
242.
LUNDGREN, L. & JONSSON, A. 2012. Assessment of social vulnerability. A literature
review of vulnerability related to climate change and natural hazards. Norrköping: Centre
for Climate Science and Policy Research.
MACFARLANE, R. 2005. A Guide to GIS Applications in Integrated Emergency
Management. Emergency Planning College, Cabinet Office.
249
MAGUIRE, D.J. 1991. An overview and definition of GIS. (In Maguire, D.J., Goodchild,
M.F. & Rhind, D.W. eds. Geographical Information Systems: overview, principles and
applications. London: Longman, p.9-20).
MAGUIRE, D.J. & DANGERMOND, J. 1991. The functionality of GIS. (In Maguire, D.J.,
Goodchild, M.F. & Rhind, D.W. eds. Geographical Information Systems: overview,
principles and applications. London: Longman, p.319-335).
MALONE, E.L. 2009. Vulnerability and resilience in the face of climate change: Current
research and needs for population information. (Report prepared for Population Action
International. Washington, D.C.)
MARCELLUS, I.O. 2009. Development Planning in Nigeria: Reflections on the National
Economic Empowerment and Development Strategy (NEEDS) 2003-2007. Journal of
Social Sciences, 20(3):197-210.
MARITZ, J. 2008. Developing a Mesoscale Geoframe. (In Gajos, M. & Styblińska, M.,
eds. Geoinformation Challenges. Sosnowiec: University of Silesia, Croatian Information
Technology Association – GIS Forum. p.119-130.)
MARK, D.M. 1999. Spatial Representation: A cognitive view. (In Maguire, D.J.,
Goodchild, M.F., Rhind, D.W. & Longley, P. eds. Geographical Information Systems:
Principles and Applications. pp. 81-89.)
MARK, D.M. 2000. Geographic Information Science: Critical Issues in an Emerging
Cross-Disciplinary Research Domain. Journal of the Urban and Regional Information
Systems Association, 12(1):45-54.
MARK, D.M. 2003. Geographic Information Science: Defining the Field. (In Duckham,
M., Goodchild, M.F. & Worboys, M.F. eds. Foundations of Geographic Information
Science. London: Taylor & Francis, p.3-18.)
MARK, D.M. & EGENHOFER, M.J. 1994. Modeling Spatial relations between lines and
regions: Combining formal mathematical models and human subjects testing.
Cartography and Geographical Information Systems, 21(3):195-212.
MASSER, I. 1988. The development of geographic information systems in Britain: the
Chorley Report in perspective. Environment and Planning B: Planning and Design,
15(1983):489-494.
250
McENTIRE, D.A. 2003. Epistemological problems in emergency management:
Theoretical dilemmas and implications. Journal of the American Society of Professional
Emergency Planners, 10:119-129.
McENTIRE, D.A. 2004a. Development, disasters and vulnerability: a discussion of
divergent theories and the need for their integration. Disaster Prevention and
Management, 13(3):193-198.
McENTIRE, D.A. 2004b. The Status of Emergency Management Theory: Issues,
Barriers, and Recommendations for Improved Scholarship. A paper presented at the
annual Emergency Management Higher Education Conference, National Emergency
Training Center, Emmitsburg, Maryland, June. http://training.fema.gov/EMIWeb/edu/
highpapers.asp. Date of access: 4 April 2013.
McENTIRE, D.A. 2005. Why vulnerability matters: Exploring the merit of an inclusive
disaster reduction concept. Disaster Prevention and Management, 14(2):206-222.
McENTIRE, D.A. & MARSHALL, M. 2003. Epistemological Problems in Emergency
Management : Theoretical Dilemmas and Implications. ASPEP Journal, pp.119–129.
McENTIRE, D.A. & SMITH, S. 2007. Making sense of consilience: Reviewing the
findings and relationship among disciplines, disasters and emergency management. (In
McEntire, D.A. ed. Disciplines, Disasters and Emergency Management: The Convergence
and Divergence of Concepts, Issues and Trends in the Research Literature. Springfield:
Charles C Thomas Publisher, p.320-336).
MEADOWS, D. 1998. Indicators and Information Systems for Sustainable Development.
Hartland Four Corners: The Sustainability Institute.
MEDEIROS, C.B. & PIRES, F. 1994. Databases for GIS. ACM Sigmod Record,
23(1):107-115.
MENNIS, J.L. & PEUQUET, D.J. 2000. A conceptual framework for incorporating
cognitive principles into geographical database representation. International Journal of
Geographical Information Science, 14(6):501-520.
MESSINA, J.P. EVANS, T.P., MANSON, S.M., SHORTRIDGE, A.M., DEADMAN, P.J. &
VERBURG, P.H. 2008. Complex systems models and the management of error and
uncertainty. Journal of Land Use Science, 3(1):11-25.
251
METZGER, P. & ROBERT, J. 2014. A geographical approach to disaster management:
Analyzing vulnerability in relation to decision and intervention resources in Lima and
Callao. International Journal of Mass Emergencies and Disasters, 32(1):26-42.
MILES, M.B. & HUBERMAN, A. 1994. Qualitative data analysis. 2nd ed. London: SAGE
Publications.
MILETI, D. 1999. Disasters by design. (In Britton, N.R. ed. The Changing Risk
Landscape: Implications for Insurance Risk Management. p.1-16.)
MILLER, F., OSBAHR, H., BOYD, E., THOMALLA, F., BHARWANI, S., ZIERVOGEL, G.,
WALKER, B., VAN DER LEEUW, S., HINKEL, J., DOWNING, T., FOLKE, C. & NELSON,
D. 2010. Resilience and Vulnerability: Complementary or Conflicting Concepts? Ecology
and Society, 15(3).
MILLER, H.J. 2004. Tobler’s First Law and Spatial Analysis. Annals of the Association of
American Geographers, 94(2):284-289.
MITCHELL, G. 1996. Problems and fundamentals of Sustainable Development
Indicators. Sustainable Development, 4(1):1-11.
MONTELLO, D.R. 2005. Cognition of Geographic Information. (In McMaster, R.B. &
Usery, E.L. eds. A research agenda for geographic information science. Boca Raton, FL:
CRC Press, p.61-91.)
MONTELLO, D.R. 2009. Cognitive Research in GIScience: Recent achievements and
future prospects. Geography Compass, 3(5):1824-1840.
MOORE, D.R. 2002. GIS in a knowledge domain: Bringing GIS to operational integration
in Spatial Planning – A Wicked Problem. (In 8th EC-GI & GIS Workshop ESDI – A Work
in Progress. Dublin, Ireland, July 3-5.)
MORÇÖL, G. 2001. What Is Complexity Science? Emergence, 3(1):104-120.
MOSS, R.M. & MALONE, E.L. 2010. The Vulnerability-Resilience Indicators Model.
Pacific Northwest National Laboratory and Joint Global Change Research Institute (level
1). p.2008-2010.
252

MURPHY, R. 2012. Managing risk under uncertainty. (In Measham, T.G. & Lockie, S.
eds. Risk and social theory in environmental management. Collingwood: Csiro Publishing,
p.15-26.)
NATIONAL RESEARCH COUNCIL (NRC). 1999. Our common journey. A transition
toward sustainability. Washington, D.C: The National Academies Press.
NATIONAL RESEARCH COUNCIL (NRC). 2006. Learning to Think Spatially: GIS as a
Support System in the K-12 Curriculum. Washington, D.C: The National Academies
Press.
NATIONAL RESEARCH COUNCIL (NRC). 2007. Successful Response Starts with a
Map: Improving Geospatial Support for Disaster Management. Washington, D.C: The
National Academies Press.
NANTO, D.K., COOPER, W.H. DONNELLY, J.M. & JOHNSON, R. 2011. Japan’s 2011
Earthquake and Tsunami: Economic Effects and Implications for the United States.
(Report prepared for Members and Committees of Congress by the Congressional
Research Service).
NAUDÉ, A., BADENHORST, W., ZIETSMAN, L., VAN HUYSSTEEN, E., & MARITZ, J.
2007. Geospatial Analysis Platform Version 2: Technical overview of the mesoframe
methodology and South African Geospatial Analysis Platform. CSIR Report number:
CSIR/BE/PSS/IR/2007/0104/B.
NAUDE, A., VAN HUYSTEEN, E. & GOSS, H. 2008. Geospatial analysis platform and
tools: supporting planning and decision making across scales, borders, sectors and
disciplines. (Paper presented at the Planning Africa Conference 14-16 April 2008 Sandton
Convention Centre, Johannesburg, South Africa). (Unpublished).
NEAL, D.M. 1997. Reconsidering the phases of disaster. International Journal of Mass
Emergencies and Disasters, 15(2):239-265.
NEWELL, B., CRUMLEY, C.L., HASSAN, N., LAMBIN, E.F., PAHL-WOSTL, C.,
UNDERDAL, A. & WASSON, R. 2005. A conceptual template for integrative human–
environment research. Global Environmental Change, 15(4):299-307.
NHAMO, G. & INYANG, E. 2011. Framework and Tools for Environmental Management
in Africa. Dakar: Council for the Development of Social Science Research in Africa.
253
NIEMEIJER, D. & DE GROOT, R.S. 2008. A conceptual framework for selecting
environmental indicator sets. Ecological Indicators, 8(1):14-25.
NIJKAMP, P. & VREEKER, R. 2000. Sustainability assessment of development
scenarios: methodology and application to Thailand. Ecological Economics, 33(1):7-27.
NORSE, E.A. & AMOS, J. 2010. Impacts, perception, and policy implications of the
deepwater horizon oil and gas disaster. International Law Reporter, 40(II):58-73.
ORGANISATION FOR ECONOMIC CO-OPERATION AND DEVELOPMENT (OECD).
1993. OECD core set of indicators for environmental performance reviews. Paris.
(Environment Monographs No 83).
ORGANISATION FOR ECONOMIC CO-OPERATION AND DEVELOPMENT (OECD).
2003. OECD Environmental indicators. Development, measurement and use. Paris.
(Reference paper).
OLIVER-SMITH, A. 1994. Peru’s Five Hundred Year Earthquake: Vulnerability in
Historical Context. (In Rodriguez, Havidan, Quarantelli, Enrico L., Dynes, eds. Disasters,
development and environment. New York: Springer, p.31-48.)
OLIVER-SMITH, A. 2004. Theorizing vulnerability in a globalized world: A political
ecological perspective. (In Bankoff, G., Frerks, G. & Hilhorst, D. eds. Mapping
Vulnerability: Disasters, Development and People. London: Earthscan, p.10-24).
OLIVER-SMITH, A. 2013. A matter of choice. International Journal of Disaster Risk
Reduction, 3:1-3.
OPDAM, P., FOPPEN, R. & VOS, C. 2002. Bridging the gap between ecology and
spatial planning in landscape ecology. Landscape Ecology, 16:767-779.
OPENSHAW, S. 1996. Developing GIS-relevant zone-based spatial analysis methods.
(In Longley P. & Batty, M. eds. Spatial Analysis: Modelling in a GIS Environment. Wiley:
New York; 55–73.
OPENSHAW, S. 1977. A geographical solution to scale and aggregation problems in
region-building, partitioning and spatial modelling. Transactions of the institute of British
Geographers, 2(4):459-472.
254
ORANJE, M. 2010. Post-apartheid national spatial development planning in South Africa
– A brief history. European Spatial Research and Policy, 17(2):55-70.
PALMIUS, J. 2005. Defining the “Information” Part of “Information System”. (In IRIS 28:
Proceedings of the 28th Information Systems Research Seminar in Scandinavia. IRIS 28,
Kristiansand, Norway, August 6-9, 2005.)
PARNELL, S. 1993. Creating racial privilege: The origins of South African public health
and town planning legislation. Journal of Southern African Studies, 19(3):471-488.
PERRINGS, C. 2006. Resilience and sustainable development. Environment and
Development Economics, 11(4):417.
PEUQUET, D.J. 1984. A conceptual framework and comparison of spatial data models.
Cartographica, 21(4):66-113.
PICOU, J.S. & MARTIN, C.G. 2007. Long-term community impacts of the Exxon Valdez
Oil Spill: Patterns of social disruption and psychological stress seventeen years after the
disaster, 1(251):1-49.
PIETERSE, J.N. 1996. The development of development theory: towards critical
globalism. Review of International Political Economy, 3(4):541-564.
PIETERSE, J.N. 2010. Development Theory. 2nd ed. London: SAGE Publications.
PORTER, A.L. & FITTIPALDI, J.J. eds. 1998. Environmental Methods Review: Retooling
Impact Assessment for the New Century, Fargo, Dakota.
POTTER, R.B. 2014. The nature of development studies. (In Desai, V. & Potter, R.B.,
eds. The Companion to Development Studies. New York: Routledge, p.48-54).
POTTER, R.B., BINNS, T., ELLIOTT, J.A. & SMITH, D. 2008. Geographies of
development: an introduction to development studies. Harlow: Pearson Prentice Hall.
PRINCE, S.H. 1920. Catastrophe and social change. Columbia University. (Thesis -
PhD)
QUARANTELLI, E.L. & DYNES, R.R. 1977. Response to Social Crisis and Disaster.
Annual Review of Sociology, 3(1):23-49.
255
QUARANTELLI, E.L. 1987. What should we study? Questions and suggestions for
researchers about the concept of disasters. International Journal of Mass Emergencies
and Disasters, 5(1):7-32.
QUARANTELLI, E.L. 1988. Disaster studies: An analysis of the social historical factors
affecting the development of research in the area. International Journal of Mass
Emergencies and Disasters, 5(3):18-32.
QUARANTELLI, E.L. 2000. Disaster planning, emergency management and civil
protection: The historical development of organized efforts to plan for and to respond to
disasters. (University of Delaware Disaster Research Center. Preliminary paper no 30).
QUARANTELLI, E.L. 2009. The earliest interest in disasters and crises, and the early
social science studies of disasters, as seen in a sociology of knowledge perspective.
(University of Delaware Disaster Research Center. Working paper no. 91).
QUESTE, A. & LAUWE, P. 2006. User needs: Why we need indicators. (In Birkmann, J.
ed. Measuring vulnerability to natural hazards: Towards disaster resilient societies. New
York: United Nations University Press, p.103-114).
REITSMA, F.M. 2004. A new geographic process data model. College Park: University
of Maryland. (Dissertation - PhD.)
REITSMA, F.M. 2013. Revisiting the “Is GIScience a science?” debate ( or quite possibly
scientific gerrymandering). International Journal of Geographical Information Science,
27(2):211-221.
RENAUD, F.G. 2006. Environmental components of vulnerability. (In Birkman, J. ed.
Measuring vulnerability to natural hazards. New Delhi: TERI Press. p.119-129).
ROBBINS, L. 1968. The theory of economic development in the history of economic
thought. London: Macmillan and Co.
ROCCO, T.S. & PLAKHOTNIK, M.S. 2009. Literature reviews, conceptual frameworks,
and theoretical frameworks: Terms, functions, and distinctions. Human Resource
Development Review, 8(1):120-130.
RODRIGUEZ, H., QUARANTELLI, E.L. & DYNES, R. (Eds.) 2006. Handbook of Disaster
Research. New York: Springer.
256
SACHS, 1992. Introduction. (In Sachs, W., ed. The Development Dictionary a guide to
knowledge as power. London: Zed Books. p. xv-xx).
SCHMITZ, P. 2008. Using supply chain management to enable GIS units to improve
their response to their customers’ needs. (Proceedings of the academic track of the 2008
Free and Open Source Software for Geospatial Conference, incorporating the GISSA
2008 Conference 29 September - 3 October 2008, Cape Town, South Africa. p.100-107).
SIDAWAY, J.D. 2007. Spaces of post development. Progress in Human Geography,
31(3):345-361.
SIDAWAY, J.D. 2012. Geographies of Development: New Maps, New Visions? The
Professional Geographer, 64(1):49-62.
SIDAWAY, J.D. 2014. Post-development. (In Desai, V. & Potter, R.B., eds. The
Companion to Development Studies. 3rd ed. New York: Routledge p.147-152.)
SIMON, H.A. 1972. Theories of bounded rationality. (In McGuire, C.B. & Radner, R. eds.
Decision and organisation. North-Holland Publishing Company.)
SINGH, Y.K. 2006. Environmental Science, New Delhi: New Age International.
SMEETS, E. & WETERINGS, R. 1999. Environmental indicators: Typology and
overview. Technical report No 25, Copenhagen.
SMITH, B. 1994. Fiat Objects. Computer and Information Science, 20(1784):1-31.
SMITH, B. 1996. Fiat and Bona Fide Boundaries: Towards an ontology of spatially
extended objects. (November 1989).
SMITH, B. & MARK, D.M. 2003. Do mountains exist? Towards an ontology of landforms.
Environment and Planning B: Planning and Design, 30(3):411-427.
SMITH, B. & VARZI, A.C. 1997. Fiat and Bona Fide Boundaries: Towards on ontology of
spatially extended objects. (In Hirtle, S.C. & Frank, A.U. eds. Spatial Information Theory:
A Theoretical Basis for GIS. Lecture Notes in Computer Science. Springer, pp. 103-119.)
SMITH, K. 2013. Hazard in the environment. (In Environmental Hazards: Assessing Risk
and Reducing Disaster. New York: Routledge.)
257
SMITH, S., RICHARDSON, J. & MCNAB, A. 2010. Towards a more efficient and
effective use of Strategic Environmental Assessment and Sustainability Appraisal in
spatial planning. London
SMITH, T.R. & JIANG, Y. 1991. Knowledge-based approaches in GIS. (In Maguire, D.J.,
Goodchild, M.F. & Rhind, D.W. eds. Geographical Information Systems: overview,
principles and applications. London: Longman.)
SOHN, L.B. 1973. The Stockholm declaration. The Harvard International Law Journal,
14(3):422-515.
SOUTH AFRICA (REPUBLIC). 1998. National Environmental Management Act 107 of
1998. Pretoria: Government Printer.
SOUTH AFRICA (REPUBLIC). 2000. Municipal Systems Act 32 of 2000. Pretoria:
Government Printer.
SOUTH AFRICA (REPUBLIC). 2003. Disaster Management Act No 57 of 2002.
Pretoria: Government Printer.
SOUTH AFRICA (REPUBLIC). 2010. National Environmental Management Act 107 of
1998. Environmental Impact Assessment Regulations 543 of 2010. Pretoria: Government
Printer.
SOUTH AFRICA. National Planning Commission. 2011. National Development Plan.
Vision for 2013. Pretoria: Government Printer.
SOUTH AFRICA (REPUBLIC). 2012. National Environmental Management Act 107 of
1998. Environmental Management Framework Regulations 547 of 2012. Pretoria:
Government Printer.
SOUTH AFRICA (REPUBLIC). 2013. Spatial Planning and Land Use Management Act
16 of 2013. Pretoria: Government Printer.
SPANGENBERG, J.H. 2002. Environmental space and the prism of sustainability:
frameworks for indicators measuring sustainable development. Ecological Indicators,
2(3):295-309.
258
STEVENS, C. 2005. Measuring Sustainable Development. OECD Statistics Brief No.10.
Paris.
STIFTEL, B. 2000. Planning Theory. (In Pelaseyed, R. ed. The National AICP
Examination Preparation Course Guidebook. Chicago: APA Press, pp.4-16.)
STONE, D. 2004. The Neoclassical Growth Model and Global Poverty. About Education.
STRANGE, T. & BAYLEY, A. 2008. Sustainable development, linking economy, society,
environment. (Organisation for Economic Co-Operation and Development (OECD)
Insights).
SUMNER, A. & TRIBE, M.A. 2008. International Development Studies. Theories and
Methods in Research and Practice. London: SAGE Publications.
TATE, E. 2012. Social vulnerability indices: a comparative assessment using uncertainty
and sensitivity analysis. Natural Hazards, 63(2):325-347.
TAYLOR, N. 1999. Anglo-American town planning theory since 1945: three significant
developments but no paradigm shifts. Planning Perspectives, 14(4):327-345.
TAYLOR, N. 1998. Urban Planning Theory since 1945. Urban Planning Theory.
Athenaeum Studi Periodici Di Letteratura E Storia Dell Antichita.
THEOBALD, D.M. 2001. Topology revisited: representing spatial relations. International
Journal of Geographical Information Science, 15(8):689-705.
THOMAS, D.S.K., CUTTER, S.L., HODGSON, M., GUTEKUNST, M. & JONES, S. 2003.
Use of spatial data and geographic technologies in response to the September 11th
terrorist attack on the World Trade Center. (Natural hazards research and applications
information center. University of Colorado. Quick response report no. 153)
THOMAS, D.S.K., ERTUGAY, K. AND KEMEC, S. 2006. Geographic Information
Systems/Remote Sensing. (In Rodriguez, H., Quarantelli, E.L., Dynes , R.R., eds.
Handbook of Disaster Research. New York: Springer. p.83-96)
THORNILL, M. 2014. In-depth interview. 19 August 2014.
259
TIMMERMAN, P. 1981. Vulnerability, resilience and the collapse of society: A review of
models and possible climatic applications. Environmental Monograph No. 1. Toronto:
Institute for Environmental Studies, University of Toronto.
TOMLINSON, R. 2014. Who coined the phrase Geographic Information System? Film
about the beginnings of the Canadian GIS. 5, pp.1-5.
TOMLINSON, R.F. 1962. Computer Mapping: An introduction to the use of electronic
computers in the storage, compilation and assessment of natural and economic data for
the evaluation of marginal lands. (Report presented to the National Land Capability
Inventory Seminar held under the direction of the Agricultural Rehabilitation and
Development Administration of the Canada Department of Agriculture)
TOMLINSON, R.F. 1963. Feasibility report of computer mapping system. (Report
presented to the Agricultural Rehabilitation and Development Administration Department
of Agriculture, Government of Canada).
TOMLINSON, R.F. 1967. An introduction to the Geo-Information System of the Canada
Land Inventory. (Report presented to the Department of Forestry and Rural Development,
Government of Canada).
TOTTE, M. & HENQUIEN, B. 1993. Methods to characterise land facets using remote
sensing. EARSeL Advances in Remote Sensing, 2(3):64-76.
TRANNUM, H.C. & BAKKE, T. 2012. Environmental effects of the Deepwater Horizon oil
spill – focus on effects on fish and effects of dispersants. (Report prepared for the
Norwegian Oil Industry Association).
TREADGOLD, G. 2006. Disaster Impact Assessment Research. Report on Disaster
Impact Assessment for the Ministry of Civil Defence.
TURNER, M.G. 1989. Landscape Ecology: The effect pattern on process. Annual
Review of Ecology and Systematics, 20(1):171-197.
TURNER, B.L. 1997. The sustainability principle in global agendas: implications for
understanding. The Geographical Journal, 163(2):133-140.
TURNER, B.L., MATSON, P.A., MCCARTHY, J.J., CORELL, R.W., CHRISTENSEN, L.,
NOELLE, E. HOVELSRUD-BRODA, G.K., KASPERSON, J.X., KASPERSON, R.E.,
260
LUERS, A., MARTELLO, M.L., MATHIESEN, S., NAYLOR, R., POLSKY, C.,
PULSIPHER, A., SCHILLER, A. SELIN, H. AND TYLER, N. 2003a. Illustrating the
coupled human–environment system for vulnerability analysis: Three case studies.
Proceedings of the National Academy of Sciences, 100(14):8080-8085.
TURNER, B.L., KASPERSON, R.E., MATSONE, P.A., MCCARTHY, J.J., CORELL, R.W.,
CHRISTENSENE, L., ECKLEYG, N., KASPERSON, J.X., LUERSE, A., MARTELLOG, M.
L., POLSKYA, C., PULSIPHERA, A. & SCHILLER, A. 2003b. A framework for
vulnerability analysis in sustainability science. Procedings of the Natonal Academy of
Sciences of the United States of America (PNAS), 100(14), p.8074–8079.
TURNHOUT, E., HISSCHEMÖLLER, M. & EIJSACKERS, H. 2007. Between the two fires
of science and policy. Ecological Indicators, 7(2):215-228.
TWIGG, J. 2007. Characteristics of a disaster-resilient community. (Guidance note
presented to the DFID Disaster Risk Reduction Interagency Coordination Group, August)
UNITED NATIONS (UN). 2014. The Millennium Development Goals Report 2014. New
York: UN
UNITED NATIONS CONFERENCE ON ENVIRONMENT AND DEVELOPMENT
(UNCED). 1992. Agenda 21: Programme of Action for Sustainable Development. New
York: United Nations.
UNITED NATIONS DEPARTMENT OF ECONOMIC AND SOCIAL AFFAIRS (UN-DESA)
2007. Indicators of Sustainable Development: Guidelines and Methodologies. 3rd ed.
New York: United Nations.
UNITED NATIONS INTERNATIONAL STRATEGY FOR DISASTER RISK REDUCTION
(UN-ISDR). 2003. Living with Risk: A Global Review of Disaster Reduction Initiatives
Geneva: UN-ISDR
UNITED NATIONS INTERNATIONAL STRATEGY FOR DISASTER RISK REDUCTION
(UN-ISDR). 2004. Living with Risk. Turning the tide on disasters towards sustainable
development. Final Version. Geneva: UN-ISDR.
UNITED NATIONS INTERNATIONAL STRATEGY FOR DISASTER RISK REDUCTION
(UN-ISDR). 2005. Hyogo Framework for Action 2005-2015: Building the Resilience of
Nations and Communities to Disasters. Geneva: UN-ISDR
261
UNITED NATIONS INTERNATIONAL STRATEGY FOR DISASTER RISK REDUCTION
(UN-ISDR). 2009. Terminology on Disaster Risk Reduction. Geneva: UN-ISDR
UNITED STATES NATIONAL RESEARCH COUNCIL (NRC). 1999. Our common
journey: A transition toward sustainability. Washington, DC: National Academy Press. UN,
2000.
UNITED STATES NATIONAL RESEARCH COUNCIL (NRC). 2006. Facing Hazards and
Disasters: Understanding Human Dimensions, Washington, D.C.: The National
Academies Press.
UNITED STATES NATIONAL RESEARCH COUNCIL (NRC). 2007. Successful
response starts with a map: Improving geospatial support for disaster management.
Washington DC: The National Academies Press.
UNWIN, D.J. 1991. The academic section of GIS. (In Maguire, D.J., Goodchild, M.F. and
Rhind, D.W. eds. Geographical Information Systems: overview, principles and
applications. London: Longman, p.81-90).
VAN DEURSEN, W., WESSELING, C. & KARSSENBERG, D. 2000. How do we gain
control over GIS technology? The strength and burden of powerful GIS-tools. (In 4th
International Conference on Integrating GIS and Environmental Modeling (GIS/EM4):
Problems, Prospects and Research Needs. Banff, Alberta, Canada, September 2-8,
2000.)
VAN NIEKERK, D. 2005. A comprehensive framework for multi-sphere disaster risk
reduction in South Africa. Potchefstroom: Northwest University. (Thesis – PhD)
VAN NIEKERK, D. 2006. Disaster risk management in South Africa: The function and
the activity – towards an integrated approach. Politeia, 25(2):96-116.
VAN NIEKERK, D. 2010. A framework for multi-sphere disaster risk reduction.
Saarbruecken: Lap Lambert Academic Publishing.
VAN NIEKERK, D. 2012. Transdisciplinarity: the binding paradigm for disaster risk
reduction. (Scientific contributions series H: Inaugural address: Nr. 254)
VAN VUUREN, D. 2006. Towards a methodology for the use of geo-information
technology in disaster assessment. Jàmbá: Journal of Disaster Risk Studies, 1(1):34-44.
262
VAN DER WALDT, G. 2013. Disaster Risk Management: Disciplinary status and
prospects for a unifying theory. Jàmbá: Journal of Disaster Risk Studies, 5(2):1-11.
VAN WYK, J. & BOSHOFF, B. 2003. The Disaster Management Act 57 of 2002: Part
panacea or ready recipe for disaster? SA Public Law, 18(2):464-474.
VOGEL, C., MOSER, S.C., KASPERSON, R.E. & DABELKO, G.D. 2007. Linking
vulnerability, adaptation, and resilience science to practice: Pathways, players, and
partnerships. Global Environmental Change, 17(3-4):349-364.
VON HUMBOLDT, A. 1807. Ideen zu einer Geographie der Pflanzen. Paris: Tubingen.
WEICHSELGARTNER, J. 2001. Disaster mitigation: the concept of vulnerability
revisited. Disaster Prevention and Management, 10(2):85-95.
WEICHSELGARTNER, J. & KELMAN, I. 2015. Geographies of resilience: Challenges
and opportunities of a descriptive concept. Progress in Human Geography, 39(3):249-
267.
WEICHSELGARTNER, J. & OBERSTEINER, M. 2002. Knowing sufficient and applying
more: challenges in hazards management. Global Environmental Change Part B:
Environmental Hazards, 4(2-3):73-77.
WEIHRICH, H. 1993. Management science theory and practice. (In Weihrich, H. &
Kroontz, H. eds. Management: A global perspective, 10th ed. New York: McGraw-Hill.)
WENBAN-SMITH, A. 2010. A better future for development plans: Making “plan, monitor
and manage” work. Planning, Theory & Practice, 3(1):33-51.
WHITE, G.F. 1945. Human adjustment to floods: A geographical approach to the flood
problem in the United States. University of Chicago.
WHITE, G.F., KATES, R.W. & BURTON, I. 2001. Knowing better and losing even more:
the use of knowledge in hazards management. Environmental Hazards, 3(3-4):81-92.
WILHELMI, O.V. & HAYDEN, M.H. 2010. Connecting people and place: a new
framework for reducing urban vulnerability to extreme heat. Environmental Research
Letters, 5(1):014021.
263
WILKINSON, C. 2011. Social-ecological resilience: Insights and issues for planning
theory. Planning Theory, 11(2):148-169.
WILLIAMS, L., ROBERTS, R. & MCINTOSH, A. 2007. Introduction: Human Ecology: A
pedagogy of hope? (In Williams, L., Roberts, R. & Mcintosh, A. Radical Human Ecology:
Intercultural and Indigenous Approaches. Farnam: Ashgate Publishing Limited. p. 1-14).
WILLIAMS, L., ROBERTS, R. & McINTOSH, A. 2012. Radical Human Ecology:
Intercultural and Indigenous Approaches. (In Williams, L., Roberts, R. & McIntosh, eds.
Radical human ecology. Intercultural and Indigenous approaches. Farnam: Ashgate
Publishing Ltd, p. 1-14).
WILSON, J. & OYOLA-YEMAIEL, A. 2001. The evolution of emergency management
and the advancement towards a profession in the United States and Florida. Safety
Science, 39(1-2):117-131.
WILSON, J.P. & FOTHERINGHAM, A.S. eds. 2008. The Handbook of Geographic
Information Science. Victoria: Blackwell Publishing.
WISNER, B., BLAIKIE, P., CANNON, T. & DAVIS, I. 2004. At Risk. Natural hazards,
people’s vulnerability and disasters. 2nd ed. New York: Routledge.
WOOLCOCK, M. & NARAYAN, D. 2000. Social Capital: Implications for Development
Theory, Research, and Policy. The World Bank Research Observer, 15(2):225-249.
WORBOYS, M.F. & DUCKHAM, W. 2004. GIS – a computing perspective. 2nd ed. Boca
Raton: CRC Press.
WORBOYS, M. & HORNSBY, K. 2004. From objects to events: GEM, the geospatial
event model. (In Egenhofer, M., Freksa, C. & Miller, H. eds. Third International
Conference on GIScience. Berlin: SpringerVerlag, p.327-344.)
WORLD BANK. 1999. Environmental Management Plans. Washington, D.C: World Bank
WORLD COMMISSION ON ENVIRONMENT AND DEVELOPMENT (WCED). 1987. Our
Common Future.
264
WRIGHT, D.J., GOODCHILD, M.F. & PROCTOR, J.D. 1997. Demystifying the persistent
ambiguity of GIS as “tool” versus “science.” Annals of the Association of American
Geographers, 87(2):346-362.
YEHUDA et al. 1978. Toward a metric of science: The Advent of Science Indicators.
New York: John Wiley.
YIFTACHEL, O. 2001. Introduction: outlining the power of planning. (In Yiftachel, O.,
Alexander, I., Hedgcock, D. & Little, J. eds. Kluwer Academic, p.1-19.)
YUAN, M., MARK, D.M., EGENHOFER, M. & PEUQUET, D. 2005. Extensions to
geographic representations. (In A research agenda for geographic information science.
p.129-156.)
YUAN, M., NARA, A. & BOTHWELL, J. 2014. Space–time representation and analytics.
Annals of GIS, 20(1):1-9.
ZAKOUR, M.J. & GILLESPIE, D.F. 2013. Community Disaster Vulnerability, New York,
NY: Springer New York.
ZHANG, T. 2006. Planning theory as an institutional innovation: Diverse approaches and
nonlinear trajectory of the evolution of planning theory. City Planning Review, 30(8):9-18.
265
DECLARATION
I declare that: “Vulnerability as a multi-faceted phenomenon: A GIS-based data
model for integrated development planning, environmental management and disaster risk reduction” is my own work, that all sources used or quoted have been
indicated and acknowledged by means of complete references, and that this thesis was
not previously submitted by me or any other person for degree purposes at this or any
another university.
27 November 2014
Signature Date
DECLARATION
I herewith declare that I,
Isabel M. Claassen (APSTrans (SATI)),
full-time freelance translator, editor and language consultant
of
1367 Lawson Avenue, Waverley, Pretoria (tel. 012 332 2040; cell 082 701 7922)
and accredited member (No. 1000583) of the South African Translators’ Institute
(SATI)
completed the language editing* of the article entitled
Vulnerability as a multi-faceted phenomenon: A GIS-based data model for integrated development planning, environmental management and
disaster risk reduction
which had been submitted to me by
ID Jansen van Vuuren 22548580 E-mail: [email protected]
Doctor Philosophiae in Development and Management (Disaster Studies)
Potchefstroom Campus – North-West University
Editing completed on 25 November 2014 *Please note that no responsibility can be taken for the veracity of statements or arguments in the document concerned or for changes made subsequent to the completion of language editing. Also remember that content editing is not part of a language editor’s task and is in fact unethical. Advanced technical editing is not included either.
11/25/2014 Turnitin Originality Report
Turnitin Originality Report 12620394:Dawie_-_Thesis_-_Final_draft_for_submission_-_Chapter_1-9.docx by DEWALD VAN NIEKERK From Dawie PhD (994ab368-2573-4ddc-8a34-fc4be89b4506)
Processed on 25-Nov-2014 10:36 SAST ID: 482421627 Word Count: 69347
Similarity Index 19% Similarity by Source Internet Sources:
15% Publications:
11% Student Papers:
7%
sources: 1 1% match (Internet from 17-May-2010) http://www.londonexternal.ac.uk/current_students/programme_resources/lse/lse_pdf/further_units/geog_devel/109_ch_02.pdf
2 < 1% match (publications)
J. P. Messina. "Complex systems models and the management of error and uncertainty", Journal of Land Use Science, 2008
3 < 1% match (Internet from 18-Apr-2009)
http://www.unisdr.org/eng/mdgs-drr/dfid.htm
4 < 1% match (Internet from 22-Apr-2010) http://www.francoarchibugi.it/pdf/2004%20- EPS%20%20Planning%20theory%20and%20requiem(A.04.02).pdf
5 < 1% match (Internet from 28-Oct-2010)
http://www.geog.ucsb.edu/~good/papers/433.pdf
6 < 1% match (Internet from 07-May-2010) http://www.dpi.inpe.br/gilberto/papers/sage_handbook.pdf
7 < 1% match (publications) Andreas Faludi. "The Performance of Spatial Planning", Planning Practice and Research, 11/1/2000
8 < 1% match (Internet from 14-Mar-2010)
http://people.plan.aau.dk/~05um0702/Tuzzi/Litterature/Urban%20theory/Anglo- American%20town%20planning%20theory%20since%201945%3b.pdf
9 < 1% match (Internet from 27-Feb-2014)
http://www.jamba.org.za/index.php/jamba/article/viewFile/72/128
10 < 1% match (Internet from 21-Nov-2013) http://clamsitel.pbworks.com/w/file/fetch/49252349/Couclelis%201992%20Objects%20Fields
11 < 1% match (Internet from 03-Jul-2009)
http://www.ncgia.ucsb.edu/Publications/tech-reports/90/90-11.PDF
12 < 1% match (Internet from 05-May-2010) http://webra.cas.sc.edu/hvri/docs/gtown.pdf
13 < 1% match (Internet from 30-Apr-2014)

http://www.intechopen.com/books/approaches-to-disaster-management-examining-the- implications-of-hazards-emergencies-and-disasters/conceptual-frameworks-of-vulnerability-
assessments-for-natural-disasters-reduction
14 < 1% match (publications) Dawn Wright. "Demystifying the Persistent Ambiguity of GIS as 'Tool' versus 'Science'", Annals of the Association of American Geographers, 06/1997

file:///C:/Users/Dawie/Downloads/Turnitin_Originality_Report_482421627.html