
Vulnerabilities and Performance Analysis over … · Vulnerabilities and Performance Analysis over...
6
Vulnerabilities and Performance Analysis over Fingerprint Biometric Authentication Network Edward Guillen, Lina Alfonso, Karina Martinez and Marcela Mejia Abstract—Fingerprint recognition system with optical sensors is one of the most efficient methods to identify people. This paper propose a method to evaluate vulnerabilities and per- formance in an identification fingerprint network with optical sensors, in order to establish the convenience of implementing this authentication technique, according to engineering param- eters, such as security parameters, recognition time, database size and network architecture. Index Terms—Authentication, Biometrics, Fingerprint Recog- nition, Performance Analysis, Vulnerability. I. I NTRODUCTION B IOMETRIC authentication systems such as fingerprint, facial recognition, iris, gait, among others are increas- ingly used for people recognition, security procedures and access control by different corporations. Some specific physical patterns or person’s physical char- acteristics are identified by biometrics systems [1]. Fin- gerprint authentication systems are widely used thanks to characteristics such as simplicity on implementation, ac- ceptable security level and high performance in fingerprint authentication [2] [3]. However, there are different kinds of sensors for fingerprint scanners including optical, capacitive and thermal sensors. [4] The choice of hardware varies according to the corpo- ration needs because the fingerprint scanner could be high security and/or high performance and enterprise implements fingerprint reader according to their own convenience. The optical sensors were evaluated in this investigation based on the high marketing of optical devices [5]. Vulnerability tests were done in the physical and electronic system. The data network performance were measured. The aim of the investigation gives specific information and not only technical about how optical sensor works, the optical sensor performance in network must be analyzed to find the system delay for multiple fingerprint authentication actions. The potential final user will be able to know if the security and performance offered fit the system or if final users have to look for other sensors or biometric systems in order to fulfill user requirements. This work was supported in part by the Military University Nueva Granada ING 831 E.Guillen is with Telecommunications Engineering Department, Military University Nueva Granada (e-mail: [email protected]), Bo- gota, Colombia. L.Alfonso is with Telecommunications Engineering Department, Military University Nueva Granada (e-mail: [email protected]), Bogota, Colombia. K.Martinez is with Telecommunications Engineering Depart- ment, Military University Nueva Granada (e-mail: securityin- [email protected]), Bogota, Colombia. M.Mejia is with Telecommunications Engineering Department, Military University Nueva Granada (e-mail: [email protected]), Bo- gota, Colombia. The second part of this paper will lay emphasis on how the fingerprint biometric systems and the optical sensor work. In the third part, the vulnerabilities and performance will be identified and with this information a conclusion will be made about how this system works and the future research to do will be proposed. A. Previous Research In 2000, Putte and Keuning [6] evaluated many finger- print sensors vulnerabilities with false fingerprints created a wafer-thin silicon dummy. Their work describe two different methods to create false fingerprints: the first method is with the cooperation of fingerprint owner and the second one is without the cooperation of the user. In the case the fingerprint owner cooperate to elaborate the fake fingerprint, the quality of the imitations is increased and the system is more likely to be deceived. Six sensors were evaluated and five of them such as optical and solid state sensor accepted the false fingerprint as valid. [6] Moreover, in 2010, B. Ashwini et al from India carried out a comparison among 9 types of sensors; the researchers analyzed and compared the sensors’ precision, tolerance, resolution, compatibility and limitations, in order to make known the specifications and properties of each of them for future engineering designs. [7] Likewise, in 2011, inside the ’Institute for Informatics and Automation Problems’, D. Kocharyan and H. Sarukhanyan proposed a high speed method for the recognition of fin- gerprints based on minutiae matching, the minutiae is an unique characteristics of each fingerprint. The high speed method takes into account region and line structures that exist between minutiae pairs, parameters that would allow them to get more structured information from the fingerprint. [8] The final method includes the following steps: 1)Binarization: the image is converted into a scale of grays and then into binary data; 2)Filter Block: the binarized image is diluted to reduce the thickness of the lines of the ridge to just one pixel; 3)Details Extraction: the details, bifurcations and ridges are defined through the algorithm of the crossed Number; 4)De- tails Coincidence: the characteristics previously obtained are compared with the database through a matrix and finally accepted or rejected. The authors finally develop a fingerprint recognition system based on the method proposed, a high speed method includes more details inside the image for more structured information and better minutiae precision.[8] In 2010, K. Martinez et al identified the vulnerabilities of the fingerprint system through physical and electronic supplanting. [9] Proceedings of the World Congress on Engineering and Computer Science 2012 Vol II WCECS 2012, October 24-26, 2012, San Francisco, USA ISBN: 978-988-19252-4-4 ISSN: 2078-0958 (Print); ISSN: 2078-0966 (Online) WCECS 2012
Transcript of Vulnerabilities and Performance Analysis over … · Vulnerabilities and Performance Analysis over...
Vulnerabilities and Performance Analysis overFingerprint Biometric Authentication Network
Edward Guillen, Lina Alfonso, Karina Martinez and Marcela Mejia
Abstract—Fingerprint recognition system with optical sensorsis one of the most efficient methods to identify people. Thispaper propose a method to evaluate vulnerabilities and per-formance in an identification fingerprint network with opticalsensors, in order to establish the convenience of implementingthis authentication technique, according to engineering param-eters, such as security parameters, recognition time, databasesize and network architecture.
Index Terms—Authentication, Biometrics, Fingerprint Recog-nition, Performance Analysis, Vulnerability.
I. INTRODUCTION
B IOMETRIC authentication systems such as fingerprint,facial recognition, iris, gait, among others are increas-
ingly used for people recognition, security procedures andaccess control by different corporations.
Some specific physical patterns or person’s physical char-acteristics are identified by biometrics systems [1]. Fin-gerprint authentication systems are widely used thanks tocharacteristics such as simplicity on implementation, ac-ceptable security level and high performance in fingerprintauthentication [2] [3]. However, there are different kinds ofsensors for fingerprint scanners including optical, capacitiveand thermal sensors. [4]
The choice of hardware varies according to the corpo-ration needs because the fingerprint scanner could be highsecurity and/or high performance and enterprise implementsfingerprint reader according to their own convenience. Theoptical sensors were evaluated in this investigation based onthe high marketing of optical devices [5]. Vulnerability testswere done in the physical and electronic system. The datanetwork performance were measured.
The aim of the investigation gives specific information andnot only technical about how optical sensor works, the opticalsensor performance in network must be analyzed to find thesystem delay for multiple fingerprint authentication actions.The potential final user will be able to know if the securityand performance offered fit the system or if final users haveto look for other sensors or biometric systems in order tofulfill user requirements.
This work was supported in part by the Military University NuevaGranada ING 831
E.Guillen is with Telecommunications Engineering Department, MilitaryUniversity Nueva Granada (e-mail: [email protected]), Bo-gota, Colombia.
L.Alfonso is with Telecommunications Engineering Department, MilitaryUniversity Nueva Granada (e-mail: [email protected]), Bogota,Colombia.
K.Martinez is with Telecommunications Engineering Depart-ment, Military University Nueva Granada (e-mail: [email protected]), Bogota, Colombia.
M.Mejia is with Telecommunications Engineering Department, MilitaryUniversity Nueva Granada (e-mail: [email protected]), Bo-gota, Colombia.
The second part of this paper will lay emphasis on how thefingerprint biometric systems and the optical sensor work.In the third part, the vulnerabilities and performance willbe identified and with this information a conclusion will bemade about how this system works and the future researchto do will be proposed.
A. Previous Research
In 2000, Putte and Keuning [6] evaluated many finger-print sensors vulnerabilities with false fingerprints created awafer-thin silicon dummy. Their work describe two differentmethods to create false fingerprints: the first method is withthe cooperation of fingerprint owner and the second one iswithout the cooperation of the user. In the case the fingerprintowner cooperate to elaborate the fake fingerprint, the qualityof the imitations is increased and the system is more likely tobe deceived. Six sensors were evaluated and five of them suchas optical and solid state sensor accepted the false fingerprintas valid. [6]
Moreover, in 2010, B. Ashwini et al from India carriedout a comparison among 9 types of sensors; the researchersanalyzed and compared the sensors’ precision, tolerance,resolution, compatibility and limitations, in order to makeknown the specifications and properties of each of them forfuture engineering designs. [7]
Likewise, in 2011, inside the ’Institute for Informatics andAutomation Problems’, D. Kocharyan and H. Sarukhanyanproposed a high speed method for the recognition of fin-gerprints based on minutiae matching, the minutiae is anunique characteristics of each fingerprint. The high speedmethod takes into account region and line structures that existbetween minutiae pairs, parameters that would allow them toget more structured information from the fingerprint. [8] Thefinal method includes the following steps: 1)Binarization:the image is converted into a scale of grays and then intobinary data; 2)Filter Block: the binarized image is diluted toreduce the thickness of the lines of the ridge to just one pixel;3)Details Extraction: the details, bifurcations and ridges aredefined through the algorithm of the crossed Number; 4)De-tails Coincidence: the characteristics previously obtained arecompared with the database through a matrix and finallyaccepted or rejected. The authors finally develop a fingerprintrecognition system based on the method proposed, a highspeed method includes more details inside the image formore structured information and better minutiae precision.[8]
In 2010, K. Martinez et al identified the vulnerabilitiesof the fingerprint system through physical and electronicsupplanting. [9]
Proceedings of the World Congress on Engineering and Computer Science 2012 Vol II WCECS 2012, October 24-26, 2012, San Francisco, USA
ISBN: 978-988-19252-4-4 ISSN: 2078-0958 (Print); ISSN: 2078-0966 (Online)
WCECS 2012
II. FINGERPRINT AND SENSOR AUTHENTICATIONSYSTEM
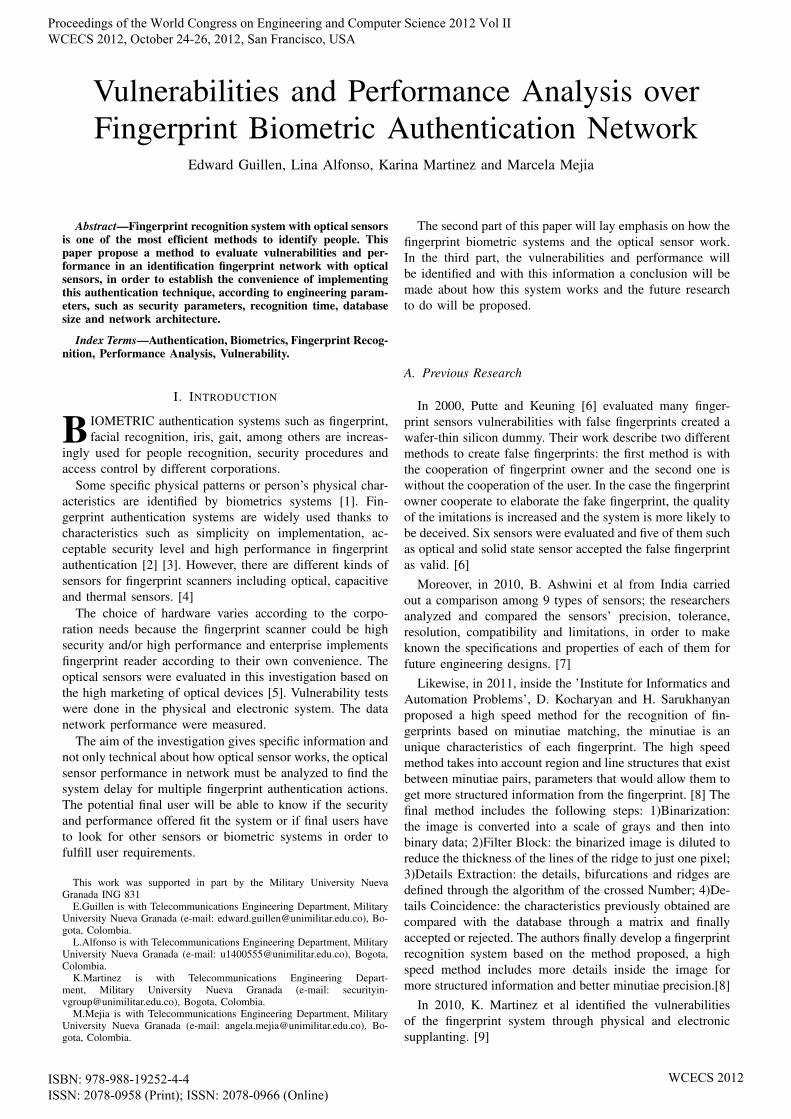
Fingerprint authentication systems have four basic partsas shown in Fig 1 [10]. After these processes, a verificationdecision is made with the results of similarity obtained fromthe matching step.
Fig. 1. Block of Fingerprint Authentication System [9] with an opticalscanner, feature extraction, matcher and database sever.
Live-scan images are acquired with optical sensor, somepoints or minutiae different for each individual are identifiedin the image; image is processed by the characteristicsextractor to create a model or template of the fingerprint.In the comparison process, template is used in order todetermine the user’s identity. Finally the biometric systemaccepts the user or a warning message indicate that the userwas not found in the database.
A. Fingerprint
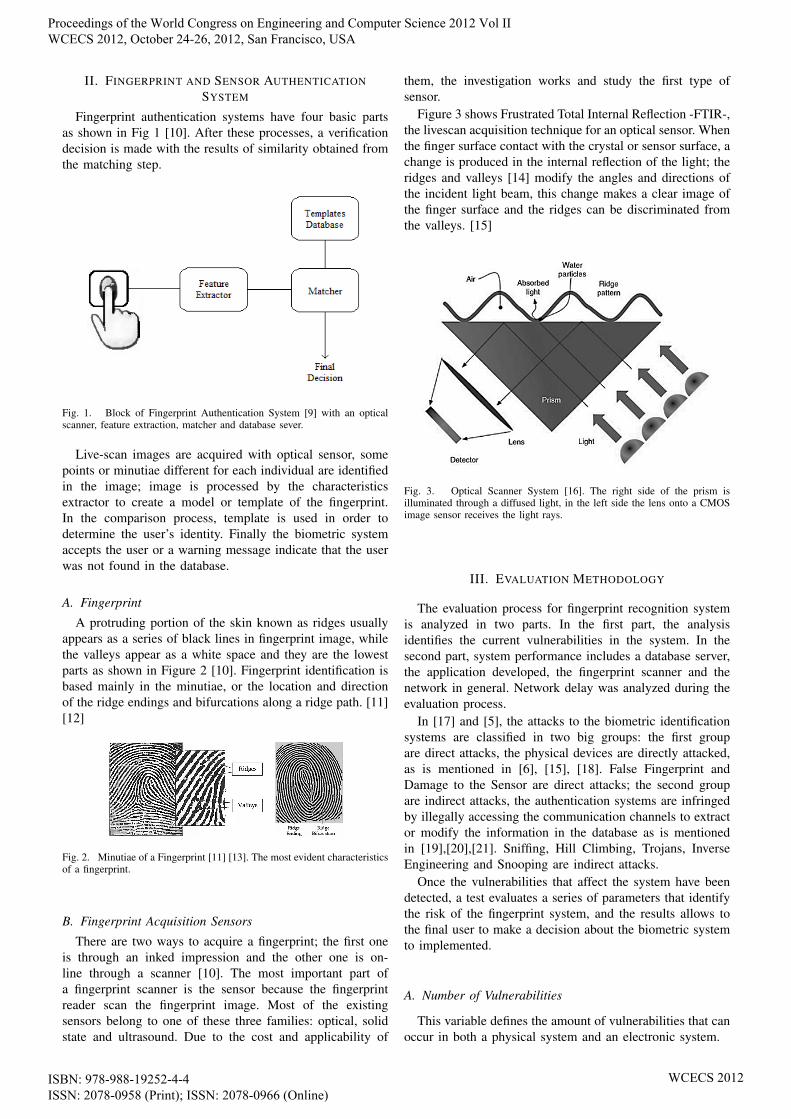
A protruding portion of the skin known as ridges usuallyappears as a series of black lines in fingerprint image, whilethe valleys appear as a white space and they are the lowestparts as shown in Figure 2 [10]. Fingerprint identification isbased mainly in the minutiae, or the location and directionof the ridge endings and bifurcations along a ridge path. [11][12]
Fig. 2. Minutiae of a Fingerprint [11] [13]. The most evident characteristicsof a fingerprint.
B. Fingerprint Acquisition Sensors
There are two ways to acquire a fingerprint; the first oneis through an inked impression and the other one is on-line through a scanner [10]. The most important part ofa fingerprint scanner is the sensor because the fingerprintreader scan the fingerprint image. Most of the existingsensors belong to one of these three families: optical, solidstate and ultrasound. Due to the cost and applicability of
them, the investigation works and study the first type ofsensor.
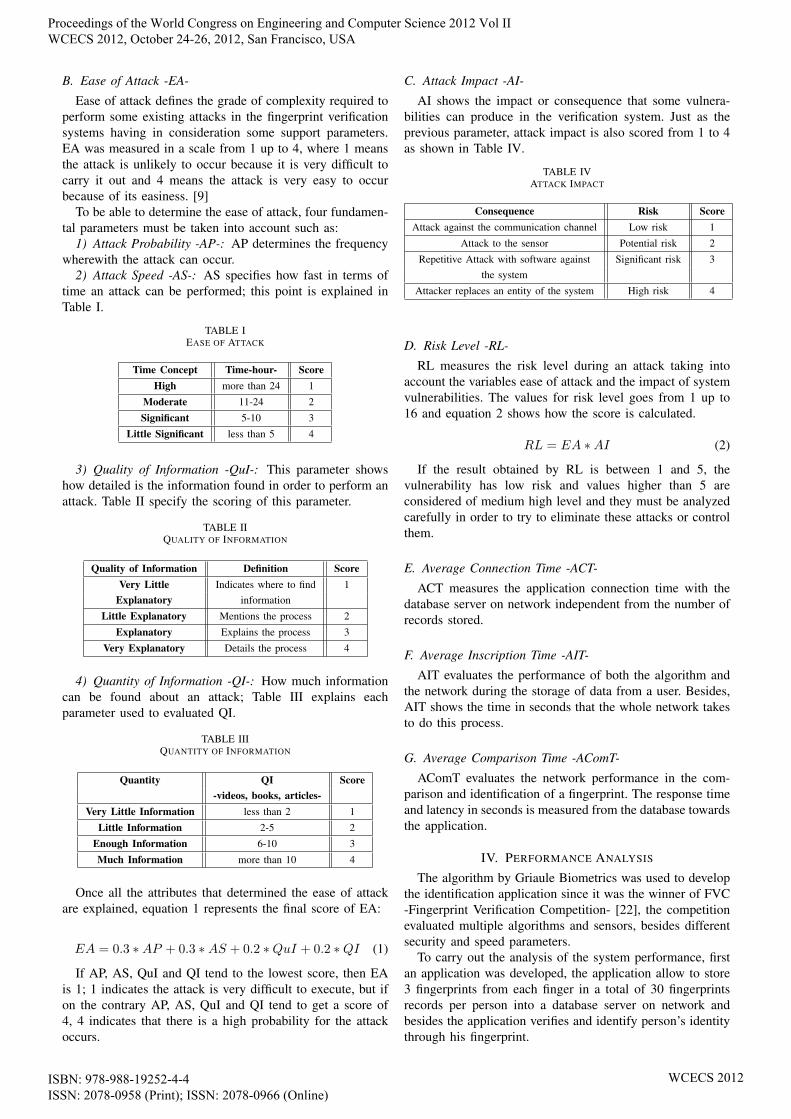
Figure 3 shows Frustrated Total Internal Reflection -FTIR-,the livescan acquisition technique for an optical sensor. Whenthe finger surface contact with the crystal or sensor surface, achange is produced in the internal reflection of the light; theridges and valleys [14] modify the angles and directions ofthe incident light beam, this change makes a clear image ofthe finger surface and the ridges can be discriminated fromthe valleys. [15]
Fig. 3. Optical Scanner System [16]. The right side of the prism isilluminated through a diffused light, in the left side the lens onto a CMOSimage sensor receives the light rays.
III. EVALUATION METHODOLOGY
The evaluation process for fingerprint recognition systemis analyzed in two parts. In the first part, the analysisidentifies the current vulnerabilities in the system. In thesecond part, system performance includes a database server,the application developed, the fingerprint scanner and thenetwork in general. Network delay was analyzed during theevaluation process.
In [17] and [5], the attacks to the biometric identificationsystems are classified in two big groups: the first groupare direct attacks, the physical devices are directly attacked,as is mentioned in [6], [15], [18]. False Fingerprint andDamage to the Sensor are direct attacks; the second groupare indirect attacks, the authentication systems are infringedby illegally accessing the communication channels to extractor modify the information in the database as is mentionedin [19],[20],[21]. Sniffing, Hill Climbing, Trojans, InverseEngineering and Snooping are indirect attacks.
Once the vulnerabilities that affect the system have beendetected, a test evaluates a series of parameters that identifythe risk of the fingerprint system, and the results allows tothe final user to make a decision about the biometric systemto implemented.
A. Number of Vulnerabilities
This variable defines the amount of vulnerabilities that canoccur in both a physical system and an electronic system.
Proceedings of the World Congress on Engineering and Computer Science 2012 Vol II WCECS 2012, October 24-26, 2012, San Francisco, USA
ISBN: 978-988-19252-4-4 ISSN: 2078-0958 (Print); ISSN: 2078-0966 (Online)
WCECS 2012
B. Ease of Attack -EA-
Ease of attack defines the grade of complexity required toperform some existing attacks in the fingerprint verificationsystems having in consideration some support parameters.EA was measured in a scale from 1 up to 4, where 1 meansthe attack is unlikely to occur because it is very difficult tocarry it out and 4 means the attack is very easy to occurbecause of its easiness. [9]
To be able to determine the ease of attack, four fundamen-tal parameters must be taken into account such as:
1) Attack Probability -AP-: AP determines the frequencywherewith the attack can occur.
2) Attack Speed -AS-: AS specifies how fast in terms oftime an attack can be performed; this point is explained inTable I.
TABLE IEASE OF ATTACK
Time Concept Time-hour- ScoreHigh more than 24 1
Moderate 11-24 2
Significant 5-10 3
Little Significant less than 5 4
3) Quality of Information -QuI-: This parameter showshow detailed is the information found in order to perform anattack. Table II specify the scoring of this parameter.
TABLE IIQUALITY OF INFORMATION
Quality of Information Definition ScoreVery Little Indicates where to find 1
Explanatory information
Little Explanatory Mentions the process 2
Explanatory Explains the process 3
Very Explanatory Details the process 4
4) Quantity of Information -QI-: How much informationcan be found about an attack; Table III explains eachparameter used to evaluated QI.
TABLE IIIQUANTITY OF INFORMATION
Quantity QI Score-videos, books, articles-
Very Little Information less than 2 1
Little Information 2-5 2
Enough Information 6-10 3
Much Information more than 10 4
Once all the attributes that determined the ease of attackare explained, equation 1 represents the final score of EA:
EA = 0.3 ∗AP + 0.3 ∗AS + 0.2 ∗QuI + 0.2 ∗QI (1)
If AP, AS, QuI and QI tend to the lowest score, then EAis 1; 1 indicates the attack is very difficult to execute, but ifon the contrary AP, AS, QuI and QI tend to get a score of4, 4 indicates that there is a high probability for the attackoccurs.
C. Attack Impact -AI-
AI shows the impact or consequence that some vulnera-bilities can produce in the verification system. Just as theprevious parameter, attack impact is also scored from 1 to 4as shown in Table IV.
TABLE IVATTACK IMPACT
Consequence Risk ScoreAttack against the communication channel Low risk 1
Attack to the sensor Potential risk 2
Repetitive Attack with software against Significant risk 3the system
Attacker replaces an entity of the system High risk 4
D. Risk Level -RL-
RL measures the risk level during an attack taking intoaccount the variables ease of attack and the impact of systemvulnerabilities. The values for risk level goes from 1 up to16 and equation 2 shows how the score is calculated.
RL = EA ∗AI (2)
If the result obtained by RL is between 1 and 5, thevulnerability has low risk and values higher than 5 areconsidered of medium high level and they must be analyzedcarefully in order to try to eliminate these attacks or controlthem.
E. Average Connection Time -ACT-
ACT measures the application connection time with thedatabase server on network independent from the number ofrecords stored.
F. Average Inscription Time -AIT-
AIT evaluates the performance of both the algorithm andthe network during the storage of data from a user. Besides,AIT shows the time in seconds that the whole network takesto do this process.
G. Average Comparison Time -AComT-
AComT evaluates the network performance in the com-parison and identification of a fingerprint. The response timeand latency in seconds is measured from the database towardsthe application.
IV. PERFORMANCE ANALYSIS
The algorithm by Griaule Biometrics was used to developthe identification application since it was the winner of FVC-Fingerprint Verification Competition- [22], the competitionevaluated multiple algorithms and sensors, besides differentsecurity and speed parameters.
To carry out the analysis of the system performance, firstan application was developed, the application allow to store3 fingerprints from each finger in a total of 30 fingerprintsrecords per person into a database server on network andbesides the application verifies and identify person’s identitythrough his fingerprint.
Proceedings of the World Congress on Engineering and Computer Science 2012 Vol II WCECS 2012, October 24-26, 2012, San Francisco, USA
ISBN: 978-988-19252-4-4 ISSN: 2078-0958 (Print); ISSN: 2078-0966 (Online)
WCECS 2012
Some devices has an internal database but system storagecapacity is limited to a small number of records by thelocal database. For that reason this investigation implementeda network system, the database server could measure thereal time performance of an access control system and thisnetwork system could also respond the needs of any user.
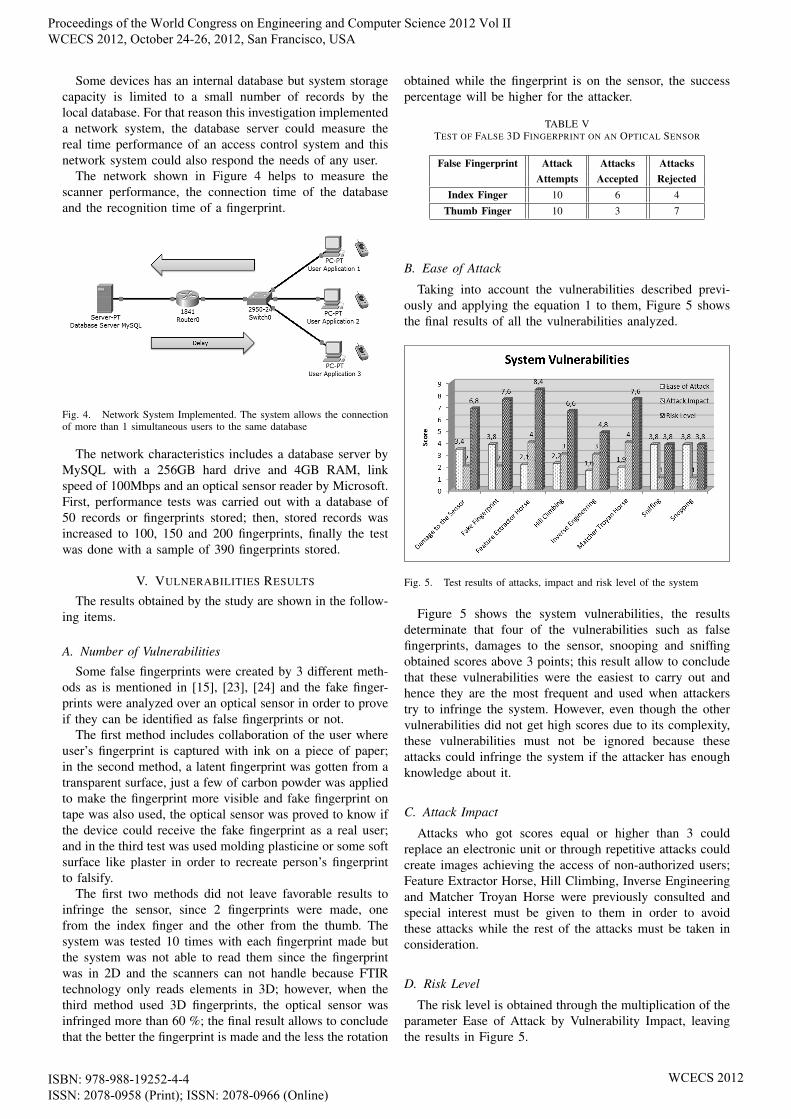
The network shown in Figure 4 helps to measure thescanner performance, the connection time of the databaseand the recognition time of a fingerprint.
Fig. 4. Network System Implemented. The system allows the connectionof more than 1 simultaneous users to the same database
The network characteristics includes a database server byMySQL with a 256GB hard drive and 4GB RAM, linkspeed of 100Mbps and an optical sensor reader by Microsoft.First, performance tests was carried out with a database of50 records or fingerprints stored; then, stored records wasincreased to 100, 150 and 200 fingerprints, finally the testwas done with a sample of 390 fingerprints stored.
V. VULNERABILITIES RESULTS
The results obtained by the study are shown in the follow-ing items.
A. Number of Vulnerabilities
Some false fingerprints were created by 3 different meth-ods as is mentioned in [15], [23], [24] and the fake finger-prints were analyzed over an optical sensor in order to proveif they can be identified as false fingerprints or not.
The first method includes collaboration of the user whereuser’s fingerprint is captured with ink on a piece of paper;in the second method, a latent fingerprint was gotten from atransparent surface, just a few of carbon powder was appliedto make the fingerprint more visible and fake fingerprint ontape was also used, the optical sensor was proved to know ifthe device could receive the fake fingerprint as a real user;and in the third test was used molding plasticine or some softsurface like plaster in order to recreate person’s fingerprintto falsify.
The first two methods did not leave favorable results toinfringe the sensor, since 2 fingerprints were made, onefrom the index finger and the other from the thumb. Thesystem was tested 10 times with each fingerprint made butthe system was not able to read them since the fingerprintwas in 2D and the scanners can not handle because FTIRtechnology only reads elements in 3D; however, when thethird method used 3D fingerprints, the optical sensor wasinfringed more than 60 %; the final result allows to concludethat the better the fingerprint is made and the less the rotation
obtained while the fingerprint is on the sensor, the successpercentage will be higher for the attacker.
TABLE VTEST OF FALSE 3D FINGERPRINT ON AN OPTICAL SENSOR
False Fingerprint Attack Attacks AttacksAttempts Accepted Rejected
Index Finger 10 6 4
Thumb Finger 10 3 7
B. Ease of Attack
Taking into account the vulnerabilities described previ-ously and applying the equation 1 to them, Figure 5 showsthe final results of all the vulnerabilities analyzed.
Fig. 5. Test results of attacks, impact and risk level of the system
Figure 5 shows the system vulnerabilities, the resultsdeterminate that four of the vulnerabilities such as falsefingerprints, damages to the sensor, snooping and sniffingobtained scores above 3 points; this result allow to concludethat these vulnerabilities were the easiest to carry out andhence they are the most frequent and used when attackerstry to infringe the system. However, even though the othervulnerabilities did not get high scores due to its complexity,these vulnerabilities must not be ignored because theseattacks could infringe the system if the attacker has enoughknowledge about it.
C. Attack Impact
Attacks who got scores equal or higher than 3 couldreplace an electronic unit or through repetitive attacks couldcreate images achieving the access of non-authorized users;Feature Extractor Horse, Hill Climbing, Inverse Engineeringand Matcher Troyan Horse were previously consulted andspecial interest must be given to them in order to avoidthese attacks while the rest of the attacks must be taken inconsideration.
D. Risk Level
The risk level is obtained through the multiplication of theparameter Ease of Attack by Vulnerability Impact, leavingthe results in Figure 5.
Proceedings of the World Congress on Engineering and Computer Science 2012 Vol II WCECS 2012, October 24-26, 2012, San Francisco, USA
ISBN: 978-988-19252-4-4 ISSN: 2078-0958 (Print); ISSN: 2078-0966 (Online)
WCECS 2012
From Figure 5, the attacks with scores higher than 6 suchas Hill Climbing [25], Service Negation Attack, Fake Finger-print and Trojans could affect the system in a considerableway even by accepting non-registered users; hence, a seriesof pertinent measures must be taken in case the system mustbe secure. Those attacks with lower scores than 6 must notbe ruled out even though they are unlikely to happen.
VI. PERFORMANCE RESULT
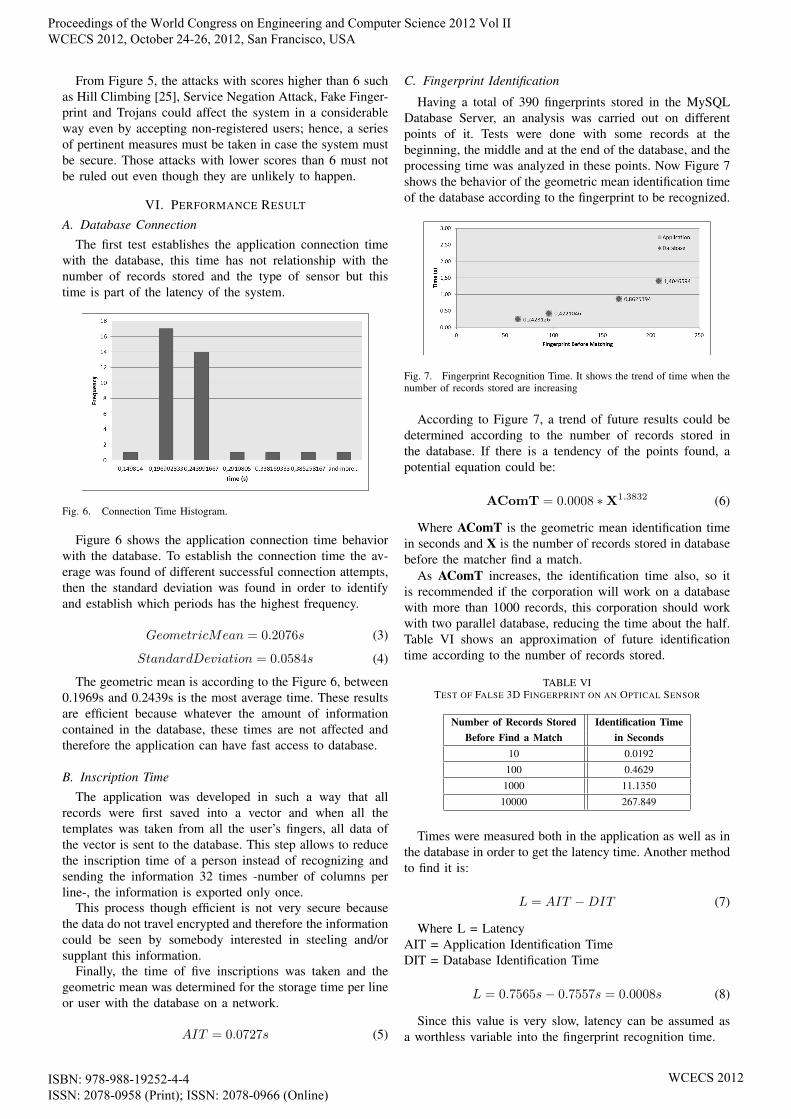
A. Database ConnectionThe first test establishes the application connection time
with the database, this time has not relationship with thenumber of records stored and the type of sensor but thistime is part of the latency of the system.
Fig. 6. Connection Time Histogram.
Figure 6 shows the application connection time behaviorwith the database. To establish the connection time the av-erage was found of different successful connection attempts,then the standard deviation was found in order to identifyand establish which periods has the highest frequency.
GeometricMean = 0.2076s (3)
StandardDeviation = 0.0584s (4)
The geometric mean is according to the Figure 6, between0.1969s and 0.2439s is the most average time. These resultsare efficient because whatever the amount of informationcontained in the database, these times are not affected andtherefore the application can have fast access to database.
B. Inscription TimeThe application was developed in such a way that all
records were first saved into a vector and when all thetemplates was taken from all the user’s fingers, all data ofthe vector is sent to the database. This step allows to reducethe inscription time of a person instead of recognizing andsending the information 32 times -number of columns perline-, the information is exported only once.
This process though efficient is not very secure becausethe data do not travel encrypted and therefore the informationcould be seen by somebody interested in steeling and/orsupplant this information.
Finally, the time of five inscriptions was taken and thegeometric mean was determined for the storage time per lineor user with the database on a network.
AIT = 0.0727s (5)
C. Fingerprint Identification
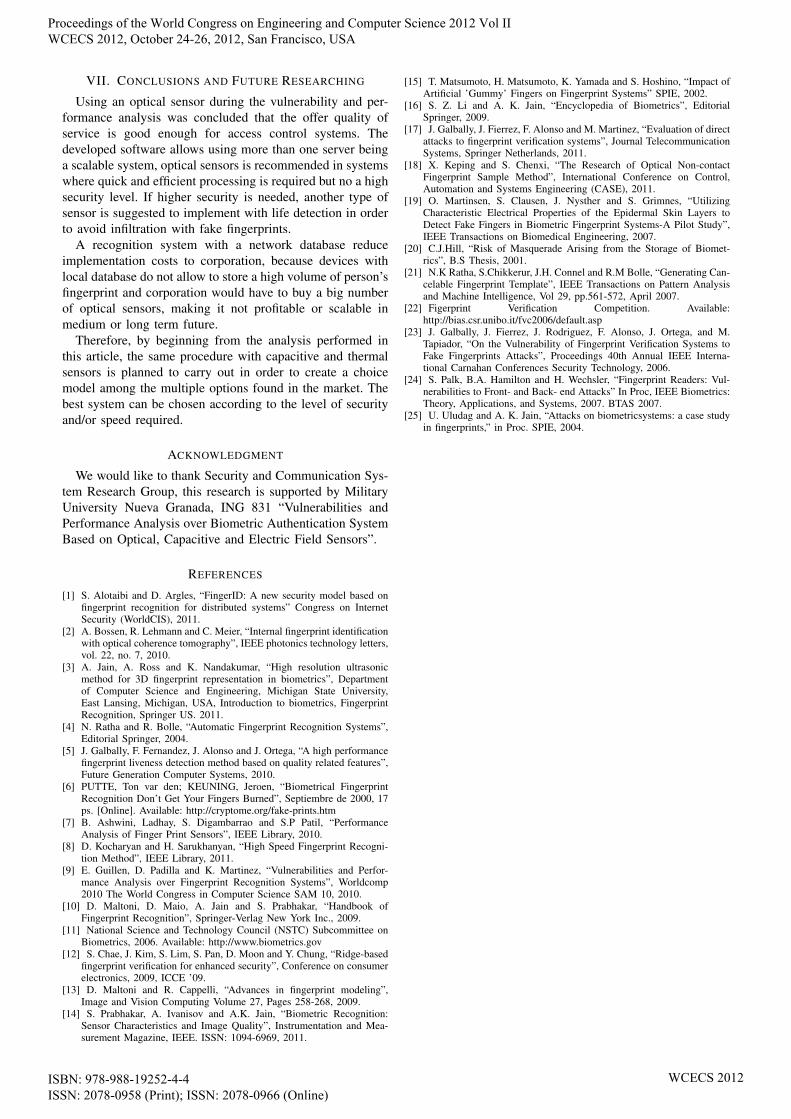
Having a total of 390 fingerprints stored in the MySQLDatabase Server, an analysis was carried out on differentpoints of it. Tests were done with some records at thebeginning, the middle and at the end of the database, and theprocessing time was analyzed in these points. Now Figure 7shows the behavior of the geometric mean identification timeof the database according to the fingerprint to be recognized.
Fig. 7. Fingerprint Recognition Time. It shows the trend of time when thenumber of records stored are increasing
According to Figure 7, a trend of future results could bedetermined according to the number of records stored inthe database. If there is a tendency of the points found, apotential equation could be:
AComT = 0.0008 ∗X1.3832 (6)
Where AComT is the geometric mean identification timein seconds and X is the number of records stored in databasebefore the matcher find a match.
As AComT increases, the identification time also, so itis recommended if the corporation will work on a databasewith more than 1000 records, this corporation should workwith two parallel database, reducing the time about the half.Table VI shows an approximation of future identificationtime according to the number of records stored.
TABLE VITEST OF FALSE 3D FINGERPRINT ON AN OPTICAL SENSOR
Number of Records Stored Identification TimeBefore Find a Match in Seconds
10 0.0192
100 0.4629
1000 11.1350
10000 267.849
Times were measured both in the application as well as inthe database in order to get the latency time. Another methodto find it is:
L = AIT −DIT (7)
Where L = LatencyAIT = Application Identification TimeDIT = Database Identification Time
L = 0.7565s− 0.7557s = 0.0008s (8)
Since this value is very slow, latency can be assumed asa worthless variable into the fingerprint recognition time.
Proceedings of the World Congress on Engineering and Computer Science 2012 Vol II WCECS 2012, October 24-26, 2012, San Francisco, USA
ISBN: 978-988-19252-4-4 ISSN: 2078-0958 (Print); ISSN: 2078-0966 (Online)
WCECS 2012
VII. CONCLUSIONS AND FUTURE RESEARCHING
Using an optical sensor during the vulnerability and per-formance analysis was concluded that the offer quality ofservice is good enough for access control systems. Thedeveloped software allows using more than one server beinga scalable system, optical sensors is recommended in systemswhere quick and efficient processing is required but no a highsecurity level. If higher security is needed, another type ofsensor is suggested to implement with life detection in orderto avoid infiltration with fake fingerprints.
A recognition system with a network database reduceimplementation costs to corporation, because devices withlocal database do not allow to store a high volume of person’sfingerprint and corporation would have to buy a big numberof optical sensors, making it not profitable or scalable inmedium or long term future.
Therefore, by beginning from the analysis performed inthis article, the same procedure with capacitive and thermalsensors is planned to carry out in order to create a choicemodel among the multiple options found in the market. Thebest system can be chosen according to the level of securityand/or speed required.
ACKNOWLEDGMENT
We would like to thank Security and Communication Sys-tem Research Group, this research is supported by MilitaryUniversity Nueva Granada, ING 831 “Vulnerabilities andPerformance Analysis over Biometric Authentication SystemBased on Optical, Capacitive and Electric Field Sensors”.
REFERENCES
[1] S. Alotaibi and D. Argles, “FingerID: A new security model based onfingerprint recognition for distributed systems” Congress on InternetSecurity (WorldCIS), 2011.
[2] A. Bossen, R. Lehmann and C. Meier, “Internal fingerprint identificationwith optical coherence tomography”, IEEE photonics technology letters,vol. 22, no. 7, 2010.
[3] A. Jain, A. Ross and K. Nandakumar, “High resolution ultrasonicmethod for 3D fingerprint representation in biometrics”, Departmentof Computer Science and Engineering, Michigan State University,East Lansing, Michigan, USA, Introduction to biometrics, FingerprintRecognition, Springer US. 2011.
[4] N. Ratha and R. Bolle, “Automatic Fingerprint Recognition Systems”,Editorial Springer, 2004.
[5] J. Galbally, F. Fernandez, J. Alonso and J. Ortega, “A high performancefingerprint liveness detection method based on quality related features”,Future Generation Computer Systems, 2010.
[6] PUTTE, Ton var den; KEUNING, Jeroen, “Biometrical FingerprintRecognition Don’t Get Your Fingers Burned”, Septiembre de 2000, 17ps. [Online]. Available: http://cryptome.org/fake-prints.htm
[7] B. Ashwini, Ladhay, S. Digambarrao and S.P Patil, “PerformanceAnalysis of Finger Print Sensors”, IEEE Library, 2010.
[8] D. Kocharyan and H. Sarukhanyan, “High Speed Fingerprint Recogni-tion Method”, IEEE Library, 2011.
[9] E. Guillen, D. Padilla and K. Martinez, “Vulnerabilities and Perfor-mance Analysis over Fingerprint Recognition Systems”, Worldcomp2010 The World Congress in Computer Science SAM 10, 2010.
[10] D. Maltoni, D. Maio, A. Jain and S. Prabhakar, “Handbook ofFingerprint Recognition”, Springer-Verlag New York Inc., 2009.
[11] National Science and Technology Council (NSTC) Subcommittee onBiometrics, 2006. Available: http://www.biometrics.gov
[12] S. Chae, J. Kim, S. Lim, S. Pan, D. Moon and Y. Chung, “Ridge-basedfingerprint verification for enhanced security”, Conference on consumerelectronics, 2009, ICCE ’09.
[13] D. Maltoni and R. Cappelli, “Advances in fingerprint modeling”,Image and Vision Computing Volume 27, Pages 258-268, 2009.
[14] S. Prabhakar, A. Ivanisov and A.K. Jain, “Biometric Recognition:Sensor Characteristics and Image Quality”, Instrumentation and Mea-surement Magazine, IEEE. ISSN: 1094-6969, 2011.
[15] T. Matsumoto, H. Matsumoto, K. Yamada and S. Hoshino, “Impact ofArtificial ’Gummy’ Fingers on Fingerprint Systems” SPIE, 2002.
[16] S. Z. Li and A. K. Jain, “Encyclopedia of Biometrics”, EditorialSpringer, 2009.
[17] J. Galbally, J. Fierrez, F. Alonso and M. Martinez, “Evaluation of directattacks to fingerprint verification systems”, Journal TelecommunicationSystems, Springer Netherlands, 2011.
[18] X. Keping and S. Chenxi, “The Research of Optical Non-contactFingerprint Sample Method”, International Conference on Control,Automation and Systems Engineering (CASE), 2011.
[19] O. Martinsen, S. Clausen, J. Nysther and S. Grimnes, “UtilizingCharacteristic Electrical Properties of the Epidermal Skin Layers toDetect Fake Fingers in Biometric Fingerprint Systems-A Pilot Study”,IEEE Transactions on Biomedical Engineering, 2007.
[20] C.J.Hill, “Risk of Masquerade Arising from the Storage of Biomet-rics”, B.S Thesis, 2001.
[21] N.K Ratha, S.Chikkerur, J.H. Connel and R.M Bolle, “Generating Can-celable Fingerprint Template”, IEEE Transactions on Pattern Analysisand Machine Intelligence, Vol 29, pp.561-572, April 2007.
[22] Figerprint Verification Competition. Available:http://bias.csr.unibo.it/fvc2006/default.asp
[23] J. Galbally, J. Fierrez, J. Rodriguez, F. Alonso, J. Ortega, and M.Tapiador, “On the Vulnerability of Fingerprint Verification Systems toFake Fingerprints Attacks”, Proceedings 40th Annual IEEE Interna-tional Carnahan Conferences Security Technology, 2006.
[24] S. Palk, B.A. Hamilton and H. Wechsler, “Fingerprint Readers: Vul-nerabilities to Front- and Back- end Attacks” In Proc, IEEE Biometrics:Theory, Applications, and Systems, 2007. BTAS 2007.
[25] U. Uludag and A. K. Jain, “Attacks on biometricsystems: a case studyin fingerprints,” in Proc. SPIE, 2004.
Proceedings of the World Congress on Engineering and Computer Science 2012 Vol II WCECS 2012, October 24-26, 2012, San Francisco, USA
ISBN: 978-988-19252-4-4 ISSN: 2078-0958 (Print); ISSN: 2078-0966 (Online)
WCECS 2012