VSRT M MASSACHUSETTS INSTITUTE OF ... VSRT M EMO #077 MASSACHUSETTS INSTITUTE OF TECHNOLOGY HAYSTACK...
13
1 VSRT MEMO #077 MASSACHUSETTS INSTITUTE OF TECHNOLOGY HAYSTACK OBSERVATORY WESTFORD, MASSACHUSETTS 01886 November 2, 2015 Telephone: 781-981-5400 Fax: 781-981-0590 To: VSRT Group From: A.E.E. Rogers and O.B. Alam Subject: Two channel spectrometer using Intel NUC A two channel spectrometer which uses both polarizations of a single LNBF has been optimized for potential deployment at new sites and an upgrade of the existing sites. The spectrometer has been optimized for: 1] Low noise by choice of LNBF and antenna to minimize spillover 2] High processing efficiency with minimum time lost to calibration and calculations. An efficiency of 70% of theoretical is achieved. 3] Low power consumption of about 15 watts Figure 1 shows a block diagram of the ozone spectrometer. A pair of TV dongles (RTL SDR with RTL2832U) are used to capture a 2.5 MHz bandwidth from each linear polarization of the LNBF (Star Com SR-3602 Ku band twin). 12 volts and 18 volts are used to select the different polarizations. A photograph of the spectrometer is shown in Figure 2. To minimize out-of-band interference the LNBF outputs are filtered and attenuated to provide the best signal levels to the TV dongles. The optimum levels are about mid-scale in the ADC range of -127 to + 128. Frequency switching is used, in which the ozone line is alternately placed at 0.9375 and 1.5625 MHz in the baseband 1 output. While the line is at 0.9375 MHz, the spectrum at 1.5625 MHz is used as a reference, and vice versa. In addition, the reference spectrum is smoothed using a polynomial. In this case, the noise in the line spectrum is reduced so that the normalized theoretical noise is given by the inverse of the square root of the resolution bandwidth times the integration time as would be obtained by a total power spectrometer. When the spectra of both polarizations are combined the theoretical noise level for a 80 K system noise and 2.44 kHz resolution is 19 millikelvin in one hour. Software timing tests show that for 42 seconds of data ( 8 1.05 10 × complex samples in each channel) the FFTs and other calculations add 5 seconds, and the calibration another 10 seconds. Most of the time for calibration is the result of using stty to turn on and off the RS232 RTS line. In principle this added time could be reduced by using another device. (at this time no alternate low cost device has been found). Other tests of the performance, in addition to comparing the rms noise levels with theory, were 1] Test of the Y-factor when an absorber is placed over the LNBF. 1 Equivalently -0.3125 and +0.3125 in I/Q spectrum
-
Upload
trinhnguyet -
Category
Documents
-
view
216 -
download
2
Transcript of VSRT M MASSACHUSETTS INSTITUTE OF ... VSRT M EMO #077 MASSACHUSETTS INSTITUTE OF TECHNOLOGY HAYSTACK...

1
VSRT MEMO #077 MASSACHUSETTS INSTITUTE OF TECHNOLOGY
HAYSTACK OBSERVATORY WESTFORD, MASSACHUSETTS 01886
November 2, 2015 Telephone: 781-981-5400 Fax: 781-981-0590 To: VSRT Group From: A.E.E. Rogers and O.B. Alam Subject: Two channel spectrometer using Intel NUC
A two channel spectrometer which uses both polarizations of a single LNBF has been optimized for potential deployment at new sites and an upgrade of the existing sites. The spectrometer has been optimized for:
1] Low noise by choice of LNBF and antenna to minimize spillover
2] High processing efficiency with minimum time lost to calibration and calculations. An efficiency of 70% of theoretical is achieved.
3] Low power consumption of about 15 watts
Figure 1 shows a block diagram of the ozone spectrometer. A pair of TV dongles (RTL SDR with RTL2832U) are used to capture a 2.5 MHz bandwidth from each linear polarization of the LNBF (Star Com SR-3602 Ku band twin). 12 volts and 18 volts are used to select the different polarizations. A photograph of the spectrometer is shown in Figure 2.
To minimize out-of-band interference the LNBF outputs are filtered and attenuated to provide the best signal levels to the TV dongles. The optimum levels are about mid-scale in the ADC range of -127 to + 128. Frequency switching is used, in which the ozone line is alternately placed at 0.9375 and 1.5625 MHz in the baseband1 output. While the line is at 0.9375 MHz, the spectrum at 1.5625 MHz is used as a reference, and vice versa. In addition, the reference spectrum is smoothed using a polynomial. In this case, the noise in the line spectrum is reduced so that the normalized theoretical noise is given by the inverse of the square root of the resolution bandwidth times the integration time as would be obtained by a total power spectrometer. When the spectra of both polarizations are combined the theoretical noise level for a 80 K system noise and 2.44 kHz resolution is 19 millikelvin in one hour. Software timing tests show that for 42 seconds of data ( 81.05 10× complex samples in each channel) the FFTs and other calculations add 5 seconds, and the calibration another 10 seconds. Most of the time for calibration is the result of using stty to turn on and off the RS232 RTS line. In principle this added time could be reduced by using another device. (at this time no alternate low cost device has been found).
Other tests of the performance, in addition to comparing the rms noise levels with theory, were
1] Test of the Y-factor when an absorber is placed over the LNBF.
1 Equivalently -0.3125 and +0.3125 in I/Q spectrum

2
Typical Y-factor between the beam at 8 degrees elevation and an absorber was 4.9 dB when using the Star Comm. SR-3602 LNBF. Approximate estimates of noise contributions are 25K spillover, 50K LNB, 30K atmosphere, and 5K sky noise.
2] Measuring the observed spectrum of the calibrator by leaving the calibrator on and treating it as a spectral line at 11.07 GHz. Units in the field exhibit drift in the LNBF local oscillator of about 200 kHz for a 10 degC change in temperature, and a drift at night in one minute of less than 300 Hz or an equivalent Doppler velocity shift of under 10 m/s at 11 GHz. While this can be corrected in post-processing using the reported calibration frequencies, the new software allows a number of additional calibrations between output to data files. Tests show that some LNBFs, most notably the Avenger KSC322 are much less stable. Presumably to correct this problem Avenger also has the PLL322-S-2 which has a phase-locked oscillator, but unfortunately this LNBF has spurs in its output spectra.
Figure 3 shows the spectrum of the frequency calibration signal observed by changing the set-up control file (ozspec.cat) to a line frequency of 1320 (for 11.07 GHz) and selecting VCALSTAYON (for leaving the calibration signal “on.”)
3] A test of a shield on the LNBF Feed to reduce the spillover and lower the back lobe of the LNBF. This shield, which is made from a plastic canning funnel (Norpro 607) covered with tin foil, was used when the spectrometer was tested close to the Haystack radar. It was found to significantly reduce the interference. While the shield improves the Y-factor by about 0.1 dB we don’t recommend using it as it may fill with snow and ice in the winter or attract insects and birds. Another solution for locations with RFI is mount the dish on a wall that prevents the LNBF from being in line of sight of the Clarke belt.
Other potential solutions for RFI are
a) Extend the dish size with added petals b) Use the LNBF shield with the dish inverted so that water or snow cannot collect in the
shield.
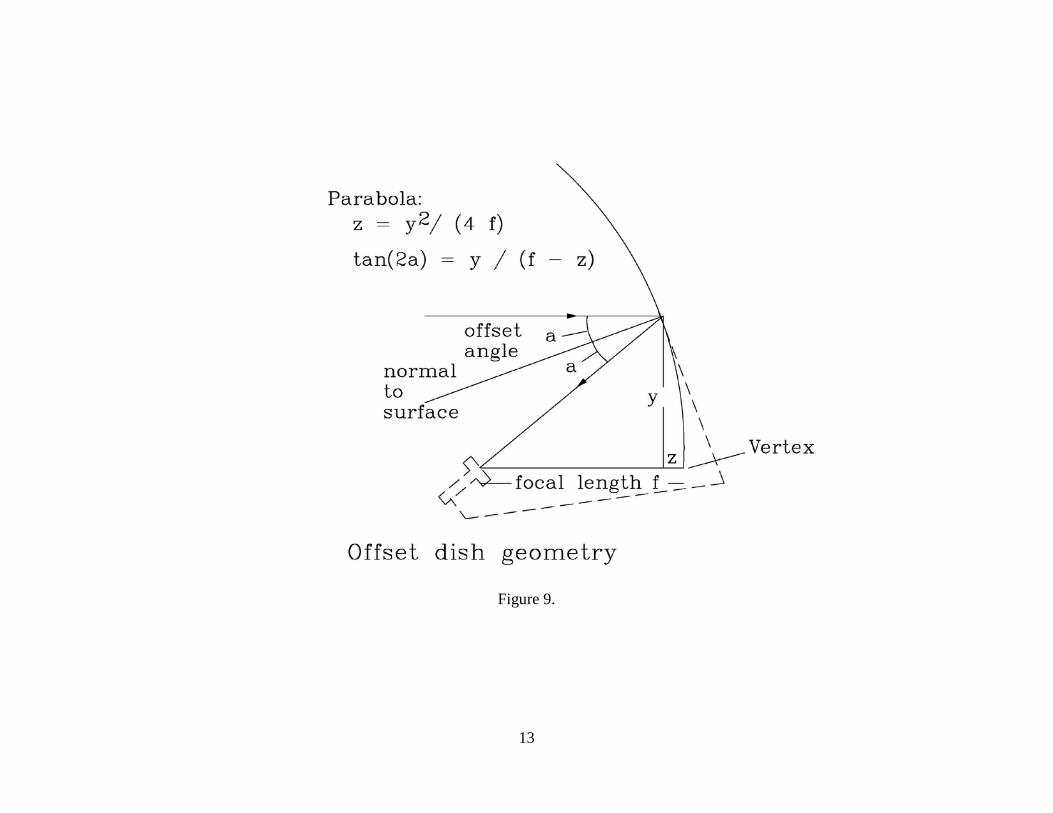
Figures 4 and 5 show views for the dish with LNBF shield in place. The LNBF is located so that a point at the phase center of the feed, which is about 0.9” into the feed, is located on a line perpendicular to the surface at the bottom of the dish at a distance of. 10.6”. The feed is pointed at an angle of 42 degrees to this line so that the feed is pointed about 8” up from the bottom of the dish. See Figure 9 for the dish geometry.
List of parts Note Approx. Unit Cost
Qty
Winegard DS-4048 (f = 10.6”) 4 Solid signal
15.00 1
Single satellite TV dish LNB bracket 6 Amazon $6.00 1
Star Comm SR-3602 dual LNBF Amazon $10.00 1
RG-6 cables – male-to-male F Amazon $10.00 2
SMA cable male-to-male Amazon $10.00 1
R820-T RTL2832 3 Amazon $20.00 2

3
6 inch USB 2.0 High speed extension cable
Amazon $5 2
Ferrite cylinder clamp-on 4.5 mm 5 Digi-Key 3
SMA male-to-MCX male right angle 6” Amazon $5.00 2
SMA female-to-F male Amazon $5.00 2
Channel vision CVT-P1 power injector Amazon $10.00 2
6 dB DC passing attenuator (optional) Amazon $10.00 2
VHF-740 MHz HPF mini circuits Mini Circuits $25.00 2
VAT-8+ attenuator mini circuits Mini Circuits $14.00 2
Open-mesh 18V power supply Amazon $14.00 1
12V power supply 2 amp Amazon $5.00 1
Intel NUC computer Amazon $300.00 1
USB to RS232 Converter cable Tripp Lite U209-000-R
Amazon $10.00 2
Harmonic generator – custom circuit Haystack 1
10 MHz crystal Conner Winfield Ox200-sc or atomic clock oscillator
$300 or $2000 11
Box for 10 MHz Haystack
Added notes:
1] Try to locate spectrometer to within 50 m of the dish. Added optional attenuation can be used if needed.
2] Many of the components are available from Amazon. Other sources are Minicircuits.com, Solidsignal.com, Newegg.com, ebay.com.
3] Mini DVB – New USB DVB-T stick RTL2832U+R820T TV-DUB (Mpeg 2) SDR FM radio / DAB radio – WMA
4] Universal mount RCA style 0.59f D =
5] Digi-Key part #240-2245-ND 6] LNB for L type LNBF (single LNB holder)
Figure 6 shows the antenna with frequency calibrator and Figure 7 shows some of the small parts needed for the complete spectrometer. Some variations/substitutions may be required depending on the availability of parts.
The ferrite “clamp-on” common mode filters help reduce any RFI from the NUC getting into the TV dongle receivers. There are some weak internal spurs in the dongles whose levels are a little higher in the larger units. While the “mini” dongles have lower spurs they can get too hot if they are not clamped to the base plate to remove some heat by conduction.

4
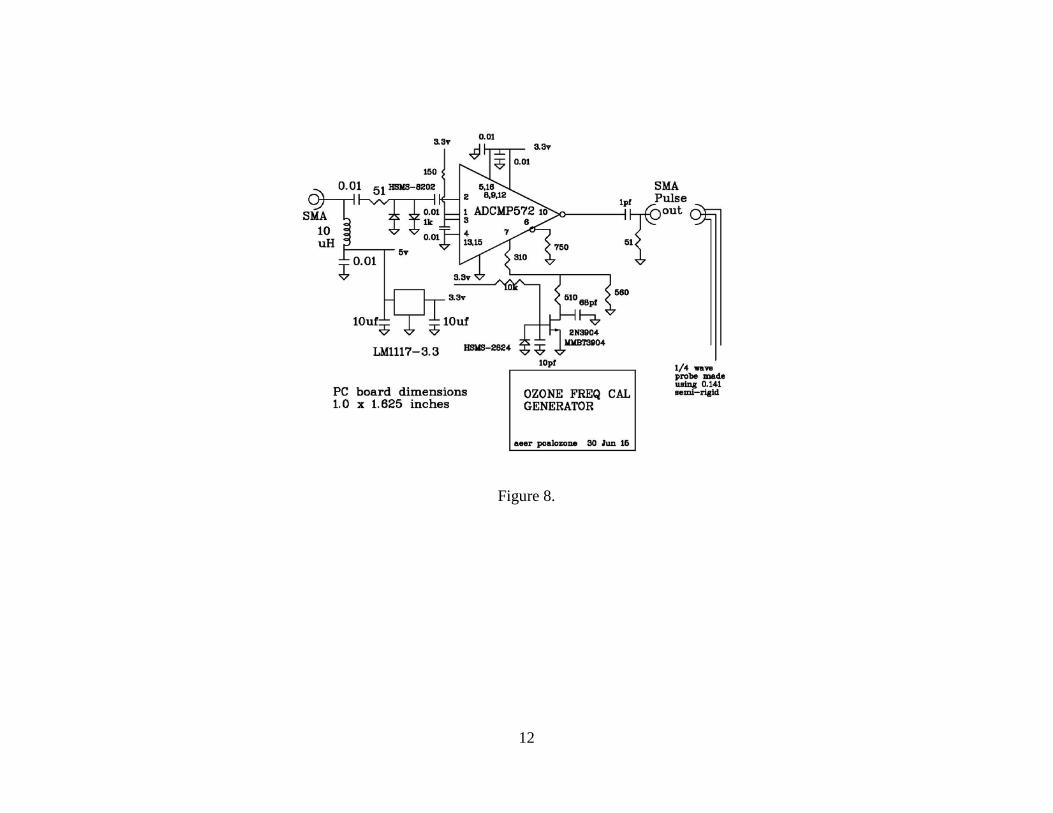
Figure 8 shows the Ozone spectrometer frequency calibration generator. This device generates short pulses at a 10 MHz rate which produces harmonies of 10 MHz. The harmonic at 11.07 GHz is used for frequency calibration. The signal is coupled into the dual polarization LNBF. The antenna is a ¼ wave monopole 0.7 cm or about ¼” long. It is oriented at 45◦ to the polarizations of the LNBF.
Figure 6 shows the LNBF attached to the feed support tube. Unfortunately there are no standard LNBF mounting bracket which will place the feed in the correct location without some modification. The dish shown in Figure 6 is a DS4047 (now obsolete) and no longer available) with a specially shaped “D” feed tube while the DS4048 has a rectangular tube. In the rectangular version the feed tube is longer and it may be convenient to drill mounting holes further away from the end of the tube or use a spacer from the metal part of the bracket to the plastic part.

5
Figure 1. Block diagram

6
Figure 2. Photograph of spectrometer mounted on wall of building.

7
Figure 3. Spectrum of frequency calibration signal.

8
Figure 4. Tests of a shield on LNBF

9
Figure 5. LNBF shown with “test” shield on LNBF.

10
Figure 6. Close-up view of antenna, frequency calibrator and LNBF mounting bracket.

11
Figure 7. Small parts for the spectrometer.
12
Figure 8.
13
Figure 9.