vSphere Monitoring and Performance - vSphere 5.1
196
vSphere Monitoring and Performance vSphere 5.1 vCenter Server 5.1 ESXi 5.1 This document supports the version of each product listed and supports all subsequent versions until the document is replaced by a new edition. To check for more recent editions of this document, see http://www.vmware.com/support/pubs. EN-000799-02
Transcript of vSphere Monitoring and Performance - vSphere 5.1
vSphere Monitoring and PerformancevSphere 5.1
vCenter Server 5.1ESXi 5.1
This document supports the version of each product listed andsupports all subsequent versions until the document is replacedby a new edition. To check for more recent editions of thisdocument, see http://www.vmware.com/support/pubs.
EN-000799-02
vSphere Monitoring and Performance
2 VMware, Inc.
You can find the most up-to-date technical documentation on the VMware Web site at:
http://www.vmware.com/support/
The VMware Web site also provides the latest product updates.
If you have comments about this documentation, submit your feedback to:
Copyright © 2010–2013 VMware, Inc. All rights reserved. This product is protected by U.S. and international copyright andintellectual property laws. VMware products are covered by one or more patents listed at http://www.vmware.com/go/patents.
VMware is a registered trademark or trademark of VMware, Inc. in the United States and/or other jurisdictions. All other marksand names mentioned herein may be trademarks of their respective companies.
VMware, Inc.3401 Hillview Ave.Palo Alto, CA 94304www.vmware.com
Contents
About vSphere Monitoring and Performance 5
Updated Information 7
1 Monitoring Inventory Objects with Performance Charts 9
Performance Chart Types 10Data Counters 11Metric Groups 12Data Collection Intervals 13Data Collection Levels 14View Charts 14View Charts in the vSphere Web Client 15Performance Charts View Menu Options 15Overview Performance Charts 16Working with Advanced and Custom Charts 94Troubleshoot and Enhance Performance 100Why are my charts empty? 104
2 Monitoring Guest Operating System Performance 107
Enable Statistics Collection for Guest Operating System Performance Analysis 107View Performance Statistics for Windows Guest Operating Systems 107
3 Monitoring Host Health Status 109
Monitor Health Status When Directly Connected to a Host 110Monitor Health Status When Connected to vCenter Server 110Monitor Health Status in the vSphere Web Client When Connected to vCenter Server 111Reset Hardware Sensors When Directly Connected to a Host 111Reset Health Status Sensors When Connected to vCenter Server 112Reset Health Status Sensors in the vSphere Web Client When Connected to vCenter Server 112Troubleshoot the Hardware Health Service 113
4 Monitoring Storage Resources 115
Working with Storage Reports 115Working with Storage Maps 119
5 Monitoring Events, Alarms, and Automated Actions 121
View Events 123View Events in the vSphere Web Client 123View System Logs 123View System Logs in the vSphere Web Client 124Export Events Data 124
VMware, Inc. 3
Export Events Data in the vSphere Web Client 124View Triggered Alarms and Alarm Definitions 125View Triggered Alarms and Alarm Definitions in the vSphere Web Client 125Set An Alarm 126Set an Alarm in the vSphere Web Client 135Acknowledge Triggered Alarms 143Acknowledge Triggered Alarms in the vSphere Web Client 144Reset Triggered Event Alarms 144Reset Triggered Event Alarms in the vSphere Web Client 145Identify Disabled Alarm Actions 145
6 Monitoring Solutions with the vCenter Solutions Manager 147
Viewing Solutions 148View Solutions and vServices in the vSphere Web Client 148Monitoring Agents 149Monitoring vServices 149
7 Performance Monitoring Utilities: resxtop and esxtop 151
Using the esxtop Utility 151Using the resxtop Utility 152Using esxtop or resxtop in Interactive Mode 152Using Batch Mode 166Using Replay Mode 167
8 Monitoring Networked Devices with SNMP and vSphere 169
Using SNMP Traps with vCenter Server 169Configure SNMP for ESXi 171SNMP Diagnostics 179Using SNMP with Guest Operating Systems 179VMware MIB Files 180SNMPv2 Diagnostic Counters 181
9 System Log Files 183
View System Log Entries 183View System Logs on an ESXi Host 183External System Logs 184Export System Log Files 184Configure Syslog on ESXi Hosts 185Collecting Log Files 186Viewing Log Files with the Log Browser in the vSphere Web Client 188
Index 191
vSphere Monitoring and Performance
4 VMware, Inc.
About vSphere Monitoring and Performance
VMware provides several tools to help you monitor your virtual environment and to locate the source ofpotential issues and current problems.
Performance charts Allow you to see performance data on a variety of system resources includingCPU, Memory, Storage, and so on.
Performance monitoringcommand-line utilities
Allow you to access detailed information on system performance through thecommand line.
Host health Allows you to quickly identify which hosts are healthy and which areexperiencing problems.
Storage maps and charts Provide an in-depth look at your storage resources.
Events, alerts, andalarms
Allow you to configure alerts and alarms and to specify the actions the systemshould take when they are triggered.
System Log Files System logs contain additional information about activities in your vSphereenvironment.
Badges for monitoringobjects in your virtualenvironment
Allow you to quickly identify objects that are experiencing performanceproblems or might experience problems in the near future.
Intended AudienceThe content in this section is intended for vSphere administrators who perform the following tasks:
n Monitor the health and performance of physical hardware backings for the virtual environment.
n Monitor the health and performance of virtual devices in the virtual environment.
n Troubleshoot problems in the system.
n Configure alarms.
n Configure SNMP messages.
Virtual machine administrators also might find the section on Chapter 2, “Monitoring Guest Operating SystemPerformance,” on page 107 helpful.
VMware, Inc. 5

vSphere Monitoring and Performance
6 VMware, Inc.
Updated Information
This vSphere Monitoring and Performance publication is updated with each release of the product or whennecessary.
This table provides the update history of vSphere Monitoring and Performance.
Revision Description
000799-02 n Fixed SNMP command in “Configure the SNMP Agent for GETs,” on page 173 and “Configure the SNMPAgent to Send SNMP v1 or v2c Traps,” on page 172.
000799-01 n New information about VMware vCenter Operations Manager badges, available in the VMwareDocumentation Center.
n Updated information about alarm environment variables in “Alarm Environment Variables for Scripts,”on page 133.
n Updated information in “Memory Panel,” on page 158.n Updated metadata in alarm-related topics.
000799-00 Initial release.
VMware, Inc. 7

vSphere Monitoring and Performance
8 VMware, Inc.
Monitoring Inventory Objects withPerformance Charts 1
The vSphere statistics subsystem collects data on the resource usage of inventory objects. Data on a wide rangeof metrics is collected at frequent intervals, processed, and archived in the vCenter Server database. You canaccess statistical information through command-line monitoring utilities or by viewing performance charts inthe vSphere Client and the vSphere Web Client.
Counters and Metric GroupsvCenter Server systems and hosts use data counters to query for statistics. A data counter is a unit ofinformation relevant to a given inventory object or device. Each counter collects data for a different statistic ina metric group. For example, the disk metric group includes separate data counters to collect data for disk readrate, disk write rate, and disk usage. Statistics for each counter are rolled up after a specified collection interval.Each data counter consists of several attributes that are used to determine the statistical value collected.
For a complete list and description of performance metrics, see the vSphere API Reference.
NOTE Data for hosts with versions of ESXi prior to 5.0 is not included in results collected by counters that areintroduced in ESXi 5.0. See the VMware Knowledge Base for details.
Collection Levels and Collection IntervalsCollection levels determine the number of counters for which data is gathered during each collection interval.Collection intervals determine the time period during which statistics are aggregated, calculated, rolled up,and archived in the vCenter Server database. Together, the collection interval and collection level determinehow much statistical data is collected and stored in your vCenter Server database .
Data AvailabilityReal-time data appears in the performance charts only for hosts and virtual machines that are powered on.Historical data appears for all supported inventory objects, but might be unavailable during certaincircumstances.
This chapter includes the following topics:
n “Performance Chart Types,” on page 10
n “Data Counters,” on page 11
n “Metric Groups,” on page 12
n “Data Collection Intervals,” on page 13
n “Data Collection Levels,” on page 14
n “View Charts,” on page 14
VMware, Inc. 9
n “View Charts in the vSphere Web Client,” on page 15
n “Performance Charts View Menu Options,” on page 15
n “Overview Performance Charts,” on page 16
n “Working with Advanced and Custom Charts,” on page 94
n “Troubleshoot and Enhance Performance,” on page 100
n “Why are my charts empty?,” on page 104
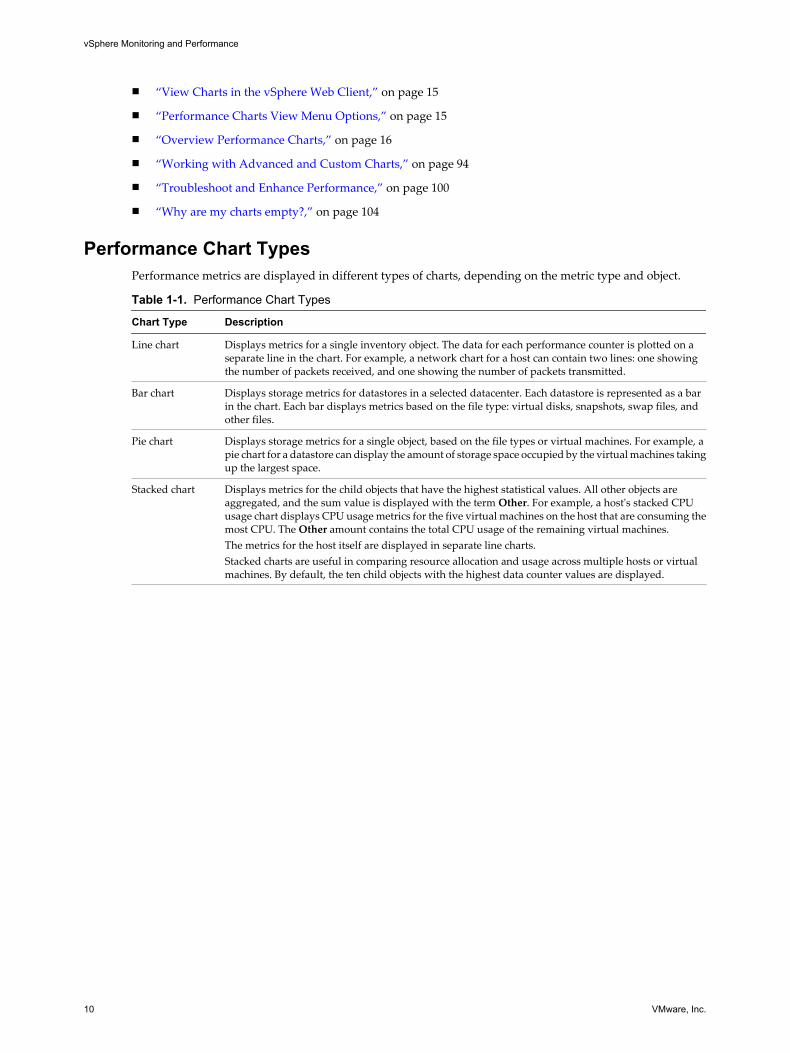
Performance Chart TypesPerformance metrics are displayed in different types of charts, depending on the metric type and object.
Table 1-1. Performance Chart Types
Chart Type Description
Line chart Displays metrics for a single inventory object. The data for each performance counter is plotted on aseparate line in the chart. For example, a network chart for a host can contain two lines: one showingthe number of packets received, and one showing the number of packets transmitted.
Bar chart Displays storage metrics for datastores in a selected datacenter. Each datastore is represented as a barin the chart. Each bar displays metrics based on the file type: virtual disks, snapshots, swap files, andother files.
Pie chart Displays storage metrics for a single object, based on the file types or virtual machines. For example, apie chart for a datastore can display the amount of storage space occupied by the virtual machines takingup the largest space.
Stacked chart Displays metrics for the child objects that have the highest statistical values. All other objects areaggregated, and the sum value is displayed with the term Other. For example, a host's stacked CPUusage chart displays CPU usage metrics for the five virtual machines on the host that are consuming themost CPU. The Other amount contains the total CPU usage of the remaining virtual machines.The metrics for the host itself are displayed in separate line charts.Stacked charts are useful in comparing resource allocation and usage across multiple hosts or virtualmachines. By default, the ten child objects with the highest data counter values are displayed.
vSphere Monitoring and Performance
10 VMware, Inc.
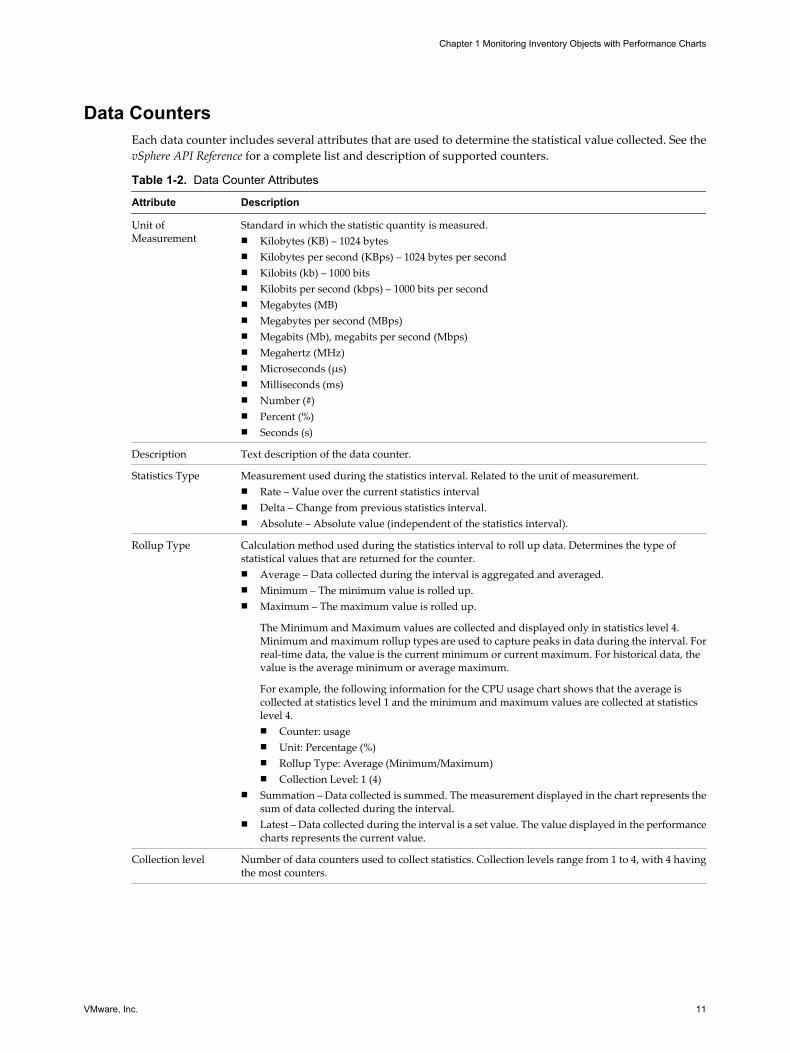
Data CountersEach data counter includes several attributes that are used to determine the statistical value collected. See thevSphere API Reference for a complete list and description of supported counters.
Table 1-2. Data Counter Attributes
Attribute Description
Unit ofMeasurement
Standard in which the statistic quantity is measured.n Kilobytes (KB) – 1024 bytesn Kilobytes per second (KBps) – 1024 bytes per secondn Kilobits (kb) – 1000 bitsn Kilobits per second (kbps) – 1000 bits per secondn Megabytes (MB)n Megabytes per second (MBps)n Megabits (Mb), megabits per second (Mbps)n Megahertz (MHz)n Microseconds (µs)n Milliseconds (ms)n Number (#)n Percent (%)n Seconds (s)
Description Text description of the data counter.
Statistics Type Measurement used during the statistics interval. Related to the unit of measurement.n Rate – Value over the current statistics intervaln Delta – Change from previous statistics interval.n Absolute – Absolute value (independent of the statistics interval).
Rollup Type Calculation method used during the statistics interval to roll up data. Determines the type ofstatistical values that are returned for the counter.n Average – Data collected during the interval is aggregated and averaged.n Minimum – The minimum value is rolled up.n Maximum – The maximum value is rolled up.
The Minimum and Maximum values are collected and displayed only in statistics level 4.Minimum and maximum rollup types are used to capture peaks in data during the interval. Forreal-time data, the value is the current minimum or current maximum. For historical data, thevalue is the average minimum or average maximum.
For example, the following information for the CPU usage chart shows that the average iscollected at statistics level 1 and the minimum and maximum values are collected at statisticslevel 4.n Counter: usagen Unit: Percentage (%)n Rollup Type: Average (Minimum/Maximum)n Collection Level: 1 (4)
n Summation – Data collected is summed. The measurement displayed in the chart represents thesum of data collected during the interval.
n Latest – Data collected during the interval is a set value. The value displayed in the performancecharts represents the current value.
Collection level Number of data counters used to collect statistics. Collection levels range from 1 to 4, with 4 havingthe most counters.
Chapter 1 Monitoring Inventory Objects with Performance Charts
VMware, Inc. 11
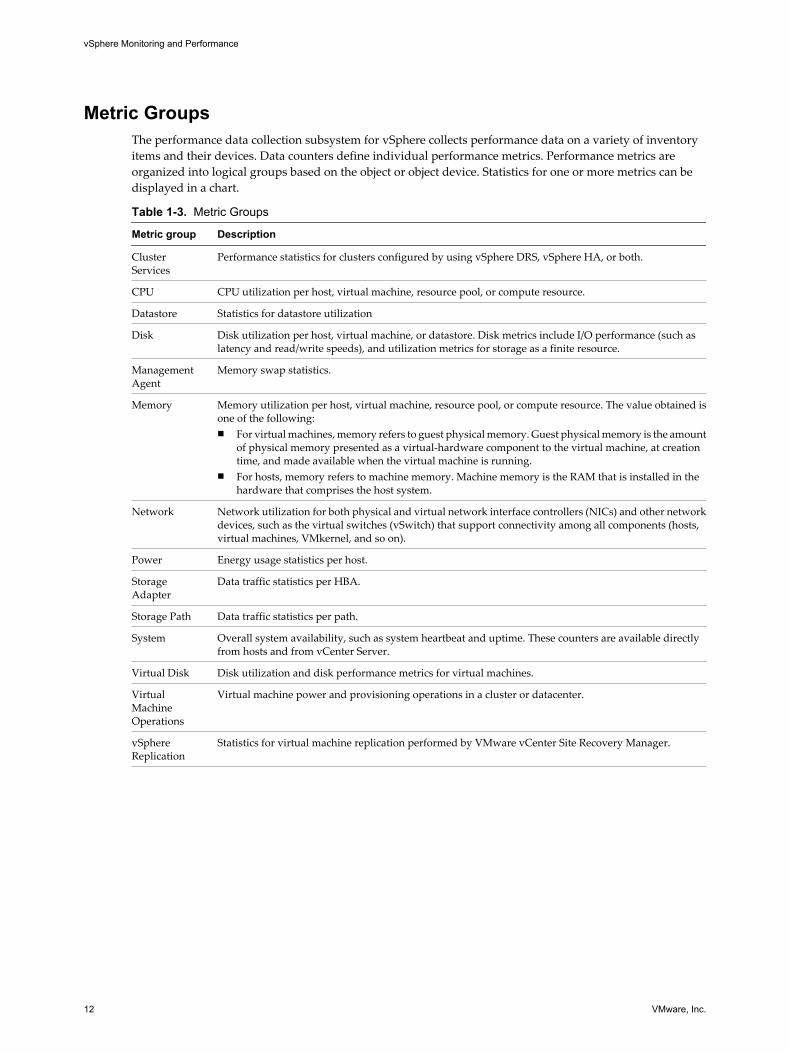
Metric GroupsThe performance data collection subsystem for vSphere collects performance data on a variety of inventoryitems and their devices. Data counters define individual performance metrics. Performance metrics areorganized into logical groups based on the object or object device. Statistics for one or more metrics can bedisplayed in a chart.
Table 1-3. Metric Groups
Metric group Description
ClusterServices
Performance statistics for clusters configured by using vSphere DRS, vSphere HA, or both.
CPU CPU utilization per host, virtual machine, resource pool, or compute resource.
Datastore Statistics for datastore utilization
Disk Disk utilization per host, virtual machine, or datastore. Disk metrics include I/O performance (such aslatency and read/write speeds), and utilization metrics for storage as a finite resource.
ManagementAgent
Memory swap statistics.
Memory Memory utilization per host, virtual machine, resource pool, or compute resource. The value obtained isone of the following:n For virtual machines, memory refers to guest physical memory. Guest physical memory is the amount
of physical memory presented as a virtual-hardware component to the virtual machine, at creationtime, and made available when the virtual machine is running.
n For hosts, memory refers to machine memory. Machine memory is the RAM that is installed in thehardware that comprises the host system.
Network Network utilization for both physical and virtual network interface controllers (NICs) and other networkdevices, such as the virtual switches (vSwitch) that support connectivity among all components (hosts,virtual machines, VMkernel, and so on).
Power Energy usage statistics per host.
StorageAdapter
Data traffic statistics per HBA.
Storage Path Data traffic statistics per path.
System Overall system availability, such as system heartbeat and uptime. These counters are available directlyfrom hosts and from vCenter Server.
Virtual Disk Disk utilization and disk performance metrics for virtual machines.
VirtualMachineOperations
Virtual machine power and provisioning operations in a cluster or datacenter.
vSphereReplication
Statistics for virtual machine replication performed by VMware vCenter Site Recovery Manager.
vSphere Monitoring and Performance
12 VMware, Inc.
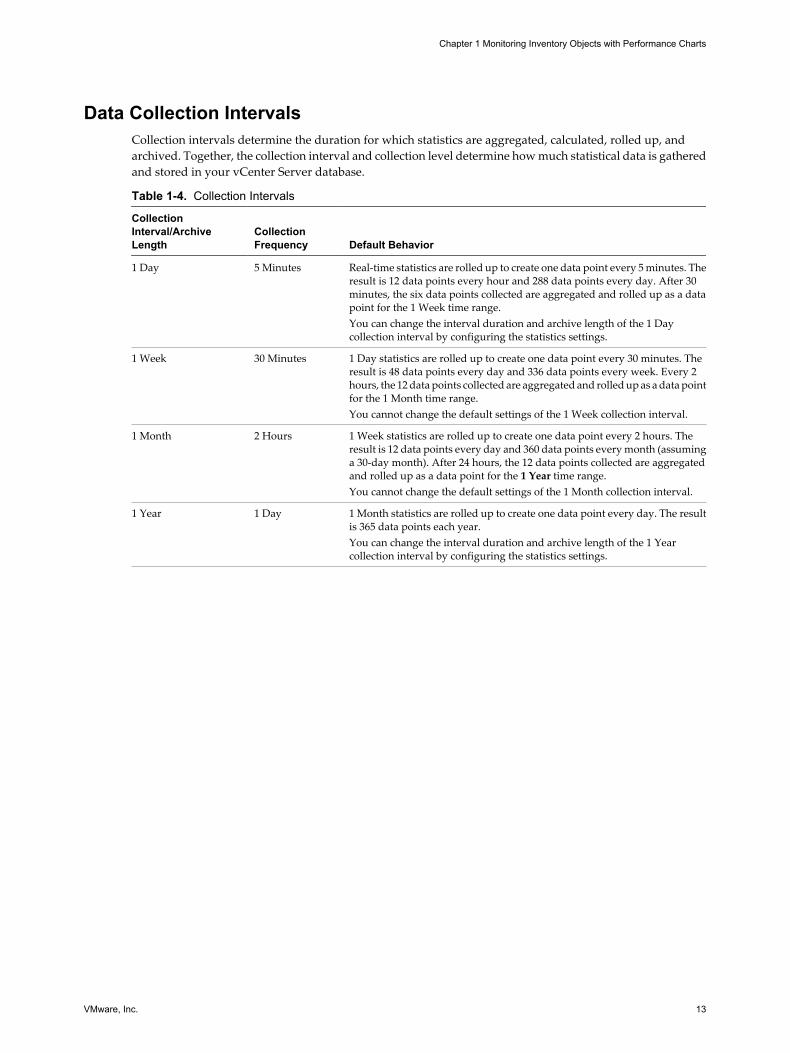
Data Collection IntervalsCollection intervals determine the duration for which statistics are aggregated, calculated, rolled up, andarchived. Together, the collection interval and collection level determine how much statistical data is gatheredand stored in your vCenter Server database.
Table 1-4. Collection Intervals
CollectionInterval/ArchiveLength
CollectionFrequency Default Behavior
1 Day 5 Minutes Real-time statistics are rolled up to create one data point every 5 minutes. Theresult is 12 data points every hour and 288 data points every day. After 30minutes, the six data points collected are aggregated and rolled up as a datapoint for the 1 Week time range.You can change the interval duration and archive length of the 1 Daycollection interval by configuring the statistics settings.
1 Week 30 Minutes 1 Day statistics are rolled up to create one data point every 30 minutes. Theresult is 48 data points every day and 336 data points every week. Every 2hours, the 12 data points collected are aggregated and rolled up as a data pointfor the 1 Month time range.You cannot change the default settings of the 1 Week collection interval.
1 Month 2 Hours 1 Week statistics are rolled up to create one data point every 2 hours. Theresult is 12 data points every day and 360 data points every month (assuminga 30-day month). After 24 hours, the 12 data points collected are aggregatedand rolled up as a data point for the 1 Year time range.You cannot change the default settings of the 1 Month collection interval.
1 Year 1 Day 1 Month statistics are rolled up to create one data point every day. The resultis 365 data points each year.You can change the interval duration and archive length of the 1 Yearcollection interval by configuring the statistics settings.
Chapter 1 Monitoring Inventory Objects with Performance Charts
VMware, Inc. 13
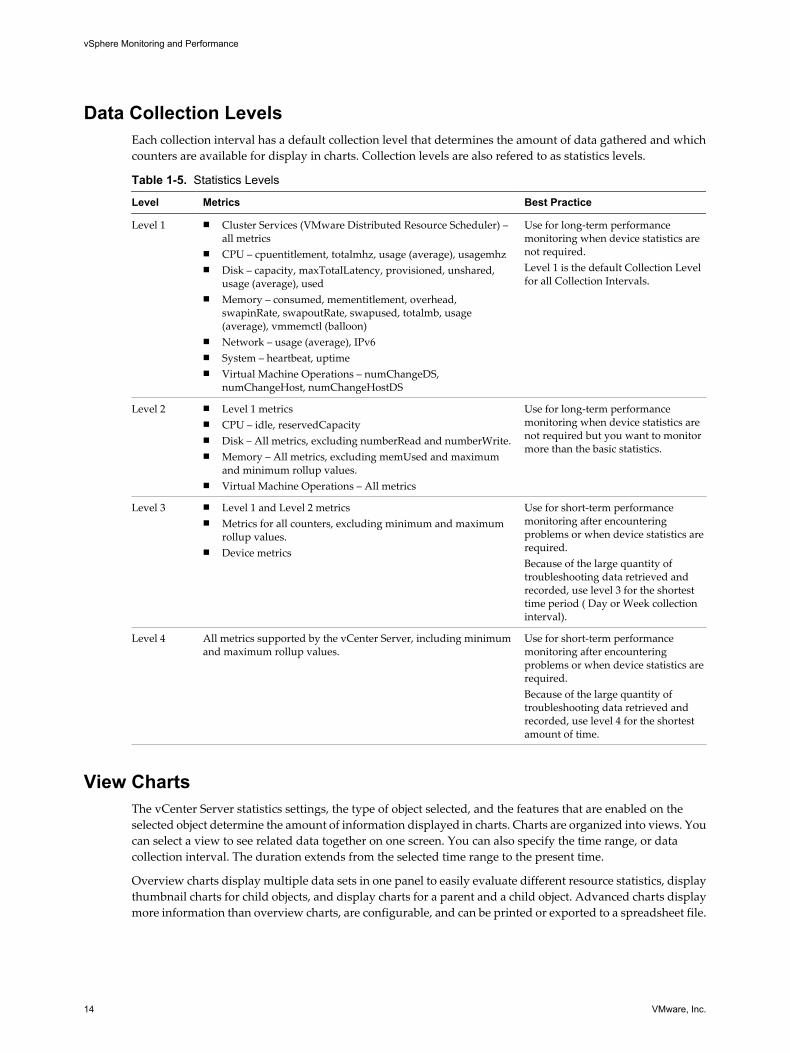
Data Collection LevelsEach collection interval has a default collection level that determines the amount of data gathered and whichcounters are available for display in charts. Collection levels are also refered to as statistics levels.
Table 1-5. Statistics Levels
Level Metrics Best Practice
Level 1 n Cluster Services (VMware Distributed Resource Scheduler) –all metrics
n CPU – cpuentitlement, totalmhz, usage (average), usagemhzn Disk – capacity, maxTotalLatency, provisioned, unshared,
usage (average), usedn Memory – consumed, mementitlement, overhead,
swapinRate, swapoutRate, swapused, totalmb, usage(average), vmmemctl (balloon)
n Network – usage (average), IPv6n System – heartbeat, uptimen Virtual Machine Operations – numChangeDS,
numChangeHost, numChangeHostDS
Use for long-term performancemonitoring when device statistics arenot required.Level 1 is the default Collection Levelfor all Collection Intervals.
Level 2 n Level 1 metricsn CPU – idle, reservedCapacityn Disk – All metrics, excluding numberRead and numberWrite.n Memory – All metrics, excluding memUsed and maximum
and minimum rollup values.n Virtual Machine Operations – All metrics
Use for long-term performancemonitoring when device statistics arenot required but you want to monitormore than the basic statistics.
Level 3 n Level 1 and Level 2 metricsn Metrics for all counters, excluding minimum and maximum
rollup values.n Device metrics
Use for short-term performancemonitoring after encounteringproblems or when device statistics arerequired.Because of the large quantity oftroubleshooting data retrieved andrecorded, use level 3 for the shortesttime period ( Day or Week collectioninterval).
Level 4 All metrics supported by the vCenter Server, including minimumand maximum rollup values.
Use for short-term performancemonitoring after encounteringproblems or when device statistics arerequired.Because of the large quantity oftroubleshooting data retrieved andrecorded, use level 4 for the shortestamount of time.
View ChartsThe vCenter Server statistics settings, the type of object selected, and the features that are enabled on theselected object determine the amount of information displayed in charts. Charts are organized into views. Youcan select a view to see related data together on one screen. You can also specify the time range, or datacollection interval. The duration extends from the selected time range to the present time.
Overview charts display multiple data sets in one panel to easily evaluate different resource statistics, displaythumbnail charts for child objects, and display charts for a parent and a child object. Advanced charts displaymore information than overview charts, are configurable, and can be printed or exported to a spreadsheet file.
vSphere Monitoring and Performance
14 VMware, Inc.
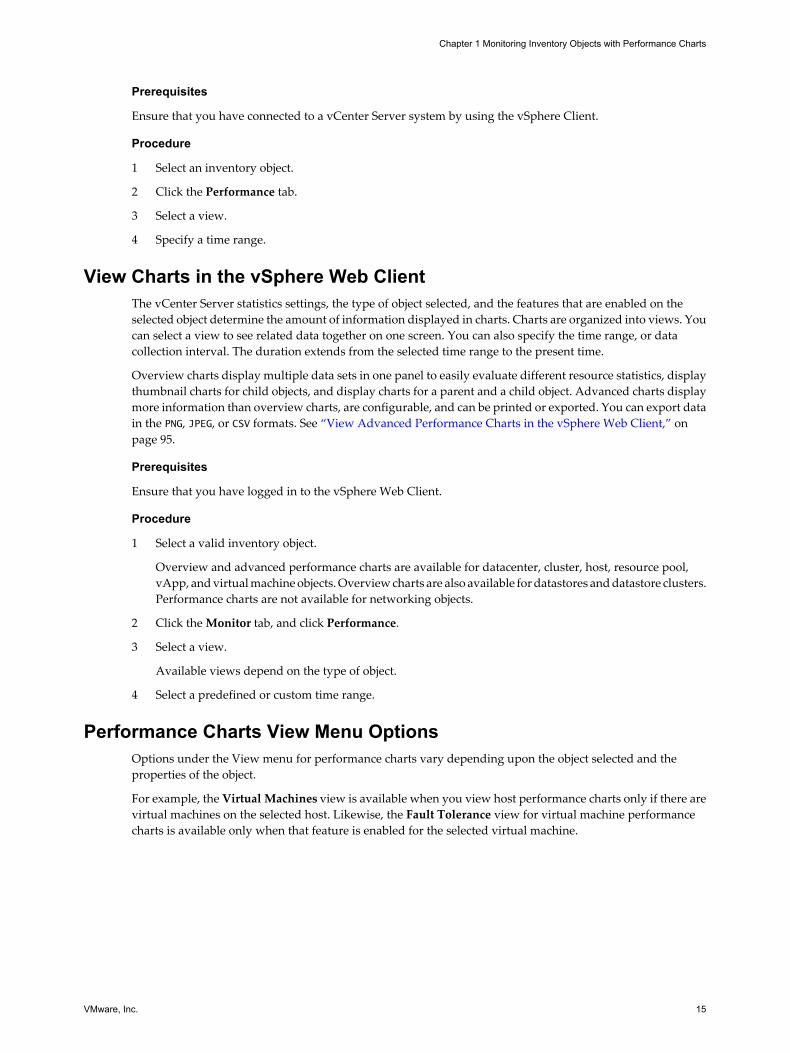
Prerequisites
Ensure that you have connected to a vCenter Server system by using the vSphere Client.
Procedure
1 Select an inventory object.
2 Click the Performance tab.
3 Select a view.
4 Specify a time range.
View Charts in the vSphere Web ClientThe vCenter Server statistics settings, the type of object selected, and the features that are enabled on theselected object determine the amount of information displayed in charts. Charts are organized into views. Youcan select a view to see related data together on one screen. You can also specify the time range, or datacollection interval. The duration extends from the selected time range to the present time.
Overview charts display multiple data sets in one panel to easily evaluate different resource statistics, displaythumbnail charts for child objects, and display charts for a parent and a child object. Advanced charts displaymore information than overview charts, are configurable, and can be printed or exported. You can export datain the PNG, JPEG, or CSV formats. See “View Advanced Performance Charts in the vSphere Web Client,” onpage 95.
Prerequisites
Ensure that you have logged in to the vSphere Web Client.
Procedure
1 Select a valid inventory object.
Overview and advanced performance charts are available for datacenter, cluster, host, resource pool,vApp, and virtual machine objects. Overview charts are also available for datastores and datastore clusters.Performance charts are not available for networking objects.
2 Click the Monitor tab, and click Performance.
3 Select a view.
Available views depend on the type of object.
4 Select a predefined or custom time range.
Performance Charts View Menu OptionsOptions under the View menu for performance charts vary depending upon the object selected and theproperties of the object.
For example, the Virtual Machines view is available when you view host performance charts only if there arevirtual machines on the selected host. Likewise, the Fault Tolerance view for virtual machine performancecharts is available only when that feature is enabled for the selected virtual machine.
Chapter 1 Monitoring Inventory Objects with Performance Charts
VMware, Inc. 15
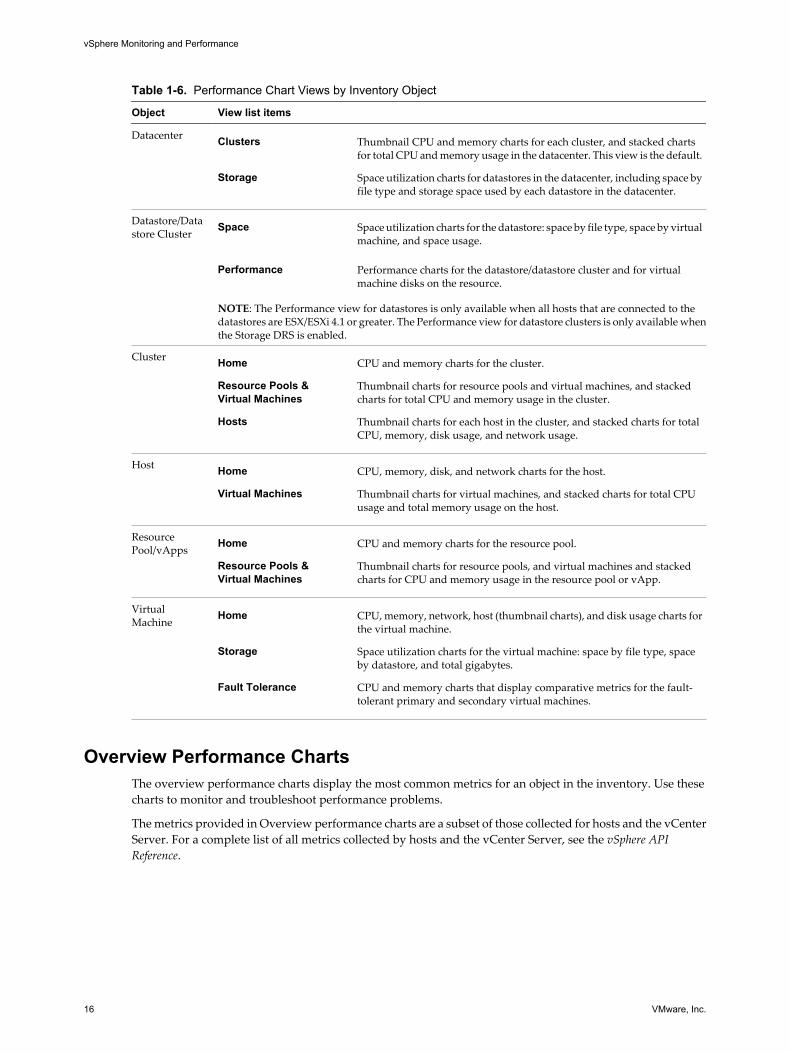
Table 1-6. Performance Chart Views by Inventory Object
Object View list items
Datacenter Clusters Thumbnail CPU and memory charts for each cluster, and stacked chartsfor total CPU and memory usage in the datacenter. This view is the default.
Storage Space utilization charts for datastores in the datacenter, including space byfile type and storage space used by each datastore in the datacenter.
Datastore/Datastore Cluster Space Space utilization charts for the datastore: space by file type, space by virtual
machine, and space usage.
Performance Performance charts for the datastore/datastore cluster and for virtualmachine disks on the resource.
NOTE: The Performance view for datastores is only available when all hosts that are connected to thedatastores are ESX/ESXi 4.1 or greater. The Performance view for datastore clusters is only available whenthe Storage DRS is enabled.
Cluster Home CPU and memory charts for the cluster.
Resource Pools &Virtual Machines
Thumbnail charts for resource pools and virtual machines, and stackedcharts for total CPU and memory usage in the cluster.
Hosts Thumbnail charts for each host in the cluster, and stacked charts for totalCPU, memory, disk usage, and network usage.
Host Home CPU, memory, disk, and network charts for the host.
Virtual Machines Thumbnail charts for virtual machines, and stacked charts for total CPUusage and total memory usage on the host.
ResourcePool/vApps Home CPU and memory charts for the resource pool.
Resource Pools &Virtual Machines
Thumbnail charts for resource pools, and virtual machines and stackedcharts for CPU and memory usage in the resource pool or vApp.
VirtualMachine Home CPU, memory, network, host (thumbnail charts), and disk usage charts for
the virtual machine.
Storage Space utilization charts for the virtual machine: space by file type, spaceby datastore, and total gigabytes.
Fault Tolerance CPU and memory charts that display comparative metrics for the fault-tolerant primary and secondary virtual machines.
Overview Performance ChartsThe overview performance charts display the most common metrics for an object in the inventory. Use thesecharts to monitor and troubleshoot performance problems.
The metrics provided in Overview performance charts are a subset of those collected for hosts and the vCenterServer. For a complete list of all metrics collected by hosts and the vCenter Server, see the vSphere APIReference.
vSphere Monitoring and Performance
16 VMware, Inc.
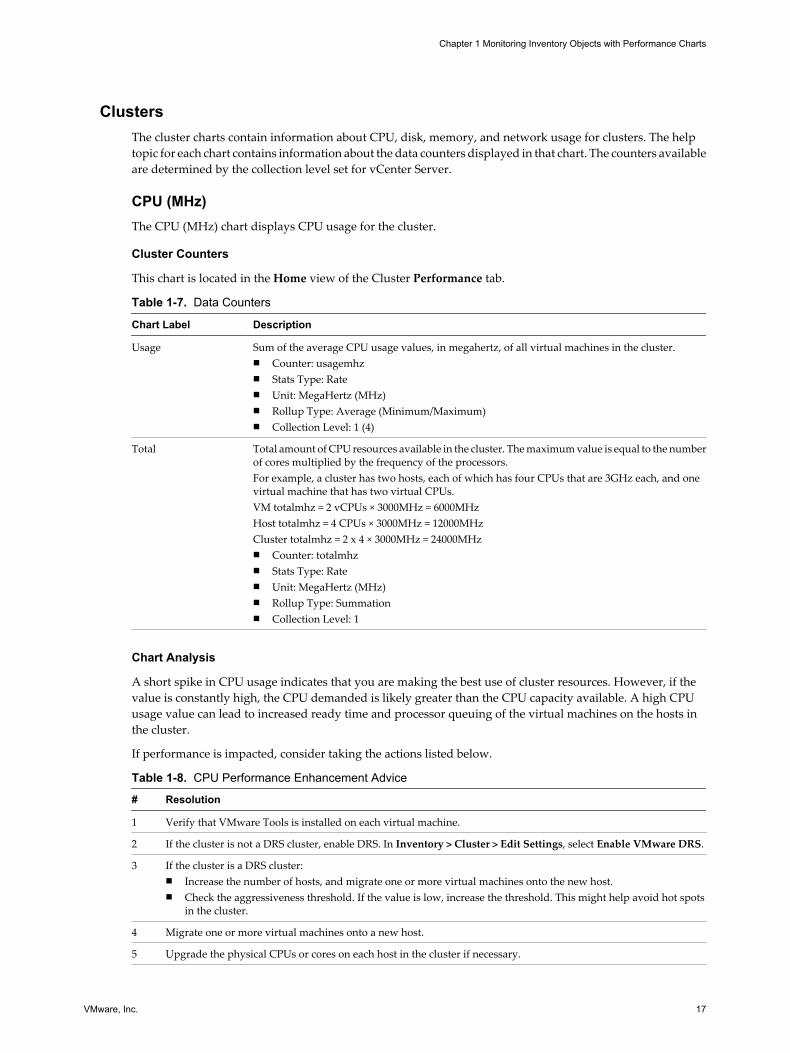
ClustersThe cluster charts contain information about CPU, disk, memory, and network usage for clusters. The helptopic for each chart contains information about the data counters displayed in that chart. The counters availableare determined by the collection level set for vCenter Server.
CPU (MHz)The CPU (MHz) chart displays CPU usage for the cluster.
Cluster Counters
This chart is located in the Home view of the Cluster Performance tab.
Table 1-7. Data Counters
Chart Label Description
Usage Sum of the average CPU usage values, in megahertz, of all virtual machines in the cluster.n Counter: usagemhzn Stats Type: Raten Unit: MegaHertz (MHz)n Rollup Type: Average (Minimum/Maximum)n Collection Level: 1 (4)
Total Total amount of CPU resources available in the cluster. The maximum value is equal to the numberof cores multiplied by the frequency of the processors.For example, a cluster has two hosts, each of which has four CPUs that are 3GHz each, and onevirtual machine that has two virtual CPUs.VM totalmhz = 2 vCPUs × 3000MHz = 6000MHzHost totalmhz = 4 CPUs × 3000MHz = 12000MHzCluster totalmhz = 2 x 4 × 3000MHz = 24000MHzn Counter: totalmhzn Stats Type: Raten Unit: MegaHertz (MHz)n Rollup Type: Summationn Collection Level: 1
Chart Analysis
A short spike in CPU usage indicates that you are making the best use of cluster resources. However, if thevalue is constantly high, the CPU demanded is likely greater than the CPU capacity available. A high CPUusage value can lead to increased ready time and processor queuing of the virtual machines on the hosts inthe cluster.
If performance is impacted, consider taking the actions listed below.
Table 1-8. CPU Performance Enhancement Advice
# Resolution
1 Verify that VMware Tools is installed on each virtual machine.
2 If the cluster is not a DRS cluster, enable DRS. In Inventory > Cluster > Edit Settings, select Enable VMware DRS.
3 If the cluster is a DRS cluster:n Increase the number of hosts, and migrate one or more virtual machines onto the new host.n Check the aggressiveness threshold. If the value is low, increase the threshold. This might help avoid hot spots
in the cluster.
4 Migrate one or more virtual machines onto a new host.
5 Upgrade the physical CPUs or cores on each host in the cluster if necessary.
Chapter 1 Monitoring Inventory Objects with Performance Charts
VMware, Inc. 17
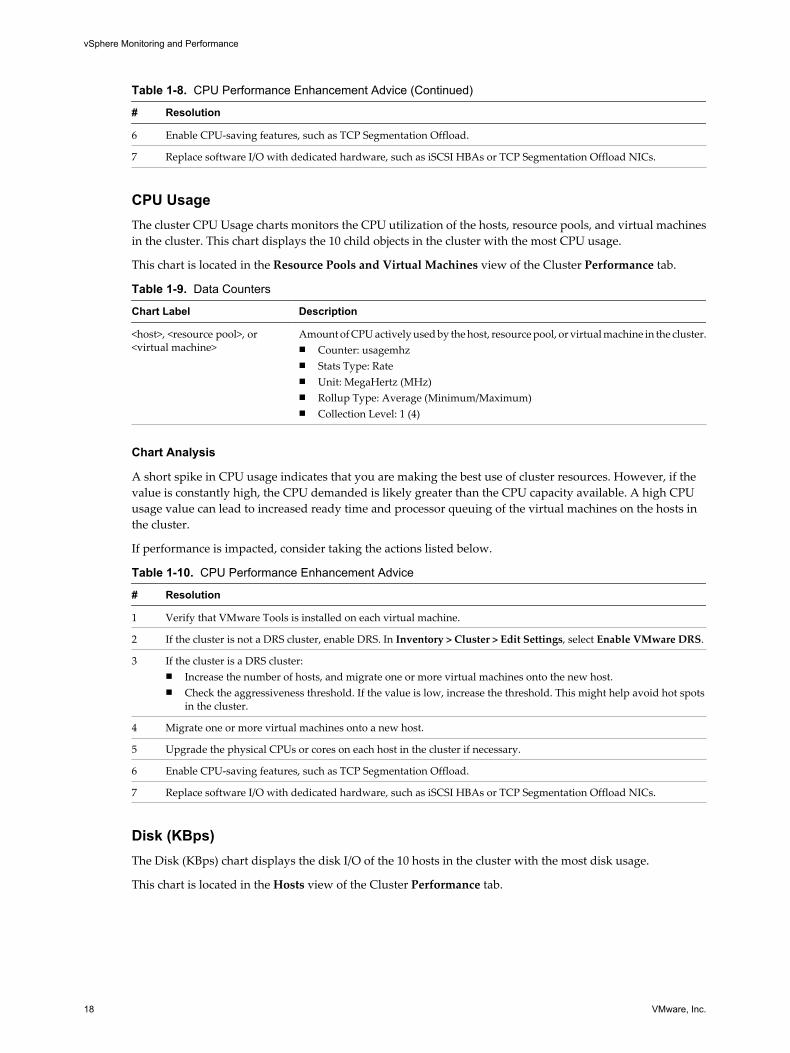
Table 1-8. CPU Performance Enhancement Advice (Continued)
# Resolution
6 Enable CPU-saving features, such as TCP Segmentation Offload.
7 Replace software I/O with dedicated hardware, such as iSCSI HBAs or TCP Segmentation Offload NICs.
CPU UsageThe cluster CPU Usage charts monitors the CPU utilization of the hosts, resource pools, and virtual machinesin the cluster. This chart displays the 10 child objects in the cluster with the most CPU usage.
This chart is located in the Resource Pools and Virtual Machines view of the Cluster Performance tab.
Table 1-9. Data Counters
Chart Label Description
<host>, <resource pool>, or<virtual machine>
Amount of CPU actively used by the host, resource pool, or virtual machine in the cluster.n Counter: usagemhzn Stats Type: Raten Unit: MegaHertz (MHz)n Rollup Type: Average (Minimum/Maximum)n Collection Level: 1 (4)
Chart Analysis
A short spike in CPU usage indicates that you are making the best use of cluster resources. However, if thevalue is constantly high, the CPU demanded is likely greater than the CPU capacity available. A high CPUusage value can lead to increased ready time and processor queuing of the virtual machines on the hosts inthe cluster.
If performance is impacted, consider taking the actions listed below.
Table 1-10. CPU Performance Enhancement Advice
# Resolution
1 Verify that VMware Tools is installed on each virtual machine.
2 If the cluster is not a DRS cluster, enable DRS. In Inventory > Cluster > Edit Settings, select Enable VMware DRS.
3 If the cluster is a DRS cluster:n Increase the number of hosts, and migrate one or more virtual machines onto the new host.n Check the aggressiveness threshold. If the value is low, increase the threshold. This might help avoid hot spots
in the cluster.
4 Migrate one or more virtual machines onto a new host.
5 Upgrade the physical CPUs or cores on each host in the cluster if necessary.
6 Enable CPU-saving features, such as TCP Segmentation Offload.
7 Replace software I/O with dedicated hardware, such as iSCSI HBAs or TCP Segmentation Offload NICs.
Disk (KBps)The Disk (KBps) chart displays the disk I/O of the 10 hosts in the cluster with the most disk usage.
This chart is located in the Hosts view of the Cluster Performance tab.
vSphere Monitoring and Performance
18 VMware, Inc.
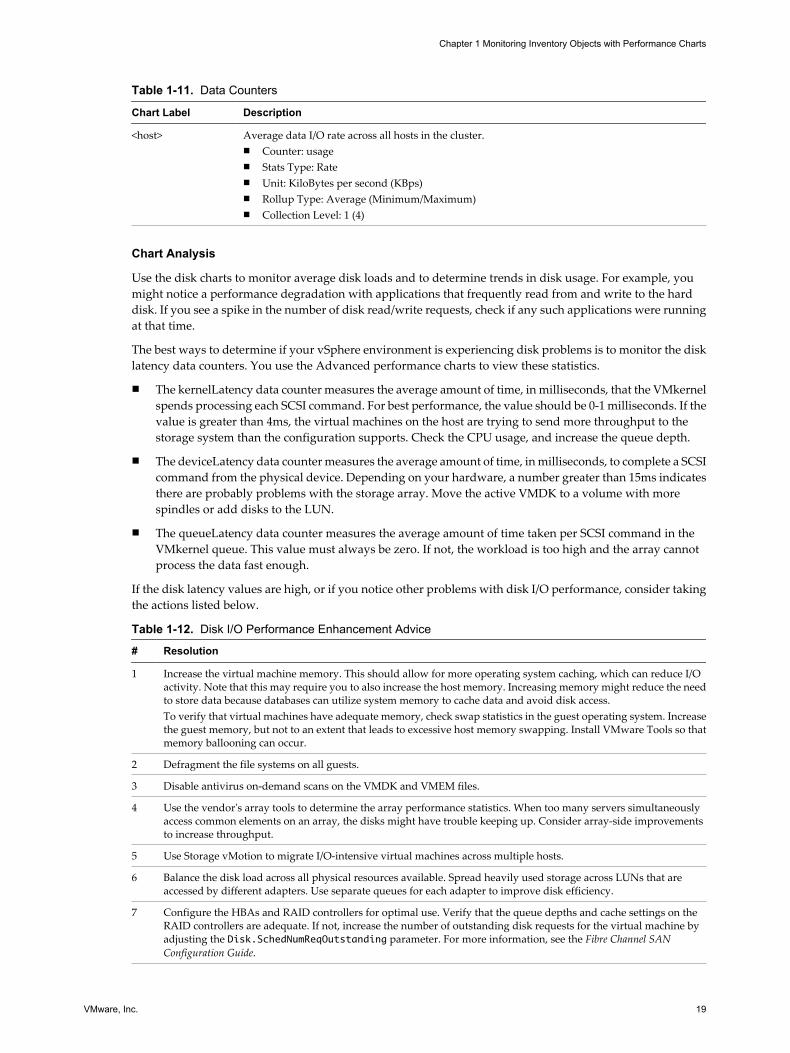
Table 1-11. Data Counters
Chart Label Description
<host> Average data I/O rate across all hosts in the cluster.n Counter: usagen Stats Type: Raten Unit: KiloBytes per second (KBps)n Rollup Type: Average (Minimum/Maximum)n Collection Level: 1 (4)
Chart Analysis
Use the disk charts to monitor average disk loads and to determine trends in disk usage. For example, youmight notice a performance degradation with applications that frequently read from and write to the harddisk. If you see a spike in the number of disk read/write requests, check if any such applications were runningat that time.
The best ways to determine if your vSphere environment is experiencing disk problems is to monitor the disklatency data counters. You use the Advanced performance charts to view these statistics.
n The kernelLatency data counter measures the average amount of time, in milliseconds, that the VMkernelspends processing each SCSI command. For best performance, the value should be 0-1 milliseconds. If thevalue is greater than 4ms, the virtual machines on the host are trying to send more throughput to thestorage system than the configuration supports. Check the CPU usage, and increase the queue depth.
n The deviceLatency data counter measures the average amount of time, in milliseconds, to complete a SCSIcommand from the physical device. Depending on your hardware, a number greater than 15ms indicatesthere are probably problems with the storage array. Move the active VMDK to a volume with morespindles or add disks to the LUN.
n The queueLatency data counter measures the average amount of time taken per SCSI command in theVMkernel queue. This value must always be zero. If not, the workload is too high and the array cannotprocess the data fast enough.
If the disk latency values are high, or if you notice other problems with disk I/O performance, consider takingthe actions listed below.
Table 1-12. Disk I/O Performance Enhancement Advice
# Resolution
1 Increase the virtual machine memory. This should allow for more operating system caching, which can reduce I/Oactivity. Note that this may require you to also increase the host memory. Increasing memory might reduce the needto store data because databases can utilize system memory to cache data and avoid disk access.To verify that virtual machines have adequate memory, check swap statistics in the guest operating system. Increasethe guest memory, but not to an extent that leads to excessive host memory swapping. Install VMware Tools so thatmemory ballooning can occur.
2 Defragment the file systems on all guests.
3 Disable antivirus on-demand scans on the VMDK and VMEM files.
4 Use the vendor's array tools to determine the array performance statistics. When too many servers simultaneouslyaccess common elements on an array, the disks might have trouble keeping up. Consider array-side improvementsto increase throughput.
5 Use Storage vMotion to migrate I/O-intensive virtual machines across multiple hosts.
6 Balance the disk load across all physical resources available. Spread heavily used storage across LUNs that areaccessed by different adapters. Use separate queues for each adapter to improve disk efficiency.
7 Configure the HBAs and RAID controllers for optimal use. Verify that the queue depths and cache settings on theRAID controllers are adequate. If not, increase the number of outstanding disk requests for the virtual machine byadjusting the Disk.SchedNumReqOutstanding parameter. For more information, see the Fibre Channel SANConfiguration Guide.
Chapter 1 Monitoring Inventory Objects with Performance Charts
VMware, Inc. 19
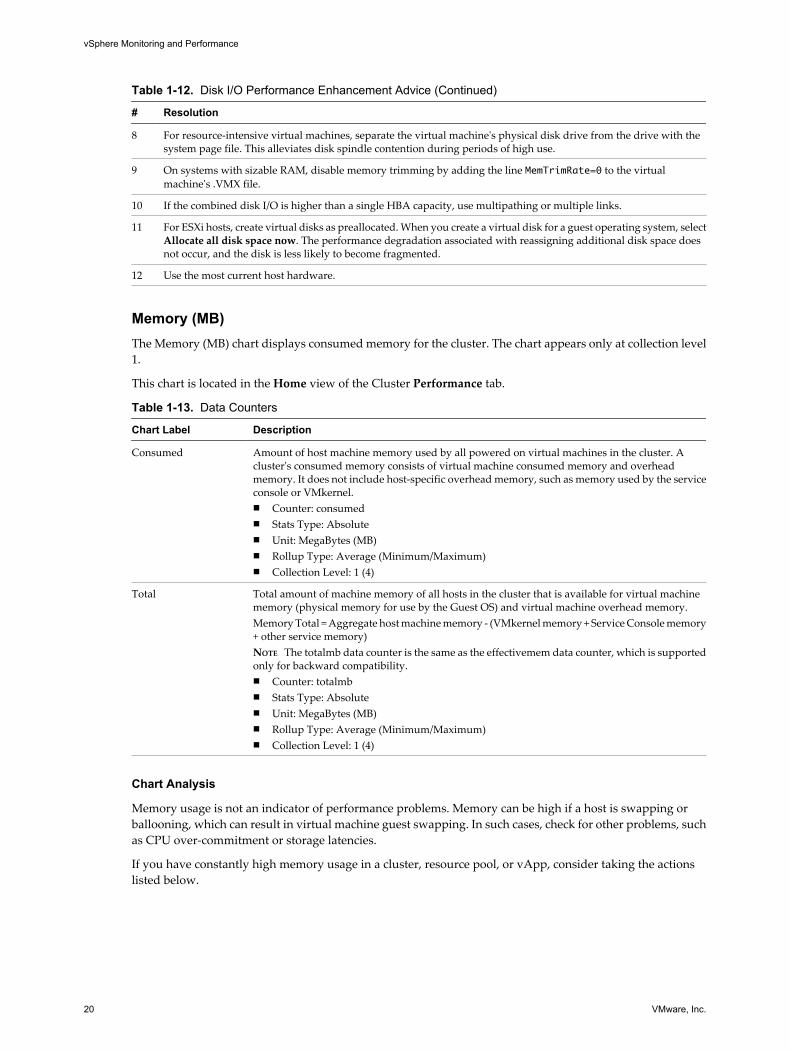
Table 1-12. Disk I/O Performance Enhancement Advice (Continued)
# Resolution
8 For resource-intensive virtual machines, separate the virtual machine's physical disk drive from the drive with thesystem page file. This alleviates disk spindle contention during periods of high use.
9 On systems with sizable RAM, disable memory trimming by adding the line MemTrimRate=0 to the virtualmachine's .VMX file.
10 If the combined disk I/O is higher than a single HBA capacity, use multipathing or multiple links.
11 For ESXi hosts, create virtual disks as preallocated. When you create a virtual disk for a guest operating system, selectAllocate all disk space now. The performance degradation associated with reassigning additional disk space doesnot occur, and the disk is less likely to become fragmented.
12 Use the most current host hardware.
Memory (MB)The Memory (MB) chart displays consumed memory for the cluster. The chart appears only at collection level1.
This chart is located in the Home view of the Cluster Performance tab.
Table 1-13. Data Counters
Chart Label Description
Consumed Amount of host machine memory used by all powered on virtual machines in the cluster. Acluster's consumed memory consists of virtual machine consumed memory and overheadmemory. It does not include host-specific overhead memory, such as memory used by the serviceconsole or VMkernel.n Counter: consumedn Stats Type: Absoluten Unit: MegaBytes (MB)n Rollup Type: Average (Minimum/Maximum)n Collection Level: 1 (4)
Total Total amount of machine memory of all hosts in the cluster that is available for virtual machinememory (physical memory for use by the Guest OS) and virtual machine overhead memory.Memory Total = Aggregate host machine memory - (VMkernel memory + Service Console memory+ other service memory)NOTE The totalmb data counter is the same as the effectivemem data counter, which is supportedonly for backward compatibility.n Counter: totalmbn Stats Type: Absoluten Unit: MegaBytes (MB)n Rollup Type: Average (Minimum/Maximum)n Collection Level: 1 (4)
Chart Analysis
Memory usage is not an indicator of performance problems. Memory can be high if a host is swapping orballooning, which can result in virtual machine guest swapping. In such cases, check for other problems, suchas CPU over-commitment or storage latencies.
If you have constantly high memory usage in a cluster, resource pool, or vApp, consider taking the actionslisted below.
vSphere Monitoring and Performance
20 VMware, Inc.
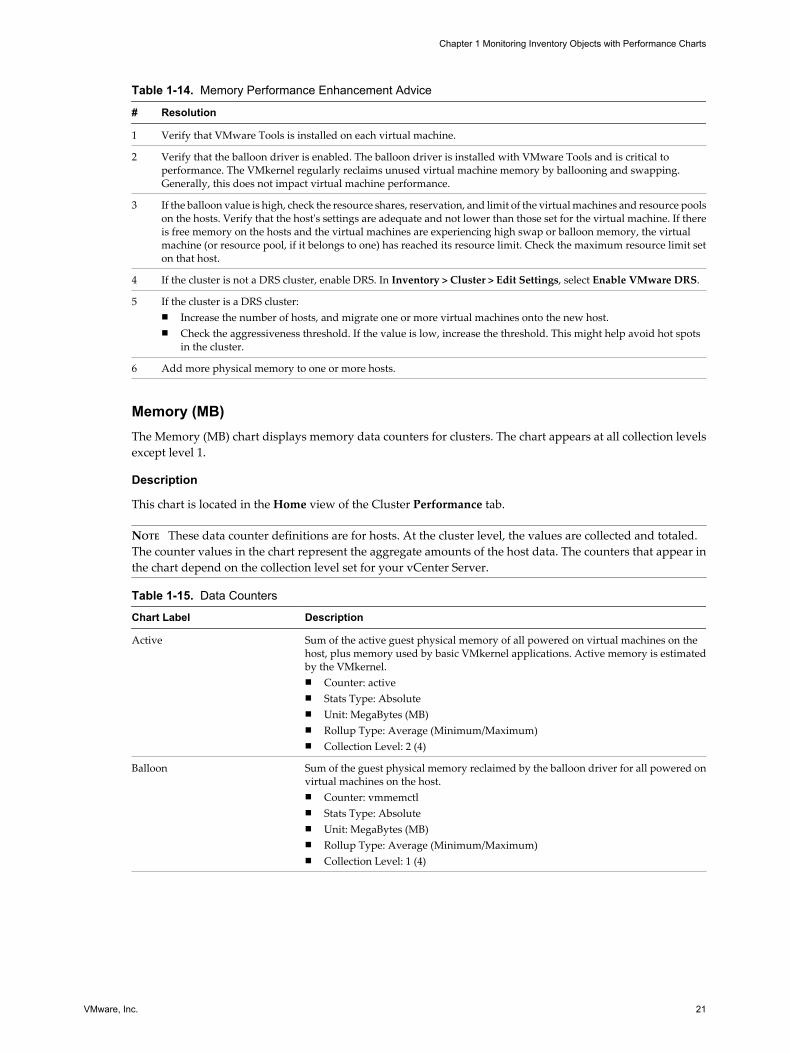
Table 1-14. Memory Performance Enhancement Advice
# Resolution
1 Verify that VMware Tools is installed on each virtual machine.
2 Verify that the balloon driver is enabled. The balloon driver is installed with VMware Tools and is critical toperformance. The VMkernel regularly reclaims unused virtual machine memory by ballooning and swapping.Generally, this does not impact virtual machine performance.
3 If the balloon value is high, check the resource shares, reservation, and limit of the virtual machines and resource poolson the hosts. Verify that the host's settings are adequate and not lower than those set for the virtual machine. If thereis free memory on the hosts and the virtual machines are experiencing high swap or balloon memory, the virtualmachine (or resource pool, if it belongs to one) has reached its resource limit. Check the maximum resource limit seton that host.
4 If the cluster is not a DRS cluster, enable DRS. In Inventory > Cluster > Edit Settings, select Enable VMware DRS.
5 If the cluster is a DRS cluster:n Increase the number of hosts, and migrate one or more virtual machines onto the new host.n Check the aggressiveness threshold. If the value is low, increase the threshold. This might help avoid hot spots
in the cluster.
6 Add more physical memory to one or more hosts.
Memory (MB)The Memory (MB) chart displays memory data counters for clusters. The chart appears at all collection levelsexcept level 1.
Description
This chart is located in the Home view of the Cluster Performance tab.
NOTE These data counter definitions are for hosts. At the cluster level, the values are collected and totaled.The counter values in the chart represent the aggregate amounts of the host data. The counters that appear inthe chart depend on the collection level set for your vCenter Server.
Table 1-15. Data Counters
Chart Label Description
Active Sum of the active guest physical memory of all powered on virtual machines on thehost, plus memory used by basic VMkernel applications. Active memory is estimatedby the VMkernel.n Counter: activen Stats Type: Absoluten Unit: MegaBytes (MB)n Rollup Type: Average (Minimum/Maximum)n Collection Level: 2 (4)
Balloon Sum of the guest physical memory reclaimed by the balloon driver for all powered onvirtual machines on the host.n Counter: vmmemctln Stats Type: Absoluten Unit: MegaBytes (MB)n Rollup Type: Average (Minimum/Maximum)n Collection Level: 1 (4)
Chapter 1 Monitoring Inventory Objects with Performance Charts
VMware, Inc. 21
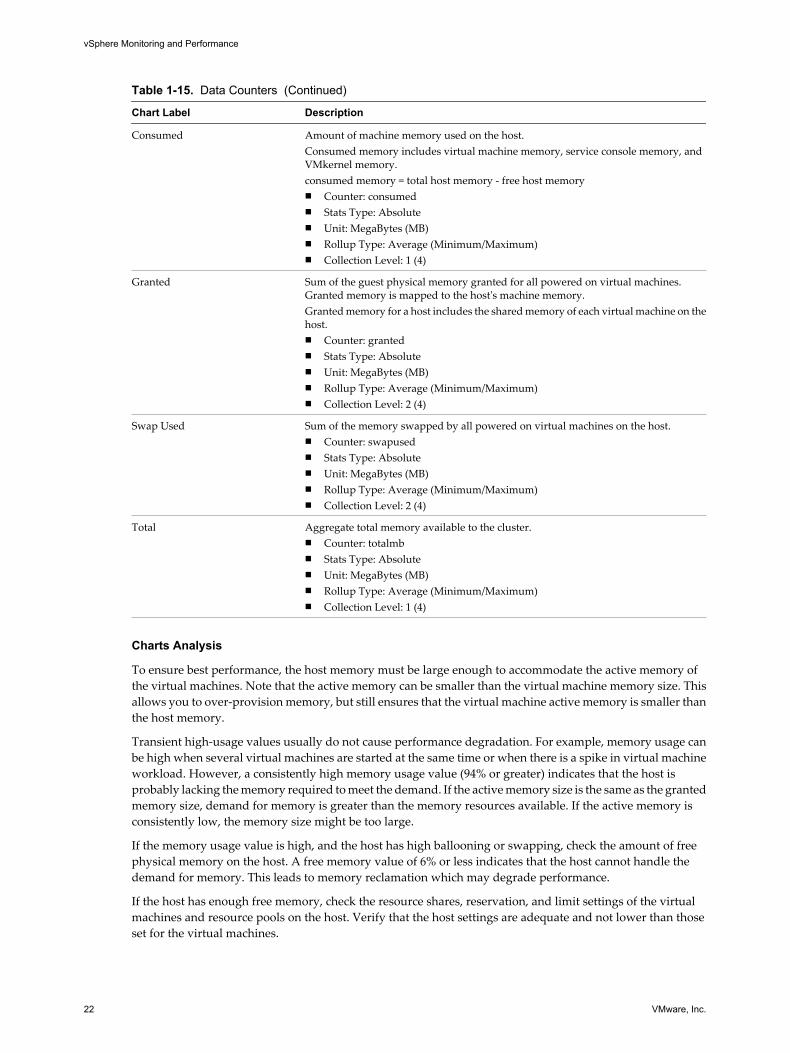
Table 1-15. Data Counters (Continued)
Chart Label Description
Consumed Amount of machine memory used on the host.Consumed memory includes virtual machine memory, service console memory, andVMkernel memory.consumed memory = total host memory - free host memoryn Counter: consumedn Stats Type: Absoluten Unit: MegaBytes (MB)n Rollup Type: Average (Minimum/Maximum)n Collection Level: 1 (4)
Granted Sum of the guest physical memory granted for all powered on virtual machines.Granted memory is mapped to the host's machine memory.Granted memory for a host includes the shared memory of each virtual machine on thehost.n Counter: grantedn Stats Type: Absoluten Unit: MegaBytes (MB)n Rollup Type: Average (Minimum/Maximum)n Collection Level: 2 (4)
Swap Used Sum of the memory swapped by all powered on virtual machines on the host.n Counter: swapusedn Stats Type: Absoluten Unit: MegaBytes (MB)n Rollup Type: Average (Minimum/Maximum)n Collection Level: 2 (4)
Total Aggregate total memory available to the cluster.n Counter: totalmbn Stats Type: Absoluten Unit: MegaBytes (MB)n Rollup Type: Average (Minimum/Maximum)n Collection Level: 1 (4)
Charts Analysis
To ensure best performance, the host memory must be large enough to accommodate the active memory ofthe virtual machines. Note that the active memory can be smaller than the virtual machine memory size. Thisallows you to over-provision memory, but still ensures that the virtual machine active memory is smaller thanthe host memory.
Transient high-usage values usually do not cause performance degradation. For example, memory usage canbe high when several virtual machines are started at the same time or when there is a spike in virtual machineworkload. However, a consistently high memory usage value (94% or greater) indicates that the host isprobably lacking the memory required to meet the demand. If the active memory size is the same as the grantedmemory size, demand for memory is greater than the memory resources available. If the active memory isconsistently low, the memory size might be too large.
If the memory usage value is high, and the host has high ballooning or swapping, check the amount of freephysical memory on the host. A free memory value of 6% or less indicates that the host cannot handle thedemand for memory. This leads to memory reclamation which may degrade performance.
If the host has enough free memory, check the resource shares, reservation, and limit settings of the virtualmachines and resource pools on the host. Verify that the host settings are adequate and not lower than thoseset for the virtual machines.
vSphere Monitoring and Performance
22 VMware, Inc.
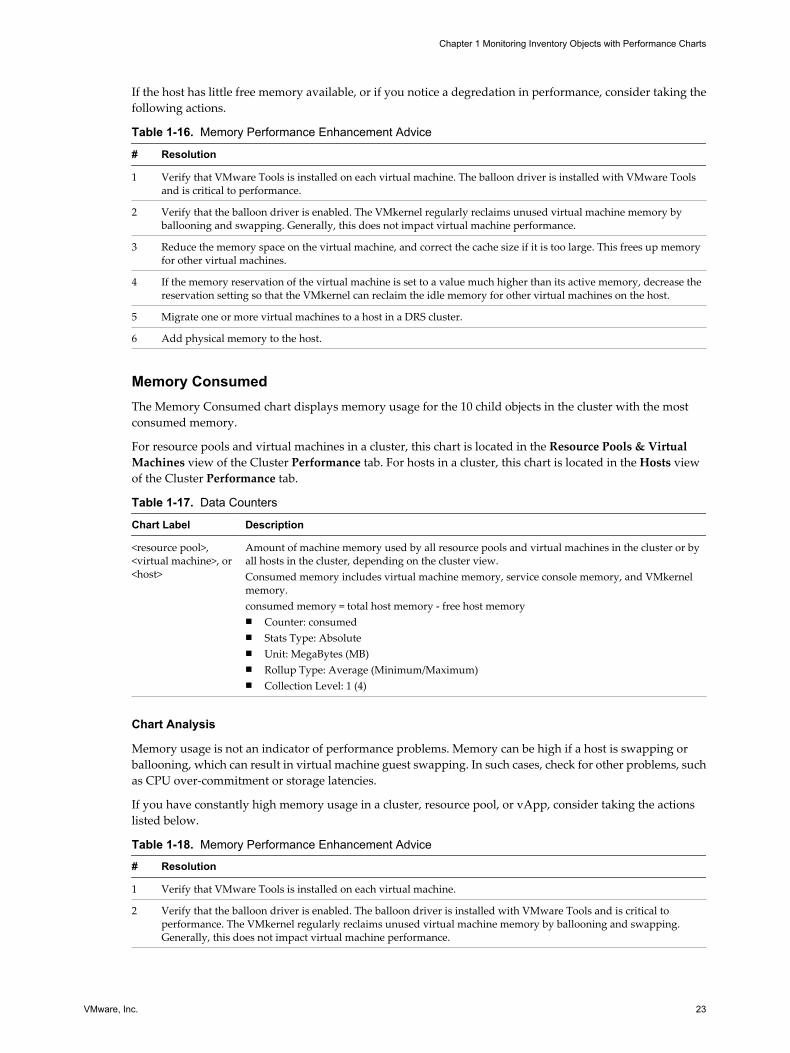
If the host has little free memory available, or if you notice a degredation in performance, consider taking thefollowing actions.
Table 1-16. Memory Performance Enhancement Advice
# Resolution
1 Verify that VMware Tools is installed on each virtual machine. The balloon driver is installed with VMware Toolsand is critical to performance.
2 Verify that the balloon driver is enabled. The VMkernel regularly reclaims unused virtual machine memory byballooning and swapping. Generally, this does not impact virtual machine performance.
3 Reduce the memory space on the virtual machine, and correct the cache size if it is too large. This frees up memoryfor other virtual machines.
4 If the memory reservation of the virtual machine is set to a value much higher than its active memory, decrease thereservation setting so that the VMkernel can reclaim the idle memory for other virtual machines on the host.
5 Migrate one or more virtual machines to a host in a DRS cluster.
6 Add physical memory to the host.
Memory ConsumedThe Memory Consumed chart displays memory usage for the 10 child objects in the cluster with the mostconsumed memory.
For resource pools and virtual machines in a cluster, this chart is located in the Resource Pools & VirtualMachines view of the Cluster Performance tab. For hosts in a cluster, this chart is located in the Hosts viewof the Cluster Performance tab.
Table 1-17. Data Counters
Chart Label Description
<resource pool>,<virtual machine>, or<host>
Amount of machine memory used by all resource pools and virtual machines in the cluster or byall hosts in the cluster, depending on the cluster view.Consumed memory includes virtual machine memory, service console memory, and VMkernelmemory.consumed memory = total host memory - free host memoryn Counter: consumedn Stats Type: Absoluten Unit: MegaBytes (MB)n Rollup Type: Average (Minimum/Maximum)n Collection Level: 1 (4)
Chart Analysis
Memory usage is not an indicator of performance problems. Memory can be high if a host is swapping orballooning, which can result in virtual machine guest swapping. In such cases, check for other problems, suchas CPU over-commitment or storage latencies.
If you have constantly high memory usage in a cluster, resource pool, or vApp, consider taking the actionslisted below.
Table 1-18. Memory Performance Enhancement Advice
# Resolution
1 Verify that VMware Tools is installed on each virtual machine.
2 Verify that the balloon driver is enabled. The balloon driver is installed with VMware Tools and is critical toperformance. The VMkernel regularly reclaims unused virtual machine memory by ballooning and swapping.Generally, this does not impact virtual machine performance.
Chapter 1 Monitoring Inventory Objects with Performance Charts
VMware, Inc. 23
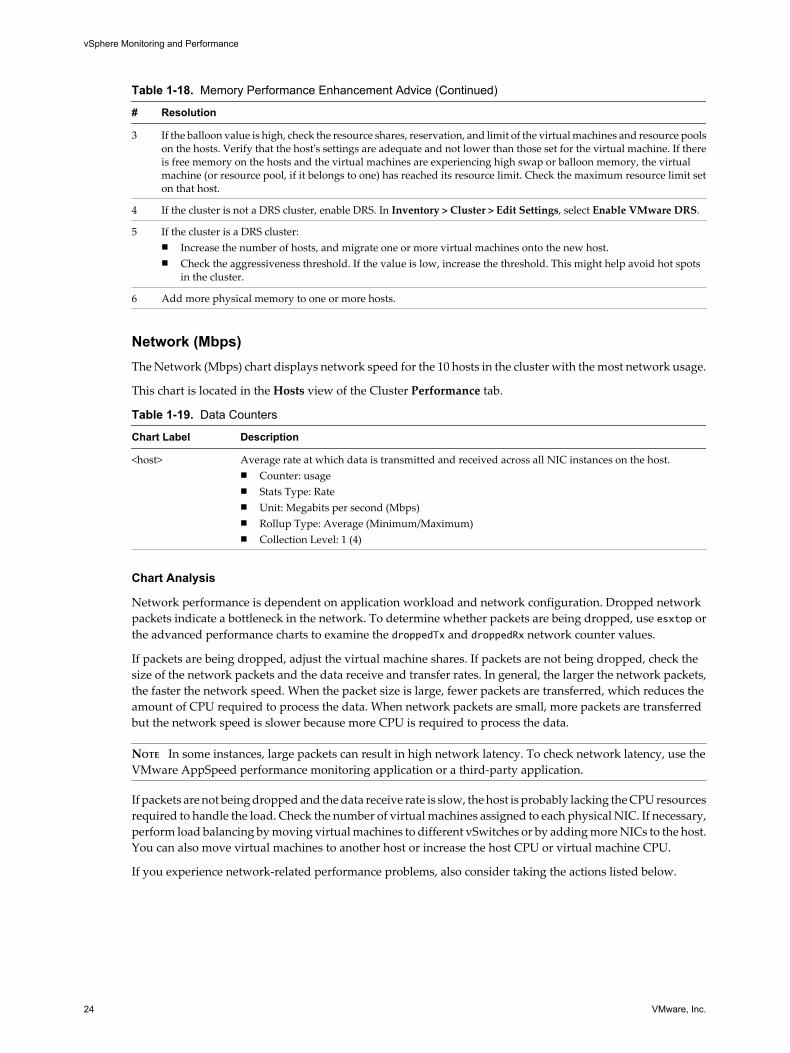
Table 1-18. Memory Performance Enhancement Advice (Continued)
# Resolution
3 If the balloon value is high, check the resource shares, reservation, and limit of the virtual machines and resource poolson the hosts. Verify that the host's settings are adequate and not lower than those set for the virtual machine. If thereis free memory on the hosts and the virtual machines are experiencing high swap or balloon memory, the virtualmachine (or resource pool, if it belongs to one) has reached its resource limit. Check the maximum resource limit seton that host.
4 If the cluster is not a DRS cluster, enable DRS. In Inventory > Cluster > Edit Settings, select Enable VMware DRS.
5 If the cluster is a DRS cluster:n Increase the number of hosts, and migrate one or more virtual machines onto the new host.n Check the aggressiveness threshold. If the value is low, increase the threshold. This might help avoid hot spots
in the cluster.
6 Add more physical memory to one or more hosts.
Network (Mbps)The Network (Mbps) chart displays network speed for the 10 hosts in the cluster with the most network usage.
This chart is located in the Hosts view of the Cluster Performance tab.
Table 1-19. Data Counters
Chart Label Description
<host> Average rate at which data is transmitted and received across all NIC instances on the host.n Counter: usagen Stats Type: Raten Unit: Megabits per second (Mbps)n Rollup Type: Average (Minimum/Maximum)n Collection Level: 1 (4)
Chart Analysis
Network performance is dependent on application workload and network configuration. Dropped networkpackets indicate a bottleneck in the network. To determine whether packets are being dropped, use esxtop orthe advanced performance charts to examine the droppedTx and droppedRx network counter values.
If packets are being dropped, adjust the virtual machine shares. If packets are not being dropped, check thesize of the network packets and the data receive and transfer rates. In general, the larger the network packets,the faster the network speed. When the packet size is large, fewer packets are transferred, which reduces theamount of CPU required to process the data. When network packets are small, more packets are transferredbut the network speed is slower because more CPU is required to process the data.
NOTE In some instances, large packets can result in high network latency. To check network latency, use theVMware AppSpeed performance monitoring application or a third-party application.
If packets are not being dropped and the data receive rate is slow, the host is probably lacking the CPU resourcesrequired to handle the load. Check the number of virtual machines assigned to each physical NIC. If necessary,perform load balancing by moving virtual machines to different vSwitches or by adding more NICs to the host.You can also move virtual machines to another host or increase the host CPU or virtual machine CPU.
If you experience network-related performance problems, also consider taking the actions listed below.
vSphere Monitoring and Performance
24 VMware, Inc.
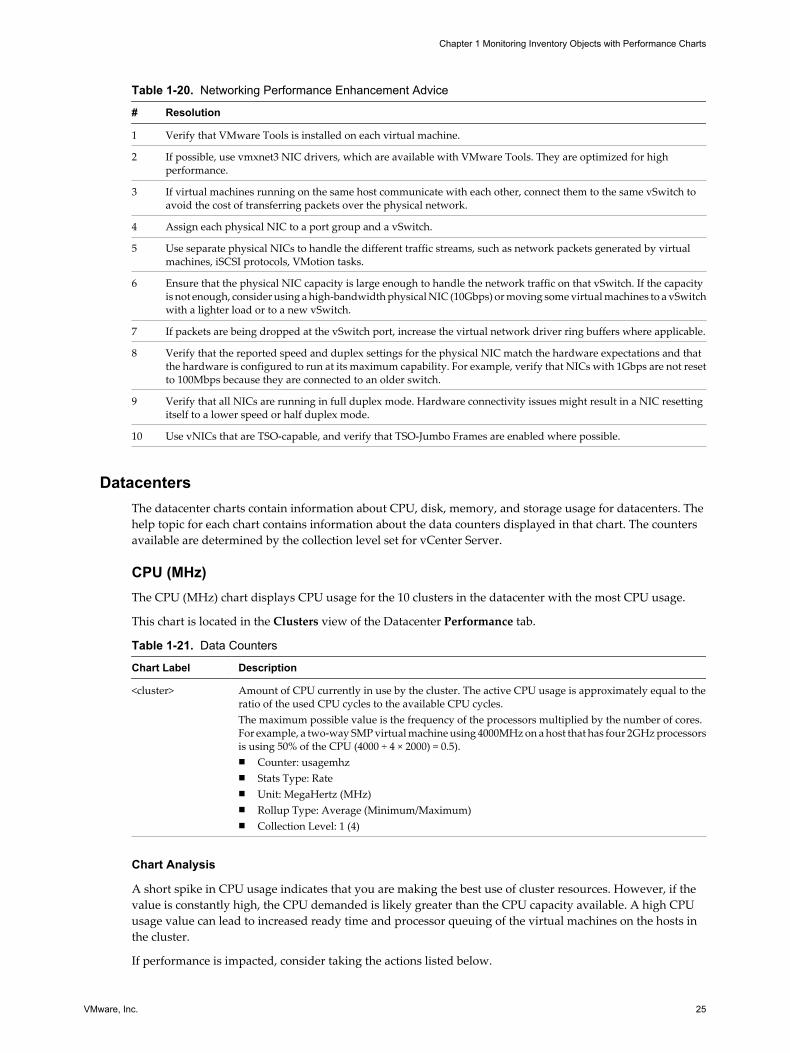
Table 1-20. Networking Performance Enhancement Advice
# Resolution
1 Verify that VMware Tools is installed on each virtual machine.
2 If possible, use vmxnet3 NIC drivers, which are available with VMware Tools. They are optimized for highperformance.
3 If virtual machines running on the same host communicate with each other, connect them to the same vSwitch toavoid the cost of transferring packets over the physical network.
4 Assign each physical NIC to a port group and a vSwitch.
5 Use separate physical NICs to handle the different traffic streams, such as network packets generated by virtualmachines, iSCSI protocols, VMotion tasks.
6 Ensure that the physical NIC capacity is large enough to handle the network traffic on that vSwitch. If the capacityis not enough, consider using a high-bandwidth physical NIC (10Gbps) or moving some virtual machines to a vSwitchwith a lighter load or to a new vSwitch.
7 If packets are being dropped at the vSwitch port, increase the virtual network driver ring buffers where applicable.
8 Verify that the reported speed and duplex settings for the physical NIC match the hardware expectations and thatthe hardware is configured to run at its maximum capability. For example, verify that NICs with 1Gbps are not resetto 100Mbps because they are connected to an older switch.
9 Verify that all NICs are running in full duplex mode. Hardware connectivity issues might result in a NIC resettingitself to a lower speed or half duplex mode.
10 Use vNICs that are TSO-capable, and verify that TSO-Jumbo Frames are enabled where possible.
DatacentersThe datacenter charts contain information about CPU, disk, memory, and storage usage for datacenters. Thehelp topic for each chart contains information about the data counters displayed in that chart. The countersavailable are determined by the collection level set for vCenter Server.
CPU (MHz)The CPU (MHz) chart displays CPU usage for the 10 clusters in the datacenter with the most CPU usage.
This chart is located in the Clusters view of the Datacenter Performance tab.
Table 1-21. Data Counters
Chart Label Description
<cluster> Amount of CPU currently in use by the cluster. The active CPU usage is approximately equal to theratio of the used CPU cycles to the available CPU cycles.The maximum possible value is the frequency of the processors multiplied by the number of cores.For example, a two-way SMP virtual machine using 4000MHz on a host that has four 2GHz processorsis using 50% of the CPU (4000 ÷ 4 × 2000) = 0.5).n Counter: usagemhzn Stats Type: Raten Unit: MegaHertz (MHz)n Rollup Type: Average (Minimum/Maximum)n Collection Level: 1 (4)
Chart Analysis
A short spike in CPU usage indicates that you are making the best use of cluster resources. However, if thevalue is constantly high, the CPU demanded is likely greater than the CPU capacity available. A high CPUusage value can lead to increased ready time and processor queuing of the virtual machines on the hosts inthe cluster.
If performance is impacted, consider taking the actions listed below.
Chapter 1 Monitoring Inventory Objects with Performance Charts
VMware, Inc. 25
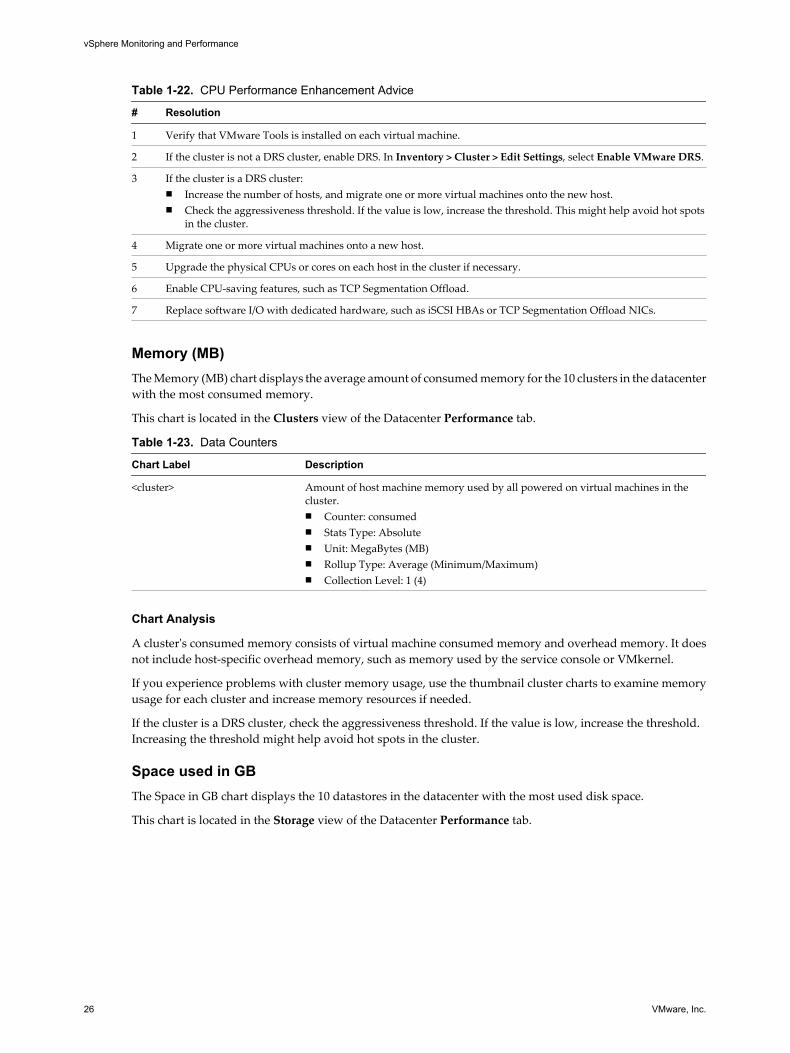
Table 1-22. CPU Performance Enhancement Advice
# Resolution
1 Verify that VMware Tools is installed on each virtual machine.
2 If the cluster is not a DRS cluster, enable DRS. In Inventory > Cluster > Edit Settings, select Enable VMware DRS.
3 If the cluster is a DRS cluster:n Increase the number of hosts, and migrate one or more virtual machines onto the new host.n Check the aggressiveness threshold. If the value is low, increase the threshold. This might help avoid hot spots
in the cluster.
4 Migrate one or more virtual machines onto a new host.
5 Upgrade the physical CPUs or cores on each host in the cluster if necessary.
6 Enable CPU-saving features, such as TCP Segmentation Offload.
7 Replace software I/O with dedicated hardware, such as iSCSI HBAs or TCP Segmentation Offload NICs.
Memory (MB)The Memory (MB) chart displays the average amount of consumed memory for the 10 clusters in the datacenterwith the most consumed memory.
This chart is located in the Clusters view of the Datacenter Performance tab.
Table 1-23. Data Counters
Chart Label Description
<cluster> Amount of host machine memory used by all powered on virtual machines in thecluster.n Counter: consumedn Stats Type: Absoluten Unit: MegaBytes (MB)n Rollup Type: Average (Minimum/Maximum)n Collection Level: 1 (4)
Chart Analysis
A cluster's consumed memory consists of virtual machine consumed memory and overhead memory. It doesnot include host-specific overhead memory, such as memory used by the service console or VMkernel.
If you experience problems with cluster memory usage, use the thumbnail cluster charts to examine memoryusage for each cluster and increase memory resources if needed.
If the cluster is a DRS cluster, check the aggressiveness threshold. If the value is low, increase the threshold.Increasing the threshold might help avoid hot spots in the cluster.
Space used in GBThe Space in GB chart displays the 10 datastores in the datacenter with the most used disk space.
This chart is located in the Storage view of the Datacenter Performance tab.
vSphere Monitoring and Performance
26 VMware, Inc.
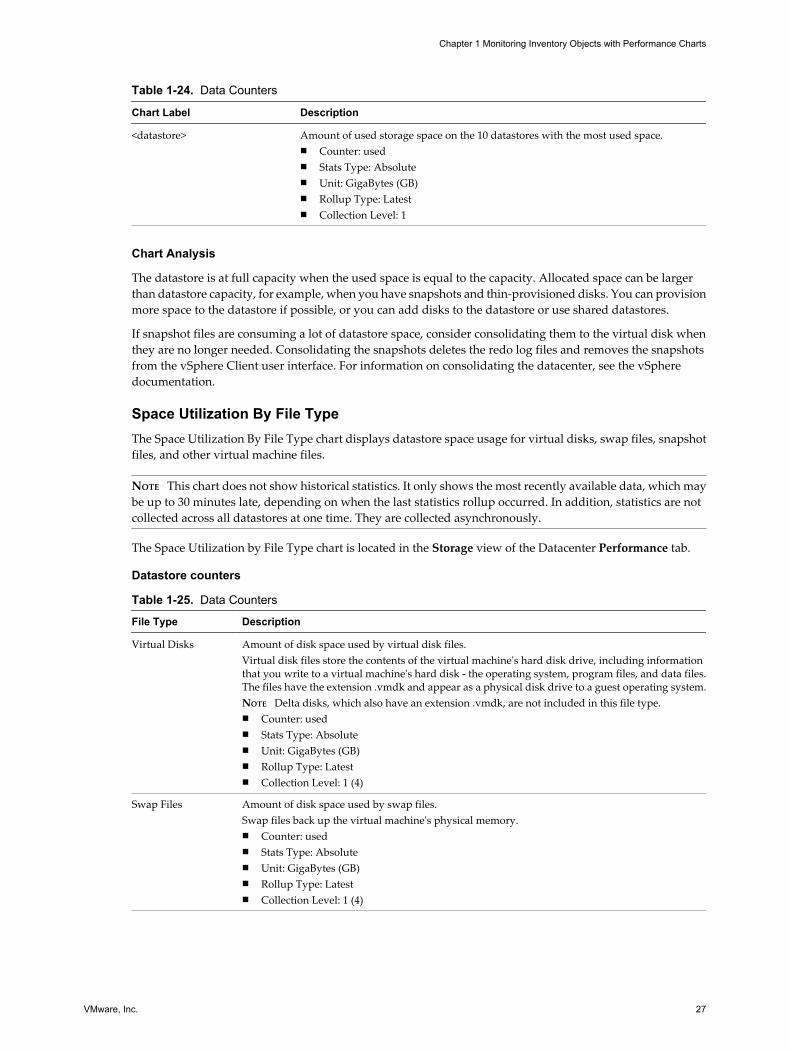
Table 1-24. Data Counters
Chart Label Description
<datastore> Amount of used storage space on the 10 datastores with the most used space.n Counter: usedn Stats Type: Absoluten Unit: GigaBytes (GB)n Rollup Type: Latestn Collection Level: 1
Chart Analysis
The datastore is at full capacity when the used space is equal to the capacity. Allocated space can be largerthan datastore capacity, for example, when you have snapshots and thin-provisioned disks. You can provisionmore space to the datastore if possible, or you can add disks to the datastore or use shared datastores.
If snapshot files are consuming a lot of datastore space, consider consolidating them to the virtual disk whenthey are no longer needed. Consolidating the snapshots deletes the redo log files and removes the snapshotsfrom the vSphere Client user interface. For information on consolidating the datacenter, see the vSpheredocumentation.
Space Utilization By File TypeThe Space Utilization By File Type chart displays datastore space usage for virtual disks, swap files, snapshotfiles, and other virtual machine files.
NOTE This chart does not show historical statistics. It only shows the most recently available data, which maybe up to 30 minutes late, depending on when the last statistics rollup occurred. In addition, statistics are notcollected across all datastores at one time. They are collected asynchronously.
The Space Utilization by File Type chart is located in the Storage view of the Datacenter Performance tab.
Datastore counters
Table 1-25. Data Counters
File Type Description
Virtual Disks Amount of disk space used by virtual disk files.Virtual disk files store the contents of the virtual machine's hard disk drive, including informationthat you write to a virtual machine's hard disk - the operating system, program files, and data files.The files have the extension .vmdk and appear as a physical disk drive to a guest operating system.NOTE Delta disks, which also have an extension .vmdk, are not included in this file type.n Counter: usedn Stats Type: Absoluten Unit: GigaBytes (GB)n Rollup Type: Latestn Collection Level: 1 (4)
Swap Files Amount of disk space used by swap files.Swap files back up the virtual machine's physical memory.n Counter: usedn Stats Type: Absoluten Unit: GigaBytes (GB)n Rollup Type: Latestn Collection Level: 1 (4)
Chapter 1 Monitoring Inventory Objects with Performance Charts
VMware, Inc. 27
Table 1-25. Data Counters (Continued)
File Type Description
Snapshots Amount of disk space used by virtual machine snapshot files.Snapshot files store information about virtual machine snapshots. They include snapshot state filesand delta disk files. A snapshot state file stores the running state of the virtual machine at the timeof the snapshot. It has the extension .vmsn. A delta disk file stores the updates made by the virtualmachine to the virtual disks after a snapshot is taken.n Counter: usedn Stats Type: Absoluten Unit: GigaBytes (GB)n Rollup Type: Latestn Collection Level: 1 (4)
Other VM Files Amount of disk space used by all other virtual machine files, such as configuration files and log files.n Counter: usedn Stats Type: Absoluten Unit: GigaBytes (GB)n Rollup Type: Latestn Collection Level: 1 (4)
Other Amount of disk space used by all other non-virtual machine files, such as documentation files andbackup files.
Free Space Amount of disk space not currently in use.
Total Space Amount of disk space available to the datastore. This is the datastore capacity. The chart displaysthe information for datastores but not for datacenters.total space = virtual disk space + swap file space + snapshot space + other VM file space + other space+ free space
Chart Analysis
The datastore is at full capacity when the used space is equal to the capacity. Allocated space can be largerthan datastore capacity, for example, when you have snapshots and thin-provisioned disks. You can provisionmore space to the datastore if possible, or you can add disks to the datastore or use shared datastores.
If snapshot files are consuming a lot of datastore space, consider consolidating them to the virtual disk whenthey are no longer needed. Consolidating the snapshots deletes the redo log files and removes the snapshotsfrom the vSphere Client user interface. For information on consolidating the datacenter, see the vSpheredocumentation.
DatastoresThe datastore charts contain information about disk usage for datastores. The help topic for each chart containsinformation about the data counters displayed in that chart. The counters available are determined by thecollection level set for vCenter Server.
Space in GBThe Space in GB chart displays space usage data counters for datastores.
This chart is located in the Space view of the Datastore Performance tab.
vSphere Monitoring and Performance
28 VMware, Inc.
Table 1-26. Data Counters
Chart Label Description
Allocated Amount of physical space provisioned by an administrator for the datastore. It is the storage sizeup to which files on the datastore can grow. Allocated space is not always in use.n Counter: provisionedn Stats Type: Absoluten Unit: GigaBytes (GB)n Rollup Type: Latestn Collection Level: 1
Used Amount of physical datastore space in use.n Counter: usedn Stats Type: Absoluten Unit: GigaBytes (GB)n Rollup Type: Latestn Collection Level: 1
Capacity Maximum capacity of the datastore.capacity = virtual machine file space + non-virtual machine file space + free spaceNOTE Storage data is collected and updated in the overview charts every 30 minutes. Therefore, ifyou refresh the datastore, the capacity value might only be updated in the datastore Summary tab,and not in the overview charts.n Counter: capacityn Stats Type: Absoluten Unit: GigaBytes (GB)n Rollup Type: Latestn Collection Level: 1
Chart Analysis
The datastore is at full capacity when the used space is equal to the capacity. Allocated space can be largerthan datastore capacity, for example, when you have snapshots and thin-provisioned disks. You can provisionmore space to the datastore if possible, or you can add disks to the datastore or use shared datastores.
If snapshot files are consuming a lot of datastore space, consider consolidating them to the virtual disk whenthey are no longer needed. Consolidating the snapshots deletes the redo log files and removes the snapshotsfrom the vSphere Client user interface. For information on consolidating the datacenter, see the vSpheredocumentation.
Space Utilization By File TypeThe Space Utilization by File Type chart displays space used by virtual disks, swap files, snapshot files, andother virtual machine files on the the datastore.
NOTE This chart does not show historical statistics. It only shows the most recently available data, which maybe up to 30 minutes late, depending on when the last statistics rollup occurred. In addition, statistics are notcollected across all datastores at one time. They are collected asynchronously.
The Space Utilization by File Type chart is located in the Space view of the Datastore Performance tab.
Chapter 1 Monitoring Inventory Objects with Performance Charts
VMware, Inc. 29
Datastore counters
Table 1-27. Data Counters
File Type Description
Virtual Disks Amount of disk space used by virtual disk files.Virtual disk files store the contents of the virtual machine's hard disk drive, including informationthat you write to a virtual machine's hard disk - the operating system, program files, and data files.The files have the extension .vmdk and appear as a physical disk drive to a guest operating system.NOTE Delta disks, which also have an extension .vmdk, are not included in this file type.n Counter: usedn Stats Type: Absoluten Unit: GigaBytes (GB)n Rollup Type: Latestn Collection Level: 1 (4)
Swap Files Amount of disk space used by swap files.Swap files back up the virtual machine's physical memory.n Counter: usedn Stats Type: Absoluten Unit: GigaBytes (GB)n Rollup Type: Latestn Collection Level: 1 (4)
Snapshots Amount of disk space used by virtual machine snapshot files.Snapshot files store information about virtual machine snapshots. They include snapshot state filesand delta disk files. A snapshot state file stores the running state of the virtual machine at the timeof the snapshot. It has the extension .vmsn. A delta disk file stores the updates made by the virtualmachine to the virtual disks after a snapshot is taken.n Counter: usedn Stats Type: Absoluten Unit: GigaBytes (GB)n Rollup Type: Latestn Collection Level: 1 (4)
Other VM Files Amount of disk space used by all other virtual machine files, such as configuration files and log files.n Counter: usedn Stats Type: Absoluten Unit: GigaBytes (GB)n Rollup Type: Latestn Collection Level: 1 (4)
Other Amount of disk space used by all other non-virtual machine files, such as documentation files andbackup files.
Free Space Amount of disk space not currently in use.
Total Space Amount of disk space available to the datastore. This is the datastore capacity. The chart displaysthe information for datastores but not for datacenters.total space = virtual disk space + swap file space + snapshot space + other VM file space + other space+ free space
Chart Analysis
The datastore is at full capacity when the used space is equal to the capacity. Allocated space can be largerthan datastore capacity, for example, when you have snapshots and thin-provisioned disks. You can provisionmore space to the datastore if possible, or you can add disks to the datastore or use shared datastores.
vSphere Monitoring and Performance
30 VMware, Inc.
If snapshot files are consuming a lot of datastore space, consider consolidating them to the virtual disk whenthey are no longer needed. Consolidating the snapshots deletes the redo log files and removes the snapshotsfrom the vSphere Client user interface. For information on consolidating the datacenter, see the vSpheredocumentation.
Space Utilization by Virtual MachineThe Space Utilization by Virtual Machine chart displays the amount of space used by the 5 virtual machineswith the most space used on the datastore.
NOTE This chart does not show historical statistics. It only shows the most recently available data, which maybe up to 30 minutes late, depending on when the last statistics rollup occurred. In addition, statistics are notcollected across all datastores at one time. They are collected asynchronously.
The Space Utilization by Virtual Machine chart is located in the Space view of the Datastore Performance tab.
Table 1-28. Data Counters
Chart Label Description
<virtual machine> Amount of datastore space used by the five virtual machines with the most useddatastore space.n Counter: usedn Stats Type: Absoluten Unit: GigaBytes (GB)n Rollup Type: Latestn Collection Level: 1
Chart Analysis
The datastore is at full capacity when the used space is equal to the capacity. Allocated space can be largerthan datastore capacity, for example, when you have snapshots and thin-provisioned disks. You can provisionmore space to the datastore if possible, or you can add disks to the datastore or use shared datastores.
If snapshot files are consuming a lot of datastore space, consider consolidating them to the virtual disk whenthey are no longer needed. Consolidating the snapshots deletes the redo log files and removes the snapshotsfrom the vSphere Client user interface. For information on consolidating the datacenter, see the vSpheredocumentation.
Storage I/O Control Normalized LatencyThis chart displays the normalized latency in microseconds on the datastore, which is the latency that ismonitored by Storage I/O Control to detect congestion on the datastore. This metric computes a weightedresponse time across all hosts and VMs accessing the datastore. IO count is used as the weight for the responsetime. It captures the device level latency and does not include any queuing inside the hypervisor storage stackor inside the VM. It is adjusted for I/O size, meaning that high latencies that are the result of very large I/Osare discounted so as not to make the datastore seem slower than it really is. Data for all virtual machines iscombined. This chart will display zero values when Storage I/O Control is disabled.
This chart is located in the Performance view of the datastore Performance tab. ThesizeNormalizedDatastoreLatency counter can also be displayed for host charts (see “Set AdvancedPerformance Charts as the Default,” on page 95).
Chapter 1 Monitoring Inventory Objects with Performance Charts
VMware, Inc. 31
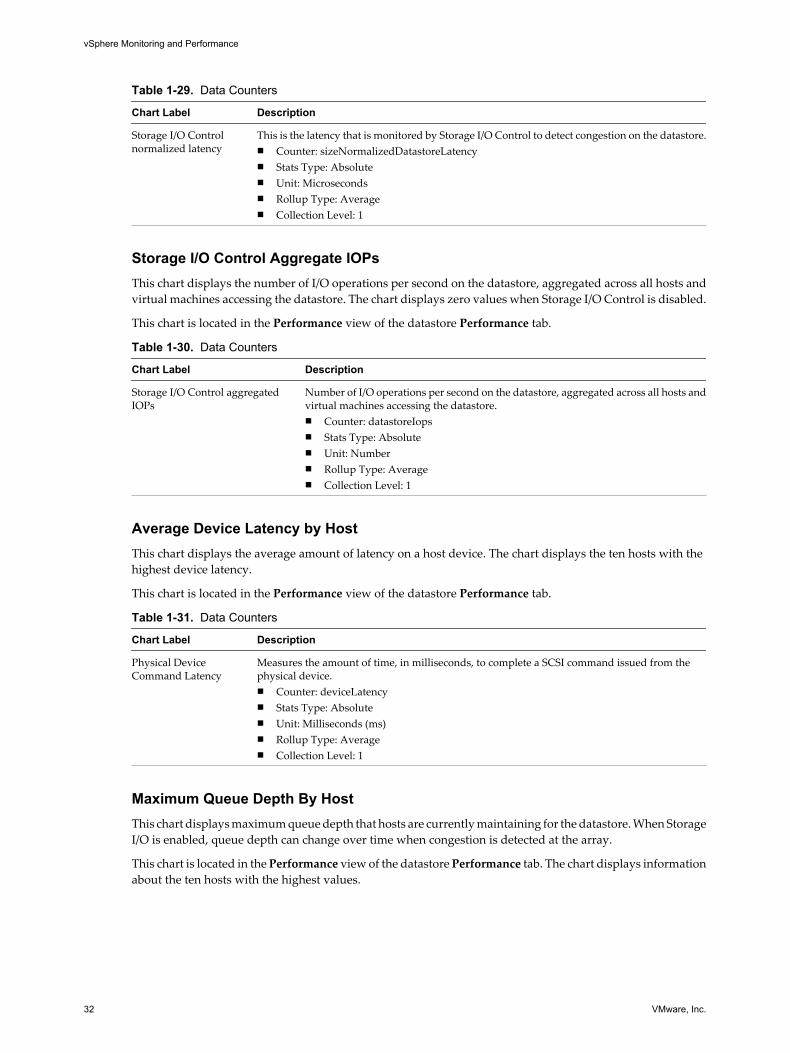
Table 1-29. Data Counters
Chart Label Description
Storage I/O Controlnormalized latency
This is the latency that is monitored by Storage I/O Control to detect congestion on the datastore.n Counter: sizeNormalizedDatastoreLatencyn Stats Type: Absoluten Unit: Microsecondsn Rollup Type: Averagen Collection Level: 1
Storage I/O Control Aggregate IOPsThis chart displays the number of I/O operations per second on the datastore, aggregated across all hosts andvirtual machines accessing the datastore. The chart displays zero values when Storage I/O Control is disabled.
This chart is located in the Performance view of the datastore Performance tab.
Table 1-30. Data Counters
Chart Label Description
Storage I/O Control aggregatedIOPs
Number of I/O operations per second on the datastore, aggregated across all hosts andvirtual machines accessing the datastore.n Counter: datastoreIopsn Stats Type: Absoluten Unit: Numbern Rollup Type: Averagen Collection Level: 1
Average Device Latency by HostThis chart displays the average amount of latency on a host device. The chart displays the ten hosts with thehighest device latency.
This chart is located in the Performance view of the datastore Performance tab.
Table 1-31. Data Counters
Chart Label Description
Physical DeviceCommand Latency
Measures the amount of time, in milliseconds, to complete a SCSI command issued from thephysical device.n Counter: deviceLatencyn Stats Type: Absoluten Unit: Milliseconds (ms)n Rollup Type: Averagen Collection Level: 1
Maximum Queue Depth By HostThis chart displays maximum queue depth that hosts are currently maintaining for the datastore. When StorageI/O is enabled, queue depth can change over time when congestion is detected at the array.
This chart is located in the Performance view of the datastore Performance tab. The chart displays informationabout the ten hosts with the highest values.
vSphere Monitoring and Performance
32 VMware, Inc.
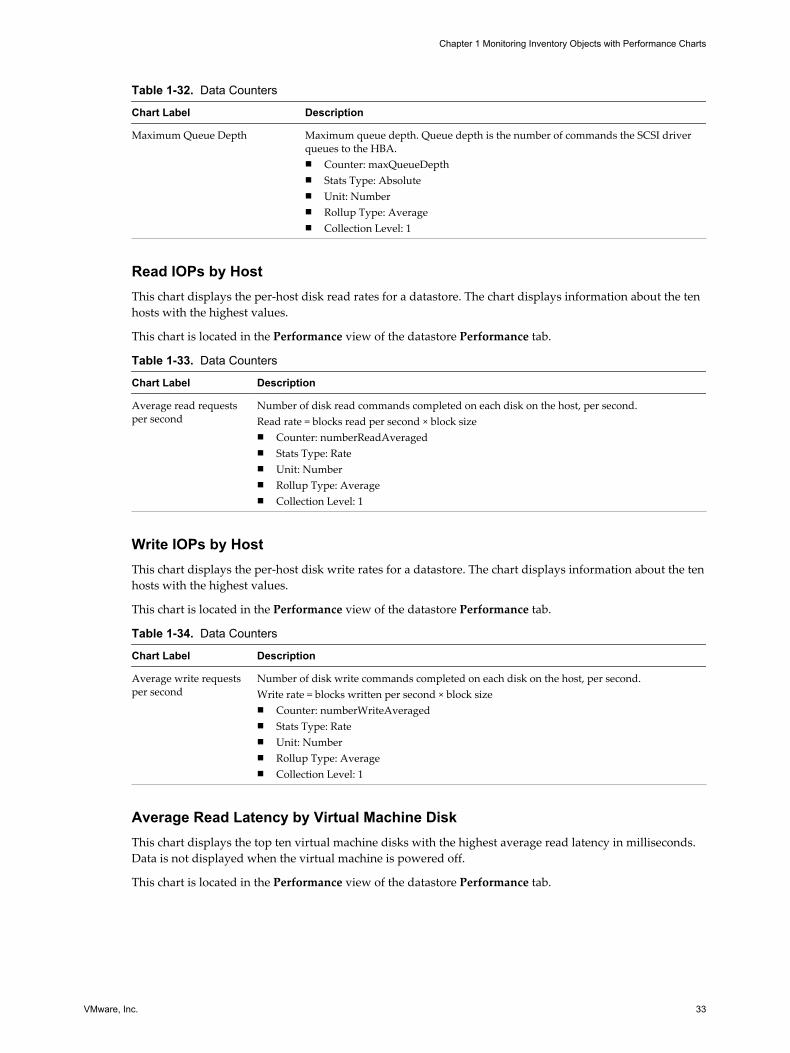
Table 1-32. Data Counters
Chart Label Description
Maximum Queue Depth Maximum queue depth. Queue depth is the number of commands the SCSI driverqueues to the HBA.n Counter: maxQueueDepthn Stats Type: Absoluten Unit: Numbern Rollup Type: Averagen Collection Level: 1
Read IOPs by HostThis chart displays the per-host disk read rates for a datastore. The chart displays information about the tenhosts with the highest values.
This chart is located in the Performance view of the datastore Performance tab.
Table 1-33. Data Counters
Chart Label Description
Average read requestsper second
Number of disk read commands completed on each disk on the host, per second.Read rate = blocks read per second × block sizen Counter: numberReadAveragedn Stats Type: Raten Unit: Numbern Rollup Type: Averagen Collection Level: 1
Write IOPs by HostThis chart displays the per-host disk write rates for a datastore. The chart displays information about the tenhosts with the highest values.
This chart is located in the Performance view of the datastore Performance tab.
Table 1-34. Data Counters
Chart Label Description
Average write requestsper second
Number of disk write commands completed on each disk on the host, per second.Write rate = blocks written per second × block sizen Counter: numberWriteAveragedn Stats Type: Raten Unit: Numbern Rollup Type: Averagen Collection Level: 1
Average Read Latency by Virtual Machine DiskThis chart displays the top ten virtual machine disks with the highest average read latency in milliseconds.Data is not displayed when the virtual machine is powered off.
This chart is located in the Performance view of the datastore Performance tab.
Chapter 1 Monitoring Inventory Objects with Performance Charts
VMware, Inc. 33
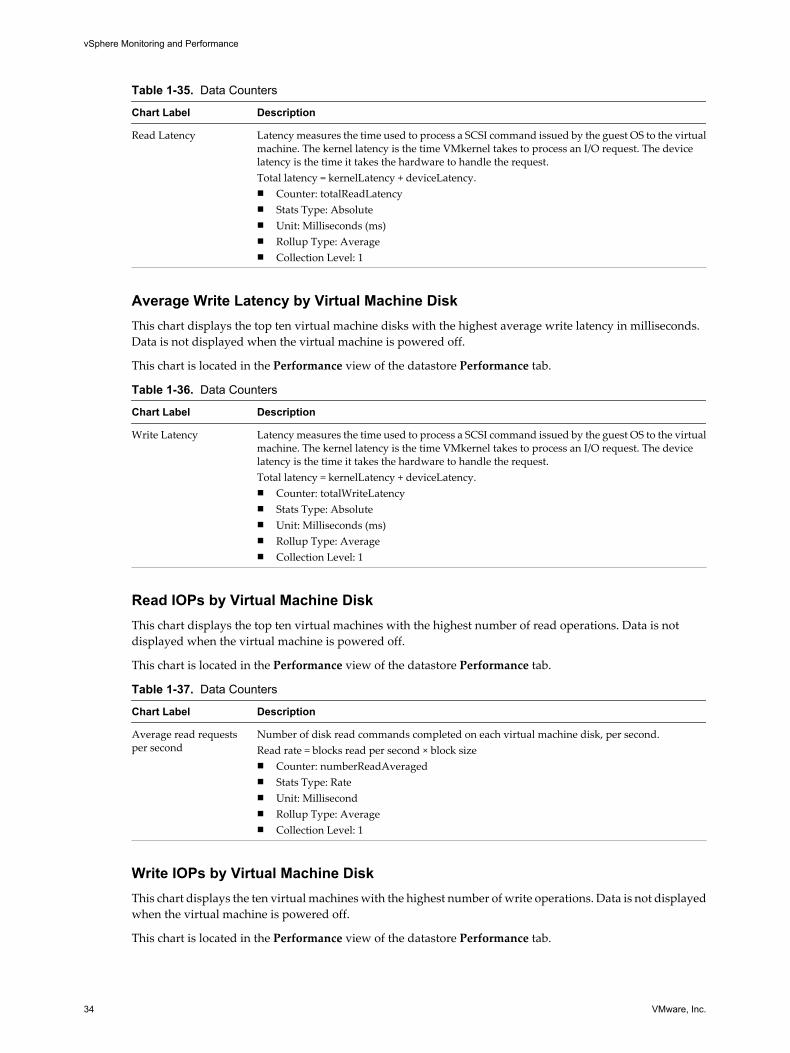
Table 1-35. Data Counters
Chart Label Description
Read Latency Latency measures the time used to process a SCSI command issued by the guest OS to the virtualmachine. The kernel latency is the time VMkernel takes to process an I/O request. The devicelatency is the time it takes the hardware to handle the request.Total latency = kernelLatency + deviceLatency.n Counter: totalReadLatencyn Stats Type: Absoluten Unit: Milliseconds (ms)n Rollup Type: Averagen Collection Level: 1
Average Write Latency by Virtual Machine DiskThis chart displays the top ten virtual machine disks with the highest average write latency in milliseconds.Data is not displayed when the virtual machine is powered off.
This chart is located in the Performance view of the datastore Performance tab.
Table 1-36. Data Counters
Chart Label Description
Write Latency Latency measures the time used to process a SCSI command issued by the guest OS to the virtualmachine. The kernel latency is the time VMkernel takes to process an I/O request. The devicelatency is the time it takes the hardware to handle the request.Total latency = kernelLatency + deviceLatency.n Counter: totalWriteLatencyn Stats Type: Absoluten Unit: Milliseconds (ms)n Rollup Type: Averagen Collection Level: 1
Read IOPs by Virtual Machine DiskThis chart displays the top ten virtual machines with the highest number of read operations. Data is notdisplayed when the virtual machine is powered off.
This chart is located in the Performance view of the datastore Performance tab.
Table 1-37. Data Counters
Chart Label Description
Average read requestsper second
Number of disk read commands completed on each virtual machine disk, per second.Read rate = blocks read per second × block sizen Counter: numberReadAveragedn Stats Type: Raten Unit: Millisecondn Rollup Type: Averagen Collection Level: 1
Write IOPs by Virtual Machine DiskThis chart displays the ten virtual machines with the highest number of write operations. Data is not displayedwhen the virtual machine is powered off.
This chart is located in the Performance view of the datastore Performance tab.
vSphere Monitoring and Performance
34 VMware, Inc.
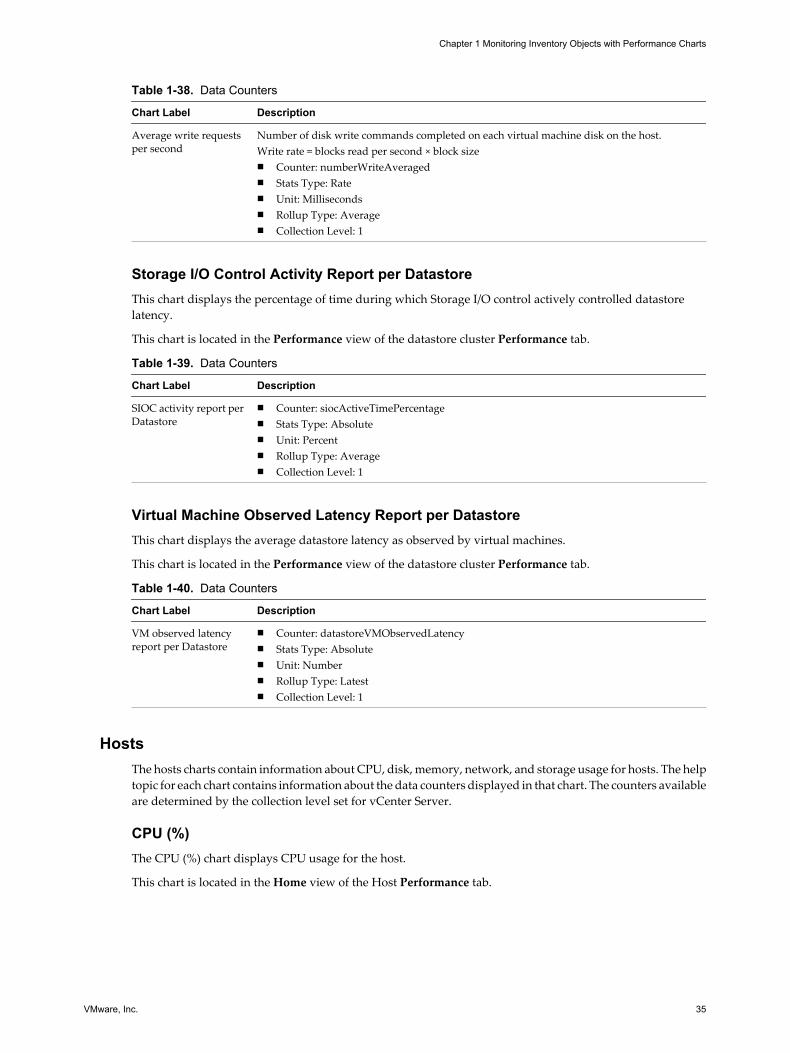
Table 1-38. Data Counters
Chart Label Description
Average write requestsper second
Number of disk write commands completed on each virtual machine disk on the host.Write rate = blocks read per second × block sizen Counter: numberWriteAveragedn Stats Type: Raten Unit: Millisecondsn Rollup Type: Averagen Collection Level: 1
Storage I/O Control Activity Report per DatastoreThis chart displays the percentage of time during which Storage I/O control actively controlled datastorelatency.
This chart is located in the Performance view of the datastore cluster Performance tab.
Table 1-39. Data Counters
Chart Label Description
SIOC activity report perDatastore
n Counter: siocActiveTimePercentagen Stats Type: Absoluten Unit: Percentn Rollup Type: Averagen Collection Level: 1
Virtual Machine Observed Latency Report per DatastoreThis chart displays the average datastore latency as observed by virtual machines.
This chart is located in the Performance view of the datastore cluster Performance tab.
Table 1-40. Data Counters
Chart Label Description
VM observed latencyreport per Datastore
n Counter: datastoreVMObservedLatencyn Stats Type: Absoluten Unit: Numbern Rollup Type: Latestn Collection Level: 1
HostsThe hosts charts contain information about CPU, disk, memory, network, and storage usage for hosts. The helptopic for each chart contains information about the data counters displayed in that chart. The counters availableare determined by the collection level set for vCenter Server.
CPU (%)The CPU (%) chart displays CPU usage for the host.
This chart is located in the Home view of the Host Performance tab.
Chapter 1 Monitoring Inventory Objects with Performance Charts
VMware, Inc. 35

Table 1-41. Data Counters
Chart Label Description
Usage Actively used CPU, as a percentage of the total available CPU, for each physicalCPU on the host.Active CPU is approximately equal to the ratio of the used CPU to the availableCPU.Available CPU = # of physical CPUs × clock rate.100% represents all CPUs on the host. For example, if a four-CPU host is runninga virtual machine with two CPUs, and the usage is 50%, the host is using twoCPUs completely.n Counter: usagen Stats Type: Raten Unit: Percentage (%)n Rollup Type: Average (Minimum/Maximum)n Collection Level: 1 (4)
Chart Analysis
A short spike in CPU usage indicates that you are making the best use of the host resources. However, if thevalue is constantly high, the host is probably lacking the CPU required to meet the demand. A high CPU usagevalue can lead to increased ready time and processor queuing of the virtual machines on the host.
If performance is impacted, consider taking the actions listed below.
Table 1-42. CPU Performance Enhancement Advice
# Resolution
1 Verify that VMware Tools is installed on every virtual machine on the host.
2 Set the CPU reservations for all high-priority virtual machines to guarantee that they receive the CPU cycles required.
3 Reduce the number of virtual CPUs on a virtual machine to only the number required to execute the workload. Forexample, a single-threaded application on a four-way virtual machine only benefits from a single vCPU. But thehypervisor's maintenance of the three idle vCPUs takes CPU cycles that could be used for other work.
4 If the host is not already in a DRS cluster, add it to one. If the host is in a DRS cluster, increase the number of hosts andmigrate one or more virtual machines onto the new host.
5 Upgrade the physical CPUs or cores on the host if necessary.
6 Use the newest version of hypervisor software, and enable CPU-saving features such as TCP Segmentation Offload,large memory pages, and jumbo frames.
CPU (MHz)The CPU (MHz) chart displays CPU usage for the host.
This chart is located in the Home view of the Host Performance tab.
vSphere Monitoring and Performance
36 VMware, Inc.
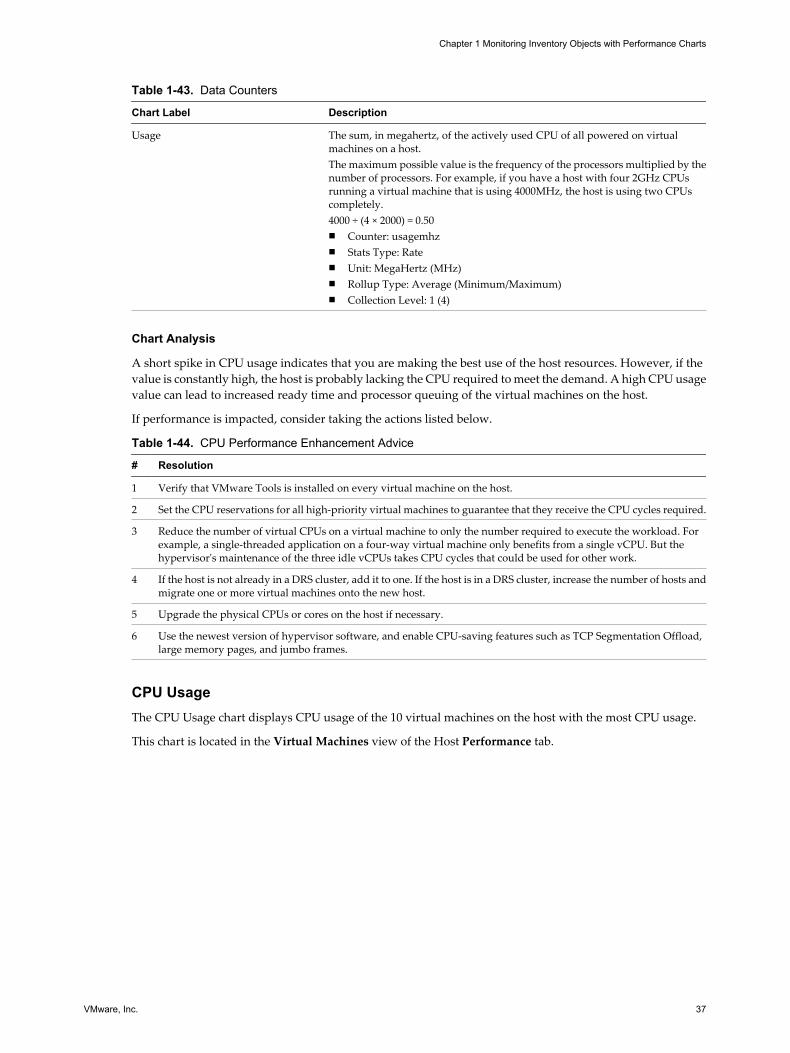
Table 1-43. Data Counters
Chart Label Description
Usage The sum, in megahertz, of the actively used CPU of all powered on virtualmachines on a host.The maximum possible value is the frequency of the processors multiplied by thenumber of processors. For example, if you have a host with four 2GHz CPUsrunning a virtual machine that is using 4000MHz, the host is using two CPUscompletely.4000 ÷ (4 × 2000) = 0.50n Counter: usagemhzn Stats Type: Raten Unit: MegaHertz (MHz)n Rollup Type: Average (Minimum/Maximum)n Collection Level: 1 (4)
Chart Analysis
A short spike in CPU usage indicates that you are making the best use of the host resources. However, if thevalue is constantly high, the host is probably lacking the CPU required to meet the demand. A high CPU usagevalue can lead to increased ready time and processor queuing of the virtual machines on the host.
If performance is impacted, consider taking the actions listed below.
Table 1-44. CPU Performance Enhancement Advice
# Resolution
1 Verify that VMware Tools is installed on every virtual machine on the host.
2 Set the CPU reservations for all high-priority virtual machines to guarantee that they receive the CPU cycles required.
3 Reduce the number of virtual CPUs on a virtual machine to only the number required to execute the workload. Forexample, a single-threaded application on a four-way virtual machine only benefits from a single vCPU. But thehypervisor's maintenance of the three idle vCPUs takes CPU cycles that could be used for other work.
4 If the host is not already in a DRS cluster, add it to one. If the host is in a DRS cluster, increase the number of hosts andmigrate one or more virtual machines onto the new host.
5 Upgrade the physical CPUs or cores on the host if necessary.
6 Use the newest version of hypervisor software, and enable CPU-saving features such as TCP Segmentation Offload,large memory pages, and jumbo frames.
CPU UsageThe CPU Usage chart displays CPU usage of the 10 virtual machines on the host with the most CPU usage.
This chart is located in the Virtual Machines view of the Host Performance tab.
Chapter 1 Monitoring Inventory Objects with Performance Charts
VMware, Inc. 37
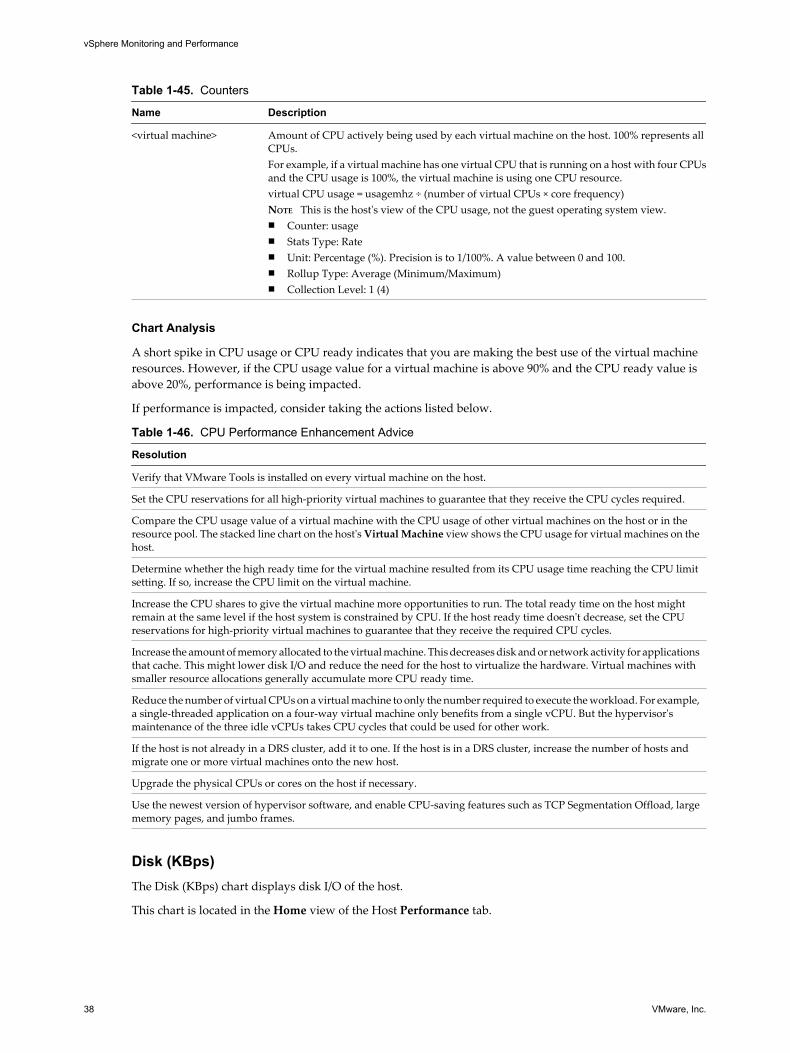
Table 1-45. Counters
Name Description
<virtual machine> Amount of CPU actively being used by each virtual machine on the host. 100% represents allCPUs.For example, if a virtual machine has one virtual CPU that is running on a host with four CPUsand the CPU usage is 100%, the virtual machine is using one CPU resource.virtual CPU usage = usagemhz ÷ (number of virtual CPUs × core frequency)NOTE This is the host's view of the CPU usage, not the guest operating system view.n Counter: usagen Stats Type: Raten Unit: Percentage (%). Precision is to 1/100%. A value between 0 and 100.n Rollup Type: Average (Minimum/Maximum)n Collection Level: 1 (4)
Chart Analysis
A short spike in CPU usage or CPU ready indicates that you are making the best use of the virtual machineresources. However, if the CPU usage value for a virtual machine is above 90% and the CPU ready value isabove 20%, performance is being impacted.
If performance is impacted, consider taking the actions listed below.
Table 1-46. CPU Performance Enhancement Advice
Resolution
Verify that VMware Tools is installed on every virtual machine on the host.
Set the CPU reservations for all high-priority virtual machines to guarantee that they receive the CPU cycles required.
Compare the CPU usage value of a virtual machine with the CPU usage of other virtual machines on the host or in theresource pool. The stacked line chart on the host's Virtual Machine view shows the CPU usage for virtual machines on thehost.
Determine whether the high ready time for the virtual machine resulted from its CPU usage time reaching the CPU limitsetting. If so, increase the CPU limit on the virtual machine.
Increase the CPU shares to give the virtual machine more opportunities to run. The total ready time on the host mightremain at the same level if the host system is constrained by CPU. If the host ready time doesn't decrease, set the CPUreservations for high-priority virtual machines to guarantee that they receive the required CPU cycles.
Increase the amount of memory allocated to the virtual machine. This decreases disk and or network activity for applicationsthat cache. This might lower disk I/O and reduce the need for the host to virtualize the hardware. Virtual machines withsmaller resource allocations generally accumulate more CPU ready time.
Reduce the number of virtual CPUs on a virtual machine to only the number required to execute the workload. For example,a single-threaded application on a four-way virtual machine only benefits from a single vCPU. But the hypervisor'smaintenance of the three idle vCPUs takes CPU cycles that could be used for other work.
If the host is not already in a DRS cluster, add it to one. If the host is in a DRS cluster, increase the number of hosts andmigrate one or more virtual machines onto the new host.
Upgrade the physical CPUs or cores on the host if necessary.
Use the newest version of hypervisor software, and enable CPU-saving features such as TCP Segmentation Offload, largememory pages, and jumbo frames.
Disk (KBps)The Disk (KBps) chart displays disk I/O of the host.
This chart is located in the Home view of the Host Performance tab.
vSphere Monitoring and Performance
38 VMware, Inc.

Table 1-47. Data Counters
Chart Label Description
Usage Average data I/O rate across all LUNs on the host.n Counter: usagen Stats Type: Raten Unit: KiloBytes per second (KBps)n Rollup Type: Average (Minimum/Maximum)n Collection Level: 1 (4)
Chart Analysis
Use the disk charts to monitor average disk loads and to determine trends in disk usage. For example, youmight notice a performance degradation with applications that frequently read from and write to the harddisk. If you see a spike in the number of disk read/write requests, check if any such applications were runningat that time.
The best ways to determine if your vSphere environment is experiencing disk problems is to monitor the disklatency data counters. You use the Advanced performance charts to view these statistics.
n The kernelLatency data counter measures the average amount of time, in milliseconds, that the VMkernelspends processing each SCSI command. For best performance, the value should be 0-1 milliseconds. If thevalue is greater than 4ms, the virtual machines on the host are trying to send more throughput to thestorage system than the configuration supports. Check the CPU usage, and increase the queue depth.
n The deviceLatency data counter measures the average amount of time, in milliseconds, to complete a SCSIcommand from the physical device. Depending on your hardware, a number greater than 15ms indicatesthere are probably problems with the storage array. Move the active VMDK to a volume with morespindles or add disks to the LUN.
n The queueLatency data counter measures the average amount of time taken per SCSI command in theVMkernel queue. This value must always be zero. If not, the workload is too high and the array cannotprocess the data fast enough.
If the disk latency values are high, or if you notice other problems with disk I/O performance, consider takingthe actions listed below.
Table 1-48. Disk I/O Performance Enhancement Advice
# Resolution
1 Increase the virtual machine memory. This should allow for more operating system caching, which can reduce I/Oactivity. Note that this may require you to also increase the host memory. Increasing memory might reduce the needto store data because databases can utilize system memory to cache data and avoid disk access.To verify that virtual machines have adequate memory, check swap statistics in the guest operating system. Increasethe guest memory, but not to an extent that leads to excessive host memory swapping. Install VMware Tools so thatmemory ballooning can occur.
2 Defragment the file systems on all guests.
3 Disable antivirus on-demand scans on the VMDK and VMEM files.
4 Use the vendor's array tools to determine the array performance statistics. When too many servers simultaneouslyaccess common elements on an array, the disks might have trouble keeping up. Consider array-side improvementsto increase throughput.
5 Use Storage vMotion to migrate I/O-intensive virtual machines across multiple hosts.
6 Balance the disk load across all physical resources available. Spread heavily used storage across LUNs that areaccessed by different adapters. Use separate queues for each adapter to improve disk efficiency.
7 Configure the HBAs and RAID controllers for optimal use. Verify that the queue depths and cache settings on theRAID controllers are adequate. If not, increase the number of outstanding disk requests for the virtual machine byadjusting the Disk.SchedNumReqOutstanding parameter. For more information, see the Fibre Channel SANConfiguration Guide.
Chapter 1 Monitoring Inventory Objects with Performance Charts
VMware, Inc. 39
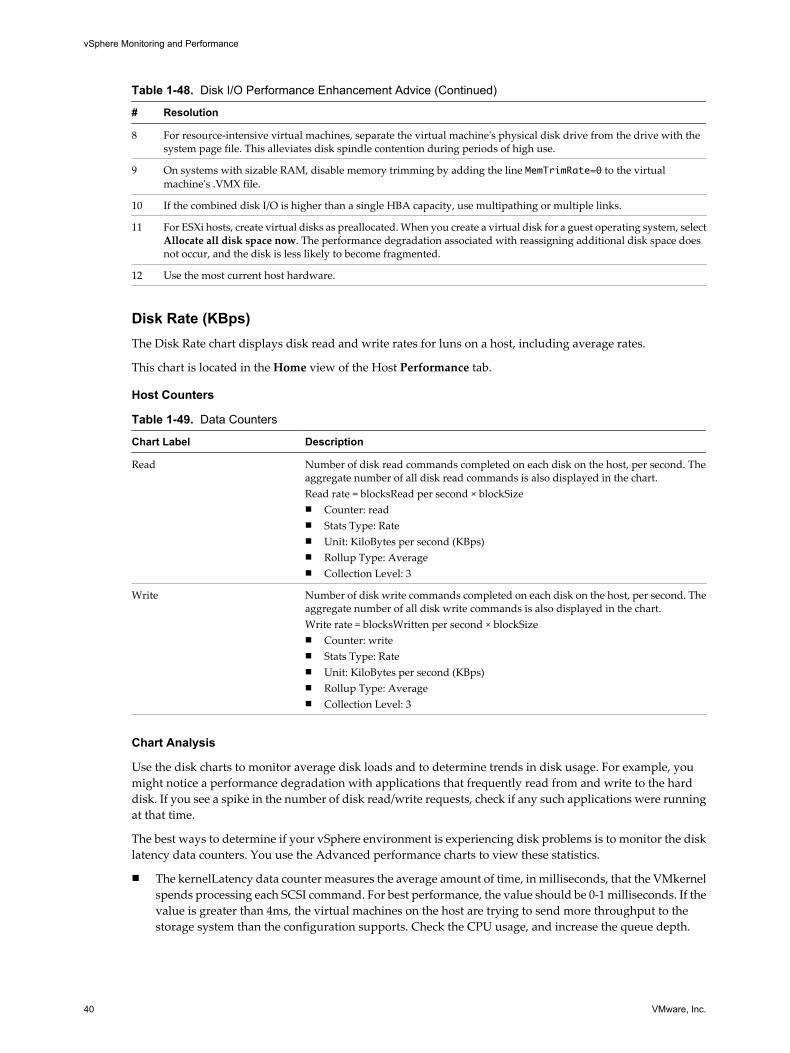
Table 1-48. Disk I/O Performance Enhancement Advice (Continued)
# Resolution
8 For resource-intensive virtual machines, separate the virtual machine's physical disk drive from the drive with thesystem page file. This alleviates disk spindle contention during periods of high use.
9 On systems with sizable RAM, disable memory trimming by adding the line MemTrimRate=0 to the virtualmachine's .VMX file.
10 If the combined disk I/O is higher than a single HBA capacity, use multipathing or multiple links.
11 For ESXi hosts, create virtual disks as preallocated. When you create a virtual disk for a guest operating system, selectAllocate all disk space now. The performance degradation associated with reassigning additional disk space doesnot occur, and the disk is less likely to become fragmented.
12 Use the most current host hardware.
Disk Rate (KBps)The Disk Rate chart displays disk read and write rates for luns on a host, including average rates.
This chart is located in the Home view of the Host Performance tab.
Host Counters
Table 1-49. Data Counters
Chart Label Description
Read Number of disk read commands completed on each disk on the host, per second. Theaggregate number of all disk read commands is also displayed in the chart.Read rate = blocksRead per second × blockSizen Counter: readn Stats Type: Raten Unit: KiloBytes per second (KBps)n Rollup Type: Averagen Collection Level: 3
Write Number of disk write commands completed on each disk on the host, per second. Theaggregate number of all disk write commands is also displayed in the chart.Write rate = blocksWritten per second × blockSizen Counter: writen Stats Type: Raten Unit: KiloBytes per second (KBps)n Rollup Type: Averagen Collection Level: 3
Chart Analysis
Use the disk charts to monitor average disk loads and to determine trends in disk usage. For example, youmight notice a performance degradation with applications that frequently read from and write to the harddisk. If you see a spike in the number of disk read/write requests, check if any such applications were runningat that time.
The best ways to determine if your vSphere environment is experiencing disk problems is to monitor the disklatency data counters. You use the Advanced performance charts to view these statistics.
n The kernelLatency data counter measures the average amount of time, in milliseconds, that the VMkernelspends processing each SCSI command. For best performance, the value should be 0-1 milliseconds. If thevalue is greater than 4ms, the virtual machines on the host are trying to send more throughput to thestorage system than the configuration supports. Check the CPU usage, and increase the queue depth.
vSphere Monitoring and Performance
40 VMware, Inc.
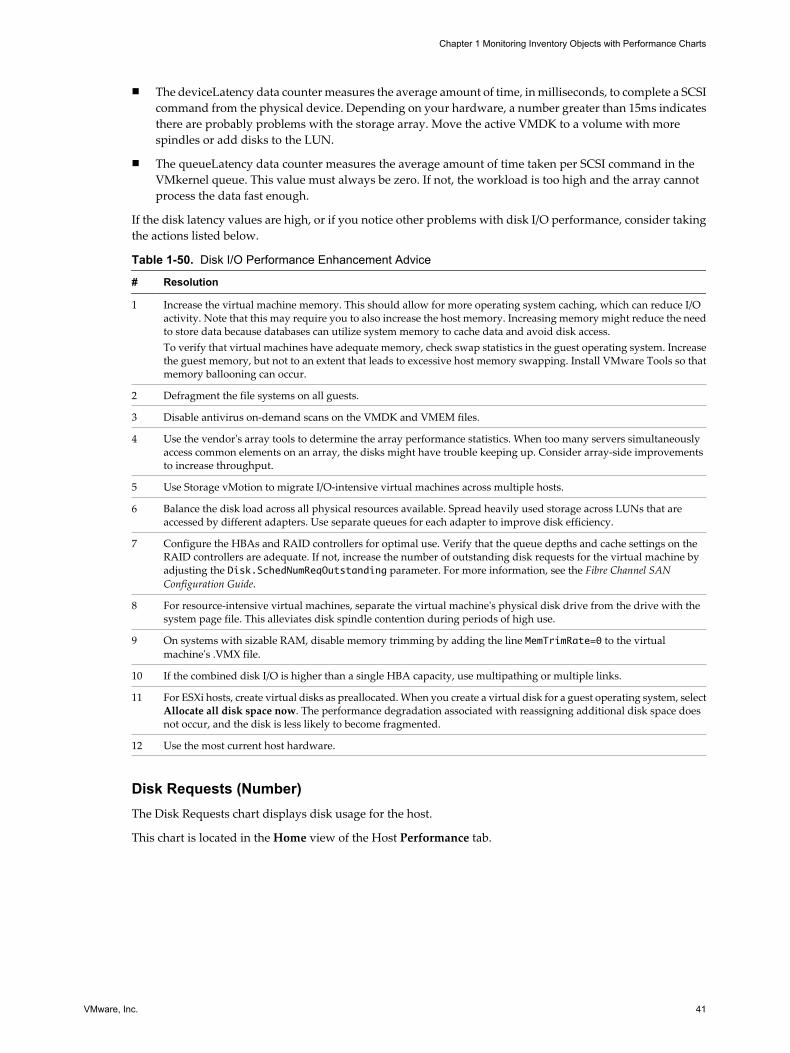
n The deviceLatency data counter measures the average amount of time, in milliseconds, to complete a SCSIcommand from the physical device. Depending on your hardware, a number greater than 15ms indicatesthere are probably problems with the storage array. Move the active VMDK to a volume with morespindles or add disks to the LUN.
n The queueLatency data counter measures the average amount of time taken per SCSI command in theVMkernel queue. This value must always be zero. If not, the workload is too high and the array cannotprocess the data fast enough.
If the disk latency values are high, or if you notice other problems with disk I/O performance, consider takingthe actions listed below.
Table 1-50. Disk I/O Performance Enhancement Advice
# Resolution
1 Increase the virtual machine memory. This should allow for more operating system caching, which can reduce I/Oactivity. Note that this may require you to also increase the host memory. Increasing memory might reduce the needto store data because databases can utilize system memory to cache data and avoid disk access.To verify that virtual machines have adequate memory, check swap statistics in the guest operating system. Increasethe guest memory, but not to an extent that leads to excessive host memory swapping. Install VMware Tools so thatmemory ballooning can occur.
2 Defragment the file systems on all guests.
3 Disable antivirus on-demand scans on the VMDK and VMEM files.
4 Use the vendor's array tools to determine the array performance statistics. When too many servers simultaneouslyaccess common elements on an array, the disks might have trouble keeping up. Consider array-side improvementsto increase throughput.
5 Use Storage vMotion to migrate I/O-intensive virtual machines across multiple hosts.
6 Balance the disk load across all physical resources available. Spread heavily used storage across LUNs that areaccessed by different adapters. Use separate queues for each adapter to improve disk efficiency.
7 Configure the HBAs and RAID controllers for optimal use. Verify that the queue depths and cache settings on theRAID controllers are adequate. If not, increase the number of outstanding disk requests for the virtual machine byadjusting the Disk.SchedNumReqOutstanding parameter. For more information, see the Fibre Channel SANConfiguration Guide.
8 For resource-intensive virtual machines, separate the virtual machine's physical disk drive from the drive with thesystem page file. This alleviates disk spindle contention during periods of high use.
9 On systems with sizable RAM, disable memory trimming by adding the line MemTrimRate=0 to the virtualmachine's .VMX file.
10 If the combined disk I/O is higher than a single HBA capacity, use multipathing or multiple links.
11 For ESXi hosts, create virtual disks as preallocated. When you create a virtual disk for a guest operating system, selectAllocate all disk space now. The performance degradation associated with reassigning additional disk space doesnot occur, and the disk is less likely to become fragmented.
12 Use the most current host hardware.
Disk Requests (Number)The Disk Requests chart displays disk usage for the host.
This chart is located in the Home view of the Host Performance tab.
Chapter 1 Monitoring Inventory Objects with Performance Charts
VMware, Inc. 41
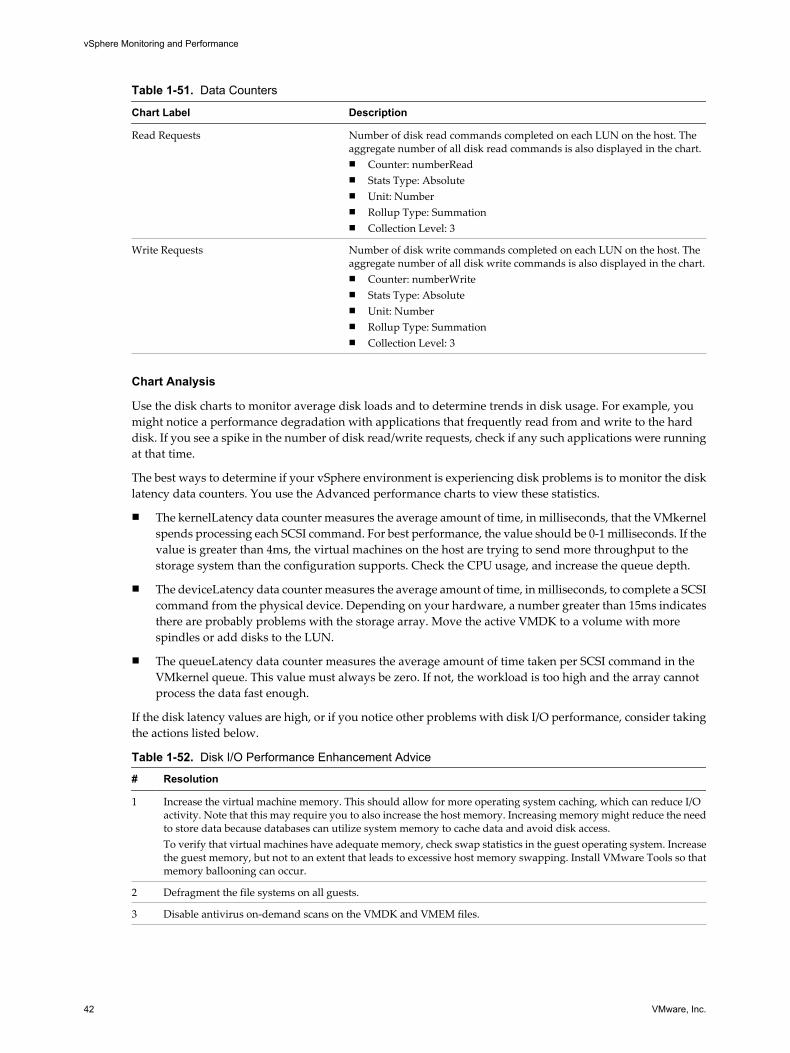
Table 1-51. Data Counters
Chart Label Description
Read Requests Number of disk read commands completed on each LUN on the host. Theaggregate number of all disk read commands is also displayed in the chart.n Counter: numberReadn Stats Type: Absoluten Unit: Numbern Rollup Type: Summationn Collection Level: 3
Write Requests Number of disk write commands completed on each LUN on the host. Theaggregate number of all disk write commands is also displayed in the chart.n Counter: numberWriten Stats Type: Absoluten Unit: Numbern Rollup Type: Summationn Collection Level: 3
Chart Analysis
Use the disk charts to monitor average disk loads and to determine trends in disk usage. For example, youmight notice a performance degradation with applications that frequently read from and write to the harddisk. If you see a spike in the number of disk read/write requests, check if any such applications were runningat that time.
The best ways to determine if your vSphere environment is experiencing disk problems is to monitor the disklatency data counters. You use the Advanced performance charts to view these statistics.
n The kernelLatency data counter measures the average amount of time, in milliseconds, that the VMkernelspends processing each SCSI command. For best performance, the value should be 0-1 milliseconds. If thevalue is greater than 4ms, the virtual machines on the host are trying to send more throughput to thestorage system than the configuration supports. Check the CPU usage, and increase the queue depth.
n The deviceLatency data counter measures the average amount of time, in milliseconds, to complete a SCSIcommand from the physical device. Depending on your hardware, a number greater than 15ms indicatesthere are probably problems with the storage array. Move the active VMDK to a volume with morespindles or add disks to the LUN.
n The queueLatency data counter measures the average amount of time taken per SCSI command in theVMkernel queue. This value must always be zero. If not, the workload is too high and the array cannotprocess the data fast enough.
If the disk latency values are high, or if you notice other problems with disk I/O performance, consider takingthe actions listed below.
Table 1-52. Disk I/O Performance Enhancement Advice
# Resolution
1 Increase the virtual machine memory. This should allow for more operating system caching, which can reduce I/Oactivity. Note that this may require you to also increase the host memory. Increasing memory might reduce the needto store data because databases can utilize system memory to cache data and avoid disk access.To verify that virtual machines have adequate memory, check swap statistics in the guest operating system. Increasethe guest memory, but not to an extent that leads to excessive host memory swapping. Install VMware Tools so thatmemory ballooning can occur.
2 Defragment the file systems on all guests.
3 Disable antivirus on-demand scans on the VMDK and VMEM files.
vSphere Monitoring and Performance
42 VMware, Inc.
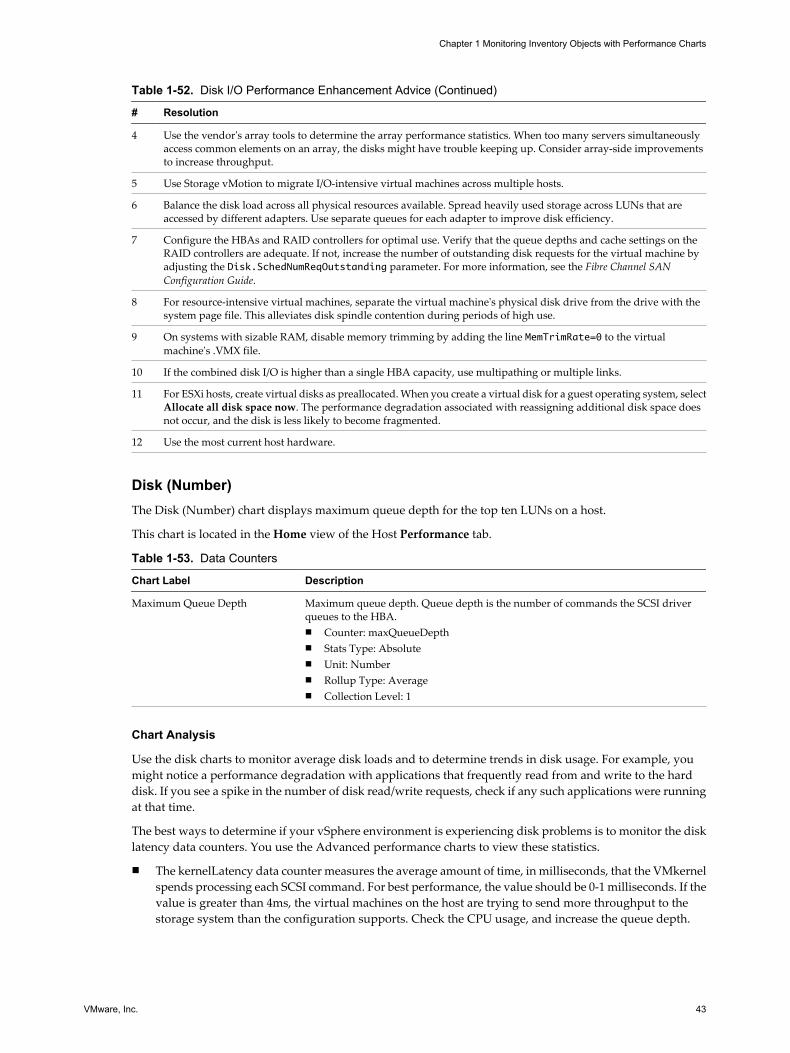
Table 1-52. Disk I/O Performance Enhancement Advice (Continued)
# Resolution
4 Use the vendor's array tools to determine the array performance statistics. When too many servers simultaneouslyaccess common elements on an array, the disks might have trouble keeping up. Consider array-side improvementsto increase throughput.
5 Use Storage vMotion to migrate I/O-intensive virtual machines across multiple hosts.
6 Balance the disk load across all physical resources available. Spread heavily used storage across LUNs that areaccessed by different adapters. Use separate queues for each adapter to improve disk efficiency.
7 Configure the HBAs and RAID controllers for optimal use. Verify that the queue depths and cache settings on theRAID controllers are adequate. If not, increase the number of outstanding disk requests for the virtual machine byadjusting the Disk.SchedNumReqOutstanding parameter. For more information, see the Fibre Channel SANConfiguration Guide.
8 For resource-intensive virtual machines, separate the virtual machine's physical disk drive from the drive with thesystem page file. This alleviates disk spindle contention during periods of high use.
9 On systems with sizable RAM, disable memory trimming by adding the line MemTrimRate=0 to the virtualmachine's .VMX file.
10 If the combined disk I/O is higher than a single HBA capacity, use multipathing or multiple links.
11 For ESXi hosts, create virtual disks as preallocated. When you create a virtual disk for a guest operating system, selectAllocate all disk space now. The performance degradation associated with reassigning additional disk space doesnot occur, and the disk is less likely to become fragmented.
12 Use the most current host hardware.
Disk (Number)The Disk (Number) chart displays maximum queue depth for the top ten LUNs on a host.
This chart is located in the Home view of the Host Performance tab.
Table 1-53. Data Counters
Chart Label Description
Maximum Queue Depth Maximum queue depth. Queue depth is the number of commands the SCSI driverqueues to the HBA.n Counter: maxQueueDepthn Stats Type: Absoluten Unit: Numbern Rollup Type: Averagen Collection Level: 1
Chart Analysis
Use the disk charts to monitor average disk loads and to determine trends in disk usage. For example, youmight notice a performance degradation with applications that frequently read from and write to the harddisk. If you see a spike in the number of disk read/write requests, check if any such applications were runningat that time.
The best ways to determine if your vSphere environment is experiencing disk problems is to monitor the disklatency data counters. You use the Advanced performance charts to view these statistics.
n The kernelLatency data counter measures the average amount of time, in milliseconds, that the VMkernelspends processing each SCSI command. For best performance, the value should be 0-1 milliseconds. If thevalue is greater than 4ms, the virtual machines on the host are trying to send more throughput to thestorage system than the configuration supports. Check the CPU usage, and increase the queue depth.
Chapter 1 Monitoring Inventory Objects with Performance Charts
VMware, Inc. 43
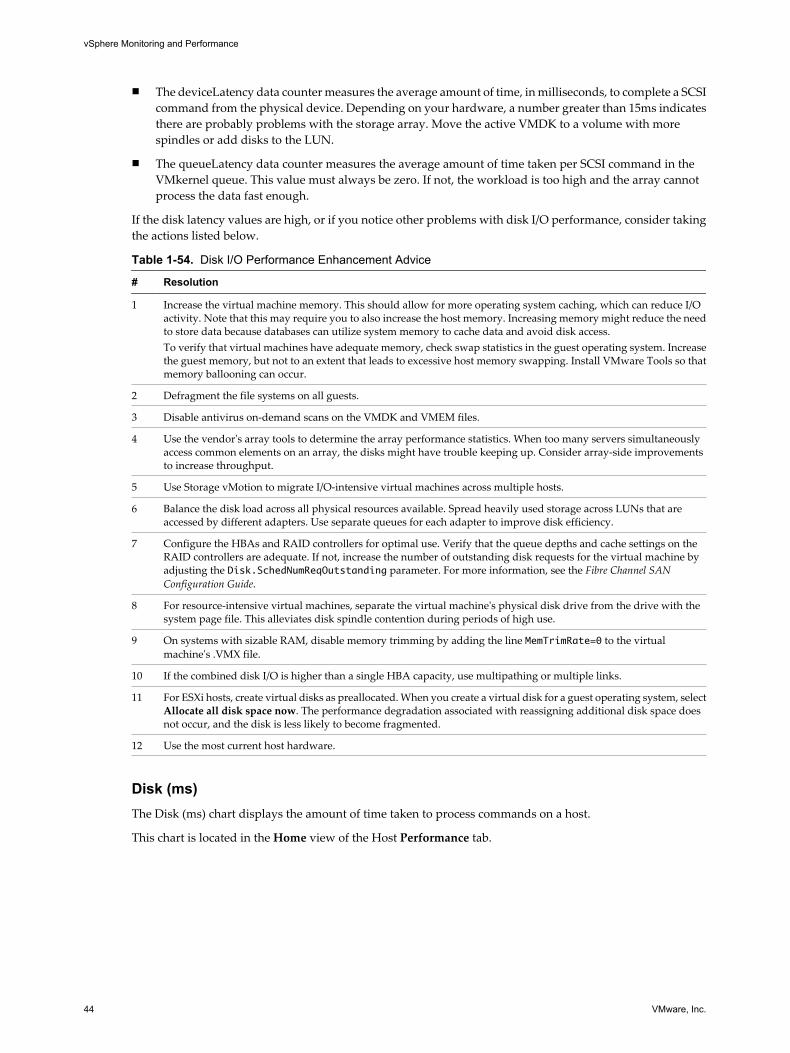
n The deviceLatency data counter measures the average amount of time, in milliseconds, to complete a SCSIcommand from the physical device. Depending on your hardware, a number greater than 15ms indicatesthere are probably problems with the storage array. Move the active VMDK to a volume with morespindles or add disks to the LUN.
n The queueLatency data counter measures the average amount of time taken per SCSI command in theVMkernel queue. This value must always be zero. If not, the workload is too high and the array cannotprocess the data fast enough.
If the disk latency values are high, or if you notice other problems with disk I/O performance, consider takingthe actions listed below.
Table 1-54. Disk I/O Performance Enhancement Advice
# Resolution
1 Increase the virtual machine memory. This should allow for more operating system caching, which can reduce I/Oactivity. Note that this may require you to also increase the host memory. Increasing memory might reduce the needto store data because databases can utilize system memory to cache data and avoid disk access.To verify that virtual machines have adequate memory, check swap statistics in the guest operating system. Increasethe guest memory, but not to an extent that leads to excessive host memory swapping. Install VMware Tools so thatmemory ballooning can occur.
2 Defragment the file systems on all guests.
3 Disable antivirus on-demand scans on the VMDK and VMEM files.
4 Use the vendor's array tools to determine the array performance statistics. When too many servers simultaneouslyaccess common elements on an array, the disks might have trouble keeping up. Consider array-side improvementsto increase throughput.
5 Use Storage vMotion to migrate I/O-intensive virtual machines across multiple hosts.
6 Balance the disk load across all physical resources available. Spread heavily used storage across LUNs that areaccessed by different adapters. Use separate queues for each adapter to improve disk efficiency.
7 Configure the HBAs and RAID controllers for optimal use. Verify that the queue depths and cache settings on theRAID controllers are adequate. If not, increase the number of outstanding disk requests for the virtual machine byadjusting the Disk.SchedNumReqOutstanding parameter. For more information, see the Fibre Channel SANConfiguration Guide.
8 For resource-intensive virtual machines, separate the virtual machine's physical disk drive from the drive with thesystem page file. This alleviates disk spindle contention during periods of high use.
9 On systems with sizable RAM, disable memory trimming by adding the line MemTrimRate=0 to the virtualmachine's .VMX file.
10 If the combined disk I/O is higher than a single HBA capacity, use multipathing or multiple links.
11 For ESXi hosts, create virtual disks as preallocated. When you create a virtual disk for a guest operating system, selectAllocate all disk space now. The performance degradation associated with reassigning additional disk space doesnot occur, and the disk is less likely to become fragmented.
12 Use the most current host hardware.
Disk (ms)The Disk (ms) chart displays the amount of time taken to process commands on a host.
This chart is located in the Home view of the Host Performance tab.
vSphere Monitoring and Performance
44 VMware, Inc.
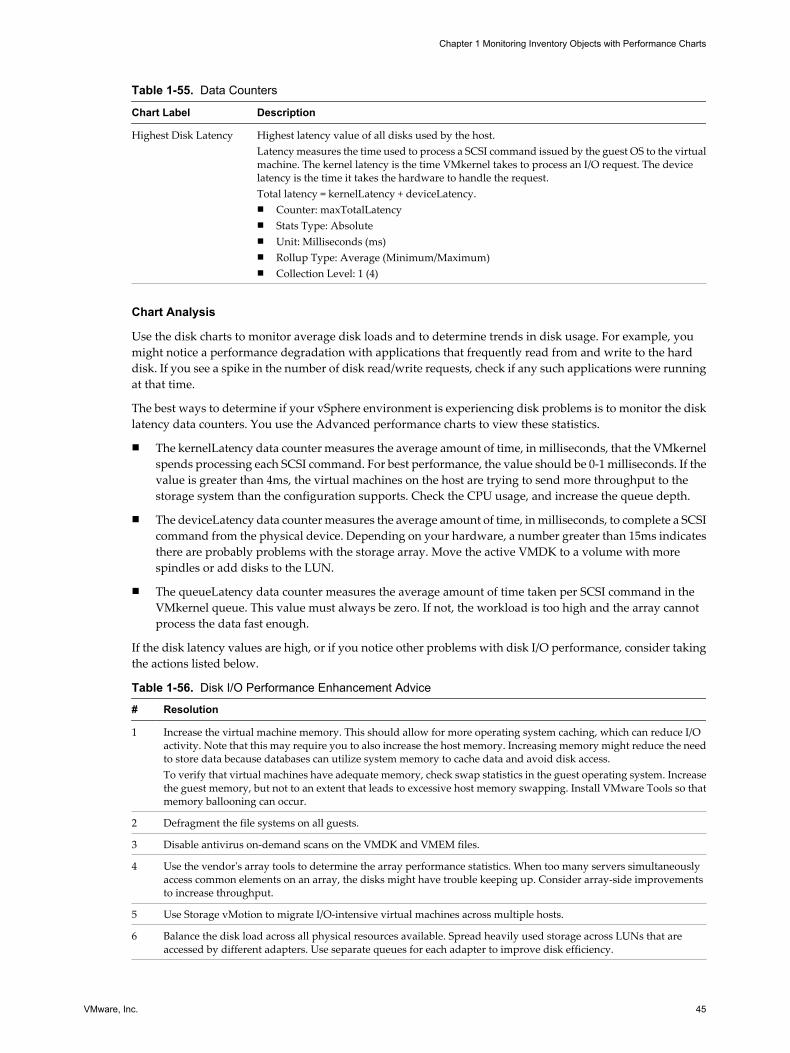
Table 1-55. Data Counters
Chart Label Description
Highest Disk Latency Highest latency value of all disks used by the host.Latency measures the time used to process a SCSI command issued by the guest OS to the virtualmachine. The kernel latency is the time VMkernel takes to process an I/O request. The devicelatency is the time it takes the hardware to handle the request.Total latency = kernelLatency + deviceLatency.n Counter: maxTotalLatencyn Stats Type: Absoluten Unit: Milliseconds (ms)n Rollup Type: Average (Minimum/Maximum)n Collection Level: 1 (4)
Chart Analysis
Use the disk charts to monitor average disk loads and to determine trends in disk usage. For example, youmight notice a performance degradation with applications that frequently read from and write to the harddisk. If you see a spike in the number of disk read/write requests, check if any such applications were runningat that time.
The best ways to determine if your vSphere environment is experiencing disk problems is to monitor the disklatency data counters. You use the Advanced performance charts to view these statistics.
n The kernelLatency data counter measures the average amount of time, in milliseconds, that the VMkernelspends processing each SCSI command. For best performance, the value should be 0-1 milliseconds. If thevalue is greater than 4ms, the virtual machines on the host are trying to send more throughput to thestorage system than the configuration supports. Check the CPU usage, and increase the queue depth.
n The deviceLatency data counter measures the average amount of time, in milliseconds, to complete a SCSIcommand from the physical device. Depending on your hardware, a number greater than 15ms indicatesthere are probably problems with the storage array. Move the active VMDK to a volume with morespindles or add disks to the LUN.
n The queueLatency data counter measures the average amount of time taken per SCSI command in theVMkernel queue. This value must always be zero. If not, the workload is too high and the array cannotprocess the data fast enough.
If the disk latency values are high, or if you notice other problems with disk I/O performance, consider takingthe actions listed below.
Table 1-56. Disk I/O Performance Enhancement Advice
# Resolution
1 Increase the virtual machine memory. This should allow for more operating system caching, which can reduce I/Oactivity. Note that this may require you to also increase the host memory. Increasing memory might reduce the needto store data because databases can utilize system memory to cache data and avoid disk access.To verify that virtual machines have adequate memory, check swap statistics in the guest operating system. Increasethe guest memory, but not to an extent that leads to excessive host memory swapping. Install VMware Tools so thatmemory ballooning can occur.
2 Defragment the file systems on all guests.
3 Disable antivirus on-demand scans on the VMDK and VMEM files.
4 Use the vendor's array tools to determine the array performance statistics. When too many servers simultaneouslyaccess common elements on an array, the disks might have trouble keeping up. Consider array-side improvementsto increase throughput.
5 Use Storage vMotion to migrate I/O-intensive virtual machines across multiple hosts.
6 Balance the disk load across all physical resources available. Spread heavily used storage across LUNs that areaccessed by different adapters. Use separate queues for each adapter to improve disk efficiency.
Chapter 1 Monitoring Inventory Objects with Performance Charts
VMware, Inc. 45
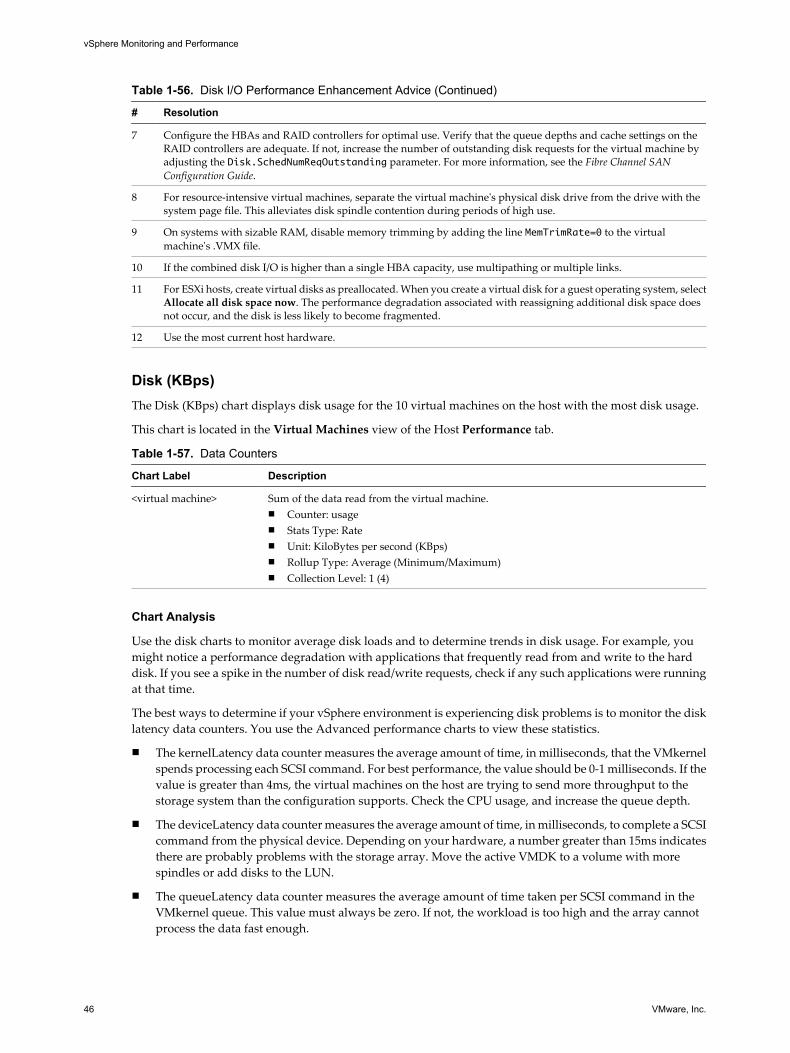
Table 1-56. Disk I/O Performance Enhancement Advice (Continued)
# Resolution
7 Configure the HBAs and RAID controllers for optimal use. Verify that the queue depths and cache settings on theRAID controllers are adequate. If not, increase the number of outstanding disk requests for the virtual machine byadjusting the Disk.SchedNumReqOutstanding parameter. For more information, see the Fibre Channel SANConfiguration Guide.
8 For resource-intensive virtual machines, separate the virtual machine's physical disk drive from the drive with thesystem page file. This alleviates disk spindle contention during periods of high use.
9 On systems with sizable RAM, disable memory trimming by adding the line MemTrimRate=0 to the virtualmachine's .VMX file.
10 If the combined disk I/O is higher than a single HBA capacity, use multipathing or multiple links.
11 For ESXi hosts, create virtual disks as preallocated. When you create a virtual disk for a guest operating system, selectAllocate all disk space now. The performance degradation associated with reassigning additional disk space doesnot occur, and the disk is less likely to become fragmented.
12 Use the most current host hardware.
Disk (KBps)The Disk (KBps) chart displays disk usage for the 10 virtual machines on the host with the most disk usage.
This chart is located in the Virtual Machines view of the Host Performance tab.
Table 1-57. Data Counters
Chart Label Description
<virtual machine> Sum of the data read from the virtual machine.n Counter: usagen Stats Type: Raten Unit: KiloBytes per second (KBps)n Rollup Type: Average (Minimum/Maximum)n Collection Level: 1 (4)
Chart Analysis
Use the disk charts to monitor average disk loads and to determine trends in disk usage. For example, youmight notice a performance degradation with applications that frequently read from and write to the harddisk. If you see a spike in the number of disk read/write requests, check if any such applications were runningat that time.
The best ways to determine if your vSphere environment is experiencing disk problems is to monitor the disklatency data counters. You use the Advanced performance charts to view these statistics.
n The kernelLatency data counter measures the average amount of time, in milliseconds, that the VMkernelspends processing each SCSI command. For best performance, the value should be 0-1 milliseconds. If thevalue is greater than 4ms, the virtual machines on the host are trying to send more throughput to thestorage system than the configuration supports. Check the CPU usage, and increase the queue depth.
n The deviceLatency data counter measures the average amount of time, in milliseconds, to complete a SCSIcommand from the physical device. Depending on your hardware, a number greater than 15ms indicatesthere are probably problems with the storage array. Move the active VMDK to a volume with morespindles or add disks to the LUN.
n The queueLatency data counter measures the average amount of time taken per SCSI command in theVMkernel queue. This value must always be zero. If not, the workload is too high and the array cannotprocess the data fast enough.
vSphere Monitoring and Performance
46 VMware, Inc.
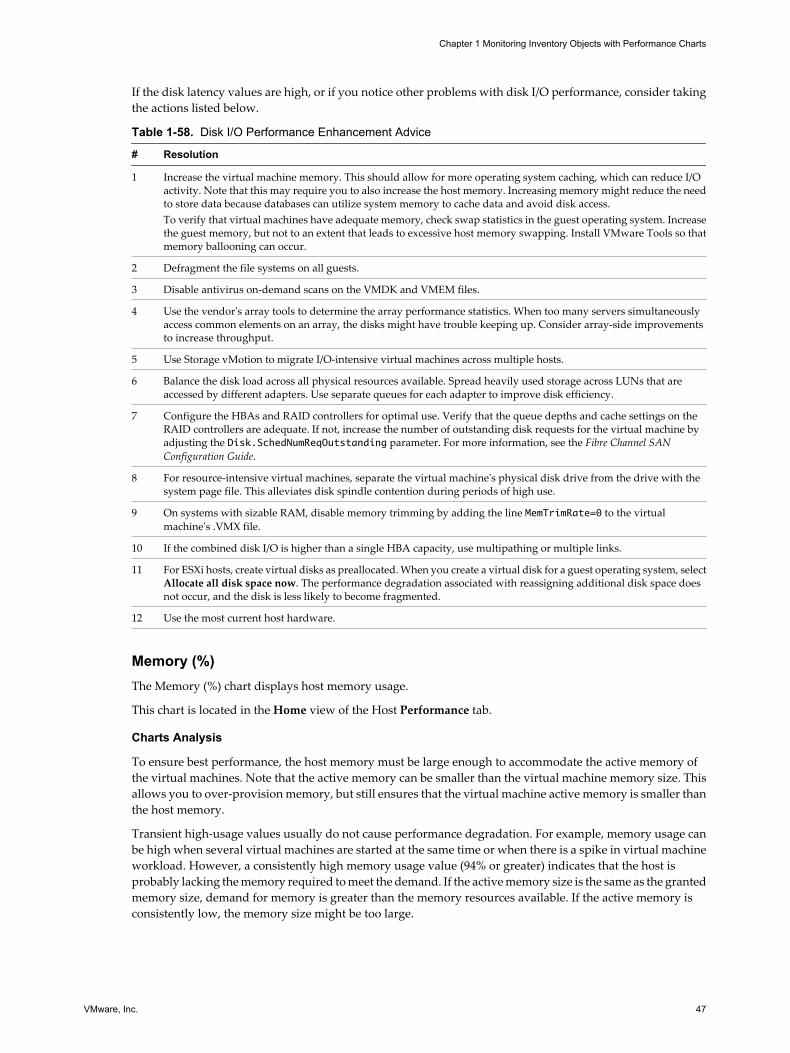
If the disk latency values are high, or if you notice other problems with disk I/O performance, consider takingthe actions listed below.
Table 1-58. Disk I/O Performance Enhancement Advice
# Resolution
1 Increase the virtual machine memory. This should allow for more operating system caching, which can reduce I/Oactivity. Note that this may require you to also increase the host memory. Increasing memory might reduce the needto store data because databases can utilize system memory to cache data and avoid disk access.To verify that virtual machines have adequate memory, check swap statistics in the guest operating system. Increasethe guest memory, but not to an extent that leads to excessive host memory swapping. Install VMware Tools so thatmemory ballooning can occur.
2 Defragment the file systems on all guests.
3 Disable antivirus on-demand scans on the VMDK and VMEM files.
4 Use the vendor's array tools to determine the array performance statistics. When too many servers simultaneouslyaccess common elements on an array, the disks might have trouble keeping up. Consider array-side improvementsto increase throughput.
5 Use Storage vMotion to migrate I/O-intensive virtual machines across multiple hosts.
6 Balance the disk load across all physical resources available. Spread heavily used storage across LUNs that areaccessed by different adapters. Use separate queues for each adapter to improve disk efficiency.
7 Configure the HBAs and RAID controllers for optimal use. Verify that the queue depths and cache settings on theRAID controllers are adequate. If not, increase the number of outstanding disk requests for the virtual machine byadjusting the Disk.SchedNumReqOutstanding parameter. For more information, see the Fibre Channel SANConfiguration Guide.
8 For resource-intensive virtual machines, separate the virtual machine's physical disk drive from the drive with thesystem page file. This alleviates disk spindle contention during periods of high use.
9 On systems with sizable RAM, disable memory trimming by adding the line MemTrimRate=0 to the virtualmachine's .VMX file.
10 If the combined disk I/O is higher than a single HBA capacity, use multipathing or multiple links.
11 For ESXi hosts, create virtual disks as preallocated. When you create a virtual disk for a guest operating system, selectAllocate all disk space now. The performance degradation associated with reassigning additional disk space doesnot occur, and the disk is less likely to become fragmented.
12 Use the most current host hardware.
Memory (%)The Memory (%) chart displays host memory usage.
This chart is located in the Home view of the Host Performance tab.
Charts Analysis
To ensure best performance, the host memory must be large enough to accommodate the active memory ofthe virtual machines. Note that the active memory can be smaller than the virtual machine memory size. Thisallows you to over-provision memory, but still ensures that the virtual machine active memory is smaller thanthe host memory.
Transient high-usage values usually do not cause performance degradation. For example, memory usage canbe high when several virtual machines are started at the same time or when there is a spike in virtual machineworkload. However, a consistently high memory usage value (94% or greater) indicates that the host isprobably lacking the memory required to meet the demand. If the active memory size is the same as the grantedmemory size, demand for memory is greater than the memory resources available. If the active memory isconsistently low, the memory size might be too large.
Chapter 1 Monitoring Inventory Objects with Performance Charts
VMware, Inc. 47
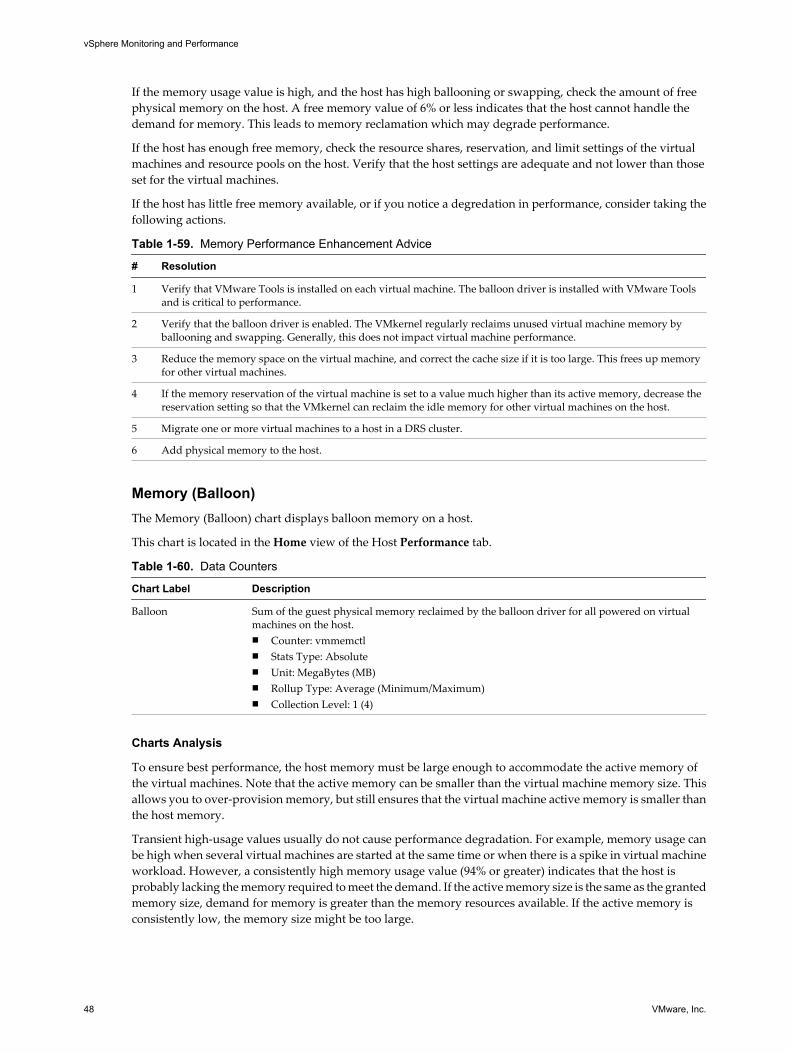
If the memory usage value is high, and the host has high ballooning or swapping, check the amount of freephysical memory on the host. A free memory value of 6% or less indicates that the host cannot handle thedemand for memory. This leads to memory reclamation which may degrade performance.
If the host has enough free memory, check the resource shares, reservation, and limit settings of the virtualmachines and resource pools on the host. Verify that the host settings are adequate and not lower than thoseset for the virtual machines.
If the host has little free memory available, or if you notice a degredation in performance, consider taking thefollowing actions.
Table 1-59. Memory Performance Enhancement Advice
# Resolution
1 Verify that VMware Tools is installed on each virtual machine. The balloon driver is installed with VMware Toolsand is critical to performance.
2 Verify that the balloon driver is enabled. The VMkernel regularly reclaims unused virtual machine memory byballooning and swapping. Generally, this does not impact virtual machine performance.
3 Reduce the memory space on the virtual machine, and correct the cache size if it is too large. This frees up memoryfor other virtual machines.
4 If the memory reservation of the virtual machine is set to a value much higher than its active memory, decrease thereservation setting so that the VMkernel can reclaim the idle memory for other virtual machines on the host.
5 Migrate one or more virtual machines to a host in a DRS cluster.
6 Add physical memory to the host.
Memory (Balloon)The Memory (Balloon) chart displays balloon memory on a host.
This chart is located in the Home view of the Host Performance tab.
Table 1-60. Data Counters
Chart Label Description
Balloon Sum of the guest physical memory reclaimed by the balloon driver for all powered on virtualmachines on the host.n Counter: vmmemctln Stats Type: Absoluten Unit: MegaBytes (MB)n Rollup Type: Average (Minimum/Maximum)n Collection Level: 1 (4)
Charts Analysis
To ensure best performance, the host memory must be large enough to accommodate the active memory ofthe virtual machines. Note that the active memory can be smaller than the virtual machine memory size. Thisallows you to over-provision memory, but still ensures that the virtual machine active memory is smaller thanthe host memory.
Transient high-usage values usually do not cause performance degradation. For example, memory usage canbe high when several virtual machines are started at the same time or when there is a spike in virtual machineworkload. However, a consistently high memory usage value (94% or greater) indicates that the host isprobably lacking the memory required to meet the demand. If the active memory size is the same as the grantedmemory size, demand for memory is greater than the memory resources available. If the active memory isconsistently low, the memory size might be too large.
vSphere Monitoring and Performance
48 VMware, Inc.
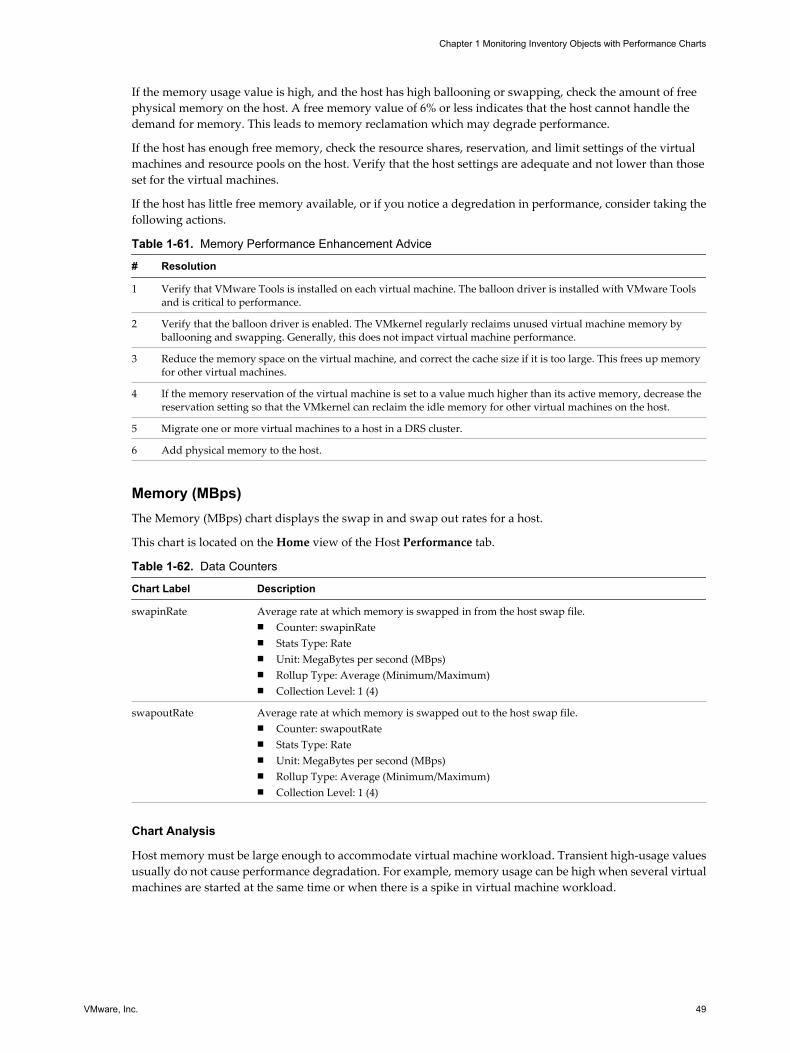
If the memory usage value is high, and the host has high ballooning or swapping, check the amount of freephysical memory on the host. A free memory value of 6% or less indicates that the host cannot handle thedemand for memory. This leads to memory reclamation which may degrade performance.
If the host has enough free memory, check the resource shares, reservation, and limit settings of the virtualmachines and resource pools on the host. Verify that the host settings are adequate and not lower than thoseset for the virtual machines.
If the host has little free memory available, or if you notice a degredation in performance, consider taking thefollowing actions.
Table 1-61. Memory Performance Enhancement Advice
# Resolution
1 Verify that VMware Tools is installed on each virtual machine. The balloon driver is installed with VMware Toolsand is critical to performance.
2 Verify that the balloon driver is enabled. The VMkernel regularly reclaims unused virtual machine memory byballooning and swapping. Generally, this does not impact virtual machine performance.
3 Reduce the memory space on the virtual machine, and correct the cache size if it is too large. This frees up memoryfor other virtual machines.
4 If the memory reservation of the virtual machine is set to a value much higher than its active memory, decrease thereservation setting so that the VMkernel can reclaim the idle memory for other virtual machines on the host.
5 Migrate one or more virtual machines to a host in a DRS cluster.
6 Add physical memory to the host.
Memory (MBps)The Memory (MBps) chart displays the swap in and swap out rates for a host.
This chart is located on the Home view of the Host Performance tab.
Table 1-62. Data Counters
Chart Label Description
swapinRate Average rate at which memory is swapped in from the host swap file.n Counter: swapinRaten Stats Type: Raten Unit: MegaBytes per second (MBps)n Rollup Type: Average (Minimum/Maximum)n Collection Level: 1 (4)
swapoutRate Average rate at which memory is swapped out to the host swap file.n Counter: swapoutRaten Stats Type: Raten Unit: MegaBytes per second (MBps)n Rollup Type: Average (Minimum/Maximum)n Collection Level: 1 (4)
Chart Analysis
Host memory must be large enough to accommodate virtual machine workload. Transient high-usage valuesusually do not cause performance degradation. For example, memory usage can be high when several virtualmachines are started at the same time or when there is a spike in virtual machine workload.
Chapter 1 Monitoring Inventory Objects with Performance Charts
VMware, Inc. 49
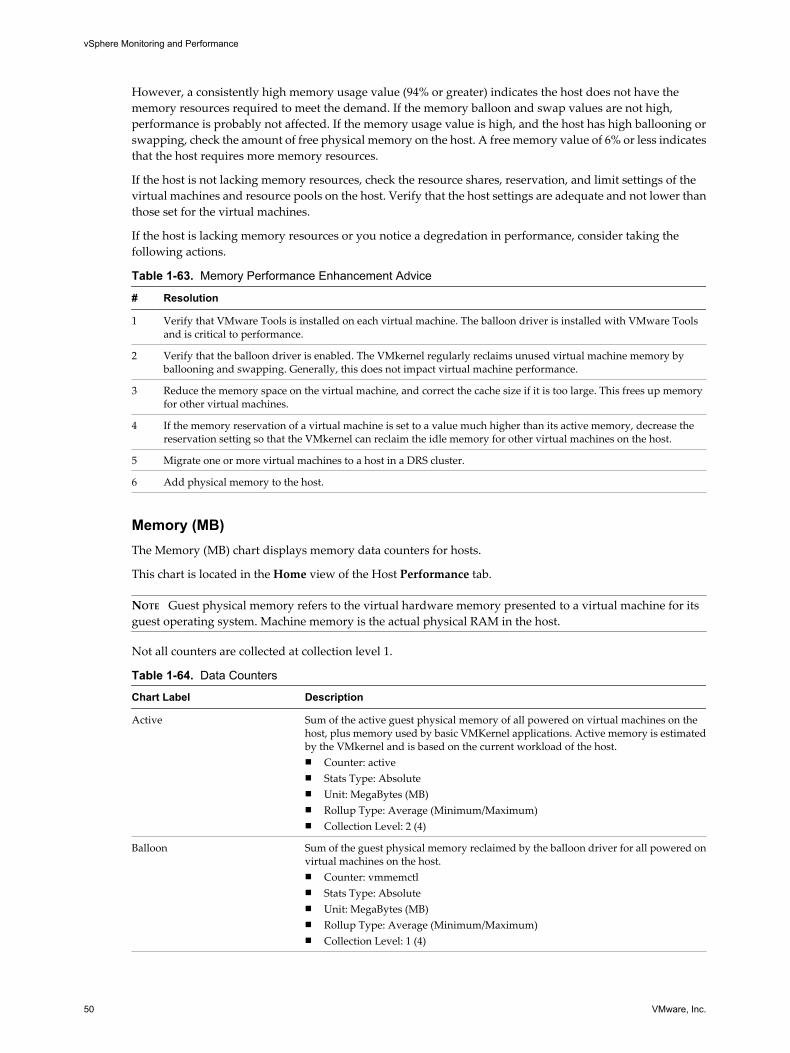
However, a consistently high memory usage value (94% or greater) indicates the host does not have thememory resources required to meet the demand. If the memory balloon and swap values are not high,performance is probably not affected. If the memory usage value is high, and the host has high ballooning orswapping, check the amount of free physical memory on the host. A free memory value of 6% or less indicatesthat the host requires more memory resources.
If the host is not lacking memory resources, check the resource shares, reservation, and limit settings of thevirtual machines and resource pools on the host. Verify that the host settings are adequate and not lower thanthose set for the virtual machines.
If the host is lacking memory resources or you notice a degredation in performance, consider taking thefollowing actions.
Table 1-63. Memory Performance Enhancement Advice
# Resolution
1 Verify that VMware Tools is installed on each virtual machine. The balloon driver is installed with VMware Toolsand is critical to performance.
2 Verify that the balloon driver is enabled. The VMkernel regularly reclaims unused virtual machine memory byballooning and swapping. Generally, this does not impact virtual machine performance.
3 Reduce the memory space on the virtual machine, and correct the cache size if it is too large. This frees up memoryfor other virtual machines.
4 If the memory reservation of a virtual machine is set to a value much higher than its active memory, decrease thereservation setting so that the VMkernel can reclaim the idle memory for other virtual machines on the host.
5 Migrate one or more virtual machines to a host in a DRS cluster.
6 Add physical memory to the host.
Memory (MB)The Memory (MB) chart displays memory data counters for hosts.
This chart is located in the Home view of the Host Performance tab.
NOTE Guest physical memory refers to the virtual hardware memory presented to a virtual machine for itsguest operating system. Machine memory is the actual physical RAM in the host.
Not all counters are collected at collection level 1.
Table 1-64. Data Counters
Chart Label Description
Active Sum of the active guest physical memory of all powered on virtual machines on thehost, plus memory used by basic VMKernel applications. Active memory is estimatedby the VMkernel and is based on the current workload of the host.n Counter: activen Stats Type: Absoluten Unit: MegaBytes (MB)n Rollup Type: Average (Minimum/Maximum)n Collection Level: 2 (4)
Balloon Sum of the guest physical memory reclaimed by the balloon driver for all powered onvirtual machines on the host.n Counter: vmmemctln Stats Type: Absoluten Unit: MegaBytes (MB)n Rollup Type: Average (Minimum/Maximum)n Collection Level: 1 (4)
vSphere Monitoring and Performance
50 VMware, Inc.
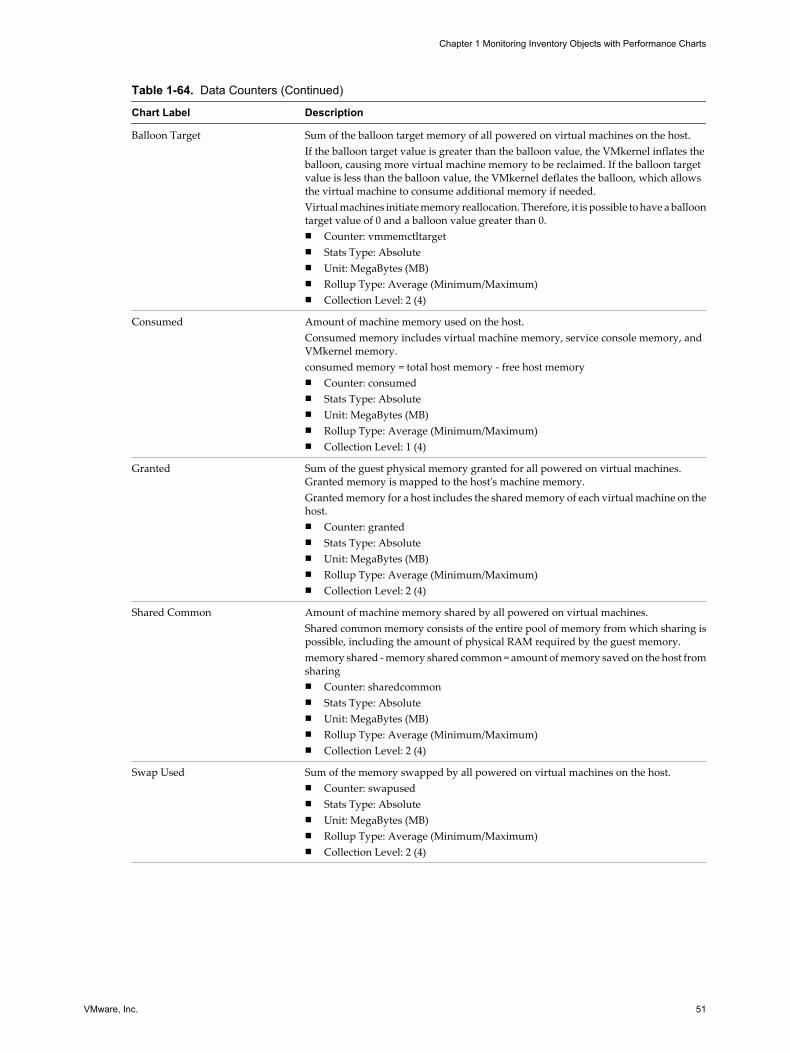
Table 1-64. Data Counters (Continued)
Chart Label Description
Balloon Target Sum of the balloon target memory of all powered on virtual machines on the host.If the balloon target value is greater than the balloon value, the VMkernel inflates theballoon, causing more virtual machine memory to be reclaimed. If the balloon targetvalue is less than the balloon value, the VMkernel deflates the balloon, which allowsthe virtual machine to consume additional memory if needed.Virtual machines initiate memory reallocation. Therefore, it is possible to have a balloontarget value of 0 and a balloon value greater than 0.n Counter: vmmemctltargetn Stats Type: Absoluten Unit: MegaBytes (MB)n Rollup Type: Average (Minimum/Maximum)n Collection Level: 2 (4)
Consumed Amount of machine memory used on the host.Consumed memory includes virtual machine memory, service console memory, andVMkernel memory.consumed memory = total host memory - free host memoryn Counter: consumedn Stats Type: Absoluten Unit: MegaBytes (MB)n Rollup Type: Average (Minimum/Maximum)n Collection Level: 1 (4)
Granted Sum of the guest physical memory granted for all powered on virtual machines.Granted memory is mapped to the host's machine memory.Granted memory for a host includes the shared memory of each virtual machine on thehost.n Counter: grantedn Stats Type: Absoluten Unit: MegaBytes (MB)n Rollup Type: Average (Minimum/Maximum)n Collection Level: 2 (4)
Shared Common Amount of machine memory shared by all powered on virtual machines.Shared common memory consists of the entire pool of memory from which sharing ispossible, including the amount of physical RAM required by the guest memory.memory shared - memory shared common = amount of memory saved on the host fromsharingn Counter: sharedcommonn Stats Type: Absoluten Unit: MegaBytes (MB)n Rollup Type: Average (Minimum/Maximum)n Collection Level: 2 (4)
Swap Used Sum of the memory swapped by all powered on virtual machines on the host.n Counter: swapusedn Stats Type: Absoluten Unit: MegaBytes (MB)n Rollup Type: Average (Minimum/Maximum)n Collection Level: 2 (4)
Chapter 1 Monitoring Inventory Objects with Performance Charts
VMware, Inc. 51
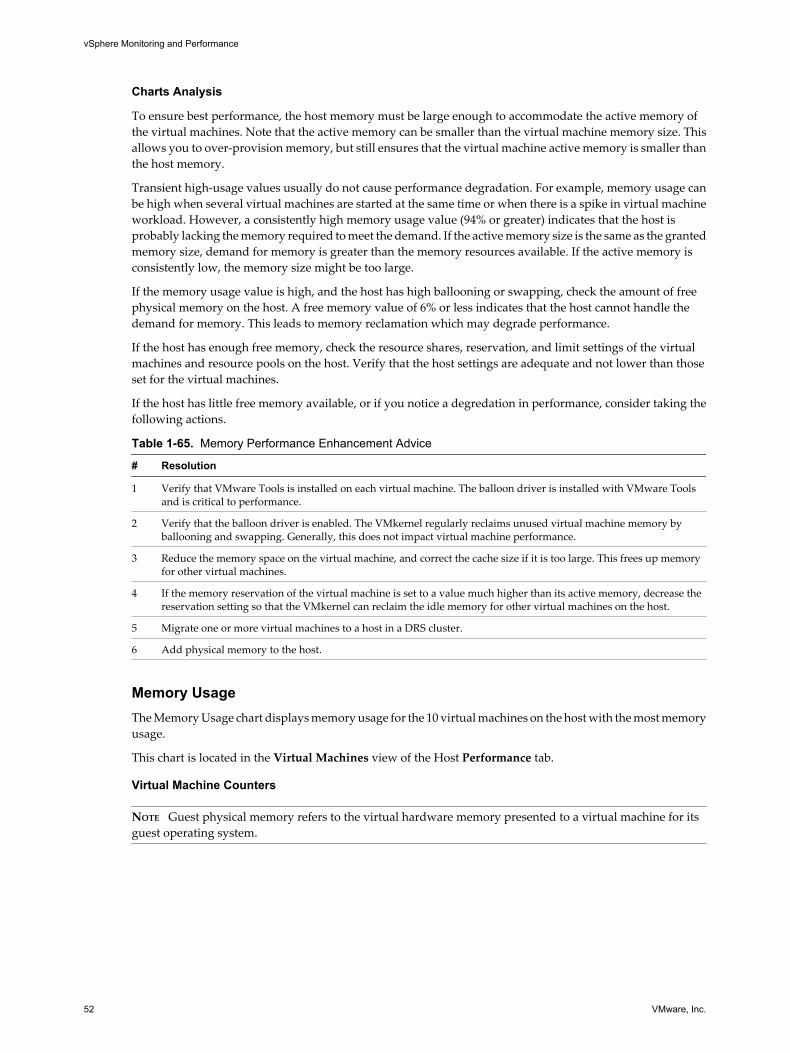
Charts Analysis
To ensure best performance, the host memory must be large enough to accommodate the active memory ofthe virtual machines. Note that the active memory can be smaller than the virtual machine memory size. Thisallows you to over-provision memory, but still ensures that the virtual machine active memory is smaller thanthe host memory.
Transient high-usage values usually do not cause performance degradation. For example, memory usage canbe high when several virtual machines are started at the same time or when there is a spike in virtual machineworkload. However, a consistently high memory usage value (94% or greater) indicates that the host isprobably lacking the memory required to meet the demand. If the active memory size is the same as the grantedmemory size, demand for memory is greater than the memory resources available. If the active memory isconsistently low, the memory size might be too large.
If the memory usage value is high, and the host has high ballooning or swapping, check the amount of freephysical memory on the host. A free memory value of 6% or less indicates that the host cannot handle thedemand for memory. This leads to memory reclamation which may degrade performance.
If the host has enough free memory, check the resource shares, reservation, and limit settings of the virtualmachines and resource pools on the host. Verify that the host settings are adequate and not lower than thoseset for the virtual machines.
If the host has little free memory available, or if you notice a degredation in performance, consider taking thefollowing actions.
Table 1-65. Memory Performance Enhancement Advice
# Resolution
1 Verify that VMware Tools is installed on each virtual machine. The balloon driver is installed with VMware Toolsand is critical to performance.
2 Verify that the balloon driver is enabled. The VMkernel regularly reclaims unused virtual machine memory byballooning and swapping. Generally, this does not impact virtual machine performance.
3 Reduce the memory space on the virtual machine, and correct the cache size if it is too large. This frees up memoryfor other virtual machines.
4 If the memory reservation of the virtual machine is set to a value much higher than its active memory, decrease thereservation setting so that the VMkernel can reclaim the idle memory for other virtual machines on the host.
5 Migrate one or more virtual machines to a host in a DRS cluster.
6 Add physical memory to the host.
Memory UsageThe Memory Usage chart displays memory usage for the 10 virtual machines on the host with the most memoryusage.
This chart is located in the Virtual Machines view of the Host Performance tab.
Virtual Machine Counters
NOTE Guest physical memory refers to the virtual hardware memory presented to a virtual machine for itsguest operating system.
vSphere Monitoring and Performance
52 VMware, Inc.
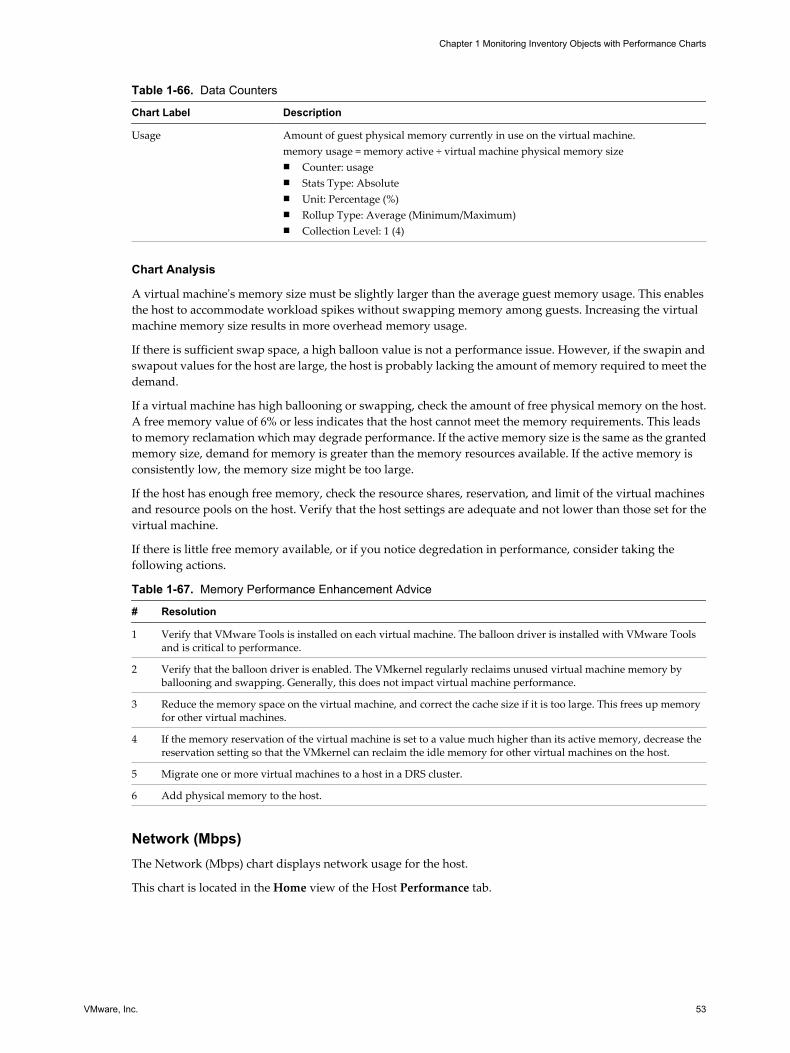
Table 1-66. Data Counters
Chart Label Description
Usage Amount of guest physical memory currently in use on the virtual machine.memory usage = memory active ÷ virtual machine physical memory sizen Counter: usagen Stats Type: Absoluten Unit: Percentage (%)n Rollup Type: Average (Minimum/Maximum)n Collection Level: 1 (4)
Chart Analysis
A virtual machine's memory size must be slightly larger than the average guest memory usage. This enablesthe host to accommodate workload spikes without swapping memory among guests. Increasing the virtualmachine memory size results in more overhead memory usage.
If there is sufficient swap space, a high balloon value is not a performance issue. However, if the swapin andswapout values for the host are large, the host is probably lacking the amount of memory required to meet thedemand.
If a virtual machine has high ballooning or swapping, check the amount of free physical memory on the host.A free memory value of 6% or less indicates that the host cannot meet the memory requirements. This leadsto memory reclamation which may degrade performance. If the active memory size is the same as the grantedmemory size, demand for memory is greater than the memory resources available. If the active memory isconsistently low, the memory size might be too large.
If the host has enough free memory, check the resource shares, reservation, and limit of the virtual machinesand resource pools on the host. Verify that the host settings are adequate and not lower than those set for thevirtual machine.
If there is little free memory available, or if you notice degredation in performance, consider taking thefollowing actions.
Table 1-67. Memory Performance Enhancement Advice
# Resolution
1 Verify that VMware Tools is installed on each virtual machine. The balloon driver is installed with VMware Toolsand is critical to performance.
2 Verify that the balloon driver is enabled. The VMkernel regularly reclaims unused virtual machine memory byballooning and swapping. Generally, this does not impact virtual machine performance.
3 Reduce the memory space on the virtual machine, and correct the cache size if it is too large. This frees up memoryfor other virtual machines.
4 If the memory reservation of the virtual machine is set to a value much higher than its active memory, decrease thereservation setting so that the VMkernel can reclaim the idle memory for other virtual machines on the host.
5 Migrate one or more virtual machines to a host in a DRS cluster.
6 Add physical memory to the host.
Network (Mbps)The Network (Mbps) chart displays network usage for the host.
This chart is located in the Home view of the Host Performance tab.
Chapter 1 Monitoring Inventory Objects with Performance Charts
VMware, Inc. 53
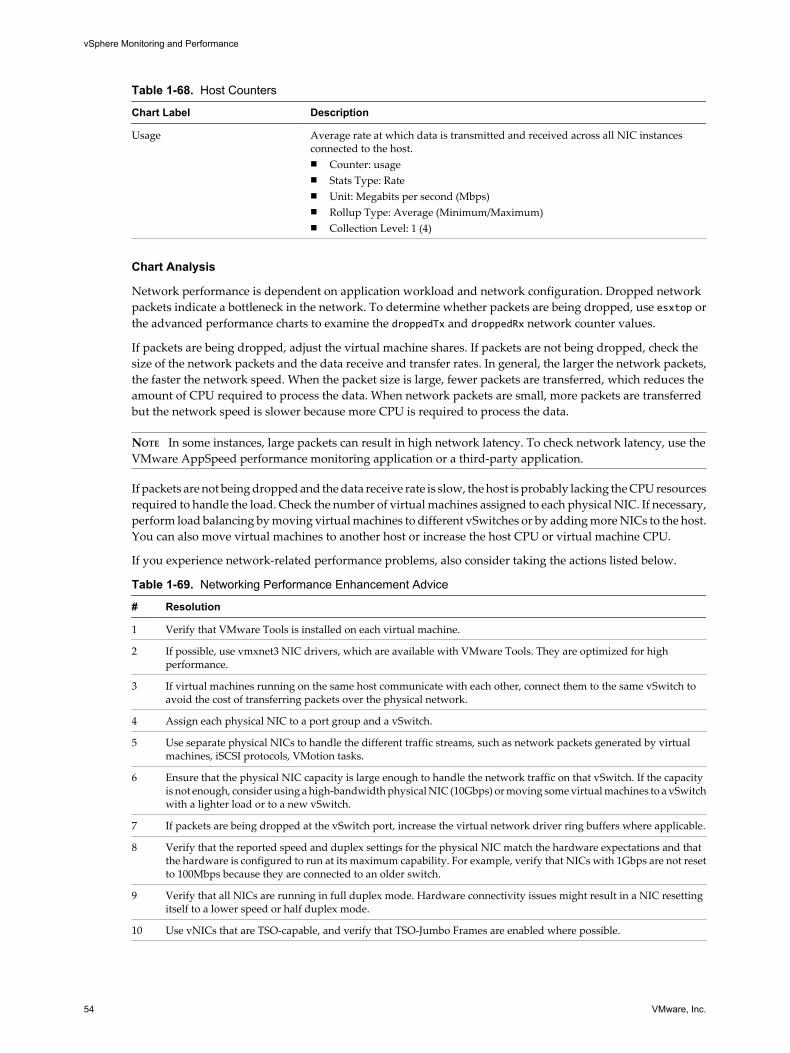
Table 1-68. Host Counters
Chart Label Description
Usage Average rate at which data is transmitted and received across all NIC instancesconnected to the host.n Counter: usagen Stats Type: Raten Unit: Megabits per second (Mbps)n Rollup Type: Average (Minimum/Maximum)n Collection Level: 1 (4)
Chart Analysis
Network performance is dependent on application workload and network configuration. Dropped networkpackets indicate a bottleneck in the network. To determine whether packets are being dropped, use esxtop orthe advanced performance charts to examine the droppedTx and droppedRx network counter values.
If packets are being dropped, adjust the virtual machine shares. If packets are not being dropped, check thesize of the network packets and the data receive and transfer rates. In general, the larger the network packets,the faster the network speed. When the packet size is large, fewer packets are transferred, which reduces theamount of CPU required to process the data. When network packets are small, more packets are transferredbut the network speed is slower because more CPU is required to process the data.
NOTE In some instances, large packets can result in high network latency. To check network latency, use theVMware AppSpeed performance monitoring application or a third-party application.
If packets are not being dropped and the data receive rate is slow, the host is probably lacking the CPU resourcesrequired to handle the load. Check the number of virtual machines assigned to each physical NIC. If necessary,perform load balancing by moving virtual machines to different vSwitches or by adding more NICs to the host.You can also move virtual machines to another host or increase the host CPU or virtual machine CPU.
If you experience network-related performance problems, also consider taking the actions listed below.
Table 1-69. Networking Performance Enhancement Advice
# Resolution
1 Verify that VMware Tools is installed on each virtual machine.
2 If possible, use vmxnet3 NIC drivers, which are available with VMware Tools. They are optimized for highperformance.
3 If virtual machines running on the same host communicate with each other, connect them to the same vSwitch toavoid the cost of transferring packets over the physical network.
4 Assign each physical NIC to a port group and a vSwitch.
5 Use separate physical NICs to handle the different traffic streams, such as network packets generated by virtualmachines, iSCSI protocols, VMotion tasks.
6 Ensure that the physical NIC capacity is large enough to handle the network traffic on that vSwitch. If the capacityis not enough, consider using a high-bandwidth physical NIC (10Gbps) or moving some virtual machines to a vSwitchwith a lighter load or to a new vSwitch.
7 If packets are being dropped at the vSwitch port, increase the virtual network driver ring buffers where applicable.
8 Verify that the reported speed and duplex settings for the physical NIC match the hardware expectations and thatthe hardware is configured to run at its maximum capability. For example, verify that NICs with 1Gbps are not resetto 100Mbps because they are connected to an older switch.
9 Verify that all NICs are running in full duplex mode. Hardware connectivity issues might result in a NIC resettingitself to a lower speed or half duplex mode.
10 Use vNICs that are TSO-capable, and verify that TSO-Jumbo Frames are enabled where possible.
vSphere Monitoring and Performance
54 VMware, Inc.
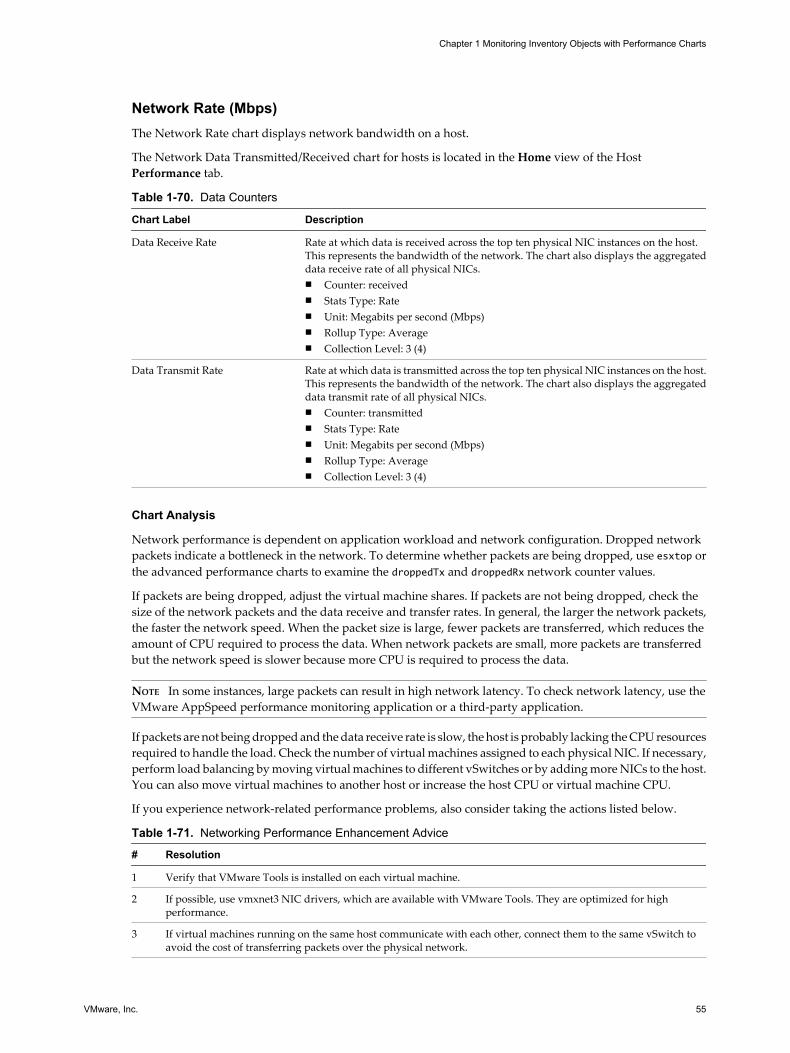
Network Rate (Mbps)The Network Rate chart displays network bandwidth on a host.
The Network Data Transmitted/Received chart for hosts is located in the Home view of the HostPerformance tab.
Table 1-70. Data Counters
Chart Label Description
Data Receive Rate Rate at which data is received across the top ten physical NIC instances on the host.This represents the bandwidth of the network. The chart also displays the aggregateddata receive rate of all physical NICs.n Counter: receivedn Stats Type: Raten Unit: Megabits per second (Mbps)n Rollup Type: Averagen Collection Level: 3 (4)
Data Transmit Rate Rate at which data is transmitted across the top ten physical NIC instances on the host.This represents the bandwidth of the network. The chart also displays the aggregateddata transmit rate of all physical NICs.n Counter: transmittedn Stats Type: Raten Unit: Megabits per second (Mbps)n Rollup Type: Averagen Collection Level: 3 (4)
Chart Analysis
Network performance is dependent on application workload and network configuration. Dropped networkpackets indicate a bottleneck in the network. To determine whether packets are being dropped, use esxtop orthe advanced performance charts to examine the droppedTx and droppedRx network counter values.
If packets are being dropped, adjust the virtual machine shares. If packets are not being dropped, check thesize of the network packets and the data receive and transfer rates. In general, the larger the network packets,the faster the network speed. When the packet size is large, fewer packets are transferred, which reduces theamount of CPU required to process the data. When network packets are small, more packets are transferredbut the network speed is slower because more CPU is required to process the data.
NOTE In some instances, large packets can result in high network latency. To check network latency, use theVMware AppSpeed performance monitoring application or a third-party application.
If packets are not being dropped and the data receive rate is slow, the host is probably lacking the CPU resourcesrequired to handle the load. Check the number of virtual machines assigned to each physical NIC. If necessary,perform load balancing by moving virtual machines to different vSwitches or by adding more NICs to the host.You can also move virtual machines to another host or increase the host CPU or virtual machine CPU.
If you experience network-related performance problems, also consider taking the actions listed below.
Table 1-71. Networking Performance Enhancement Advice
# Resolution
1 Verify that VMware Tools is installed on each virtual machine.
2 If possible, use vmxnet3 NIC drivers, which are available with VMware Tools. They are optimized for highperformance.
3 If virtual machines running on the same host communicate with each other, connect them to the same vSwitch toavoid the cost of transferring packets over the physical network.
Chapter 1 Monitoring Inventory Objects with Performance Charts
VMware, Inc. 55
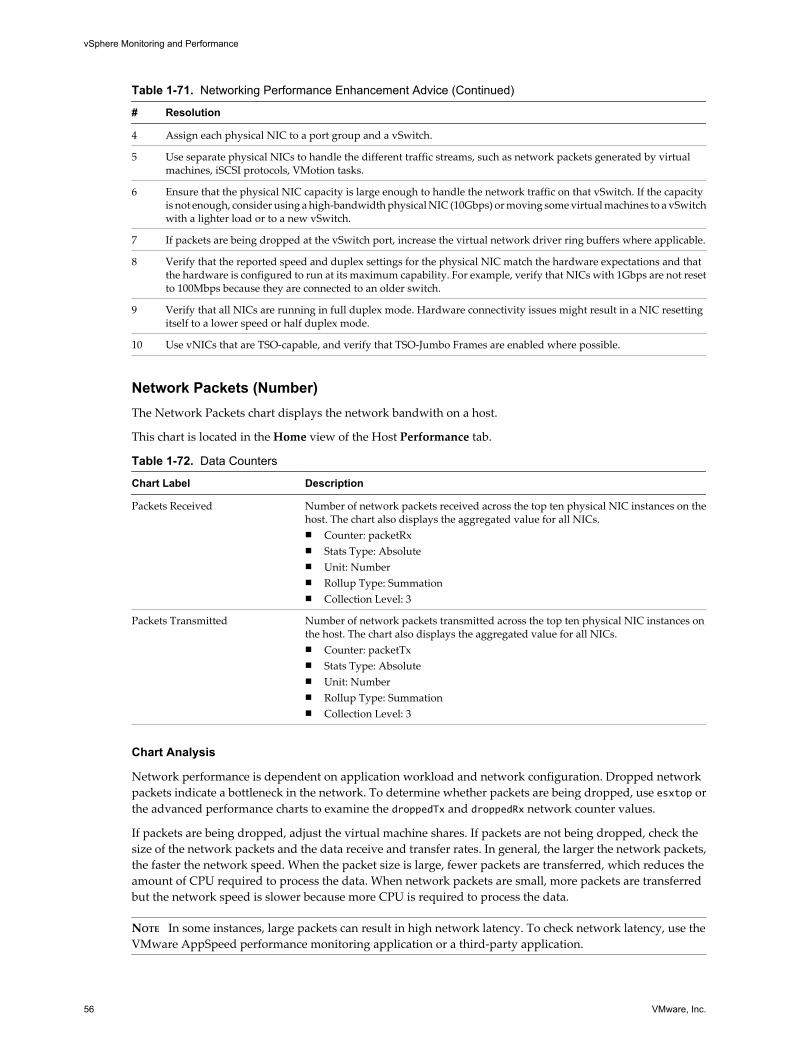
Table 1-71. Networking Performance Enhancement Advice (Continued)
# Resolution
4 Assign each physical NIC to a port group and a vSwitch.
5 Use separate physical NICs to handle the different traffic streams, such as network packets generated by virtualmachines, iSCSI protocols, VMotion tasks.
6 Ensure that the physical NIC capacity is large enough to handle the network traffic on that vSwitch. If the capacityis not enough, consider using a high-bandwidth physical NIC (10Gbps) or moving some virtual machines to a vSwitchwith a lighter load or to a new vSwitch.
7 If packets are being dropped at the vSwitch port, increase the virtual network driver ring buffers where applicable.
8 Verify that the reported speed and duplex settings for the physical NIC match the hardware expectations and thatthe hardware is configured to run at its maximum capability. For example, verify that NICs with 1Gbps are not resetto 100Mbps because they are connected to an older switch.
9 Verify that all NICs are running in full duplex mode. Hardware connectivity issues might result in a NIC resettingitself to a lower speed or half duplex mode.
10 Use vNICs that are TSO-capable, and verify that TSO-Jumbo Frames are enabled where possible.
Network Packets (Number)The Network Packets chart displays the network bandwith on a host.
This chart is located in the Home view of the Host Performance tab.
Table 1-72. Data Counters
Chart Label Description
Packets Received Number of network packets received across the top ten physical NIC instances on thehost. The chart also displays the aggregated value for all NICs.n Counter: packetRxn Stats Type: Absoluten Unit: Numbern Rollup Type: Summationn Collection Level: 3
Packets Transmitted Number of network packets transmitted across the top ten physical NIC instances onthe host. The chart also displays the aggregated value for all NICs.n Counter: packetTxn Stats Type: Absoluten Unit: Numbern Rollup Type: Summationn Collection Level: 3
Chart Analysis
Network performance is dependent on application workload and network configuration. Dropped networkpackets indicate a bottleneck in the network. To determine whether packets are being dropped, use esxtop orthe advanced performance charts to examine the droppedTx and droppedRx network counter values.
If packets are being dropped, adjust the virtual machine shares. If packets are not being dropped, check thesize of the network packets and the data receive and transfer rates. In general, the larger the network packets,the faster the network speed. When the packet size is large, fewer packets are transferred, which reduces theamount of CPU required to process the data. When network packets are small, more packets are transferredbut the network speed is slower because more CPU is required to process the data.
NOTE In some instances, large packets can result in high network latency. To check network latency, use theVMware AppSpeed performance monitoring application or a third-party application.
vSphere Monitoring and Performance
56 VMware, Inc.
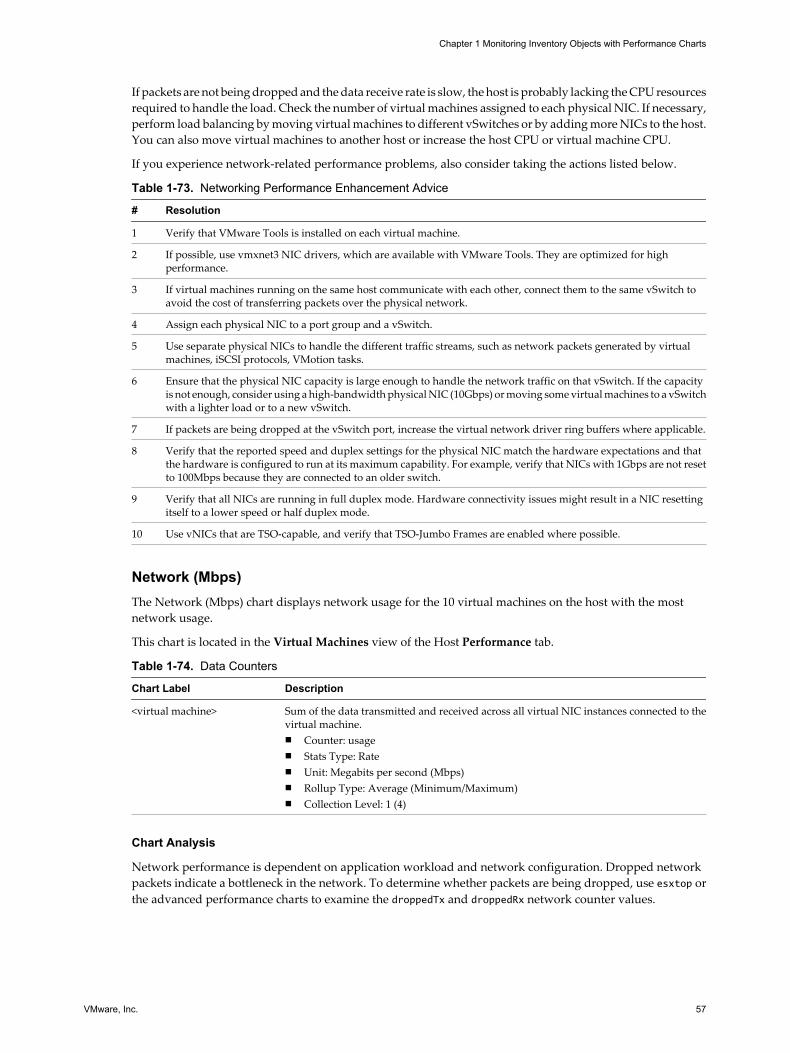
If packets are not being dropped and the data receive rate is slow, the host is probably lacking the CPU resourcesrequired to handle the load. Check the number of virtual machines assigned to each physical NIC. If necessary,perform load balancing by moving virtual machines to different vSwitches or by adding more NICs to the host.You can also move virtual machines to another host or increase the host CPU or virtual machine CPU.
If you experience network-related performance problems, also consider taking the actions listed below.
Table 1-73. Networking Performance Enhancement Advice
# Resolution
1 Verify that VMware Tools is installed on each virtual machine.
2 If possible, use vmxnet3 NIC drivers, which are available with VMware Tools. They are optimized for highperformance.
3 If virtual machines running on the same host communicate with each other, connect them to the same vSwitch toavoid the cost of transferring packets over the physical network.
4 Assign each physical NIC to a port group and a vSwitch.
5 Use separate physical NICs to handle the different traffic streams, such as network packets generated by virtualmachines, iSCSI protocols, VMotion tasks.
6 Ensure that the physical NIC capacity is large enough to handle the network traffic on that vSwitch. If the capacityis not enough, consider using a high-bandwidth physical NIC (10Gbps) or moving some virtual machines to a vSwitchwith a lighter load or to a new vSwitch.
7 If packets are being dropped at the vSwitch port, increase the virtual network driver ring buffers where applicable.
8 Verify that the reported speed and duplex settings for the physical NIC match the hardware expectations and thatthe hardware is configured to run at its maximum capability. For example, verify that NICs with 1Gbps are not resetto 100Mbps because they are connected to an older switch.
9 Verify that all NICs are running in full duplex mode. Hardware connectivity issues might result in a NIC resettingitself to a lower speed or half duplex mode.
10 Use vNICs that are TSO-capable, and verify that TSO-Jumbo Frames are enabled where possible.
Network (Mbps)The Network (Mbps) chart displays network usage for the 10 virtual machines on the host with the mostnetwork usage.
This chart is located in the Virtual Machines view of the Host Performance tab.
Table 1-74. Data Counters
Chart Label Description
<virtual machine> Sum of the data transmitted and received across all virtual NIC instances connected to thevirtual machine.n Counter: usagen Stats Type: Raten Unit: Megabits per second (Mbps)n Rollup Type: Average (Minimum/Maximum)n Collection Level: 1 (4)
Chart Analysis
Network performance is dependent on application workload and network configuration. Dropped networkpackets indicate a bottleneck in the network. To determine whether packets are being dropped, use esxtop orthe advanced performance charts to examine the droppedTx and droppedRx network counter values.
Chapter 1 Monitoring Inventory Objects with Performance Charts
VMware, Inc. 57
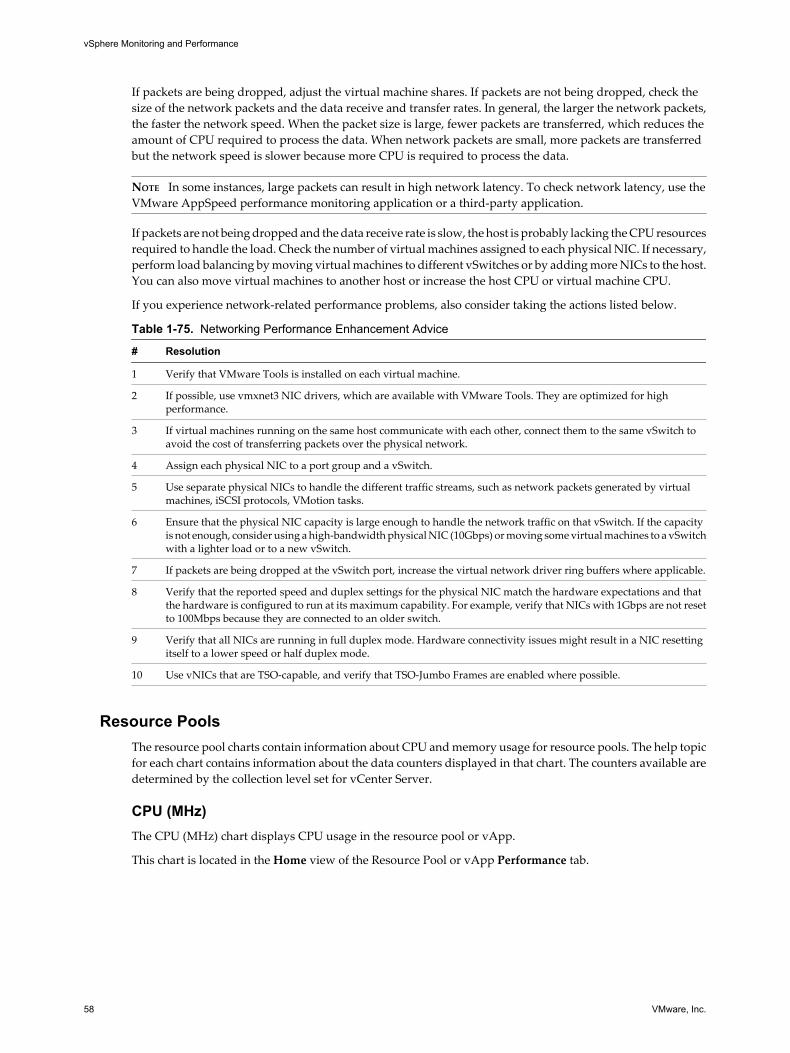
If packets are being dropped, adjust the virtual machine shares. If packets are not being dropped, check thesize of the network packets and the data receive and transfer rates. In general, the larger the network packets,the faster the network speed. When the packet size is large, fewer packets are transferred, which reduces theamount of CPU required to process the data. When network packets are small, more packets are transferredbut the network speed is slower because more CPU is required to process the data.
NOTE In some instances, large packets can result in high network latency. To check network latency, use theVMware AppSpeed performance monitoring application or a third-party application.
If packets are not being dropped and the data receive rate is slow, the host is probably lacking the CPU resourcesrequired to handle the load. Check the number of virtual machines assigned to each physical NIC. If necessary,perform load balancing by moving virtual machines to different vSwitches or by adding more NICs to the host.You can also move virtual machines to another host or increase the host CPU or virtual machine CPU.
If you experience network-related performance problems, also consider taking the actions listed below.
Table 1-75. Networking Performance Enhancement Advice
# Resolution
1 Verify that VMware Tools is installed on each virtual machine.
2 If possible, use vmxnet3 NIC drivers, which are available with VMware Tools. They are optimized for highperformance.
3 If virtual machines running on the same host communicate with each other, connect them to the same vSwitch toavoid the cost of transferring packets over the physical network.
4 Assign each physical NIC to a port group and a vSwitch.
5 Use separate physical NICs to handle the different traffic streams, such as network packets generated by virtualmachines, iSCSI protocols, VMotion tasks.
6 Ensure that the physical NIC capacity is large enough to handle the network traffic on that vSwitch. If the capacityis not enough, consider using a high-bandwidth physical NIC (10Gbps) or moving some virtual machines to a vSwitchwith a lighter load or to a new vSwitch.
7 If packets are being dropped at the vSwitch port, increase the virtual network driver ring buffers where applicable.
8 Verify that the reported speed and duplex settings for the physical NIC match the hardware expectations and thatthe hardware is configured to run at its maximum capability. For example, verify that NICs with 1Gbps are not resetto 100Mbps because they are connected to an older switch.
9 Verify that all NICs are running in full duplex mode. Hardware connectivity issues might result in a NIC resettingitself to a lower speed or half duplex mode.
10 Use vNICs that are TSO-capable, and verify that TSO-Jumbo Frames are enabled where possible.
Resource PoolsThe resource pool charts contain information about CPU and memory usage for resource pools. The help topicfor each chart contains information about the data counters displayed in that chart. The counters available aredetermined by the collection level set for vCenter Server.
CPU (MHz)The CPU (MHz) chart displays CPU usage in the resource pool or vApp.
This chart is located in the Home view of the Resource Pool or vApp Performance tab.
vSphere Monitoring and Performance
58 VMware, Inc.
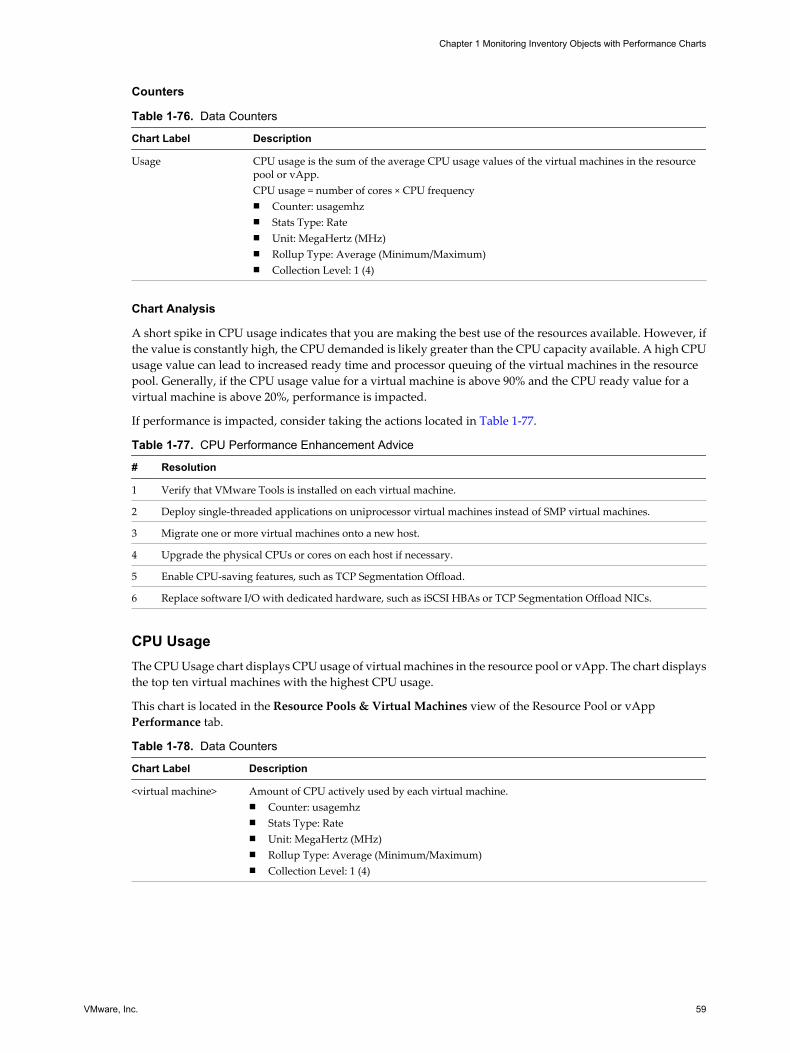
Counters
Table 1-76. Data Counters
Chart Label Description
Usage CPU usage is the sum of the average CPU usage values of the virtual machines in the resourcepool or vApp.CPU usage = number of cores × CPU frequencyn Counter: usagemhzn Stats Type: Raten Unit: MegaHertz (MHz)n Rollup Type: Average (Minimum/Maximum)n Collection Level: 1 (4)
Chart Analysis
A short spike in CPU usage indicates that you are making the best use of the resources available. However, ifthe value is constantly high, the CPU demanded is likely greater than the CPU capacity available. A high CPUusage value can lead to increased ready time and processor queuing of the virtual machines in the resourcepool. Generally, if the CPU usage value for a virtual machine is above 90% and the CPU ready value for avirtual machine is above 20%, performance is impacted.
If performance is impacted, consider taking the actions located in Table 1-77.
Table 1-77. CPU Performance Enhancement Advice
# Resolution
1 Verify that VMware Tools is installed on each virtual machine.
2 Deploy single-threaded applications on uniprocessor virtual machines instead of SMP virtual machines.
3 Migrate one or more virtual machines onto a new host.
4 Upgrade the physical CPUs or cores on each host if necessary.
5 Enable CPU-saving features, such as TCP Segmentation Offload.
6 Replace software I/O with dedicated hardware, such as iSCSI HBAs or TCP Segmentation Offload NICs.
CPU UsageThe CPU Usage chart displays CPU usage of virtual machines in the resource pool or vApp. The chart displaysthe top ten virtual machines with the highest CPU usage.
This chart is located in the Resource Pools & Virtual Machines view of the Resource Pool or vAppPerformance tab.
Table 1-78. Data Counters
Chart Label Description
<virtual machine> Amount of CPU actively used by each virtual machine.n Counter: usagemhzn Stats Type: Raten Unit: MegaHertz (MHz)n Rollup Type: Average (Minimum/Maximum)n Collection Level: 1 (4)
Chapter 1 Monitoring Inventory Objects with Performance Charts
VMware, Inc. 59
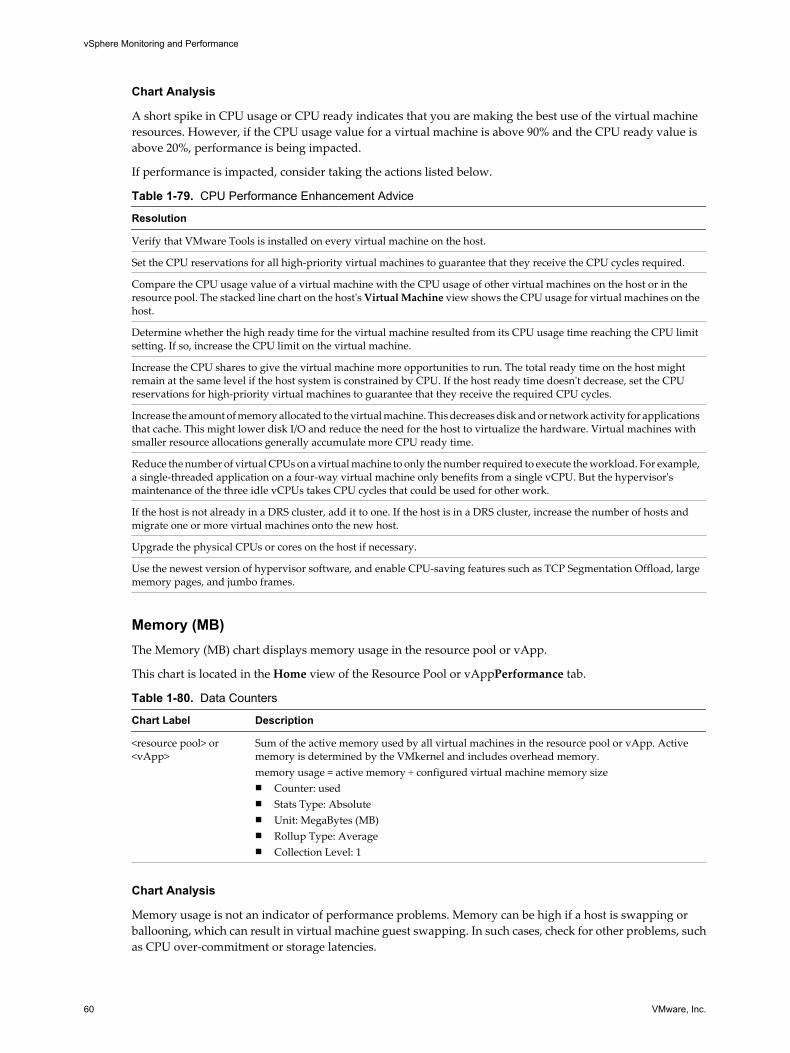
Chart Analysis
A short spike in CPU usage or CPU ready indicates that you are making the best use of the virtual machineresources. However, if the CPU usage value for a virtual machine is above 90% and the CPU ready value isabove 20%, performance is being impacted.
If performance is impacted, consider taking the actions listed below.
Table 1-79. CPU Performance Enhancement Advice
Resolution
Verify that VMware Tools is installed on every virtual machine on the host.
Set the CPU reservations for all high-priority virtual machines to guarantee that they receive the CPU cycles required.
Compare the CPU usage value of a virtual machine with the CPU usage of other virtual machines on the host or in theresource pool. The stacked line chart on the host's Virtual Machine view shows the CPU usage for virtual machines on thehost.
Determine whether the high ready time for the virtual machine resulted from its CPU usage time reaching the CPU limitsetting. If so, increase the CPU limit on the virtual machine.
Increase the CPU shares to give the virtual machine more opportunities to run. The total ready time on the host mightremain at the same level if the host system is constrained by CPU. If the host ready time doesn't decrease, set the CPUreservations for high-priority virtual machines to guarantee that they receive the required CPU cycles.
Increase the amount of memory allocated to the virtual machine. This decreases disk and or network activity for applicationsthat cache. This might lower disk I/O and reduce the need for the host to virtualize the hardware. Virtual machines withsmaller resource allocations generally accumulate more CPU ready time.
Reduce the number of virtual CPUs on a virtual machine to only the number required to execute the workload. For example,a single-threaded application on a four-way virtual machine only benefits from a single vCPU. But the hypervisor'smaintenance of the three idle vCPUs takes CPU cycles that could be used for other work.
If the host is not already in a DRS cluster, add it to one. If the host is in a DRS cluster, increase the number of hosts andmigrate one or more virtual machines onto the new host.
Upgrade the physical CPUs or cores on the host if necessary.
Use the newest version of hypervisor software, and enable CPU-saving features such as TCP Segmentation Offload, largememory pages, and jumbo frames.
Memory (MB)The Memory (MB) chart displays memory usage in the resource pool or vApp.
This chart is located in the Home view of the Resource Pool or vAppPerformance tab.
Table 1-80. Data Counters
Chart Label Description
<resource pool> or<vApp>
Sum of the active memory used by all virtual machines in the resource pool or vApp. Activememory is determined by the VMkernel and includes overhead memory.memory usage = active memory ÷ configured virtual machine memory sizen Counter: usedn Stats Type: Absoluten Unit: MegaBytes (MB)n Rollup Type: Averagen Collection Level: 1
Chart Analysis
Memory usage is not an indicator of performance problems. Memory can be high if a host is swapping orballooning, which can result in virtual machine guest swapping. In such cases, check for other problems, suchas CPU over-commitment or storage latencies.
vSphere Monitoring and Performance
60 VMware, Inc.
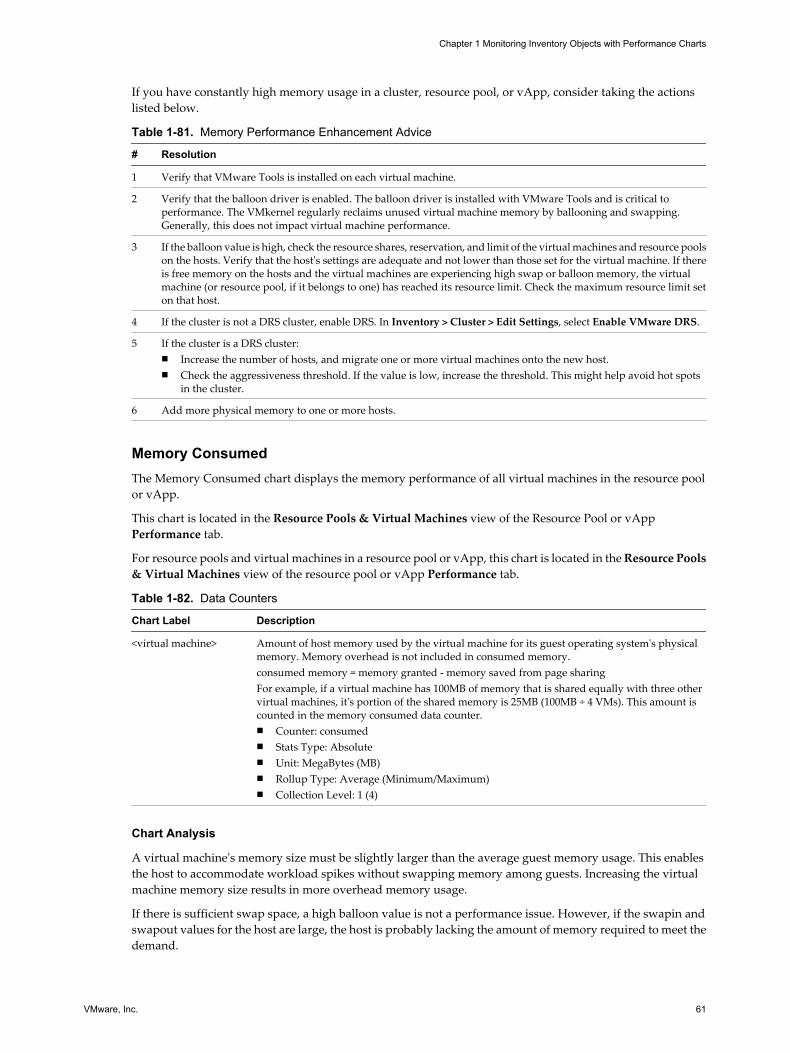
If you have constantly high memory usage in a cluster, resource pool, or vApp, consider taking the actionslisted below.
Table 1-81. Memory Performance Enhancement Advice
# Resolution
1 Verify that VMware Tools is installed on each virtual machine.
2 Verify that the balloon driver is enabled. The balloon driver is installed with VMware Tools and is critical toperformance. The VMkernel regularly reclaims unused virtual machine memory by ballooning and swapping.Generally, this does not impact virtual machine performance.
3 If the balloon value is high, check the resource shares, reservation, and limit of the virtual machines and resource poolson the hosts. Verify that the host's settings are adequate and not lower than those set for the virtual machine. If thereis free memory on the hosts and the virtual machines are experiencing high swap or balloon memory, the virtualmachine (or resource pool, if it belongs to one) has reached its resource limit. Check the maximum resource limit seton that host.
4 If the cluster is not a DRS cluster, enable DRS. In Inventory > Cluster > Edit Settings, select Enable VMware DRS.
5 If the cluster is a DRS cluster:n Increase the number of hosts, and migrate one or more virtual machines onto the new host.n Check the aggressiveness threshold. If the value is low, increase the threshold. This might help avoid hot spots
in the cluster.
6 Add more physical memory to one or more hosts.
Memory ConsumedThe Memory Consumed chart displays the memory performance of all virtual machines in the resource poolor vApp.
This chart is located in the Resource Pools & Virtual Machines view of the Resource Pool or vAppPerformance tab.
For resource pools and virtual machines in a resource pool or vApp, this chart is located in the Resource Pools& Virtual Machines view of the resource pool or vApp Performance tab.
Table 1-82. Data Counters
Chart Label Description
<virtual machine> Amount of host memory used by the virtual machine for its guest operating system's physicalmemory. Memory overhead is not included in consumed memory.consumed memory = memory granted - memory saved from page sharingFor example, if a virtual machine has 100MB of memory that is shared equally with three othervirtual machines, it's portion of the shared memory is 25MB (100MB ÷ 4 VMs). This amount iscounted in the memory consumed data counter.n Counter: consumedn Stats Type: Absoluten Unit: MegaBytes (MB)n Rollup Type: Average (Minimum/Maximum)n Collection Level: 1 (4)
Chart Analysis
A virtual machine's memory size must be slightly larger than the average guest memory usage. This enablesthe host to accommodate workload spikes without swapping memory among guests. Increasing the virtualmachine memory size results in more overhead memory usage.
If there is sufficient swap space, a high balloon value is not a performance issue. However, if the swapin andswapout values for the host are large, the host is probably lacking the amount of memory required to meet thedemand.
Chapter 1 Monitoring Inventory Objects with Performance Charts
VMware, Inc. 61

If a virtual machine has high ballooning or swapping, check the amount of free physical memory on the host.A free memory value of 6% or less indicates that the host cannot meet the memory requirements. This leadsto memory reclamation which may degrade performance. If the active memory size is the same as the grantedmemory size, demand for memory is greater than the memory resources available. If the active memory isconsistently low, the memory size might be too large.
If the host has enough free memory, check the resource shares, reservation, and limit of the virtual machinesand resource pools on the host. Verify that the host settings are adequate and not lower than those set for thevirtual machine.
If there is little free memory available, or if you notice degredation in performance, consider taking thefollowing actions.
Table 1-83. Memory Performance Enhancement Advice
# Resolution
1 Verify that VMware Tools is installed on each virtual machine. The balloon driver is installed with VMware Toolsand is critical to performance.
2 Verify that the balloon driver is enabled. The VMkernel regularly reclaims unused virtual machine memory byballooning and swapping. Generally, this does not impact virtual machine performance.
3 Reduce the memory space on the virtual machine, and correct the cache size if it is too large. This frees up memoryfor other virtual machines.
4 If the memory reservation of the virtual machine is set to a value much higher than its active memory, decrease thereservation setting so that the VMkernel can reclaim the idle memory for other virtual machines on the host.
5 Migrate one or more virtual machines to a host in a DRS cluster.
6 Add physical memory to the host.
Memory (MB)The Memory (MB) chart displays memory data counters for resource pools or vApps.
Description
This chart is located in the Home view of the Resource Pool or vAppPerformance tab.
NOTE These data counter definitions are for virtual machines. At the resource pool level, the values are collectedand totaled. The counter values in the chart represent the aggregate amounts of the virtual machine data.Thecounters that appear in the chart depend on the collection level set for your vCenter Server.
Table 1-84. Data Counters
Chart Label Description
Active Sum of the active guest physical memory of all powered on virtual machines in theresource pool.n Counter: activen Stats Type: Absoluten Unit: MegaBytes (MB)n Rollup Type: Average (Minimum/Maximum)n Collection Level: 2 (4)
Balloon Sum of the guest physical memory reclaimed by the balloon driver for all powered onvirtual machines in the resource pool.n Counter: vmmemctln Stats Type: Absoluten Unit: MegaBytes (MB)n Rollup Type: Average (Minimum/Maximum)n Collection Level: 1 (4)
vSphere Monitoring and Performance
62 VMware, Inc.
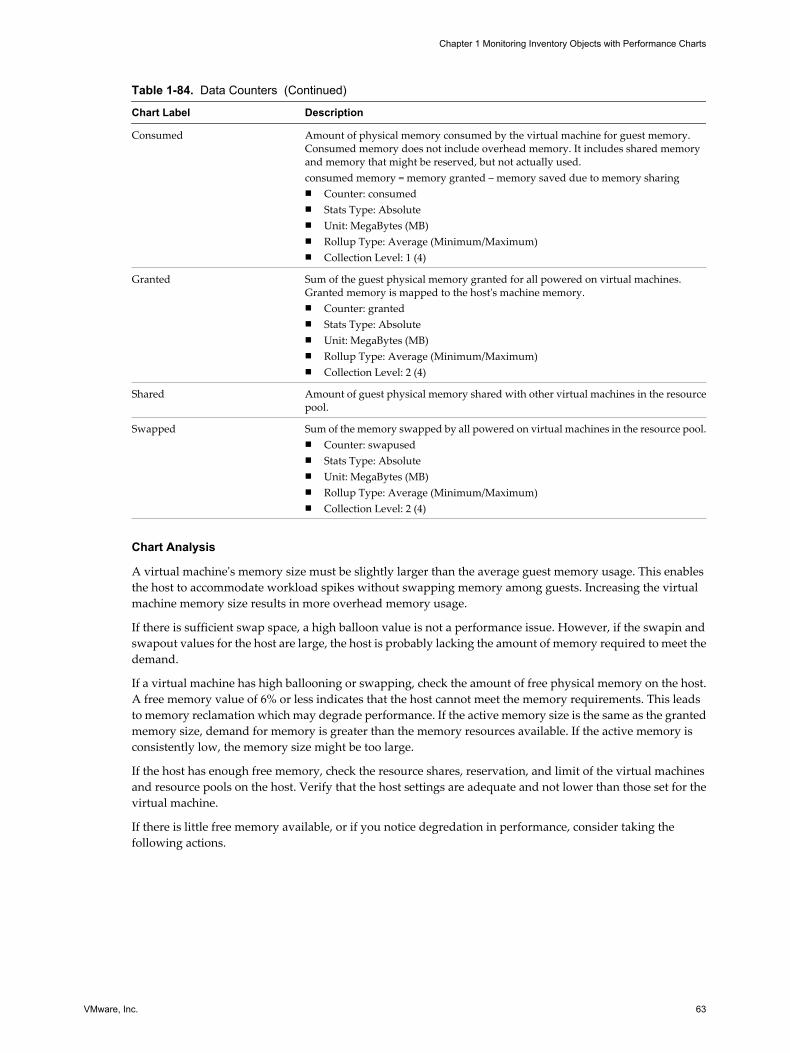
Table 1-84. Data Counters (Continued)
Chart Label Description
Consumed Amount of physical memory consumed by the virtual machine for guest memory.Consumed memory does not include overhead memory. It includes shared memoryand memory that might be reserved, but not actually used.consumed memory = memory granted – memory saved due to memory sharingn Counter: consumedn Stats Type: Absoluten Unit: MegaBytes (MB)n Rollup Type: Average (Minimum/Maximum)n Collection Level: 1 (4)
Granted Sum of the guest physical memory granted for all powered on virtual machines.Granted memory is mapped to the host's machine memory.n Counter: grantedn Stats Type: Absoluten Unit: MegaBytes (MB)n Rollup Type: Average (Minimum/Maximum)n Collection Level: 2 (4)
Shared Amount of guest physical memory shared with other virtual machines in the resourcepool.
Swapped Sum of the memory swapped by all powered on virtual machines in the resource pool.n Counter: swapusedn Stats Type: Absoluten Unit: MegaBytes (MB)n Rollup Type: Average (Minimum/Maximum)n Collection Level: 2 (4)
Chart Analysis
A virtual machine's memory size must be slightly larger than the average guest memory usage. This enablesthe host to accommodate workload spikes without swapping memory among guests. Increasing the virtualmachine memory size results in more overhead memory usage.
If there is sufficient swap space, a high balloon value is not a performance issue. However, if the swapin andswapout values for the host are large, the host is probably lacking the amount of memory required to meet thedemand.
If a virtual machine has high ballooning or swapping, check the amount of free physical memory on the host.A free memory value of 6% or less indicates that the host cannot meet the memory requirements. This leadsto memory reclamation which may degrade performance. If the active memory size is the same as the grantedmemory size, demand for memory is greater than the memory resources available. If the active memory isconsistently low, the memory size might be too large.
If the host has enough free memory, check the resource shares, reservation, and limit of the virtual machinesand resource pools on the host. Verify that the host settings are adequate and not lower than those set for thevirtual machine.
If there is little free memory available, or if you notice degredation in performance, consider taking thefollowing actions.
Chapter 1 Monitoring Inventory Objects with Performance Charts
VMware, Inc. 63
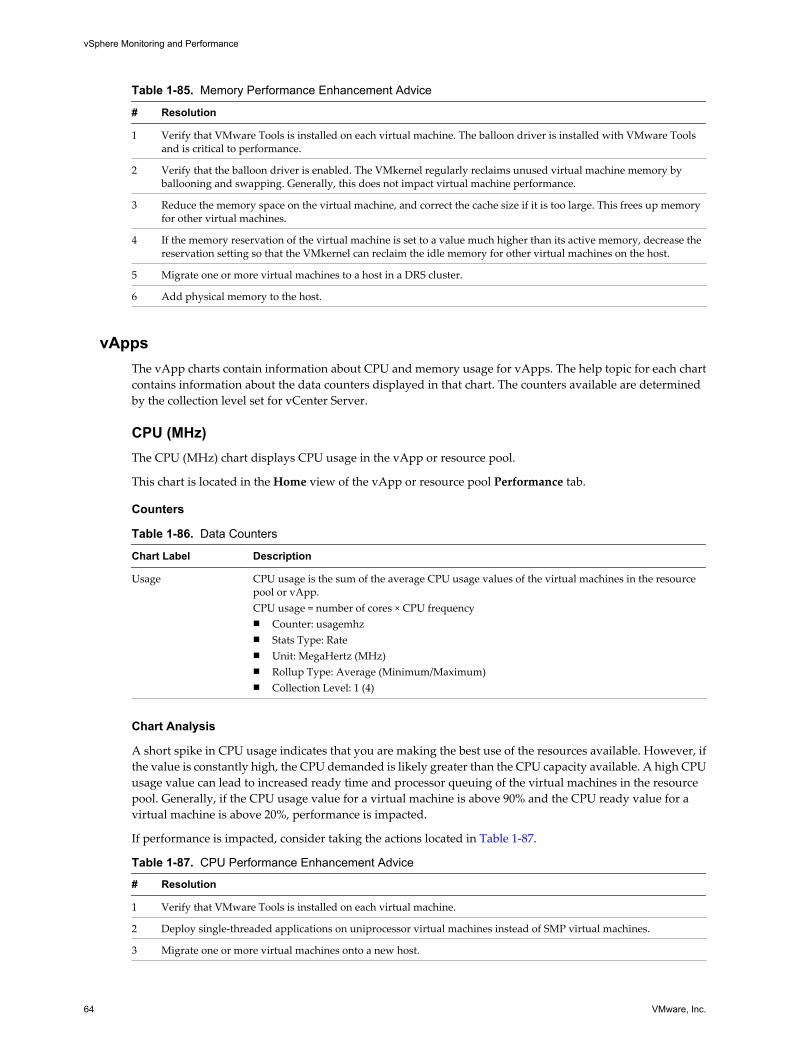
Table 1-85. Memory Performance Enhancement Advice
# Resolution
1 Verify that VMware Tools is installed on each virtual machine. The balloon driver is installed with VMware Toolsand is critical to performance.
2 Verify that the balloon driver is enabled. The VMkernel regularly reclaims unused virtual machine memory byballooning and swapping. Generally, this does not impact virtual machine performance.
3 Reduce the memory space on the virtual machine, and correct the cache size if it is too large. This frees up memoryfor other virtual machines.
4 If the memory reservation of the virtual machine is set to a value much higher than its active memory, decrease thereservation setting so that the VMkernel can reclaim the idle memory for other virtual machines on the host.
5 Migrate one or more virtual machines to a host in a DRS cluster.
6 Add physical memory to the host.
vAppsThe vApp charts contain information about CPU and memory usage for vApps. The help topic for each chartcontains information about the data counters displayed in that chart. The counters available are determinedby the collection level set for vCenter Server.
CPU (MHz)The CPU (MHz) chart displays CPU usage in the vApp or resource pool.
This chart is located in the Home view of the vApp or resource pool Performance tab.
Counters
Table 1-86. Data Counters
Chart Label Description
Usage CPU usage is the sum of the average CPU usage values of the virtual machines in the resourcepool or vApp.CPU usage = number of cores × CPU frequencyn Counter: usagemhzn Stats Type: Raten Unit: MegaHertz (MHz)n Rollup Type: Average (Minimum/Maximum)n Collection Level: 1 (4)
Chart Analysis
A short spike in CPU usage indicates that you are making the best use of the resources available. However, ifthe value is constantly high, the CPU demanded is likely greater than the CPU capacity available. A high CPUusage value can lead to increased ready time and processor queuing of the virtual machines in the resourcepool. Generally, if the CPU usage value for a virtual machine is above 90% and the CPU ready value for avirtual machine is above 20%, performance is impacted.
If performance is impacted, consider taking the actions located in Table 1-87.
Table 1-87. CPU Performance Enhancement Advice
# Resolution
1 Verify that VMware Tools is installed on each virtual machine.
2 Deploy single-threaded applications on uniprocessor virtual machines instead of SMP virtual machines.
3 Migrate one or more virtual machines onto a new host.
vSphere Monitoring and Performance
64 VMware, Inc.
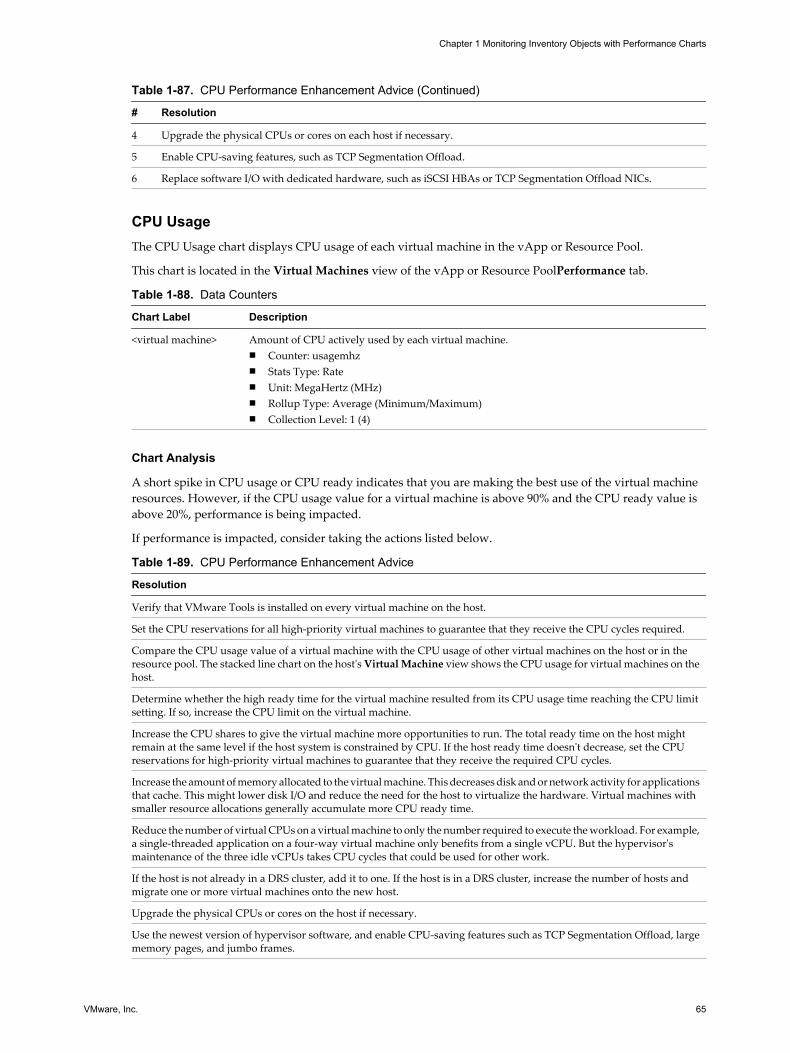
Table 1-87. CPU Performance Enhancement Advice (Continued)
# Resolution
4 Upgrade the physical CPUs or cores on each host if necessary.
5 Enable CPU-saving features, such as TCP Segmentation Offload.
6 Replace software I/O with dedicated hardware, such as iSCSI HBAs or TCP Segmentation Offload NICs.
CPU UsageThe CPU Usage chart displays CPU usage of each virtual machine in the vApp or Resource Pool.
This chart is located in the Virtual Machines view of the vApp or Resource PoolPerformance tab.
Table 1-88. Data Counters
Chart Label Description
<virtual machine> Amount of CPU actively used by each virtual machine.n Counter: usagemhzn Stats Type: Raten Unit: MegaHertz (MHz)n Rollup Type: Average (Minimum/Maximum)n Collection Level: 1 (4)
Chart Analysis
A short spike in CPU usage or CPU ready indicates that you are making the best use of the virtual machineresources. However, if the CPU usage value for a virtual machine is above 90% and the CPU ready value isabove 20%, performance is being impacted.
If performance is impacted, consider taking the actions listed below.
Table 1-89. CPU Performance Enhancement Advice
Resolution
Verify that VMware Tools is installed on every virtual machine on the host.
Set the CPU reservations for all high-priority virtual machines to guarantee that they receive the CPU cycles required.
Compare the CPU usage value of a virtual machine with the CPU usage of other virtual machines on the host or in theresource pool. The stacked line chart on the host's Virtual Machine view shows the CPU usage for virtual machines on thehost.
Determine whether the high ready time for the virtual machine resulted from its CPU usage time reaching the CPU limitsetting. If so, increase the CPU limit on the virtual machine.
Increase the CPU shares to give the virtual machine more opportunities to run. The total ready time on the host mightremain at the same level if the host system is constrained by CPU. If the host ready time doesn't decrease, set the CPUreservations for high-priority virtual machines to guarantee that they receive the required CPU cycles.
Increase the amount of memory allocated to the virtual machine. This decreases disk and or network activity for applicationsthat cache. This might lower disk I/O and reduce the need for the host to virtualize the hardware. Virtual machines withsmaller resource allocations generally accumulate more CPU ready time.
Reduce the number of virtual CPUs on a virtual machine to only the number required to execute the workload. For example,a single-threaded application on a four-way virtual machine only benefits from a single vCPU. But the hypervisor'smaintenance of the three idle vCPUs takes CPU cycles that could be used for other work.
If the host is not already in a DRS cluster, add it to one. If the host is in a DRS cluster, increase the number of hosts andmigrate one or more virtual machines onto the new host.
Upgrade the physical CPUs or cores on the host if necessary.
Use the newest version of hypervisor software, and enable CPU-saving features such as TCP Segmentation Offload, largememory pages, and jumbo frames.
Chapter 1 Monitoring Inventory Objects with Performance Charts
VMware, Inc. 65
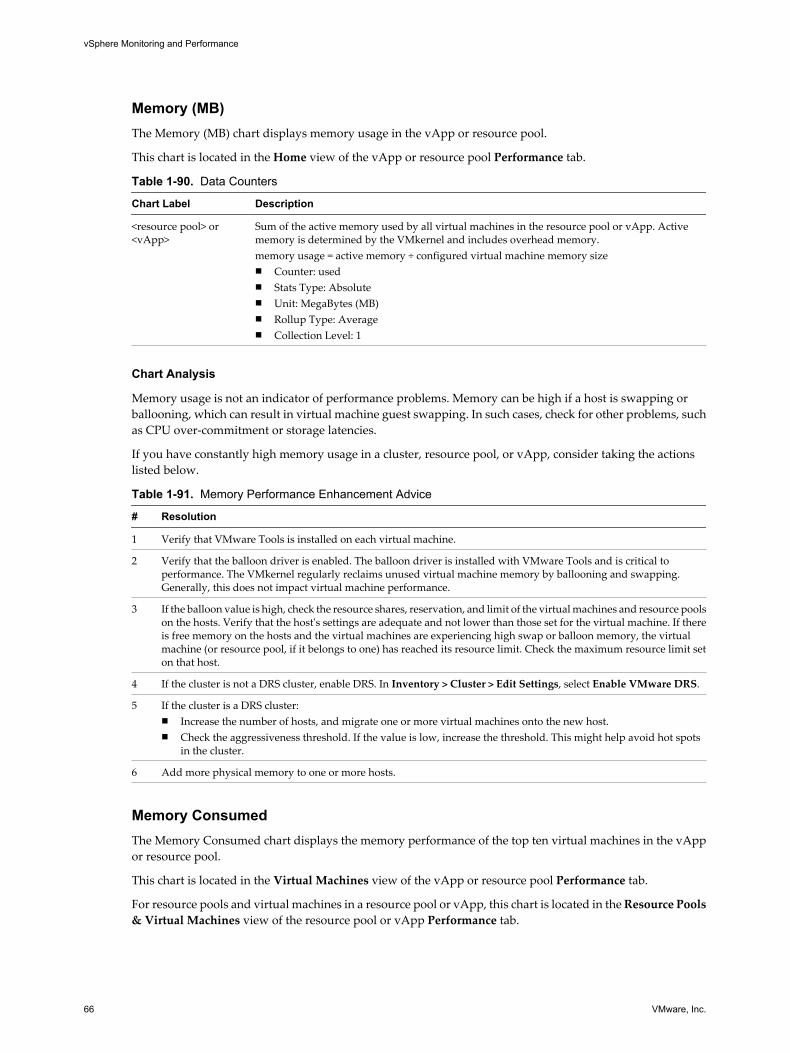
Memory (MB)The Memory (MB) chart displays memory usage in the vApp or resource pool.
This chart is located in the Home view of the vApp or resource pool Performance tab.
Table 1-90. Data Counters
Chart Label Description
<resource pool> or<vApp>
Sum of the active memory used by all virtual machines in the resource pool or vApp. Activememory is determined by the VMkernel and includes overhead memory.memory usage = active memory ÷ configured virtual machine memory sizen Counter: usedn Stats Type: Absoluten Unit: MegaBytes (MB)n Rollup Type: Averagen Collection Level: 1
Chart Analysis
Memory usage is not an indicator of performance problems. Memory can be high if a host is swapping orballooning, which can result in virtual machine guest swapping. In such cases, check for other problems, suchas CPU over-commitment or storage latencies.
If you have constantly high memory usage in a cluster, resource pool, or vApp, consider taking the actionslisted below.
Table 1-91. Memory Performance Enhancement Advice
# Resolution
1 Verify that VMware Tools is installed on each virtual machine.
2 Verify that the balloon driver is enabled. The balloon driver is installed with VMware Tools and is critical toperformance. The VMkernel regularly reclaims unused virtual machine memory by ballooning and swapping.Generally, this does not impact virtual machine performance.
3 If the balloon value is high, check the resource shares, reservation, and limit of the virtual machines and resource poolson the hosts. Verify that the host's settings are adequate and not lower than those set for the virtual machine. If thereis free memory on the hosts and the virtual machines are experiencing high swap or balloon memory, the virtualmachine (or resource pool, if it belongs to one) has reached its resource limit. Check the maximum resource limit seton that host.
4 If the cluster is not a DRS cluster, enable DRS. In Inventory > Cluster > Edit Settings, select Enable VMware DRS.
5 If the cluster is a DRS cluster:n Increase the number of hosts, and migrate one or more virtual machines onto the new host.n Check the aggressiveness threshold. If the value is low, increase the threshold. This might help avoid hot spots
in the cluster.
6 Add more physical memory to one or more hosts.
Memory ConsumedThe Memory Consumed chart displays the memory performance of the top ten virtual machines in the vAppor resource pool.
This chart is located in the Virtual Machines view of the vApp or resource pool Performance tab.
For resource pools and virtual machines in a resource pool or vApp, this chart is located in the Resource Pools& Virtual Machines view of the resource pool or vApp Performance tab.
vSphere Monitoring and Performance
66 VMware, Inc.
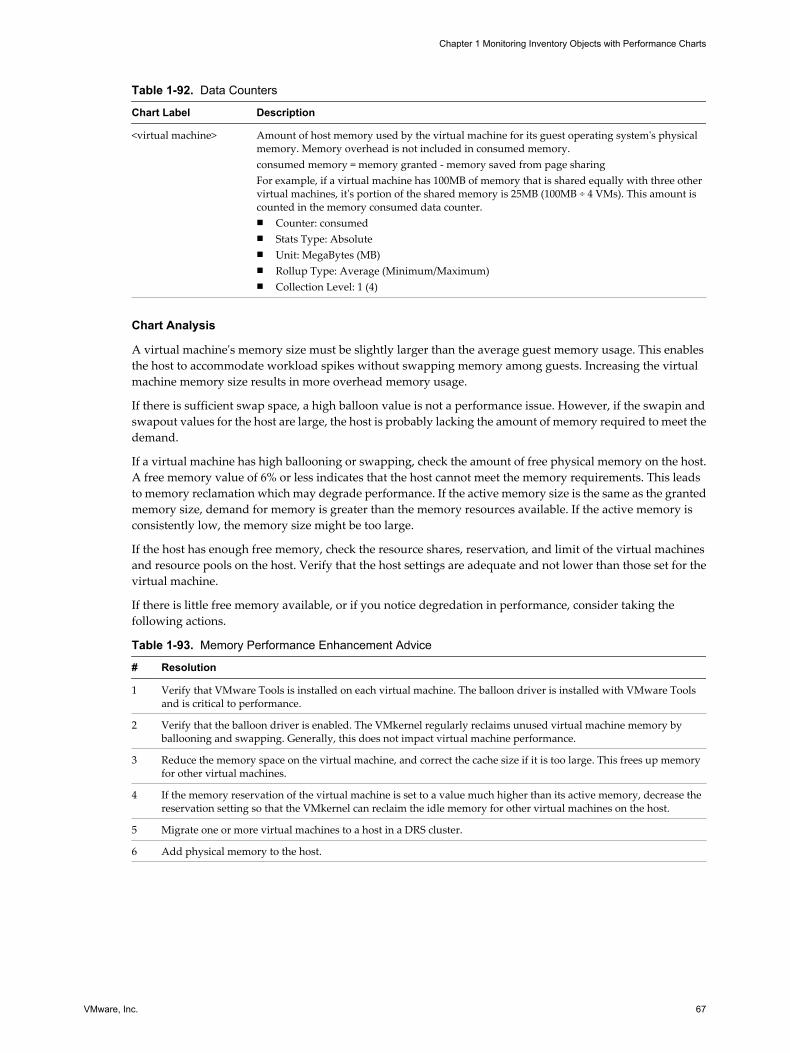
Table 1-92. Data Counters
Chart Label Description
<virtual machine> Amount of host memory used by the virtual machine for its guest operating system's physicalmemory. Memory overhead is not included in consumed memory.consumed memory = memory granted - memory saved from page sharingFor example, if a virtual machine has 100MB of memory that is shared equally with three othervirtual machines, it's portion of the shared memory is 25MB (100MB ÷ 4 VMs). This amount iscounted in the memory consumed data counter.n Counter: consumedn Stats Type: Absoluten Unit: MegaBytes (MB)n Rollup Type: Average (Minimum/Maximum)n Collection Level: 1 (4)
Chart Analysis
A virtual machine's memory size must be slightly larger than the average guest memory usage. This enablesthe host to accommodate workload spikes without swapping memory among guests. Increasing the virtualmachine memory size results in more overhead memory usage.
If there is sufficient swap space, a high balloon value is not a performance issue. However, if the swapin andswapout values for the host are large, the host is probably lacking the amount of memory required to meet thedemand.
If a virtual machine has high ballooning or swapping, check the amount of free physical memory on the host.A free memory value of 6% or less indicates that the host cannot meet the memory requirements. This leadsto memory reclamation which may degrade performance. If the active memory size is the same as the grantedmemory size, demand for memory is greater than the memory resources available. If the active memory isconsistently low, the memory size might be too large.
If the host has enough free memory, check the resource shares, reservation, and limit of the virtual machinesand resource pools on the host. Verify that the host settings are adequate and not lower than those set for thevirtual machine.
If there is little free memory available, or if you notice degredation in performance, consider taking thefollowing actions.
Table 1-93. Memory Performance Enhancement Advice
# Resolution
1 Verify that VMware Tools is installed on each virtual machine. The balloon driver is installed with VMware Toolsand is critical to performance.
2 Verify that the balloon driver is enabled. The VMkernel regularly reclaims unused virtual machine memory byballooning and swapping. Generally, this does not impact virtual machine performance.
3 Reduce the memory space on the virtual machine, and correct the cache size if it is too large. This frees up memoryfor other virtual machines.
4 If the memory reservation of the virtual machine is set to a value much higher than its active memory, decrease thereservation setting so that the VMkernel can reclaim the idle memory for other virtual machines on the host.
5 Migrate one or more virtual machines to a host in a DRS cluster.
6 Add physical memory to the host.
Chapter 1 Monitoring Inventory Objects with Performance Charts
VMware, Inc. 67
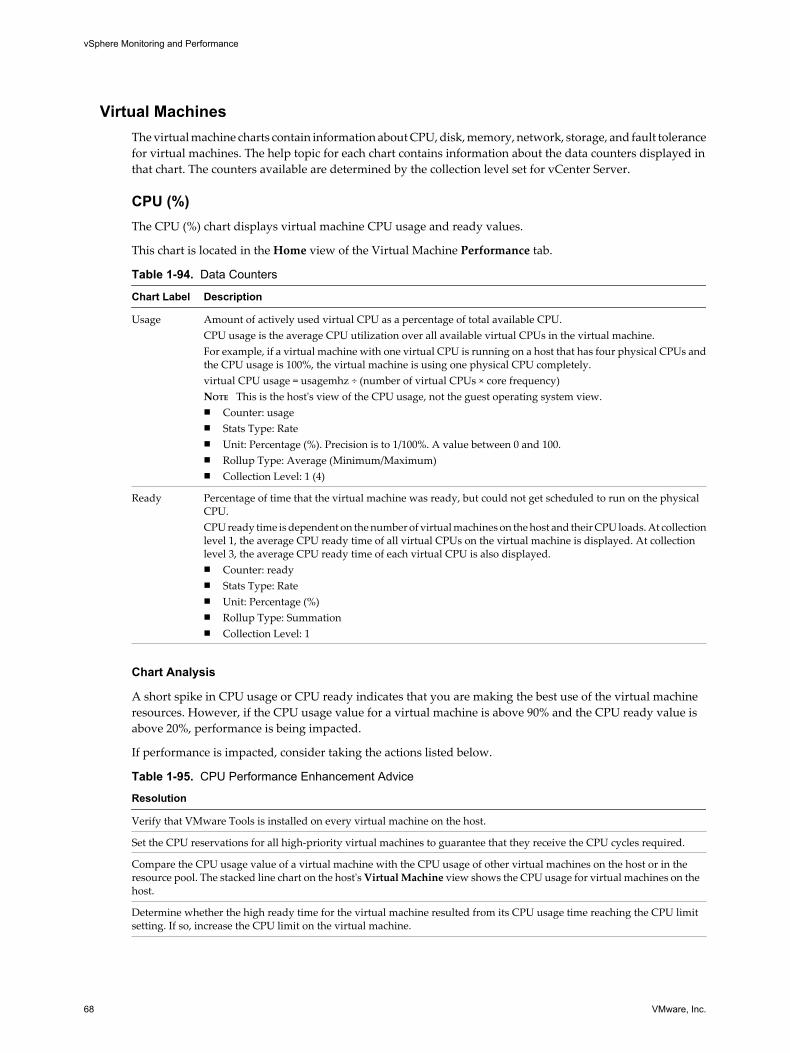
Virtual MachinesThe virtual machine charts contain information about CPU, disk, memory, network, storage, and fault tolerancefor virtual machines. The help topic for each chart contains information about the data counters displayed inthat chart. The counters available are determined by the collection level set for vCenter Server.
CPU (%)The CPU (%) chart displays virtual machine CPU usage and ready values.
This chart is located in the Home view of the Virtual Machine Performance tab.
Table 1-94. Data Counters
Chart Label Description
Usage Amount of actively used virtual CPU as a percentage of total available CPU.CPU usage is the average CPU utilization over all available virtual CPUs in the virtual machine.For example, if a virtual machine with one virtual CPU is running on a host that has four physical CPUs andthe CPU usage is 100%, the virtual machine is using one physical CPU completely.virtual CPU usage = usagemhz ÷ (number of virtual CPUs × core frequency)NOTE This is the host's view of the CPU usage, not the guest operating system view.n Counter: usagen Stats Type: Raten Unit: Percentage (%). Precision is to 1/100%. A value between 0 and 100.n Rollup Type: Average (Minimum/Maximum)n Collection Level: 1 (4)
Ready Percentage of time that the virtual machine was ready, but could not get scheduled to run on the physicalCPU.CPU ready time is dependent on the number of virtual machines on the host and their CPU loads. At collectionlevel 1, the average CPU ready time of all virtual CPUs on the virtual machine is displayed. At collectionlevel 3, the average CPU ready time of each virtual CPU is also displayed.n Counter: readyn Stats Type: Raten Unit: Percentage (%)n Rollup Type: Summationn Collection Level: 1
Chart Analysis
A short spike in CPU usage or CPU ready indicates that you are making the best use of the virtual machineresources. However, if the CPU usage value for a virtual machine is above 90% and the CPU ready value isabove 20%, performance is being impacted.
If performance is impacted, consider taking the actions listed below.
Table 1-95. CPU Performance Enhancement Advice
Resolution
Verify that VMware Tools is installed on every virtual machine on the host.
Set the CPU reservations for all high-priority virtual machines to guarantee that they receive the CPU cycles required.
Compare the CPU usage value of a virtual machine with the CPU usage of other virtual machines on the host or in theresource pool. The stacked line chart on the host's Virtual Machine view shows the CPU usage for virtual machines on thehost.
Determine whether the high ready time for the virtual machine resulted from its CPU usage time reaching the CPU limitsetting. If so, increase the CPU limit on the virtual machine.
vSphere Monitoring and Performance
68 VMware, Inc.
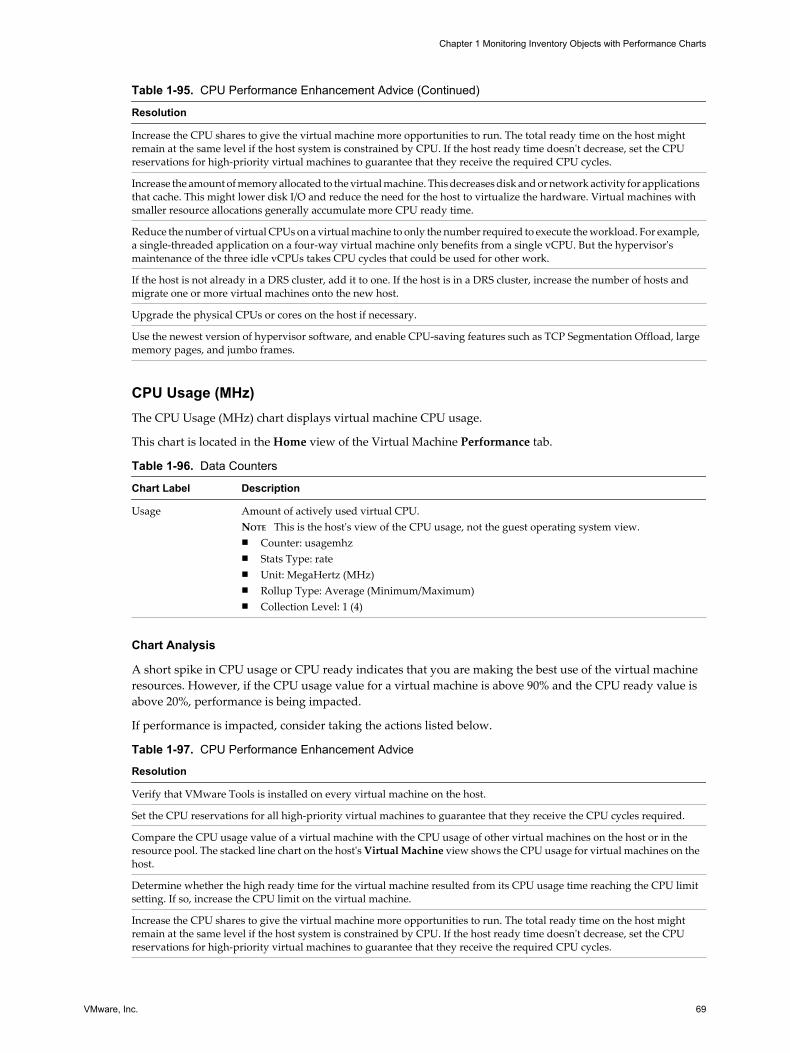
Table 1-95. CPU Performance Enhancement Advice (Continued)
Resolution
Increase the CPU shares to give the virtual machine more opportunities to run. The total ready time on the host mightremain at the same level if the host system is constrained by CPU. If the host ready time doesn't decrease, set the CPUreservations for high-priority virtual machines to guarantee that they receive the required CPU cycles.
Increase the amount of memory allocated to the virtual machine. This decreases disk and or network activity for applicationsthat cache. This might lower disk I/O and reduce the need for the host to virtualize the hardware. Virtual machines withsmaller resource allocations generally accumulate more CPU ready time.
Reduce the number of virtual CPUs on a virtual machine to only the number required to execute the workload. For example,a single-threaded application on a four-way virtual machine only benefits from a single vCPU. But the hypervisor'smaintenance of the three idle vCPUs takes CPU cycles that could be used for other work.
If the host is not already in a DRS cluster, add it to one. If the host is in a DRS cluster, increase the number of hosts andmigrate one or more virtual machines onto the new host.
Upgrade the physical CPUs or cores on the host if necessary.
Use the newest version of hypervisor software, and enable CPU-saving features such as TCP Segmentation Offload, largememory pages, and jumbo frames.
CPU Usage (MHz)The CPU Usage (MHz) chart displays virtual machine CPU usage.
This chart is located in the Home view of the Virtual Machine Performance tab.
Table 1-96. Data Counters
Chart Label Description
Usage Amount of actively used virtual CPU.NOTE This is the host's view of the CPU usage, not the guest operating system view.n Counter: usagemhzn Stats Type: raten Unit: MegaHertz (MHz)n Rollup Type: Average (Minimum/Maximum)n Collection Level: 1 (4)
Chart Analysis
A short spike in CPU usage or CPU ready indicates that you are making the best use of the virtual machineresources. However, if the CPU usage value for a virtual machine is above 90% and the CPU ready value isabove 20%, performance is being impacted.
If performance is impacted, consider taking the actions listed below.
Table 1-97. CPU Performance Enhancement Advice
Resolution
Verify that VMware Tools is installed on every virtual machine on the host.
Set the CPU reservations for all high-priority virtual machines to guarantee that they receive the CPU cycles required.
Compare the CPU usage value of a virtual machine with the CPU usage of other virtual machines on the host or in theresource pool. The stacked line chart on the host's Virtual Machine view shows the CPU usage for virtual machines on thehost.
Determine whether the high ready time for the virtual machine resulted from its CPU usage time reaching the CPU limitsetting. If so, increase the CPU limit on the virtual machine.
Increase the CPU shares to give the virtual machine more opportunities to run. The total ready time on the host mightremain at the same level if the host system is constrained by CPU. If the host ready time doesn't decrease, set the CPUreservations for high-priority virtual machines to guarantee that they receive the required CPU cycles.
Chapter 1 Monitoring Inventory Objects with Performance Charts
VMware, Inc. 69
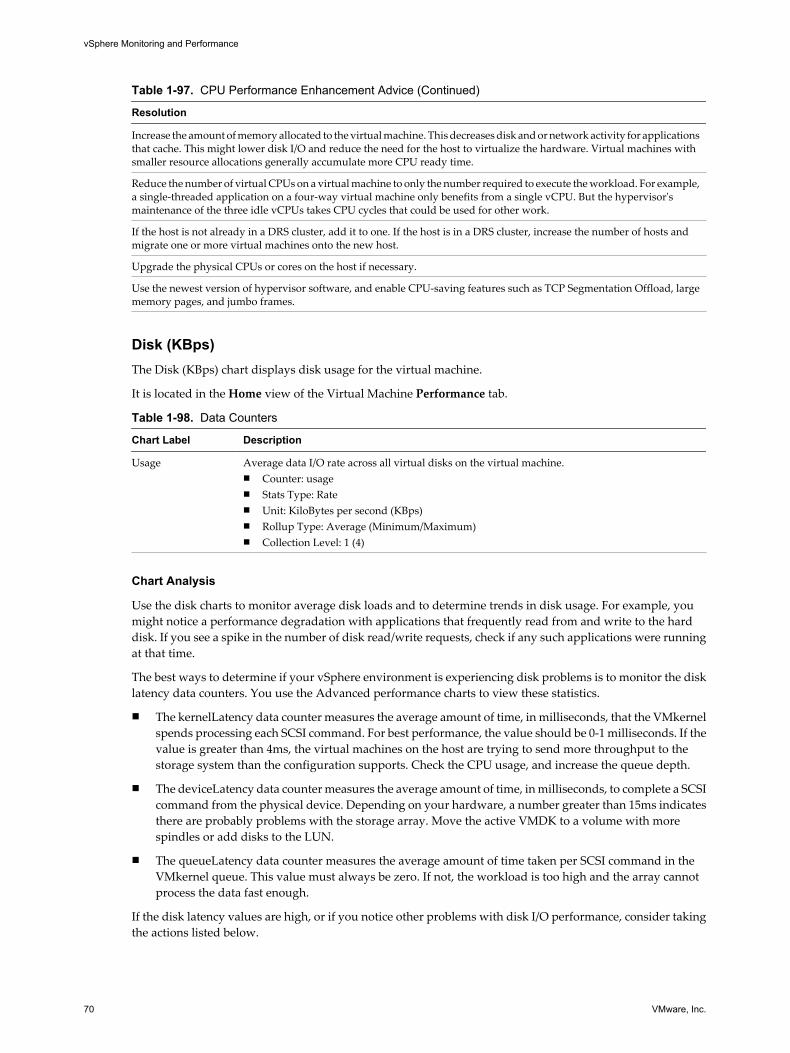
Table 1-97. CPU Performance Enhancement Advice (Continued)
Resolution
Increase the amount of memory allocated to the virtual machine. This decreases disk and or network activity for applicationsthat cache. This might lower disk I/O and reduce the need for the host to virtualize the hardware. Virtual machines withsmaller resource allocations generally accumulate more CPU ready time.
Reduce the number of virtual CPUs on a virtual machine to only the number required to execute the workload. For example,a single-threaded application on a four-way virtual machine only benefits from a single vCPU. But the hypervisor'smaintenance of the three idle vCPUs takes CPU cycles that could be used for other work.
If the host is not already in a DRS cluster, add it to one. If the host is in a DRS cluster, increase the number of hosts andmigrate one or more virtual machines onto the new host.
Upgrade the physical CPUs or cores on the host if necessary.
Use the newest version of hypervisor software, and enable CPU-saving features such as TCP Segmentation Offload, largememory pages, and jumbo frames.
Disk (KBps)The Disk (KBps) chart displays disk usage for the virtual machine.
It is located in the Home view of the Virtual Machine Performance tab.
Table 1-98. Data Counters
Chart Label Description
Usage Average data I/O rate across all virtual disks on the virtual machine.n Counter: usagen Stats Type: Raten Unit: KiloBytes per second (KBps)n Rollup Type: Average (Minimum/Maximum)n Collection Level: 1 (4)
Chart Analysis
Use the disk charts to monitor average disk loads and to determine trends in disk usage. For example, youmight notice a performance degradation with applications that frequently read from and write to the harddisk. If you see a spike in the number of disk read/write requests, check if any such applications were runningat that time.
The best ways to determine if your vSphere environment is experiencing disk problems is to monitor the disklatency data counters. You use the Advanced performance charts to view these statistics.
n The kernelLatency data counter measures the average amount of time, in milliseconds, that the VMkernelspends processing each SCSI command. For best performance, the value should be 0-1 milliseconds. If thevalue is greater than 4ms, the virtual machines on the host are trying to send more throughput to thestorage system than the configuration supports. Check the CPU usage, and increase the queue depth.
n The deviceLatency data counter measures the average amount of time, in milliseconds, to complete a SCSIcommand from the physical device. Depending on your hardware, a number greater than 15ms indicatesthere are probably problems with the storage array. Move the active VMDK to a volume with morespindles or add disks to the LUN.
n The queueLatency data counter measures the average amount of time taken per SCSI command in theVMkernel queue. This value must always be zero. If not, the workload is too high and the array cannotprocess the data fast enough.
If the disk latency values are high, or if you notice other problems with disk I/O performance, consider takingthe actions listed below.
vSphere Monitoring and Performance
70 VMware, Inc.
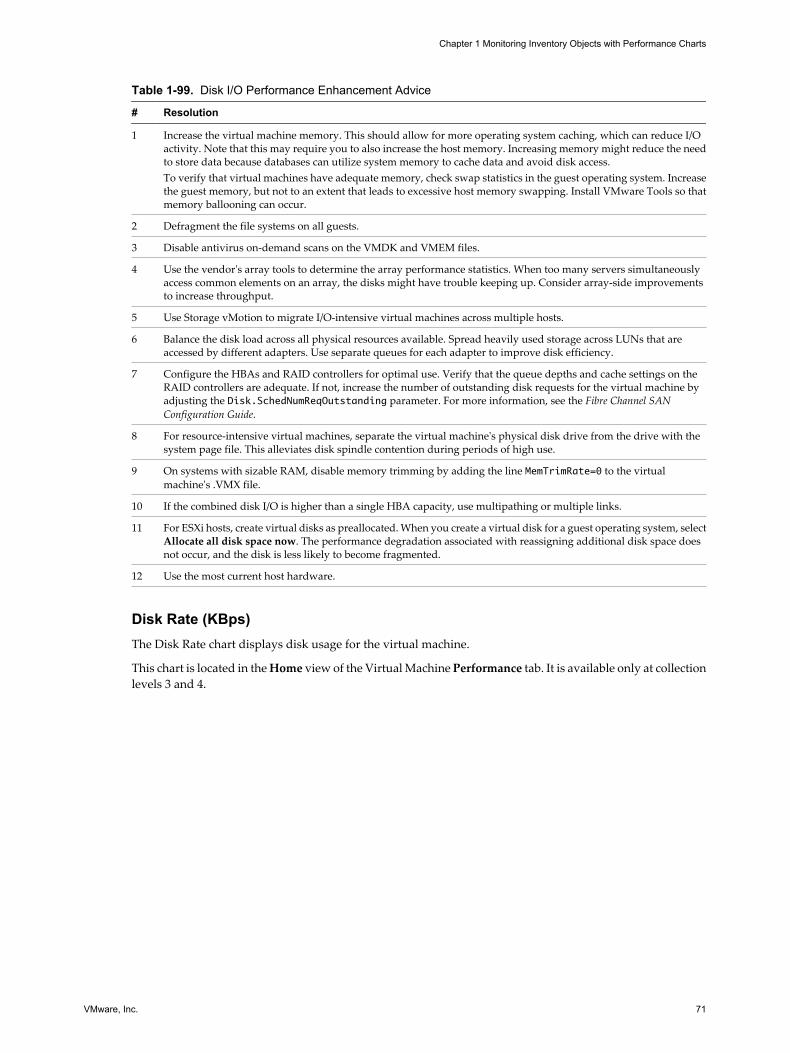
Table 1-99. Disk I/O Performance Enhancement Advice
# Resolution
1 Increase the virtual machine memory. This should allow for more operating system caching, which can reduce I/Oactivity. Note that this may require you to also increase the host memory. Increasing memory might reduce the needto store data because databases can utilize system memory to cache data and avoid disk access.To verify that virtual machines have adequate memory, check swap statistics in the guest operating system. Increasethe guest memory, but not to an extent that leads to excessive host memory swapping. Install VMware Tools so thatmemory ballooning can occur.
2 Defragment the file systems on all guests.
3 Disable antivirus on-demand scans on the VMDK and VMEM files.
4 Use the vendor's array tools to determine the array performance statistics. When too many servers simultaneouslyaccess common elements on an array, the disks might have trouble keeping up. Consider array-side improvementsto increase throughput.
5 Use Storage vMotion to migrate I/O-intensive virtual machines across multiple hosts.
6 Balance the disk load across all physical resources available. Spread heavily used storage across LUNs that areaccessed by different adapters. Use separate queues for each adapter to improve disk efficiency.
7 Configure the HBAs and RAID controllers for optimal use. Verify that the queue depths and cache settings on theRAID controllers are adequate. If not, increase the number of outstanding disk requests for the virtual machine byadjusting the Disk.SchedNumReqOutstanding parameter. For more information, see the Fibre Channel SANConfiguration Guide.
8 For resource-intensive virtual machines, separate the virtual machine's physical disk drive from the drive with thesystem page file. This alleviates disk spindle contention during periods of high use.
9 On systems with sizable RAM, disable memory trimming by adding the line MemTrimRate=0 to the virtualmachine's .VMX file.
10 If the combined disk I/O is higher than a single HBA capacity, use multipathing or multiple links.
11 For ESXi hosts, create virtual disks as preallocated. When you create a virtual disk for a guest operating system, selectAllocate all disk space now. The performance degradation associated with reassigning additional disk space doesnot occur, and the disk is less likely to become fragmented.
12 Use the most current host hardware.
Disk Rate (KBps)The Disk Rate chart displays disk usage for the virtual machine.
This chart is located in the Home view of the Virtual Machine Performance tab. It is available only at collectionlevels 3 and 4.
Chapter 1 Monitoring Inventory Objects with Performance Charts
VMware, Inc. 71
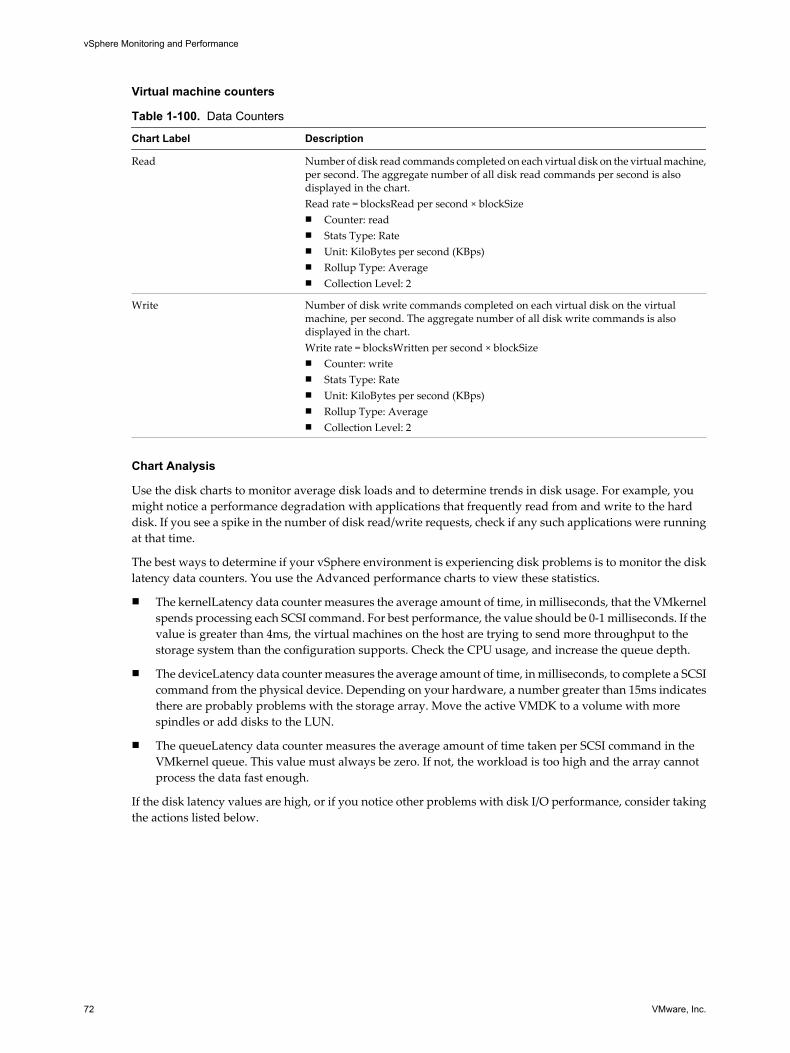
Virtual machine counters
Table 1-100. Data Counters
Chart Label Description
Read Number of disk read commands completed on each virtual disk on the virtual machine,per second. The aggregate number of all disk read commands per second is alsodisplayed in the chart.Read rate = blocksRead per second × blockSizen Counter: readn Stats Type: Raten Unit: KiloBytes per second (KBps)n Rollup Type: Averagen Collection Level: 2
Write Number of disk write commands completed on each virtual disk on the virtualmachine, per second. The aggregate number of all disk write commands is alsodisplayed in the chart.Write rate = blocksWritten per second × blockSizen Counter: writen Stats Type: Raten Unit: KiloBytes per second (KBps)n Rollup Type: Averagen Collection Level: 2
Chart Analysis
Use the disk charts to monitor average disk loads and to determine trends in disk usage. For example, youmight notice a performance degradation with applications that frequently read from and write to the harddisk. If you see a spike in the number of disk read/write requests, check if any such applications were runningat that time.
The best ways to determine if your vSphere environment is experiencing disk problems is to monitor the disklatency data counters. You use the Advanced performance charts to view these statistics.
n The kernelLatency data counter measures the average amount of time, in milliseconds, that the VMkernelspends processing each SCSI command. For best performance, the value should be 0-1 milliseconds. If thevalue is greater than 4ms, the virtual machines on the host are trying to send more throughput to thestorage system than the configuration supports. Check the CPU usage, and increase the queue depth.
n The deviceLatency data counter measures the average amount of time, in milliseconds, to complete a SCSIcommand from the physical device. Depending on your hardware, a number greater than 15ms indicatesthere are probably problems with the storage array. Move the active VMDK to a volume with morespindles or add disks to the LUN.
n The queueLatency data counter measures the average amount of time taken per SCSI command in theVMkernel queue. This value must always be zero. If not, the workload is too high and the array cannotprocess the data fast enough.
If the disk latency values are high, or if you notice other problems with disk I/O performance, consider takingthe actions listed below.
vSphere Monitoring and Performance
72 VMware, Inc.
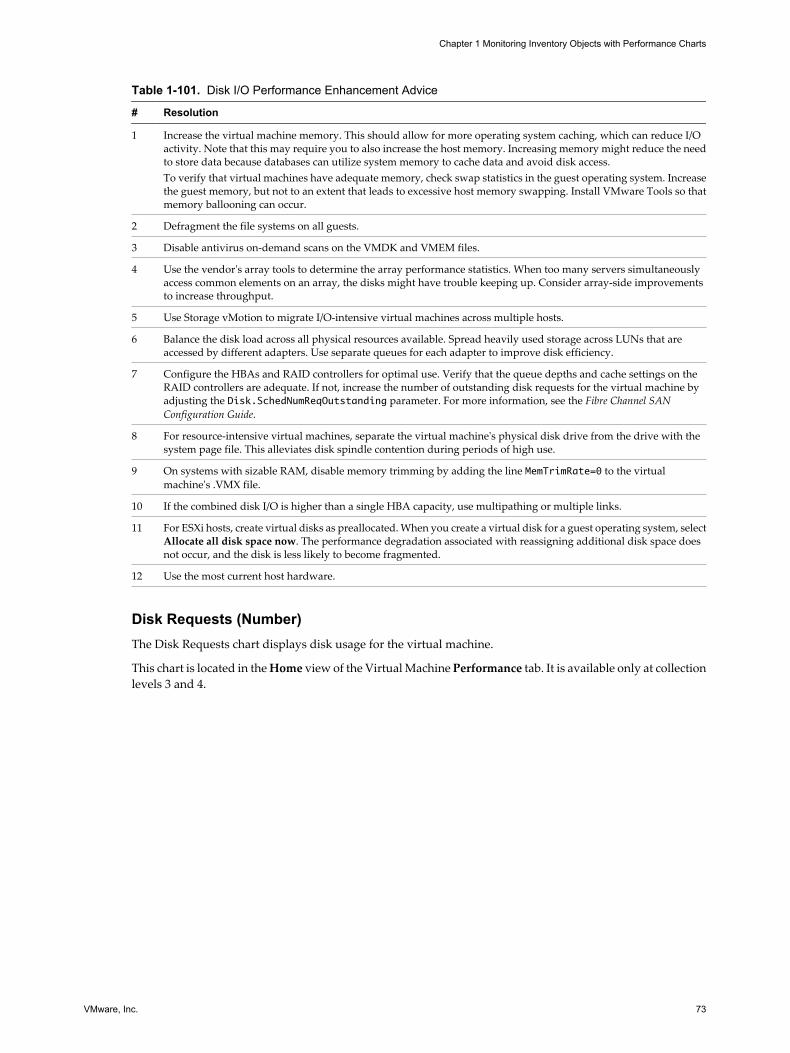
Table 1-101. Disk I/O Performance Enhancement Advice
# Resolution
1 Increase the virtual machine memory. This should allow for more operating system caching, which can reduce I/Oactivity. Note that this may require you to also increase the host memory. Increasing memory might reduce the needto store data because databases can utilize system memory to cache data and avoid disk access.To verify that virtual machines have adequate memory, check swap statistics in the guest operating system. Increasethe guest memory, but not to an extent that leads to excessive host memory swapping. Install VMware Tools so thatmemory ballooning can occur.
2 Defragment the file systems on all guests.
3 Disable antivirus on-demand scans on the VMDK and VMEM files.
4 Use the vendor's array tools to determine the array performance statistics. When too many servers simultaneouslyaccess common elements on an array, the disks might have trouble keeping up. Consider array-side improvementsto increase throughput.
5 Use Storage vMotion to migrate I/O-intensive virtual machines across multiple hosts.
6 Balance the disk load across all physical resources available. Spread heavily used storage across LUNs that areaccessed by different adapters. Use separate queues for each adapter to improve disk efficiency.
7 Configure the HBAs and RAID controllers for optimal use. Verify that the queue depths and cache settings on theRAID controllers are adequate. If not, increase the number of outstanding disk requests for the virtual machine byadjusting the Disk.SchedNumReqOutstanding parameter. For more information, see the Fibre Channel SANConfiguration Guide.
8 For resource-intensive virtual machines, separate the virtual machine's physical disk drive from the drive with thesystem page file. This alleviates disk spindle contention during periods of high use.
9 On systems with sizable RAM, disable memory trimming by adding the line MemTrimRate=0 to the virtualmachine's .VMX file.
10 If the combined disk I/O is higher than a single HBA capacity, use multipathing or multiple links.
11 For ESXi hosts, create virtual disks as preallocated. When you create a virtual disk for a guest operating system, selectAllocate all disk space now. The performance degradation associated with reassigning additional disk space doesnot occur, and the disk is less likely to become fragmented.
12 Use the most current host hardware.
Disk Requests (Number)The Disk Requests chart displays disk usage for the virtual machine.
This chart is located in the Home view of the Virtual Machine Performance tab. It is available only at collectionlevels 3 and 4.
Chapter 1 Monitoring Inventory Objects with Performance Charts
VMware, Inc. 73
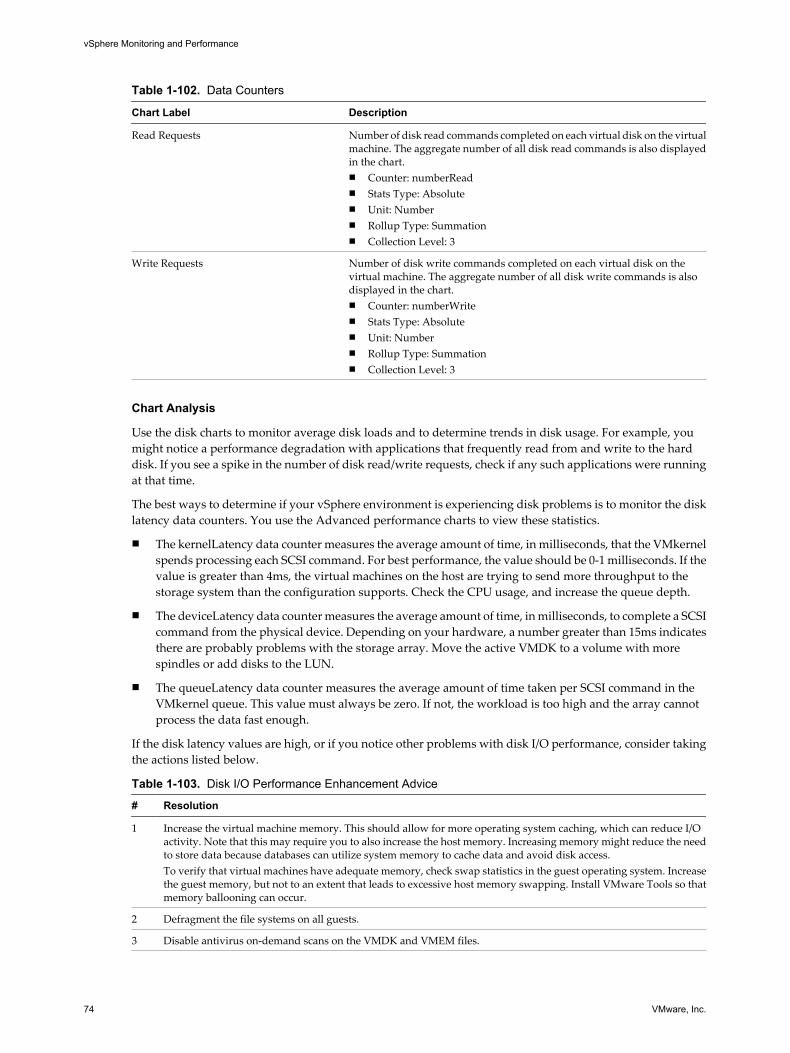
Table 1-102. Data Counters
Chart Label Description
Read Requests Number of disk read commands completed on each virtual disk on the virtualmachine. The aggregate number of all disk read commands is also displayedin the chart.n Counter: numberReadn Stats Type: Absoluten Unit: Numbern Rollup Type: Summationn Collection Level: 3
Write Requests Number of disk write commands completed on each virtual disk on thevirtual machine. The aggregate number of all disk write commands is alsodisplayed in the chart.n Counter: numberWriten Stats Type: Absoluten Unit: Numbern Rollup Type: Summationn Collection Level: 3
Chart Analysis
Use the disk charts to monitor average disk loads and to determine trends in disk usage. For example, youmight notice a performance degradation with applications that frequently read from and write to the harddisk. If you see a spike in the number of disk read/write requests, check if any such applications were runningat that time.
The best ways to determine if your vSphere environment is experiencing disk problems is to monitor the disklatency data counters. You use the Advanced performance charts to view these statistics.
n The kernelLatency data counter measures the average amount of time, in milliseconds, that the VMkernelspends processing each SCSI command. For best performance, the value should be 0-1 milliseconds. If thevalue is greater than 4ms, the virtual machines on the host are trying to send more throughput to thestorage system than the configuration supports. Check the CPU usage, and increase the queue depth.
n The deviceLatency data counter measures the average amount of time, in milliseconds, to complete a SCSIcommand from the physical device. Depending on your hardware, a number greater than 15ms indicatesthere are probably problems with the storage array. Move the active VMDK to a volume with morespindles or add disks to the LUN.
n The queueLatency data counter measures the average amount of time taken per SCSI command in theVMkernel queue. This value must always be zero. If not, the workload is too high and the array cannotprocess the data fast enough.
If the disk latency values are high, or if you notice other problems with disk I/O performance, consider takingthe actions listed below.
Table 1-103. Disk I/O Performance Enhancement Advice
# Resolution
1 Increase the virtual machine memory. This should allow for more operating system caching, which can reduce I/Oactivity. Note that this may require you to also increase the host memory. Increasing memory might reduce the needto store data because databases can utilize system memory to cache data and avoid disk access.To verify that virtual machines have adequate memory, check swap statistics in the guest operating system. Increasethe guest memory, but not to an extent that leads to excessive host memory swapping. Install VMware Tools so thatmemory ballooning can occur.
2 Defragment the file systems on all guests.
3 Disable antivirus on-demand scans on the VMDK and VMEM files.
vSphere Monitoring and Performance
74 VMware, Inc.
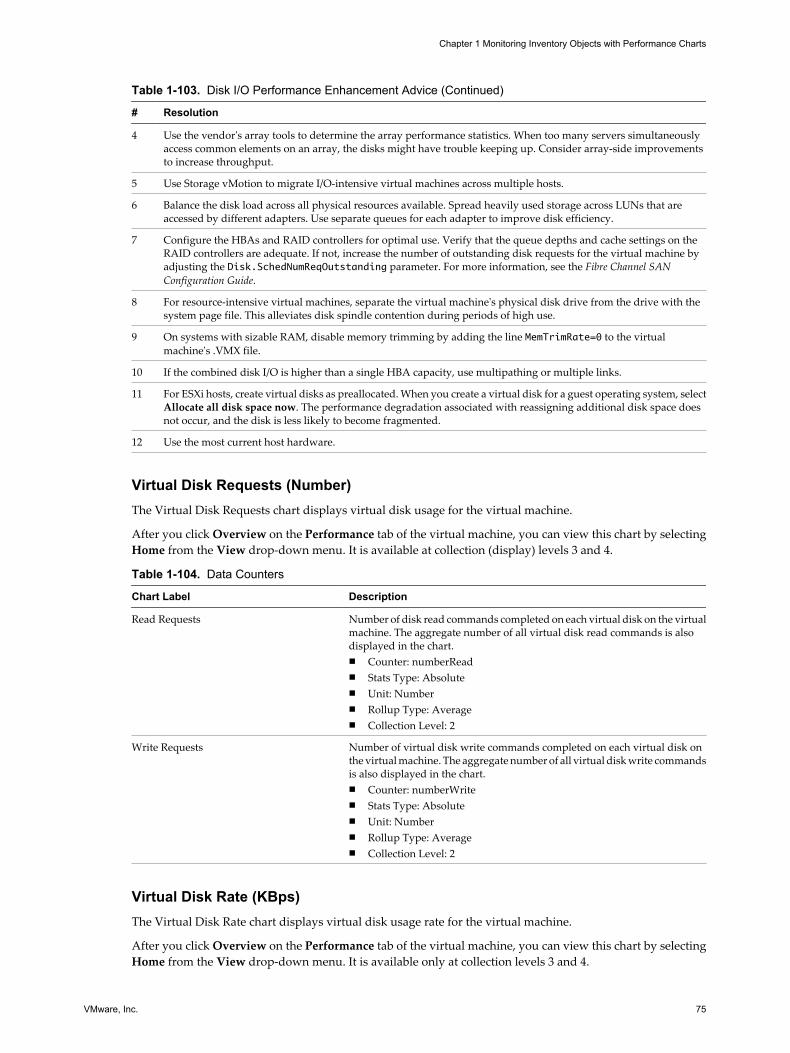
Table 1-103. Disk I/O Performance Enhancement Advice (Continued)
# Resolution
4 Use the vendor's array tools to determine the array performance statistics. When too many servers simultaneouslyaccess common elements on an array, the disks might have trouble keeping up. Consider array-side improvementsto increase throughput.
5 Use Storage vMotion to migrate I/O-intensive virtual machines across multiple hosts.
6 Balance the disk load across all physical resources available. Spread heavily used storage across LUNs that areaccessed by different adapters. Use separate queues for each adapter to improve disk efficiency.
7 Configure the HBAs and RAID controllers for optimal use. Verify that the queue depths and cache settings on theRAID controllers are adequate. If not, increase the number of outstanding disk requests for the virtual machine byadjusting the Disk.SchedNumReqOutstanding parameter. For more information, see the Fibre Channel SANConfiguration Guide.
8 For resource-intensive virtual machines, separate the virtual machine's physical disk drive from the drive with thesystem page file. This alleviates disk spindle contention during periods of high use.
9 On systems with sizable RAM, disable memory trimming by adding the line MemTrimRate=0 to the virtualmachine's .VMX file.
10 If the combined disk I/O is higher than a single HBA capacity, use multipathing or multiple links.
11 For ESXi hosts, create virtual disks as preallocated. When you create a virtual disk for a guest operating system, selectAllocate all disk space now. The performance degradation associated with reassigning additional disk space doesnot occur, and the disk is less likely to become fragmented.
12 Use the most current host hardware.
Virtual Disk Requests (Number)The Virtual Disk Requests chart displays virtual disk usage for the virtual machine.
After you click Overview on the Performance tab of the virtual machine, you can view this chart by selectingHome from the View drop-down menu. It is available at collection (display) levels 3 and 4.
Table 1-104. Data Counters
Chart Label Description
Read Requests Number of disk read commands completed on each virtual disk on the virtualmachine. The aggregate number of all virtual disk read commands is alsodisplayed in the chart.n Counter: numberReadn Stats Type: Absoluten Unit: Numbern Rollup Type: Averagen Collection Level: 2
Write Requests Number of virtual disk write commands completed on each virtual disk onthe virtual machine. The aggregate number of all virtual disk write commandsis also displayed in the chart.n Counter: numberWriten Stats Type: Absoluten Unit: Numbern Rollup Type: Averagen Collection Level: 2
Virtual Disk Rate (KBps)The Virtual Disk Rate chart displays virtual disk usage rate for the virtual machine.
After you click Overview on the Performance tab of the virtual machine, you can view this chart by selectingHome from the View drop-down menu. It is available only at collection levels 3 and 4.
Chapter 1 Monitoring Inventory Objects with Performance Charts
VMware, Inc. 75
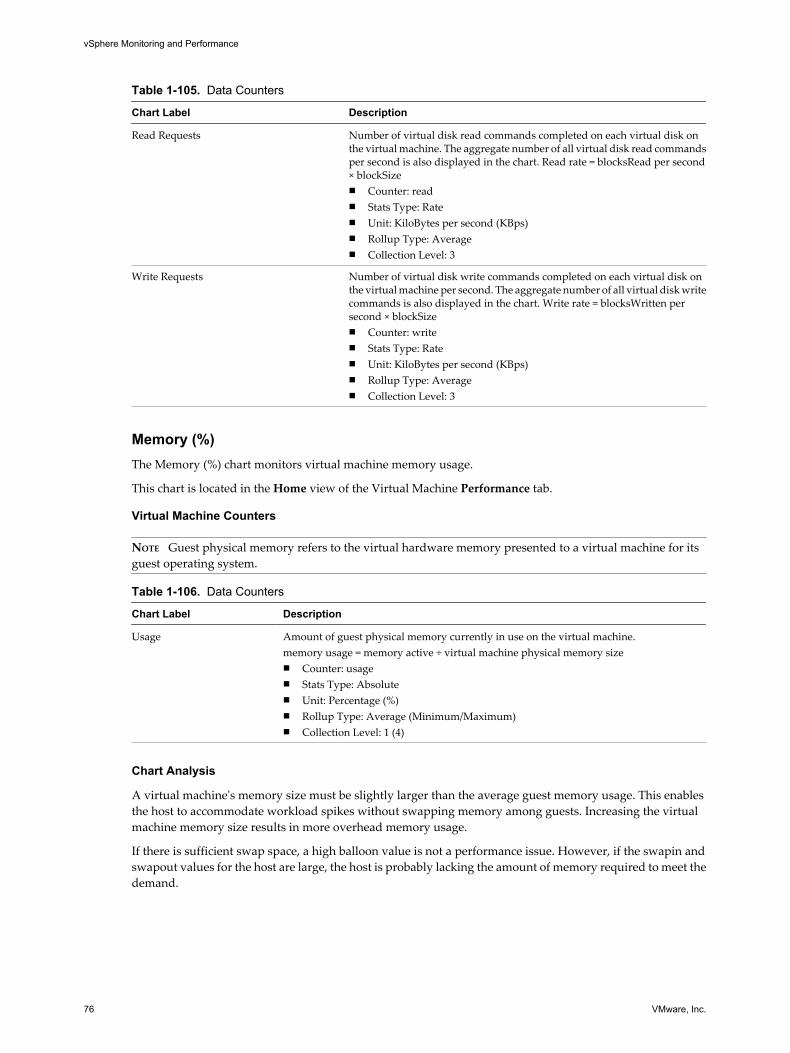
Table 1-105. Data Counters
Chart Label Description
Read Requests Number of virtual disk read commands completed on each virtual disk onthe virtual machine. The aggregate number of all virtual disk read commandsper second is also displayed in the chart. Read rate = blocksRead per second× blockSizen Counter: readn Stats Type: Raten Unit: KiloBytes per second (KBps)n Rollup Type: Averagen Collection Level: 3
Write Requests Number of virtual disk write commands completed on each virtual disk onthe virtual machine per second. The aggregate number of all virtual disk writecommands is also displayed in the chart. Write rate = blocksWritten persecond × blockSizen Counter: writen Stats Type: Raten Unit: KiloBytes per second (KBps)n Rollup Type: Averagen Collection Level: 3
Memory (%)The Memory (%) chart monitors virtual machine memory usage.
This chart is located in the Home view of the Virtual Machine Performance tab.
Virtual Machine Counters
NOTE Guest physical memory refers to the virtual hardware memory presented to a virtual machine for itsguest operating system.
Table 1-106. Data Counters
Chart Label Description
Usage Amount of guest physical memory currently in use on the virtual machine.memory usage = memory active ÷ virtual machine physical memory sizen Counter: usagen Stats Type: Absoluten Unit: Percentage (%)n Rollup Type: Average (Minimum/Maximum)n Collection Level: 1 (4)
Chart Analysis
A virtual machine's memory size must be slightly larger than the average guest memory usage. This enablesthe host to accommodate workload spikes without swapping memory among guests. Increasing the virtualmachine memory size results in more overhead memory usage.
If there is sufficient swap space, a high balloon value is not a performance issue. However, if the swapin andswapout values for the host are large, the host is probably lacking the amount of memory required to meet thedemand.
vSphere Monitoring and Performance
76 VMware, Inc.
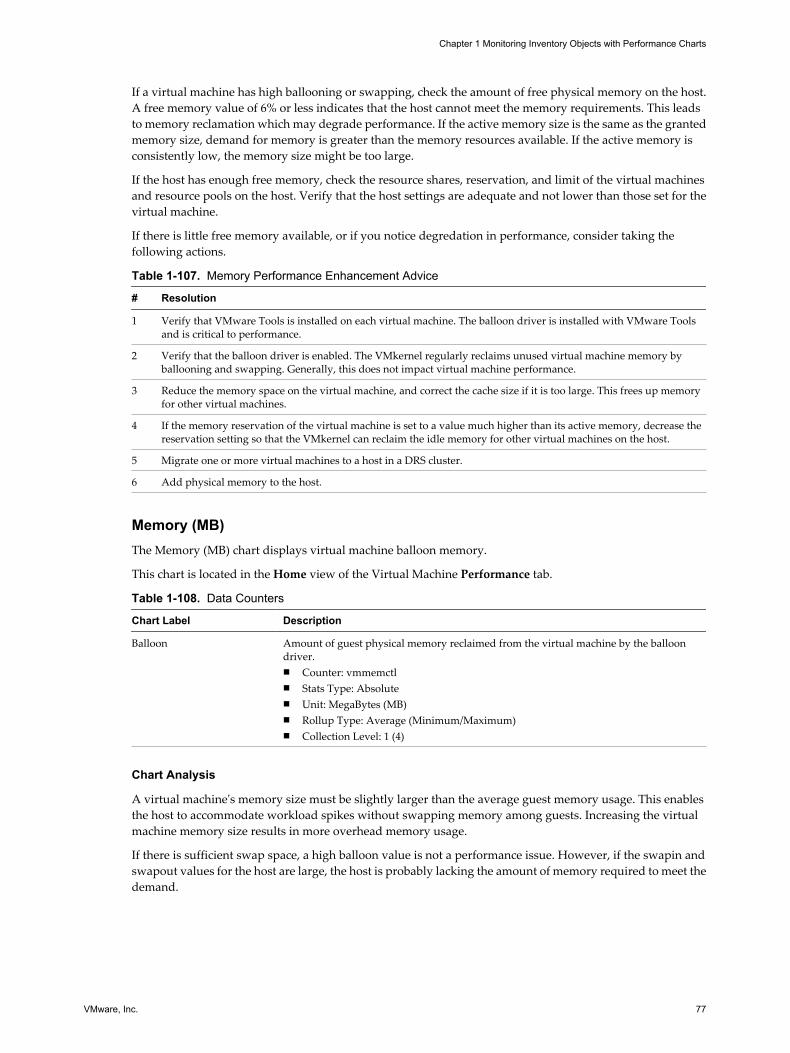
If a virtual machine has high ballooning or swapping, check the amount of free physical memory on the host.A free memory value of 6% or less indicates that the host cannot meet the memory requirements. This leadsto memory reclamation which may degrade performance. If the active memory size is the same as the grantedmemory size, demand for memory is greater than the memory resources available. If the active memory isconsistently low, the memory size might be too large.
If the host has enough free memory, check the resource shares, reservation, and limit of the virtual machinesand resource pools on the host. Verify that the host settings are adequate and not lower than those set for thevirtual machine.
If there is little free memory available, or if you notice degredation in performance, consider taking thefollowing actions.
Table 1-107. Memory Performance Enhancement Advice
# Resolution
1 Verify that VMware Tools is installed on each virtual machine. The balloon driver is installed with VMware Toolsand is critical to performance.
2 Verify that the balloon driver is enabled. The VMkernel regularly reclaims unused virtual machine memory byballooning and swapping. Generally, this does not impact virtual machine performance.
3 Reduce the memory space on the virtual machine, and correct the cache size if it is too large. This frees up memoryfor other virtual machines.
4 If the memory reservation of the virtual machine is set to a value much higher than its active memory, decrease thereservation setting so that the VMkernel can reclaim the idle memory for other virtual machines on the host.
5 Migrate one or more virtual machines to a host in a DRS cluster.
6 Add physical memory to the host.
Memory (MB)The Memory (MB) chart displays virtual machine balloon memory.
This chart is located in the Home view of the Virtual Machine Performance tab.
Table 1-108. Data Counters
Chart Label Description
Balloon Amount of guest physical memory reclaimed from the virtual machine by the balloondriver.n Counter: vmmemctln Stats Type: Absoluten Unit: MegaBytes (MB)n Rollup Type: Average (Minimum/Maximum)n Collection Level: 1 (4)
Chart Analysis
A virtual machine's memory size must be slightly larger than the average guest memory usage. This enablesthe host to accommodate workload spikes without swapping memory among guests. Increasing the virtualmachine memory size results in more overhead memory usage.
If there is sufficient swap space, a high balloon value is not a performance issue. However, if the swapin andswapout values for the host are large, the host is probably lacking the amount of memory required to meet thedemand.
Chapter 1 Monitoring Inventory Objects with Performance Charts
VMware, Inc. 77
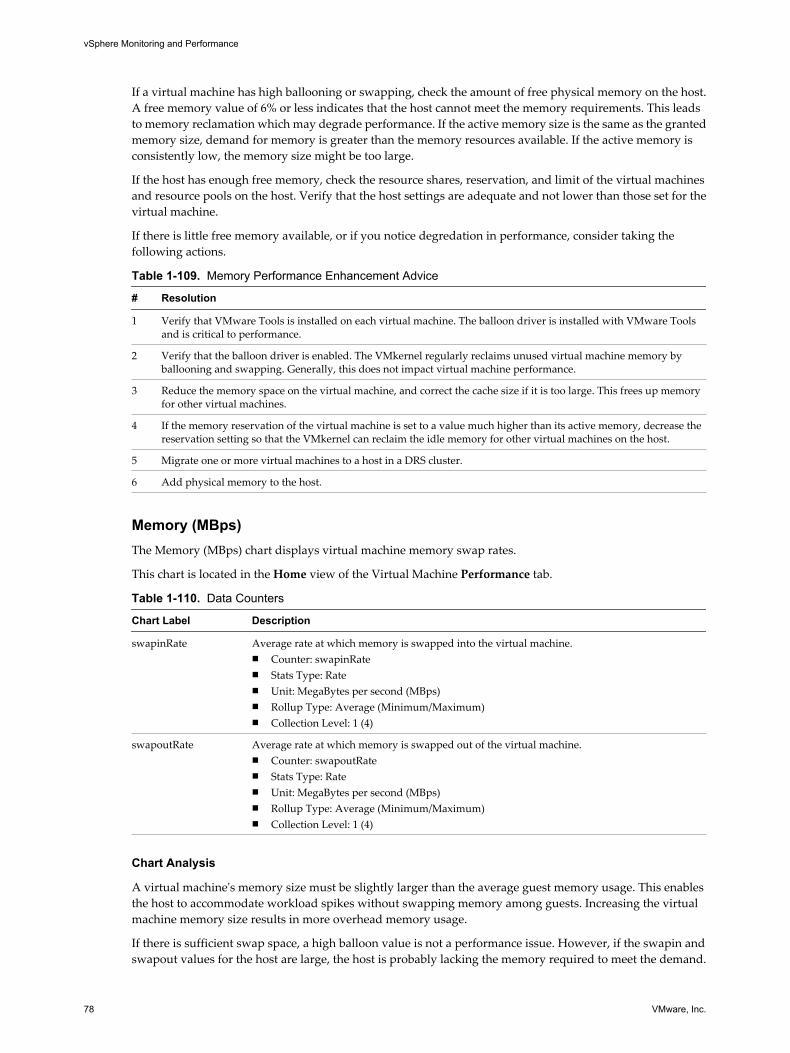
If a virtual machine has high ballooning or swapping, check the amount of free physical memory on the host.A free memory value of 6% or less indicates that the host cannot meet the memory requirements. This leadsto memory reclamation which may degrade performance. If the active memory size is the same as the grantedmemory size, demand for memory is greater than the memory resources available. If the active memory isconsistently low, the memory size might be too large.
If the host has enough free memory, check the resource shares, reservation, and limit of the virtual machinesand resource pools on the host. Verify that the host settings are adequate and not lower than those set for thevirtual machine.
If there is little free memory available, or if you notice degredation in performance, consider taking thefollowing actions.
Table 1-109. Memory Performance Enhancement Advice
# Resolution
1 Verify that VMware Tools is installed on each virtual machine. The balloon driver is installed with VMware Toolsand is critical to performance.
2 Verify that the balloon driver is enabled. The VMkernel regularly reclaims unused virtual machine memory byballooning and swapping. Generally, this does not impact virtual machine performance.
3 Reduce the memory space on the virtual machine, and correct the cache size if it is too large. This frees up memoryfor other virtual machines.
4 If the memory reservation of the virtual machine is set to a value much higher than its active memory, decrease thereservation setting so that the VMkernel can reclaim the idle memory for other virtual machines on the host.
5 Migrate one or more virtual machines to a host in a DRS cluster.
6 Add physical memory to the host.
Memory (MBps)The Memory (MBps) chart displays virtual machine memory swap rates.
This chart is located in the Home view of the Virtual Machine Performance tab.
Table 1-110. Data Counters
Chart Label Description
swapinRate Average rate at which memory is swapped into the virtual machine.n Counter: swapinRaten Stats Type: Raten Unit: MegaBytes per second (MBps)n Rollup Type: Average (Minimum/Maximum)n Collection Level: 1 (4)
swapoutRate Average rate at which memory is swapped out of the virtual machine.n Counter: swapoutRaten Stats Type: Raten Unit: MegaBytes per second (MBps)n Rollup Type: Average (Minimum/Maximum)n Collection Level: 1 (4)
Chart Analysis
A virtual machine's memory size must be slightly larger than the average guest memory usage. This enablesthe host to accommodate workload spikes without swapping memory among guests. Increasing the virtualmachine memory size results in more overhead memory usage.
If there is sufficient swap space, a high balloon value is not a performance issue. However, if the swapin andswapout values for the host are large, the host is probably lacking the memory required to meet the demand.
vSphere Monitoring and Performance
78 VMware, Inc.
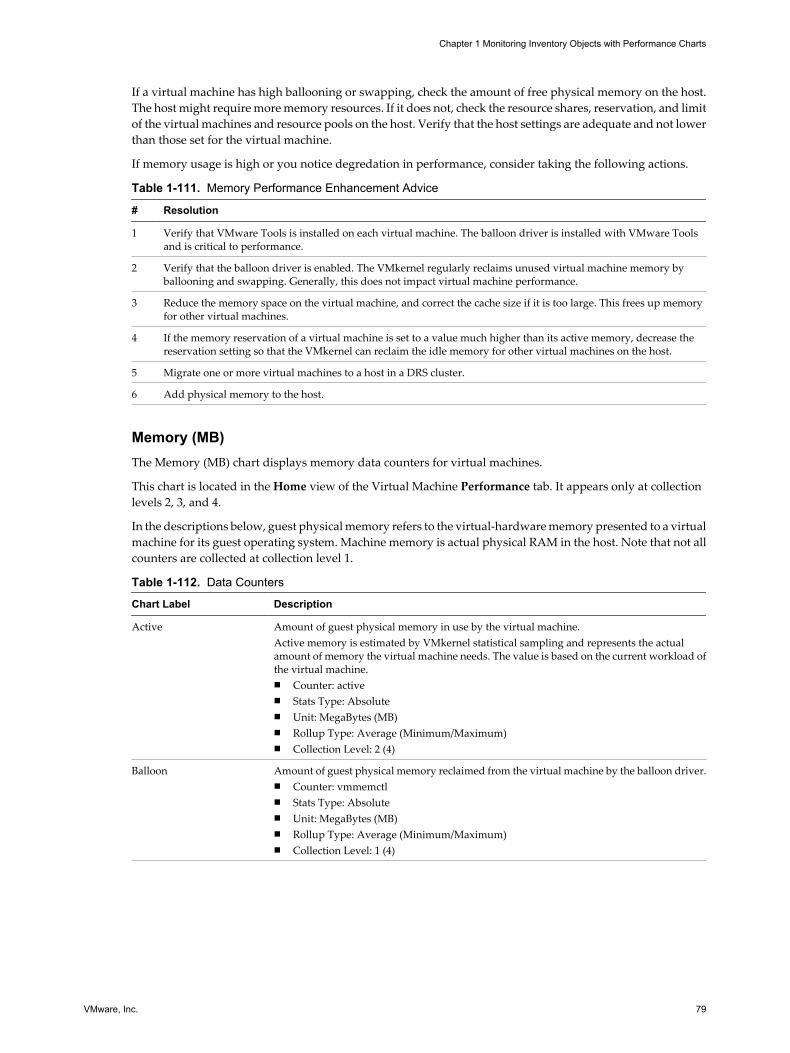
If a virtual machine has high ballooning or swapping, check the amount of free physical memory on the host.The host might require more memory resources. If it does not, check the resource shares, reservation, and limitof the virtual machines and resource pools on the host. Verify that the host settings are adequate and not lowerthan those set for the virtual machine.
If memory usage is high or you notice degredation in performance, consider taking the following actions.
Table 1-111. Memory Performance Enhancement Advice
# Resolution
1 Verify that VMware Tools is installed on each virtual machine. The balloon driver is installed with VMware Toolsand is critical to performance.
2 Verify that the balloon driver is enabled. The VMkernel regularly reclaims unused virtual machine memory byballooning and swapping. Generally, this does not impact virtual machine performance.
3 Reduce the memory space on the virtual machine, and correct the cache size if it is too large. This frees up memoryfor other virtual machines.
4 If the memory reservation of a virtual machine is set to a value much higher than its active memory, decrease thereservation setting so that the VMkernel can reclaim the idle memory for other virtual machines on the host.
5 Migrate one or more virtual machines to a host in a DRS cluster.
6 Add physical memory to the host.
Memory (MB)The Memory (MB) chart displays memory data counters for virtual machines.
This chart is located in the Home view of the Virtual Machine Performance tab. It appears only at collectionlevels 2, 3, and 4.
In the descriptions below, guest physical memory refers to the virtual-hardware memory presented to a virtualmachine for its guest operating system. Machine memory is actual physical RAM in the host. Note that not allcounters are collected at collection level 1.
Table 1-112. Data Counters
Chart Label Description
Active Amount of guest physical memory in use by the virtual machine.Active memory is estimated by VMkernel statistical sampling and represents the actualamount of memory the virtual machine needs. The value is based on the current workload ofthe virtual machine.n Counter: activen Stats Type: Absoluten Unit: MegaBytes (MB)n Rollup Type: Average (Minimum/Maximum)n Collection Level: 2 (4)
Balloon Amount of guest physical memory reclaimed from the virtual machine by the balloon driver.n Counter: vmmemctln Stats Type: Absoluten Unit: MegaBytes (MB)n Rollup Type: Average (Minimum/Maximum)n Collection Level: 1 (4)
Chapter 1 Monitoring Inventory Objects with Performance Charts
VMware, Inc. 79
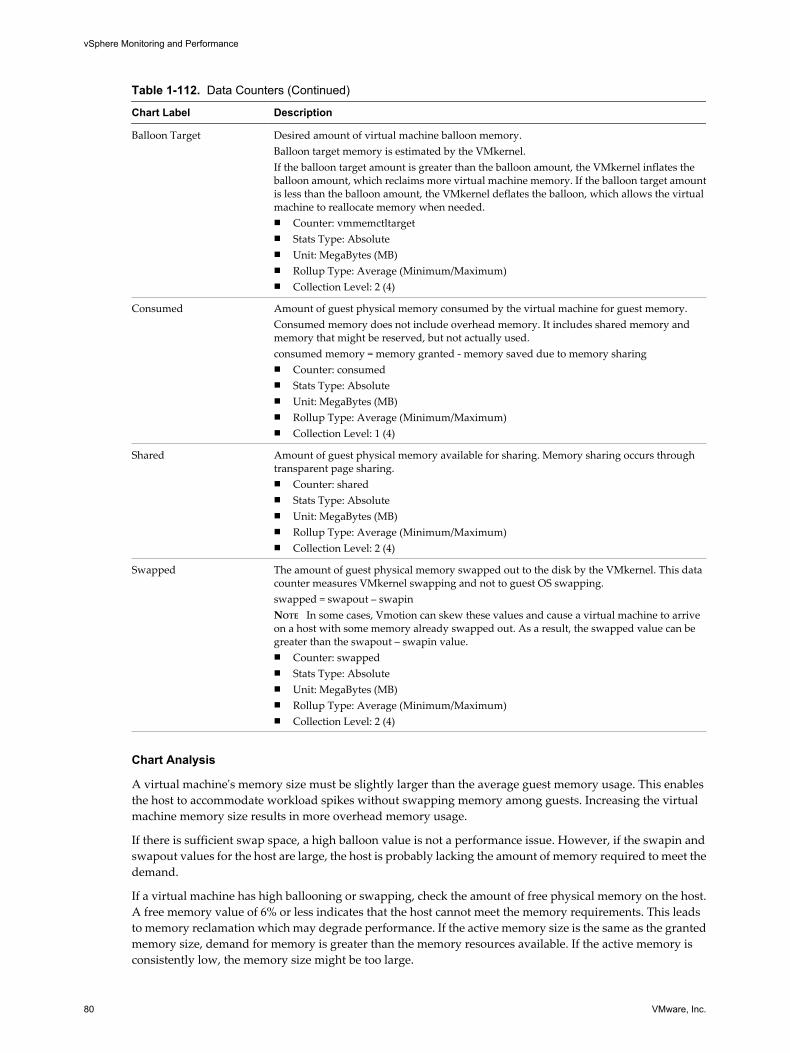
Table 1-112. Data Counters (Continued)
Chart Label Description
Balloon Target Desired amount of virtual machine balloon memory.Balloon target memory is estimated by the VMkernel.If the balloon target amount is greater than the balloon amount, the VMkernel inflates theballoon amount, which reclaims more virtual machine memory. If the balloon target amountis less than the balloon amount, the VMkernel deflates the balloon, which allows the virtualmachine to reallocate memory when needed.n Counter: vmmemctltargetn Stats Type: Absoluten Unit: MegaBytes (MB)n Rollup Type: Average (Minimum/Maximum)n Collection Level: 2 (4)
Consumed Amount of guest physical memory consumed by the virtual machine for guest memory.Consumed memory does not include overhead memory. It includes shared memory andmemory that might be reserved, but not actually used.consumed memory = memory granted - memory saved due to memory sharingn Counter: consumedn Stats Type: Absoluten Unit: MegaBytes (MB)n Rollup Type: Average (Minimum/Maximum)n Collection Level: 1 (4)
Shared Amount of guest physical memory available for sharing. Memory sharing occurs throughtransparent page sharing.n Counter: sharedn Stats Type: Absoluten Unit: MegaBytes (MB)n Rollup Type: Average (Minimum/Maximum)n Collection Level: 2 (4)
Swapped The amount of guest physical memory swapped out to the disk by the VMkernel. This datacounter measures VMkernel swapping and not to guest OS swapping.swapped = swapout – swapinNOTE In some cases, Vmotion can skew these values and cause a virtual machine to arriveon a host with some memory already swapped out. As a result, the swapped value can begreater than the swapout – swapin value.n Counter: swappedn Stats Type: Absoluten Unit: MegaBytes (MB)n Rollup Type: Average (Minimum/Maximum)n Collection Level: 2 (4)
Chart Analysis
A virtual machine's memory size must be slightly larger than the average guest memory usage. This enablesthe host to accommodate workload spikes without swapping memory among guests. Increasing the virtualmachine memory size results in more overhead memory usage.
If there is sufficient swap space, a high balloon value is not a performance issue. However, if the swapin andswapout values for the host are large, the host is probably lacking the amount of memory required to meet thedemand.
If a virtual machine has high ballooning or swapping, check the amount of free physical memory on the host.A free memory value of 6% or less indicates that the host cannot meet the memory requirements. This leadsto memory reclamation which may degrade performance. If the active memory size is the same as the grantedmemory size, demand for memory is greater than the memory resources available. If the active memory isconsistently low, the memory size might be too large.
vSphere Monitoring and Performance
80 VMware, Inc.
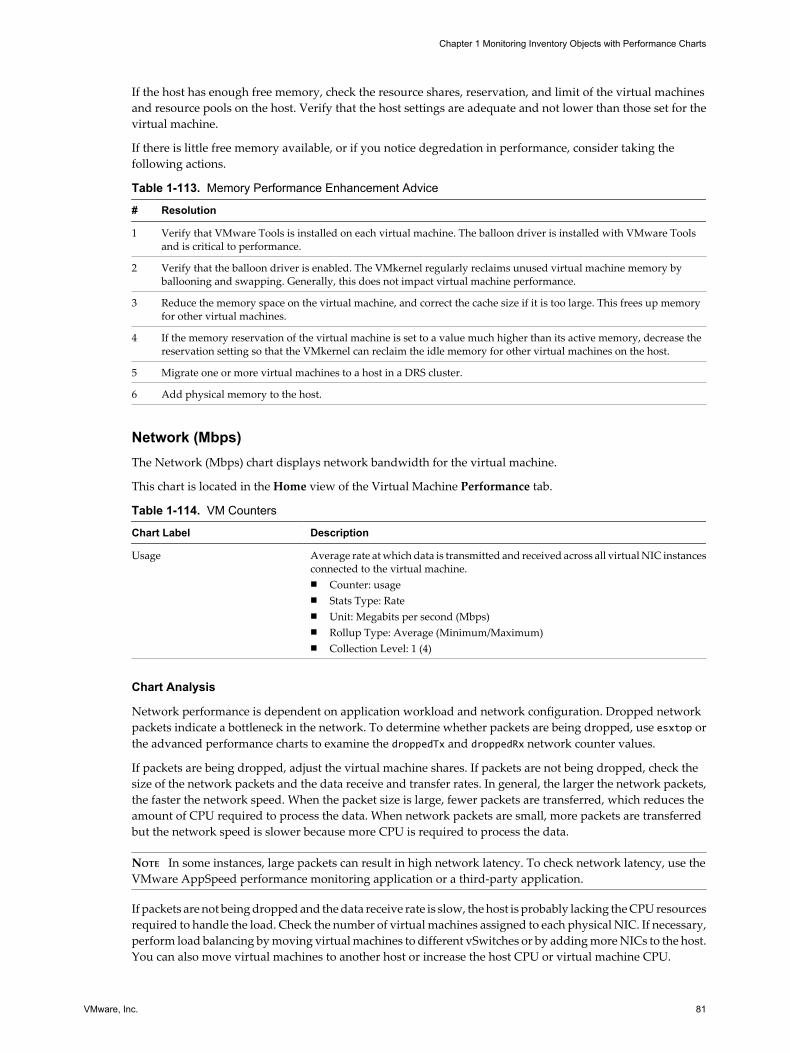
If the host has enough free memory, check the resource shares, reservation, and limit of the virtual machinesand resource pools on the host. Verify that the host settings are adequate and not lower than those set for thevirtual machine.
If there is little free memory available, or if you notice degredation in performance, consider taking thefollowing actions.
Table 1-113. Memory Performance Enhancement Advice
# Resolution
1 Verify that VMware Tools is installed on each virtual machine. The balloon driver is installed with VMware Toolsand is critical to performance.
2 Verify that the balloon driver is enabled. The VMkernel regularly reclaims unused virtual machine memory byballooning and swapping. Generally, this does not impact virtual machine performance.
3 Reduce the memory space on the virtual machine, and correct the cache size if it is too large. This frees up memoryfor other virtual machines.
4 If the memory reservation of the virtual machine is set to a value much higher than its active memory, decrease thereservation setting so that the VMkernel can reclaim the idle memory for other virtual machines on the host.
5 Migrate one or more virtual machines to a host in a DRS cluster.
6 Add physical memory to the host.
Network (Mbps)The Network (Mbps) chart displays network bandwidth for the virtual machine.
This chart is located in the Home view of the Virtual Machine Performance tab.
Table 1-114. VM Counters
Chart Label Description
Usage Average rate at which data is transmitted and received across all virtual NIC instancesconnected to the virtual machine.n Counter: usagen Stats Type: Raten Unit: Megabits per second (Mbps)n Rollup Type: Average (Minimum/Maximum)n Collection Level: 1 (4)
Chart Analysis
Network performance is dependent on application workload and network configuration. Dropped networkpackets indicate a bottleneck in the network. To determine whether packets are being dropped, use esxtop orthe advanced performance charts to examine the droppedTx and droppedRx network counter values.
If packets are being dropped, adjust the virtual machine shares. If packets are not being dropped, check thesize of the network packets and the data receive and transfer rates. In general, the larger the network packets,the faster the network speed. When the packet size is large, fewer packets are transferred, which reduces theamount of CPU required to process the data. When network packets are small, more packets are transferredbut the network speed is slower because more CPU is required to process the data.
NOTE In some instances, large packets can result in high network latency. To check network latency, use theVMware AppSpeed performance monitoring application or a third-party application.
If packets are not being dropped and the data receive rate is slow, the host is probably lacking the CPU resourcesrequired to handle the load. Check the number of virtual machines assigned to each physical NIC. If necessary,perform load balancing by moving virtual machines to different vSwitches or by adding more NICs to the host.You can also move virtual machines to another host or increase the host CPU or virtual machine CPU.
Chapter 1 Monitoring Inventory Objects with Performance Charts
VMware, Inc. 81
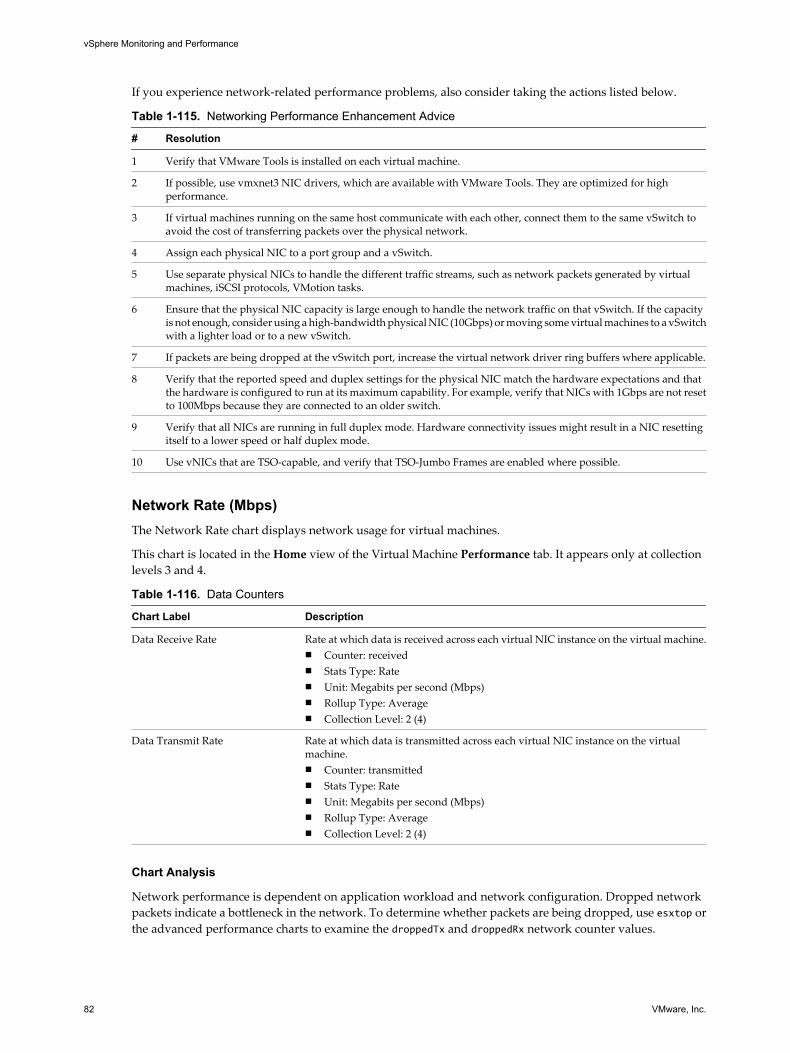
If you experience network-related performance problems, also consider taking the actions listed below.
Table 1-115. Networking Performance Enhancement Advice
# Resolution
1 Verify that VMware Tools is installed on each virtual machine.
2 If possible, use vmxnet3 NIC drivers, which are available with VMware Tools. They are optimized for highperformance.
3 If virtual machines running on the same host communicate with each other, connect them to the same vSwitch toavoid the cost of transferring packets over the physical network.
4 Assign each physical NIC to a port group and a vSwitch.
5 Use separate physical NICs to handle the different traffic streams, such as network packets generated by virtualmachines, iSCSI protocols, VMotion tasks.
6 Ensure that the physical NIC capacity is large enough to handle the network traffic on that vSwitch. If the capacityis not enough, consider using a high-bandwidth physical NIC (10Gbps) or moving some virtual machines to a vSwitchwith a lighter load or to a new vSwitch.
7 If packets are being dropped at the vSwitch port, increase the virtual network driver ring buffers where applicable.
8 Verify that the reported speed and duplex settings for the physical NIC match the hardware expectations and thatthe hardware is configured to run at its maximum capability. For example, verify that NICs with 1Gbps are not resetto 100Mbps because they are connected to an older switch.
9 Verify that all NICs are running in full duplex mode. Hardware connectivity issues might result in a NIC resettingitself to a lower speed or half duplex mode.
10 Use vNICs that are TSO-capable, and verify that TSO-Jumbo Frames are enabled where possible.
Network Rate (Mbps)The Network Rate chart displays network usage for virtual machines.
This chart is located in the Home view of the Virtual Machine Performance tab. It appears only at collectionlevels 3 and 4.
Table 1-116. Data Counters
Chart Label Description
Data Receive Rate Rate at which data is received across each virtual NIC instance on the virtual machine.n Counter: receivedn Stats Type: Raten Unit: Megabits per second (Mbps)n Rollup Type: Averagen Collection Level: 2 (4)
Data Transmit Rate Rate at which data is transmitted across each virtual NIC instance on the virtualmachine.n Counter: transmittedn Stats Type: Raten Unit: Megabits per second (Mbps)n Rollup Type: Averagen Collection Level: 2 (4)
Chart Analysis
Network performance is dependent on application workload and network configuration. Dropped networkpackets indicate a bottleneck in the network. To determine whether packets are being dropped, use esxtop orthe advanced performance charts to examine the droppedTx and droppedRx network counter values.
vSphere Monitoring and Performance
82 VMware, Inc.
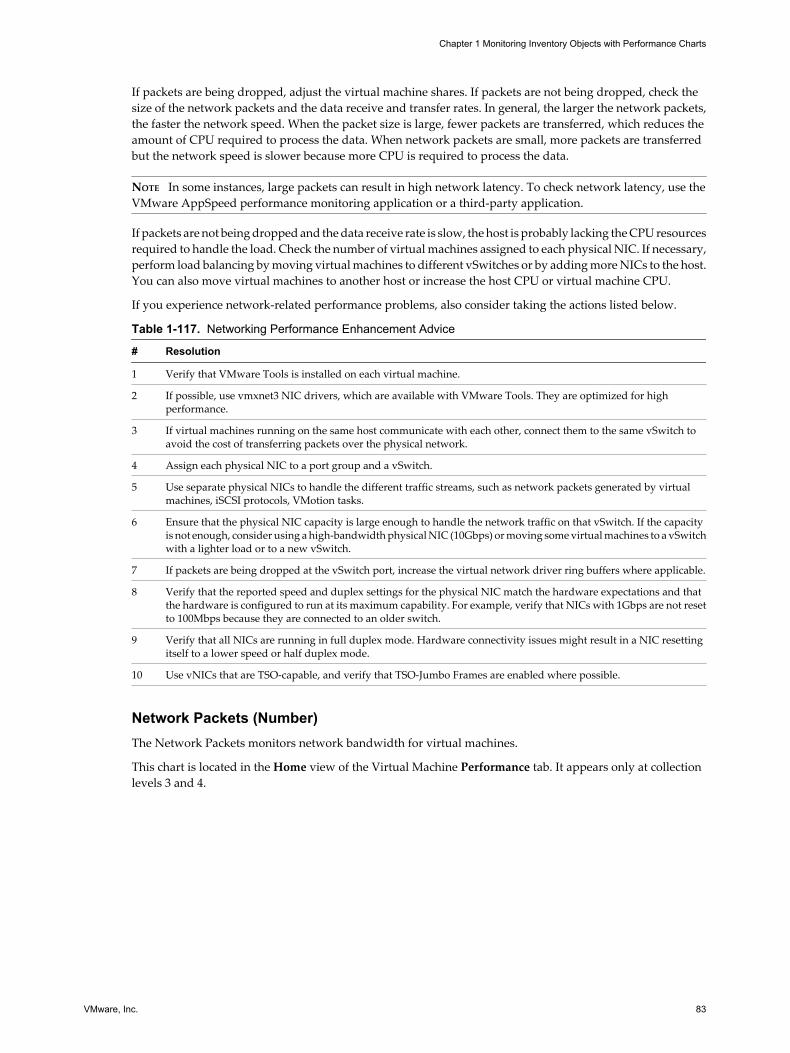
If packets are being dropped, adjust the virtual machine shares. If packets are not being dropped, check thesize of the network packets and the data receive and transfer rates. In general, the larger the network packets,the faster the network speed. When the packet size is large, fewer packets are transferred, which reduces theamount of CPU required to process the data. When network packets are small, more packets are transferredbut the network speed is slower because more CPU is required to process the data.
NOTE In some instances, large packets can result in high network latency. To check network latency, use theVMware AppSpeed performance monitoring application or a third-party application.
If packets are not being dropped and the data receive rate is slow, the host is probably lacking the CPU resourcesrequired to handle the load. Check the number of virtual machines assigned to each physical NIC. If necessary,perform load balancing by moving virtual machines to different vSwitches or by adding more NICs to the host.You can also move virtual machines to another host or increase the host CPU or virtual machine CPU.
If you experience network-related performance problems, also consider taking the actions listed below.
Table 1-117. Networking Performance Enhancement Advice
# Resolution
1 Verify that VMware Tools is installed on each virtual machine.
2 If possible, use vmxnet3 NIC drivers, which are available with VMware Tools. They are optimized for highperformance.
3 If virtual machines running on the same host communicate with each other, connect them to the same vSwitch toavoid the cost of transferring packets over the physical network.
4 Assign each physical NIC to a port group and a vSwitch.
5 Use separate physical NICs to handle the different traffic streams, such as network packets generated by virtualmachines, iSCSI protocols, VMotion tasks.
6 Ensure that the physical NIC capacity is large enough to handle the network traffic on that vSwitch. If the capacityis not enough, consider using a high-bandwidth physical NIC (10Gbps) or moving some virtual machines to a vSwitchwith a lighter load or to a new vSwitch.
7 If packets are being dropped at the vSwitch port, increase the virtual network driver ring buffers where applicable.
8 Verify that the reported speed and duplex settings for the physical NIC match the hardware expectations and thatthe hardware is configured to run at its maximum capability. For example, verify that NICs with 1Gbps are not resetto 100Mbps because they are connected to an older switch.
9 Verify that all NICs are running in full duplex mode. Hardware connectivity issues might result in a NIC resettingitself to a lower speed or half duplex mode.
10 Use vNICs that are TSO-capable, and verify that TSO-Jumbo Frames are enabled where possible.
Network Packets (Number)The Network Packets monitors network bandwidth for virtual machines.
This chart is located in the Home view of the Virtual Machine Performance tab. It appears only at collectionlevels 3 and 4.
Chapter 1 Monitoring Inventory Objects with Performance Charts
VMware, Inc. 83
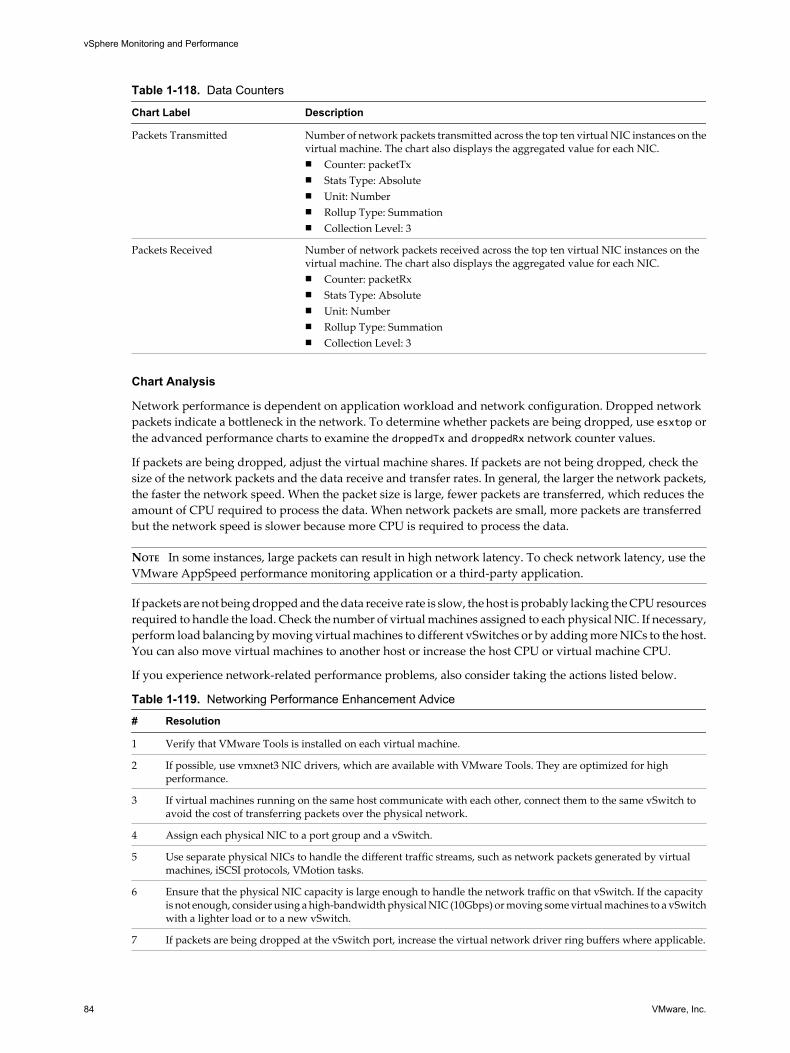
Table 1-118. Data Counters
Chart Label Description
Packets Transmitted Number of network packets transmitted across the top ten virtual NIC instances on thevirtual machine. The chart also displays the aggregated value for each NIC.n Counter: packetTxn Stats Type: Absoluten Unit: Numbern Rollup Type: Summationn Collection Level: 3
Packets Received Number of network packets received across the top ten virtual NIC instances on thevirtual machine. The chart also displays the aggregated value for each NIC.n Counter: packetRxn Stats Type: Absoluten Unit: Numbern Rollup Type: Summationn Collection Level: 3
Chart Analysis
Network performance is dependent on application workload and network configuration. Dropped networkpackets indicate a bottleneck in the network. To determine whether packets are being dropped, use esxtop orthe advanced performance charts to examine the droppedTx and droppedRx network counter values.
If packets are being dropped, adjust the virtual machine shares. If packets are not being dropped, check thesize of the network packets and the data receive and transfer rates. In general, the larger the network packets,the faster the network speed. When the packet size is large, fewer packets are transferred, which reduces theamount of CPU required to process the data. When network packets are small, more packets are transferredbut the network speed is slower because more CPU is required to process the data.
NOTE In some instances, large packets can result in high network latency. To check network latency, use theVMware AppSpeed performance monitoring application or a third-party application.
If packets are not being dropped and the data receive rate is slow, the host is probably lacking the CPU resourcesrequired to handle the load. Check the number of virtual machines assigned to each physical NIC. If necessary,perform load balancing by moving virtual machines to different vSwitches or by adding more NICs to the host.You can also move virtual machines to another host or increase the host CPU or virtual machine CPU.
If you experience network-related performance problems, also consider taking the actions listed below.
Table 1-119. Networking Performance Enhancement Advice
# Resolution
1 Verify that VMware Tools is installed on each virtual machine.
2 If possible, use vmxnet3 NIC drivers, which are available with VMware Tools. They are optimized for highperformance.
3 If virtual machines running on the same host communicate with each other, connect them to the same vSwitch toavoid the cost of transferring packets over the physical network.
4 Assign each physical NIC to a port group and a vSwitch.
5 Use separate physical NICs to handle the different traffic streams, such as network packets generated by virtualmachines, iSCSI protocols, VMotion tasks.
6 Ensure that the physical NIC capacity is large enough to handle the network traffic on that vSwitch. If the capacityis not enough, consider using a high-bandwidth physical NIC (10Gbps) or moving some virtual machines to a vSwitchwith a lighter load or to a new vSwitch.
7 If packets are being dropped at the vSwitch port, increase the virtual network driver ring buffers where applicable.
vSphere Monitoring and Performance
84 VMware, Inc.
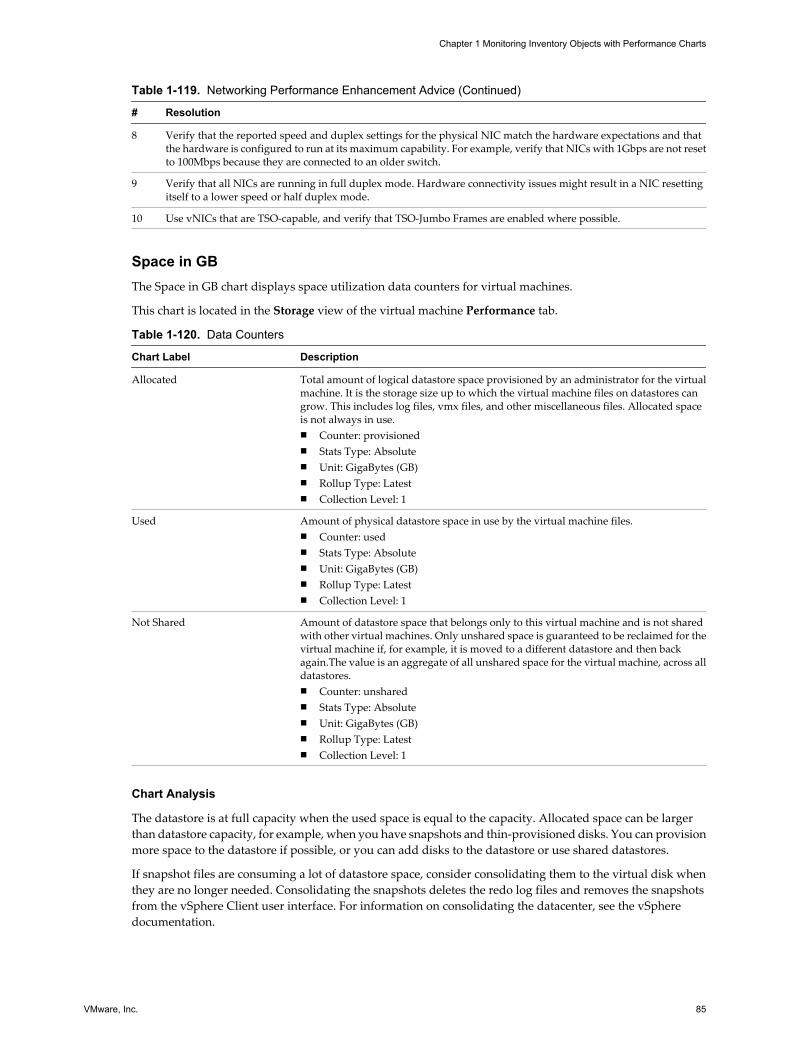
Table 1-119. Networking Performance Enhancement Advice (Continued)
# Resolution
8 Verify that the reported speed and duplex settings for the physical NIC match the hardware expectations and thatthe hardware is configured to run at its maximum capability. For example, verify that NICs with 1Gbps are not resetto 100Mbps because they are connected to an older switch.
9 Verify that all NICs are running in full duplex mode. Hardware connectivity issues might result in a NIC resettingitself to a lower speed or half duplex mode.
10 Use vNICs that are TSO-capable, and verify that TSO-Jumbo Frames are enabled where possible.
Space in GBThe Space in GB chart displays space utilization data counters for virtual machines.
This chart is located in the Storage view of the virtual machine Performance tab.
Table 1-120. Data Counters
Chart Label Description
Allocated Total amount of logical datastore space provisioned by an administrator for the virtualmachine. It is the storage size up to which the virtual machine files on datastores cangrow. This includes log files, vmx files, and other miscellaneous files. Allocated spaceis not always in use.n Counter: provisionedn Stats Type: Absoluten Unit: GigaBytes (GB)n Rollup Type: Latestn Collection Level: 1
Used Amount of physical datastore space in use by the virtual machine files.n Counter: usedn Stats Type: Absoluten Unit: GigaBytes (GB)n Rollup Type: Latestn Collection Level: 1
Not Shared Amount of datastore space that belongs only to this virtual machine and is not sharedwith other virtual machines. Only unshared space is guaranteed to be reclaimed for thevirtual machine if, for example, it is moved to a different datastore and then backagain.The value is an aggregate of all unshared space for the virtual machine, across alldatastores.n Counter: unsharedn Stats Type: Absoluten Unit: GigaBytes (GB)n Rollup Type: Latestn Collection Level: 1
Chart Analysis
The datastore is at full capacity when the used space is equal to the capacity. Allocated space can be largerthan datastore capacity, for example, when you have snapshots and thin-provisioned disks. You can provisionmore space to the datastore if possible, or you can add disks to the datastore or use shared datastores.
If snapshot files are consuming a lot of datastore space, consider consolidating them to the virtual disk whenthey are no longer needed. Consolidating the snapshots deletes the redo log files and removes the snapshotsfrom the vSphere Client user interface. For information on consolidating the datacenter, see the vSpheredocumentation.
Chapter 1 Monitoring Inventory Objects with Performance Charts
VMware, Inc. 85
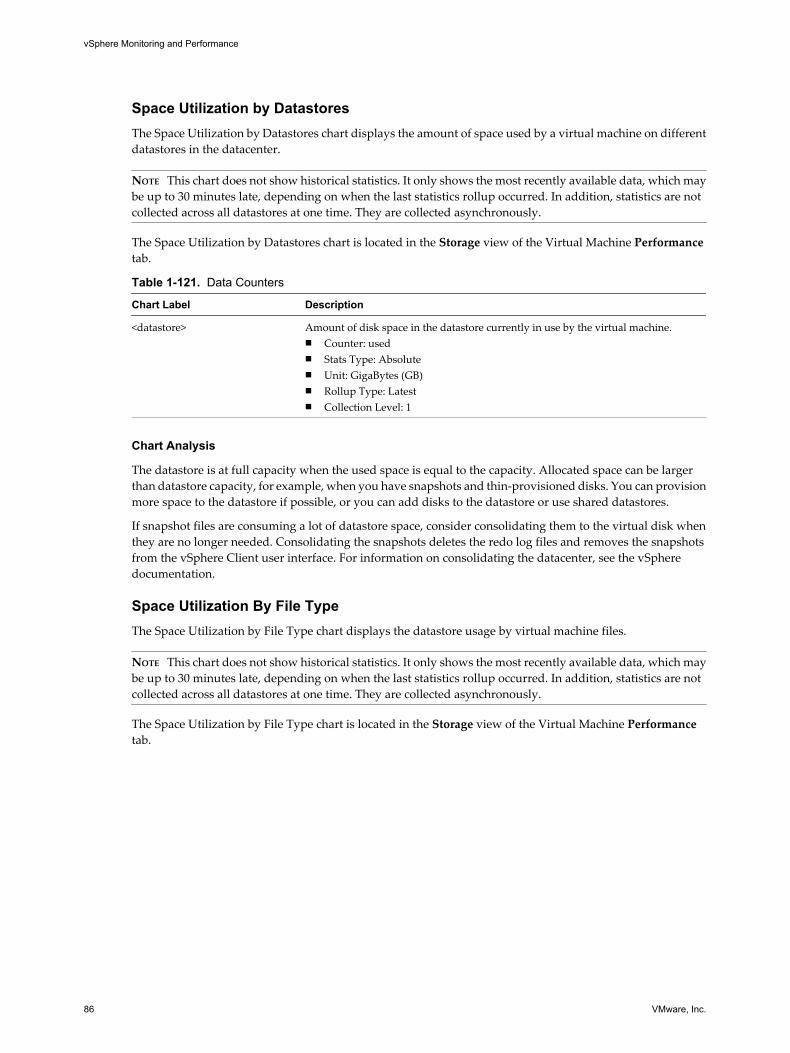
Space Utilization by DatastoresThe Space Utilization by Datastores chart displays the amount of space used by a virtual machine on differentdatastores in the datacenter.
NOTE This chart does not show historical statistics. It only shows the most recently available data, which maybe up to 30 minutes late, depending on when the last statistics rollup occurred. In addition, statistics are notcollected across all datastores at one time. They are collected asynchronously.
The Space Utilization by Datastores chart is located in the Storage view of the Virtual Machine Performancetab.
Table 1-121. Data Counters
Chart Label Description
<datastore> Amount of disk space in the datastore currently in use by the virtual machine.n Counter: usedn Stats Type: Absoluten Unit: GigaBytes (GB)n Rollup Type: Latestn Collection Level: 1
Chart Analysis
The datastore is at full capacity when the used space is equal to the capacity. Allocated space can be largerthan datastore capacity, for example, when you have snapshots and thin-provisioned disks. You can provisionmore space to the datastore if possible, or you can add disks to the datastore or use shared datastores.
If snapshot files are consuming a lot of datastore space, consider consolidating them to the virtual disk whenthey are no longer needed. Consolidating the snapshots deletes the redo log files and removes the snapshotsfrom the vSphere Client user interface. For information on consolidating the datacenter, see the vSpheredocumentation.
Space Utilization By File TypeThe Space Utilization by File Type chart displays the datastore usage by virtual machine files.
NOTE This chart does not show historical statistics. It only shows the most recently available data, which maybe up to 30 minutes late, depending on when the last statistics rollup occurred. In addition, statistics are notcollected across all datastores at one time. They are collected asynchronously.
The Space Utilization by File Type chart is located in the Storage view of the Virtual Machine Performancetab.
vSphere Monitoring and Performance
86 VMware, Inc.
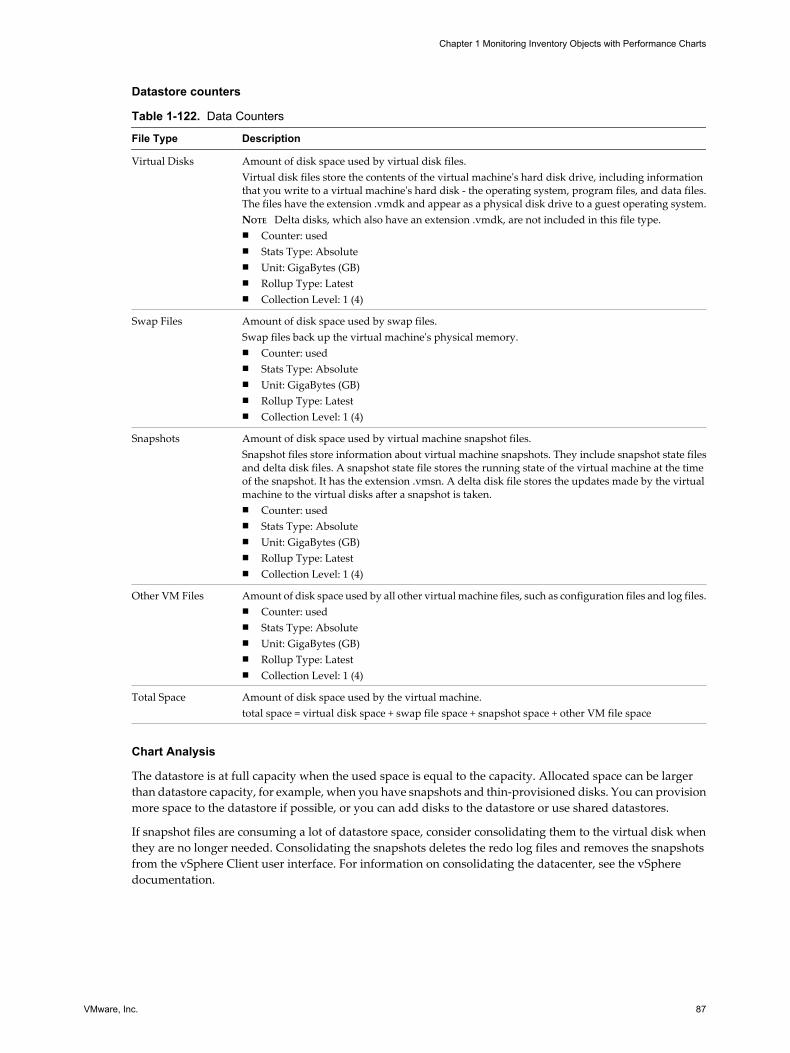
Datastore counters
Table 1-122. Data Counters
File Type Description
Virtual Disks Amount of disk space used by virtual disk files.Virtual disk files store the contents of the virtual machine's hard disk drive, including informationthat you write to a virtual machine's hard disk - the operating system, program files, and data files.The files have the extension .vmdk and appear as a physical disk drive to a guest operating system.NOTE Delta disks, which also have an extension .vmdk, are not included in this file type.n Counter: usedn Stats Type: Absoluten Unit: GigaBytes (GB)n Rollup Type: Latestn Collection Level: 1 (4)
Swap Files Amount of disk space used by swap files.Swap files back up the virtual machine's physical memory.n Counter: usedn Stats Type: Absoluten Unit: GigaBytes (GB)n Rollup Type: Latestn Collection Level: 1 (4)
Snapshots Amount of disk space used by virtual machine snapshot files.Snapshot files store information about virtual machine snapshots. They include snapshot state filesand delta disk files. A snapshot state file stores the running state of the virtual machine at the timeof the snapshot. It has the extension .vmsn. A delta disk file stores the updates made by the virtualmachine to the virtual disks after a snapshot is taken.n Counter: usedn Stats Type: Absoluten Unit: GigaBytes (GB)n Rollup Type: Latestn Collection Level: 1 (4)
Other VM Files Amount of disk space used by all other virtual machine files, such as configuration files and log files.n Counter: usedn Stats Type: Absoluten Unit: GigaBytes (GB)n Rollup Type: Latestn Collection Level: 1 (4)
Total Space Amount of disk space used by the virtual machine.total space = virtual disk space + swap file space + snapshot space + other VM file space
Chart Analysis
The datastore is at full capacity when the used space is equal to the capacity. Allocated space can be largerthan datastore capacity, for example, when you have snapshots and thin-provisioned disks. You can provisionmore space to the datastore if possible, or you can add disks to the datastore or use shared datastores.
If snapshot files are consuming a lot of datastore space, consider consolidating them to the virtual disk whenthey are no longer needed. Consolidating the snapshots deletes the redo log files and removes the snapshotsfrom the vSphere Client user interface. For information on consolidating the datacenter, see the vSpheredocumentation.
Chapter 1 Monitoring Inventory Objects with Performance Charts
VMware, Inc. 87
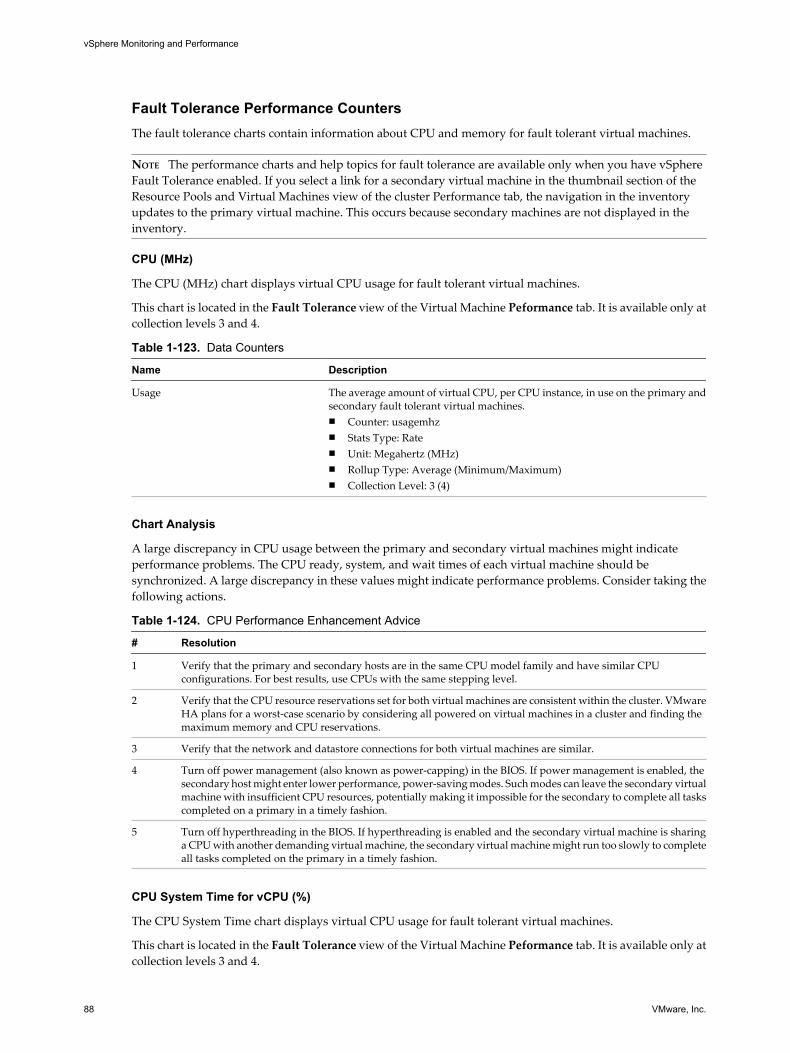
Fault Tolerance Performance CountersThe fault tolerance charts contain information about CPU and memory for fault tolerant virtual machines.
NOTE The performance charts and help topics for fault tolerance are available only when you have vSphereFault Tolerance enabled. If you select a link for a secondary virtual machine in the thumbnail section of theResource Pools and Virtual Machines view of the cluster Performance tab, the navigation in the inventoryupdates to the primary virtual machine. This occurs because secondary machines are not displayed in theinventory.
CPU (MHz)
The CPU (MHz) chart displays virtual CPU usage for fault tolerant virtual machines.
This chart is located in the Fault Tolerance view of the Virtual Machine Peformance tab. It is available only atcollection levels 3 and 4.
Table 1-123. Data Counters
Name Description
Usage The average amount of virtual CPU, per CPU instance, in use on the primary andsecondary fault tolerant virtual machines.n Counter: usagemhzn Stats Type: Raten Unit: Megahertz (MHz)n Rollup Type: Average (Minimum/Maximum)n Collection Level: 3 (4)
Chart Analysis
A large discrepancy in CPU usage between the primary and secondary virtual machines might indicateperformance problems. The CPU ready, system, and wait times of each virtual machine should besynchronized. A large discrepancy in these values might indicate performance problems. Consider taking thefollowing actions.
Table 1-124. CPU Performance Enhancement Advice
# Resolution
1 Verify that the primary and secondary hosts are in the same CPU model family and have similar CPUconfigurations. For best results, use CPUs with the same stepping level.
2 Verify that the CPU resource reservations set for both virtual machines are consistent within the cluster. VMwareHA plans for a worst-case scenario by considering all powered on virtual machines in a cluster and finding themaximum memory and CPU reservations.
3 Verify that the network and datastore connections for both virtual machines are similar.
4 Turn off power management (also known as power-capping) in the BIOS. If power management is enabled, thesecondary host might enter lower performance, power-saving modes. Such modes can leave the secondary virtualmachine with insufficient CPU resources, potentially making it impossible for the secondary to complete all taskscompleted on a primary in a timely fashion.
5 Turn off hyperthreading in the BIOS. If hyperthreading is enabled and the secondary virtual machine is sharinga CPU with another demanding virtual machine, the secondary virtual machine might run too slowly to completeall tasks completed on the primary in a timely fashion.
CPU System Time for vCPU (%)
The CPU System Time chart displays virtual CPU usage for fault tolerant virtual machines.
This chart is located in the Fault Tolerance view of the Virtual Machine Peformance tab. It is available only atcollection levels 3 and 4.
vSphere Monitoring and Performance
88 VMware, Inc.
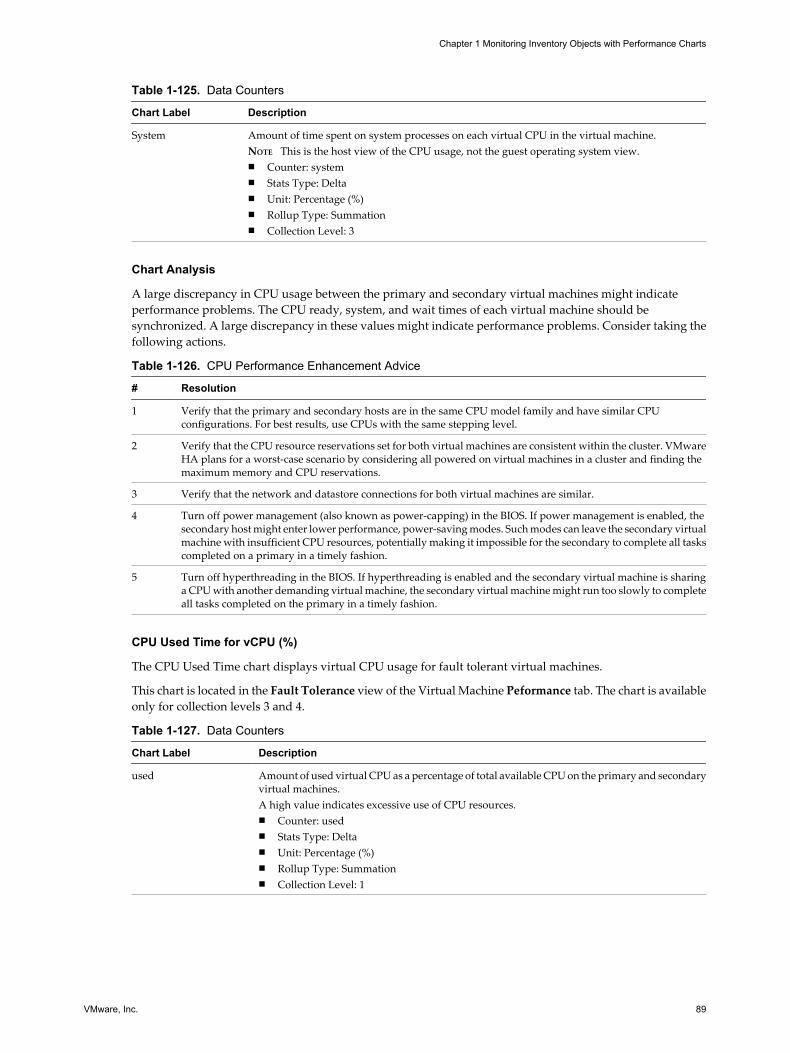
Table 1-125. Data Counters
Chart Label Description
System Amount of time spent on system processes on each virtual CPU in the virtual machine.NOTE This is the host view of the CPU usage, not the guest operating system view.n Counter: systemn Stats Type: Deltan Unit: Percentage (%)n Rollup Type: Summationn Collection Level: 3
Chart Analysis
A large discrepancy in CPU usage between the primary and secondary virtual machines might indicateperformance problems. The CPU ready, system, and wait times of each virtual machine should besynchronized. A large discrepancy in these values might indicate performance problems. Consider taking thefollowing actions.
Table 1-126. CPU Performance Enhancement Advice
# Resolution
1 Verify that the primary and secondary hosts are in the same CPU model family and have similar CPUconfigurations. For best results, use CPUs with the same stepping level.
2 Verify that the CPU resource reservations set for both virtual machines are consistent within the cluster. VMwareHA plans for a worst-case scenario by considering all powered on virtual machines in a cluster and finding themaximum memory and CPU reservations.
3 Verify that the network and datastore connections for both virtual machines are similar.
4 Turn off power management (also known as power-capping) in the BIOS. If power management is enabled, thesecondary host might enter lower performance, power-saving modes. Such modes can leave the secondary virtualmachine with insufficient CPU resources, potentially making it impossible for the secondary to complete all taskscompleted on a primary in a timely fashion.
5 Turn off hyperthreading in the BIOS. If hyperthreading is enabled and the secondary virtual machine is sharinga CPU with another demanding virtual machine, the secondary virtual machine might run too slowly to completeall tasks completed on the primary in a timely fashion.
CPU Used Time for vCPU (%)
The CPU Used Time chart displays virtual CPU usage for fault tolerant virtual machines.
This chart is located in the Fault Tolerance view of the Virtual Machine Peformance tab. The chart is availableonly for collection levels 3 and 4.
Table 1-127. Data Counters
Chart Label Description
used Amount of used virtual CPU as a percentage of total available CPU on the primary and secondaryvirtual machines.A high value indicates excessive use of CPU resources.n Counter: usedn Stats Type: Deltan Unit: Percentage (%)n Rollup Type: Summationn Collection Level: 1
Chapter 1 Monitoring Inventory Objects with Performance Charts
VMware, Inc. 89
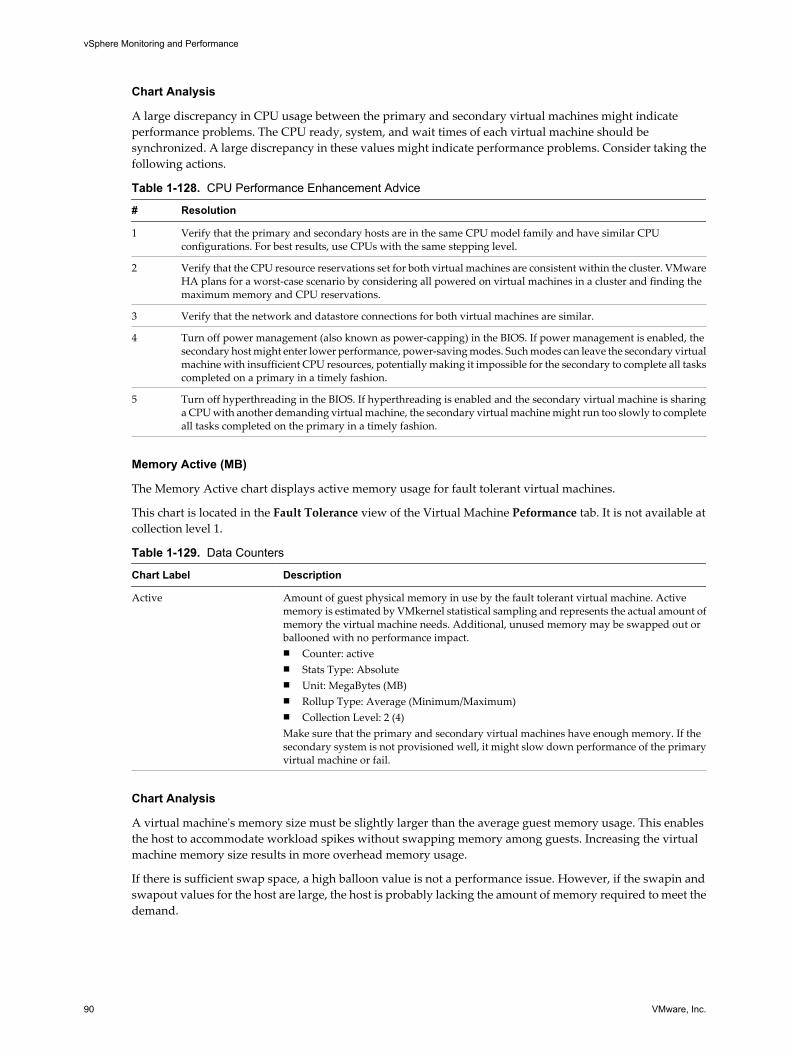
Chart Analysis
A large discrepancy in CPU usage between the primary and secondary virtual machines might indicateperformance problems. The CPU ready, system, and wait times of each virtual machine should besynchronized. A large discrepancy in these values might indicate performance problems. Consider taking thefollowing actions.
Table 1-128. CPU Performance Enhancement Advice
# Resolution
1 Verify that the primary and secondary hosts are in the same CPU model family and have similar CPUconfigurations. For best results, use CPUs with the same stepping level.
2 Verify that the CPU resource reservations set for both virtual machines are consistent within the cluster. VMwareHA plans for a worst-case scenario by considering all powered on virtual machines in a cluster and finding themaximum memory and CPU reservations.
3 Verify that the network and datastore connections for both virtual machines are similar.
4 Turn off power management (also known as power-capping) in the BIOS. If power management is enabled, thesecondary host might enter lower performance, power-saving modes. Such modes can leave the secondary virtualmachine with insufficient CPU resources, potentially making it impossible for the secondary to complete all taskscompleted on a primary in a timely fashion.
5 Turn off hyperthreading in the BIOS. If hyperthreading is enabled and the secondary virtual machine is sharinga CPU with another demanding virtual machine, the secondary virtual machine might run too slowly to completeall tasks completed on the primary in a timely fashion.
Memory Active (MB)
The Memory Active chart displays active memory usage for fault tolerant virtual machines.
This chart is located in the Fault Tolerance view of the Virtual Machine Peformance tab. It is not available atcollection level 1.
Table 1-129. Data Counters
Chart Label Description
Active Amount of guest physical memory in use by the fault tolerant virtual machine. Activememory is estimated by VMkernel statistical sampling and represents the actual amount ofmemory the virtual machine needs. Additional, unused memory may be swapped out orballooned with no performance impact.n Counter: activen Stats Type: Absoluten Unit: MegaBytes (MB)n Rollup Type: Average (Minimum/Maximum)n Collection Level: 2 (4)Make sure that the primary and secondary virtual machines have enough memory. If thesecondary system is not provisioned well, it might slow down performance of the primaryvirtual machine or fail.
Chart Analysis
A virtual machine's memory size must be slightly larger than the average guest memory usage. This enablesthe host to accommodate workload spikes without swapping memory among guests. Increasing the virtualmachine memory size results in more overhead memory usage.
If there is sufficient swap space, a high balloon value is not a performance issue. However, if the swapin andswapout values for the host are large, the host is probably lacking the amount of memory required to meet thedemand.
vSphere Monitoring and Performance
90 VMware, Inc.
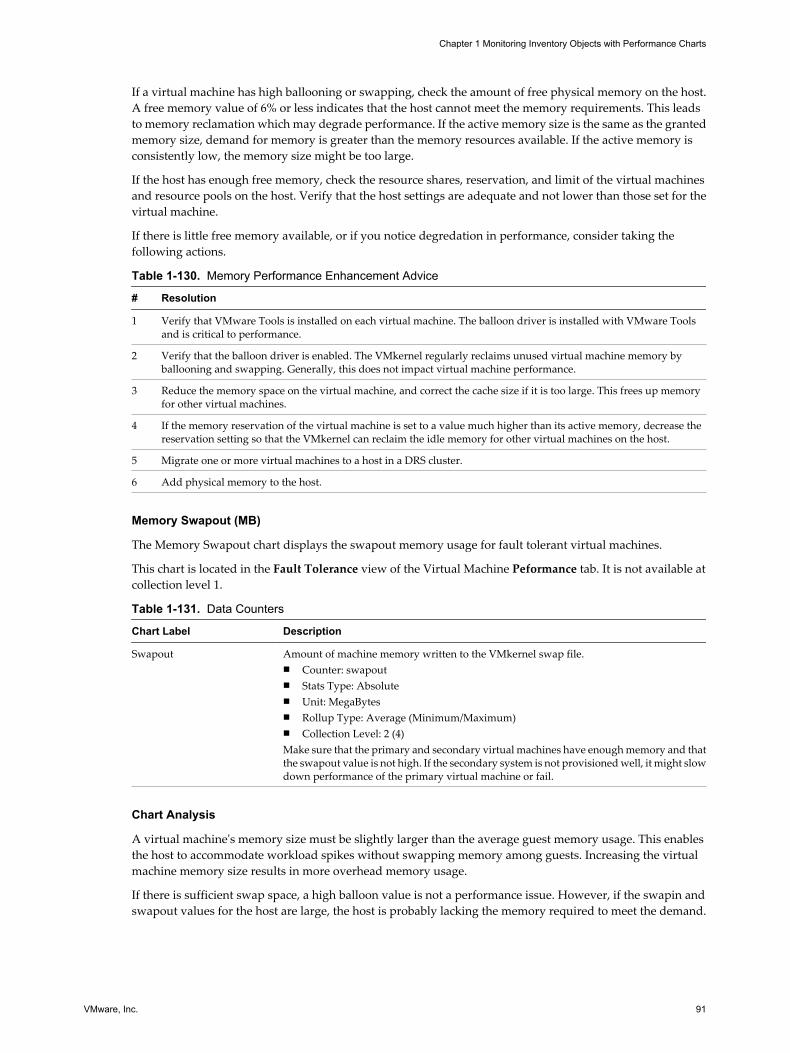
If a virtual machine has high ballooning or swapping, check the amount of free physical memory on the host.A free memory value of 6% or less indicates that the host cannot meet the memory requirements. This leadsto memory reclamation which may degrade performance. If the active memory size is the same as the grantedmemory size, demand for memory is greater than the memory resources available. If the active memory isconsistently low, the memory size might be too large.
If the host has enough free memory, check the resource shares, reservation, and limit of the virtual machinesand resource pools on the host. Verify that the host settings are adequate and not lower than those set for thevirtual machine.
If there is little free memory available, or if you notice degredation in performance, consider taking thefollowing actions.
Table 1-130. Memory Performance Enhancement Advice
# Resolution
1 Verify that VMware Tools is installed on each virtual machine. The balloon driver is installed with VMware Toolsand is critical to performance.
2 Verify that the balloon driver is enabled. The VMkernel regularly reclaims unused virtual machine memory byballooning and swapping. Generally, this does not impact virtual machine performance.
3 Reduce the memory space on the virtual machine, and correct the cache size if it is too large. This frees up memoryfor other virtual machines.
4 If the memory reservation of the virtual machine is set to a value much higher than its active memory, decrease thereservation setting so that the VMkernel can reclaim the idle memory for other virtual machines on the host.
5 Migrate one or more virtual machines to a host in a DRS cluster.
6 Add physical memory to the host.
Memory Swapout (MB)
The Memory Swapout chart displays the swapout memory usage for fault tolerant virtual machines.
This chart is located in the Fault Tolerance view of the Virtual Machine Peformance tab. It is not available atcollection level 1.
Table 1-131. Data Counters
Chart Label Description
Swapout Amount of machine memory written to the VMkernel swap file.n Counter: swapoutn Stats Type: Absoluten Unit: MegaBytesn Rollup Type: Average (Minimum/Maximum)n Collection Level: 2 (4)Make sure that the primary and secondary virtual machines have enough memory and thatthe swapout value is not high. If the secondary system is not provisioned well, it might slowdown performance of the primary virtual machine or fail.
Chart Analysis
A virtual machine's memory size must be slightly larger than the average guest memory usage. This enablesthe host to accommodate workload spikes without swapping memory among guests. Increasing the virtualmachine memory size results in more overhead memory usage.
If there is sufficient swap space, a high balloon value is not a performance issue. However, if the swapin andswapout values for the host are large, the host is probably lacking the memory required to meet the demand.
Chapter 1 Monitoring Inventory Objects with Performance Charts
VMware, Inc. 91
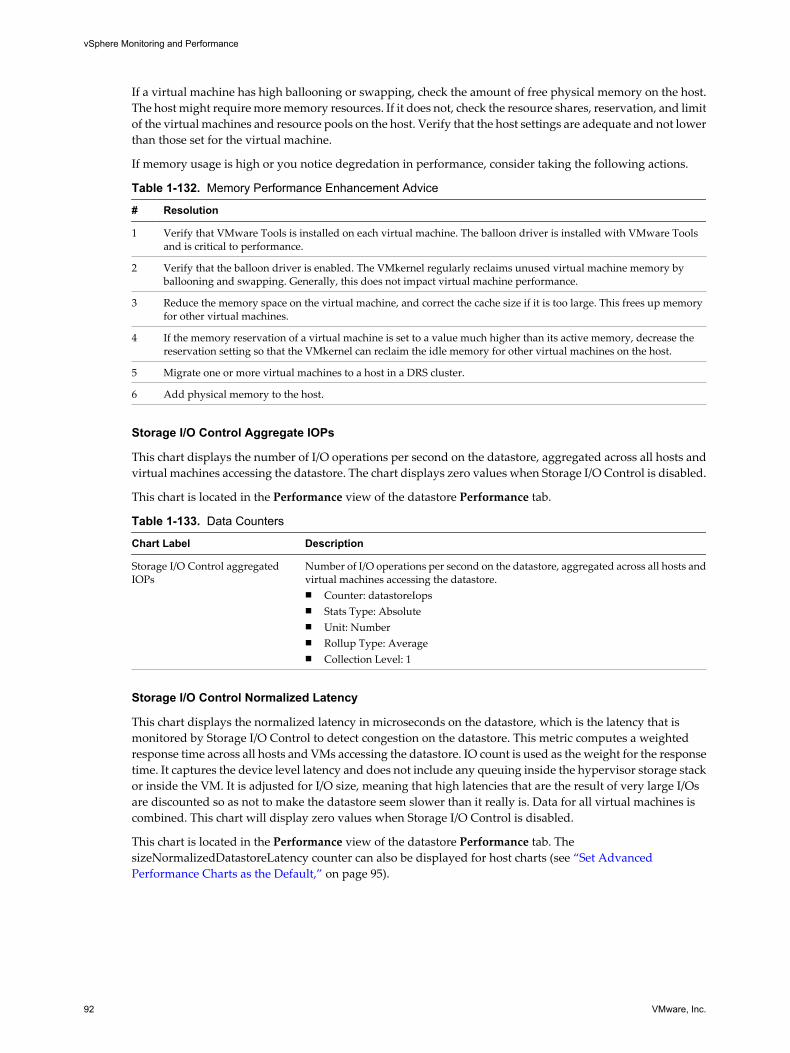
If a virtual machine has high ballooning or swapping, check the amount of free physical memory on the host.The host might require more memory resources. If it does not, check the resource shares, reservation, and limitof the virtual machines and resource pools on the host. Verify that the host settings are adequate and not lowerthan those set for the virtual machine.
If memory usage is high or you notice degredation in performance, consider taking the following actions.
Table 1-132. Memory Performance Enhancement Advice
# Resolution
1 Verify that VMware Tools is installed on each virtual machine. The balloon driver is installed with VMware Toolsand is critical to performance.
2 Verify that the balloon driver is enabled. The VMkernel regularly reclaims unused virtual machine memory byballooning and swapping. Generally, this does not impact virtual machine performance.
3 Reduce the memory space on the virtual machine, and correct the cache size if it is too large. This frees up memoryfor other virtual machines.
4 If the memory reservation of a virtual machine is set to a value much higher than its active memory, decrease thereservation setting so that the VMkernel can reclaim the idle memory for other virtual machines on the host.
5 Migrate one or more virtual machines to a host in a DRS cluster.
6 Add physical memory to the host.
Storage I/O Control Aggregate IOPs
This chart displays the number of I/O operations per second on the datastore, aggregated across all hosts andvirtual machines accessing the datastore. The chart displays zero values when Storage I/O Control is disabled.
This chart is located in the Performance view of the datastore Performance tab.
Table 1-133. Data Counters
Chart Label Description
Storage I/O Control aggregatedIOPs
Number of I/O operations per second on the datastore, aggregated across all hosts andvirtual machines accessing the datastore.n Counter: datastoreIopsn Stats Type: Absoluten Unit: Numbern Rollup Type: Averagen Collection Level: 1
Storage I/O Control Normalized Latency
This chart displays the normalized latency in microseconds on the datastore, which is the latency that ismonitored by Storage I/O Control to detect congestion on the datastore. This metric computes a weightedresponse time across all hosts and VMs accessing the datastore. IO count is used as the weight for the responsetime. It captures the device level latency and does not include any queuing inside the hypervisor storage stackor inside the VM. It is adjusted for I/O size, meaning that high latencies that are the result of very large I/Osare discounted so as not to make the datastore seem slower than it really is. Data for all virtual machines iscombined. This chart will display zero values when Storage I/O Control is disabled.
This chart is located in the Performance view of the datastore Performance tab. ThesizeNormalizedDatastoreLatency counter can also be displayed for host charts (see “Set AdvancedPerformance Charts as the Default,” on page 95).
vSphere Monitoring and Performance
92 VMware, Inc.
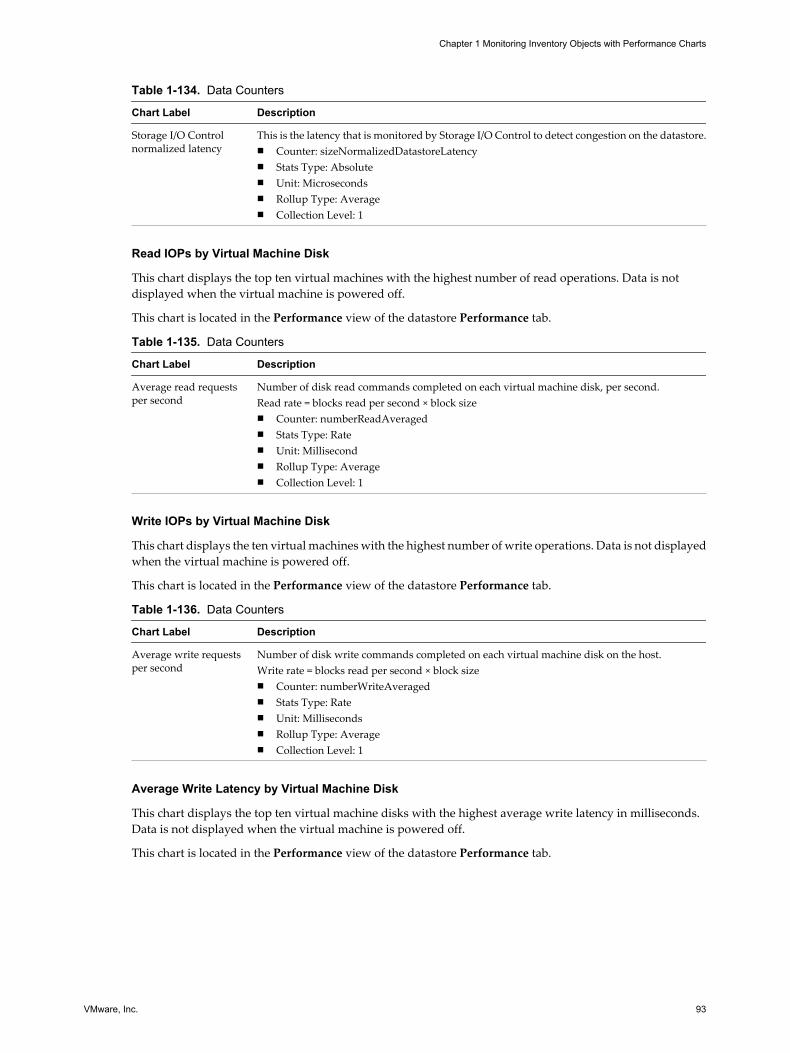
Table 1-134. Data Counters
Chart Label Description
Storage I/O Controlnormalized latency
This is the latency that is monitored by Storage I/O Control to detect congestion on the datastore.n Counter: sizeNormalizedDatastoreLatencyn Stats Type: Absoluten Unit: Microsecondsn Rollup Type: Averagen Collection Level: 1
Read IOPs by Virtual Machine Disk
This chart displays the top ten virtual machines with the highest number of read operations. Data is notdisplayed when the virtual machine is powered off.
This chart is located in the Performance view of the datastore Performance tab.
Table 1-135. Data Counters
Chart Label Description
Average read requestsper second
Number of disk read commands completed on each virtual machine disk, per second.Read rate = blocks read per second × block sizen Counter: numberReadAveragedn Stats Type: Raten Unit: Millisecondn Rollup Type: Averagen Collection Level: 1
Write IOPs by Virtual Machine Disk
This chart displays the ten virtual machines with the highest number of write operations. Data is not displayedwhen the virtual machine is powered off.
This chart is located in the Performance view of the datastore Performance tab.
Table 1-136. Data Counters
Chart Label Description
Average write requestsper second
Number of disk write commands completed on each virtual machine disk on the host.Write rate = blocks read per second × block sizen Counter: numberWriteAveragedn Stats Type: Raten Unit: Millisecondsn Rollup Type: Averagen Collection Level: 1
Average Write Latency by Virtual Machine Disk
This chart displays the top ten virtual machine disks with the highest average write latency in milliseconds.Data is not displayed when the virtual machine is powered off.
This chart is located in the Performance view of the datastore Performance tab.
Chapter 1 Monitoring Inventory Objects with Performance Charts
VMware, Inc. 93
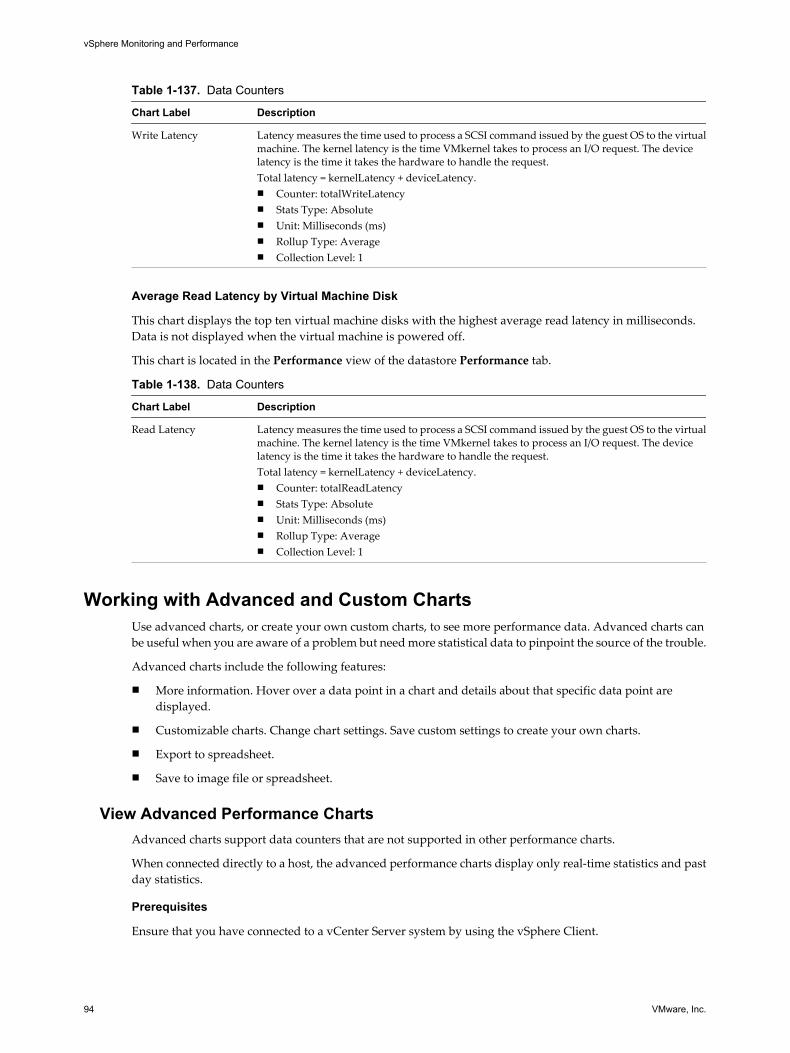
Table 1-137. Data Counters
Chart Label Description
Write Latency Latency measures the time used to process a SCSI command issued by the guest OS to the virtualmachine. The kernel latency is the time VMkernel takes to process an I/O request. The devicelatency is the time it takes the hardware to handle the request.Total latency = kernelLatency + deviceLatency.n Counter: totalWriteLatencyn Stats Type: Absoluten Unit: Milliseconds (ms)n Rollup Type: Averagen Collection Level: 1
Average Read Latency by Virtual Machine Disk
This chart displays the top ten virtual machine disks with the highest average read latency in milliseconds.Data is not displayed when the virtual machine is powered off.
This chart is located in the Performance view of the datastore Performance tab.
Table 1-138. Data Counters
Chart Label Description
Read Latency Latency measures the time used to process a SCSI command issued by the guest OS to the virtualmachine. The kernel latency is the time VMkernel takes to process an I/O request. The devicelatency is the time it takes the hardware to handle the request.Total latency = kernelLatency + deviceLatency.n Counter: totalReadLatencyn Stats Type: Absoluten Unit: Milliseconds (ms)n Rollup Type: Averagen Collection Level: 1
Working with Advanced and Custom ChartsUse advanced charts, or create your own custom charts, to see more performance data. Advanced charts canbe useful when you are aware of a problem but need more statistical data to pinpoint the source of the trouble.
Advanced charts include the following features:
n More information. Hover over a data point in a chart and details about that specific data point aredisplayed.
n Customizable charts. Change chart settings. Save custom settings to create your own charts.
n Export to spreadsheet.
n Save to image file or spreadsheet.
View Advanced Performance ChartsAdvanced charts support data counters that are not supported in other performance charts.
When connected directly to a host, the advanced performance charts display only real-time statistics and pastday statistics.
Prerequisites
Ensure that you have connected to a vCenter Server system by using the vSphere Client.
vSphere Monitoring and Performance
94 VMware, Inc.
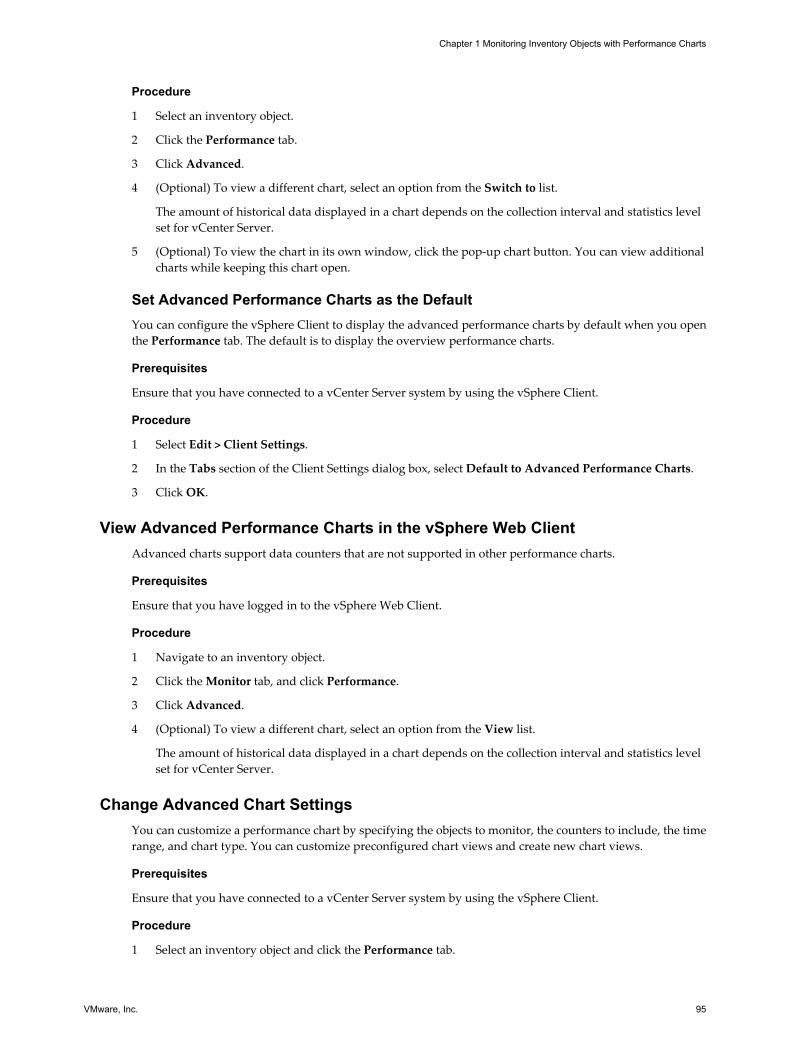
Procedure
1 Select an inventory object.
2 Click the Performance tab.
3 Click Advanced.
4 (Optional) To view a different chart, select an option from the Switch to list.
The amount of historical data displayed in a chart depends on the collection interval and statistics levelset for vCenter Server.
5 (Optional) To view the chart in its own window, click the pop-up chart button. You can view additionalcharts while keeping this chart open.
Set Advanced Performance Charts as the DefaultYou can configure the vSphere Client to display the advanced performance charts by default when you openthe Performance tab. The default is to display the overview performance charts.
Prerequisites
Ensure that you have connected to a vCenter Server system by using the vSphere Client.
Procedure
1 Select Edit > Client Settings.
2 In the Tabs section of the Client Settings dialog box, select Default to Advanced Performance Charts.
3 Click OK.
View Advanced Performance Charts in the vSphere Web ClientAdvanced charts support data counters that are not supported in other performance charts.
Prerequisites
Ensure that you have logged in to the vSphere Web Client.
Procedure
1 Navigate to an inventory object.
2 Click the Monitor tab, and click Performance.
3 Click Advanced.
4 (Optional) To view a different chart, select an option from the View list.
The amount of historical data displayed in a chart depends on the collection interval and statistics levelset for vCenter Server.
Change Advanced Chart SettingsYou can customize a performance chart by specifying the objects to monitor, the counters to include, the timerange, and chart type. You can customize preconfigured chart views and create new chart views.
Prerequisites
Ensure that you have connected to a vCenter Server system by using the vSphere Client.
Procedure
1 Select an inventory object and click the Performance tab.
Chapter 1 Monitoring Inventory Objects with Performance Charts
VMware, Inc. 95
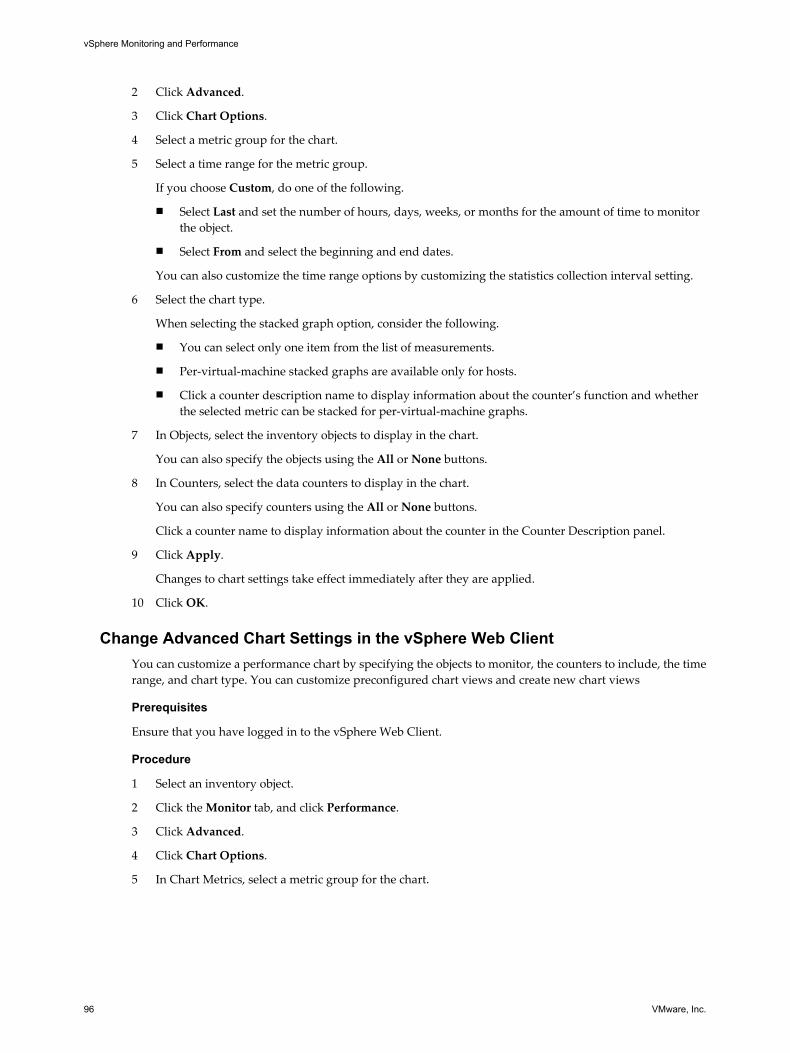
2 Click Advanced.
3 Click Chart Options.
4 Select a metric group for the chart.
5 Select a time range for the metric group.
If you choose Custom, do one of the following.
n Select Last and set the number of hours, days, weeks, or months for the amount of time to monitorthe object.
n Select From and select the beginning and end dates.
You can also customize the time range options by customizing the statistics collection interval setting.
6 Select the chart type.
When selecting the stacked graph option, consider the following.
n You can select only one item from the list of measurements.
n Per-virtual-machine stacked graphs are available only for hosts.
n Click a counter description name to display information about the counter’s function and whetherthe selected metric can be stacked for per-virtual-machine graphs.
7 In Objects, select the inventory objects to display in the chart.
You can also specify the objects using the All or None buttons.
8 In Counters, select the data counters to display in the chart.
You can also specify counters using the All or None buttons.
Click a counter name to display information about the counter in the Counter Description panel.
9 Click Apply.
Changes to chart settings take effect immediately after they are applied.
10 Click OK.
Change Advanced Chart Settings in the vSphere Web ClientYou can customize a performance chart by specifying the objects to monitor, the counters to include, the timerange, and chart type. You can customize preconfigured chart views and create new chart views
Prerequisites
Ensure that you have logged in to the vSphere Web Client.
Procedure
1 Select an inventory object.
2 Click the Monitor tab, and click Performance.
3 Click Advanced.
4 Click Chart Options.
5 In Chart Metrics, select a metric group for the chart.
vSphere Monitoring and Performance
96 VMware, Inc.
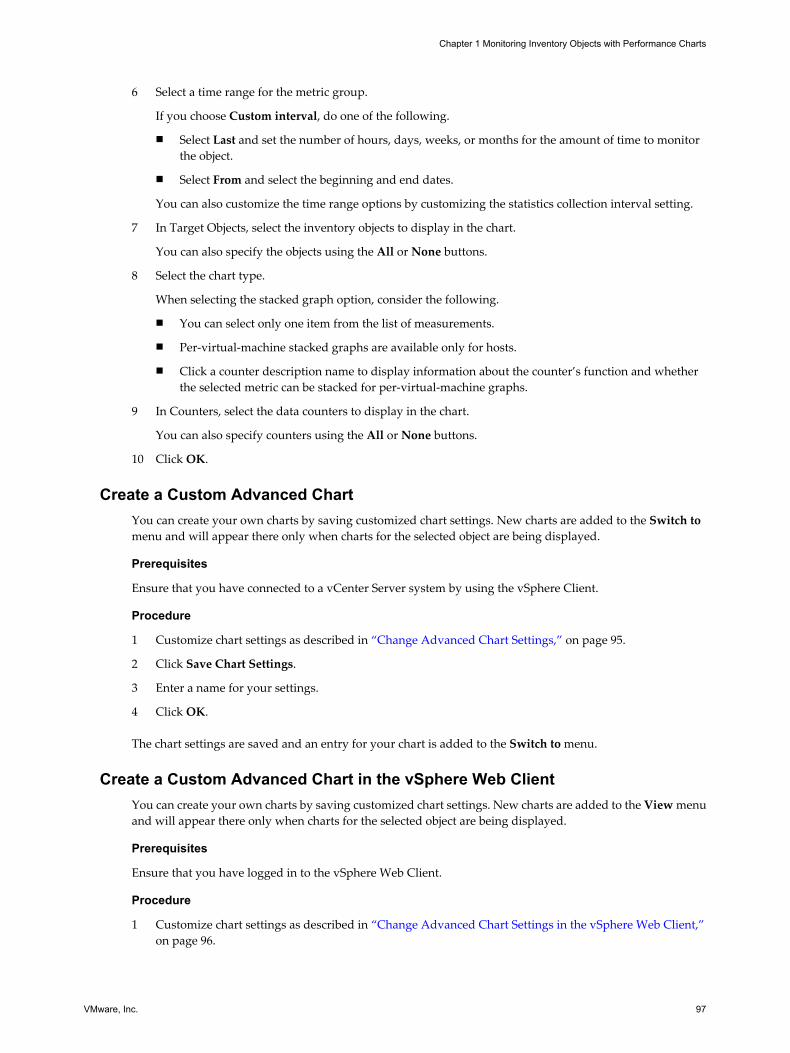
6 Select a time range for the metric group.
If you choose Custom interval, do one of the following.
n Select Last and set the number of hours, days, weeks, or months for the amount of time to monitorthe object.
n Select From and select the beginning and end dates.
You can also customize the time range options by customizing the statistics collection interval setting.
7 In Target Objects, select the inventory objects to display in the chart.
You can also specify the objects using the All or None buttons.
8 Select the chart type.
When selecting the stacked graph option, consider the following.
n You can select only one item from the list of measurements.
n Per-virtual-machine stacked graphs are available only for hosts.
n Click a counter description name to display information about the counter’s function and whetherthe selected metric can be stacked for per-virtual-machine graphs.
9 In Counters, select the data counters to display in the chart.
You can also specify counters using the All or None buttons.
10 Click OK.
Create a Custom Advanced ChartYou can create your own charts by saving customized chart settings. New charts are added to the Switch tomenu and will appear there only when charts for the selected object are being displayed.
Prerequisites
Ensure that you have connected to a vCenter Server system by using the vSphere Client.
Procedure
1 Customize chart settings as described in “Change Advanced Chart Settings,” on page 95.
2 Click Save Chart Settings.
3 Enter a name for your settings.
4 Click OK.
The chart settings are saved and an entry for your chart is added to the Switch to menu.
Create a Custom Advanced Chart in the vSphere Web ClientYou can create your own charts by saving customized chart settings. New charts are added to the View menuand will appear there only when charts for the selected object are being displayed.
Prerequisites
Ensure that you have logged in to the vSphere Web Client.
Procedure
1 Customize chart settings as described in “Change Advanced Chart Settings in the vSphere Web Client,”on page 96.
Chapter 1 Monitoring Inventory Objects with Performance Charts
VMware, Inc. 97
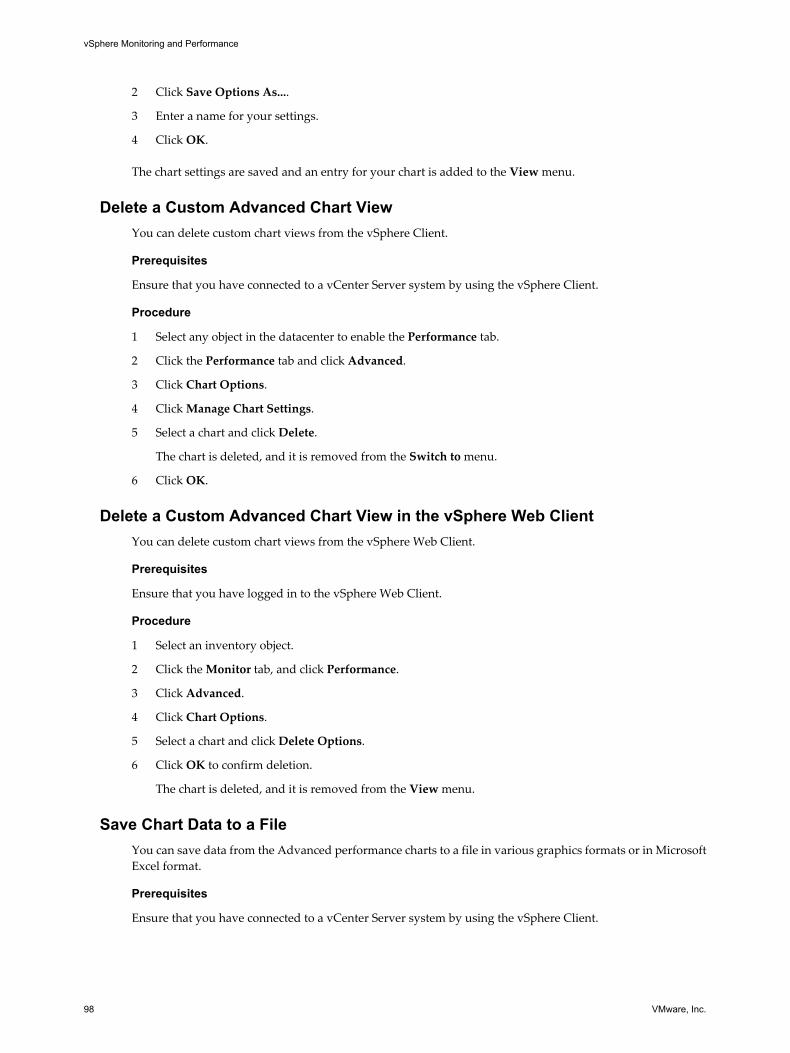
2 Click Save Options As....
3 Enter a name for your settings.
4 Click OK.
The chart settings are saved and an entry for your chart is added to the View menu.
Delete a Custom Advanced Chart ViewYou can delete custom chart views from the vSphere Client.
Prerequisites
Ensure that you have connected to a vCenter Server system by using the vSphere Client.
Procedure
1 Select any object in the datacenter to enable the Performance tab.
2 Click the Performance tab and click Advanced.
3 Click Chart Options.
4 Click Manage Chart Settings.
5 Select a chart and click Delete.
The chart is deleted, and it is removed from the Switch to menu.
6 Click OK.
Delete a Custom Advanced Chart View in the vSphere Web ClientYou can delete custom chart views from the vSphere Web Client.
Prerequisites
Ensure that you have logged in to the vSphere Web Client.
Procedure
1 Select an inventory object.
2 Click the Monitor tab, and click Performance.
3 Click Advanced.
4 Click Chart Options.
5 Select a chart and click Delete Options.
6 Click OK to confirm deletion.
The chart is deleted, and it is removed from the View menu.
Save Chart Data to a FileYou can save data from the Advanced performance charts to a file in various graphics formats or in MicrosoftExcel format.
Prerequisites
Ensure that you have connected to a vCenter Server system by using the vSphere Client.
vSphere Monitoring and Performance
98 VMware, Inc.
Procedure
1 In the Performance tab, click Advanced.
2 Click Save.
3 In the Save Performance Chart dialog box, navigate to the location to save the file.
4 Enter a name for the file.
5 Select a file type.
6 Click Save.
The file is saved to the location and format you specified.
Save Chart Data to a File in the vSphere Web ClientYou can save data from the Advanced performance charts to a file in various graphics formats or in coma-separated values (CSV) format.
Prerequisites
Procedure
1 Select an inventory object.
2 Click the Monitor tab, and click Performance.
3 Click Advanced.
4 Click the Export icon ( ).
5 Select a file type.
Option Description
To PNG Exports a bitmap image in the PNG format.
To JPEG Exports a bitmap image in the JPEG format.
To CSV Exports plain-text data in the CSV format.
6 Enter a name and location for the file.
7 Click Save.
The file is saved to the location and format you specified.
Export Performance Data to a SpreadsheetYou can export performance data from the Advanced charts to a Microsoft Office Excel file.
Prerequisites
Ensure that you have connected to a vCenter Server system by using the vSphere Client.
Procedure
1 Select the object in the inventory.
2 Select File > Report > Performance.
If performance data is not available for the selected inventory object, the Export Performance option is notavailable.
3 Enter a filename and location.
Chapter 1 Monitoring Inventory Objects with Performance Charts
VMware, Inc. 99
4 Select the date and time range for the chart.
5 In Chart Options, select the chart type.
6 Select the metric groups to display in the chart.
You can also specify the objects by selecting All or None.
7 (Optional) To customize the options, click Advanced, select the objects and counters to include in the chart,and click OK.
8 Specify the size of the chart in the exported file.
9 Click OK to export the data.
Troubleshoot and Enhance PerformanceThis section presents tips for identifying and solving performance problems.
The suggestions in this section are not meant to be a comprehensive guide to diagnosing and troubleshootingproblems in the virtual environment. It is meant to provide information about some common problems thatcan be solved without contacting VMware Technical Support.
Solutions for Consistently High CPU UsageTemporary spikes in CPU usage indicate that you are making the best use of CPU resources. Consistently highCPU usage might indicate a problem. You can use the vSphere Client CPU performance charts to monitor CPUusage for hosts, clusters, resource pools, virtual machines, and vApps.
Problem
n Host CPU usage constantly is high. A high CPU usage value can lead to increased ready time and processorqueuing of the virtual machines on the host.
n Virtual machine CPU usage is above 90% and the CPU ready value is above 20%. Application performanceis impacted.
Cause
The host probably is lacking the CPU resources required to meet the demand.
Solution
n Verify that VMware Tools is installed on every virtual machine on the host.
n Compare the CPU usage value of a virtual machine with the CPU usage of other virtual machines on thehost or in the resource pool. The stacked bar chart on the host's Virtual Machine view shows the CPUusage for all virtual machines on the host.
n Determine whether the high ready time for the virtual machine resulted from its CPU usage time reachingthe CPU limit setting. If so, increase the CPU limit on the virtual machine.
n Increase the CPU shares to give the virtual machine more opportunities to run. The total ready time onthe host might remain at the same level if the host system is constrained by CPU. If the host ready timedoesn't decrease, set the CPU reservations for high-priority virtual machines to guarantee that they receivethe required CPU cycles.
n Increase the amount of memory allocated to the virtual machine. This action decreases disk and or networkactivity for applications that cache. This might lower disk I/O and reduce the need for the host to virtualizethe hardware. Virtual machines with smaller resource allocations generally accumulate more CPU readytime.
vSphere Monitoring and Performance
100 VMware, Inc.
n Reduce the number of virtual CPUs on a virtual machine to only the number required to execute theworkload. For example, a single-threaded application on a four-way virtual machine only benefits froma single vCPU. But the hypervisor's maintenance of the three idle vCPUs takes CPU cycles that could beused for other work.
n If the host is not already in a DRS cluster, add it to one. If the host is in a DRS cluster, increase the numberof hosts and migrate one or more virtual machines onto the new host.
n Upgrade the physical CPUs or cores on the host if necessary.
n Use the newest version of hypervisor software, and enable CPU-saving features such as TCP SegmentationOffload, large memory pages, and jumbo frames.
Solutions for Memory Performance ProblemsHost machine memory is the hardware backing for guest virtual memory and guest physical memory. Hostmachine memory must be at least slightly larger than the combined active memory of the virtual machines onthe host. A virtual machine's memory size must be slightly larger than the average guest memory usage.Increasing the virtual machine memory size results in more overhead memory usage.
Problem
n Memory usage is constantly high (94% or greater) or constantly low (24% or less).
n Free memory consistently is 6% or less and swapping frequently occurs.
Cause
n The host probably is lacking the memory required to meet the demand. The active memory size is thesame as the granted memory size, which results in memory resources that are not sufficient for theworkload. Granted memory is too much if the active memory is constantly low.
n Host machine memory resources are not enough to meet the demand, which leads to memory reclamationand degraded performance.
n The active memory size is the same as the granted memory size, which results in memory resources thatare not sufficient for the workload.
Solution
n Verify that VMware Tools is installed on each virtual machine. The balloon driver is installed with VMwareTools and is critical to performance.
n Verify that the balloon driver is enabled. The VMkernel regularly reclaims unused virtual machinememory by ballooning and swapping. Generally, this does not impact virtual machine performance.
n Reduce the memory space on the virtual machine, and correct the cache size if it is too large. This frees upmemory for other virtual machines.
n If the memory reservation of the virtual machine is set to a value much higher than its active memory,decrease the reservation setting so that the VMkernel can reclaim the idle memory for other virtualmachines on the host.
n Migrate one or more virtual machines to a host in a DRS cluster.
n Add physical memory to the host.
Chapter 1 Monitoring Inventory Objects with Performance Charts
VMware, Inc. 101
Solutions for Storage Performance ProblemsDatastores represent storage locations for virtual machine files. A storage location can be a VMFS volume, adirectory on Network Attached Storage, or a local file system path. Datastores are platform-independent andhost-independent.
Problem
n Snapshot files are consuming a lot of datastore space.
n The datastore is at full capacity when the used space is equal to the capacity. Allocated space can be largerthan datastore capacity, for example, when you have snapshots and thin-provisioned disks.
Solution
n Consider consolidating snapshots to the virtual disk when they are no longer needed. Consolidating thesnapshots deletes the redo log files and removes the snapshots from the vSphere Client and vSphere WebClient user interfaces.
n You can provision more space to the datastore if possible, or you can add disks to the datastore or useshared datastores.
Solutions for Disk Performance ProblemsUse the disk charts to monitor average disk loads and to determine trends in disk usage. For example, youmight notice a performance degradation with applications that frequently read from and write to the harddisk. If you see a spike in the number of disk read/write requests, check if any such applications were runningat that time.
Problem
n The value for the kernelLatency data counter is greater than 4ms.
n The value for the deviceLatency data counter is greater than 15ms indicates there are probably problemswith the storage array.
n The queueLatency data counter measures above zero.
n Spikes in latency.
n Unusual increases in read/write requests.
Cause
n The virtual machines on the host are trying to send more throughput to the storage system than theconfiguration supports.
n The storage array probably is experiencing internal problems.
n The workload is too high and the array cannot process the data fast enough.
Solution
n The virtual machines on the host are trying to send more throughput to the storage system than theconfiguration supports. Check the CPU usage, and increase the queue depth.
n Move the active VMDK to a volume with more spindles or add disks to the LUN.
n Increase the virtual machine memory. This should allow for more operating system caching, which canreduce I/O activity. Note that this may require you to also increase the host memory. Increasing memorymight reduce the need to store data because databases can utilize system memory to cache data and avoiddisk access.
vSphere Monitoring and Performance
102 VMware, Inc.
n Check swap statistics in the guest operating system to verify that virtual machines have adequate memory.Increase the guest memory, but not to an extent that leads to excessive host memory swapping. InstallVMware Tools so that memory ballooning can occur.
n Defragment the file systems on all guests.
n Disable antivirus on-demand scans on the VMDK and VMEM files.
n Use the vendor's array tools to determine the array performance statistics. When too many serverssimultaneously access common elements on an array, the disks might have trouble keeping up. Considerarray-side improvements to increase throughput.
n Use Storage vMotion to migrate I/O-intensive virtual machines across multiple hosts.
n Balance the disk load across all physical resources available. Spread heavily used storage across LUNsthat are accessed by different adapters. Use separate queues for each adapter to improve disk efficiency.
n Configure the HBAs and RAID controllers for optimal use. Verify that the queue depths and cache settingson the RAID controllers are adequate. If not, increase the number of outstanding disk requests for thevirtual machine by adjusting the Disk.SchedNumReqOutstanding parameter.
n For resource-intensive virtual machines, separate the virtual machine's physical disk drive from the drivewith the system page file. This alleviates disk spindle contention during periods of high use.
n On systems with sizable RAM, disable memory trimming by adding the line MemTrimRate=0 to the virtualmachine's .VMX file.
n If the combined disk I/O is higher than a single HBA capacity, use multipathing or multiple links.
n For ESXi hosts, create virtual disks as preallocated. When you create a virtual disk for a guest operatingsystem, select Allocate all disk space now. The performance degradation associated with reassigningadditional disk space does not occur, and the disk is less likely to become fragmented.
n Use the most current hypervisor software.
Solutions for Poor Network PerformanceNetwork performance is dependent on application workload and network configuration. Dropped networkpackets indicate a bottleneck in the network. Slow network performance can be a sign of load-balancingproblems.
Problem
Network problems can manifest in many ways:
n Packets are being dropped.
n Network latency is high.
n Data receive rate is low.
Cause
Network problems can have several causes:
n Virtual machine network resource shares are too few.
n Network packet size is too large, which results in high network latency. Use the VMware AppSpeedperformance monitoring application or a third-party application to check network latency.
n Network packet size is too small, which increases the demand for the CPU resources needed for processingeach packet. Host CPU, or possibly virtual machine CPU, resources are not enough to handle the load.
Chapter 1 Monitoring Inventory Objects with Performance Charts
VMware, Inc. 103
Solution
n Determine whether packets are being dropped by using esxtop or the advanced performance charts toexamine the droppedTx and droppedRx network counter values. Verify that VMware Tools is installed oneach virtual machine.
n Check the number of virtual machines assigned to each physical NIC. If necessary, perform load balancingby moving virtual machines to different vSwitches or by adding more NICs to the host. You can also movevirtual machines to another host or increase the host CPU or virtual machine CPU.
n If possible, use vmxnet3 NIC drivers, which are available with VMware Tools. They are optimized forhigh performance.
n If virtual machines running on the same host communicate with each other, connect them to the samevSwitch to avoid the cost of transferring packets over the physical network.
n Assign each physical NIC to a port group and a vSwitch.
n Use separate physical NICs to handle the different traffic streams, such as network packets generated byvirtual machines, iSCSI protocols, vMotion tasks.
n Ensure that the physical NIC capacity is large enough to handle the network traffic on that vSwitch. If thecapacity is not enough, consider using a high-bandwidth physical NIC (10Gbps) or moving some virtualmachines to a vSwitch with a lighter load or to a new vSwitch.
n If packets are being dropped at the vSwitch port, increase the virtual network driver ring buffers whereapplicable.
n Verify that the reported speed and duplex settings for the physical NIC match the hardware expectationsand that the hardware is configured to run at its maximum capability. For example, verify that NICs with1Gbps are not reset to 100Mbps because they are connected to an older switch.
n Verify that all NICs are running in full duplex mode. Hardware connectivity issues might result in a NICresetting itself to a lower speed or half duplex mode.
n Use vNICs that are TSO-capable, and verify that TSO-Jumbo Frames are enabled where possible.
Why are my charts empty?The following table lists the scenarios in which performance charts are empty with the label "No data available."Each scenario assumes that the default rollup configuration for the vCenter Server system has not changed.Metrics introduced in ESXi 5.0 are not available for hosts running earlier versions; "No data available" will bedisplayed when users attempt to view new metrics on older hosts.
Table 1-139. Scenarios for Unavailable Performance Data
Chart Time Range Behavior
Real time Real-time statistics are not available for disconnected hosts or powered off virtualmachines. The charts are empty with the label "No data available."
1 day The real-time statistics are collected on hosts and aggregated every 5 minutes. After sixdata points are collected (30 minutes), they are rolled up to the vCenter Server databaseto create the 1 Day statistics. 1 Day statistics might not be available for 30 minutes afterthe current time, depending on when the sample period began. The charts are emptywith the label "No data available."
1 week The 1 Day statistics are rolled up to create one data point every 30 minutes. If there is alag in the rollup operation, the 1 Week statistics might not be available for 1 hour afterthe current time (30 minutes for the 1 Week collection interval + 30 minutes for the 1 Daycollection interval). The charts are empty with the label "No data available."
vSphere Monitoring and Performance
104 VMware, Inc.
Table 1-139. Scenarios for Unavailable Performance Data (Continued)
Chart Time Range Behavior
1 month The 1 Week statistics are rolled up to create one data point every 2 hours. If there is a lagin the rollup operations, the 1 Month statistics might not be available for 3 hours (2 hoursfor the 1 Month collection interval + 1 hour for the 1 Week collection interval). The chartsare empty with the label "No data available."
1 year The 1 Month statistics are rolled up to create one data point every day. If there is a lag inthe rollup operations, the statistics might not be available for 1 day and 3 hours (1 dayfor the past year collection interval + 3 hours for the past month collection interval).During this time, the charts are empty with the label "No data available."
Chapter 1 Monitoring Inventory Objects with Performance Charts
VMware, Inc. 105

vSphere Monitoring and Performance
106 VMware, Inc.
Monitoring Guest Operating SystemPerformance 2
This section describes how to install and view VMware-specific performance data for virtual machines thatrun Microsoft Windows operating systems. VMware provides performance counters that enable you to viewdata on many aspects of guest operating system performance for the Microsoft Windows Perfmon utility.
Some virtualization processes dynamically allocate available resources depending on the status, or utilizationrates, of virtual machines in the environment. This can make obtaining accurate information about the resourceutilization (CPU utilization, in particular) of individual virtual machines, or applications running within virtualmachines, difficult. VMware now provides virtual machine-specific performance counter libraries for theWindows Perfmon utility that enable application administrators to access accurate virtual machine resourceutilization statistics from within the Windows Perfmon utility.
You can take advantage of virtualized CPU performance counters to use performance tuning tools inside theguest operating system. See the vSphere Virtual Machine Administration documentation.
This chapter includes the following topics:
n “Enable Statistics Collection for Guest Operating System Performance Analysis,” on page 107
n “View Performance Statistics for Windows Guest Operating Systems,” on page 107
Enable Statistics Collection for Guest Operating System PerformanceAnalysis
VMware-specific performance objects are loaded into Microsoft Windows Perfmon and enabled whenVMware Tools is installed.
To display a performance chart for any performance object, you must add counters. See “View PerformanceStatistics for Windows Guest Operating Systems,” on page 107
View Performance Statistics for Windows Guest Operating SystemsYou can display VMware specific statistics in the Microsoft Windows Perfmon utility.
Prerequisites
Verify that a virtual machine with a Microsoft Windows operating system and VMware Tools is installed.
Procedure
1 Open a console to the virtual machine and log in.
2 Select Start > Run.
3 Enter Perfmon and press Enter.
4 In the Performance dialog box, click Add .
VMware, Inc. 107
5 In the Add Counters dialog box, select Use local computer counters.
6 Select a virtual machine performance object.
Virtual machine performance object names begin with VM.
7 Select the counters that you want to display for that object.
8 If the performance object has multiple instances, select the instances you want to display.
9 Click Add.
The Performance dialog box displays data for the selected performance object.
10 Click Close to close the Add Counter dialog box and return to the Performance dialog box.
vSphere Monitoring and Performance
108 VMware, Inc.
Monitoring Host Health Status 3You can use the vSphere Client or the vSphere Web Client to monitor the state of host hardware components,such as CPU processors, memory, fans, and other components.
The host health monitoring tool allows you to monitor the health of a variety of host hardware componentsincluding:
n CPU processors
n Memory
n Fans
n Temperature
n Voltage
n Power
n Network
n Battery
n Storage
n Cable/Interconnect
n Software components
n Watchdog
n Other
The host health monitoring tool presents data gathered using Systems Management Architecture for ServerHardware (SMASH) profiles. The information displayed depends on the sensors available on your serverhardware. SMASH is an industry standard specification providing protocols for managing a variety of systemsin the datacenter. For more information, see http://www.dmtf.org/standards/smash.
You can monitor a host’s health status either by connecting the vSphere Client directly to a host, or byconnecting to a vCenter Server system. You can also set alarms to trigger when the host health status changes.
This chapter includes the following topics:
n “Monitor Health Status When Directly Connected to a Host,” on page 110
n “Monitor Health Status When Connected to vCenter Server,” on page 110
n “Monitor Health Status in the vSphere Web Client When Connected to vCenter Server,” on page 111
n “Reset Hardware Sensors When Directly Connected to a Host,” on page 111
n “Reset Health Status Sensors When Connected to vCenter Server,” on page 112
VMware, Inc. 109
n “Reset Health Status Sensors in the vSphere Web Client When Connected to vCenter Server,” onpage 112
n “Troubleshoot the Hardware Health Service,” on page 113
Monitor Health Status When Directly Connected to a HostWhen you connect the vSphere Client directly to a host, you can view the health status from the host’sConfiguration tab.
When you are connected to a host through vCenter Server, you must use the Hardware Status tab to monitorthe host health.
Procedure
1 Log in to the host using the vSphere Client, and display the inventory.
2 Click the Configuration tab, and click Health Status.
If a component is functioning normally, the status indicator is green. The status indicator changes to yellowor red if a system component violates a performance threshold or is not functioning properly. Generally, ayellow indicator signifies degraded performance. A red indicator signifies that a component stopped operatingor exceeded the highest threshold. If the status is blank, then the health monitoring service cannot determinethe status of the component.
The Reading column displays the current values for the sensors. For instance, the column displays rotationsper minute (RPM) for fans and degrees Celsius for temperature.
Monitor Health Status When Connected to vCenter ServerWhen you connect the vSphere Client to vCenter Server, you can view the health status from the HardwareStatus tab.
When you are connected to a host through vCenter Server, you must use the Hardware Status tab to monitorthe host health.
Prerequisites
Ensure that the vCenter Hardware Status plug-in is enabled.
Procedure
1 Log in to a vCenter Server system using the vSphere Client.
2 Select the host in the inventory and click the Hardware Status tab.
vSphere Monitoring and Performance
110 VMware, Inc.
3 From the View drop-down menu, select the type of information to view.
Option Description
Sensors Displays all sensors arranged in a tree view. If the status is blank, the healthmonitoring service cannot determine the status of the component.n Click Show all sensors to expand the tree view to show all sensors under
each group.n Click Show all details to expand the tree view to show descriptive details
for every sensor.n Click Hide all to collapse the tree view to show only the sensor groups.
Alerts and warnings Displays only alerts and warnings.
System event log Displays the system event log.Click Reset event log to clear the event log.CAUTION Resetting the event log clears all log data. Download a supportbundle or export the log data before resetting the log if you need to preserveexisting log information for troubleshooting.
Monitor Health Status in the vSphere Web Client When Connected tovCenter Server
When you connect the vSphere Web Client to vCenter Server, you can view the health status from theMonitor tab.
Prerequisites
Ensure that you have logged in to the vSphere Web Client.
Procedure
1 Select a host in the object navigator.
2 Click the Monitor tab, and click Hardware Status.
3 Select the type of information to view.
Option Description
Sensors Displays all sensors arranged in a tree view. If the status is blank, the healthmonitoring service cannot determine the status of the component.n Click the Expand All icon to expand the tree view to show all sensors
under each group.n Click Collapse All icon to expand the tree view to show descriptive
details for every sensor.
Alerts and warnings Displays alerts and warnings.
System event log Displays the system event log.
Reset Hardware Sensors When Directly Connected to a HostSome host hardware sensors display data that is cumulative over time. You can reset these sensors to clear thedata in them and begin collecting new data.
Prerequisites
If you need to preserve sensor data for troubleshooting or other purposes, take a screenshot, export the data,or download a support bundle before resetting sensors.
Procedure
1 On the host Configuration tab, click Health Status.
Chapter 3 Monitoring Host Health Status
VMware, Inc. 111
2 Click Reset Sensors.
Reset Health Status Sensors When Connected to vCenter ServerSome host hardware sensors display data that is cumulative over time. You can reset these sensors to clear thedata in them and begin collecting new data.
If you need to preserve sensor data for troubleshooting or other purposes, take a screenshot, export the data,or download a support bundle before resetting sensors.
Prerequisites
Ensure that the vCenter Hardware Status plug-in is enabled.
Procedure
1 Log in to a vCenter Server system using the vSphere Client, and display the Hosts and Clusters view inthe inventory.
2 Select the host in the inventory and click the Hardware Status tab.
3 Click Reset sensors.
Reset Health Status Sensors in the vSphere Web Client WhenConnected to vCenter Server
Some host hardware sensors display data that is cumulative over time. You can reset these sensors to clear thedata in them and begin collecting new data.
If you need to preserve sensor data for troubleshooting or other purposes, take a screenshot, export the data,or download a support bundle before resetting sensors.
Prerequisites
Ensure that the vCenter Hardware Status plug-in is enabled.
Procedure
1 Select a host in the object navigator.
2 Click the Monitor tab, and click Hardware Status.
3 Click Reset sensors.
vSphere Monitoring and Performance
112 VMware, Inc.
Troubleshoot the Hardware Health ServiceThe Hardware Health service is a vCenter Server extension that uses an Internet Explorer Web browser controlto display information about host hardware health. Use the information in this topic to troubleshoot problemswith Hardware Health.
Procedure
u Take the appropriate action based on the observed problem.
Problem Action
The Hardware Status tab is notvisible in the vSphere Client.
Select Plug-ins > Plug-in Manager and verify that the Hardware Status plug-in is enabled.
The Hardware Status tab displaysthe following error message: theremote name could not beresolved SERVER_NAME whereSERVER_NAME is the domain nameof the vCenter Server system.
This error appears when the client system is unable to resolve the domainname of the vCenter Server system. Either fix the domain name resolutionproblem, or edit the file C:\ProgramFiles\VMware\Infrastructure\VirtualCenterServer\extensions\cim-ui\extensions.xml on the vCenter Serversystem and replace the vCenter Server domain name with its IP address.
The Hardware Status tab displays asecurity alert.
Your Internet Explorer security settings are set too high. To change thesecurity settings:a Launch Internet Explorer.b Select Tools > Internet Options.c Click the Security tab.d Select the Local intranet Web content zone.e Click Custom Level.f Underneath Allow scripting of Internet Explorer Web browser
control, select Enable.g Click OK to close the Security Settings dialog box, and click OK to close
the Internet Options dialog box.
Chapter 3 Monitoring Host Health Status
VMware, Inc. 113

vSphere Monitoring and Performance
114 VMware, Inc.
Monitoring Storage Resources 4If you use vCenter Server to manage your hosts, you can review information on storage usage and visuallymap relationships between all storage entities that are available in vCenter Server.
In the vSphere Client, for any inventory object except networking, the storage usage data appears in the StorageViews tab. To view this tab, you must have the vCenter Storage Monitoring plug-in, which is generally installedand enabled by default.
In the vSphere Web Client, storage usage data appears in the Monitor tab.
You can display storage information as reports or storage topology maps.
Reports Reports display relationship tables that provide insight about how aninventory object is associated with storage entities. They also offer summarizedstorage usage data for the object’s virtual and physical storage resources. Usethe Reports view to analyze storage space utilization and availability,multipathing status, and other storage properties of the selected object anditems related to it.
If you use arrays that support storage vendor providers developed throughStorage APIs - Storage Awareness, the Reports view offers additionalinformation about storage arrays, storage processors, ports, LUNs or filesystems, and so on. For more information about vendor providers, see thevSphere Storage documentation.
Maps Storage topology maps visually represent relationships between the selectedobject and its associated virtual and physical storage entities. Storage maps arenot available in the vSphere Web Client.
This chapter includes the following topics:
n “Working with Storage Reports,” on page 115
n “Working with Storage Maps,” on page 119
Working with Storage ReportsYou monitor storage information through the Reports view on the vSphere Client Storage Views tab. In thevSphere Web Client, storage reports are available in the Monitor tab.
For the object you select in the Inventory, a list of categories associated with the object is available. You candisplay and review statistics for each category of items on the list depending on the inventory object.
VMware, Inc. 115
For example, if the inventory object is a datastore, you can display information for all virtual machines thatreside on the datastore, all hosts that have access to the datastore, a LUN or LUNs, on which the datastore isdeployed, and so on. In addition, if your storage supports vendor providers developed through the StorageAPIs - Storage Awareness, you can also see information about physical arrays. For information on vendorproviders, see the vSphere Storage documentation.
When you display the reports tables, the default column headings depend on the inventory object you select.You can customize the tables by adding or removing columns. Reports are automatically updated every 120minutes. You can manually update the reports by clicking Update in the vSphere Client, or by clickingRescan in the vSphere Web Client.
You can search for specific information you need to see by filtering reports tables based on storage attributesand keywords.
Display Storage ReportsYou can view storage reports in the vSphere Client.
You can display storage reports to review storage information for any inventory object except networking. Forexample, if the inventory object is a virtual machine, you can review datastores and LUNs that the virtualmachine uses, status of paths to the LUNs, adapters that the host uses to access the LUNs, and so on.
Procedure
1 Start the vSphere Client, and log in to the vCenter Server system.
2 Select the appropriate inventory object.
3 Click Storage Views > Reports.
4 Select View > Filtering to display the Show all [Category of Items] and search fields.
5 Click Show all [Category of Items] and select a category from the list to display information about thatcategory.
6 Move the cursor over the column heading to see the description of each column.
View Storage Reports in the vSphere Web ClientYou can view storage reports in the vSphere Web Client.
You can view storage reports to review storage information for any inventory object except networking. Forexample, if the inventory object is a virtual machine, you can review datastores and LUNs that the virtualmachine uses, the status of paths to the LUNs, the adapters that the host uses to access the LUNs, and so on.
Procedure
1 Start the vSphere Web Client, and log in to the vCenter Server system.
2 Select an appropriate object in the object navigator.
3 Click the Monitor tab, and click Storage Reports.
4 Click Report on category_of_items and select a category from the list to display information about thatcategory.
5 (Optional) Move the cursor over the column heading to see the description of each column.
vSphere Monitoring and Performance
116 VMware, Inc.
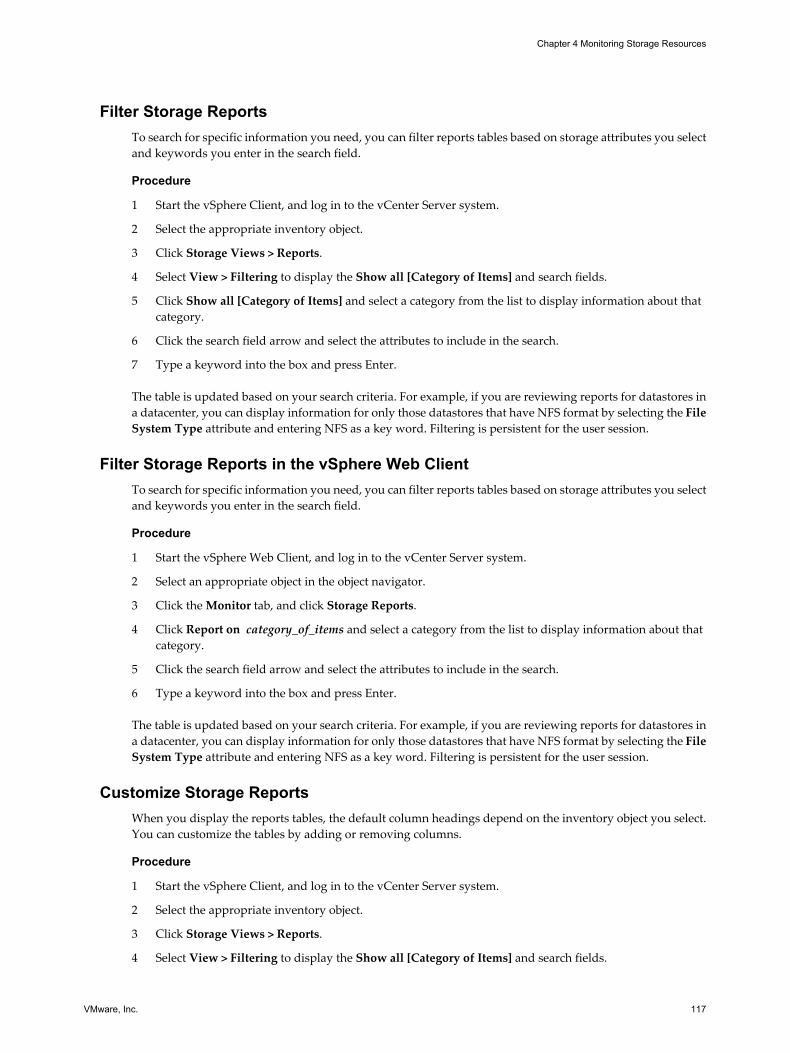
Filter Storage ReportsTo search for specific information you need, you can filter reports tables based on storage attributes you selectand keywords you enter in the search field.
Procedure
1 Start the vSphere Client, and log in to the vCenter Server system.
2 Select the appropriate inventory object.
3 Click Storage Views > Reports.
4 Select View > Filtering to display the Show all [Category of Items] and search fields.
5 Click Show all [Category of Items] and select a category from the list to display information about thatcategory.
6 Click the search field arrow and select the attributes to include in the search.
7 Type a keyword into the box and press Enter.
The table is updated based on your search criteria. For example, if you are reviewing reports for datastores ina datacenter, you can display information for only those datastores that have NFS format by selecting the FileSystem Type attribute and entering NFS as a key word. Filtering is persistent for the user session.
Filter Storage Reports in the vSphere Web ClientTo search for specific information you need, you can filter reports tables based on storage attributes you selectand keywords you enter in the search field.
Procedure
1 Start the vSphere Web Client, and log in to the vCenter Server system.
2 Select an appropriate object in the object navigator.
3 Click the Monitor tab, and click Storage Reports.
4 Click Report on category_of_items and select a category from the list to display information about thatcategory.
5 Click the search field arrow and select the attributes to include in the search.
6 Type a keyword into the box and press Enter.
The table is updated based on your search criteria. For example, if you are reviewing reports for datastores ina datacenter, you can display information for only those datastores that have NFS format by selecting the FileSystem Type attribute and entering NFS as a key word. Filtering is persistent for the user session.
Customize Storage ReportsWhen you display the reports tables, the default column headings depend on the inventory object you select.You can customize the tables by adding or removing columns.
Procedure
1 Start the vSphere Client, and log in to the vCenter Server system.
2 Select the appropriate inventory object.
3 Click Storage Views > Reports.
4 Select View > Filtering to display the Show all [Category of Items] and search fields.
Chapter 4 Monitoring Storage Resources
VMware, Inc. 117
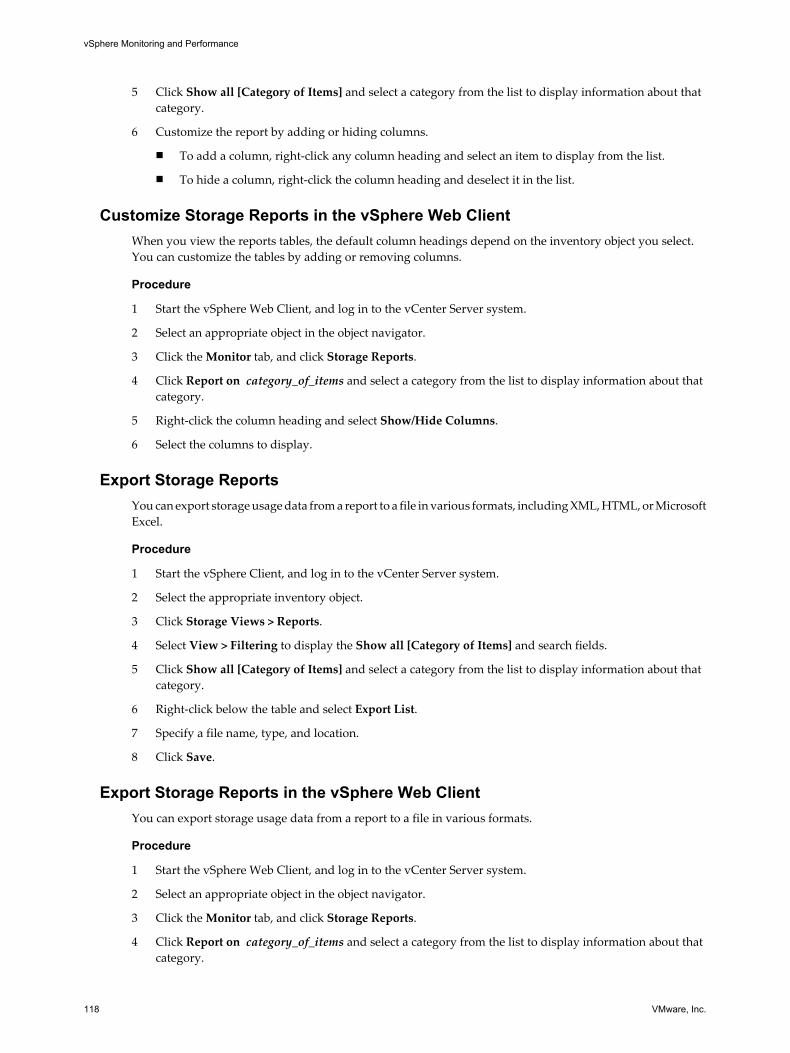
5 Click Show all [Category of Items] and select a category from the list to display information about thatcategory.
6 Customize the report by adding or hiding columns.
n To add a column, right-click any column heading and select an item to display from the list.
n To hide a column, right-click the column heading and deselect it in the list.
Customize Storage Reports in the vSphere Web ClientWhen you view the reports tables, the default column headings depend on the inventory object you select.You can customize the tables by adding or removing columns.
Procedure
1 Start the vSphere Web Client, and log in to the vCenter Server system.
2 Select an appropriate object in the object navigator.
3 Click the Monitor tab, and click Storage Reports.
4 Click Report on category_of_items and select a category from the list to display information about thatcategory.
5 Right-click the column heading and select Show/Hide Columns.
6 Select the columns to display.
Export Storage ReportsYou can export storage usage data from a report to a file in various formats, including XML, HTML, or MicrosoftExcel.
Procedure
1 Start the vSphere Client, and log in to the vCenter Server system.
2 Select the appropriate inventory object.
3 Click Storage Views > Reports.
4 Select View > Filtering to display the Show all [Category of Items] and search fields.
5 Click Show all [Category of Items] and select a category from the list to display information about thatcategory.
6 Right-click below the table and select Export List.
7 Specify a file name, type, and location.
8 Click Save.
Export Storage Reports in the vSphere Web ClientYou can export storage usage data from a report to a file in various formats.
Procedure
1 Start the vSphere Web Client, and log in to the vCenter Server system.
2 Select an appropriate object in the object navigator.
3 Click the Monitor tab, and click Storage Reports.
4 Click Report on category_of_items and select a category from the list to display information about thatcategory.
vSphere Monitoring and Performance
118 VMware, Inc.
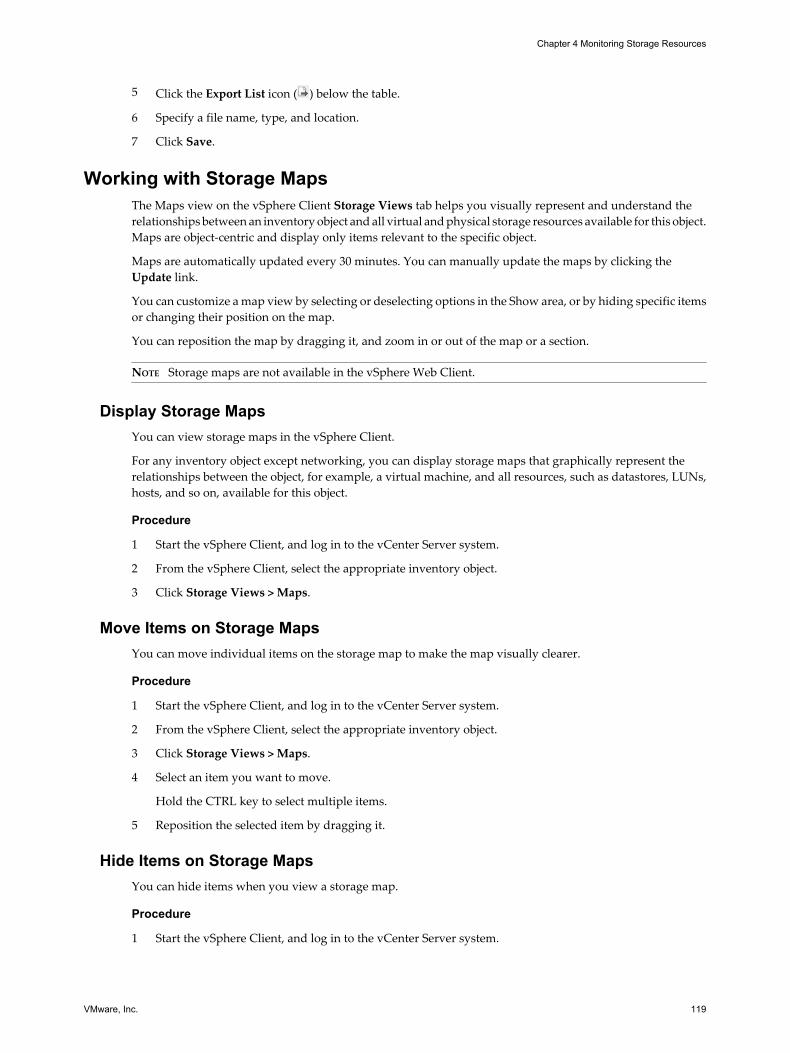
5 Click the Export List icon ( ) below the table.
6 Specify a file name, type, and location.
7 Click Save.
Working with Storage MapsThe Maps view on the vSphere Client Storage Views tab helps you visually represent and understand therelationships between an inventory object and all virtual and physical storage resources available for this object.Maps are object-centric and display only items relevant to the specific object.
Maps are automatically updated every 30 minutes. You can manually update the maps by clicking theUpdate link.
You can customize a map view by selecting or deselecting options in the Show area, or by hiding specific itemsor changing their position on the map.
You can reposition the map by dragging it, and zoom in or out of the map or a section.
NOTE Storage maps are not available in the vSphere Web Client.
Display Storage MapsYou can view storage maps in the vSphere Client.
For any inventory object except networking, you can display storage maps that graphically represent therelationships between the object, for example, a virtual machine, and all resources, such as datastores, LUNs,hosts, and so on, available for this object.
Procedure
1 Start the vSphere Client, and log in to the vCenter Server system.
2 From the vSphere Client, select the appropriate inventory object.
3 Click Storage Views > Maps.
Move Items on Storage MapsYou can move individual items on the storage map to make the map visually clearer.
Procedure
1 Start the vSphere Client, and log in to the vCenter Server system.
2 From the vSphere Client, select the appropriate inventory object.
3 Click Storage Views > Maps.
4 Select an item you want to move.
Hold the CTRL key to select multiple items.
5 Reposition the selected item by dragging it.
Hide Items on Storage MapsYou can hide items when you view a storage map.
Procedure
1 Start the vSphere Client, and log in to the vCenter Server system.
Chapter 4 Monitoring Storage Resources
VMware, Inc. 119
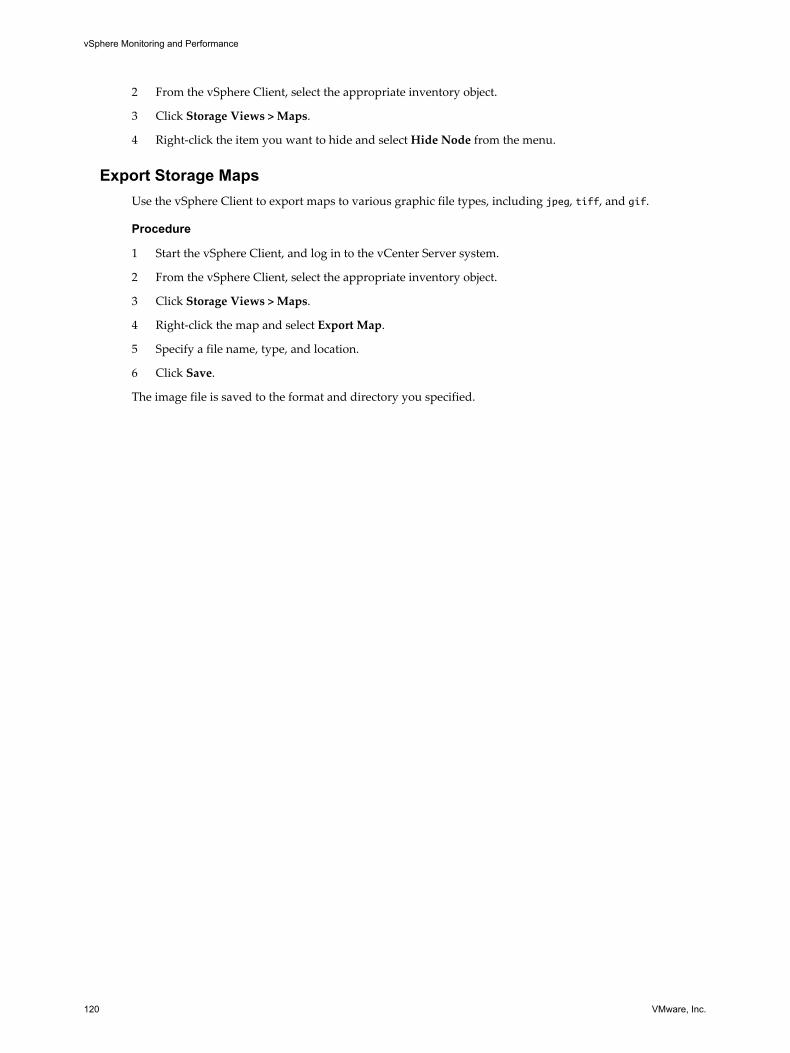
2 From the vSphere Client, select the appropriate inventory object.
3 Click Storage Views > Maps.
4 Right-click the item you want to hide and select Hide Node from the menu.
Export Storage MapsUse the vSphere Client to export maps to various graphic file types, including jpeg, tiff, and gif.
Procedure
1 Start the vSphere Client, and log in to the vCenter Server system.
2 From the vSphere Client, select the appropriate inventory object.
3 Click Storage Views > Maps.
4 Right-click the map and select Export Map.
5 Specify a file name, type, and location.
6 Click Save.
The image file is saved to the format and directory you specified.
vSphere Monitoring and Performance
120 VMware, Inc.
Monitoring Events, Alarms, andAutomated Actions 5
vSphere includes a user-configurable events and alarms subsystem. This subsystem tracks events happeningthroughout vSphere and stores the data in log files and the vCenter Server database. This subsystem alsoenables you to specify the conditions under which alarms are triggered. Alarms can change state from mildwarnings to more serious alerts as system conditions change, and can trigger automated alarm actions. Thisfunctionality is useful when you want to be informed, or take immediate action, when certain events orconditions occur for a specific inventory object, or group of objects.
EventsEvents are records of user actions or system actions that occur on objects in vCenter Server or on a host. Actionsthat might be recordered as events include, but are not limited to, the following examples:
n A license key expires
n A virtual machine is powered on
n A user logs in to a virtual machine
n A host connection is lost
Event data includes details about the event such as who generated it, when it occured, and what type of eventit is. There are three types of events:
n Information
n Warning
n Error
In the vSphere Client, event data is displayed in Tasks and Events tab for the selected inventory object. In thevSphere Web Client, event data is displayed in the Monitor tab. See “View Events,” on page 123 or “ViewEvents in the vSphere Web Client,” on page 123.
AlarmsAlarms are notifications that are activated in response to an event, a set of conditions, or the state of an inventoryobject. An alarm definition consists of the following elements:
n Name and description - Provides an identifying label and description.
n Alarm type - Defines the type of object that will be monitored.
n Triggers - Defines the event, condition, or state that will trigger the alarm and defines the notificationseverity.
n Tolerance thresholds (Reporting) - Provides additional restrictions on condition and state triggersthresholds that must be exceeded before the alarm is triggered.
VMware, Inc. 121
n Actions - Defines operations that occur in response to triggered alarms. VMware provides sets ofpredefined actions that are specific to inventory object types.
Alarms have the following severity levels:
n Normal – green
n Warning – yellow
n Alert – red
Alarm definitions are associated with the object selected in the inventory. An alarm monitors the type ofinventory objects specified in its definition.
For example, you might want to monitor the CPU usage of all virtual machines in a specific host cluster. Youcan select the cluster in the inventory, and add a virtual machine alarm to it. When enabled, that alarm willmonitor all virtual machines running in the cluster and will trigger when any one of them meets the criteriadefined in the alarm. If you want to monitor a specific virtual machine in the cluster, but not others, you wouldselect that virtual machine in the inventory and add an alarm to it. One easy way to apply the same alarms toa group of objects is to place those objects in a folder and define the alarm on the folder.
NOTE You can enable, disable, and modify alarms only from the object in which the alarm is defined. Forexample, if you defined an alarm in a cluster to monitor virtual machines, you can only enable, disable, ormodify that alarm through the cluster; you can not make changes to the alarm at the individual virtual machinelevel.
Alarm ActionsAlarm actions are operations that occur in response to the trigger. For example, you can have an emailnotification sent to one or more administrators when an alarm is triggered.
NOTE Default alarms are not preconfigured with actions. You must manually set what action occurs when thetriggering event, condition, or state occurs.
This chapter includes the following topics:
n “View Events,” on page 123
n “View Events in the vSphere Web Client,” on page 123
n “View System Logs,” on page 123
n “View System Logs in the vSphere Web Client,” on page 124
n “Export Events Data,” on page 124
n “Export Events Data in the vSphere Web Client,” on page 124
n “View Triggered Alarms and Alarm Definitions,” on page 125
n “View Triggered Alarms and Alarm Definitions in the vSphere Web Client,” on page 125
n “Set An Alarm,” on page 126
n “Set an Alarm in the vSphere Web Client,” on page 135
n “Acknowledge Triggered Alarms,” on page 143
n “Acknowledge Triggered Alarms in the vSphere Web Client,” on page 144
n “Reset Triggered Event Alarms,” on page 144
n “Reset Triggered Event Alarms in the vSphere Web Client,” on page 145
n “Identify Disabled Alarm Actions,” on page 145
vSphere Monitoring and Performance
122 VMware, Inc.
View EventsYou can either view all vSphere events or view events associated with a single object. The events list for aselected inventory object includes events associated with child objects.
Prerequisites
Ensure that you have connected to a vCenter Server system by using the vSphere Client.
Required privilege: Read-only
Procedure
n To see a list of all events in the system, select Home > Management > Events.
n To see a list of events associated with a selected inventory object and its child objects, select the Tasks &Events tab and click Events.
a Select an event to see event details.
b Use the filter controls above the list to filter the list.
c Click a column heading to sort the list.
View Events in the vSphere Web ClientYou can view events associated with a single object or view all vSphere events. The events list for a selectedinventory object includes events associated with child objects.
Prerequisites
Ensure that you have logged in to the vSphere Web Client.
Procedure
1 Select an inventory object.
2 Click the Monitor tab, and click Events.
3 Select an event to see details.
4 Use the filter controls above the list to filter the list.
5 (Optional) Click a column heading to sort the list.
View System LogsvSphere records events in the vCenter Server database. System log entries include such information as whogenerated the event, when the event was created, and the type of event.
Prerequisites
Ensure that you have connected to a vCenter Server system by using the vSphere Client.
Required privilege:Global. Diagnostics privilege.
Procedure
1 To view system log entries, select Home > Administration > System Logs.
2 From the drop-down menu, select the log.
3 (Optional) Click Show All or Show next#lines to see additional log entries.
Chapter 5 Monitoring Events, Alarms, and Automated Actions
VMware, Inc. 123
4 (Optional) Filter the log entries.
a Select View > Filtering.
b Type the filter criteria in the filter box.
View System Logs in the vSphere Web ClientvSphere records events in the vCenter Server database. System log entries include such information as whogenerated the event, when the event was created, and the type of event.
Prerequisites
Ensure that you have logged in to the vSphere Web Client.
Required privilege:Global. Diagnostics privilege.
Procedure
1 Select a vCenter Server instance in the object navigator.
2 Click Monitor, and click System Logs.
3 From the drop-down menu, select the log.
4 (Optional) Click Show All Lines or Show Next 2000 Lines to see additional log entries.
Export Events DataYou can export all or part of the events data stored in the vCenter Server database.
Prerequisites
Ensure that you have connected to a vCenter Server system by using the vSphere Client.
Required Privilege: Read-only
Procedure
1 Select File > Export > Export Events.
2 (Linked-mode only) In the vCenter Server list, select the server where the events occurred.
3 Specify Events, Time, and Limits attributes for the events you want to export.
4 Specify a file name and location.
5 Click OK.
vCenter Server creates the file in the specified location. The file contains the Type, Time, and Description ofthe events.
Export Events Data in the vSphere Web ClientYou can export all or part of the events data stored in the vCenter Server database.
Prerequisites
Ensure that you have logged in to the vSphere Web Client.
Required Privilege: Read-only
Procedure
1 Select an inventory object.
vSphere Monitoring and Performance
124 VMware, Inc.
2 Click the Monitor tab, and click Events.
3 Click the Export icon ( ).
4 In the Export Events window, specify what types of event information you want to export.
5 Click Generate CSV Report, and click Save.
6 Specify a file name and location and save the file.
View Triggered Alarms and Alarm DefinitionsTriggered alarms are visible in several locations throughout the vSphere Client and vSphere Web Client.
Prerequisites
Ensure that you have connected to a vCenter Server system by using the vSphere Client.
Procedure
n To view all triggered alarms, click Alarms in the status bar.
n To view alarms triggered on an selected inventory object, select the Alarms tab > Triggered Alarms.
n To view a list of alarms associated with a selected inventory object, select the Alarms tab > Definitions.The Defined In column indicates the object on which the alarm was set.
View Triggered Alarms and Alarm Definitions in the vSphere Web ClientTriggered alarms are visible in several locations throughout the vSphere Web Client.
Prerequisites
Ensure that you have logged in to the vSphere Web Client.
Procedure
n To view all triggered alarms, click All in the Alarms sidebar panel.
NOTE The list of alarms in the sidebar refreshes every 120 seconds. For information about changing thedefault refresh period, see the VMware knowledge base article at http://kb.vmware.com/kb/2020290.
n To view only newly triggered alarms, click New in the Alarms sidebar panel.
The sidebar panel displays the latest 30 most critical alarms.
n To view acknowledged alarms, click Acknowledged in the Alarms sidebar panel.
n To view alarms triggered on a selected inventory object, click the Monitor tab, click Issues, and clickTriggered Alarms.
n To view a list of available alarm definitions for a selected inventory object, click the Manage tab, and clickAlarm Definitions.
Chapter 5 Monitoring Events, Alarms, and Automated Actions
VMware, Inc. 125
Set An AlarmYou can monitor inventory objects by setting alarms on them. Setting an alarm involves selecting the type ofinventory object to monitor, defining when and for how long the alarm will trigger, and defining actions thatwill be performed as a result of the alarm being triggered. You define alarms in the Alarm Settings dialog box.
Prerequisites
Ensure that you have connected to a vCenter Server system by using the vSphere Client.
Required Privilege: Alarms.Create Alarm or Alarm.Modify Alarm
n View and Edit Alarm Settings on page 127You create and modify alarms in the Alarm Settings dialog box. You can view alarm settings from anyobject, but you can modify settings only through the object on which the alarm is defined.
n Specify Alarm Name, Description, and Type on page 127General settings include alarm Name, Description, and Type. You can also enable and disable the alarmin the General settings tab. Specifying the alarm type includes selecting the type of inventory object andthe type of activity (events, or conditions and states) that you want to monitor. The options in the Triggerstab change depending on the type of activity you choose to monitor.
n Specify How a Condition-Based or State-Based Alarm is Triggered in the vSphere Web Client onpage 128You can select and configure the events, states, or conditions that trigger the alarm on the Triggers pageof the alarm definition wizard. The options that you choose on the General page of the alarm definitionwizard determine the options available on the Triggers page. An alarm definition must contain at leastone trigger before you can save it.
n Specify How the Alarm is Triggered (Event-based) on page 128You can specify the events, states, or conditions that trigger the alarm in the Triggers tab of the AlarmSettings dialog box. The options you choose under the General tab of the Alarm Settings dialog boxdetermine the options available under the Triggers tab. An alarm definition must contain at least onetrigger before it can be saved.
n Specify Alarm Tolerance and Frequency on page 129You can use reporting to apply a tolerance range for the alarm triggers. This can help you distinguishtemporary problems from more serious, chronic ones. The Reporting settings allow you to specify theamount a condition or state must exceed the trigger value before the alarm triggers.
n Specify Which Actions to Perform When Triggered on page 129You can specify actions that the system performs when the alarm is triggered or changes status. You canenable and disable alarms and alarm actions independently of each other.
n Enable and Disable Alarm Actions on page 135You can disable alarm actions on any inventory object. Disabling alarm actions is not the same asdisabling an alarm, nor is it the same as acknowledging an alarm. When alarm actions are disabled, thealarm can still be triggered but its associated actions will not be performed. You might want to disablealarm actions when, for example, you plan on putting a host into maintenance mode. When you disablealarm actions on a selected inventory object, all actions for all alarms are disabled on that object. Youcannot disable a subset of alarm actions. Alarm actions will continue on the child objects.
vSphere Monitoring and Performance
126 VMware, Inc.
View and Edit Alarm SettingsYou create and modify alarms in the Alarm Settings dialog box. You can view alarm settings from any object,but you can modify settings only through the object on which the alarm is defined.
Prerequisites
Ensure that you have connected to a vCenter Server system by using the vSphere Client.
Required Privilege: Alarms.Create Alarm or Alarm.Modify Alarm
Procedure
u To view or change alarm settings, open the Alarm Settings dialog box:
Option Description
Create New Alarm Select an inventory object and selectFile > New > Alarm.
Add Alarm to Object Right-click an inventory object and select Alarm > Add Alarm.
View Alarm Definitions Select the Alarms tab, click the Definitions subtab of the inventory item withthe alarm you want, and double-click an alarm in the list.
Specify Alarm Name, Description, and TypeGeneral settings include alarm Name, Description, and Type. You can also enable and disable the alarm in theGeneral settings tab. Specifying the alarm type includes selecting the type of inventory object and the type ofactivity (events, or conditions and states) that you want to monitor. The options in the Triggers tab changedepending on the type of activity you choose to monitor.
Prerequisites
Open the General tab of the Alarm Settings dialog box. See “View and Edit Alarm Settings,” on page 127.
Required Privilege: Alarms.Create Alarm or Alarm.Modify Alarm
Procedure
1 Enter a name and description.
2 Select the type of inventory object this alarm will monitor.
3 Select the type of activity this alarm will monitor.
The options in the Triggers tab change depending on the type of activity you select.
4 Click OK to save your changes and exit the dialog box or select a different tab to make further changes tothe alarm.
What to do next
Specify alarm triggers. See “Specify How a Condition-Based or State-Based Alarm is Triggered in the vSphereWeb Client,” on page 128 or “Specify How the Alarm is Triggered (Event-based),” on page 128.
NOTE You cannot save an alarm without triggers defined for it.
Chapter 5 Monitoring Events, Alarms, and Automated Actions
VMware, Inc. 127
Specify How a Condition-Based or State-Based Alarm is Triggered in the vSphereWeb Client
You can select and configure the events, states, or conditions that trigger the alarm on the Triggers page of thealarm definition wizard. The options that you choose on the General page of the alarm definition wizarddetermine the options available on the Triggers page. An alarm definition must contain at least one triggerbefore you can save it.
You can add multiple triggers and choose whether to trigger the alarm when one or all of them become active.
For information about defining triggers for an event-based alarm, see “Specify How an Event-Based Alarm isTriggered in the vSphere Web Client,” on page 137.
Prerequisites
Verify that you have navigated to the Triggers page of the alarm definition wizard. See “View and Edit AlarmSettings in the vSphere Web Client,” on page 136.
Required Privilege: Alarms.Create Alarm or Alarm.Modify Alarm
Procedure
1 Select the trigger that you want to change, or click the Add icon to add a new trigger.
2 Click in the Trigger column, and select an option from the drop-down menu.
3 Click in the Operator column, and select an option from the drop-down menu.
4 Click in the Warning Condition column, and select an option from the drop-down menu to set thethreshold for triggering a warning.
5 Click in the Critical Condition column, and select an option from the drop-down menu.
6 Click Next.
You selected and configured alarm triggers.
What to do next
Configure alarm actions.
Specify How the Alarm is Triggered (Event-based)You can specify the events, states, or conditions that trigger the alarm in the Triggers tab of the Alarm Settingsdialog box. The options you choose under the General tab of the Alarm Settings dialog box determine theoptions available under the Triggers tab. An alarm definition must contain at least one trigger before it can besaved.
Prerequisites
Open the Triggers tab of the Alarm Settings dialog box. See “View and Edit Alarm Settings,” on page 127.
Required Privilege: Alarms.Create Alarm or Alarm.Modify Alarm
Procedure
1 Select the trigger you want to change or click Add to add a new trigger.
2 Click in the Event column and select an option from the drop-down menu.
3 Click in the Status column and select an option from the drop-down menu.
vSphere Monitoring and Performance
128 VMware, Inc.
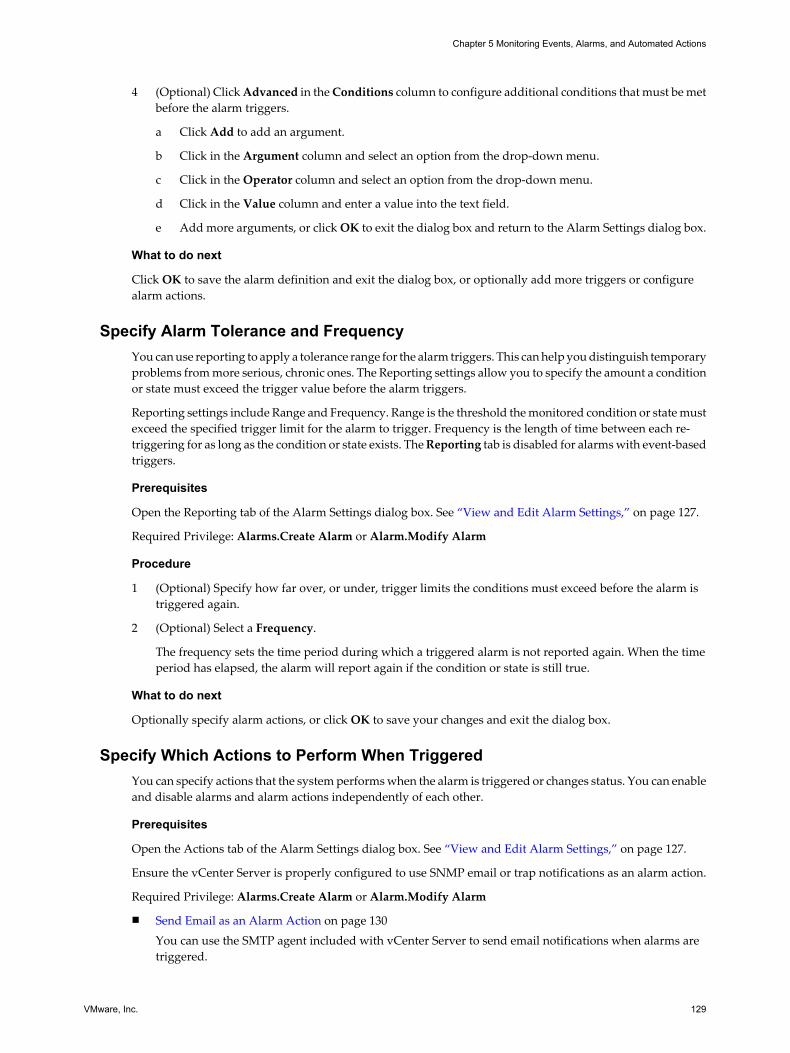
4 (Optional) Click Advanced in the Conditions column to configure additional conditions that must be metbefore the alarm triggers.
a Click Add to add an argument.
b Click in the Argument column and select an option from the drop-down menu.
c Click in the Operator column and select an option from the drop-down menu.
d Click in the Value column and enter a value into the text field.
e Add more arguments, or click OK to exit the dialog box and return to the Alarm Settings dialog box.
What to do next
Click OK to save the alarm definition and exit the dialog box, or optionally add more triggers or configurealarm actions.
Specify Alarm Tolerance and FrequencyYou can use reporting to apply a tolerance range for the alarm triggers. This can help you distinguish temporaryproblems from more serious, chronic ones. The Reporting settings allow you to specify the amount a conditionor state must exceed the trigger value before the alarm triggers.
Reporting settings include Range and Frequency. Range is the threshold the monitored condition or state mustexceed the specified trigger limit for the alarm to trigger. Frequency is the length of time between each re-triggering for as long as the condition or state exists. The Reporting tab is disabled for alarms with event-basedtriggers.
Prerequisites
Open the Reporting tab of the Alarm Settings dialog box. See “View and Edit Alarm Settings,” on page 127.
Required Privilege: Alarms.Create Alarm or Alarm.Modify Alarm
Procedure
1 (Optional) Specify how far over, or under, trigger limits the conditions must exceed before the alarm istriggered again.
2 (Optional) Select a Frequency.
The frequency sets the time period during which a triggered alarm is not reported again. When the timeperiod has elapsed, the alarm will report again if the condition or state is still true.
What to do next
Optionally specify alarm actions, or click OK to save your changes and exit the dialog box.
Specify Which Actions to Perform When TriggeredYou can specify actions that the system performs when the alarm is triggered or changes status. You can enableand disable alarms and alarm actions independently of each other.
Prerequisites
Open the Actions tab of the Alarm Settings dialog box. See “View and Edit Alarm Settings,” on page 127.
Ensure the vCenter Server is properly configured to use SNMP email or trap notifications as an alarm action.
Required Privilege: Alarms.Create Alarm or Alarm.Modify Alarm
n Send Email as an Alarm Action on page 130You can use the SMTP agent included with vCenter Server to send email notifications when alarms aretriggered.
Chapter 5 Monitoring Events, Alarms, and Automated Actions
VMware, Inc. 129
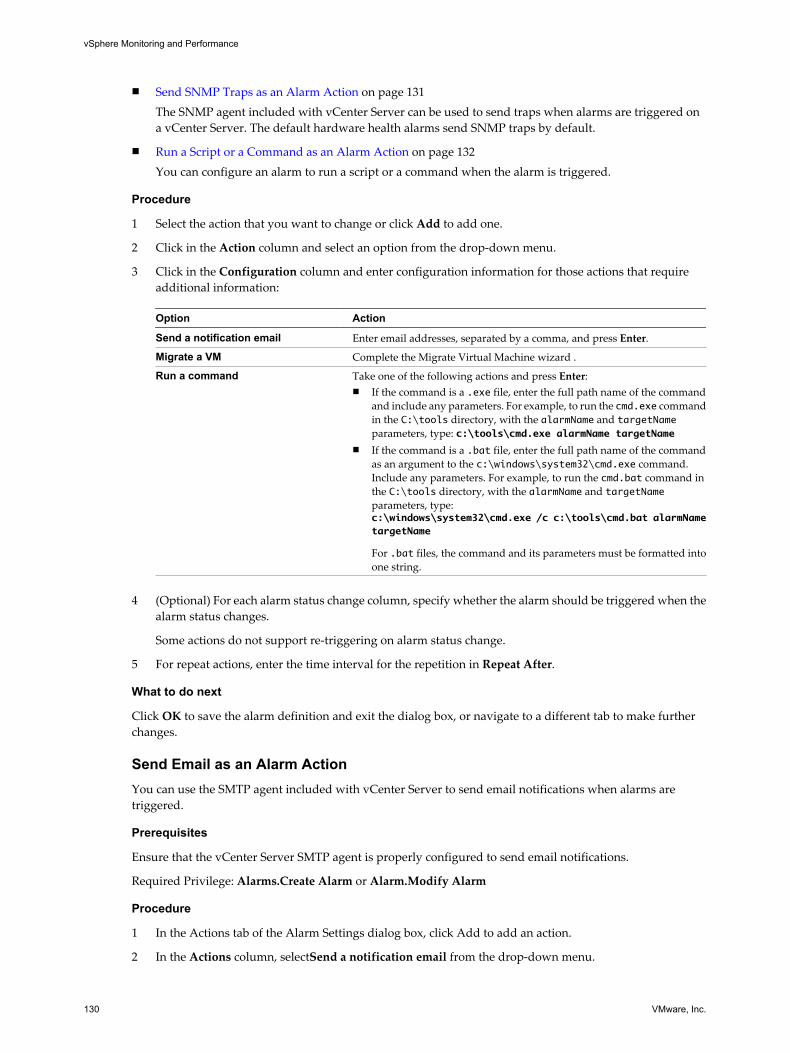
n Send SNMP Traps as an Alarm Action on page 131The SNMP agent included with vCenter Server can be used to send traps when alarms are triggered ona vCenter Server. The default hardware health alarms send SNMP traps by default.
n Run a Script or a Command as an Alarm Action on page 132You can configure an alarm to run a script or a command when the alarm is triggered.
Procedure
1 Select the action that you want to change or click Add to add one.
2 Click in the Action column and select an option from the drop-down menu.
3 Click in the Configuration column and enter configuration information for those actions that requireadditional information:
Option Action
Send a notification email Enter email addresses, separated by a comma, and press Enter.
Migrate a VM Complete the Migrate Virtual Machine wizard .
Run a command Take one of the following actions and press Enter:n If the command is a .exe file, enter the full path name of the command
and include any parameters. For example, to run the cmd.exe commandin the C:\tools directory, with the alarmName and targetNameparameters, type: c:\tools\cmd.exe alarmName targetName
n If the command is a .bat file, enter the full path name of the commandas an argument to the c:\windows\system32\cmd.exe command.Include any parameters. For example, to run the cmd.bat command inthe C:\tools directory, with the alarmName and targetNameparameters, type:c:\windows\system32\cmd.exe /c c:\tools\cmd.bat alarmNametargetName
For .bat files, the command and its parameters must be formatted intoone string.
4 (Optional) For each alarm status change column, specify whether the alarm should be triggered when the
alarm status changes.
Some actions do not support re-triggering on alarm status change.
5 For repeat actions, enter the time interval for the repetition in Repeat After.
What to do next
Click OK to save the alarm definition and exit the dialog box, or navigate to a different tab to make furtherchanges.
Send Email as an Alarm ActionYou can use the SMTP agent included with vCenter Server to send email notifications when alarms aretriggered.
Prerequisites
Ensure that the vCenter Server SMTP agent is properly configured to send email notifications.
Required Privilege: Alarms.Create Alarm or Alarm.Modify Alarm
Procedure
1 In the Actions tab of the Alarm Settings dialog box, click Add to add an action.
2 In the Actions column, selectSend a notification email from the drop-down menu.
vSphere Monitoring and Performance
130 VMware, Inc.
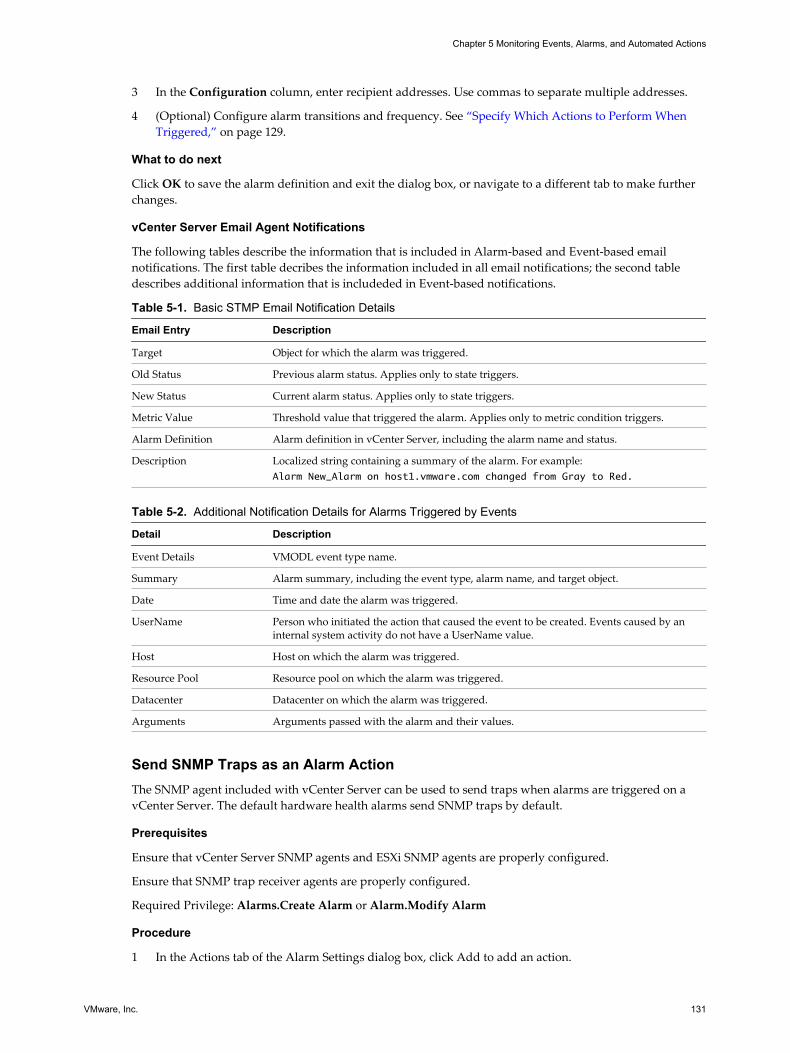
3 In the Configuration column, enter recipient addresses. Use commas to separate multiple addresses.
4 (Optional) Configure alarm transitions and frequency. See “Specify Which Actions to Perform WhenTriggered,” on page 129.
What to do next
Click OK to save the alarm definition and exit the dialog box, or navigate to a different tab to make furtherchanges.
vCenter Server Email Agent Notifications
The following tables describe the information that is included in Alarm-based and Event-based emailnotifications. The first table decribes the information included in all email notifications; the second tabledescribes additional information that is includeded in Event-based notifications.
Table 5-1. Basic STMP Email Notification Details
Email Entry Description
Target Object for which the alarm was triggered.
Old Status Previous alarm status. Applies only to state triggers.
New Status Current alarm status. Applies only to state triggers.
Metric Value Threshold value that triggered the alarm. Applies only to metric condition triggers.
Alarm Definition Alarm definition in vCenter Server, including the alarm name and status.
Description Localized string containing a summary of the alarm. For example:Alarm New_Alarm on host1.vmware.com changed from Gray to Red.
Table 5-2. Additional Notification Details for Alarms Triggered by Events
Detail Description
Event Details VMODL event type name.
Summary Alarm summary, including the event type, alarm name, and target object.
Date Time and date the alarm was triggered.
UserName Person who initiated the action that caused the event to be created. Events caused by aninternal system activity do not have a UserName value.
Host Host on which the alarm was triggered.
Resource Pool Resource pool on which the alarm was triggered.
Datacenter Datacenter on which the alarm was triggered.
Arguments Arguments passed with the alarm and their values.
Send SNMP Traps as an Alarm ActionThe SNMP agent included with vCenter Server can be used to send traps when alarms are triggered on avCenter Server. The default hardware health alarms send SNMP traps by default.
Prerequisites
Ensure that vCenter Server SNMP agents and ESXi SNMP agents are properly configured.
Ensure that SNMP trap receiver agents are properly configured.
Required Privilege: Alarms.Create Alarm or Alarm.Modify Alarm
Procedure
1 In the Actions tab of the Alarm Settings dialog box, click Add to add an action.
Chapter 5 Monitoring Events, Alarms, and Automated Actions
VMware, Inc. 131
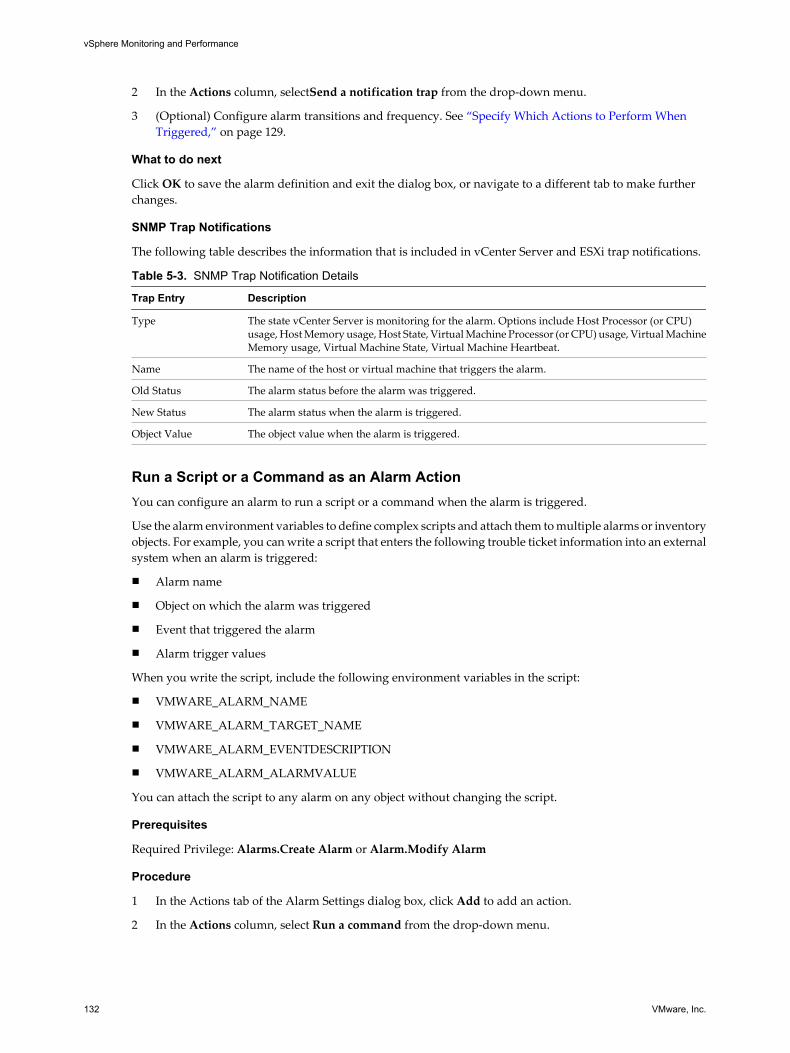
2 In the Actions column, selectSend a notification trap from the drop-down menu.
3 (Optional) Configure alarm transitions and frequency. See “Specify Which Actions to Perform WhenTriggered,” on page 129.
What to do next
Click OK to save the alarm definition and exit the dialog box, or navigate to a different tab to make furtherchanges.
SNMP Trap Notifications
The following table describes the information that is included in vCenter Server and ESXi trap notifications.
Table 5-3. SNMP Trap Notification Details
Trap Entry Description
Type The state vCenter Server is monitoring for the alarm. Options include Host Processor (or CPU)usage, Host Memory usage, Host State, Virtual Machine Processor (or CPU) usage, Virtual MachineMemory usage, Virtual Machine State, Virtual Machine Heartbeat.
Name The name of the host or virtual machine that triggers the alarm.
Old Status The alarm status before the alarm was triggered.
New Status The alarm status when the alarm is triggered.
Object Value The object value when the alarm is triggered.
Run a Script or a Command as an Alarm ActionYou can configure an alarm to run a script or a command when the alarm is triggered.
Use the alarm environment variables to define complex scripts and attach them to multiple alarms or inventoryobjects. For example, you can write a script that enters the following trouble ticket information into an externalsystem when an alarm is triggered:
n Alarm name
n Object on which the alarm was triggered
n Event that triggered the alarm
n Alarm trigger values
When you write the script, include the following environment variables in the script:
n VMWARE_ALARM_NAME
n VMWARE_ALARM_TARGET_NAME
n VMWARE_ALARM_EVENTDESCRIPTION
n VMWARE_ALARM_ALARMVALUE
You can attach the script to any alarm on any object without changing the script.
Prerequisites
Required Privilege: Alarms.Create Alarm or Alarm.Modify Alarm
Procedure
1 In the Actions tab of the Alarm Settings dialog box, click Add to add an action.
2 In the Actions column, select Run a command from the drop-down menu.
vSphere Monitoring and Performance
132 VMware, Inc.
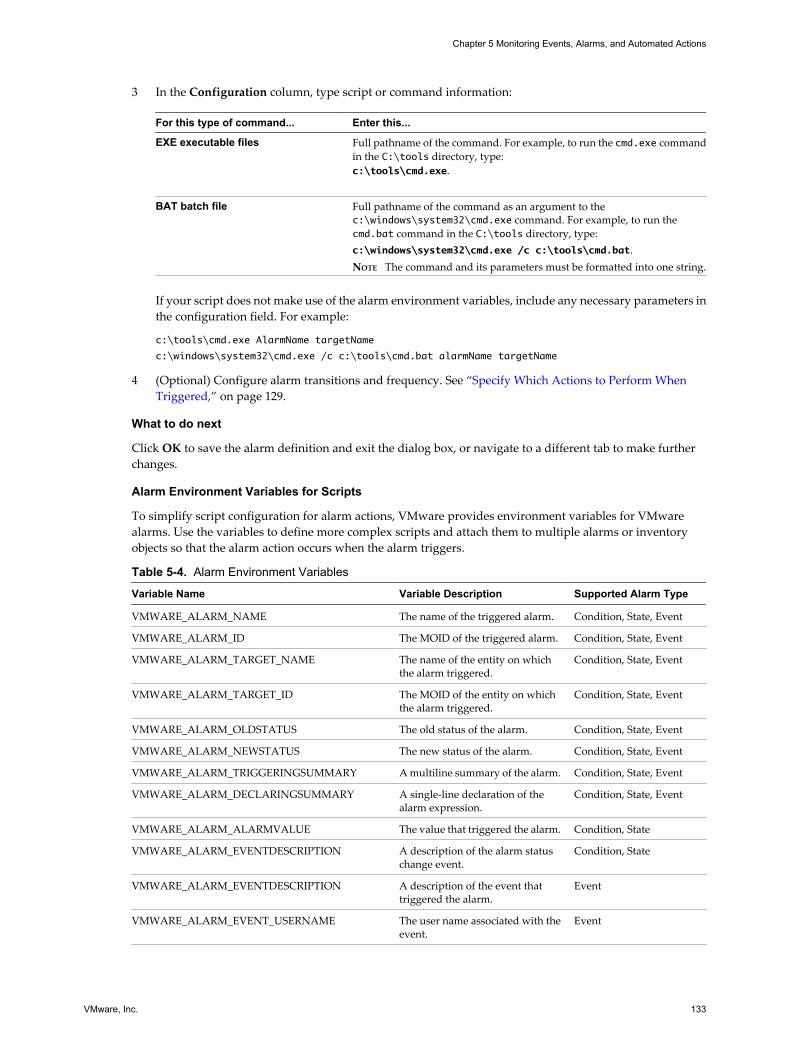
3 In the Configuration column, type script or command information:
For this type of command... Enter this...
EXE executable files Full pathname of the command. For example, to run the cmd.exe commandin the C:\tools directory, type:c:\tools\cmd.exe.
BAT batch file Full pathname of the command as an argument to thec:\windows\system32\cmd.exe command. For example, to run thecmd.bat command in the C:\tools directory, type:c:\windows\system32\cmd.exe /c c:\tools\cmd.bat.NOTE The command and its parameters must be formatted into one string.
If your script does not make use of the alarm environment variables, include any necessary parameters inthe configuration field. For example:
c:\tools\cmd.exe AlarmName targetName
c:\windows\system32\cmd.exe /c c:\tools\cmd.bat alarmName targetName
4 (Optional) Configure alarm transitions and frequency. See “Specify Which Actions to Perform WhenTriggered,” on page 129.
What to do next
Click OK to save the alarm definition and exit the dialog box, or navigate to a different tab to make furtherchanges.
Alarm Environment Variables for Scripts
To simplify script configuration for alarm actions, VMware provides environment variables for VMwarealarms. Use the variables to define more complex scripts and attach them to multiple alarms or inventoryobjects so that the alarm action occurs when the alarm triggers.
Table 5-4. Alarm Environment Variables
Variable Name Variable Description Supported Alarm Type
VMWARE_ALARM_NAME The name of the triggered alarm. Condition, State, Event
VMWARE_ALARM_ID The MOID of the triggered alarm. Condition, State, Event
VMWARE_ALARM_TARGET_NAME The name of the entity on whichthe alarm triggered.
Condition, State, Event
VMWARE_ALARM_TARGET_ID The MOID of the entity on whichthe alarm triggered.
Condition, State, Event
VMWARE_ALARM_OLDSTATUS The old status of the alarm. Condition, State, Event
VMWARE_ALARM_NEWSTATUS The new status of the alarm. Condition, State, Event
VMWARE_ALARM_TRIGGERINGSUMMARY A multiline summary of the alarm. Condition, State, Event
VMWARE_ALARM_DECLARINGSUMMARY A single-line declaration of thealarm expression.
Condition, State, Event
VMWARE_ALARM_ALARMVALUE The value that triggered the alarm. Condition, State
VMWARE_ALARM_EVENTDESCRIPTION A description of the alarm statuschange event.
Condition, State
VMWARE_ALARM_EVENTDESCRIPTION A description of the event thattriggered the alarm.
Event
VMWARE_ALARM_EVENT_USERNAME The user name associated with theevent.
Event
Chapter 5 Monitoring Events, Alarms, and Automated Actions
VMware, Inc. 133
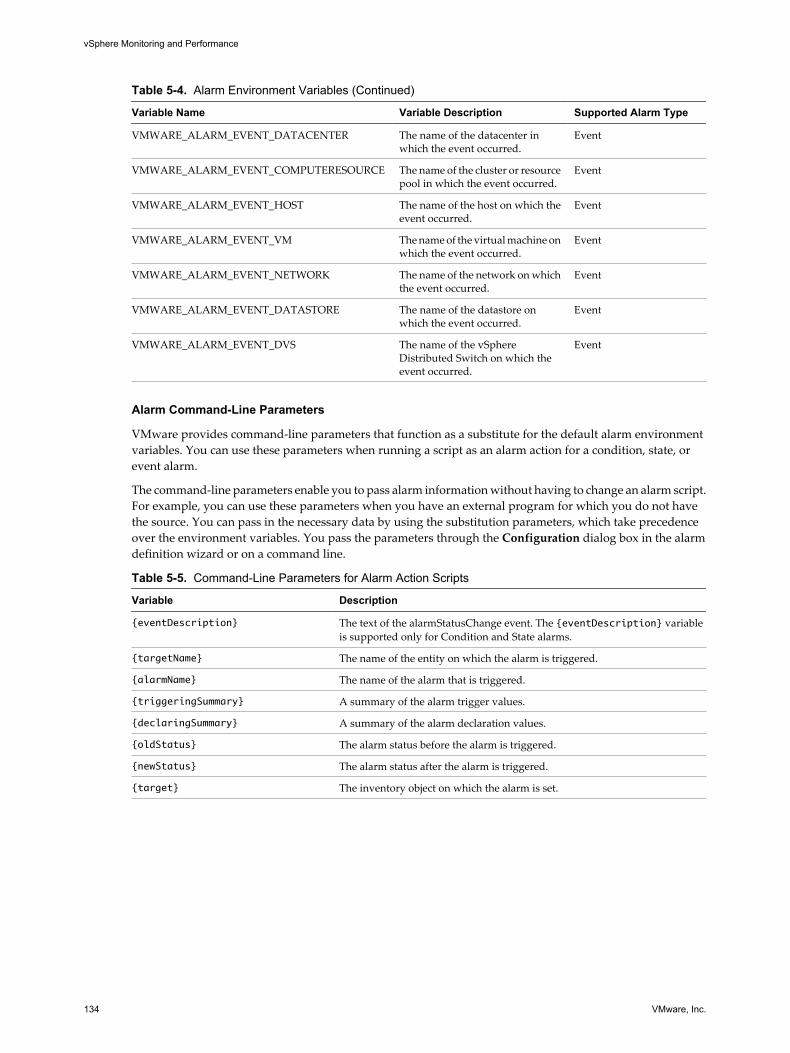
Table 5-4. Alarm Environment Variables (Continued)
Variable Name Variable Description Supported Alarm Type
VMWARE_ALARM_EVENT_DATACENTER The name of the datacenter inwhich the event occurred.
Event
VMWARE_ALARM_EVENT_COMPUTERESOURCE The name of the cluster or resourcepool in which the event occurred.
Event
VMWARE_ALARM_EVENT_HOST The name of the host on which theevent occurred.
Event
VMWARE_ALARM_EVENT_VM The name of the virtual machine onwhich the event occurred.
Event
VMWARE_ALARM_EVENT_NETWORK The name of the network on whichthe event occurred.
Event
VMWARE_ALARM_EVENT_DATASTORE The name of the datastore onwhich the event occurred.
Event
VMWARE_ALARM_EVENT_DVS The name of the vSphereDistributed Switch on which theevent occurred.
Event
Alarm Command-Line Parameters
VMware provides command-line parameters that function as a substitute for the default alarm environmentvariables. You can use these parameters when running a script as an alarm action for a condition, state, orevent alarm.
The command-line parameters enable you to pass alarm information without having to change an alarm script.For example, you can use these parameters when you have an external program for which you do not havethe source. You can pass in the necessary data by using the substitution parameters, which take precedenceover the environment variables. You pass the parameters through the Configuration dialog box in the alarmdefinition wizard or on a command line.
Table 5-5. Command-Line Parameters for Alarm Action Scripts
Variable Description
{eventDescription} The text of the alarmStatusChange event. The {eventDescription} variableis supported only for Condition and State alarms.
{targetName} The name of the entity on which the alarm is triggered.
{alarmName} The name of the alarm that is triggered.
{triggeringSummary} A summary of the alarm trigger values.
{declaringSummary} A summary of the alarm declaration values.
{oldStatus} The alarm status before the alarm is triggered.
{newStatus} The alarm status after the alarm is triggered.
{target} The inventory object on which the alarm is set.
vSphere Monitoring and Performance
134 VMware, Inc.
Enable and Disable Alarm ActionsYou can disable alarm actions on any inventory object. Disabling alarm actions is not the same as disabling analarm, nor is it the same as acknowledging an alarm. When alarm actions are disabled, the alarm can still betriggered but its associated actions will not be performed. You might want to disable alarm actions when, forexample, you plan on putting a host into maintenance mode. When you disable alarm actions on a selectedinventory object, all actions for all alarms are disabled on that object. You cannot disable a subset of alarmactions. Alarm actions will continue on the child objects.
Prerequisites
You must have a vSphere Web Client or a vSphere Client connected to a vCenter Server system.
Required privilege: Alarm.Disable Alarm Action
Procedure
n To disable alarm actions, right-click on the inventory object and select Alarm > Disable Alarm Actions.
n To enable alarm actions, right click on the inventory object and select Alarm > Enable Alarm Actions.
Set an Alarm in the vSphere Web ClientYou can monitor inventory objects by setting alarms on them. Setting an alarm involves selecting the type ofinventory object to monitor, defining when and for how long the alarm will trigger, and defining actions thatwill be performed as a result of the alarm being triggered. You define alarms in the alarm definition wizardunder the Manage tab.
Prerequisites
Ensure that you have logged in to the vSphere Web Client.
Required Privilege: Alarms.Create Alarm or Alarm.Modify Alarm
n View and Edit Alarm Settings in the vSphere Web Client on page 136To monitor your environment, you can create and modify alarm definitions in the vSphere Web Client.You can view alarm settings from any object, but you can modify settings only through the object onwhich the alarm is defined.
n Specify Alarm Name, Description, and Type in the vSphere Web Client on page 136General settings of an alarm definition include alarm name, description, and type. You can also enableand disable the alarm from the general settings page. When you select the alarm type, you also select thetype of inventory object and the type of activity (events, or conditions and states) that you want tomonitor. The options on the Triggers page change depending on the type of activity that you choose tomonitor.
n Specify How an Event-Based Alarm is Triggered in the vSphere Web Client on page 137You can specify the events, states, or conditions that trigger the alarm on the Triggers page of the alarmdefinition wizard. The alarm type options that you selected determine the options available on theTriggers page. An alarm definition must contain at least one trigger before you can save it.
n Specify How a Condition-Based or State-Based Alarm is Triggered in the vSphere Web Client onpage 137You can select and configure the events, states, or conditions that trigger the alarm on the Triggers pageof the alarm definition wizard. The options that you choose on the General page of the alarm definitionwizard determine the options available on the Triggers page. An alarm definition must contain at leastone trigger before you can save it.
Chapter 5 Monitoring Events, Alarms, and Automated Actions
VMware, Inc. 135
n Specify Alarm Actions in the vSphere Web Client on page 138You can define actions that the system performs when the alarm is triggered or changes status. You canenable and disable alarms and alarm actions independently of each other.
View and Edit Alarm Settings in the vSphere Web ClientTo monitor your environment, you can create and modify alarm definitions in the vSphere Web Client. Youcan view alarm settings from any object, but you can modify settings only through the object on which thealarm is defined.
You can access alarm definitions in the Manage tab or in the pop-up menu.
Prerequisites
Required Privilege: Alarms.Create Alarm or Alarm.Modify Alarm
Procedure
n Create or edit alarms in the Manage tab.
a Select an inventory object and click the Manage tab.
b Click Alarm Definitions.
c Right-click the list of alarms and select one of the options to add or edit an alarm.
n Add an alarm to an object in the object navigator.
a Right-click an inventory object and select Alarms > New Alarm Definition.
Specify Alarm Name, Description, and Type in the vSphere Web ClientGeneral settings of an alarm definition include alarm name, description, and type. You can also enable anddisable the alarm from the general settings page. When you select the alarm type, you also select the type ofinventory object and the type of activity (events, or conditions and states) that you want to monitor. The optionson the Triggers page change depending on the type of activity that you choose to monitor.
Prerequisites
Verify that you have navigated to the General page of the alarm definition wizard. See “View and Edit AlarmSettings in the vSphere Web Client,” on page 136.
Required Privilege: Alarms.Create Alarm or Alarm.Modify Alarm
Procedure
1 Type a name and description.
2 Select the type of inventory object that this alarm will monitor.
3 Select the type of activity that this alarm will monitor.
The options on the Triggers page change depending on the type of activity you select.
4 Click Next.
What to do next
Specify alarm triggers.
vSphere Monitoring and Performance
136 VMware, Inc.
Specify How an Event-Based Alarm is Triggered in the vSphere Web ClientYou can specify the events, states, or conditions that trigger the alarm on the Triggers page of the alarmdefinition wizard. The alarm type options that you selected determine the options available on the Triggerspage. An alarm definition must contain at least one trigger before you can save it.
Prerequisites
Verify that you have navigated to the Triggers page of the alarm definition wizard. See “View and Edit AlarmSettings in the vSphere Web Client,” on page 136.
Required Privilege: Alarms.Create Alarm or Alarm.Modify Alarm
Procedure
1 Select the trigger that you want to change, or click the Add icon to add a new trigger.
2 Click in the Event column, and select an option from the drop-down menu.
3 Click in the Status column, and select an option from the drop-down menu.
4 (Optional) Configure additional conditions to be met before the alarm triggers.
a Click the Add icon to add an argument.
b Click in the Argument column, and select an option from the drop-down menu.
c Click in the Operator column, and select an option from the drop-down menu.
d Click in the Value column, and enter a value into the text field.
You can add more than one argument.
5 Click Next.
You selected and configured alarm triggers.
What to do next
Configure alarm actions.
Specify How a Condition-Based or State-Based Alarm is Triggered in the vSphereWeb Client
You can select and configure the events, states, or conditions that trigger the alarm on the Triggers page of thealarm definition wizard. The options that you choose on the General page of the alarm definition wizarddetermine the options available on the Triggers page. An alarm definition must contain at least one triggerbefore you can save it.
You can add multiple triggers and choose whether to trigger the alarm when one or all of them become active.
For information about defining triggers for an event-based alarm, see “Specify How an Event-Based Alarm isTriggered in the vSphere Web Client,” on page 137.
Prerequisites
Verify that you have navigated to the Triggers page of the alarm definition wizard. See “View and Edit AlarmSettings in the vSphere Web Client,” on page 136.
Required Privilege: Alarms.Create Alarm or Alarm.Modify Alarm
Procedure
1 Select the trigger that you want to change, or click the Add icon to add a new trigger.
Chapter 5 Monitoring Events, Alarms, and Automated Actions
VMware, Inc. 137
2 Click in the Trigger column, and select an option from the drop-down menu.
3 Click in the Operator column, and select an option from the drop-down menu.
4 Click in the Warning Condition column, and select an option from the drop-down menu to set thethreshold for triggering a warning.
5 Click in the Critical Condition column, and select an option from the drop-down menu.
6 Click Next.
You selected and configured alarm triggers.
What to do next
Configure alarm actions.
Specify Alarm Actions in the vSphere Web ClientYou can define actions that the system performs when the alarm is triggered or changes status. You can enableand disable alarms and alarm actions independently of each other.
vCenter Server can perform alarm actions in response to triggered alarms.
Prerequisites
Verify that you have navigated to the Actions page of the alarm definition wizard. See “View and Edit AlarmSettings in the vSphere Web Client,” on page 136.
Required Privilege: Alarms.Create Alarm or Alarm.Modify Alarm
n Send Email as an Alarm Action in the vSphere Web Client on page 139You can use the SMTP agent included with vCenter Server to send email notifications when alarms aretriggered.
n Send SNMP Traps as an Alarm in the vSphere Web Client on page 140The SNMP agent included with vCenter Server can be used to send traps when alarms are triggered ona vCenter Server instance. The default hardware health alarms send SNMP traps by default.
n Run a Script or a Command as an Alarm Action in the vSphere Web Client on page 141You can configure an alarm to run a script or a command when the alarm is triggered.
Procedure
1 Select the action that you want to change, or click the Add icon to add one.
2 Click in the Action column, and select an option from the drop-down menu.
vSphere Monitoring and Performance
138 VMware, Inc.
3 Click in the Configuration column, and enter configuration information for actions that require additionalinformation:
Option Action
Send a notification email Type email addresses, separated by a comma.
Migrate VM Complete the virtual machine migration wizard.
Run a command Take one of the following actions and press Enter:n If the command is a .exe file, enter the full path name of the command
and include any parameters. For example, to run the cmd.exe commandin the C:\tools directory, with the alarmName and targetNameparameters, type: c:\tools\cmd.exe alarmName targetName
n If the command is a .bat file, enter the full path name of the commandas an argument to the c:\windows\system32\cmd.exe command.Include any parameters. For example, to run the cmd.bat command inthe C:\tools directory, with the alarmName and targetNameparameters, type:c:\windows\system32\cmd.exe /c c:\tools\cmd.bat alarmNametargetName
For .bat files, the command and its parameters must be formatted intoone string.
4 (Optional) For each alarm status change column, select whether the alarm should be triggered when the
alarm status changes.
Some actions do not support re-triggering when alarm status change.
5 For repeat actions, select the time interval for the repetition.
6 Click Finish.
You configured the alarm general settings, triggers, and actions. The alarm monitors the object on which it isdefined, as well as child objects.
Send Email as an Alarm Action in the vSphere Web ClientYou can use the SMTP agent included with vCenter Server to send email notifications when alarms aretriggered.
Prerequisites
Ensure that the vCenter Server SMTP agent is properly configured to send email notifications.
Required Privilege: Alarms.Create Alarm or Alarm.Modify Alarm
Procedure
1 On the Actions page of the alarm definition wizard, click Add to add an action.
2 In the Actions column, select Send a notification email from the drop-down menu.
3 In the Configuration column, enter recipient addresses. Use commas to separate multiple addresses.
4 (Optional) Configure alarm transitions and frequency.
Chapter 5 Monitoring Events, Alarms, and Automated Actions
VMware, Inc. 139
vCenter Server Email Agent Notifications
The following tables describe the information that is included in Alarm-based and Event-based emailnotifications. The first table decribes the information included in all email notifications; the second tabledescribes additional information that is includeded in Event-based notifications.
Table 5-6. Basic STMP Email Notification Details
Email Entry Description
Target Object for which the alarm was triggered.
Old Status Previous alarm status. Applies only to state triggers.
New Status Current alarm status. Applies only to state triggers.
Metric Value Threshold value that triggered the alarm. Applies only to metric condition triggers.
Alarm Definition Alarm definition in vCenter Server, including the alarm name and status.
Description Localized string containing a summary of the alarm. For example:Alarm New_Alarm on host1.vmware.com changed from Gray to Red.
Table 5-7. Additional Notification Details for Alarms Triggered by Events
Detail Description
Event Details VMODL event type name.
Summary Alarm summary, including the event type, alarm name, and target object.
Date Time and date the alarm was triggered.
UserName Person who initiated the action that caused the event to be created. Events caused by aninternal system activity do not have a UserName value.
Host Host on which the alarm was triggered.
Resource Pool Resource pool on which the alarm was triggered.
Datacenter Datacenter on which the alarm was triggered.
Arguments Arguments passed with the alarm and their values.
Send SNMP Traps as an Alarm in the vSphere Web ClientThe SNMP agent included with vCenter Server can be used to send traps when alarms are triggered on avCenter Server instance. The default hardware health alarms send SNMP traps by default.
Prerequisites
Ensure that vCenter Server SNMP agents and ESXi SNMP agents are properly configured.
Ensure that SNMP trap receiver agents are properly configured.
Required Privilege: Alarms.Create Alarm or Alarm.Modify Alarm
Procedure
1 on the Actions page of the alarm definition wizard, click Add to add an action.
2 In the Actions column, select Send a notification trap from the drop-down menu.
3 (Optional) Configure alarm transitions and frequency.
vSphere Monitoring and Performance
140 VMware, Inc.
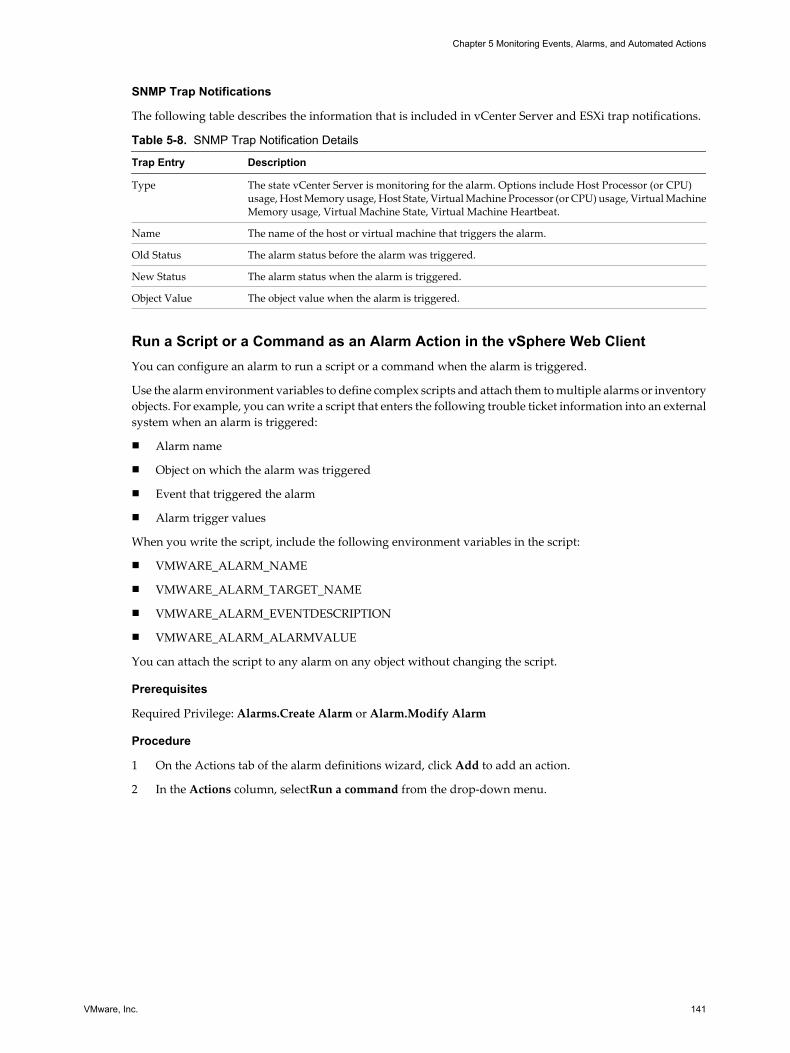
SNMP Trap Notifications
The following table describes the information that is included in vCenter Server and ESXi trap notifications.
Table 5-8. SNMP Trap Notification Details
Trap Entry Description
Type The state vCenter Server is monitoring for the alarm. Options include Host Processor (or CPU)usage, Host Memory usage, Host State, Virtual Machine Processor (or CPU) usage, Virtual MachineMemory usage, Virtual Machine State, Virtual Machine Heartbeat.
Name The name of the host or virtual machine that triggers the alarm.
Old Status The alarm status before the alarm was triggered.
New Status The alarm status when the alarm is triggered.
Object Value The object value when the alarm is triggered.
Run a Script or a Command as an Alarm Action in the vSphere Web ClientYou can configure an alarm to run a script or a command when the alarm is triggered.
Use the alarm environment variables to define complex scripts and attach them to multiple alarms or inventoryobjects. For example, you can write a script that enters the following trouble ticket information into an externalsystem when an alarm is triggered:
n Alarm name
n Object on which the alarm was triggered
n Event that triggered the alarm
n Alarm trigger values
When you write the script, include the following environment variables in the script:
n VMWARE_ALARM_NAME
n VMWARE_ALARM_TARGET_NAME
n VMWARE_ALARM_EVENTDESCRIPTION
n VMWARE_ALARM_ALARMVALUE
You can attach the script to any alarm on any object without changing the script.
Prerequisites
Required Privilege: Alarms.Create Alarm or Alarm.Modify Alarm
Procedure
1 On the Actions tab of the alarm definitions wizard, click Add to add an action.
2 In the Actions column, selectRun a command from the drop-down menu.
Chapter 5 Monitoring Events, Alarms, and Automated Actions
VMware, Inc. 141
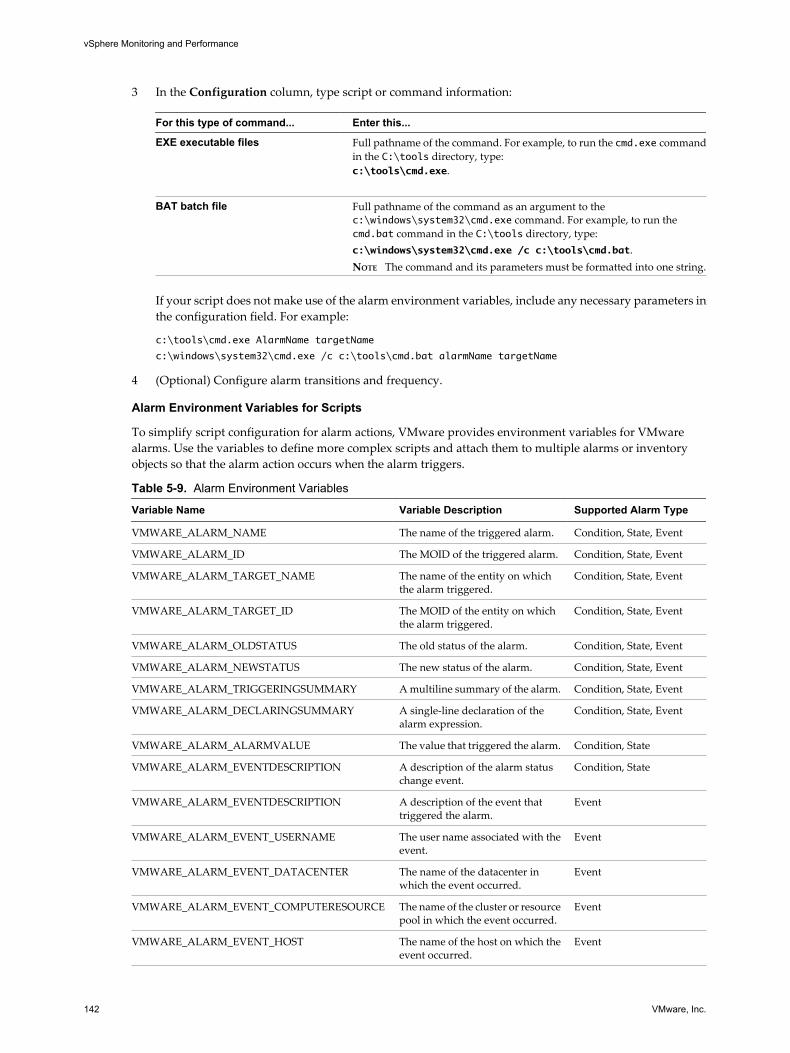
3 In the Configuration column, type script or command information:
For this type of command... Enter this...
EXE executable files Full pathname of the command. For example, to run the cmd.exe commandin the C:\tools directory, type:c:\tools\cmd.exe.
BAT batch file Full pathname of the command as an argument to thec:\windows\system32\cmd.exe command. For example, to run thecmd.bat command in the C:\tools directory, type:c:\windows\system32\cmd.exe /c c:\tools\cmd.bat.NOTE The command and its parameters must be formatted into one string.
If your script does not make use of the alarm environment variables, include any necessary parameters inthe configuration field. For example:
c:\tools\cmd.exe AlarmName targetName
c:\windows\system32\cmd.exe /c c:\tools\cmd.bat alarmName targetName
4 (Optional) Configure alarm transitions and frequency.
Alarm Environment Variables for Scripts
To simplify script configuration for alarm actions, VMware provides environment variables for VMwarealarms. Use the variables to define more complex scripts and attach them to multiple alarms or inventoryobjects so that the alarm action occurs when the alarm triggers.
Table 5-9. Alarm Environment Variables
Variable Name Variable Description Supported Alarm Type
VMWARE_ALARM_NAME The name of the triggered alarm. Condition, State, Event
VMWARE_ALARM_ID The MOID of the triggered alarm. Condition, State, Event
VMWARE_ALARM_TARGET_NAME The name of the entity on whichthe alarm triggered.
Condition, State, Event
VMWARE_ALARM_TARGET_ID The MOID of the entity on whichthe alarm triggered.
Condition, State, Event
VMWARE_ALARM_OLDSTATUS The old status of the alarm. Condition, State, Event
VMWARE_ALARM_NEWSTATUS The new status of the alarm. Condition, State, Event
VMWARE_ALARM_TRIGGERINGSUMMARY A multiline summary of the alarm. Condition, State, Event
VMWARE_ALARM_DECLARINGSUMMARY A single-line declaration of thealarm expression.
Condition, State, Event
VMWARE_ALARM_ALARMVALUE The value that triggered the alarm. Condition, State
VMWARE_ALARM_EVENTDESCRIPTION A description of the alarm statuschange event.
Condition, State
VMWARE_ALARM_EVENTDESCRIPTION A description of the event thattriggered the alarm.
Event
VMWARE_ALARM_EVENT_USERNAME The user name associated with theevent.
Event
VMWARE_ALARM_EVENT_DATACENTER The name of the datacenter inwhich the event occurred.
Event
VMWARE_ALARM_EVENT_COMPUTERESOURCE The name of the cluster or resourcepool in which the event occurred.
Event
VMWARE_ALARM_EVENT_HOST The name of the host on which theevent occurred.
Event
vSphere Monitoring and Performance
142 VMware, Inc.
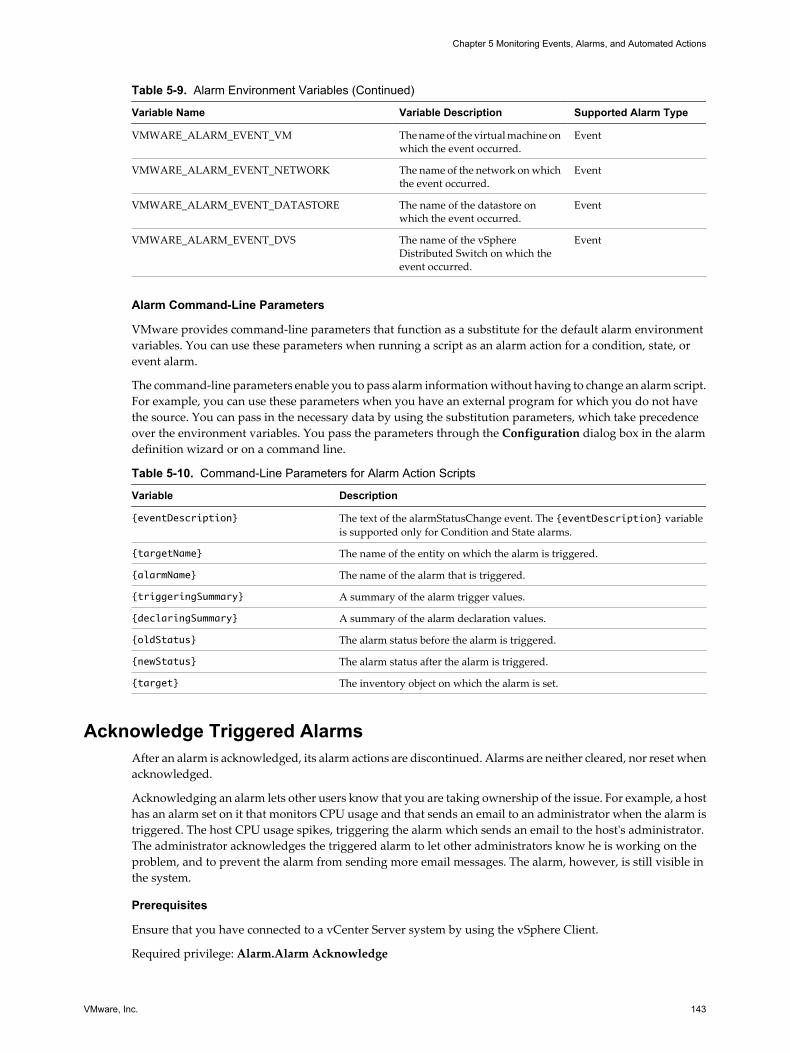
Table 5-9. Alarm Environment Variables (Continued)
Variable Name Variable Description Supported Alarm Type
VMWARE_ALARM_EVENT_VM The name of the virtual machine onwhich the event occurred.
Event
VMWARE_ALARM_EVENT_NETWORK The name of the network on whichthe event occurred.
Event
VMWARE_ALARM_EVENT_DATASTORE The name of the datastore onwhich the event occurred.
Event
VMWARE_ALARM_EVENT_DVS The name of the vSphereDistributed Switch on which theevent occurred.
Event
Alarm Command-Line Parameters
VMware provides command-line parameters that function as a substitute for the default alarm environmentvariables. You can use these parameters when running a script as an alarm action for a condition, state, orevent alarm.
The command-line parameters enable you to pass alarm information without having to change an alarm script.For example, you can use these parameters when you have an external program for which you do not havethe source. You can pass in the necessary data by using the substitution parameters, which take precedenceover the environment variables. You pass the parameters through the Configuration dialog box in the alarmdefinition wizard or on a command line.
Table 5-10. Command-Line Parameters for Alarm Action Scripts
Variable Description
{eventDescription} The text of the alarmStatusChange event. The {eventDescription} variableis supported only for Condition and State alarms.
{targetName} The name of the entity on which the alarm is triggered.
{alarmName} The name of the alarm that is triggered.
{triggeringSummary} A summary of the alarm trigger values.
{declaringSummary} A summary of the alarm declaration values.
{oldStatus} The alarm status before the alarm is triggered.
{newStatus} The alarm status after the alarm is triggered.
{target} The inventory object on which the alarm is set.
Acknowledge Triggered AlarmsAfter an alarm is acknowledged, its alarm actions are discontinued. Alarms are neither cleared, nor reset whenacknowledged.
Acknowledging an alarm lets other users know that you are taking ownership of the issue. For example, a hosthas an alarm set on it that monitors CPU usage and that sends an email to an administrator when the alarm istriggered. The host CPU usage spikes, triggering the alarm which sends an email to the host's administrator.The administrator acknowledges the triggered alarm to let other administrators know he is working on theproblem, and to prevent the alarm from sending more email messages. The alarm, however, is still visible inthe system.
Prerequisites
Ensure that you have connected to a vCenter Server system by using the vSphere Client.
Required privilege: Alarm.Alarm Acknowledge
Chapter 5 Monitoring Events, Alarms, and Automated Actions
VMware, Inc. 143
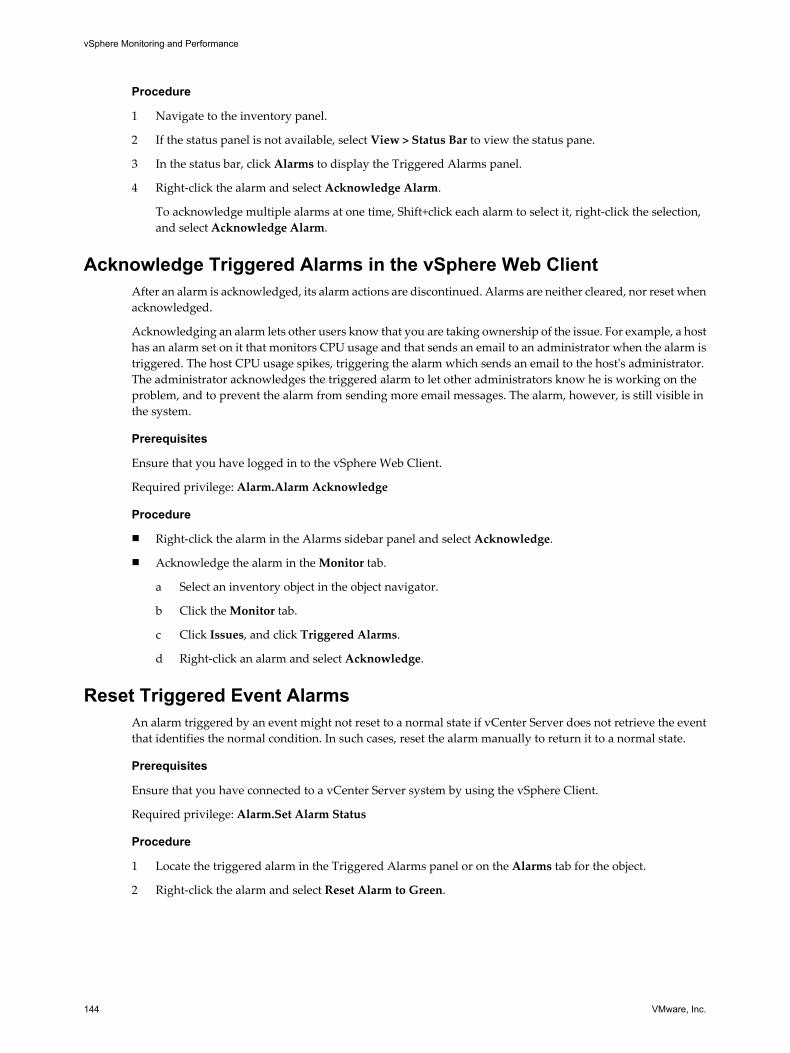
Procedure
1 Navigate to the inventory panel.
2 If the status panel is not available, select View > Status Bar to view the status pane.
3 In the status bar, click Alarms to display the Triggered Alarms panel.
4 Right-click the alarm and select Acknowledge Alarm.
To acknowledge multiple alarms at one time, Shift+click each alarm to select it, right-click the selection,and select Acknowledge Alarm.
Acknowledge Triggered Alarms in the vSphere Web ClientAfter an alarm is acknowledged, its alarm actions are discontinued. Alarms are neither cleared, nor reset whenacknowledged.
Acknowledging an alarm lets other users know that you are taking ownership of the issue. For example, a hosthas an alarm set on it that monitors CPU usage and that sends an email to an administrator when the alarm istriggered. The host CPU usage spikes, triggering the alarm which sends an email to the host's administrator.The administrator acknowledges the triggered alarm to let other administrators know he is working on theproblem, and to prevent the alarm from sending more email messages. The alarm, however, is still visible inthe system.
Prerequisites
Ensure that you have logged in to the vSphere Web Client.
Required privilege: Alarm.Alarm Acknowledge
Procedure
n Right-click the alarm in the Alarms sidebar panel and select Acknowledge.
n Acknowledge the alarm in the Monitor tab.
a Select an inventory object in the object navigator.
b Click the Monitor tab.
c Click Issues, and click Triggered Alarms.
d Right-click an alarm and select Acknowledge.
Reset Triggered Event AlarmsAn alarm triggered by an event might not reset to a normal state if vCenter Server does not retrieve the eventthat identifies the normal condition. In such cases, reset the alarm manually to return it to a normal state.
Prerequisites
Ensure that you have connected to a vCenter Server system by using the vSphere Client.
Required privilege: Alarm.Set Alarm Status
Procedure
1 Locate the triggered alarm in the Triggered Alarms panel or on the Alarms tab for the object.
2 Right-click the alarm and select Reset Alarm to Green.
vSphere Monitoring and Performance
144 VMware, Inc.
Reset Triggered Event Alarms in the vSphere Web ClientAn alarm triggered by an event might not reset to a normal state if vCenter Server does not retrieve the eventthat identifies the normal condition. In such cases, reset the alarm manually to return it to a normal state.
Prerequisites
Ensure that you have logged in to the vSphere Web Client.
Required privilege: Alarm.Set Alarm Status
Procedure
n Right-click an alarm in the Alarms sidebar pane and select Reset to green.
n Reset triggered alarms in the Monitor tab.
a Select an inventory object.
b Click the Monitor tab.
c Click Issues, and click Triggered Alarms.
d Select the alarms you want to reset.
Use Shift+click or Ctrl+click to select multiple alarms.
e Right-click an alarm and select Reset to Green.
Identify Disabled Alarm ActionsIf you are experiencing problems with alarm actions for a specific inventory object, ensure that alarm actionsare enabled for that object.
Prerequisites
Ensure that you have connected to a vCenter Server system by using the vSphere Client.
Procedure
1 Select a parent object, depending on the scope of objects you want to examine.
n vCenter Server
n Datacenter
n Cluster
n Host
n Virtual Switch
n Datastore Cluster
2 Select the tab that corresponds to the child objects you want to examine.
For example, if the selected inventory object is a datacenter, you might select the Hosts tab.
3 Locate the Alarm Actions column.
You might need to scroll horizontally to bring the column into view.
The value in the Alarm Actions column indicates whether alarm actions are enabled or disabled on thelisted objects.
Chapter 5 Monitoring Events, Alarms, and Automated Actions
VMware, Inc. 145

vSphere Monitoring and Performance
146 VMware, Inc.
Monitoring Solutions with the vCenterSolutions Manager 6
A vSphere administrator uses the vCenter Solutions Manager in the vSphere Client to view the installalledsolutions, view detailed information about the solutions, and monitor the solution health status. You can alsoperform those tasks in the vSphere Web Client.
You can monitor and manage vSphere solutions from the vSphere Client or the vSphere Web Client. Bothclients display an inventory of vSphere solutions and details about each solution.
A solution is an extension of the vCenter Server that adds new functions to a vCenter Server instance. Forexample, vSphere ESX Agent Manager is a standard vCenter solution provided by VMware that allows youto manage ESX host agents that add new capabilities to ESX hosts. Another standard solution that vSphereprovides is vService Manager. VMware products that integrate with vCenter Sever are also consideredsolutions. You can install a solution to add functionality from third-party technologies to the standard functionsof vCenter Server. Solutions typically are delivered as OVF packages. You can install and deploy solutionsfrom vSphere Client. Solutions can be integrated into the vCenter Solutions Manager.
If a virtual machine or vApp is running a solution, a custom icon appears next to it in the inventory view ofthe vSphere Client. When you power on or power off a virtual machine or vApp, you are notified that you areperforming this operation on an entity that is managed by the solution manager.
Each solution registers a unique icon to identify that the virtual machine or vApp is being managed by thatsolution. The icons show the power states (powered on, paused, powered off).
The solutions display more than one type of icon if they manage more than one type of virtual machine orvApp.
When you attempt an operation on a virtual machine or a vApp that is managed by a solution, an informationalwarning message appears.
For more information, see the Developing and Deploying vSphere Solutions, vServices, and ESX Agentsdocumentation.
This chapter includes the following topics:
n “Viewing Solutions,” on page 148
n “View Solutions and vServices in the vSphere Web Client,” on page 148
n “Monitoring Agents,” on page 149
n “Monitoring vServices,” on page 149
VMware, Inc. 147
Viewing SolutionsYou can deploy, monitor, and interact with solutions that are installed in a vCenter Server instance with thevCenter Solutions Manager. The Solutions Manager displays information about the health of a solution.
You can navigate to the Solutions Manager from the home page of the vSphere Client. The Solutions Managerview displays information about the solution:
n Solution name
n Solution health
n vService providers
Procedure
1 Click the Solutions Manager icon from vSphere Client home.
2 Navigate through the tabs in the Solutions Manager.
n Summary tab. Lists the number of installed solutions and a brief health overview for each of thesolutions.
n Solutions tab. Lists each managed solution.
n Health tab. Provides the health status of the vCenter services. It also shows alerts or warnings foreach of the services.
3 In the Solutions Manager inventory, click one of the solutions.
n Summary tab. Lists information about the solution, including a link to the product and vendor Websites, a link to launch the management UI in a separate window, and a link to the virtual machine orvApp running this solution.
Selecting the vendor Web site link takes you to the Summary page of the virtual machine or vApp.A link under "Managed by" returns you to the solution.
n Virtual Machines tab. Lists all the virtual machines belonging to the solution
n vServices Providers tab.
n Management tab or any other tabs the solution specified.
View Solutions and vServices in the vSphere Web ClientIn the vSphere Web Client, you can view information about solutions and vService providers.
Procedure
1 Navigate to the vCenter Server system in the object navigator.
2 Double-click the vCenter Server object.
3 Click Extensions.
4 Select a solution.
The Summary tab displays more information about the solution.
5 To view vService provider information, click Monitor, and click vServices.
vSphere Monitoring and Performance
148 VMware, Inc.
Monitoring AgentsThe vCenter Solutions Manager displays the vSphere ESX Agent Manager agents that you use to deploy andmanage related agents on ESX hosts.
An administrator uses the solutions manager to keep track of whether a solution's agents are working asexpected. Outstanding issues are reflected by the solution's ESX Agent Manager status and a list of issues.
When a solution's state changes, the solutions manager updates the ESX Agent Manager's summary status andstate. Administrators use this status to track whether the goal state is reached.
The agency's health status is indicated by a specific color:
n Red. The solution must intervene for the ESX Agent Manager to proceed. For example, if a virtual machineagent is powered off manually on a compute resource and the ESX Agent Manager does not attempt topower on the agent. The ESX Agent Manager reports this action to the solution. The solution alerts theadministrator to power on the agent.
n Yellow. The ESX Agent Manager is actively working to reach a goal state. The goal state can be enabled,disabled, or uninstalled. For example, when a solution is registered, its status is yellow until the ESX AgentManager deploys the solutions agents to all the specified compute resources. A solution does not need tointervene when the ESX Agent Manager reports its ESX Agent Manager health status as yellow.
n Green. A solution and all its agents reached the goal state.
Monitoring vServicesA vService is a service or function that a solution provides to virtual machines and vApps. A solution canprovide one or more vServices. These vServices integrate with the platform and are able to change theenvironment in which the vApp or virtual machine runs.
A vService is a type of service for a virtual machine and a vApp provided by a vCenter extension. Virtualmachines and vApps can have dependencies on vServices. Each dependency is associated with a vService type.The vService type must be bound to a particular vCenter extension that implements that vService type. ThisvService type is similar to a virtual hardware device. For example, a virtual machine can have a networkingdevice that at deployment must be connected to a particular network.
The vService Manager allows a solution to connect to operations related to OVF templates:
n Importing OVF templates. Receive a callback when OVF templates with a vService dependancy of a certaintype is imported.
n Exporting OVF templates. Inserts OVF sections when a virtual machine is exported.
n OVF environment generation. Inserts OVF sections into the OVF environment at the power-on instance.
The vService Provider tab in the solution manager provides details for each vCenter extension. Thisinformation allows you to monitor vService providers and list the virtual machines or vApps to which theyare bound.
Chapter 6 Monitoring Solutions with the vCenter Solutions Manager
VMware, Inc. 149

vSphere Monitoring and Performance
150 VMware, Inc.
Performance Monitoring Utilities:resxtop and esxtop 7
The resxtop and esxtop command-line utilities provide a detailed look at how ESXi uses resources in real time.You can start either utility in one of three modes: interactive (default), batch, or replay.
The fundamental difference between resxtop and esxtop is that you can use resxtop remotely, whereas youcan start esxtop only through the ESXi Shell of a local ESXi host.
This chapter includes the following topics:
n “Using the esxtop Utility,” on page 151
n “Using the resxtop Utility,” on page 152
n “Using esxtop or resxtop in Interactive Mode,” on page 152
n “Using Batch Mode,” on page 166
n “Using Replay Mode,” on page 167
Using the esxtop UtilityYou can run the esxtop utility using the ESXi Shell to communicate with the ESXi host’s management interface.You must have root user privileges.
Type the command, using the options you want:
esxtop [-] [h] [v] [b] [s] [a] [c filename] [R vm-support_dir_path] [d delay] [n iter]
The esxtop utility reads its default configuration from .esxtop50rc on the ESXi system. This configuration fileconsists of nine lines.
The first eight lines contain lowercase and uppercase letters to specify which fields appear in which order onthe CPU, memory, storage adapter, storage device, virtual machine storage, network, interrupt, and CPUpower panels. The letters correspond to the letters in the Fields or Order panels for the respective esxtop panel.
The ninth line contains information on the other options. Most important, if you saved a configuration in securemode, you do not get an insecure esxtop without removing the s from the seventh line of your .esxtop50rcfile. A number specifies the delay time between updates. As in interactive mode, typing c, m, d, u, v, n, I, or pdetermines the panel with which esxtop starts.
NOTE Do not edit the .esxtop50rc file. Instead, select the fields and the order in a running esxtop process,make changes, and save this file using the W interactive command.
VMware, Inc. 151
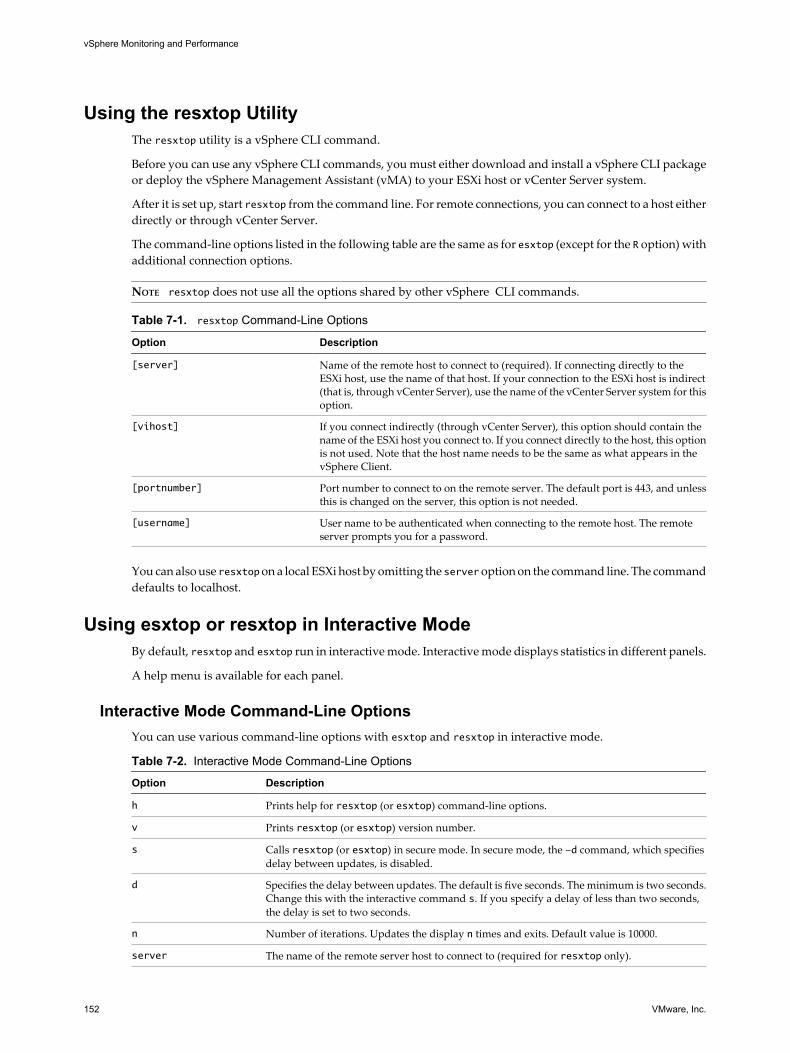
Using the resxtop UtilityThe resxtop utility is a vSphere CLI command.
Before you can use any vSphere CLI commands, you must either download and install a vSphere CLI packageor deploy the vSphere Management Assistant (vMA) to your ESXi host or vCenter Server system.
After it is set up, start resxtop from the command line. For remote connections, you can connect to a host eitherdirectly or through vCenter Server.
The command-line options listed in the following table are the same as for esxtop (except for the R option) withadditional connection options.
NOTE resxtop does not use all the options shared by other vSphere CLI commands.
Table 7-1. resxtop Command-Line Options
Option Description
[server] Name of the remote host to connect to (required). If connecting directly to theESXi host, use the name of that host. If your connection to the ESXi host is indirect(that is, through vCenter Server), use the name of the vCenter Server system for thisoption.
[vihost] If you connect indirectly (through vCenter Server), this option should contain thename of the ESXi host you connect to. If you connect directly to the host, this optionis not used. Note that the host name needs to be the same as what appears in thevSphere Client.
[portnumber] Port number to connect to on the remote server. The default port is 443, and unlessthis is changed on the server, this option is not needed.
[username] User name to be authenticated when connecting to the remote host. The remoteserver prompts you for a password.
You can also use resxtop on a local ESXi host by omitting the server option on the command line. The commanddefaults to localhost.
Using esxtop or resxtop in Interactive ModeBy default, resxtop and esxtop run in interactive mode. Interactive mode displays statistics in different panels.
A help menu is available for each panel.
Interactive Mode Command-Line OptionsYou can use various command-line options with esxtop and resxtop in interactive mode.
Table 7-2. Interactive Mode Command-Line Options
Option Description
h Prints help for resxtop (or esxtop) command-line options.
v Prints resxtop (or esxtop) version number.
s Calls resxtop (or esxtop) in secure mode. In secure mode, the -d command, which specifiesdelay between updates, is disabled.
d Specifies the delay between updates. The default is five seconds. The minimum is two seconds.Change this with the interactive command s. If you specify a delay of less than two seconds,the delay is set to two seconds.
n Number of iterations. Updates the display n times and exits. Default value is 10000.
server The name of the remote server host to connect to (required for resxtop only).
vSphere Monitoring and Performance
152 VMware, Inc.
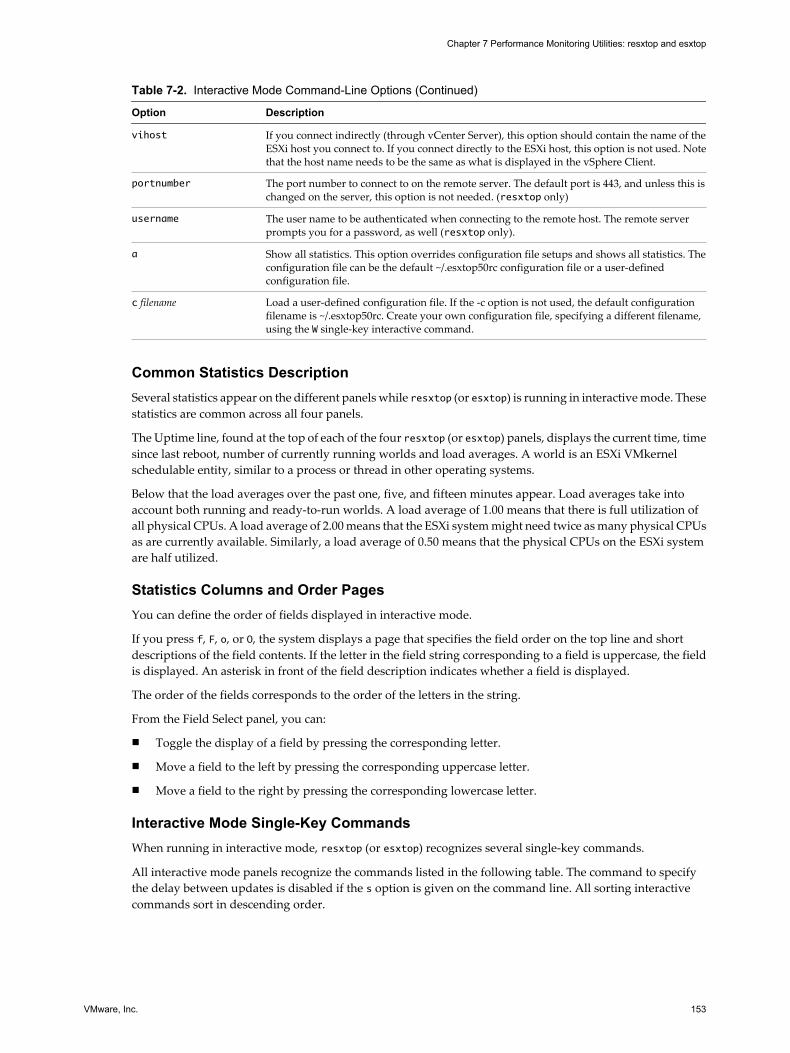
Table 7-2. Interactive Mode Command-Line Options (Continued)
Option Description
vihost If you connect indirectly (through vCenter Server), this option should contain the name of theESXi host you connect to. If you connect directly to the ESXi host, this option is not used. Notethat the host name needs to be the same as what is displayed in the vSphere Client.
portnumber The port number to connect to on the remote server. The default port is 443, and unless this ischanged on the server, this option is not needed. (resxtop only)
username The user name to be authenticated when connecting to the remote host. The remote serverprompts you for a password, as well (resxtop only).
a Show all statistics. This option overrides configuration file setups and shows all statistics. Theconfiguration file can be the default ~/.esxtop50rc configuration file or a user-definedconfiguration file.
c filename Load a user-defined configuration file. If the -c option is not used, the default configurationfilename is ~/.esxtop50rc. Create your own configuration file, specifying a different filename,using the W single-key interactive command.
Common Statistics DescriptionSeveral statistics appear on the different panels while resxtop (or esxtop) is running in interactive mode. Thesestatistics are common across all four panels.
The Uptime line, found at the top of each of the four resxtop (or esxtop) panels, displays the current time, timesince last reboot, number of currently running worlds and load averages. A world is an ESXi VMkernelschedulable entity, similar to a process or thread in other operating systems.
Below that the load averages over the past one, five, and fifteen minutes appear. Load averages take intoaccount both running and ready-to-run worlds. A load average of 1.00 means that there is full utilization ofall physical CPUs. A load average of 2.00 means that the ESXi system might need twice as many physical CPUsas are currently available. Similarly, a load average of 0.50 means that the physical CPUs on the ESXi systemare half utilized.
Statistics Columns and Order PagesYou can define the order of fields displayed in interactive mode.
If you press f, F, o, or O, the system displays a page that specifies the field order on the top line and shortdescriptions of the field contents. If the letter in the field string corresponding to a field is uppercase, the fieldis displayed. An asterisk in front of the field description indicates whether a field is displayed.
The order of the fields corresponds to the order of the letters in the string.
From the Field Select panel, you can:
n Toggle the display of a field by pressing the corresponding letter.
n Move a field to the left by pressing the corresponding uppercase letter.
n Move a field to the right by pressing the corresponding lowercase letter.
Interactive Mode Single-Key CommandsWhen running in interactive mode, resxtop (or esxtop) recognizes several single-key commands.
All interactive mode panels recognize the commands listed in the following table. The command to specifythe delay between updates is disabled if the s option is given on the command line. All sorting interactivecommands sort in descending order.
Chapter 7 Performance Monitoring Utilities: resxtop and esxtop
VMware, Inc. 153
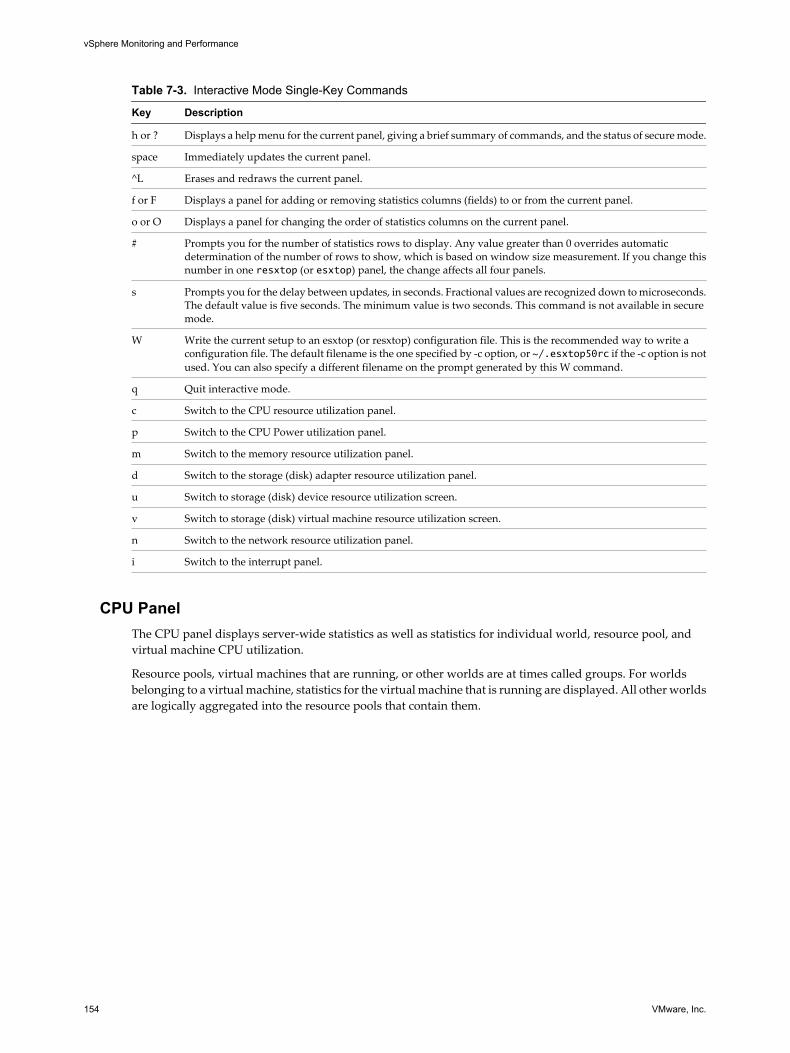
Table 7-3. Interactive Mode Single-Key Commands
Key Description
h or ? Displays a help menu for the current panel, giving a brief summary of commands, and the status of secure mode.
space Immediately updates the current panel.
^L Erases and redraws the current panel.
f or F Displays a panel for adding or removing statistics columns (fields) to or from the current panel.
o or O Displays a panel for changing the order of statistics columns on the current panel.
# Prompts you for the number of statistics rows to display. Any value greater than 0 overrides automaticdetermination of the number of rows to show, which is based on window size measurement. If you change thisnumber in one resxtop (or esxtop) panel, the change affects all four panels.
s Prompts you for the delay between updates, in seconds. Fractional values are recognized down to microseconds.The default value is five seconds. The minimum value is two seconds. This command is not available in securemode.
W Write the current setup to an esxtop (or resxtop) configuration file. This is the recommended way to write aconfiguration file. The default filename is the one specified by -c option, or ~/.esxtop50rc if the -c option is notused. You can also specify a different filename on the prompt generated by this W command.
q Quit interactive mode.
c Switch to the CPU resource utilization panel.
p Switch to the CPU Power utilization panel.
m Switch to the memory resource utilization panel.
d Switch to the storage (disk) adapter resource utilization panel.
u Switch to storage (disk) device resource utilization screen.
v Switch to storage (disk) virtual machine resource utilization screen.
n Switch to the network resource utilization panel.
i Switch to the interrupt panel.
CPU PanelThe CPU panel displays server-wide statistics as well as statistics for individual world, resource pool, andvirtual machine CPU utilization.
Resource pools, virtual machines that are running, or other worlds are at times called groups. For worldsbelonging to a virtual machine, statistics for the virtual machine that is running are displayed. All other worldsare logically aggregated into the resource pools that contain them.
vSphere Monitoring and Performance
154 VMware, Inc.
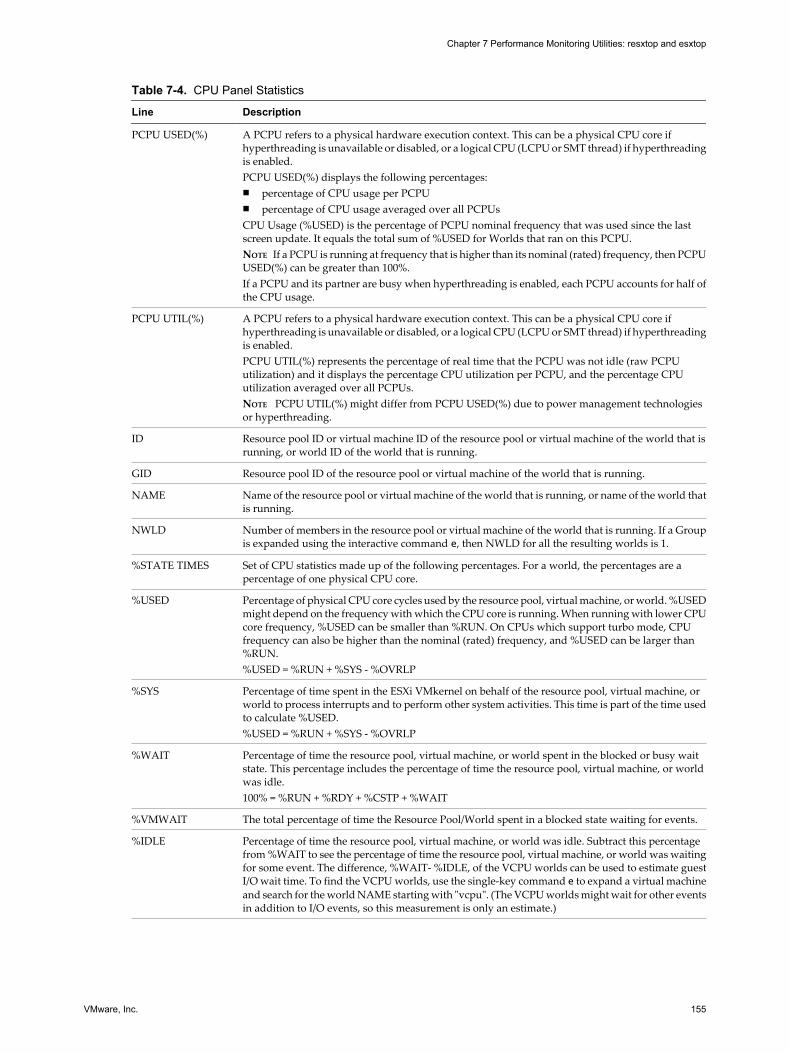
Table 7-4. CPU Panel Statistics
Line Description
PCPU USED(%) A PCPU refers to a physical hardware execution context. This can be a physical CPU core ifhyperthreading is unavailable or disabled, or a logical CPU (LCPU or SMT thread) if hyperthreadingis enabled.PCPU USED(%) displays the following percentages:n percentage of CPU usage per PCPUn percentage of CPU usage averaged over all PCPUsCPU Usage (%USED) is the percentage of PCPU nominal frequency that was used since the lastscreen update. It equals the total sum of %USED for Worlds that ran on this PCPU.NOTE If a PCPU is running at frequency that is higher than its nominal (rated) frequency, then PCPUUSED(%) can be greater than 100%.If a PCPU and its partner are busy when hyperthreading is enabled, each PCPU accounts for half ofthe CPU usage.
PCPU UTIL(%) A PCPU refers to a physical hardware execution context. This can be a physical CPU core ifhyperthreading is unavailable or disabled, or a logical CPU (LCPU or SMT thread) if hyperthreadingis enabled.PCPU UTIL(%) represents the percentage of real time that the PCPU was not idle (raw PCPUutilization) and it displays the percentage CPU utilization per PCPU, and the percentage CPUutilization averaged over all PCPUs.NOTE PCPU UTIL(%) might differ from PCPU USED(%) due to power management technologiesor hyperthreading.
ID Resource pool ID or virtual machine ID of the resource pool or virtual machine of the world that isrunning, or world ID of the world that is running.
GID Resource pool ID of the resource pool or virtual machine of the world that is running.
NAME Name of the resource pool or virtual machine of the world that is running, or name of the world thatis running.
NWLD Number of members in the resource pool or virtual machine of the world that is running. If a Groupis expanded using the interactive command e, then NWLD for all the resulting worlds is 1.
%STATE TIMES Set of CPU statistics made up of the following percentages. For a world, the percentages are apercentage of one physical CPU core.
%USED Percentage of physical CPU core cycles used by the resource pool, virtual machine, or world. %USEDmight depend on the frequency with which the CPU core is running. When running with lower CPUcore frequency, %USED can be smaller than %RUN. On CPUs which support turbo mode, CPUfrequency can also be higher than the nominal (rated) frequency, and %USED can be larger than%RUN.%USED = %RUN + %SYS - %OVRLP
%SYS Percentage of time spent in the ESXi VMkernel on behalf of the resource pool, virtual machine, orworld to process interrupts and to perform other system activities. This time is part of the time usedto calculate %USED.%USED = %RUN + %SYS - %OVRLP
%WAIT Percentage of time the resource pool, virtual machine, or world spent in the blocked or busy waitstate. This percentage includes the percentage of time the resource pool, virtual machine, or worldwas idle.100% = %RUN + %RDY + %CSTP + %WAIT
%VMWAIT The total percentage of time the Resource Pool/World spent in a blocked state waiting for events.
%IDLE Percentage of time the resource pool, virtual machine, or world was idle. Subtract this percentagefrom %WAIT to see the percentage of time the resource pool, virtual machine, or world was waitingfor some event. The difference, %WAIT- %IDLE, of the VCPU worlds can be used to estimate guestI/O wait time. To find the VCPU worlds, use the single-key command e to expand a virtual machineand search for the world NAME starting with "vcpu". (The VCPU worlds might wait for other eventsin addition to I/O events, so this measurement is only an estimate.)
Chapter 7 Performance Monitoring Utilities: resxtop and esxtop
VMware, Inc. 155
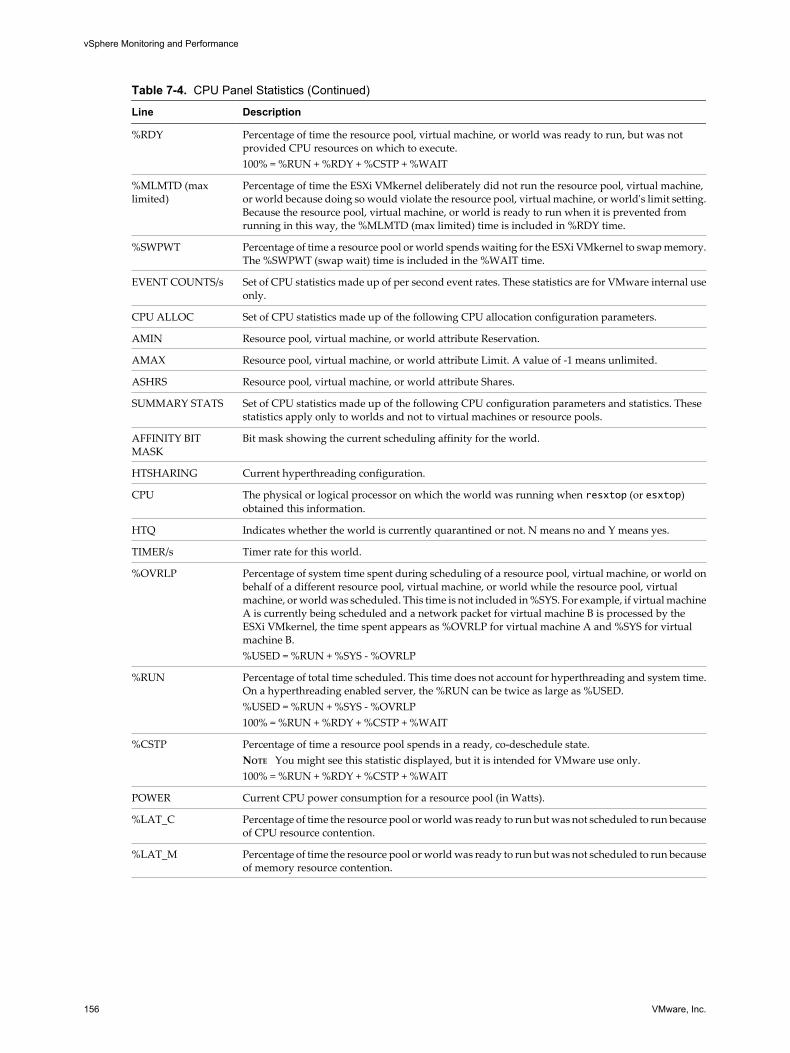
Table 7-4. CPU Panel Statistics (Continued)
Line Description
%RDY Percentage of time the resource pool, virtual machine, or world was ready to run, but was notprovided CPU resources on which to execute.100% = %RUN + %RDY + %CSTP + %WAIT
%MLMTD (maxlimited)
Percentage of time the ESXi VMkernel deliberately did not run the resource pool, virtual machine,or world because doing so would violate the resource pool, virtual machine, or world's limit setting.Because the resource pool, virtual machine, or world is ready to run when it is prevented fromrunning in this way, the %MLMTD (max limited) time is included in %RDY time.
%SWPWT Percentage of time a resource pool or world spends waiting for the ESXi VMkernel to swap memory.The %SWPWT (swap wait) time is included in the %WAIT time.
EVENT COUNTS/s Set of CPU statistics made up of per second event rates. These statistics are for VMware internal useonly.
CPU ALLOC Set of CPU statistics made up of the following CPU allocation configuration parameters.
AMIN Resource pool, virtual machine, or world attribute Reservation.
AMAX Resource pool, virtual machine, or world attribute Limit. A value of -1 means unlimited.
ASHRS Resource pool, virtual machine, or world attribute Shares.
SUMMARY STATS Set of CPU statistics made up of the following CPU configuration parameters and statistics. Thesestatistics apply only to worlds and not to virtual machines or resource pools.
AFFINITY BITMASK
Bit mask showing the current scheduling affinity for the world.
HTSHARING Current hyperthreading configuration.
CPU The physical or logical processor on which the world was running when resxtop (or esxtop)obtained this information.
HTQ Indicates whether the world is currently quarantined or not. N means no and Y means yes.
TIMER/s Timer rate for this world.
%OVRLP Percentage of system time spent during scheduling of a resource pool, virtual machine, or world onbehalf of a different resource pool, virtual machine, or world while the resource pool, virtualmachine, or world was scheduled. This time is not included in %SYS. For example, if virtual machineA is currently being scheduled and a network packet for virtual machine B is processed by theESXi VMkernel, the time spent appears as %OVRLP for virtual machine A and %SYS for virtualmachine B.%USED = %RUN + %SYS - %OVRLP
%RUN Percentage of total time scheduled. This time does not account for hyperthreading and system time.On a hyperthreading enabled server, the %RUN can be twice as large as %USED.%USED = %RUN + %SYS - %OVRLP100% = %RUN + %RDY + %CSTP + %WAIT
%CSTP Percentage of time a resource pool spends in a ready, co-deschedule state.NOTE You might see this statistic displayed, but it is intended for VMware use only.100% = %RUN + %RDY + %CSTP + %WAIT
POWER Current CPU power consumption for a resource pool (in Watts).
%LAT_C Percentage of time the resource pool or world was ready to run but was not scheduled to run becauseof CPU resource contention.
%LAT_M Percentage of time the resource pool or world was ready to run but was not scheduled to run becauseof memory resource contention.
vSphere Monitoring and Performance
156 VMware, Inc.
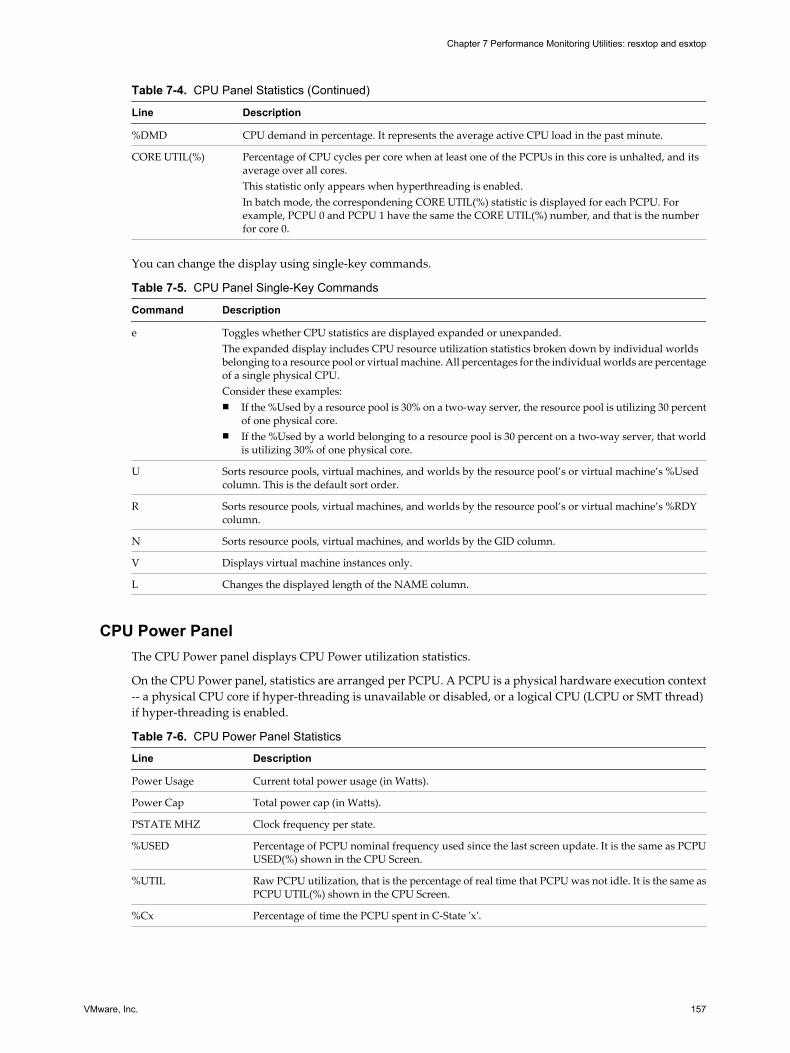
Table 7-4. CPU Panel Statistics (Continued)
Line Description
%DMD CPU demand in percentage. It represents the average active CPU load in the past minute.
CORE UTIL(%) Percentage of CPU cycles per core when at least one of the PCPUs in this core is unhalted, and itsaverage over all cores.This statistic only appears when hyperthreading is enabled.In batch mode, the correspondening CORE UTIL(%) statistic is displayed for each PCPU. Forexample, PCPU 0 and PCPU 1 have the same the CORE UTIL(%) number, and that is the numberfor core 0.
You can change the display using single-key commands.
Table 7-5. CPU Panel Single-Key Commands
Command Description
e Toggles whether CPU statistics are displayed expanded or unexpanded.The expanded display includes CPU resource utilization statistics broken down by individual worldsbelonging to a resource pool or virtual machine. All percentages for the individual worlds are percentageof a single physical CPU.Consider these examples:n If the %Used by a resource pool is 30% on a two-way server, the resource pool is utilizing 30 percent
of one physical core.n If the %Used by a world belonging to a resource pool is 30 percent on a two-way server, that world
is utilizing 30% of one physical core.
U Sorts resource pools, virtual machines, and worlds by the resource pool’s or virtual machine’s %Usedcolumn. This is the default sort order.
R Sorts resource pools, virtual machines, and worlds by the resource pool’s or virtual machine’s %RDYcolumn.
N Sorts resource pools, virtual machines, and worlds by the GID column.
V Displays virtual machine instances only.
L Changes the displayed length of the NAME column.
CPU Power PanelThe CPU Power panel displays CPU Power utilization statistics.
On the CPU Power panel, statistics are arranged per PCPU. A PCPU is a physical hardware execution context-- a physical CPU core if hyper-threading is unavailable or disabled, or a logical CPU (LCPU or SMT thread)if hyper-threading is enabled.
Table 7-6. CPU Power Panel Statistics
Line Description
Power Usage Current total power usage (in Watts).
Power Cap Total power cap (in Watts).
PSTATE MHZ Clock frequency per state.
%USED Percentage of PCPU nominal frequency used since the last screen update. It is the same as PCPUUSED(%) shown in the CPU Screen.
%UTIL Raw PCPU utilization, that is the percentage of real time that PCPU was not idle. It is the same asPCPU UTIL(%) shown in the CPU Screen.
%Cx Percentage of time the PCPU spent in C-State 'x'.
Chapter 7 Performance Monitoring Utilities: resxtop and esxtop
VMware, Inc. 157
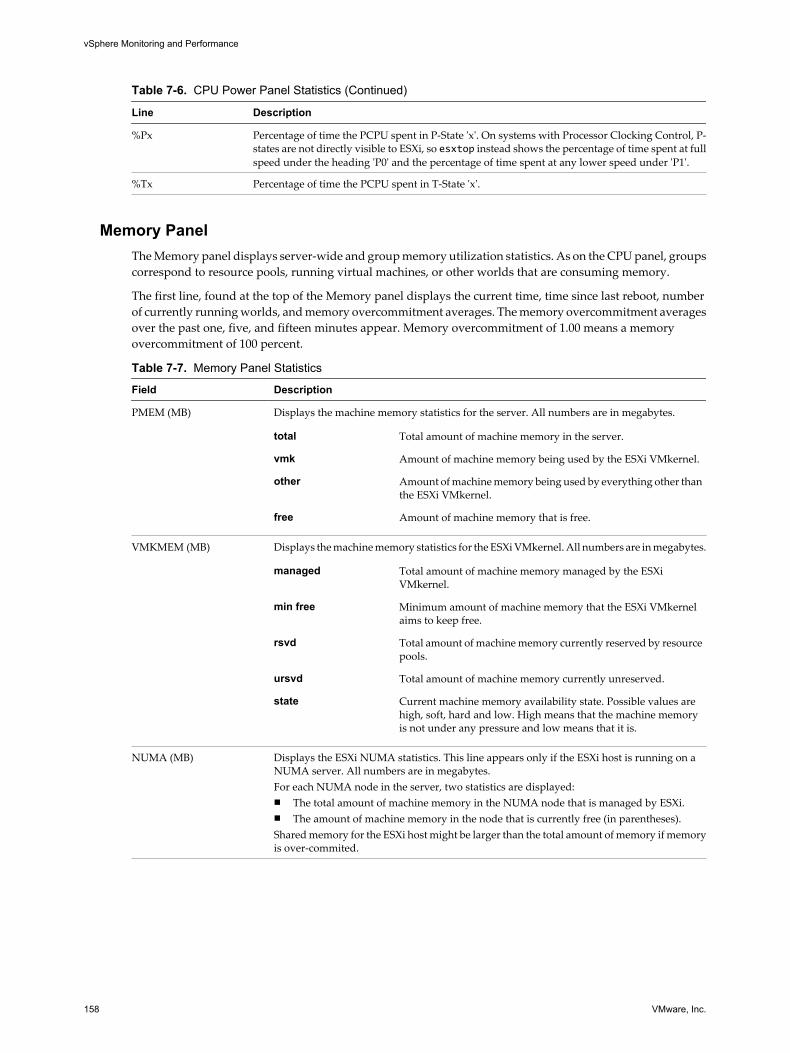
Table 7-6. CPU Power Panel Statistics (Continued)
Line Description
%Px Percentage of time the PCPU spent in P-State 'x'. On systems with Processor Clocking Control, P-states are not directly visible to ESXi, so esxtop instead shows the percentage of time spent at fullspeed under the heading 'P0' and the percentage of time spent at any lower speed under 'P1'.
%Tx Percentage of time the PCPU spent in T-State 'x'.
Memory PanelThe Memory panel displays server-wide and group memory utilization statistics. As on the CPU panel, groupscorrespond to resource pools, running virtual machines, or other worlds that are consuming memory.
The first line, found at the top of the Memory panel displays the current time, time since last reboot, numberof currently running worlds, and memory overcommitment averages. The memory overcommitment averagesover the past one, five, and fifteen minutes appear. Memory overcommitment of 1.00 means a memoryovercommitment of 100 percent.
Table 7-7. Memory Panel Statistics
Field Description
PMEM (MB) Displays the machine memory statistics for the server. All numbers are in megabytes.
total Total amount of machine memory in the server.
vmk Amount of machine memory being used by the ESXi VMkernel.
other Amount of machine memory being used by everything other thanthe ESXi VMkernel.
free Amount of machine memory that is free.
VMKMEM (MB) Displays the machine memory statistics for the ESXi VMkernel. All numbers are in megabytes.
managed Total amount of machine memory managed by the ESXiVMkernel.
min free Minimum amount of machine memory that the ESXi VMkernelaims to keep free.
rsvd Total amount of machine memory currently reserved by resourcepools.
ursvd Total amount of machine memory currently unreserved.
state Current machine memory availability state. Possible values arehigh, soft, hard and low. High means that the machine memoryis not under any pressure and low means that it is.
NUMA (MB) Displays the ESXi NUMA statistics. This line appears only if the ESXi host is running on aNUMA server. All numbers are in megabytes.For each NUMA node in the server, two statistics are displayed:n The total amount of machine memory in the NUMA node that is managed by ESXi.n The amount of machine memory in the node that is currently free (in parentheses).Shared memory for the ESXi host might be larger than the total amount of memory if memoryis over-commited.
vSphere Monitoring and Performance
158 VMware, Inc.
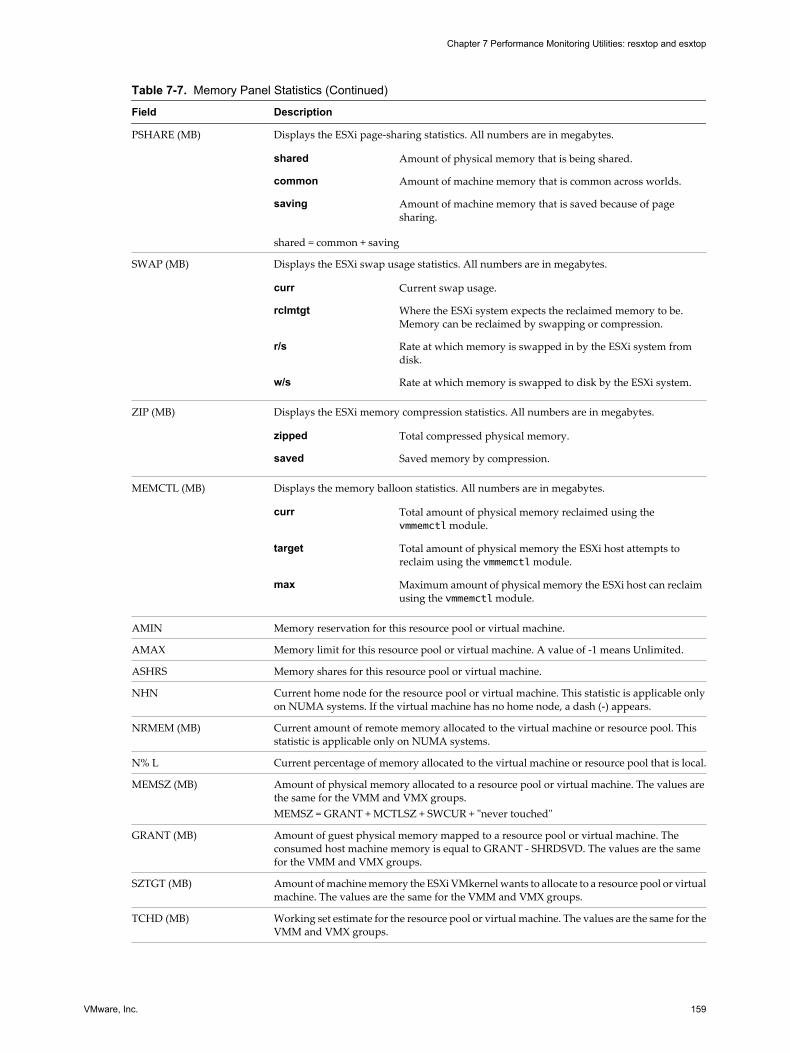
Table 7-7. Memory Panel Statistics (Continued)
Field Description
PSHARE (MB) Displays the ESXi page-sharing statistics. All numbers are in megabytes.
shared Amount of physical memory that is being shared.
common Amount of machine memory that is common across worlds.
saving Amount of machine memory that is saved because of pagesharing.
shared = common + saving
SWAP (MB) Displays the ESXi swap usage statistics. All numbers are in megabytes.
curr Current swap usage.
rclmtgt Where the ESXi system expects the reclaimed memory to be.Memory can be reclaimed by swapping or compression.
r/s Rate at which memory is swapped in by the ESXi system fromdisk.
w/s Rate at which memory is swapped to disk by the ESXi system.
ZIP (MB) Displays the ESXi memory compression statistics. All numbers are in megabytes.
zipped Total compressed physical memory.
saved Saved memory by compression.
MEMCTL (MB) Displays the memory balloon statistics. All numbers are in megabytes.
curr Total amount of physical memory reclaimed using thevmmemctl module.
target Total amount of physical memory the ESXi host attempts toreclaim using the vmmemctl module.
max Maximum amount of physical memory the ESXi host can reclaimusing the vmmemctl module.
AMIN Memory reservation for this resource pool or virtual machine.
AMAX Memory limit for this resource pool or virtual machine. A value of -1 means Unlimited.
ASHRS Memory shares for this resource pool or virtual machine.
NHN Current home node for the resource pool or virtual machine. This statistic is applicable onlyon NUMA systems. If the virtual machine has no home node, a dash (-) appears.
NRMEM (MB) Current amount of remote memory allocated to the virtual machine or resource pool. Thisstatistic is applicable only on NUMA systems.
N% L Current percentage of memory allocated to the virtual machine or resource pool that is local.
MEMSZ (MB) Amount of physical memory allocated to a resource pool or virtual machine. The values arethe same for the VMM and VMX groups.MEMSZ = GRANT + MCTLSZ + SWCUR + "never touched"
GRANT (MB) Amount of guest physical memory mapped to a resource pool or virtual machine. Theconsumed host machine memory is equal to GRANT - SHRDSVD. The values are the samefor the VMM and VMX groups.
SZTGT (MB) Amount of machine memory the ESXi VMkernel wants to allocate to a resource pool or virtualmachine. The values are the same for the VMM and VMX groups.
TCHD (MB) Working set estimate for the resource pool or virtual machine. The values are the same for theVMM and VMX groups.
Chapter 7 Performance Monitoring Utilities: resxtop and esxtop
VMware, Inc. 159
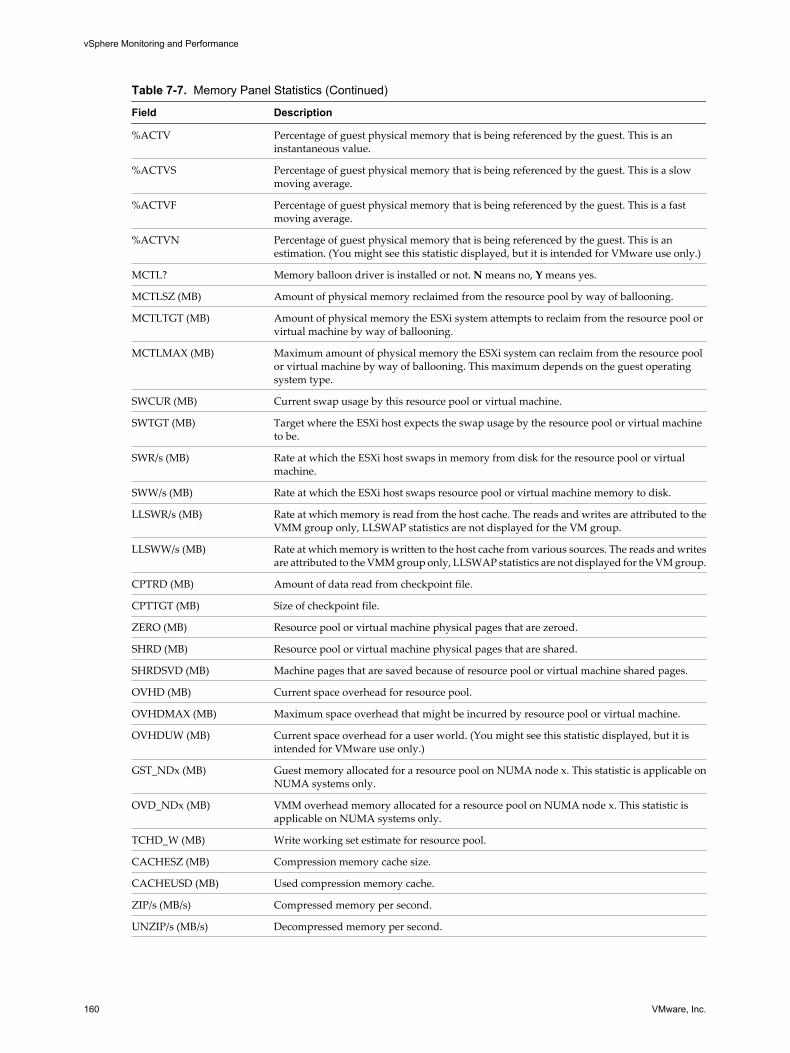
Table 7-7. Memory Panel Statistics (Continued)
Field Description
%ACTV Percentage of guest physical memory that is being referenced by the guest. This is aninstantaneous value.
%ACTVS Percentage of guest physical memory that is being referenced by the guest. This is a slowmoving average.
%ACTVF Percentage of guest physical memory that is being referenced by the guest. This is a fastmoving average.
%ACTVN Percentage of guest physical memory that is being referenced by the guest. This is anestimation. (You might see this statistic displayed, but it is intended for VMware use only.)
MCTL? Memory balloon driver is installed or not. N means no, Y means yes.
MCTLSZ (MB) Amount of physical memory reclaimed from the resource pool by way of ballooning.
MCTLTGT (MB) Amount of physical memory the ESXi system attempts to reclaim from the resource pool orvirtual machine by way of ballooning.
MCTLMAX (MB) Maximum amount of physical memory the ESXi system can reclaim from the resource poolor virtual machine by way of ballooning. This maximum depends on the guest operatingsystem type.
SWCUR (MB) Current swap usage by this resource pool or virtual machine.
SWTGT (MB) Target where the ESXi host expects the swap usage by the resource pool or virtual machineto be.
SWR/s (MB) Rate at which the ESXi host swaps in memory from disk for the resource pool or virtualmachine.
SWW/s (MB) Rate at which the ESXi host swaps resource pool or virtual machine memory to disk.
LLSWR/s (MB) Rate at which memory is read from the host cache. The reads and writes are attributed to theVMM group only, LLSWAP statistics are not displayed for the VM group.
LLSWW/s (MB) Rate at which memory is written to the host cache from various sources. The reads and writesare attributed to the VMM group only, LLSWAP statistics are not displayed for the VM group.
CPTRD (MB) Amount of data read from checkpoint file.
CPTTGT (MB) Size of checkpoint file.
ZERO (MB) Resource pool or virtual machine physical pages that are zeroed.
SHRD (MB) Resource pool or virtual machine physical pages that are shared.
SHRDSVD (MB) Machine pages that are saved because of resource pool or virtual machine shared pages.
OVHD (MB) Current space overhead for resource pool.
OVHDMAX (MB) Maximum space overhead that might be incurred by resource pool or virtual machine.
OVHDUW (MB) Current space overhead for a user world. (You might see this statistic displayed, but it isintended for VMware use only.)
GST_NDx (MB) Guest memory allocated for a resource pool on NUMA node x. This statistic is applicable onNUMA systems only.
OVD_NDx (MB) VMM overhead memory allocated for a resource pool on NUMA node x. This statistic isapplicable on NUMA systems only.
TCHD_W (MB) Write working set estimate for resource pool.
CACHESZ (MB) Compression memory cache size.
CACHEUSD (MB) Used compression memory cache.
ZIP/s (MB/s) Compressed memory per second.
UNZIP/s (MB/s) Decompressed memory per second.
vSphere Monitoring and Performance
160 VMware, Inc.
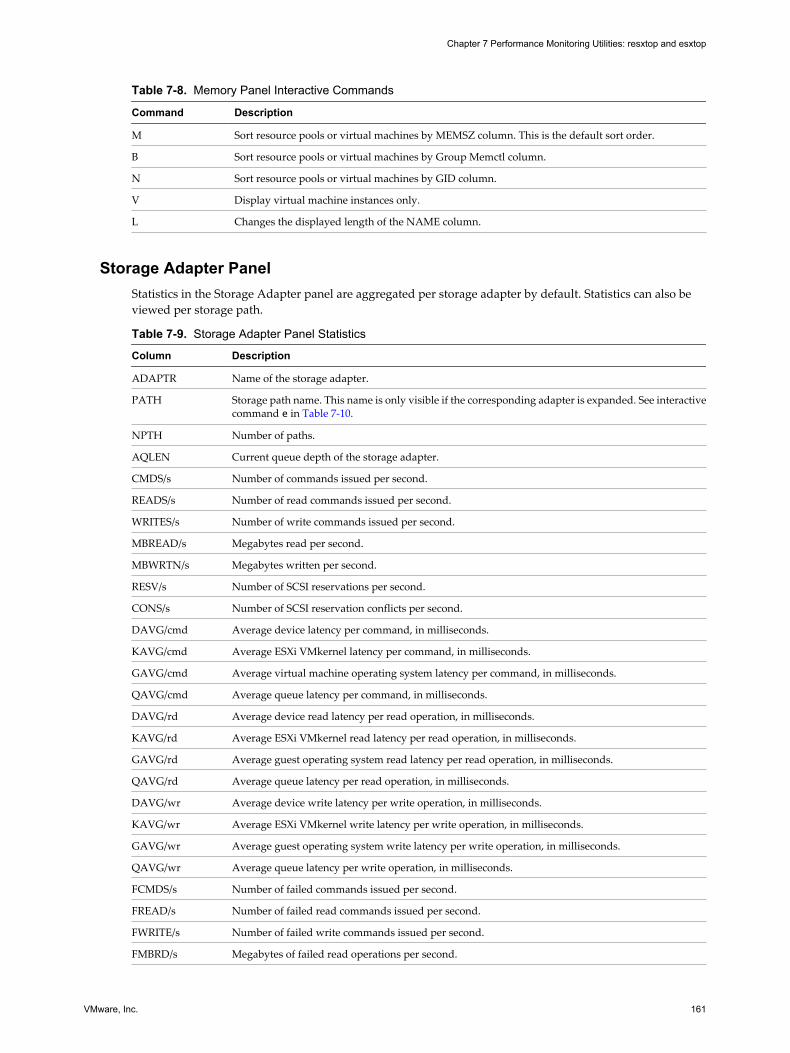
Table 7-8. Memory Panel Interactive Commands
Command Description
M Sort resource pools or virtual machines by MEMSZ column. This is the default sort order.
B Sort resource pools or virtual machines by Group Memctl column.
N Sort resource pools or virtual machines by GID column.
V Display virtual machine instances only.
L Changes the displayed length of the NAME column.
Storage Adapter PanelStatistics in the Storage Adapter panel are aggregated per storage adapter by default. Statistics can also beviewed per storage path.
Table 7-9. Storage Adapter Panel Statistics
Column Description
ADAPTR Name of the storage adapter.
PATH Storage path name. This name is only visible if the corresponding adapter is expanded. See interactivecommand e in Table 7-10.
NPTH Number of paths.
AQLEN Current queue depth of the storage adapter.
CMDS/s Number of commands issued per second.
READS/s Number of read commands issued per second.
WRITES/s Number of write commands issued per second.
MBREAD/s Megabytes read per second.
MBWRTN/s Megabytes written per second.
RESV/s Number of SCSI reservations per second.
CONS/s Number of SCSI reservation conflicts per second.
DAVG/cmd Average device latency per command, in milliseconds.
KAVG/cmd Average ESXi VMkernel latency per command, in milliseconds.
GAVG/cmd Average virtual machine operating system latency per command, in milliseconds.
QAVG/cmd Average queue latency per command, in milliseconds.
DAVG/rd Average device read latency per read operation, in milliseconds.
KAVG/rd Average ESXi VMkernel read latency per read operation, in milliseconds.
GAVG/rd Average guest operating system read latency per read operation, in milliseconds.
QAVG/rd Average queue latency per read operation, in milliseconds.
DAVG/wr Average device write latency per write operation, in milliseconds.
KAVG/wr Average ESXi VMkernel write latency per write operation, in milliseconds.
GAVG/wr Average guest operating system write latency per write operation, in milliseconds.
QAVG/wr Average queue latency per write operation, in milliseconds.
FCMDS/s Number of failed commands issued per second.
FREAD/s Number of failed read commands issued per second.
FWRITE/s Number of failed write commands issued per second.
FMBRD/s Megabytes of failed read operations per second.
Chapter 7 Performance Monitoring Utilities: resxtop and esxtop
VMware, Inc. 161
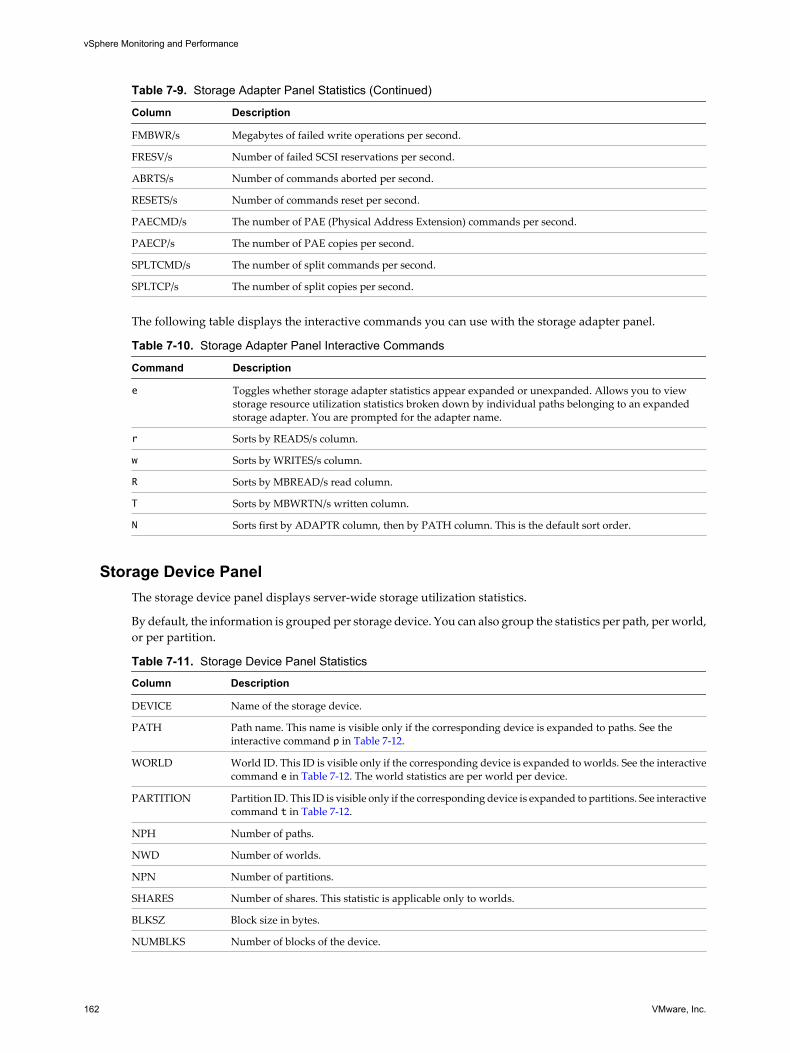
Table 7-9. Storage Adapter Panel Statistics (Continued)
Column Description
FMBWR/s Megabytes of failed write operations per second.
FRESV/s Number of failed SCSI reservations per second.
ABRTS/s Number of commands aborted per second.
RESETS/s Number of commands reset per second.
PAECMD/s The number of PAE (Physical Address Extension) commands per second.
PAECP/s The number of PAE copies per second.
SPLTCMD/s The number of split commands per second.
SPLTCP/s The number of split copies per second.
The following table displays the interactive commands you can use with the storage adapter panel.
Table 7-10. Storage Adapter Panel Interactive Commands
Command Description
e Toggles whether storage adapter statistics appear expanded or unexpanded. Allows you to viewstorage resource utilization statistics broken down by individual paths belonging to an expandedstorage adapter. You are prompted for the adapter name.
r Sorts by READS/s column.
w Sorts by WRITES/s column.
R Sorts by MBREAD/s read column.
T Sorts by MBWRTN/s written column.
N Sorts first by ADAPTR column, then by PATH column. This is the default sort order.
Storage Device PanelThe storage device panel displays server-wide storage utilization statistics.
By default, the information is grouped per storage device. You can also group the statistics per path, per world,or per partition.
Table 7-11. Storage Device Panel Statistics
Column Description
DEVICE Name of the storage device.
PATH Path name. This name is visible only if the corresponding device is expanded to paths. See theinteractive command p in Table 7-12.
WORLD World ID. This ID is visible only if the corresponding device is expanded to worlds. See the interactivecommand e in Table 7-12. The world statistics are per world per device.
PARTITION Partition ID. This ID is visible only if the corresponding device is expanded to partitions. See interactivecommand t in Table 7-12.
NPH Number of paths.
NWD Number of worlds.
NPN Number of partitions.
SHARES Number of shares. This statistic is applicable only to worlds.
BLKSZ Block size in bytes.
NUMBLKS Number of blocks of the device.
vSphere Monitoring and Performance
162 VMware, Inc.
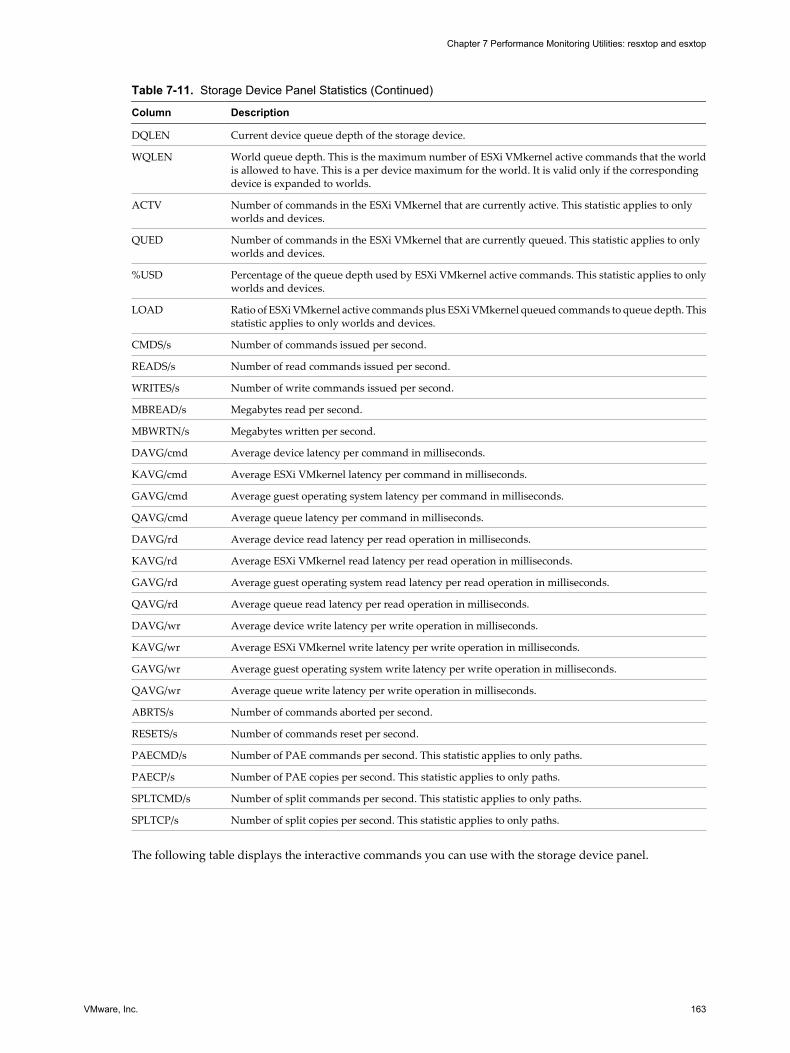
Table 7-11. Storage Device Panel Statistics (Continued)
Column Description
DQLEN Current device queue depth of the storage device.
WQLEN World queue depth. This is the maximum number of ESXi VMkernel active commands that the worldis allowed to have. This is a per device maximum for the world. It is valid only if the correspondingdevice is expanded to worlds.
ACTV Number of commands in the ESXi VMkernel that are currently active. This statistic applies to onlyworlds and devices.
QUED Number of commands in the ESXi VMkernel that are currently queued. This statistic applies to onlyworlds and devices.
%USD Percentage of the queue depth used by ESXi VMkernel active commands. This statistic applies to onlyworlds and devices.
LOAD Ratio of ESXi VMkernel active commands plus ESXi VMkernel queued commands to queue depth. Thisstatistic applies to only worlds and devices.
CMDS/s Number of commands issued per second.
READS/s Number of read commands issued per second.
WRITES/s Number of write commands issued per second.
MBREAD/s Megabytes read per second.
MBWRTN/s Megabytes written per second.
DAVG/cmd Average device latency per command in milliseconds.
KAVG/cmd Average ESXi VMkernel latency per command in milliseconds.
GAVG/cmd Average guest operating system latency per command in milliseconds.
QAVG/cmd Average queue latency per command in milliseconds.
DAVG/rd Average device read latency per read operation in milliseconds.
KAVG/rd Average ESXi VMkernel read latency per read operation in milliseconds.
GAVG/rd Average guest operating system read latency per read operation in milliseconds.
QAVG/rd Average queue read latency per read operation in milliseconds.
DAVG/wr Average device write latency per write operation in milliseconds.
KAVG/wr Average ESXi VMkernel write latency per write operation in milliseconds.
GAVG/wr Average guest operating system write latency per write operation in milliseconds.
QAVG/wr Average queue write latency per write operation in milliseconds.
ABRTS/s Number of commands aborted per second.
RESETS/s Number of commands reset per second.
PAECMD/s Number of PAE commands per second. This statistic applies to only paths.
PAECP/s Number of PAE copies per second. This statistic applies to only paths.
SPLTCMD/s Number of split commands per second. This statistic applies to only paths.
SPLTCP/s Number of split copies per second. This statistic applies to only paths.
The following table displays the interactive commands you can use with the storage device panel.
Chapter 7 Performance Monitoring Utilities: resxtop and esxtop
VMware, Inc. 163
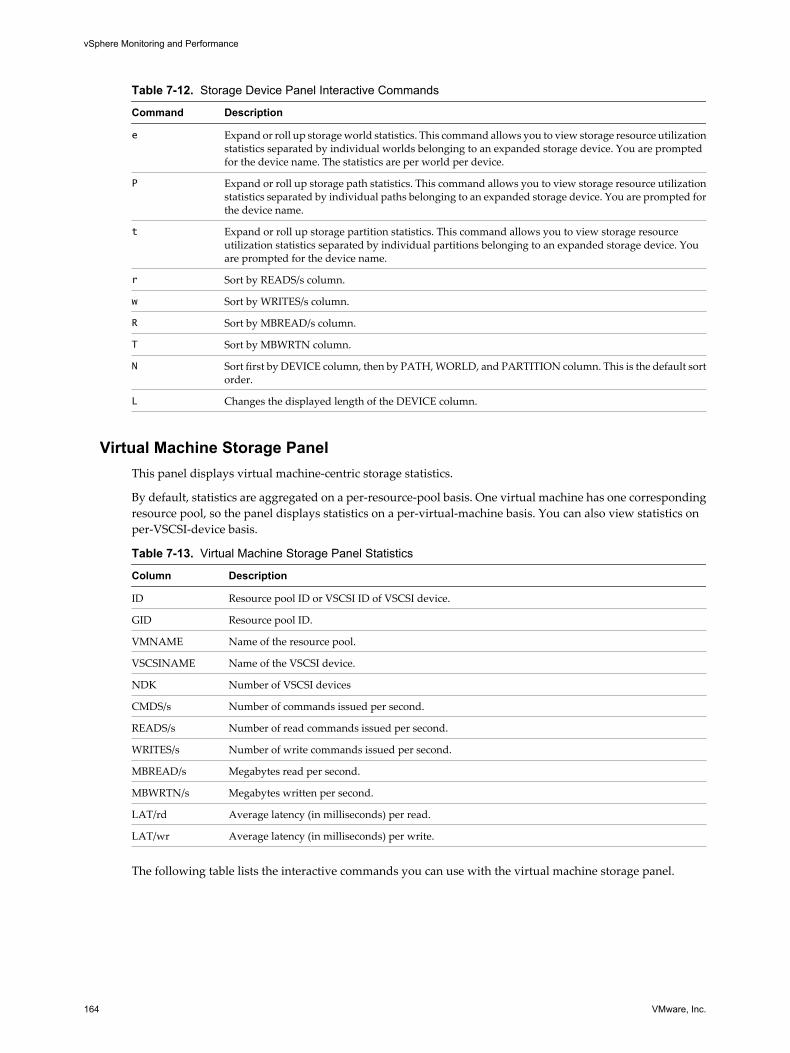
Table 7-12. Storage Device Panel Interactive Commands
Command Description
e Expand or roll up storage world statistics. This command allows you to view storage resource utilizationstatistics separated by individual worlds belonging to an expanded storage device. You are promptedfor the device name. The statistics are per world per device.
P Expand or roll up storage path statistics. This command allows you to view storage resource utilizationstatistics separated by individual paths belonging to an expanded storage device. You are prompted forthe device name.
t Expand or roll up storage partition statistics. This command allows you to view storage resourceutilization statistics separated by individual partitions belonging to an expanded storage device. Youare prompted for the device name.
r Sort by READS/s column.
w Sort by WRITES/s column.
R Sort by MBREAD/s column.
T Sort by MBWRTN column.
N Sort first by DEVICE column, then by PATH, WORLD, and PARTITION column. This is the default sortorder.
L Changes the displayed length of the DEVICE column.
Virtual Machine Storage PanelThis panel displays virtual machine-centric storage statistics.
By default, statistics are aggregated on a per-resource-pool basis. One virtual machine has one correspondingresource pool, so the panel displays statistics on a per-virtual-machine basis. You can also view statistics onper-VSCSI-device basis.
Table 7-13. Virtual Machine Storage Panel Statistics
Column Description
ID Resource pool ID or VSCSI ID of VSCSI device.
GID Resource pool ID.
VMNAME Name of the resource pool.
VSCSINAME Name of the VSCSI device.
NDK Number of VSCSI devices
CMDS/s Number of commands issued per second.
READS/s Number of read commands issued per second.
WRITES/s Number of write commands issued per second.
MBREAD/s Megabytes read per second.
MBWRTN/s Megabytes written per second.
LAT/rd Average latency (in milliseconds) per read.
LAT/wr Average latency (in milliseconds) per write.
The following table lists the interactive commands you can use with the virtual machine storage panel.
vSphere Monitoring and Performance
164 VMware, Inc.
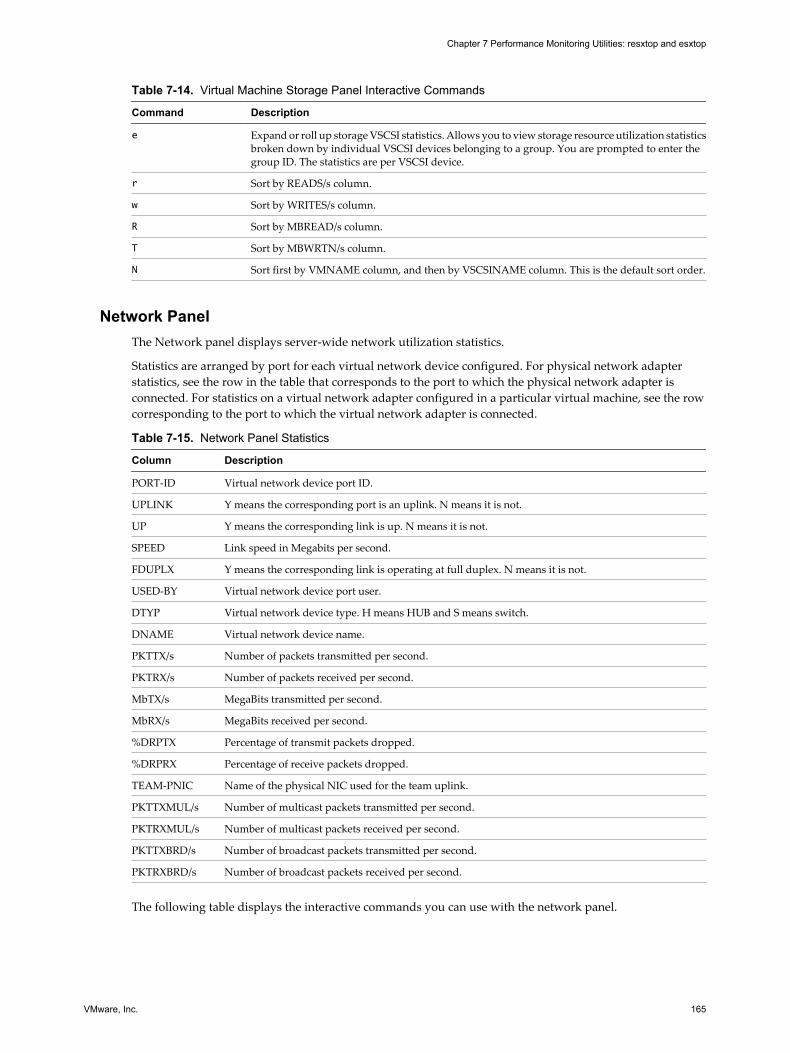
Table 7-14. Virtual Machine Storage Panel Interactive Commands
Command Description
e Expand or roll up storage VSCSI statistics. Allows you to view storage resource utilization statisticsbroken down by individual VSCSI devices belonging to a group. You are prompted to enter thegroup ID. The statistics are per VSCSI device.
r Sort by READS/s column.
w Sort by WRITES/s column.
R Sort by MBREAD/s column.
T Sort by MBWRTN/s column.
N Sort first by VMNAME column, and then by VSCSINAME column. This is the default sort order.
Network PanelThe Network panel displays server-wide network utilization statistics.
Statistics are arranged by port for each virtual network device configured. For physical network adapterstatistics, see the row in the table that corresponds to the port to which the physical network adapter isconnected. For statistics on a virtual network adapter configured in a particular virtual machine, see the rowcorresponding to the port to which the virtual network adapter is connected.
Table 7-15. Network Panel Statistics
Column Description
PORT-ID Virtual network device port ID.
UPLINK Y means the corresponding port is an uplink. N means it is not.
UP Y means the corresponding link is up. N means it is not.
SPEED Link speed in Megabits per second.
FDUPLX Y means the corresponding link is operating at full duplex. N means it is not.
USED-BY Virtual network device port user.
DTYP Virtual network device type. H means HUB and S means switch.
DNAME Virtual network device name.
PKTTX/s Number of packets transmitted per second.
PKTRX/s Number of packets received per second.
MbTX/s MegaBits transmitted per second.
MbRX/s MegaBits received per second.
%DRPTX Percentage of transmit packets dropped.
%DRPRX Percentage of receive packets dropped.
TEAM-PNIC Name of the physical NIC used for the team uplink.
PKTTXMUL/s Number of multicast packets transmitted per second.
PKTRXMUL/s Number of multicast packets received per second.
PKTTXBRD/s Number of broadcast packets transmitted per second.
PKTRXBRD/s Number of broadcast packets received per second.
The following table displays the interactive commands you can use with the network panel.
Chapter 7 Performance Monitoring Utilities: resxtop and esxtop
VMware, Inc. 165
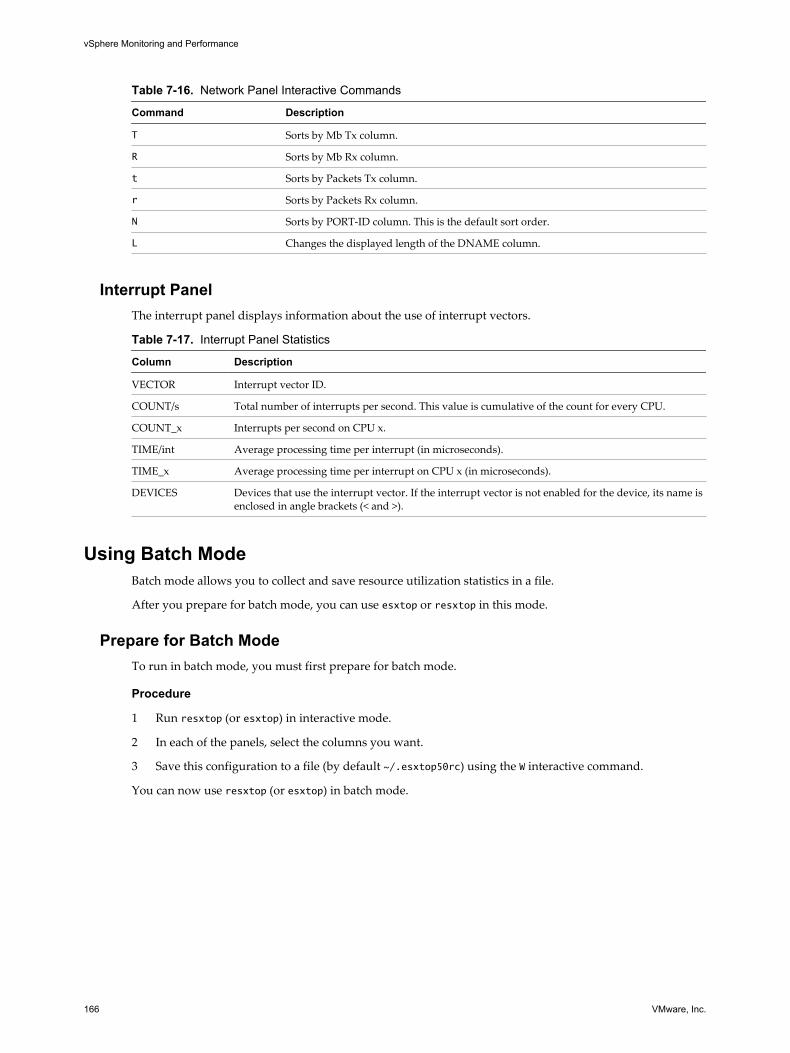
Table 7-16. Network Panel Interactive Commands
Command Description
T Sorts by Mb Tx column.
R Sorts by Mb Rx column.
t Sorts by Packets Tx column.
r Sorts by Packets Rx column.
N Sorts by PORT-ID column. This is the default sort order.
L Changes the displayed length of the DNAME column.
Interrupt PanelThe interrupt panel displays information about the use of interrupt vectors.
Table 7-17. Interrupt Panel Statistics
Column Description
VECTOR Interrupt vector ID.
COUNT/s Total number of interrupts per second. This value is cumulative of the count for every CPU.
COUNT_x Interrupts per second on CPU x.
TIME/int Average processing time per interrupt (in microseconds).
TIME_x Average processing time per interrupt on CPU x (in microseconds).
DEVICES Devices that use the interrupt vector. If the interrupt vector is not enabled for the device, its name isenclosed in angle brackets (< and >).
Using Batch ModeBatch mode allows you to collect and save resource utilization statistics in a file.
After you prepare for batch mode, you can use esxtop or resxtop in this mode.
Prepare for Batch ModeTo run in batch mode, you must first prepare for batch mode.
Procedure
1 Run resxtop (or esxtop) in interactive mode.
2 In each of the panels, select the columns you want.
3 Save this configuration to a file (by default ~/.esxtop50rc) using the W interactive command.
You can now use resxtop (or esxtop) in batch mode.
vSphere Monitoring and Performance
166 VMware, Inc.
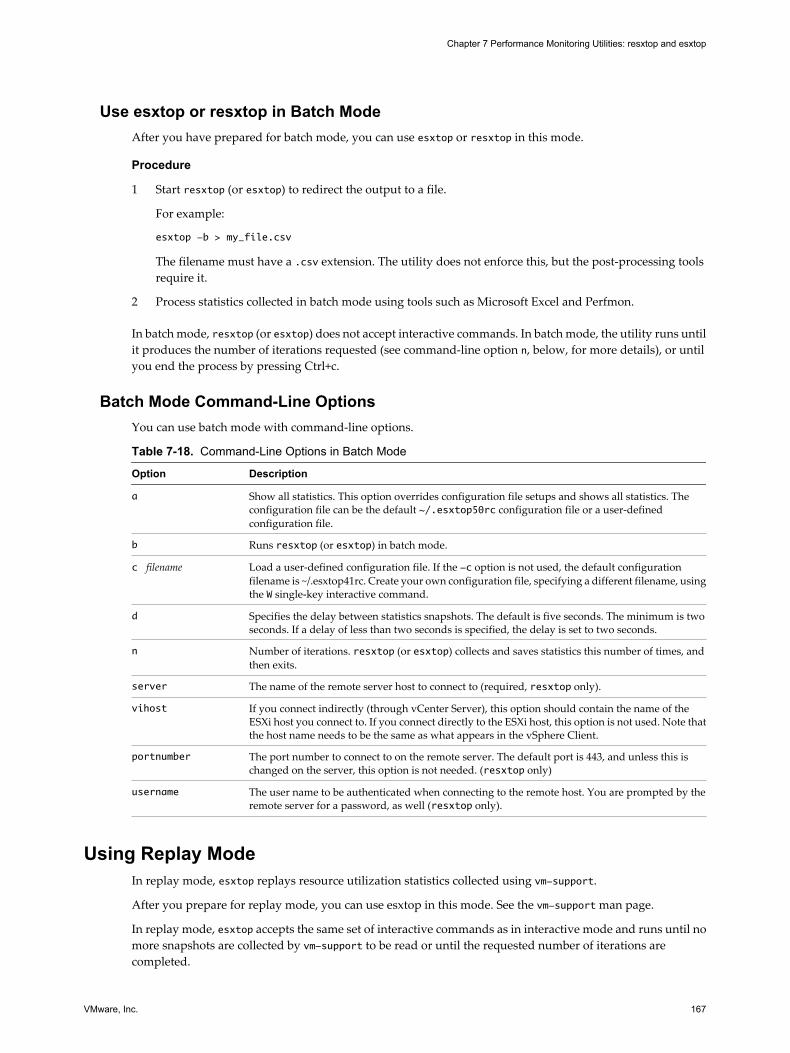
Use esxtop or resxtop in Batch ModeAfter you have prepared for batch mode, you can use esxtop or resxtop in this mode.
Procedure
1 Start resxtop (or esxtop) to redirect the output to a file.
For example:
esxtop -b > my_file.csv
The filename must have a .csv extension. The utility does not enforce this, but the post-processing toolsrequire it.
2 Process statistics collected in batch mode using tools such as Microsoft Excel and Perfmon.
In batch mode, resxtop (or esxtop) does not accept interactive commands. In batch mode, the utility runs untilit produces the number of iterations requested (see command-line option n, below, for more details), or untilyou end the process by pressing Ctrl+c.
Batch Mode Command-Line OptionsYou can use batch mode with command-line options.
Table 7-18. Command-Line Options in Batch Mode
Option Description
a Show all statistics. This option overrides configuration file setups and shows all statistics. Theconfiguration file can be the default ~/.esxtop50rc configuration file or a user-definedconfiguration file.
b Runs resxtop (or esxtop) in batch mode.
c filename Load a user-defined configuration file. If the -c option is not used, the default configurationfilename is ~/.esxtop41rc. Create your own configuration file, specifying a different filename, usingthe W single-key interactive command.
d Specifies the delay between statistics snapshots. The default is five seconds. The minimum is twoseconds. If a delay of less than two seconds is specified, the delay is set to two seconds.
n Number of iterations. resxtop (or esxtop) collects and saves statistics this number of times, andthen exits.
server The name of the remote server host to connect to (required, resxtop only).
vihost If you connect indirectly (through vCenter Server), this option should contain the name of theESXi host you connect to. If you connect directly to the ESXi host, this option is not used. Note thatthe host name needs to be the same as what appears in the vSphere Client.
portnumber The port number to connect to on the remote server. The default port is 443, and unless this ischanged on the server, this option is not needed. (resxtop only)
username The user name to be authenticated when connecting to the remote host. You are prompted by theremote server for a password, as well (resxtop only).
Using Replay ModeIn replay mode, esxtop replays resource utilization statistics collected using vm-support.
After you prepare for replay mode, you can use esxtop in this mode. See the vm-support man page.
In replay mode, esxtop accepts the same set of interactive commands as in interactive mode and runs until nomore snapshots are collected by vm-support to be read or until the requested number of iterations arecompleted.
Chapter 7 Performance Monitoring Utilities: resxtop and esxtop
VMware, Inc. 167
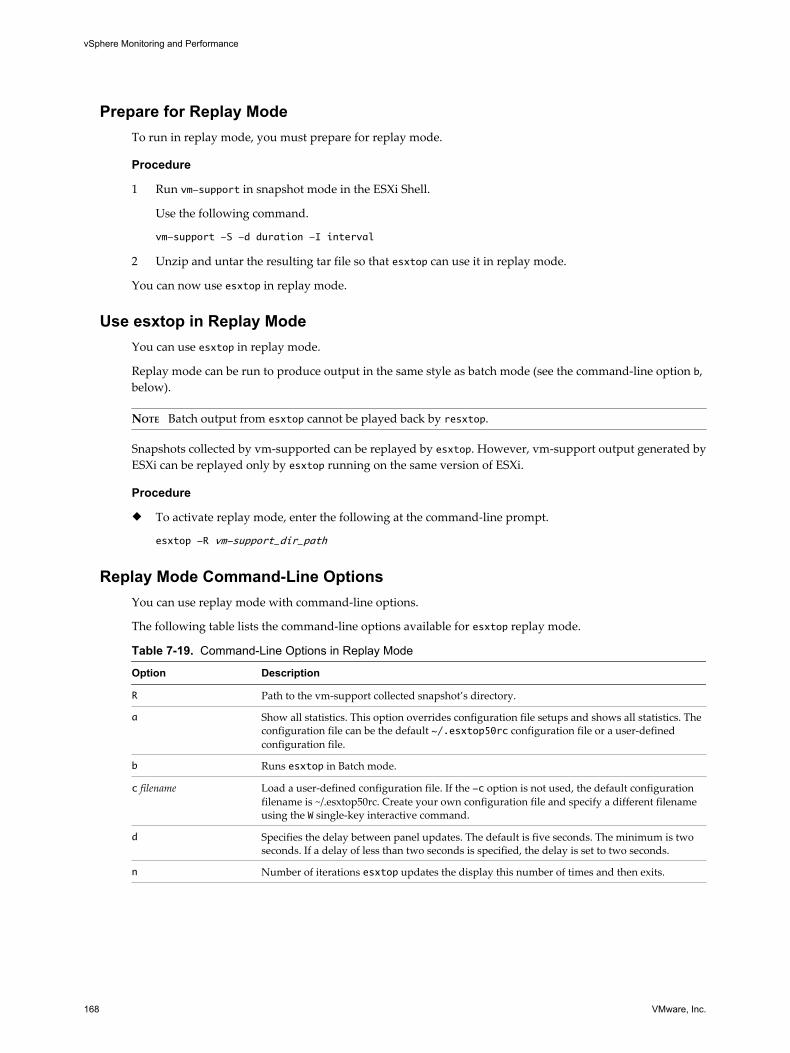
Prepare for Replay ModeTo run in replay mode, you must prepare for replay mode.
Procedure
1 Run vm-support in snapshot mode in the ESXi Shell.
Use the following command.
vm-support -S -d duration -I interval
2 Unzip and untar the resulting tar file so that esxtop can use it in replay mode.
You can now use esxtop in replay mode.
Use esxtop in Replay ModeYou can use esxtop in replay mode.
Replay mode can be run to produce output in the same style as batch mode (see the command-line option b,below).
NOTE Batch output from esxtop cannot be played back by resxtop.
Snapshots collected by vm-supported can be replayed by esxtop. However, vm-support output generated byESXi can be replayed only by esxtop running on the same version of ESXi.
Procedure
u To activate replay mode, enter the following at the command-line prompt.
esxtop -R vm-support_dir_path
Replay Mode Command-Line OptionsYou can use replay mode with command-line options.
The following table lists the command-line options available for esxtop replay mode.
Table 7-19. Command-Line Options in Replay Mode
Option Description
R Path to the vm-support collected snapshot’s directory.
a Show all statistics. This option overrides configuration file setups and shows all statistics. Theconfiguration file can be the default ~/.esxtop50rc configuration file or a user-definedconfiguration file.
b Runs esxtop in Batch mode.
c filename Load a user-defined configuration file. If the -c option is not used, the default configurationfilename is ~/.esxtop50rc. Create your own configuration file and specify a different filenameusing the W single-key interactive command.
d Specifies the delay between panel updates. The default is five seconds. The minimum is twoseconds. If a delay of less than two seconds is specified, the delay is set to two seconds.
n Number of iterations esxtop updates the display this number of times and then exits.
vSphere Monitoring and Performance
168 VMware, Inc.
Monitoring Networked Devices withSNMP and vSphere 8
Simple Network Management Protocol (SNMP) is commonly used by management programs to monitor avariety of networked devices.
vSphere systems run SNMP agents, which can provide information to a management program in at least oneof the following ways:
n In response to a GET, GETBULK, or GETNEXT operation, which is a specific request for information from themanagement system.
n By sending a notification which is an alert sent by the SNMP agent to notify the management system of aparticular event or condition.
Management Information Base (MIB) files define the information that can be provided by managed devices.The MIB files define managed objects, described by object identifiers (OIDs) and variables arranged in ahierarchy.
vCenter Server and ESXi have SNMP agents. The agent provided with each product has differing capabilities.
This chapter includes the following topics:
n “Using SNMP Traps with vCenter Server,” on page 169
n “Configure SNMP for ESXi,” on page 171
n “SNMP Diagnostics,” on page 179
n “Using SNMP with Guest Operating Systems,” on page 179
n “VMware MIB Files,” on page 180
n “SNMPv2 Diagnostic Counters,” on page 181
Using SNMP Traps with vCenter ServerThe SNMP agent included with vCenter Server can be used to send traps when the vCenter Server system isstarted and when an alarm is triggered on vCenter Server. The vCenter Server SNMP agent functions only asa trap emitter and does not support other SNMP operations, such as GET.
The traps sent by vCenter Server are typically sent to other management programs. You must configure yourmanagement server to interpret the SNMP traps sent by vCenter Server.
To use the vCenter Server SNMP traps, configure the SNMP settings on vCenter Server and configure yourmanagement client software to accept the traps from vCenter Server.
The traps sent by vCenter Server are defined in VMWARE-VC-EVENT-MIB.mib.
VMware, Inc. 169
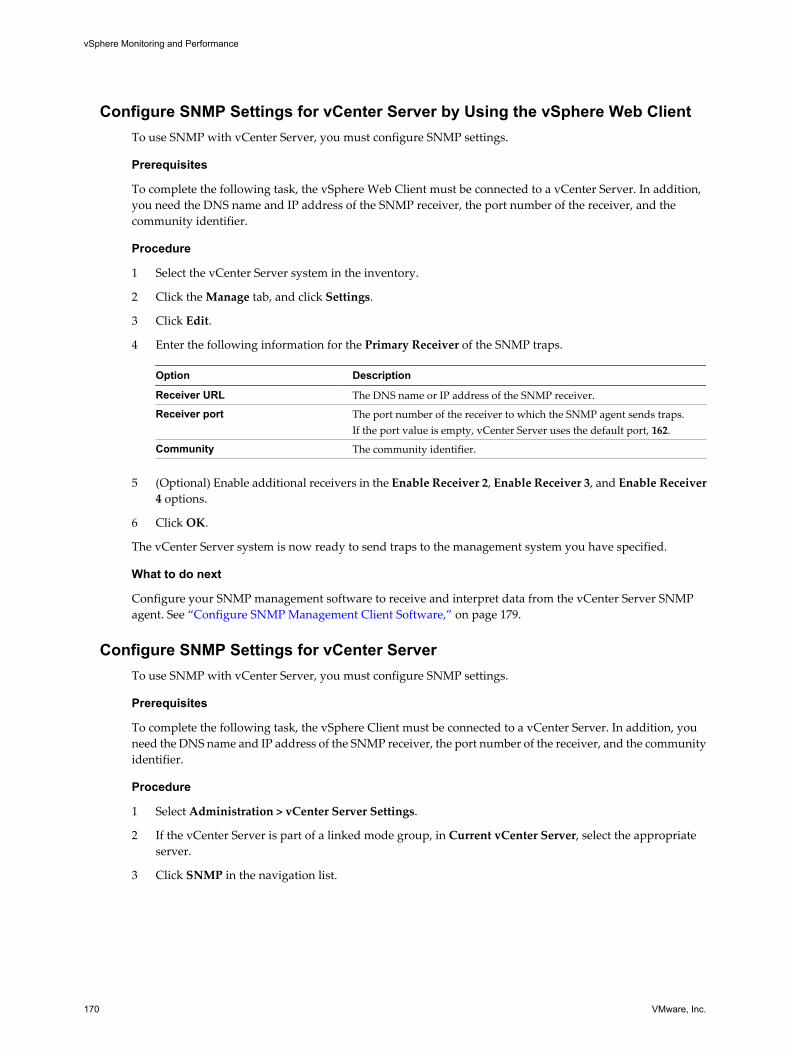
Configure SNMP Settings for vCenter Server by Using the vSphere Web ClientTo use SNMP with vCenter Server, you must configure SNMP settings.
Prerequisites
To complete the following task, the vSphere Web Client must be connected to a vCenter Server. In addition,you need the DNS name and IP address of the SNMP receiver, the port number of the receiver, and thecommunity identifier.
Procedure
1 Select the vCenter Server system in the inventory.
2 Click the Manage tab, and click Settings.
3 Click Edit.
4 Enter the following information for the Primary Receiver of the SNMP traps.
Option Description
Receiver URL The DNS name or IP address of the SNMP receiver.
Receiver port The port number of the receiver to which the SNMP agent sends traps.If the port value is empty, vCenter Server uses the default port, 162.
Community The community identifier.
5 (Optional) Enable additional receivers in the Enable Receiver 2, Enable Receiver 3, and Enable Receiver4 options.
6 Click OK.
The vCenter Server system is now ready to send traps to the management system you have specified.
What to do next
Configure your SNMP management software to receive and interpret data from the vCenter Server SNMPagent. See “Configure SNMP Management Client Software,” on page 179.
Configure SNMP Settings for vCenter ServerTo use SNMP with vCenter Server, you must configure SNMP settings.
Prerequisites
To complete the following task, the vSphere Client must be connected to a vCenter Server. In addition, youneed the DNS name and IP address of the SNMP receiver, the port number of the receiver, and the communityidentifier.
Procedure
1 Select Administration > vCenter Server Settings.
2 If the vCenter Server is part of a linked mode group, in Current vCenter Server, select the appropriateserver.
3 Click SNMP in the navigation list.
vSphere Monitoring and Performance
170 VMware, Inc.
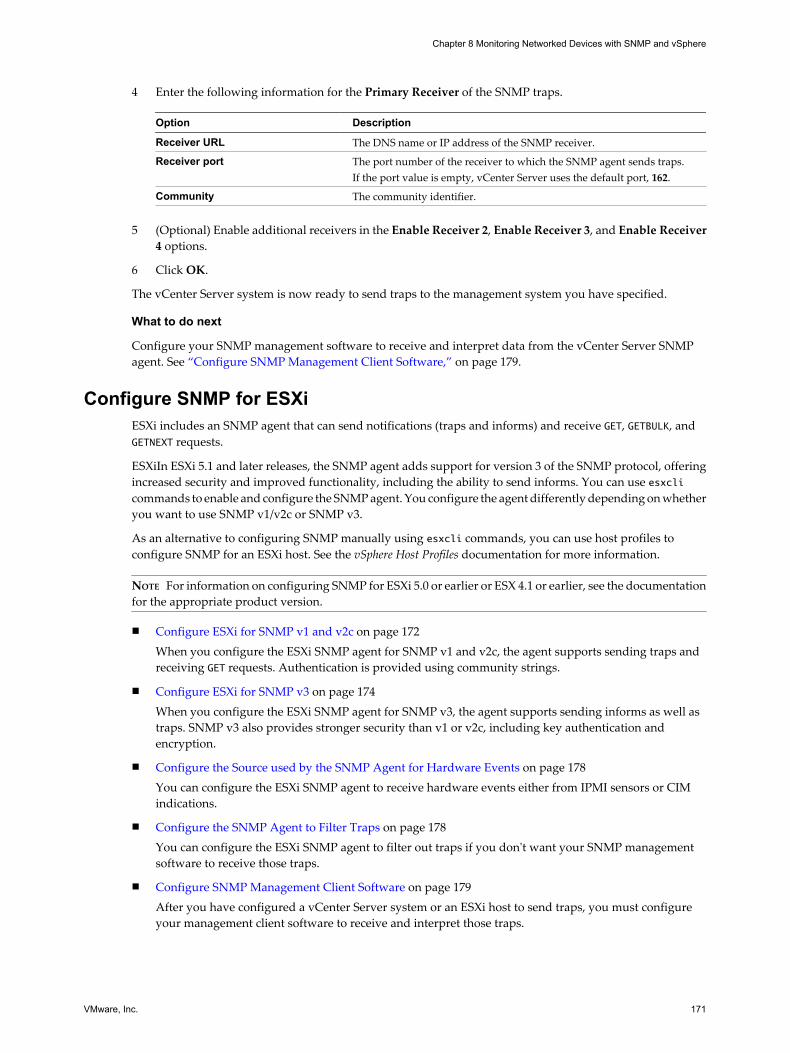
4 Enter the following information for the Primary Receiver of the SNMP traps.
Option Description
Receiver URL The DNS name or IP address of the SNMP receiver.
Receiver port The port number of the receiver to which the SNMP agent sends traps.If the port value is empty, vCenter Server uses the default port, 162.
Community The community identifier.
5 (Optional) Enable additional receivers in the Enable Receiver 2, Enable Receiver 3, and Enable Receiver4 options.
6 Click OK.
The vCenter Server system is now ready to send traps to the management system you have specified.
What to do next
Configure your SNMP management software to receive and interpret data from the vCenter Server SNMPagent. See “Configure SNMP Management Client Software,” on page 179.
Configure SNMP for ESXiESXi includes an SNMP agent that can send notifications (traps and informs) and receive GET, GETBULK, andGETNEXT requests.
ESXiIn ESXi 5.1 and later releases, the SNMP agent adds support for version 3 of the SNMP protocol, offeringincreased security and improved functionality, including the ability to send informs. You can use esxclicommands to enable and configure the SNMP agent. You configure the agent differently depending on whetheryou want to use SNMP v1/v2c or SNMP v3.
As an alternative to configuring SNMP manually using esxcli commands, you can use host profiles toconfigure SNMP for an ESXi host. See the vSphere Host Profiles documentation for more information.
NOTE For information on configuring SNMP for ESXi 5.0 or earlier or ESX 4.1 or earlier, see the documentationfor the appropriate product version.
n Configure ESXi for SNMP v1 and v2c on page 172When you configure the ESXi SNMP agent for SNMP v1 and v2c, the agent supports sending traps andreceiving GET requests. Authentication is provided using community strings.
n Configure ESXi for SNMP v3 on page 174When you configure the ESXi SNMP agent for SNMP v3, the agent supports sending informs as well astraps. SNMP v3 also provides stronger security than v1 or v2c, including key authentication andencryption.
n Configure the Source used by the SNMP Agent for Hardware Events on page 178You can configure the ESXi SNMP agent to receive hardware events either from IPMI sensors or CIMindications.
n Configure the SNMP Agent to Filter Traps on page 178You can configure the ESXi SNMP agent to filter out traps if you don't want your SNMP managementsoftware to receive those traps.
n Configure SNMP Management Client Software on page 179After you have configured a vCenter Server system or an ESXi host to send traps, you must configureyour management client software to receive and interpret those traps.
Chapter 8 Monitoring Networked Devices with SNMP and vSphere
VMware, Inc. 171
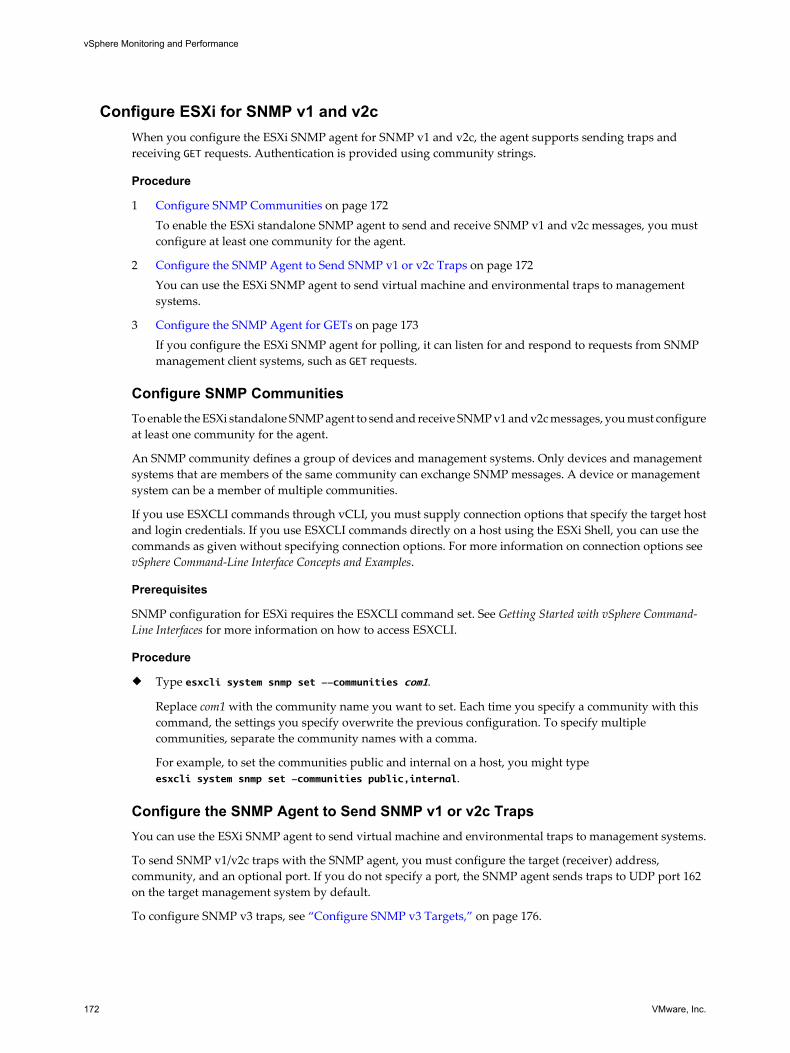
Configure ESXi for SNMP v1 and v2cWhen you configure the ESXi SNMP agent for SNMP v1 and v2c, the agent supports sending traps andreceiving GET requests. Authentication is provided using community strings.
Procedure
1 Configure SNMP Communities on page 172To enable the ESXi standalone SNMP agent to send and receive SNMP v1 and v2c messages, you mustconfigure at least one community for the agent.
2 Configure the SNMP Agent to Send SNMP v1 or v2c Traps on page 172You can use the ESXi SNMP agent to send virtual machine and environmental traps to managementsystems.
3 Configure the SNMP Agent for GETs on page 173If you configure the ESXi SNMP agent for polling, it can listen for and respond to requests from SNMPmanagement client systems, such as GET requests.
Configure SNMP CommunitiesTo enable the ESXi standalone SNMP agent to send and receive SNMP v1 and v2c messages, you must configureat least one community for the agent.
An SNMP community defines a group of devices and management systems. Only devices and managementsystems that are members of the same community can exchange SNMP messages. A device or managementsystem can be a member of multiple communities.
If you use ESXCLI commands through vCLI, you must supply connection options that specify the target hostand login credentials. If you use ESXCLI commands directly on a host using the ESXi Shell, you can use thecommands as given without specifying connection options. For more information on connection options seevSphere Command-Line Interface Concepts and Examples.
Prerequisites
SNMP configuration for ESXi requires the ESXCLI command set. See Getting Started with vSphere Command-Line Interfaces for more information on how to access ESXCLI.
Procedure
u Type esxcli system snmp set --communities com1.
Replace com1 with the community name you want to set. Each time you specify a community with thiscommand, the settings you specify overwrite the previous configuration. To specify multiplecommunities, separate the community names with a comma.
For example, to set the communities public and internal on a host, you might typeesxcli system snmp set -communities public,internal.
Configure the SNMP Agent to Send SNMP v1 or v2c TrapsYou can use the ESXi SNMP agent to send virtual machine and environmental traps to management systems.
To send SNMP v1/v2c traps with the SNMP agent, you must configure the target (receiver) address,community, and an optional port. If you do not specify a port, the SNMP agent sends traps to UDP port 162on the target management system by default.
To configure SNMP v3 traps, see “Configure SNMP v3 Targets,” on page 176.
vSphere Monitoring and Performance
172 VMware, Inc.
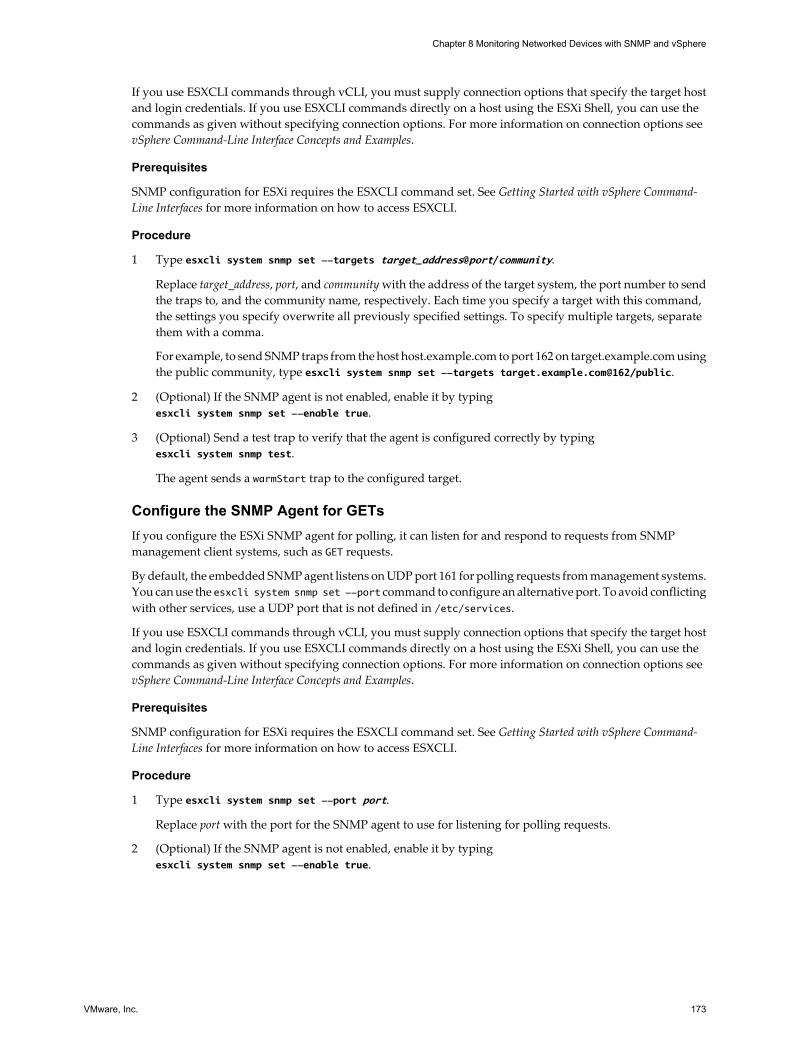
If you use ESXCLI commands through vCLI, you must supply connection options that specify the target hostand login credentials. If you use ESXCLI commands directly on a host using the ESXi Shell, you can use thecommands as given without specifying connection options. For more information on connection options seevSphere Command-Line Interface Concepts and Examples.
Prerequisites
SNMP configuration for ESXi requires the ESXCLI command set. See Getting Started with vSphere Command-Line Interfaces for more information on how to access ESXCLI.
Procedure
1 Type esxcli system snmp set --targets target_address@port/community.
Replace target_address, port, and community with the address of the target system, the port number to sendthe traps to, and the community name, respectively. Each time you specify a target with this command,the settings you specify overwrite all previously specified settings. To specify multiple targets, separatethem with a comma.
For example, to send SNMP traps from the host host.example.com to port 162 on target.example.com usingthe public community, type esxcli system snmp set --targets target.example.com@162/public.
2 (Optional) If the SNMP agent is not enabled, enable it by typingesxcli system snmp set --enable true.
3 (Optional) Send a test trap to verify that the agent is configured correctly by typingesxcli system snmp test.
The agent sends a warmStart trap to the configured target.
Configure the SNMP Agent for GETsIf you configure the ESXi SNMP agent for polling, it can listen for and respond to requests from SNMPmanagement client systems, such as GET requests.
By default, the embedded SNMP agent listens on UDP port 161 for polling requests from management systems.You can use the esxcli system snmp set --port command to configure an alternative port. To avoid conflictingwith other services, use a UDP port that is not defined in /etc/services.
If you use ESXCLI commands through vCLI, you must supply connection options that specify the target hostand login credentials. If you use ESXCLI commands directly on a host using the ESXi Shell, you can use thecommands as given without specifying connection options. For more information on connection options seevSphere Command-Line Interface Concepts and Examples.
Prerequisites
SNMP configuration for ESXi requires the ESXCLI command set. See Getting Started with vSphere Command-Line Interfaces for more information on how to access ESXCLI.
Procedure
1 Type esxcli system snmp set --port port.
Replace port with the port for the SNMP agent to use for listening for polling requests.
2 (Optional) If the SNMP agent is not enabled, enable it by typingesxcli system snmp set --enable true.
Chapter 8 Monitoring Networked Devices with SNMP and vSphere
VMware, Inc. 173
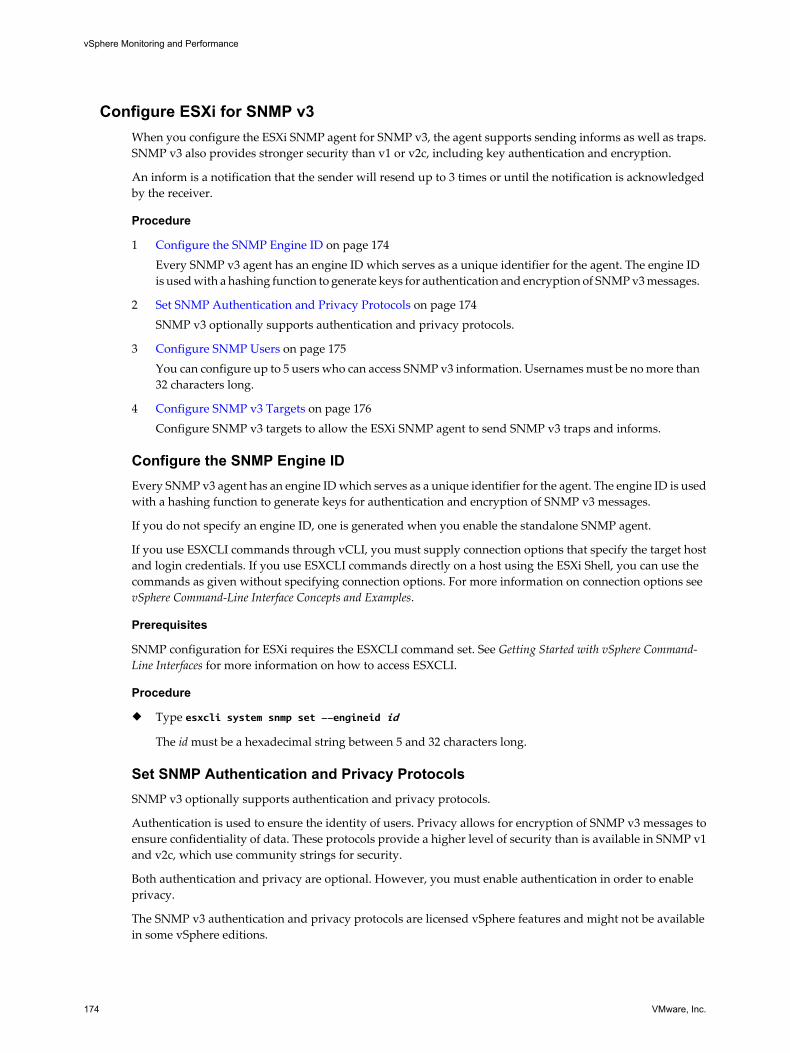
Configure ESXi for SNMP v3When you configure the ESXi SNMP agent for SNMP v3, the agent supports sending informs as well as traps.SNMP v3 also provides stronger security than v1 or v2c, including key authentication and encryption.
An inform is a notification that the sender will resend up to 3 times or until the notification is acknowledgedby the receiver.
Procedure
1 Configure the SNMP Engine ID on page 174Every SNMP v3 agent has an engine ID which serves as a unique identifier for the agent. The engine IDis used with a hashing function to generate keys for authentication and encryption of SNMP v3 messages.
2 Set SNMP Authentication and Privacy Protocols on page 174SNMP v3 optionally supports authentication and privacy protocols.
3 Configure SNMP Users on page 175You can configure up to 5 users who can access SNMP v3 information. Usernames must be no more than32 characters long.
4 Configure SNMP v3 Targets on page 176Configure SNMP v3 targets to allow the ESXi SNMP agent to send SNMP v3 traps and informs.
Configure the SNMP Engine IDEvery SNMP v3 agent has an engine ID which serves as a unique identifier for the agent. The engine ID is usedwith a hashing function to generate keys for authentication and encryption of SNMP v3 messages.
If you do not specify an engine ID, one is generated when you enable the standalone SNMP agent.
If you use ESXCLI commands through vCLI, you must supply connection options that specify the target hostand login credentials. If you use ESXCLI commands directly on a host using the ESXi Shell, you can use thecommands as given without specifying connection options. For more information on connection options seevSphere Command-Line Interface Concepts and Examples.
Prerequisites
SNMP configuration for ESXi requires the ESXCLI command set. See Getting Started with vSphere Command-Line Interfaces for more information on how to access ESXCLI.
Procedure
u Type esxcli system snmp set --engineid id
The id must be a hexadecimal string between 5 and 32 characters long.
Set SNMP Authentication and Privacy ProtocolsSNMP v3 optionally supports authentication and privacy protocols.
Authentication is used to ensure the identity of users. Privacy allows for encryption of SNMP v3 messages toensure confidentiality of data. These protocols provide a higher level of security than is available in SNMP v1and v2c, which use community strings for security.
Both authentication and privacy are optional. However, you must enable authentication in order to enableprivacy.
The SNMP v3 authentication and privacy protocols are licensed vSphere features and might not be availablein some vSphere editions.
vSphere Monitoring and Performance
174 VMware, Inc.
If you use ESXCLI commands through vCLI, you must supply connection options that specify the target hostand login credentials. If you use ESXCLI commands directly on a host using the ESXi Shell, you can use thecommands as given without specifying connection options. For more information on connection options seevSphere Command-Line Interface Concepts and Examples.
Prerequisites
SNMP configuration for ESXi requires the ESXCLI command set. See Getting Started with vSphere Command-Line Interfaces for more information on how to access ESXCLI.
Procedure
1 (Optional) To configure authentication, type esxcli system snmp set --authentication protocol.
Replace protocol with either none (for no authentication), SHA1, or MD5.
2 (Optional) To configure privacy, type esxcli system snmp set --privacy protocol.
Replace protocol with either none (for no privacy) or AES128.
Configure SNMP UsersYou can configure up to 5 users who can access SNMP v3 information. Usernames must be no more than 32characters long.
As part of configuring a user, you generate authentication and privacy hash values based on the user'sauthentication and privacy passwords and the SNMP agent's engine ID. If you change the engine ID, theauthentication protocol, or the privacy protocol after configuring users, the users are no longer valid and youmust reconfigure them.
If you use ESXCLI commands through vCLI, you must supply connection options that specify the target hostand login credentials. If you use ESXCLI commands directly on a host using the ESXi Shell, you can use thecommands as given without specifying connection options. For more information on connection options seevSphere Command-Line Interface Concepts and Examples.
Prerequisites
n Configure the authentication and privacy protocols before configuring users.
n Determine the authentication and privacy passwords for each user you will configure. Passwords mustbe a minimum of 7 characters long. VMware recommends storing these passwords in files on the hostsystem.
n SNMP configuration for ESXi requires the ESXCLI command set. See Getting Started with vSphere Command-Line Interfaces for more information on how to access ESXCLI.
Chapter 8 Monitoring Networked Devices with SNMP and vSphere
VMware, Inc. 175
Procedure
1 If you are using authentication or authentication and privacy, get the authentication and privacy hashvalues for the user by typing esxcli system snmp hash --auth-hash secret1 --priv-hash secret2.
Replace secret1 with the path to the file containing the user's authentication password and secret2 with thepath to the file containing the user's privacy password.
Alternatively, you can specify the flag --raw-secret and specify the passwords directly on the commandline.
For example, typingesxcli system snmp hash --auth-hash authsecret --priv-hash privsecret --raw-secret mightproduce the following output:
Authhash: 08248c6eb8b333e75a29ca0af06b224faa7d22d6
Privhash: 232ba5cbe8c55b8f979455d3c9ca8b48812adb97
The authentication and privacy hash values are displayed.
2 Configure the user by typing esxcli system snmp set --users userid/authhash/privhash/security.
Replace the parameters in the above command as follows.
Parameter Description
userid Replace with the user name.
authhash Replace with the authentication hash value.
privhash Replace with the privacy hash value.
security Replace with the level of security enabled for that user, which can be auth (for authentication only),priv (for authentication and privacy), or none (for no authentication or privacy).
For example: To configure user1 for access with authentication and privacy, you might typeesxcli system snmp set --users
user1/08248c6eb8b333e75a29ca0af06b224faa7d22d6/232ba5cbe8c55b8f979455d3c9ca8b48812adb97/priv.To configure user2 for access with no authentication or privacy, you might typeesxcli system snmp set --users user2/-/-/none.
3 (Optional) Test the user configuration by typingesxcli system snmp test --users username --auth-hash secret1 --priv-hash secret2.
If the configuration is correct, this command returns the message, "User username validated correctly usingengine id and security level: protocols," where protocols indicates the security protocols configured.
Configure SNMP v3 TargetsConfigure SNMP v3 targets to allow the ESXi SNMP agent to send SNMP v3 traps and informs.
SNMP v3 allows for sending both traps and informs. An inform is a message that the sender will resend amaximum of three times, waiting 5 seconds between each attempt, unless the message is acknowledged by thereceiver.
You can configure a maximum of three SNMP v3 targets, in addition to a maximum of three SNMP v1/v2ctargets.
To configure a target, you must specify a hostname or IP address of the system that will receive the traps orinforms, a user name, a security level, and whether to send traps or informs. The security level can be eithernone (for no security), auth (for authentication only), or priv (for authentication and privacy).
vSphere Monitoring and Performance
176 VMware, Inc.
If you use ESXCLI commands through vCLI, you must supply connection options that specify the target hostand login credentials. If you use ESXCLI commands directly on a host using the ESXi Shell, you can use thecommands as given without specifying connection options. For more information on connection options seevSphere Command-Line Interface Concepts and Examples.
Prerequisites
n Ensure that the users who will access the traps or informs are configured as SNMP users for both theESXi SNMP agent and the target management system.
n If you are configuring informs, you need the engine ID for the SNMP agent on the remote system that willreceive the informs.
n SNMP configuration for ESXi requires the ESXCLI command set. See Getting Started with vSphere Command-Line Interfaces for more information on how to access ESXCLI.
Procedure
1 (Optional) If you are configuring informs, configure the remote users by typingesxcli system snmp set --remote-users userid/auth-protocol/auth-hash/priv-protocol/priv-
hash/engine-id.
Replace the parameters in the above command as follows.
Parameter Description
userid Replace with the user name.
auth-protocol Replace with the authentication protocol, , none, MD5, or SHA1.
auth-hash Replace with the authentication hash or - if authentication is none.
priv-protocol Replace with the privacy protocol, AES128 or none.
priv-hash Replace with the privacy hash, or - if the privacy protocol is none.
engine-id Replace with the engine ID of the SNMP agent on the remote system that will receive the informs.
2 Type esxcli system snmp set --v3targets hostname@port/userid/secLevel/message-type.
Parameter Description
hostname Replace with the host name or IP address of the management system that will receive the traps orinforms.
port Replace with the port on the management system that will receive the traps or informs. If you do notspecify a port, the default port, 162, is used.
userid Replace with the user name.
secLevel Replace with either none, auth, or priv to indicate the level of authentication and privacy you haveconfigured. Use auth if you have configured authentication only, priv if you have configured bothauthentication and privacy, and none if you have configured neither.
message-type Replace with either trap or inform.
3 (Optional) If the SNMP agent is not enabled, enable it by typingesxcli system snmp set --enable true.
4 (Optional) Send a test notification to verify that the agent is configured correctly by typingesxcli system snmp test.
The agent sends a warmStart notification to the configured target.
Chapter 8 Monitoring Networked Devices with SNMP and vSphere
VMware, Inc. 177
Configure the Source used by the SNMP Agent for Hardware EventsYou can configure the ESXi SNMP agent to receive hardware events either from IPMI sensors or CIMindications.
IPMI sensors were used for hardware monitoring in ESX/ESXi 4.x and earlier. The conversion of CIMindications to SNMP notifications is available in ESXi 5.0 and later.
If you use ESXCLI commands through vCLI, you must supply connection options that specify the target hostand login credentials. If you use ESXCLI commands directly on a host using the ESXi Shell, you can use thecommands as given without specifying connection options. For more information on connection options seevSphere Command-Line Interface Concepts and Examples.
Prerequisites
SNMP configuration for ESXi requires the ESXCLI command set. See Getting Started with vSphere Command-Line Interfaces for more information on how to access ESXCLI.
Procedure
1 Configure the source for hardware events.
Option Command
IPMI sensors esxcli system snmp set --hwsrc sensors
CIM indications esxcli system snmp set --hwsrc indications
2 (Optional) If the SNMP agent is not enabled, enable it by typingesxcli system snmp set --enable true.
Configure the SNMP Agent to Filter TrapsYou can configure the ESXi SNMP agent to filter out traps if you don't want your SNMP management softwareto receive those traps.
Prerequisites
SNMP configuration for ESXi requires the ESXCLI command set. See Getting Started with vSphere Command-Line Interfaces for more information on how to access ESXCLI.
Procedure
1 From the vSphere CLI, esxcli system snmp set --notraps oid_list
oid_list is a list of OIDs for the traps to filter, separated by commas. This list replaces any OIDs that werepreviously specificed using this command.
For example, to filter out coldStart (OID 1.3.6.1.4.1.6876.4.1.1.0) and warmStart (OID1.3.6.1.4.1.6876.4.1.1.1) traps, typeesxcli system snmp set --notraps 1.3.6.1.4.1.6876.4.1.1.0,1.3.6.1.4.1.6876.4.1.1.1 .
2 (Optional) If the SNMP agent is not enabled, enable it by typingesxcli system snmp set --enable true.
The traps identified by the specified OIDs are filtered out of the output of the SNMP agent, and are not sentto SNMP management software.
What to do next
To clear all trap filters, type esxcli system snmp set --notraps reset.
vSphere Monitoring and Performance
178 VMware, Inc.
Configure SNMP Management Client SoftwareAfter you have configured a vCenter Server system or an ESXi host to send traps, you must configure yourmanagement client software to receive and interpret those traps.
To configure your management client software, specify the communities for the managed device, configurethe port settings, and load the VMware MIB files. See the documentation for your management system forspecific instructions for these steps.
Prerequisites
To complete this task, download the VMware MIB files from the VMware Web site: http://communities.vmware.com/community/developer/managementapi.
Procedure
1 In your management software, specify the vCenter Server or ESXi host as an SNMP-based managed device.
2 If you are using SNMP v1 or v2c, set up appropriate community names in the management software.
These names must correspond to the communities set for the SNMP agent on the vCenter Server systemor ESXi host.
3 If you are using SNMP v3, configure users and authentication and privacy protocols to match thoseconfigured on the ESXi host.
4 If you configured the SNMP agent to send traps to a port on the management system other than the defaultUDP port 162, configure the management client software to listen on the port you configured.
5 Load the VMware MIBs into the management software so you can view the symbolic names for the vCenterServer or host variables.
To prevent lookup errors, load these MIB files in the following order before loading other MIB files:
a VMWARE-ROOT-MIB.mib
b VMWARE-TC-MIB.mib
c VMWARE-PRODUCTS-MIB.mib
The management software can now receive and interpret traps from vCenter Server or ESXi hosts.
SNMP DiagnosticsYou can use SNMP tools to diagnose configuration problems.
n Type esxcli system snmp test at the vSphere command-line interface to prompt the SNMP agent to senda test warmStart trap.
n Type esxcli system snmp get to display the current configuration of the SNMP agent.
n The SNMPv2-MIB.mib file provides a number of counters to aid in debugging SNMP problems. See “SNMPv2 Diagnostic Counters,” on page 181.
n The VMWARE-AGENTCAP-MIB.mib file defines the capabilities of the VMware SNMP agents by productversion. Use this file to determine if the SNMP functionality that you want to use is supported.
Using SNMP with Guest Operating SystemsYou can use SNMP to monitor guest operating systems or applications running in virtual machines.
The virtual machine uses its own virtual hardware devices. Do not install agents in the virtual machines thatare intended to monitor physical hardware.
Chapter 8 Monitoring Networked Devices with SNMP and vSphere
VMware, Inc. 179
Procedure
u Install the SNMP agents you normally would use for that purpose in the guest operating systems.
VMware MIB FilesVMware MIB files define the information provided by ESXi hosts and vCenter Server to SNMP managementsoftware.
You can download these MIB files from http://communities.vmware.com/community/developer/forums/managementapi#http://communities.vmware.com/community/developer/forums/managementapi/SNMP-MIB.
Table 8-1 lists the MIB files provided by VMware and describes the information that each file provides.
Table 8-1. VMware MIB Files
MIB File Description
VMWARE-ROOT-MIB.mib Contains VMware’s enterprise OID and top level OID assignments.
VMWARE-AGENTCAP-MIB.mib Defines the capabilities of the VMware agents by product versions. This file isoptional and might not be supported by all management systems.
VMWARE-CIMOM-MIB.mib Defines variables and trap types used to report on the state of the CIM ObjectManagement subsystem.
VMWARE-ENV-MIB.mib Defines variables and trap types used to report on the state of physical hardwarecomponents of the host computer. Enables conversion of CIM indications toSNMP traps.
VMWARE-OBSOLETE-MIB.mib For use with versions of ESX/ESXi prior to 4.0. Defines OIDs that have beenmade obsolete to maintain backward compatibility with earlier versions ofESX/ESXi. Includes variables formerly defined in the files VMWARE-TRAPS-MIB.mib and VMWARE-VMKERNEL-MIB.mib.
VMWARE-PRODUCTS-MIB.mib Defines OIDs to uniquely identify each SNMP agent on each VMware platformby name, version, and build platform.
VMWARE-RESOURCES-MIB.mib Defines variables used to report information on resource usage of the VMkernel,including physical memory, CPU, and disk utilization.
VMWARE-SYSTEM-MIB.mib The VMWARE-SYSTEM-MIB.mib file is obsolete. Use the SNMPv2-MIB to obtaininformation from sysDescr.0 and sysObjec ID.0.
VMWARE-TC-MIB.mib Defines common textual conventions used by VMware MIB files.
VMWARE-VC-EVENTS-MIB.mib Defines traps sent by vCenter Server. Load this file if you use vCenter Server tosend traps.
VMWARE-VMINFO-MIB.mib Defines variables for reporting information about virtual machines, includingvirtual machine traps.
Table 8-2 lists MIB files included in the VMware MIB files package that are not created by VMware. These canbe used with the VMware MIB files to provide additional information.
Table 8-2. Other MIB Files
MIB File Description
ENTITY-MIB.mib Allows the description of relationships between physicalentities and logical entities managed by the same SNMPagent. See RFC 4133 for more information.
HOST-RESOURCES-MIB.mib Defines objects that are useful for managing host computers.
HOST-RESOURCES-TYPES.mib Defines storage, device, and filesystem types for use withHOST-RESOURCES-MIB.mib.
vSphere Monitoring and Performance
180 VMware, Inc.
Table 8-2. Other MIB Files (Continued)
MIB File Description
IEEE8021-BRIDGE-MIB Defines objects for managing devices that support IEEE802.1D.
IEEE8023-LAG-MIB Defines objects for managing devices that support IEEE802.3ad link aggregation.
IEEE8021-Q-BRIDGE-MIB Defines objects for managing Virtual Bridged Local AreaNetworks.
IF-MIB.mib Defines attributes related to physical NICs on the hostsystem.
IP-MIB.mib Defines objects for managing implementations of theInternet Protocol (IP) in an IP version independent manner.
IP-FORWARD-MIB.mib Defines objects for managing IP forwarding.
LLDP-V2-MIB.mib Defines objects for managing devices using Linked LayerDiscovery Protocol (LLDP).
SNMPv2-CONF.mib Defines conformance groups for MIBs.
SNMPv2-MIB.mib Defines the SNMP version 2 MIB objects.
SNMPv2-SMI.mib Defines the Structure of Managment Information for SNMPversion 2.
SNMPv2-TC.mib Defines textual conventions for SNMP version 2.
TCP-MIB.mib Defines objects for managing devices using the TCP protocol.
UDP-MIB.mib Defines objects for managing devices using the UDPprotocol.
SNMPv2 Diagnostic CountersThe SNMPv2-MIB.mib file provides a number of counters to aid in debugging SNMP problems.
Table 8-3 lists some of these diagnostic counters.
Table 8-3. Diagnostic Counters from SNMPv2-MIB
Variable ID Mapping Description
snmpInPkts snmp 1 The total number of messages delivered to the SNMP entityfrom the transport service.
snmpInBadVersions snmp 3 The total number of SNMP messages that were deliveredto the SNMP entity and were for an unsupported SNMPversion.
snmpInBadCommunityNames snmp 4 The total number of community-based SNMP messagesdelivered to the SNMP entity that used an invalid SNMPcommunity name.
snmpInBadCommunityUses snmp 5 The total number of community-based SNMP messagesdelivered to the SNMP entity that represented an SNMPoperation that was not allowed for the community namedin the message.
snmpInASNParseErrs snmp 6 The total number of ASN.1 or BER errors encountered bythe SNMP entity when decoding received SNMP messages.
snmpEnableAuthenTraps snmp 30 Indicates whether the SNMP entity is permitted to generateauthenticationFailure traps. The value of this objectoverrides any configuration information. It thereforeprovides a means of disabling all authenticationFailuretraps.
Chapter 8 Monitoring Networked Devices with SNMP and vSphere
VMware, Inc. 181
Table 8-3. Diagnostic Counters from SNMPv2-MIB (Continued)
Variable ID Mapping Description
snmpSilentDrops snmp 31 The total number of Confirmed Class PDUs delivered tothe SNMP entity that were silently dropped because thesize of a reply containing an alternate Response Class PDUwith an empty variable-bindings field was greater thaneither a local constraint or the maximum message sizeassociated with the originator of the request.
snmpProxyDrops snmp 32 The total number of Confirmed Class PDUs delivered tothe SNMP entity that were silently dropped because thetransmission of the message to a proxy target failed in amanner other than a time-out such that no Response ClassPDU could be returned.
vSphere Monitoring and Performance
182 VMware, Inc.
System Log Files 9In addition to lists of events and alarms, vSphere components generate assorted logs.
These logs contain additional information about activities in your vSphere environment.
This chapter includes the following topics:
n “View System Log Entries,” on page 183
n “View System Logs on an ESXi Host,” on page 183
n “External System Logs,” on page 184
n “Export System Log Files,” on page 184
n “Configure Syslog on ESXi Hosts,” on page 185
n “Collecting Log Files,” on page 186
n “Viewing Log Files with the Log Browser in the vSphere Web Client,” on page 188
View System Log EntriesYou can view system logs generated by vSphere components.
Procedure
1 From the Home page of a vSphere Client connected to either a vCenter Server system or an ESXi host,click System Logs.
2 From the drop-down menu, select the log and entry you want to view.
3 Select View > Filtering to refer to the filtering options.
4 Enter text in the data field.
5 Click Clear to empty the data field.
View System Logs on an ESXi HostYou can use the direct console interface to view the system logs on an ESXi host. These logs provide informationabout system operational events.
Procedure
1 From the direct console, select View System Logs.
2 Press a corresponding number key to view a log.
vCenter Server agent (vpxa) logs appear if the host is managed by vCenter Server.
VMware, Inc. 183
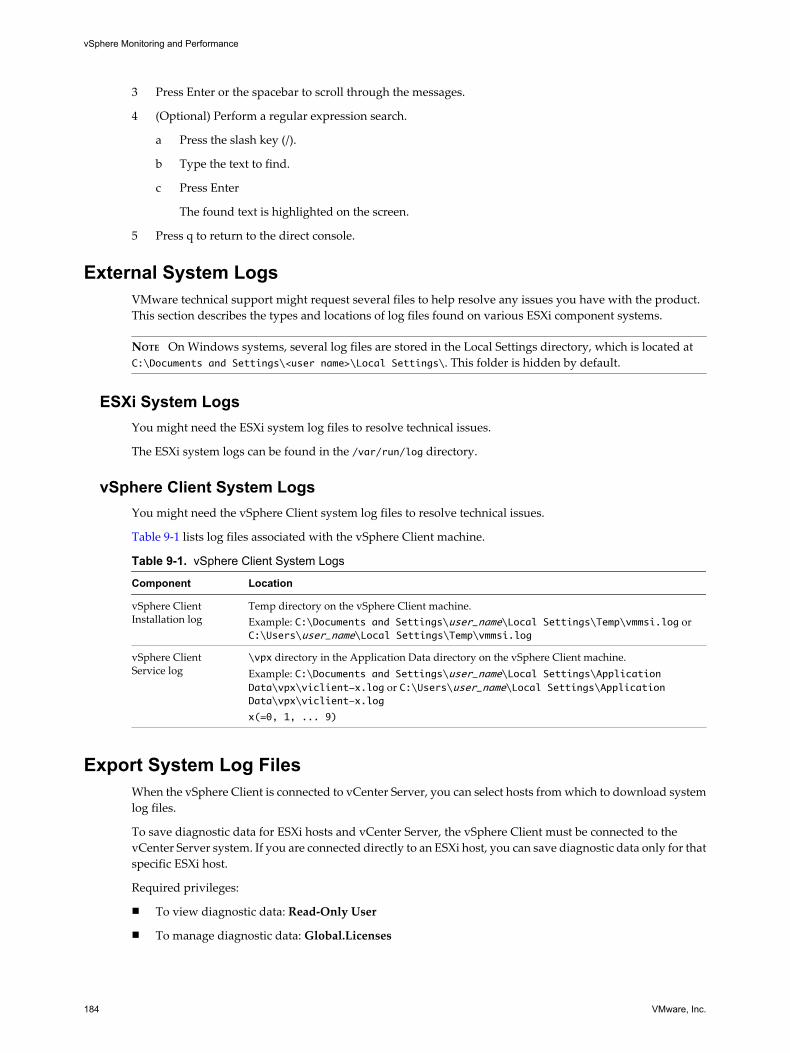
3 Press Enter or the spacebar to scroll through the messages.
4 (Optional) Perform a regular expression search.
a Press the slash key (/).
b Type the text to find.
c Press Enter
The found text is highlighted on the screen.
5 Press q to return to the direct console.
External System LogsVMware technical support might request several files to help resolve any issues you have with the product.This section describes the types and locations of log files found on various ESXi component systems.
NOTE On Windows systems, several log files are stored in the Local Settings directory, which is located atC:\Documents and Settings\<user name>\Local Settings\. This folder is hidden by default.
ESXi System LogsYou might need the ESXi system log files to resolve technical issues.
The ESXi system logs can be found in the /var/run/log directory.
vSphere Client System LogsYou might need the vSphere Client system log files to resolve technical issues.
Table 9-1 lists log files associated with the vSphere Client machine.
Table 9-1. vSphere Client System Logs
Component Location
vSphere ClientInstallation log
Temp directory on the vSphere Client machine.Example: C:\Documents and Settings\user_name\Local Settings\Temp\vmmsi.log orC:\Users\user_name\Local Settings\Temp\vmmsi.log
vSphere ClientService log
\vpx directory in the Application Data directory on the vSphere Client machine.Example: C:\Documents and Settings\user_name\Local Settings\ApplicationData\vpx\viclient-x.log or C:\Users\user_name\Local Settings\ApplicationData\vpx\viclient-x.log
x(=0, 1, ... 9)
Export System Log FilesWhen the vSphere Client is connected to vCenter Server, you can select hosts from which to download systemlog files.
To save diagnostic data for ESXi hosts and vCenter Server, the vSphere Client must be connected to thevCenter Server system. If you are connected directly to an ESXi host, you can save diagnostic data only for thatspecific ESXi host.
Required privileges:
n To view diagnostic data: Read-Only User
n To manage diagnostic data: Global.Licenses
vSphere Monitoring and Performance
184 VMware, Inc.
Procedure
1 Select File > Export > Export System Logs.
2 If you are connected to vCenter Server, select the object for which you want to export data.
Selecting an object selects all of its child objects.
3 If you are connected to vCenter Server, select Include information from vCenter Server and vSphereClient to download vCenter Server and vSphere Client log files and host log files, and click Next.
4 If the selected host supports manifest driven exports of system log files, select the system log files to collect.Select the specific system log files to download.
If the host does not support manifest exports of log files, all system log files are exported.
5 Select Gather performance data to include performance data information in the log files. Click Next.
You can update the duration and interval time you want the data collected.
6 Click Next.
7 Click Browse and specify the location to which to save the log files.
The host or vCenter Server generates .zip bundles containing the log files. The Recent Tasks panel showsthe Generate diagnostic bundles task in progress.
8 Click Next.
The Downloading Log Bundles dialog box appears when the Generating Diagnostic Bundle task isfinished. The download status of each bundle appears in the dialog box.
Some network errors can cause download failures. When you select an individual download in the dialogbox, the error message for that operation appears under the name and location of the log bundle file.
9 Verify the information in the Summary and click Finish to download the log files.
10 If the download fails, click Retry to attempt to download the generated bundles again.
Diagnostic bundles containing log files for the specified objects are downloaded to the location specified.
Configure Syslog on ESXi HostsAll ESXi hosts run a syslog service (vmsyslogd), which logs messages from the VMkernel and other systemcomponents to log files.
You can use the vSphere Client or the esxcli system syslog vCLI command to configure the syslog service.
For more information about using vCLI commands, see Getting Started with vSphere Command-Line Interfaces.
Procedure
1 In the vSphere Client inventory, select the host.
2 Click the Configuration tab.
3 In the Software panel, click Advanced Settings.
4 Select Syslog in the tree control.
Chapter 9 System Log Files
VMware, Inc. 185
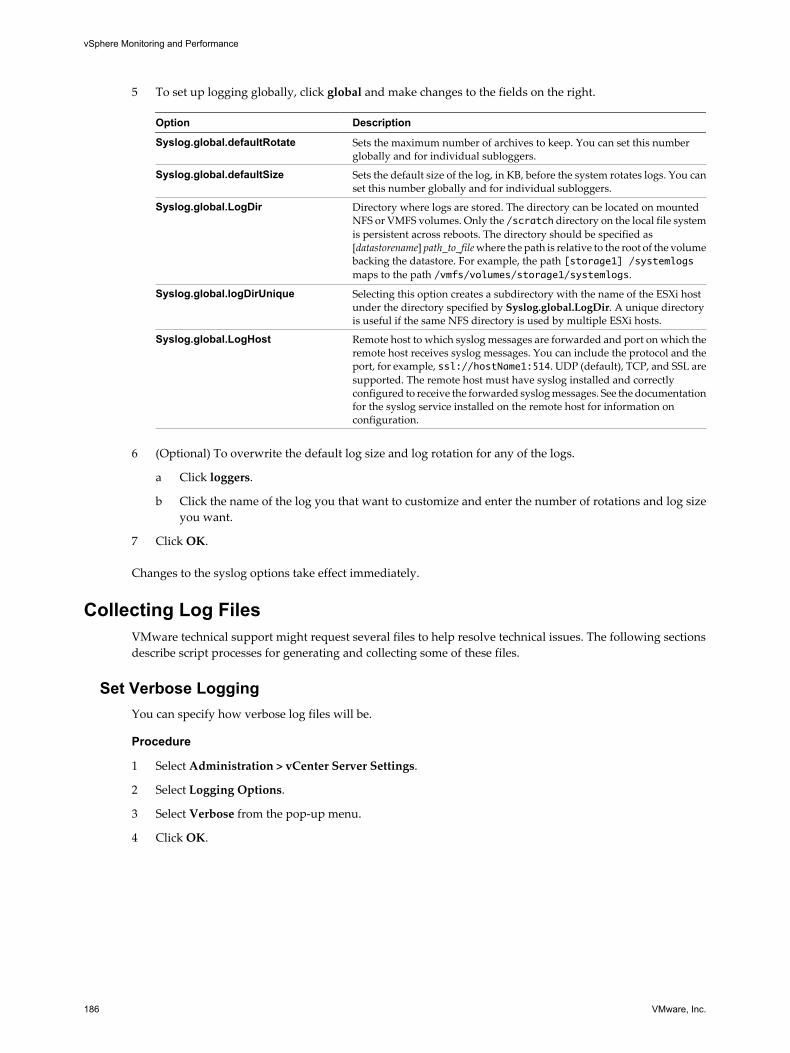
5 To set up logging globally, click global and make changes to the fields on the right.
Option Description
Syslog.global.defaultRotate Sets the maximum number of archives to keep. You can set this numberglobally and for individual subloggers.
Syslog.global.defaultSize Sets the default size of the log, in KB, before the system rotates logs. You canset this number globally and for individual subloggers.
Syslog.global.LogDir Directory where logs are stored. The directory can be located on mountedNFS or VMFS volumes. Only the /scratch directory on the local file systemis persistent across reboots. The directory should be specified as[datastorename] path_to_file where the path is relative to the root of the volumebacking the datastore. For example, the path [storage1] /systemlogsmaps to the path /vmfs/volumes/storage1/systemlogs.
Syslog.global.logDirUnique Selecting this option creates a subdirectory with the name of the ESXi hostunder the directory specified by Syslog.global.LogDir. A unique directoryis useful if the same NFS directory is used by multiple ESXi hosts.
Syslog.global.LogHost Remote host to which syslog messages are forwarded and port on which theremote host receives syslog messages. You can include the protocol and theport, for example, ssl://hostName1:514. UDP (default), TCP, and SSL aresupported. The remote host must have syslog installed and correctlyconfigured to receive the forwarded syslog messages. See the documentationfor the syslog service installed on the remote host for information onconfiguration.
6 (Optional) To overwrite the default log size and log rotation for any of the logs.
a Click loggers.
b Click the name of the log you that want to customize and enter the number of rotations and log sizeyou want.
7 Click OK.
Changes to the syslog options take effect immediately.
Collecting Log FilesVMware technical support might request several files to help resolve technical issues. The following sectionsdescribe script processes for generating and collecting some of these files.
Set Verbose LoggingYou can specify how verbose log files will be.
Procedure
1 Select Administration > vCenter Server Settings.
2 Select Logging Options.
3 Select Verbose from the pop-up menu.
4 Click OK.
vSphere Monitoring and Performance
186 VMware, Inc.
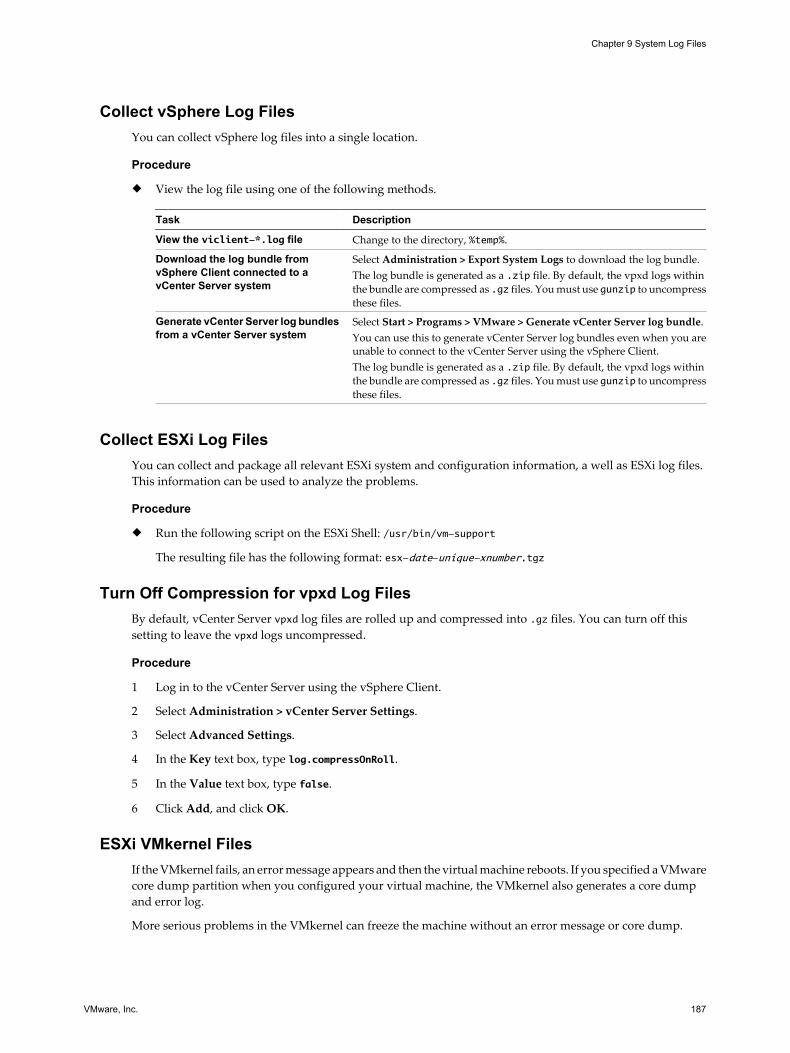
Collect vSphere Log FilesYou can collect vSphere log files into a single location.
Procedure
u View the log file using one of the following methods.
Task Description
View the viclient-*.log file Change to the directory, %temp%.
Download the log bundle fromvSphere Client connected to avCenter Server system
Select Administration > Export System Logs to download the log bundle.The log bundle is generated as a .zip file. By default, the vpxd logs withinthe bundle are compressed as .gz files. You must use gunzip to uncompressthese files.
Generate vCenter Server log bundlesfrom a vCenter Server system
Select Start > Programs > VMware > Generate vCenter Server log bundle.You can use this to generate vCenter Server log bundles even when you areunable to connect to the vCenter Server using the vSphere Client.The log bundle is generated as a .zip file. By default, the vpxd logs withinthe bundle are compressed as .gz files. You must use gunzip to uncompressthese files.
Collect ESXi Log FilesYou can collect and package all relevant ESXi system and configuration information, a well as ESXi log files.This information can be used to analyze the problems.
Procedure
u Run the following script on the ESXi Shell: /usr/bin/vm-support
The resulting file has the following format: esx-date-unique-xnumber.tgz
Turn Off Compression for vpxd Log FilesBy default, vCenter Server vpxd log files are rolled up and compressed into .gz files. You can turn off thissetting to leave the vpxd logs uncompressed.
Procedure
1 Log in to the vCenter Server using the vSphere Client.
2 Select Administration > vCenter Server Settings.
3 Select Advanced Settings.
4 In the Key text box, type log.compressOnRoll.
5 In the Value text box, type false.
6 Click Add, and click OK.
ESXi VMkernel FilesIf the VMkernel fails, an error message appears and then the virtual machine reboots. If you specified a VMwarecore dump partition when you configured your virtual machine, the VMkernel also generates a core dumpand error log.
More serious problems in the VMkernel can freeze the machine without an error message or core dump.
Chapter 9 System Log Files
VMware, Inc. 187
Viewing Log Files with the Log Browser in the vSphere Web ClientYou can view, search, and export one or more vCenter Server and ESXi log files at a time using the log browser.
You can also export, manage, and view different log types.
Retrieve LogsWhen you retrieve logs for a host or vCenter Server, you can use these logs to view, search, filter, and comparewith other system logs.
Procedure
1 Navigate to the host or vCenter Server that contain the logs you want to retrieve.
2 Click the Monitor tab.
3 Click Log Browser.
4 (Optional) If no logs for the host or vCenter Server are available, click Retrieve now to retrieve the logsfor that object.
The retrieved logs are based on a current snapshot of the system. Retrieving logs can take a few minutes.You can perform other tasks while the logs are being retrieved.
5 (Optional) Click Refresh to retrieve newer logs.
6 Select the type of log you want to browse.
The log displays in the browser.
Search Log FilesYou can search the log files by text or by time.
Prerequisites
If the log is unavailable, you must retrieve it. See “Retrieve Logs,” on page 188.
Procedure
1 Navigate to the Log Browser.
2 Select the type of log you want to browse.
3 In the Actions menu, select either Find by Text or Find by Time.
4 In the search area at the bottom of the Log Browser type the text or select the time you want to search.
5 Click Next to view the next line containing the text or time searched or Previous to view the previous line.
The Log Browser displays the line (in the 3rd row) that contains the text or time you searched.
Filter Log FilesThe Log Browser displays filtered searches.
Procedure
1 Navigate to the Log Browser and select a log file to browse.
2 Select the number of Adjacent lines you want the Log Browser to display.
vSphere Monitoring and Performance
188 VMware, Inc.
3 Type the text that you want filtered in the search box.
When displaying adjacent lines, groups of consecutive entries are highlighted with a different backgroundcolor.
The log browser displays the lines in the log that contain the word you typed, along with the number of adjacent(before and after) lines.
Create Advanced Log FiltersYou can create and save log file filters to your local system.
Procedure
1 Navigate to the Log Browser and retrieve a log file object.
2 Click Advanced filter.
3 Enter the conditions you want included in the filter.
4 Type a filter name.
5 Click Save to save the filter.
The filter is saved on the vSphere Web Client server and is available the next time you start thevSphere Web Client.
6 Click Filter to view the results in the Log Browser.
What to do next
You can load saved filters from your local system by clicking Save to local system. The filters are saved inXML format. You can also load filters from an XML file from your local system by clicking Load from localsystem.
Adjust Log TimesYou might want to adjust the times in the log files to a different time zone or to compare multiple log files.
Procedure
1 Navigate to the Log Browser and retrieve a log file from an object.
2 In the Actions menu, select Adjust by Time.
3 Select Add or Subtract and adjust the days, hours, minutes, seconds, or milliseconds from the originaltime stamps in the log.
The adjusted time stamp appears.
4 (Optional) Click Reset to adjust the time stamp back to the original times.
5 Click Apply.
The log browser displays the log entries with the adjusted times.
Export Logs from the Log BrowserYou can export log files using the Log Browser.
Procedure
1 Navigate to the Log Browser and select an object to browse.
2 Select Action > Export.
Chapter 9 System Log Files
VMware, Inc. 189
3 Select the type of file that you want to export.
Selecting the log file bundle downloads a potentially large file.
4 Click Export.
After a few seconds a new web browser displays.
5 Enter the location where you want to save the file.
The log file is downloaded to your local machine and you can close the new browser window.
Compare Log FilesYou can open multiple windows in the Log Browser to compare log files.
Procedure
1 Navigate to the Log Browser and retrieve a log file from an object.
2 Select Actions > New Browser Window to open a window in the Log Browser.
3 In the Log Browser window, retrieve another log file to view.
You can perform the same actions with the log file opened in the new window as you can with the originalLog Browser window.
Manage Logs Using the Log BrowserFrom the Log Browser, you can update, remove, and see a list of available log file bundles.
To manage log file bundles, you must access the Log Browser from the vSphere Web Clienthome.
Procedure
1 From the vSphere Web Client home, click Log Browser.
2 Click the Manage tab.
3 Select an object's log file in the list of sources.
4 (Optional) Click Remove to delete the log file bundle.
Deleting the log file bundle reclaims disk space on the vSphere Web Client server.
All log files generated from that bundle are deleted.
5 (Optional) Click Update to update the list of log file bundles.
You can view the log bundles created by other vSphere Web Client sessions.
The log does not appear in the retrievable objects list.
Browse Log Files from Different ObjectsYou can browse multiple log files coming from different objects within the Log Browser at the same time. Thisis helpful if you want to simultaneously compare log files.
Procedure
1 From the vSphere Web Client home, click Log Browser.
2 Click the View tab.
3 Select an object (ESXi host or vCenter Server) to view its logs.
4 Open a new browser window by selecting Actions > New Browser Window and select another object toview its logs.
vSphere Monitoring and Performance
190 VMware, Inc.
Index
Aadvanced charts, set as default 95alarm actions
described 121disabling 135email notifications 131, 140notification traps 129, 138running a script 129, 138setting up 129, 138
alarm environment variables 134, 143alarms
acknowledging triggered alarms 143, 144commands 132, 141condition or state-based 128, 137create 126, 135definitions 125described 121disabling actions 135frequency 129general settings 127, 136network 131, 132, 140, 141notification emails 129, 138reporting settings 129resetting triggered event alarms 144, 145scripts 132, 133, 141, 142send email as alarm action 130, 139set on inventory object 126, 135SMTP settings 130, 139SNMP traps 131, 132, 140, 141trigger tolerance limits 129triggered 125triggers 128, 137viewing 125
alarms,disabled actions 145alarms,environment variables 132, 133, 141,
142alarms,triggers 128, 137alarms,view settings 127, 136authentication, SNMP 174
Bbar charts, description 10batch mode
command-line options 167preparing for 166
Ccable/interconnect, health monitoring 109charts
adding custom to Switch to menu 97advanced 94customizing 94–96exporting data 99saving data to a file 98, 99settings 95, 96viewing 14, 15See also performance charts
charts,empty 104CIM indications, SNMP 178cluster charts 17clusters
CPU usage (MHz) 17disk usage 18memory data counters 21
memory usagehosts 23resource pools and virtual
machines 23network usage 24
collection intervals 9collection levels 9commands, alarms 132, 141communities, SNMP 172core dumps 187counters
data 11host 75virtual machine 75
CPU, health monitoring 109CPU panel
esxtop 154resxtop 154
CPU Power panelesxtop 157resxtop 157
CPU system time, fault tolerance virtualmachines 88
CPU usage (%)hosts 35
resource pools, virtual machines 59virtual machines 37, 68
VMware, Inc. 191
CPU usage (MHz)clusters 17
datacenters, clusters 25fault tolerance virtual machines 88hosts 18, 36resource pools 58resource pools and virtual machines 18vApps 64virtual machines 65, 69
CPU used time, fault tolerance virtualmachines 89
CPU,troubleshooting 100create alarms 126, 135
Ddata collection interval 13data collection levels 14data counter 11datacenter charts 25datacenters
CPU usage (MHz), clusters 25disk space by datastores 26disk space by file type 27memory usage, clusters 26
datastore, troubleshooting 102datastore charts 28datastore latency 35datastores
disk space by file type 29disk space by virtual machine 31disk space data counters 28
diagnostic bundles, generating 184diagnostic data
creating report 184export 184exporting 184
diagnostics, SNMP 181disk latency, hosts 32, 44disk rate
hosts 31–34, 40, 43, 92–94virtual machines 71
disk sizehosts 41virtual machines 73
disk spacedatacenter, datastores 26datacenter, file types 27datastores, file types 29datastores, virtual machines 31virtual machines, datastores 86virtual machines, file types 86
disk space data countersdatastores 28virtual machines 85
disk usageclusters 18hosts 38virtual machines 46, 70
disk,troubleshooting 102downloading, diagnostic bundles 184
Eemail, content of vCenter Server notifications 131,
140encryption, SNMP 174engine ID, SNMP 174environment variables, alarms 132, 133, 141,
142error logs, VMkernel 187ESXi
configuring SNMP 171, 172, 174syslog service 185
esxtopbatch mode 167common statistics description 153CPU panel 154CPU Power panel 157interactive mode 152interactive mode command-line options 152interactive mode single-key commands 153interrupt panel 166memory panel 158network panel 165order pages 153performance monitoring 151replay mode 168statistics column 153storage adapter panel 161storage device panel 162virtual machine storage panel 164
eventsexporting 124viewing 123
events,described 121exporting, diagnostic data 184
Ffans, monitoring 109fault tolerance charts 88fault tolerance virtual machines
CPU system time 88CPU usage (MHz) 88CPU used time 89memory active 90memory swapout 91
filtering traps, SNMP 178
vSphere Monitoring and Performance
192 VMware, Inc.
Gguest operating statistics, enabling 107guest operating systems, SNMP 179
Hhardware, health troubleshooting 113hardware health
reset sensors 111, 112troubleshooting 113
health status, monitoring 110, 111host charts 35host counters 75host health, reset sensors 111, 112hosts
CPU usage 35CPU usage (MHz) 36disk latency 32, 44disk rate 31–34, 40, 43, 92–94disk size 41disk usage 38hardware monitoring 109health status 110, 111memory balloon 48memory data counters 50memory swap rates 49memory usage 47memory usage, virtual machines 52network rate 55network size 56network usage 53network usage, virtual machines 57
IInternet Explorer, security settings 113inventory objects, set alarm on 126, 135IPMI sensors, SNMP 178
Lline charts, description 10Log Browser 188log browser, manage 190log browser, adjust times 189Log Browser, advanced filters 189Log Browser, browse from different objects 190Log Browser, compare 190Log Browser, export 189Log Browser, filter logs 188log browser, retrieving 188log browser, searching 188log files
collecting 186, 187ESXi 187export 184
external 184turning off compression 187
logscollecting 187ESXi 184vSphere Client 184
logs,system, See also troubleshooting
Mmanaged devices, MIB files 180memory, health monitoring 109memory active, fault tolerance virtual
machines 90memory balloon
hosts 48virtual machines 77
memory consumedresource pools, virtual machines 61vApps, virtual machines 66
memory data countersclusters 21hosts 50resource pools 62virtual machines 79
memory swap rateshosts 49virtual machines 78
memory swapout, fault tolerance virtualmachines 91
memory usageclusters 20
datacenters, clusters 26hosts 23, 47resource pools 60resource pools and virtual machines 23vApps 66virtual machines 52, 76
memory, troubleshooting 101metric groups 9metric groups,description 12MIB files 180monitor, guest operating system
performance 107monitoring, performance charts 9
Nnetwork
SNMP 169SNMP traps 131, 132, 140, 141
network ratehosts 55virtual machines 82
network sizehosts 56virtual machines 83
Index
VMware, Inc. 193
network usageclusters 24hosts 53virtual machines 57, 81
network,troubleshooting 103networks, health monitoring 109notification emails, alarms 129, 138notification traps, alarms 129, 138notifications, See traps
Oobject identifiers (OIDs) 180overview charts
cluster charts 17datacenter charts 25datastore charts 28fault tolerance charts 88host charts 35resource pool charts 58vApp charts 64virtual machine charts 68
PPerfmon utility 107performance
advanced charts 94statistics collection 12troubleshooting 100virtual machine 107
performance chartsabout 9
advanced chartsabout 94deleting views 98viewing 94, 95
customizing 95, 96data collection 9data collection intervals 13data collection levels 14exporting data 99overview charts 16saving data to a file 98, 99types 10
performance charts, views 15performance monitoring 151performance statistics, Windows guest operating
systems 107pie charts, description 10ports, for SNMP 173power, health monitoring 109privacy, SNMP 174processors, health monitoring 109
Rreplay mode
command-line options 168preparing for 168
reset sensors, host health 111, 112resource pool charts 58resource pools
CPU usage (%), virtual machines 59CPU usage (MHz) 58memory consumed, virtual machines 61memory data counters 62memory usage 60
resources, storage 115resxtop
batch mode 167common statistics description 153CPU panel 154CPU Power panel 157interactive mode 152interactive mode command-line options 152interactive mode single-key commands 153interrupt panel 166memory panel 158network panel 165options 152order pages 153performance monitoring 151statistics column 153storage adapter panel 161storage device panel 162virtual machine storage panel 164
Sscripts, alarms 132, 133, 141, 142security settings, Internet Explorer 113services, syslogd 185SIOC activity report 35SMASH 109SMTP, configuring 130, 139SNMP
authentication 174CIM indications 178communities 172configuring 169, 170configuring for ESXi 171configuring traps 172diagnostics 179, 181encryption 174engine ID 174filtering traps 178GET 173guest operating systems 179IPMI sensors 178
vSphere Monitoring and Performance
194 VMware, Inc.
management software 179polling 173ports 173privacy 174targets 176traps 169users 175v3 traps 176
SNMP traps 131, 132, 140, 141SNMP v1 172SNMP v2c 172SNMP v3 174solutions,viewing 148stacked charts, description 10statistics
about vCenter Server data 12collecting for guest operating systems 107
statistics, esxtop 153statistics, resxtop 153storage
health monitoring 109monitoring 115
storage mapsdisplay 119export 120hide items 119move items 119
storage reportscustomize 117, 118display 116export 118filter 117view 116
storage resources, monitoring 115Storage Views
Maps 119Reports 115
storage,troubleshooting 102syslog 185system log files, downloading 184system logs
configuring 186ESXi 184VMkernel 187
Systems Management Architecture for ServerHardware, See SMASH
Ttemperature, monitoring 109traps
configuring SNMP traps 172SNMP 131, 132, 140, 141, 169
triggered alarms, acknowledging 143, 144triggers, event-based 128, 137
troubleshoot, performance 100troubleshooting
CPU 100datastores 102disk 102hardware health 113log files 183, 186memory 101networking 103storage 102
Uupdated information 7users, SNMP 175
VvApp charts 64vApps
CPU usage (MHz) 64CPU usage (MHz), virtual machines 65memory consumed, virtual machines 66memory usage 66
vCenter Serverconfiguring SNMP 170performance statistics 12SNMP 169STMP 131, 140
vCenter Server,email agent 131, 140verbose logging, configuring 186virtual machine charts 68virtual machine counters 75virtual machines
CPU usage (%) 37, 68CPU usage (MHz) 69disk rate 71disk size 73disk space by datastores 86disk space by file type 86disk space data counters 85disk usage 70memory balloon 77memory data counters 79memory swap rates 78memory usage 76network rate 82network size 83network usage 81performance 107
vMA 152VMkernel, logs 187vpxd, log files 187vServices,monitoring 149
Index
VMware, Inc. 195

vSphere CLI 152vSphere Client, logs 184vSphere Management Assistant 152
Wwatchdog, health monitoring 109Windows, performance statistics 107
vSphere Monitoring and Performance
196 VMware, Inc.