
VRIJE UNIVERSITEIT The Ecology of Bacterial...
138
VRIJE UNIVERSITEIT The Ecology of Bacterial Individuality ACADEMISCH PROEFSCHRIFT ter verkrijging van de graad Doctor aan de Vrije Universiteit Amsterdam, op gezag van de rector magnificus prof.dr. L.M. Bouter, in het openbaar te verdedigen ten overstaan van de promotiecommissie van de faculteit der Aard- en Levenswetenschappen op dinsdag 27 maart 2012 om 13.45 uur in de aula van de universiteit, De Boelelaan 1105 door Mitja Nandi Paul Remus-Emsermann geboren te Siegburg, Duitsland
Transcript of VRIJE UNIVERSITEIT The Ecology of Bacterial...

VRIJE UNIVERSITEIT
The Ecology of Bacterial Individuality
ACADEMISCH PROEFSCHRIFT
ter verkrijging van de graad Doctor aande Vrije Universiteit Amsterdam,op gezag van de rector magnificus
prof.dr. L.M. Bouter,in het openbaar te verdedigen
ten overstaan van de promotiecommissievan de faculteit der Aard- en Levenswetenschappen
op dinsdag 27 maart 2012 om 13.45 uurin de aula van de universiteit,
De Boelelaan 1105
door
Mitja Nandi Paul Remus-Emsermann
geboren te Siegburg, Duitsland

promotoren: prof.dr. G.A. Kowalchuk prof.dr. J.H.J. Leveau

The Ecology of Bacterial Individuality
Mitja Nandi Paul Remus-Emsermann
Ph.D. Thesis

The research presented in this thesis was carried out at the Department of Microbial Ecology at the Netherlands Institute of Ecology (NIOO-KNAW), The Netherlands.The research was financially supported by a vidi-grant from the Netherlands Research Foundation awarded to JHJ Leveau.Production of the thesis was partly financed by the Netherlands Institute of Ecology (NIOO- KNAW).
Printed by: GVO printers & designers B.V. | Ponsen & Looijen Ede, The Netherlands
ISBN: 978-90-6464-538-9

Table of Contents
Introduction
Chapter 1 - Linking environmental heterogeneity and repro-ductive success at single-cell resolution
Chapter 2 - Variation in local carrying capacity and the in-dividual fate of bacterial colonizers in the phyllosphere
Chapter 3 - Single-cell experience of bacterial immigrants to pre-colonized leaf surfaces
Chapter 4 - Quantification of lateral heterogeneity in carbohy-drate permeability of isolated plant leaf cuticles
Chapter 5 - ASiMoPh – Agent-based Simulation of Microbial Phyllosphere Colonization
Chapter 6 - Draft sequence and partial genome annotation of the phyllosphere model bacterium Erwinia herbicola strain 299R
General discussion and synthesis
References
Appendix
About the author
Acknowledgements
Summary
Samenvatting
Page
1
19
33
49
59
71
83
87
95
109
119
121
125
129


General Introduction 1
General IntroductionIt is long known that bacteria exhibit phenotypical heterogeneity within clonal popu-lations and that heterogeneous environments have an impact on bacterial individuals that inhabit it. Nevertheless microbiologists tend to investigate bacteria as averages of populations: Be it by observing the average phenotypic properties of a popula-tion such as colony morphologies on an agar plates or the growth rate in a shaken liquid culture. A classical approach in microbiology is to determine the total number of colony forming units that can be recovered from an environment to evaluate the capability of the population of a bacterium to grow and survive in the environment. More recently, scientists turned to molecular tools to determine bacterial responses to an environment on a molecular level such as gene-expression of a population. The concept of bacterial individuality is a recent development in microbiology. In essence it is built around the ideas that bacteria should be treated as individuals and investigated at scales that actually matter for them. In this thesis I followed these ideas and developed methods that show the value of the information that can be extracted from single-cell observations and how they increase our knowledge about the ecology of bacteria. As the study environment, I used the leaf surface, or phyllosphere, as a natural sys-tem for bacterial colonization. By using bacterial bioreporter technology and fluores-cence microscopy coupled with image cytometry I was aiming to determine coloni-zation success and the impact of chance on colonization processes. In another biore-porter-based approach I aimed to determine local differences in fructose permeance through isolated cuticles. I then used the data derived from the previous studies to formulate a spatial-explicit, agent-based model for phyllosphere colonization.
A brief introduction to bacterial ecologyThe term ecology describes the study of the distribution, abundance, and interaction of organisms with their biotic and abiotic environment (Begon, Harper et al. 1996). Bacterial ecology deals with questions on what and how Earth’s ecosystems are in-habited and influenced by bacteria. Some examples for bacterial ecosystems are: bio-films in aquatic sediments (Torsvik, Sorheim et al. 1996), oceans (Gugliandolo and Maugeri 1993), the gastro intestinal tract of animals (Brune 1998; Zoetendal, Collier et al. 2004), soil (Torsvik, Sorheim et al. 1996)and plants (Andrews and Harris 2000; Lindow and Brandl 2003; Leveau 2006). Additionally, a variety of anthropogenic types of bacterial ecosystems exist, e.g. wastewater treatment plants (Kapley, De Baere et al. 2007), vinegar or acetic acid bioreactors (Sueki, Kobayashi et al. 1991), glutamic acid bioreactors (Hermann 2003), and silage (Denoncourt, Caillet et al.

The Ecology of Bacterial Individuality2
2007). It is generally accepted that bacteria colonize and influence nearly all habitats on Earth (Whitman, Coleman et al. 1998).
Introduction of plants as a habitat for bacteriaAs the experimental model system in this thesis involves plant-associated bacteria, a more detailed introduction into plants as a habitat for bacteria will be given in the following section. Plants are common habitats for microorganisms. Their roots and leaves are naturally colonized by a broad spectrum of bacteria, fungi and proto-zoa (Andrews and Harris 2000), which have a variety of interactions with the host plant ranging from mutualism to commensalism and pathogenicity (Singh, Millard et al. 2004). Especially the root system, the so-called rhizosphere, is colonized very densely. One gram of forest soil may typically contain up to 109 bacterial cells (Whit-man, Coleman et al. 1998), and bacterial densities in the rhizosphere may be one to two orders of magnitude greater (Liljeroth and Baath 1988; Duineveld and Van Veen 1999; Jaeger, Lindow et al. 1999). Compared to underground organs, aerial parts of plants are less densely inhabited (Holm and Jensen 1972). Leaf surfaces, for example, feature limited availability of water and nutrition, increased exposure to UV-radiation, and the waxy cuticle covering the leaf is a substrate that is very hard to penetrate (Kolattukudy 1985) and offers few niches to populate (Monier and Lindow 2004) ¤7. Also, several plants posses a self-cleaning effect, which prevents the successful colonization of leaves (Barthlott and Neinhuis 1997). Therefore, only specialized microorganisms can manage to survive the conditions on leaf surfaces. Leaves are typically inhabited by 106 -107 bacterial cells per cm2 or up to 108 bacteria cells per gram of leaves (Lindow and Brandl 2003), and the cumulative number of bacteria on plant leaves world-wide has been estimated to add up to the astonishing number of 1026 (Morris and Kinkel 2002). Most of these so-called epiphytic bacteria have developed strategies to adhere to their substrate: some synthesize and secrete extracellular polymers, whereas others possess pili to facilitate adhesion and prevent removal (Beattie and Lindow 1999). Some bacteria can also influence the substrate structure itself, e.g. by producing indole-3-acetic acid (IAA), a phytohormone. In high doses, bacterially produced IAA is thought to cause russet on pear fruits (Lin-dow, Desurmont et al. 1998), which result from an increased division activity of plant cells. These cells act as sinks for nutrients from which the bacteria might ben-efit. Also, it is known that bacteria are able to increase the permeability of leaf cu-ticles (Schreiber, Krimm et al. 2005), thereby increasing their access to plant-derived nutrients.Leaves are not colonized in a uniform manner. The most frequently colonized struc-

General Introduction 3
tures are the bases of trichomes, glandular cells, leaf veins, epidermal cell wall junc-tions, hydathodes, wounds, and stomata (Beattie and Lindow 1999; Monier and Lin-dow 2004). Leaf permeance for nutrients, mostly photoassimilates such as fructose, glucose and sucrose, can differ between these features (Schlegel, Schönherr et al. 2005; Schreiber 2005). This is in part due to the heterogeneous compositions and thickness of the cuticle, which overlays the epidermis of plant leaves (Fernández, Khayet et al. 2011). The cuticle has also been shown to contain locally clustered hydrophilic pores, which allow higher rates of diffusion for hydrophilic substances through the cuticle (Schönherr and Schreiber 2004; Schlegel, Schönherr et al. 2005; Schreiber 2005). Water droplets can adhere longer at trichomes, glandular cells, leaf veins and other structures on the leaf and act as a sink for nutrients that leach out of the leaf (Linskens 1950). In addition, the nutrient flow in leaf veins is much higher than in the rest of the leaf, resulting in a steeper gradient, increasing the driving force with which nutrients permeate across the cuticle (Schreiber and Schönherr 2009). Differences in leaf geography are also thought to contribute to differential adherence and protection of bacteria (Monier and Lindow 2004). As a result, the distribution of cells on a single leaf surface can be very heterogeneous and can differ by 100 fold even between segments of 9 mm2 (Kinkel, Wilson et al. 1995; Monier and Lindow 2004).Leaves are colonized by airborne, waterborne, or biotic vector mediated (e.g. in-sects) events or during the emergence of the shoot through the soil (Leveau 2006). Usually, bacteria initially arrive on leaves as single cells or cell aggregates. These colonizers may encounter a variety of conditions, depending on their particular lo-cation. In laboratory experiments with bean plants, it was found that uncolonized leaf surfaces carry sufficient amounts of sugar (0.2 to 10 µg; the majority consisting of sucrose, fructose and glucose) to sustain a population of 1.7 x 10⁷ bacteria per gram (Mercier and Lindow 2000). In another study, it was shown that most bacterial immigrants to bean leaves encounter nutrient conditions that allow them to divide several times, but after this initial phase, sugar is only available in a limited number of sites on the leaf (Leveau and Lindow 2001). Bacteria that have not already colo-nized these sinks likely starve and die off unless they have specialized adaptations to this environment, i.e. high tolerance to desiccation, starvation, UV-radiation, or adaptations to avoidance strategies these stresses altogether, e.g. by entering the leaf (Beattie and Lindow 1999).
Studying the ecology of bacterial communitiesThe study of bacteria in their natural environment involves experimental techniques

The Ecology of Bacterial Individuality4
that typically have been developed for the study of bacteria in the laboratory, e.g. cultures grown in flasks or colonies and biofilms grown on agar plates. Many of these techniques are population-based measurements. Some of these techniques will be discussed here in more detail, using the phyllosphere as a model bacterial eco-system.A basic but valuable method to determine the number of bacteria on a leaf, as well as to investigate the general composition of the bacterial phyllosphere community, is plate counting. Leaves of known size or weight are washed in a known volume of a wash buffer, and samples of this buffer are spread onto a defined growth medium. After a sufficient time of incubation, colony forming units (CFUs) can be counted and used to estimate the bacterial numbers per unit of leaf surface (i.e. population size). A disadvantage of plate counting is the selectivity of the medium upon which the samples are plated, as some bacteria do not grow under artificial conditions, or they grow very slowly e.g. the pink- pigmented facultative methylotrophic bacteria (Holland 1997). Those organisms will be missed in standard plate count analyses. Another disadvantage of plate counting is that it is a semi-quantitative method, be-cause bacterial aggregates will form only one colony. These two problems may lead to an underestimation of the bacterial count in a sample. Microscopic techniques can be utilized as an alternative to estimate bacterial counts. For this, leaves are washed in a known amount of buffer, and the leaf is weighed and/or the surface area is determined. Afterwards, samples are placed on a Neubauer counting chamber with a defined volume between slide and coverslip, which allows estimation of the cell count of a community. Microscopy can also be used to ana-lyze colonized plant surfaces directly, either to examine the success of leaf washing procedures or to investigate the spatial distribution of bacteria on the leaf. To im-prove bacterial cell analysis, bacterial cells are commonly stained, for example with 4’,6-diamidino-2-phenylindole (DAPI) or Acridine orange, both fluorescent dyes that interact with nucleic acids and stain all bacteria including those bacteria that would be missed by plate counting due to their non-culturability. Molecular community fingerprinting techniques can also be used to characterize the composition of an overall leaf community. For this, the total community DNA, or metagenome, is extracted and a subsequent polymerase chain reaction (PCR) with primers for conserved DNA-sequences that are connected by variable DNA-sequences is performed (Handelsman, Rondon et al. 1998). Afterwards, a step to separate PCR products of the dominant populations, such as denaturating gradient gel electrophoresis (DGGE) (Muyzer and Smalla 1998) and terminal-restriction fragment length polymorphism (T-RFLP) (Marsh 1999), is conducted. Each band

General Introduction 5
on a DGGE gel, for example, represents, in the ideal case, a population of one domi-nant species in the sample. These bands can be excised from the gel and sequenced to identify the species they represent. Importantly, also non-cultureable organisms will appear in these analyses. By employing DGGE, Yang et al. could show, that the phyllosphere diversity of Citrus sinesis is more complex than assumed based on culturable analyses (Yang, Crowley et al. 2001). Besides improving knowledge about the qualitative composition of a leaf surface community, the quantitative composition of the community is of interest. It is pos-sible to answer these questions by performing quantitative or real time PCR (qPCR or RT-PCR). To quantify the relative abundance of a DNA-fragment in a sample of metagenomic DNA, the produced double stranded DNA intercalates with a fluores-cent dye or it is tagged with fluorescent probes, so that fluorescence intensity in a PCR becomes a measurement for the amount of fragment in the sample (Wong and Medrano 2005). By using primers for conserved DNA-sequences, it is possible to measure the content of different bacterial species or bacteria groups in a specimen (Zwielehner, Handschur et al. 2008). Furthermore, it is possible to analyze the ap-pearance of certain genes and their abundance within a community by means of quantitative PCR methods.To analyze the full metagenome of the phyllosphere it is possible to create a clone library by inserting large DNA-fragments of the metagenome into vectors (Jackson, Echlin et al. 2006). These vectors can then be cloned into bacteria and stored there for further analysis. Such clone libraries are able to reveal the genetic potential of a community for example which substrate the community can metabolize. The abun-dance of clones with certain genes, e.g. 16S RNA genes, in the library is also a proxy for the abundance of a species in a sample (Handelsman 2004).To gain knowledge about a community it is possible to perform next generation se-quencing, i.e. pyro- or Illumina-sequencing, of the metagenome. This can be done either in combination with a barcoded PCR of conserved DNA sequences to ana-lyze the community composition (Claesson, Wang et al. 2010; Redford, Bowers et al. 2010), or by 454 shotgun pyrosequencing of the full metagenome (Kowalchuk, Speksnijder et al. 2007; Delmotte, Knief et al. 2009). The advantage of these meth-ods is that they allow for the identification of bacterial species within a sample while providing a quantitative estimate of the relative species abundances within a sample (Fierer, Hamady et al. 2008).A novel approach combines genomic and proteomic information of bacteria that reside in an environment, so called community proteogenomics (Delmotte, Knief et al. 2009). By generating a full metagenome database, of phyllosphere bacteria in

The Ecology of Bacterial Individuality6
High stimulus level
No stimulus
Low stimuluslevel
Habitat Release of cells into habitat
Health status of cells responseto environment
Individual based result
= Population based result
A B
C D
Figure 1 (changed from Leveau and Lindow 2002) Impact of environmental heterogene-ity on individual microbial cells and the discrepancy between population and single-cell results. A) A habitat that consist of several microhabitats that feature different levels of a stimulus. B) Microbial bioreporters for the stimulus are released into the habitat. C) After a time of incubation the bioreporter will be induced to report on the stimulus in the habitat. These cells are now recovered from the environment and queried for their reporter signal either by a population-based measurement, e.g. fluorescent measure-ment in a cuvette, or a single-cell-based measurement, e.g. epifluorescent microscopy and image cytometry. Both methods yield different results as shown in D). The popu-lation-based measurement yields the average stimulus experienced by the bioreporter in the habitat revealing that the habitat contains average levels of the stimulus. The in-dividual-based measurement reveals that the habitat is heterogeneous, containing sites that do not hold a stimulus, that hold average levels of the stimulus, and that hold high levels of the stimulus. This example reveals the averaging effect of population-based methods that, depending on the questions asked, can lead to wrong results. Single-cell methods yield higher information content about the habitat under study without prior knowledge of the heterogeneity of a stimulus distribution in the habitat.

General Introduction 7
combination with metaproteome information extracted from the same community, one can reveal information about the ecophysiology and possibly unique features of phyllosphere bacteria.
Introduction of the ecology of individual bacteriaIn general, and as illustrated by the examples above, bacterial ecology has been heavily biased towards measurements of bacterial populations. Despite the fact that bacterial individuals can be observed, already since Antonie van Leeuwenhoek dis-covered bacteria in 1683, it has long been difficult, if not impossible, to monitor single bacterial cells and determine their identity and behavior or health status. Fur-thermore, the study of bacteria on or in natural substrates may be impeded by their invisibility without magnifying and staining protocols, as well as their relatively low density under natural conditions.Given these difficulties, it is not surprising that classical bacterial ecology approach-es have typically ignored single individuals. Classical bacterial ecology tends to describe the interactions of populations, not individuals, with the environment in relation to other populations (Kinkel, Andrews et al. 1987). Changes in populations are typically expressed as averages, without regard for variation that might exist at the individual level, for example in terms of generation time, response to the local microenvironment, and expression of functional traits. The heterogeneous surface of a plant leaf provides a good example to explain this. Most of the surface area is difficult to populate for bacteria, but certain spots are habitats for significant num-bers of bacteria (Kinkel, Wilson et al. 1995). Figure 1 illustrates how a per leaf view, i.e. using the leaf as a unit of normalization, might give a different (and in this case incorrect) picture of how bacteria thrive in the ecosystem, compared to a single-cell perspective. On average, a plant leaf surface can be called an inhospitable environment, schematically indicated by white areas in Figure 1. If now bacteria are released into this environment (Figure 1 B) and are allowed to grow, they will do so according to the locally offered resources (Figure 1 C). As a result, the average bacterium is one that experiences the leaf surface as not very conducive to growth (Figure 1 D). However, from the perspective of single individuals, spatial variation in hospitality would result in different subpopulations on the leaf surface, some of which prosper (Figure 1 D) (Leveau and Lindow 2001). Even in environments that lack spatial heterogeneity, phenotypic variation among individual bacteria has been shown to exist. For example, it has been known for a long time that individuality oc-curs even in single descendants in a clonal population (Hughes 1956; Smits, Kuipers et al. 2006). An evolutionary explanation for phenotypic variation in individuals of

The Ecology of Bacterial Individuality8
an isogenic culture could be the higher chance to survive hazardous conditions, so called bet-hedging (Veening, Smits et al. 2008). For instance, in case a population is subjected to environmental stress, individuals that are in a certain physiological state can be able to resist stress, and, after the stress stimulus is relieved, these individu-als can regenerate a population featuring several phenotypes (Smits, Kuipers et al. 2006). Individual variation also arises from stochastic differences in cell division and bacterial growth (Kelly and Rahn 1932; Rosenfeld, Perkins et al. 2006; Strovas, Sauter et al. 2007).Thus, there seems to be a clear need for bacterial ecologists to pay more attention to the fate of individual cells. How do single bacteria vary in their experiences of their local environment and in their reaction to it? How does the sum of all reactions shape population structure and distribution? Can we predict bacterial activities better if we get an appreciation for bacterial life at the single cell level? These are central ques-tions to the ecology of bacterial individuality and thus central to this thesis.
Individual based ecology and agent-based modelling In this context, a very useful theoretical framework to embrace is the concept of “individual based ecology” (IBE) (Grimm and Railsback 2005). IBE handles popu-lations as a group of individuals whose growth, reproduction, food intake and ulti-mately death is an outcome of their adaptive behavior to their surroundings. Adapted to a bacterial system, it gives each individual bacterium its own individual environ-ment. An individual environment results in an individual reaction, i.e. phenotype or gene expression.The phyllosphere offers a great opportunity to investigate such relationships. It is easily accessible, highly amenable to experimentation, offers a highly heterogeneous environment at the level of individual bacteria, and it a natural and relevant habitat for bacteria.An important tool in individual-based ecology is modeling. An individual-based bac-terial model can be though of as a spatial explicit two- or three-dimensional environ-ment inhabited by agents, representing organisms, that interact with each other and the environment. Agents are simulated individuals that feature behavior answers, e.g. resource uptake, movement, and division, which are dependent on environmen-tal conditions, such as the local availability of resources, as well as modeler-defined thresholds, e.g. the amount resources that an agent owns before it divides. The possi-ble reactions of agents, and the effects of these reactions on their environment, need a high amount of calculation power, which makes computers prerequisite for ecol-ogy models based on individuals (Grimm and Railsback 2005). The phyllosphere

General Introduction 9
for example can be simplified into a model by creating an environment consisting of a two-dimensional grid, which depicts the leaf, inhabited by agents that mimic bacteria. So far, there have been several applications of individual-based ecology to explain bacterial growth patterns. Kreft et al. (1998) developed an individual-based bacte-rial model system BacSim. BacSim has been used to model dynamics of bacteria in biofilms, colony growth, and the migration of Salmonella enteritidis into chicken’s eggs (Kreft, Booth et al. 1998; Kreft, Picioreanu et al. 2001; Grijspeerdt, Kreft et al. 2005). Representing a second generation of biofilm models, iDynoMiCS has re-cently been released (Lardon, Merkey et al. 2011). An individual-based bacterial modeling systems has been developed to investigate microscale evolution of bacte-ria (Gregory, Saunders et al. 2006). Also, some successful efforts have been made to model individual-based chemotaxis models (Emonet, Macal et al. 2005). More individual-based bacterial model systems have recently been reviewed elsewhere (Hellweger and Bucci 2009). In an ideal case, a model should include all possible answers and behavior patterns, but the results produced by such a model are likely to be as complicated as the natural phenomena they are attempting to explain. So models typically aim for simplicity, while still trying to tackle and explain relevant biological questions.
Investigating individual bacteriaAs mentioned above, bacterial ecology has traditionally been biased towards the study of populations and communities. Relatively little data and theories are avail-able on the ecology of bacteria as individuals. However, a growing array of tech-niques is becoming available to interrogate individual bacteria in their natural habi-tats. This section will list some of these recently developed techniques and their potential in an individual-based approach to bacterial ecology.
Single cell analysis by microscopyThe most frequently used and oldest technique to investigate single bacterial cells is microscopy. Since the first bacteria have been observed while using a simple light microscope (Dobell 1933) microscopy has made many technical advances. But even to date, the basic concepts of microscopy are still the same, and light microscopy is still widely used. Microscopic images can be captured with digital cameras, and ana-lyzed by imaging software, e.g. to determine the size of single cells or the content of a chromophore inside a cell (Brehm-Stecher and Johnson 2004). Light microscopy allows interrogation of single bacteria in their natural habitat, provided that cells are not stained prior to the analysis. To obtain a three-dimensional perspective of a habi-

The Ecology of Bacterial Individuality10
tat, Confocal Laser Scanning Microscopy (CLSM) may be used (Zhang, Callaway et al. 2009). While using CLSM, several pictures are taken along the Z-axis to produce a three-dimensional image, which can be an advantage when studying thicker speci-mens, or a microenvironment that is characterized by an uneven surface. It is pos-sible to create ultra-high resolution images of individual bacterial cells on surfaces by using electron microscopy (Morris, Monier et al. 1997). Prior to the microscopy, surfaces harboring communities of interest have to be fixed and sputter-coated with gold. During the observation specimen are kept under vacuum. Bioreporter technology in single-cell microbiologyReporter proteins are valuable tools in microbial ecology. In a typical application, reporter genes are fused to a constitutive- or inducible gene promoter which allows the visualization of bacteria in their natural environment (Leveau and Lindow 2002), or the quantification of gene activities (Kohler, Bubert et al. 2000). If fused to pro-moters that are activated by a particular stimulus, it is possible to generate bioreport-ers, i.e. cells that respond to the stimulus by the production of the reporter protein. Examples of such stimuli are nutrients (Leveau and Lindow 2001), heavy metals (Abd-El-Haleem, Zaki et al. 2006) or even the abundance of certain species in a certain culture volume by quorum sensing (March and Bentley 2004). The list of bioreporters is growing constantly (Hansen and Sorensen 2001; Leveau and Lindow 2002; Shimshon 2003; Nivens, McKnight et al. 2004). The following section will introduce some of the currently available reporter genes.The green fluorescent protein (GFP) is derived from fluorescing jelly fish (Chalfie, Tu et al. 1994) and has been extensively used as a reporter protein in different types of organisms, including bacteria. Through modification, the original properties of GFP have been changed to design proteins that differ in maturation time, stabil-ity (Andersen, Sternberg et al. 1998), excitation wavelength maximum (Cormack, Valdivia et al. 1996), and emission intensity and wavelength (thereby changing the color of the resulting protein) (Cormack, Valdivia et al. 1996; Miller, Desai et al. 1999). Fluorescent proteins from other organisms, such as DsRED and its deriva-tives, have been added to the pool of available reporter proteins (Matz, Fradkov et al. 1999; Shaner, Campbell et al. 2004). The advantage of short-lived forms of GFP is the ability to observe temporal changes in gene activity. This can be of utility in studies that employ bacterial bioreporters for the exploration of changes in environ-mental conditions. For example, Leveau and Lindow (Leveau and Lindow 2001) introduced a gene for unstable GFP[AAV] (Andersen, Sternberg et al. 1998) under the control of a fructose responsive promoter into Erwinia herbicola. Bacteria har-boring this plasmid were successfully used to quantify fructose in culture and show

General Introduction 11
the transient availability of fructose on leaf surfaces. Other reporter proteins that are used for single-cell analyses are enzymes like β-galactosidase (Chung, Conner et al. 1995). The detection is based on enzymatic cleavage of substrates into easily detectable compounds, e.g. X-Gal is cleaved by β-galactosidase to form insoluble indigo-blue homodimers, or MUGLR-substrates that result in insoluble fluorescent products after cleavage by β-galactosidase (Manafi, Kneifel et al. 1991). Due to their insolubility, cleaved MUGLR-products are not released by intact cells, so that it is possible to quantify enzyme activities and thus promoter activities in individual cells. These fluorescent proteins and substrates may be combined with a stain that only colors dead cells, e.g. propidium iodide (Monier and Lindow 2003), which al-lows an estimation of living and dead cells.
Analysis of individual cells using fluorescent probesBeside reporter proteins, it is also possible to interrogate single cells by using fluo-rescence in situ hybridization (FISH). FISH involves fluorescently marked DNA-probes that hybridize with RNA or DNA (Amann, Fuchs et al. 2001; Zwirglmaier, Ludwig et al. 2004). FISH can be highly sensitive, which makes it an ideal tool for cell counting by microscopy or flow cytometry (see below). Furthermore, by using probes that bind to variable regions of the ribosomal RNA, it is possible to con-firm the phylogenetic identity of bacteria under investigation. The use of differently colored probes with different specificities makes it is possible to obtain data sets about multiple populations from a single sample. Probes that hybridize with 16Sr-RNA can also be used to make statements about the general activity of cells (Ruimy, Breittmayer et al. 1994; Leveau and Lindow 2001). FISH is fully compatible with other fluorescence-based methods, like GFP reporter technology (Eberl, Schulze et al. 1997). A disadvantage of FISH is that it is destructive due to the need to fix cells prior to the analysis. Several variations on the FISH theme have been developed. To enhance the detection of low copy RNA or DNA, catalyzed reporter deposition FISH (CARD-FISH) can be used: by using probes that are tagged with horseradish peroxidase instead of a fluorophore. The peroxidase activity leads to signal ampli-fication compared to fluorophore-labeled FISH probes (Pernthaler, Pernthaler et al. 2002). The recognition of individual genes by FISH (RING-FISH) is possible by us-ing polynucleotide probes. The method is based on the formation of a probe network that is anchored at the probe-specific site in the cell. The network is formed due to complementary regions within the polynucleotide probes. Another variation is to investigate the gene expression or genetic traits of single cells via prokaryote in situ polymerase chain reaction (PI-PCR) (Hodson, Dustman et al. 1995). The method
The Ecology of Bacterial Individuality12
uses fixed cells that are spotted on a microscopic slide after which a PCR is executed directly on the slide. Afterwards, fluorescence probes are added onto the slide similar to FISH, which can hybridize to the amplified nucleotide strains.
Analysis of individual cells by flow-based techniquesBy flow cytometry, large numbers of cells can be rapidly analyzed (Davey and Kell 1996). This technique can directly or indirectly (e.g. after staining) detect and quan-tify single cells based on their optical properties, such as fluorescence intensity of bacterial bioreporter cells. Fluorescence-activated cell sorting (FACS) is a flow-cytometric tool to separate cells with different optical properties (Davey and Kell 1996; Brehm-Stecher and Johnson 2004). For example, it is possible to separate rod-shaped and coccus-shaped, or fluorescent from non-fluorescent bacteria. This method is a versatile tool to enrich cells with an interesting property from a given sample. Examples for FACS applications include the separation of two different populations with defined GFP contents for further analyses (Davey and Kell 1996; Shapiro 2000).Another flow-based single-cell interrogation technique is microfluidic flow cytom-etry (Shapiro 2000). It has several advantages: the sensitivity is much higher than the sensitivity of a standard flow cytometer, it is possible to add and mix fluids into the sample (e.g. stains), and the flow of the sample can be stopped and reversed to investigate a cell again or investigate its behavior over time. The disadvantage of this technique is the smaller number of cells that can be analyzed compared to conven-tional flow cytometry.
Raman spectrum-based analysis of individual cellsA very interesting and advanced form of microscopy is Raman microscopy. Based on Raman spectroscopy, which uses the inelastic light scattering that is produced by molecules that were exposed to a monochromatic laser, it is used for chemical analy-ses in very small areas by exposing them to a monochromatic light beam and the analysis of the resulting spectra (Huang, Griffiths et al. 2004). Raman microscopy produces a spectrum that represents an enormous amount of data for the different components from a single cell. Raman microscopy has already been used to analyze single bacteria to study differences in chemical composition (Schuster, Urlaub et al. 2000; Rosch, Harz et al. 2005; Huang, Bailey et al. 2007). Sample preparation for Raman microscopy is not destructive, so whole inoculated samples can be investi-gated (Rosch, Harz et al. 2005). This allows the investigation of individual chemical heterogeneity in populations (Schuster, Urlaub et al. 2000). The main disadvantage

General Introduction 13
of Raman microscopy lies in the time-consuming analysis of these spectra and, as a consequence, the relatively low number of cells that can be analyzed in a given period of time.
General ApproachesThe aim of this PhD-thesis was to develop the concept of bacterial individuality into a more quantifiable and experimentally testable science within the field of bacterial ecology. We determined the merit of a single-cell approach to explain the activity of bacteria in their natural environment. As a model bacterial ecosystem, the leaf surface, or phyllosphere, was chosen. This habitat has several experimental advan-tages, i.e. being readily accessible by microscopy and allowing the easy recovery of bacteria for single-cell analysis. Also, the phyllosphere can be manipulated to mimic specific environmental situations, e.g. different levels of humidity, rain, wind, and light/UV illumination levels. By using diverse methods of inoculation, such as air-brushing or the dipping of leaves into bacterial solutions, different kinds of coloniza-tion strategies can be tested.For most of the experiments, Phaseolus vulgaris plants (green snap bean ‘Blue Lake Bush 274’) were used as the host system, as there are already many protocols and studies available on the colonization its leaves by bacteria (Beattie and Lindow 1999; Mercier and Lindow 2000; Leveau and Lindow 2001; Monier and Lindow 2003; Monier and Lindow 2004). Beans can also easily be cultivated in the greenhouse and thus allow independence from seasons. In addition to intact leaves, isolated plant leaf cuticles were used. Their properties are similar to living leaf surfaces (Kirsch, Kaffarnik et al. 1997; Schreiber 2001) and allow for standardized experiments, for example to quantify diffusion of substances.The bacterial strains used in this thesis are all derived from the parental strain Er-winia herbicola 299R that has been used in many phyllosphere studies (Lindow, Desurmont et al. 1998; Beattie and Lindow 1999; Leveau and Lindow 2001). Er-winia herbicola (also known as Pantoea agglomerans or Enterobacter agglomerans) is a heterotrophic, flagellated, Gram-negative Gammaproteobacterium that belongs to the family Enterobacteriaceae (Rezzonico, Smits et al. 2009). It is primarily a plant epiphyte, but has been found in other ecological niches like soil, sediments, and aquatic environments (Rezzonico, Smits et al. 2009). Erwinia herbicola forms monolayer and multilayer biofilms on plant surfaces, it also forms spherical or ob-long-elliptical multicellular structures in culture and on plants which are currently under investigation (Tecon and Leveau, unpublished).

The Ecology of Bacterial Individuality14
Outline of the thesis
Chapter 2In chapter two, a proof of concept is provided demonstrating how a single-cell ap-proach provides complementary information over a population-based approach. A bacterial bioreporter was constructed, characterized and exploited for quantification of single-cell reproductive success. Consequently, we coined the bioreporter CUS-PER for reproductive success = repsuc read backwards. After establishing the proof-of-principle, basic leaf colonization experiments were performed.The bioreporter consisted of the Erwinia herbicola strain Eh299R::JBA28(pCPP39) that can be induced to produce GFP in response to Isopropyl-β-D-thiogalactopyranosid (IPTG) (Leveau and Lindow 2001). In an environment lacking IPTG, GFP produc-tion ceases and whatever GFP is present in cells is diluted with every cell doubling. In that way GFP content of any single cell is inversely proportional to the number of times its ancestor has divided since this ancestor was introduced into the IPTG-free environment. This single-cell approach revealed to what extent the total population-increase on the leaf was due to individual immigrant cells that contributed to dif-ferent degrees to the final population. This cannot be answered using a population approach.Proof-of-principle characterization of the bioreporter was performed as follows: Growth of GFP-loaded CUSPER on LB without IPTG revealed a decrease in GFP concentration (as quantified by fluorescence microscopy) with a rate that is inverse to the growth rate. GFP-loaded CUSPER cells were then released on bean leaves by dipping them into a bacterial suspension. After different incubation times, the cells were retrieved, cell counts were determined by plate counts and GFP concentration of single cells were measured. Data revealed subpopulations of cells that contributed to different degrees to bacterial populations on bean leaves, thereby providing evidence for environmen-tal heterogeneity in the phyllosphere. We determined that the phyllosphere offers a sliding scale of habitability for bacterial colonizers.
Chapter 3In Chapter 3, I evaluated the general understanding of the term “carrying capacity” in microbiology, which in some respect differs from the term as it is used in the general ecological context. In microbiology, it is used as a synonym for maximal load, which describes the maximum number of organisms that an environment can sustain, while in ecology the term describes the equilibrium of growth and death,

General Introduction 15
which results in the maximum number of organisms that an environment can sustain. Different densities of GFP-loaded CUSPER cells were airbrushed onto bean leaves. Some of these densities were deliberately higher than the carrying capacity of the leaves under study. Bacteria were recovered from leaves at different time points, CFUs were determined and single-cell reproductive success was analyzed. Results provided evidence that the phyllosphere consists of distinct microenvironments that offered low, intermediate, or high success rates for reproduction. The study estimat-ed the probability of successful phyllosphere colonization. We concluded from our data that the carrying capacity of the phyllosphere has to be understood as a sum of local carrying capacities that are determined by individual sites on leaves.
Chapter 4In chapter 4, I evaluate if the success of biocontrol by the principles of preemptive colonization and preemptive exclusion are determined at the level of single cells. It is known that certain bacteria and fungi are able to attack plants, potentially caus-ing severe damage and significantly lower crop yields (Pernezny, Raid et al. 1995; Roberts, Berger et al. 1997; Savary, Willocquet et al. 2000; Goszczynska, Botha et al. 2007). Some of these pathogens cause damage only when a certain popula-tion density is reached (Whitehead, Byers et al. 2002). There have been several at-tempts to control such plant pathogens by inoculating plants with non-pathogenic, but competitive, bacteria (biocontrol agents) before pathogens can reach the popula-tion density necessary for infection (Lee, Lee et al. 2006; Stockwell, Johnson et al. 2010). Among potential mechanisms of action, biocontrol agents are acknowledged to repress growth of pathogenic strains by competitive exclusion (Lindow 1987). This is the principle of preemptive colonization, and its success or failure ultimately depends on how individuals of the biocontrol agent and the pathogen interact at the micrometer level. The CUSPER bioreporter was used in competition with preemptively inoculated red fluorescent Erwinia herbicola (Eh299R(pFru97)) cells on bean leaves. Leaves were inoculated with three densities of Eh299R(pFru97) or a water control 24 hours before GFP-filled CUSPER cells were released.
Chapter 5In this chapter, I describe the localization of hotspots of fructose diffusion over iso-lated leaf cuticles of poplar (Populus canescens). Isolated leaf cuticles were mea-sured for their bulk-permeance of fructose by using gas chromatography coupled a with flame ionization detector. Subsequently, cuticles were inoculated with the GFP-based fructose bioreporter strain Erwinia herbicola strain Eh299R(pFRU46)

The Ecology of Bacterial Individuality16
(Leveau and Lindow 2001) to later be scanned by epifluorescence microscopy. Sites containing GFP-expressing cells were quantified and their size was measured. By relating the bulk-measurements with the local information obtained by fructose-ex-posed bacteria, it was possible to estimate the local fructose flux over the cuticles.
Chapter 6This chapter introduces the agent-based simulation of microbial phyllosphere colo-nization (ASiMoPh) model. ASiMoPh was constructed around the framework of CUSPER bacteria that report reproductive success in a heterogeneous environment.A heterogeneous two-dimensional environment, mimicking a leaf surface, was gen-erated using the agent-based modelling software NetLogo (Wilensky 1999). This environment consisted of patches that offer different amounts of “energy”. The agents released into the environment can utilize this energy. The model allow for the visualization of bacterial growth in a heterogeneous environment. It also records the number of agents that reside in the environment and the number of generations that individual agents were able to undergo since they were released into the envi-ronment. This facilitated the comparison of model results with experimental results acquired with the CUSPER reporter system.
Chapter 7In this brief chapter, I describe the preliminary results of the de novo assembly and draft annotation of the Erwinia herbicola 299R genome. Genomic DNA was se-quenced using the Illumina platform and de novo assembled using the bioinformatics tools Velvet and SeqMan Ngen. Draft annotation was performed using the RAST online annotation service. A finalized assembly and annotation will enable follow-up applications like expression profiling of Erwinia herbicola 299R in natural and arti-ficial environments. Expression profiling and the availability of the genome can help to answer questions like, “what makes a successful phyllosphere bacterium?” and, “how does Erwinia herbicola 299R experience the leaf environment?”
Chapter 8This chapter provides a summarizing discussion and examines the implications of the results presented in this thesis on phyllosphere microbiology and the ecology of bacterial individuality

General Introduction 17

The Ecology of Bacterial Individuality18

Individual-based reproductive success of bacteria 19
Linking environmental heterogeneity and reproductive success at single-cell resolutionMitja NP Remus-Emsermanna and Johan HJ Leveaua,b,= aDepartment of Terrestrial Microbial Ecology, Netherlands Institute of Ecology (NIOO-KNAW), Wageningen, The Netherlands and bDepartment of Plant Pathol-ogy, University of California, Davis, CA, USA
=Corresponding author: Dr. Johan Leveau, University of California, One Shields Avenue, Department of Plant Pathology, Davis CA 95616, USA. Tel. +1 530 752 5046. Fax +1 530 752 5674. E-mail: [email protected].
Published in The ISME Journal (2010) 4, 215-222
AbstractIndividual-based microbial ecology (IBME) is a developing field of study in need of experimental tools to quantify the individual experience and performance of micro-organisms in their natural habitats. We describe here the conception and application of a single-cell bioreporter approach with broad utility in IBME. It is based on the dilution of stable green fluorescent protein (GFP) in dividing bacteria. In the absence of de novo synthesis, GFP fluorescence of a daughter cell approximates half of that of its mother, from which follows that the fluorescence of a progeny cell is a quan-titative measure for the reproductive success of its ancestor. To test this concept, we exposed GFP-filled bacteria to different degrees of environmental heterogeneity and assessed how this affected individual cells by the analysis of GFP content in their progeny. Reporter bacteria growing in rich medium in a shaking flask showed no variation in reproductive success, confirming that life in a broth is experienced much the same from one bacterium to the next. In contrast, when reporter bacteria were released onto plant leaf surfaces, representing a microscopically heterogeneous en-vironment, clear intrapopulation differences in reproductive success were observed. Such variation suggests that individual cells in the founding population experienced different growth- permitting conditions, resulting in unequal contributions of indi-vidual bacteria to future offspring and population sizes. Being able to assess popula-tion changes bottom-up rather than top-down, the bioreporter offers opportunities to quantify single-cell competitive and facilitative interactions, assess the role of chance events in individual survivorship and reveal causes that underlie individual-based environmental heterogeneity.

The Ecology of Bacterial Individuality20
IntroductionEnvironmental heterogeneity, defined as spatial and temporal variation in the physi-cal, chemical and biological environment, is a fundamental property of ecosystems (Scheiner and Willig 2008). At the scale of individual organisms, it affects the ability to survive, reproduce, co-exist and interact with other organisms. For plants and ani-mals, environmental impact can be assessed and quantified relatively simply at the level of individual organisms (Melbourne, Cornell et al. 2007). In microbial ecology, however, the effect of environmental variability on microbial activity and diversity is commonly assessed at a scale that is several orders of magnitude greater than the dimensions of the microorganisms under study (Hellweger and Bucci 2009). This ‘coarse-grained’ (Templeton and Rothman 1978) approach to environmental hetero-geneity suffers from the averaging effect that is typical of many population-based approaches (Brehm-Stecher and Johnson 2004). It is increasingly being recognized that ‘fine-grained’ environmental heterogeneity, that is the one experienced by mi-croscopic individuals at the micrometer-scale is a key factor in explaining microbial activity, diversity, distribution and evolution (Davey and Winson 2003; Green and Bohannan 2006; Prosser, Bohannan et al. 2007; Davidson and Surette 2008). How-ever, due to the relative lack of tools to probe environments for micrometer-scale differences in physical, chemical or biological variables, little is known about the heterogeneity that individual micro-organisms are exposed to and, more importantly, how this affects their activity and reproductive success. Bioreporter technology (Leveau and Lindow 2001; Leveau and Lindow 2002; Harms, Wells et al. 2006; Leveau 2006; Tecon and van der Meer 2006) relies on microorganisms themselves to report on local environmental conditions. Many of these bioreporters involve the conditional expression of green fluorescent protein (GFP), a reporter that can be quantified with relative ease in individual cells by fluo-rescence image microscopy (Jaspers, Meier et al. 2001; Leveau and Lindow 2001) or flow cytometry (Axtell and Beattie 2002; Maksimow, Hakkila et al. 2002; Harms, Wells et al. 2006; Roostalu, Joers et al. 2008). When properly calibrated, the GFP signal becomes a measure for exposure to a particular environmental stimulus. For example, Leveau and Lindow (2001a) used a fructose-responsive promoter fused to the gene for GFP to probe the availability of this sugar to bacteria on plant leaf surfaces, also known as the phyllosphere (Leveau 2006). Temporal and spatial varia-tion in single-cell green fluorescence indicated substantial heterogeneity in the avail-ability of fructose to individual leaf colonizers (Leveau and Lindow 2001). Such heterogeneity has also been reported for other nutrients or stimuli that leaf bacteria are exposed to, including iron (Joyner and Lindow 2000), water (Axtell and Beattie

Individual-based reproductive success of bacteria 21
2002), UV light (Gunasekera and Sundin 2006) and phenolic compounds (Sandhu, Halverson et al. 2007).While bacterial bioreporters, such as the ones described above, are useful in mi-crometer mapping of differences in the bacterial experience of single environmental variables, they cannot communicate how each of those variables, individually or jointly, impact the fate of bacteria in the environment under study. We therefore designed a bioreporter tool that describes micrometer-scale environmental hetero-geneity in general terms, that is as a sum of all variables expressed into a single, quantifiable effect on the bacterium. The bioreporter we introduce here records envi-ronmental heterogeneity in terms of past reproductive success. In concept, it is based on the observation that upon cell division, GFP in a bacterial cell is distributed in a predictable manner between its two daughter cells (Rosenfeld, Perkins et al. 2006; Roostalu, Joers et al. 2008): one division leaves cells approximately half as green fluorescent as their parent, two divisions one-fourth as fluorescent, and so on. Thus, the GFP content of an individual offspring cell becomes a quantifiable measure of reproductive success. This approach resembles the method that was used (Mailloux and Fuller 2003) to estimate in situ doubling times for bacteria released into an aquifer after staining them with carboxy-fluorescein diacetate succinimidyl ester, a fluorescent protein stain that dilutes from the bacteria with every cell division. However, whereas these authors were interested solely in population averages of in situ growth, we tested our GFP-based bioreporter by exposure to microscopic condi-tions of low (that is, LB broth) and high (that is, the phyllosphere) environmental heterogeneity to reveal sub-population differences in the reproduction of single bac-teria. The implications of our findings extend broadly to studies on other microbial habitats dealing with the question of how individual bacteria in founder populations differ in their contribution to future population sizes.
Materials and methodsBacterial strains and culture conditions Erwinia herbicola 299R JBA28 (pCPP39) (Eh299R::JBA28 (pCPP39)) (Leveau and Lindow, 2001b) carries a chromosomal mini-Tn5-Km transposon insertion that ex-presses stable GFP from a LacIq-repressible PA1/O4/O3 promoter fusion to gfpmut3. The transposon confers resistance to kanamycin. The strain also harbors plasmid pCPP39, which confers tetracycline resistance and harbors a lacIq gene for control of PA1/O4/O3 activity, and thus GFP production by isopropyl-β-D-thiogalactopyranoside (IPTG). Bacteria were cultivated at 28 °C on LB agar or in LB broth at 300 r.p.m. Where appropriate, IPTG, kanamycin, or tetracycline were added to final concentra-tions of 1mM, 50 or 15 mg ml-1, respectively. Optical densities of bacterial cultures
The Ecology of Bacterial Individuality22
were measured at 600nm (OD600) in a Unico 1100 spectrophotometer (Unico, Day-ton, NJ, USA).
GFP-loading, release and recovery of bioreporter Eh299R::JBA28 (pCPP39)Exponentially growing cells of Eh299R::JBA28 (pCPP39) were diluted 300-fold into fresh LB broth containing 1mM IPTG and grown to mid-exponential phase. These GFP-loaded cells were used to inoculate plant leaves (see below) or LB broth. In the latter case, 25 ml of LB was inoculated with 200 ml of GFP-loaded bacteria and incubated at 28°C and 300 r.p.m. Samples were taken every 30 min to mea-sure OD600 and to collect bacteria for fixation (see below). For plant inoculations, GFP-loaded bacteria were diluted in Milli-Q water to a final concentration of 5 x 10⁴ colony-forming units ml-1. Leaves of 12–14-day old Phaseolus vulgaris plants (green snap bean, variety Blue Lake Bush 274) were inoculated by brief submersion into this bacterial suspension, shaken to dispose of excessive liquid and transferred to a closed translucent box for high-humidity incubation at 21°C. At different time intervals, two leaves were transferred to a 50-ml Falcon tube with 20 ml 1 x PBS buffer, vortexed briefly and sonicated for 7 min. Part of the bacterial cells in the leaf washing was plated on agar for counting colony forming units, whereas the rest was collected on 0.2-µm Durapore filters (Millipore, Amsterdam, The Netherlands), re-covered by vortexing for 15s in 1ml 1 x PBS, and fixed (see below).
Fluorescence in situ hybridization, fluorescence microscopy and image cytometry Bacterial cells collected from LB broth or plant leaves were fixed as described previ-ously (Leveau and Lindow 2001) and stored at -20 °C in 50% 1 x PBS/50% etha-nol for no longer than 2 weeks. To distinguish cells of Eh299R::JBA28 (pCPP39) from indigenous bacteria on the bean leaves, fixed leaf washings were subjected to fluorescence in situ hybridization using an Eh299R-specific, TAMRA-labeled probe (Brandl, Quinones et al. 2001) at a final concentration of 5.5 ng µl-1. LB-or leaf-ex-posed cells were examined with an Axio Imager.M1 (Zeiss, Oberkochen, Germany) using 470/20 nm excitation for the visualization of GFP and 546/6 nm for TAMRA. Digital images were captured at 1000-fold magnification with an AxioCam MRm camera (Zeiss) in phase contrast and through a 525/25nm (GFP) or 575–640 nm (TAMRA) filter set. Using AxioVision 2.6 Software (Zeiss), single-cell GFP fluo-rescence was quantified as the mean-pixel intensity (Leveau and Lindow 2001), and expressed in units of Sfere (Standardized fluorescence reference), where 1 milliS-fere equals one-thousandth of the average mean-pixel intensity of 1-mm Tetraspeck Fluorescent Microsphere Standards (Molecular probes, Eugene, OR, USA). Data analyses and simulations were performed in Microsoft Excel 2003 (Microsoft Cor-
Individual-based reproductive success of bacteria 23
poration, Redmond, WA, USA).
Computer simulationsFor computer simulations presented in Figure 3a, reproductive success was calculat-ed for 100 cells with a green fluorescence (GF) equal to X/2t, in which X equals the Excel formula ‘=norminv(rand(),1000,250)’. Figure 3b shows the temporal changes in reproductive success of individual bacteria as a function of t from a population of 90 cells with GF = X and 10 * 2t cells with GF = X/2t. Figure 3c shows the reproduc-tive success of 20 bacteria with GF = X, 20 * 20.125 * t bacteria with GF = X/20.125* t, 20 * 20.25 * t bacteria with GF = X/20.25 * t, 20 * 20.5 * t bacteria with GF = X/20.5 * t and 20 * 2t bacteria with GF = X/2t. Figure 3d shows the reproductive success in a population of 20 bacteria with GF = X, 20 * 2t bacteria with GF = X/2t (t ≤ 1) or 20 * 21 bacteria with GF = X/21 (t>1), 20 * 2t bacteria with GF = X/2t (t>2) or 20 * 22 bacteria with GF = X/22 (t>2), 20 * 2t bacteria with GF = X/2t (t>3) or 20 * 23 bacteria with GF = X/23 (t>3) and 20 2t bacteria with GF = X/2t.
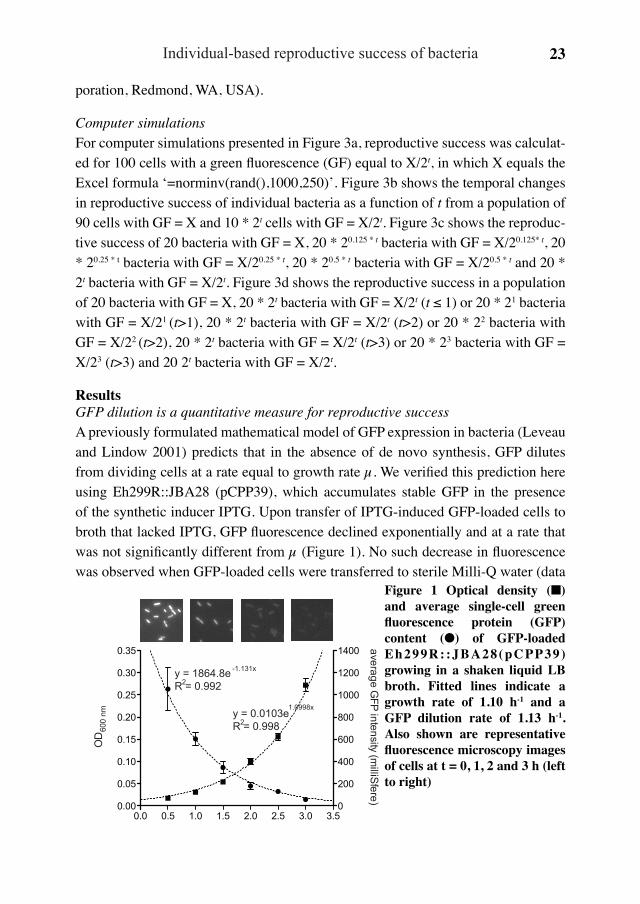
ResultsGFP dilution is a quantitative measure for reproductive successA previously formulated mathematical model of GFP expression in bacteria (Leveau and Lindow 2001) predicts that in the absence of de novo synthesis, GFP dilutes from dividing cells at a rate equal to growth rate µ. We verified this prediction here using Eh299R::JBA28 (pCPP39), which accumulates stable GFP in the presence of the synthetic inducer IPTG. Upon transfer of IPTG-induced GFP-loaded cells to broth that lacked IPTG, GFP fluorescence declined exponentially and at a rate that was not significantly different from µ (Figure 1). No such decrease in fluorescence was observed when GFP-loaded cells were transferred to sterile Milli-Q water (data
0.0 0.5 1.0 1.5 2.0 2.5 3.0 3.50.00
0.05
0.10
0.15
0.20
0.25
0.30
0.35
0
200
400
600
800
1000
1200
1400
hours
OD
600
nm
average GFP intensity (m
illiSfere)
y = 1864.8eR = 0.992
-1.131x
2
y = 0.0103eR = 0.9982
1.0998x
Figure 1 Optical density (■) and average single-cell green fluorescence protein (GFP) content (●) of GFP-loaded Eh299R: :JBA28(pCPP39) growing in a shaken liquid LB broth. Fitted lines indicate a growth rate of 1.10 h-1 and a GFP dilution rate of 1.13 h-1. Also shown are representative fluorescence microscopy images of cells at t = 0, 1, 2 and 3 h (left to right)

The Ecology of Bacterial Individuality24
not shown), confirming that GFP is extremely stable in this strain and that its dilution from cells depends on division. From Figure 1, it follows that the average number of cell divisions since t = 0 can be calculated from the GFP fluorescence at times t (GFPt) and t = 0 (GFP0) as 2log(GFP0/GFPt). This value is essentially a measure of reproductive success; in simple terms, it means that the dimmer a cell is, the more successful its ancestor was in producing offspring. Figure 2a shows that in an expo-nentially growing bacterial population in LB broth, the reproductive success of indi-vidual cells (which for any individual cell was calculated as 2log[average cell’s GFP fluorescence at t = 0 divided by single cell’s fluorescence at time t]) was normally distributed. The parallel lines signify that over time, all cells contributed with equal success to the population increase (Figure 2a). This observation is consistent with
0.01
%
0.1%
1.0%
10.0
%
30.0
%50
.0%
70.0
%
90.0
%
99.0
%
99.9
%0
1
2
3
4
5
6
t=0t=0.5t=1t=1.5t=2t=2.5t=3
expected normal value
repr
oduc
tive
succ
ess
0.01
%
0.1%
1.0%
10.0
%
30.0
%50
.0%
70.0
%
90.0
%
99.0
%
99.9
%
-1
0
1
2
3
4
5
t=0t=1t=3t=6t=9t=24
expected normal value
repr
oduc
tive
succ
ess
a b
Figure 2 Normal probability plot showing the reproductive success of Eh299::HJBA28 (pCPP39) under low (a) and high (b) environmental heterogeneity. (a) Bioreporter cells growing in a shaken LB culture flask. (b) Bioreporter cells growing on plant leaf surfac-es. Cells were sampled at the indicated times and examined for green fluorescence pro-tein (GFP) content as described in Materials and methods. Each data point represents an individual cell, for which the reproductive success was calculated as 2log[average cell’s GFP fluorescence at t=0, divided by single cell’s fluorescence at time t]. The broken line represents the limit of detection, which is determined by the lowest detectable level of GFP fluorescence in a single cell. To distinguish bioreporter cells from indigenous bacteria recovered from the leaf surface, we needed to include a fluorescence in situ hybridization (FISH) step (see Material and methods), which reduced the GFP fluores-cence of the average cell by fourfold compared with unhybridized cells and changed the detection limit of reproductive success from 6 to 4 divisions.

Individual-based reproductive success of bacteria 25
the assumption that a shaking LB culture represents a homogeneous environment.A very different result was obtained when GFP-loaded cells of Eh299R::JBA28 (pCPP39) were released onto leaf surfaces of bean plants. In this environment (which is devoid of IPTG, see below), progeny bacteria showed considerably more variation in reproductive success compared with those in LB (Figure 2b), with clear deviation from the parallel lines observed in Figure 2a. This suggests that some immigrant cells to the leaves contributed more progeny to the population than others.In a control experiment, we introduced an uninduced culture of Eh299R::JBA28 (pCPP39) onto leaf surfaces. Analysis of bacteria recovered from leaves after 24h revealed that they had remained non-fluorescent, confirming that (1) the leaf surface was devoid of IPTG or other compounds that might induce de novo synthesis of GFP and (2) loss of plasmid pCPP39 (which would lead to constitutive expression of GFP) did not occur during the course of the experiment.
Modeling of GFP dilution in individual cellsTo facilitate interpretation of the experimental data from the leaf surface, we ran four simple simulations (see Materials and methods) to examine the effects of different scenarios of environmental heterogeneity on the shape of reproductive success dis-tributions. In the first scenario, all cells experienced the same conditions for maximal growth, much like the experiment in LB broth. This resulted in normal distributions of reproductive success (Figure 3a), as expected and as observed experimentally
0.01
%0.
1%1.
0%
10.0
%30
.0%
50.0
%70
.0%
90.0
%
99.0
%99
.9%
0
2
4
6t=0t=1t=2t=3t=4
0.01
%0.
1%1.
0%
10.0
%30
.0%
50.0
%70
.0%
90.0
%
99.0
%99
.9%
0
2
4
6re
prod
uctiv
e su
cces
s0.
01%
0.1%
1.0%
10.0
%30
.0%
50.0
%70
.0%
90.0
%
99.0
%99
.9%
0
2
4
6
expected normal value
repr
oduc
tive
succ
ess
0.01
%0.
1%1.
0%
10.0
%30
.0%
50.0
%70
.0%
90.0
%
99.0
%99
.9%
0
2
4
6
expected normal value
Figure 3 Simulations of repro-ductive success in bacterial populations with different in-trapopulation growth rates. See text for details on panels (a-d). Data points with the same shape correspond to the same single simulated sampling time. Time is expressed as generations, not in hours.

The Ecology of Bacterial Individuality26
(Figure 2a). In a second scenario, the starter population was split into two sub-pop-ulations, one of which, representing an arbitrary 10% of the cells, had a maximum reproductive success rate, whereas 90% were unsuccessful at producing offspring (Figure 3b). In the other two simulations, the starter population was divided into five equal sub-populations, each of which produced progeny at different rates (Figure 3c) or produced progeny at the same maximum rate but ceased doing so at different times during the course of the simulation (Figure 3d).Comparison of the simulated distribution curves to the experimental ones suggests that it is unlikely that the leaf surface consists of only two types of locales: one that fully supports bacterial growth and another that does not. Based on Figure 3b, this would have resulted in the clear separation of two sub-populations in the distribu-tion curves. Instead, it seems more likely that leaf locales represent a sliding scale in their ability to support growth of initial colonizers. Figures 3c and d show that pat-terns of increased heterogeneity can be simulated by assuming sub-populations that differ in their ability to reproduce, either through being offered less than favorable growth conditions or by being offered less time or resources to reproduce. Which one of these scenarios applies to the leaf surface, or whether it is a combination of the two, cannot be easily resolved by comparison of experimental to simulated data. However, both simulations prove the point that heterogeneity in reproductive success is indicative of a starter population in which cells are exposed to different growth-permitting conditions, resulting in unequal contributions to future offspring and population sizes.Bacterial immigrants to the phyllosphere contribute differentially to leaf population sizes Based on these simulations, we interpreted the experimental leaf data (Figure 2b) as follows. During the first 3 h, GFP content did not differ significantly from t = 0 across the population, suggesting that the bacteria did not reproduce during that time. Six hours after inoculation, > 90% cells appeared in a straight line more or less parallel to the t = 0 distribution, but with an average reproductive success of 2.9 divi-sions. This suggests that during the early period of colonization, most cells encoun-tered similar conditions, allowing them to contribute equally to an approximately 22.9, that is 7.5-fold population increase. About 5% of the cells appeared brighter than expected. These might represent cells with ancestors that settled in spots unfavorable for growth. With time, the shape of the distribution curve changed (Figure 2b). At t = 9 h, approximately 3% of the cells had divided 0 times, 2% 1 time, 8% 2 times, 36% 3 times and 51% 4 times or more. Extrapolated to t = 0, this means that 22%, 7%, 15%, 33% and 23% of the starter population contributed 3%, 2%, 8%, 36% and 51%, respectively, of the population at t = 9 (Figure 4). In other words, while nearly one-

Individual-based reproductive success of bacteria 27
third of the starter cells contributed only 5% to the population size at t = 9, less than one-fourth eventually contributed more than half. These data confirm that bacterial immigrants to the leaf surface contributed differently to population sizes, which is consistent with the hypothesis that the fate of individual immigrants is determined in large part by the environmental heterogeneity at the microscopic leaf level. We were unable to make estimates of relative contribution for the t = 24 population, as 79% of the cells had divided beyond the limit of GFP detection.
Estimating population changes from single-cell dataFigure 5a shows the changes in bacterial population sizes on the leaves, as deter-mined by plate counting. The growth curve follows a pattern that is typical for this type of plant inoculation experiment, including a short lag, a phase of rapid growth and a level-off to apparent carrying capacity. It is interesting to note that this pattern can be reproduced quite well using only the single-cell data. From N = N0 * eµt (in which N is the number of cells at time t, and N0 is the number of cells at t = 0) and GFP = GFP0 * e-µt (in which GFP is the average single-cell GFP content at time t, and GFP0 is the average single-cell GFP content at t = 0), µ and t can be eliminated to reveal that N/N0 equals GFP0/GFP. In other words, a plot of GFP0/GFP as a function of time produces in essence a growth curve, which is indeed confirmed for our data
Figure 4 Unequal contribution of bacterial founder cells to leaf popula-tion sizes. Plotted on the y axis is the cumulative percentage of cells with 0, 1, 2, 3 or ≥4 divisions 9h after in-oculation onto the leaf surface, as de-termined by their green fluorescence protein (GFP) content, versus on the x axis the cumulative percentage that these cells represented in the founder population at t = 0. The latter was calculated by extrapolation to t = 0; for example, the 8% of bacteria that appeared to have divided twice by t = 9 constitute 822 divided by the sum of 3/20, 2/21, 8/22, 36/23 and 51/24 equals 15% at t = 0. The convex shape of the
line indicates uneven contribution of individual founder cells to the total population size. For example, the subpopulations at the bottom-left and the top-right of the graph represent similarly sized fractions (29% and 23%, respectively) of the founder popula-tion, but differ 10-fold (5% and 51%, respectively) in their contribution to the popula-tion at t = 9.
0
20
40
60
80
100
0 20 40 60 80 100%-age of cells in the population at t=0
%-a
ge o
f cel
ls in
the
popu
latio
n at
t=9
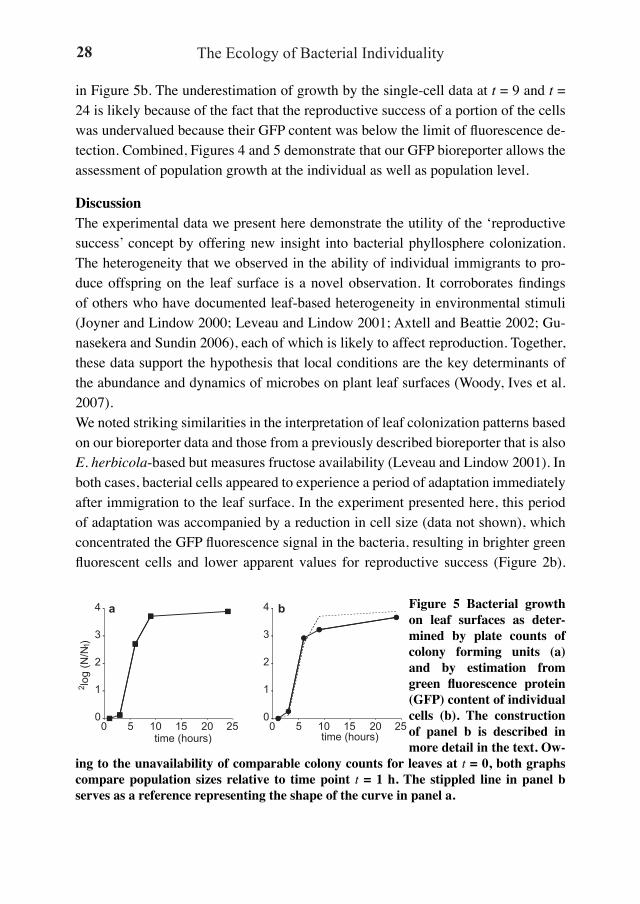
The Ecology of Bacterial Individuality28
in Figure 5b. The underestimation of growth by the single-cell data at t = 9 and t = 24 is likely because of the fact that the reproductive success of a portion of the cells was undervalued because their GFP content was below the limit of fluorescence de-tection. Combined, Figures 4 and 5 demonstrate that our GFP bioreporter allows the assessment of population growth at the individual as well as population level.
DiscussionThe experimental data we present here demonstrate the utility of the ‘reproductive success’ concept by offering new insight into bacterial phyllosphere colonization. The heterogeneity that we observed in the ability of individual immigrants to pro-duce offspring on the leaf surface is a novel observation. It corroborates findings of others who have documented leaf-based heterogeneity in environmental stimuli (Joyner and Lindow 2000; Leveau and Lindow 2001; Axtell and Beattie 2002; Gu-nasekera and Sundin 2006), each of which is likely to affect reproduction. Together, these data support the hypothesis that local conditions are the key determinants of the abundance and dynamics of microbes on plant leaf surfaces (Woody, Ives et al. 2007).We noted striking similarities in the interpretation of leaf colonization patterns based on our bioreporter data and those from a previously described bioreporter that is also E. herbicola-based but measures fructose availability (Leveau and Lindow 2001). In both cases, bacterial cells appeared to experience a period of adaptation immediately after immigration to the leaf surface. In the experiment presented here, this period of adaptation was accompanied by a reduction in cell size (data not shown), which concentrated the GFP fluorescence signal in the bacteria, resulting in brighter green fluorescent cells and lower apparent values for reproductive success (Figure 2b).
4
2
3
0
1
4
2
3
0
1
time (hours)time (hours)
2 log
(N/N
1)
50 15 2510 20 50 15 2510 20
a b Figure 5 Bacterial growth on leaf surfaces as deter-mined by plate counts of colony forming units (a) and by estimation from green fluorescence protein (GFP) content of individual cells (b). The construction of panel b is described in more detail in the text. Ow-
ing to the unavailability of comparable colony counts for leaves at t = 0, both graphs compare population sizes relative to time point t = 1 h. The stippled line in panel b serves as a reference representing the shape of the curve in panel a.

Individual-based reproductive success of bacteria 29
This initial period of adaptation was followed by a period of reproduction for nearly all immigrants. The fructose bioreporter revealed that bacteria differ substantially in their subsequent access to fructose, causing them to deplete their resources and cease dividing at different times during colonization. This parallels our observation here of unequal contributions to the population size (Figure 2b). These lines of evidence suggest that heterogeneity in fructose availability at the micrometer scale has an important role in the reproductive success of individual bacterial immigrants to the leaf surface.Our observations of intra-population variability in the reproduction of bacteria on leaf surfaces are compatible with current theories of aggregative behavior of bacteria in the phyllosphere. Various studies (Morris, Monier et al. 1998; Monier and Lindow 2004) have shown that many or most bacteria on naturally or experimentally inocu-lated leaves occur not as isolated cells but in aggregates. Aggregation has been ex-plained to result from the differential survival and growth of solitary and aggregated cells (Monier and Lindow 2003). In the case of Pseudomonas syringae (Monier and Lindow 2004), the frequency distribution of the number of cells per aggregate was found to be right-hand skewed, representing a sliding scale from many aggregates with few bacteria to few aggregates with many bacteria. Assuming that each aggre-gate arose from a single founder cell, a right-hand skewed distribution of aggregate sizes would indeed translate into a curved distribution of reproductive success, much like we observed for E. herbicola cells on leaves after prolonged exposure to the leaf surface (Figures 2b and 5b).A limitation of our bioreporter is the inability to interpret reproductive success for cells in which GFP is diluted beyond the limit of detection. In our most optimal setup, this corresponded to six doublings, or 64 progeny cells from a single ancestor. This is sufficient for studies that are relatively short-term, involve bacteria with low rates of reproduction, or habitats with low or intermediate degrees of environmental hetero-geneity. The need for fluorescence in situ hybridization to distinguish bioreporters from indigenous cells made it impossible to follow bacterial reproduction beyond four divisions. In future versions of the bioreporter, this may be solved by comple-mentation of the bioreporter with a GFP-compatible, constitutively expressed fluo-rescent protein, for example red fluorescent mCherry (Shaner, Campbell et al. 2004). An additional advantage is the prospect of in situ observation of the bioreporter in-dependent of its GFP fluorescence. Thus, one can start to interpret ancestral success of individual bacteria in the context of their location in the micrometer landscape.Despite this room for improvement, the bioreporter in its current form offers several unique opportunities and advantages. One of its strengths is that reproductive success

The Ecology of Bacterial Individuality30
is recorded in the GFP content of each cell, which is a major advantage for studies that allow only intermittent observation or that necessitate destructive sampling of the environment, as most experiments in microbial ecology do. Another plus of the reproductive success bioreporter is that it offers microbial ecologists low-ambiguity output. Most GFP bioreporters are promoter-based, and although promoters can be quite specific in response to the environmental variable under investigation, their activity can be modulated in unpredictable ways by other input from the environ-ment (Leveau and Lindow 2001). Such ambiguity makes promoter-based bioreport-ers susceptible to misinterpretation, particularly in the absence of proper controls (Leveau and Lindow 2001). The reproductive-success bioreporter is promoter-in-dependent in that it is solely based on dilution of previously synthesized GFP from the cell by division, hence with the minimal likelihood of misinterpretation of GFP output. Such types of bioreporters are expected to have the broadest and most reli-able utility in microbial ecology. Another major advantage of our bioreporter is its compatibility with many other single-cell interrogation techniques (Davey and Kell 1996; Brehm-Stecher and Johnson 2004) with the ultimate goal to link reproductive success at single-cell resolution to specific bacterial behaviors or environmental ex-periences, and to identify the sources of heterogeneity and their impacts on bacterial individuals and on population structure and activity.
AcknowledgementsWe thank Maria Marco for useful comments on the paper and Steve Lindow for his support in the conception phase of the project. Funding was provided by the Neth-erlands Organisation of Scientific Research (NWO) in the form of a personal VIDI grant to JHJL. This is NIOO-KNAW publication 4626.

Individual-based reproductive success of bacteria 31

The Ecology of Bacterial Individuality32

Quantifying local carrying capacity in the phyllosphere 33
Variation in local carrying capacity and the individual fate of bacterial colonizers in the phyllosphereMitja NP Remus-Emsermanna, Robin Tecona,b, George A Kowalchuka,c and Johan HJ Leveaua,b,=
aDepartment of Microbial Ecology, Netherlands Institute of Ecology (NIOO-KNAW), Droevendaalsesteeg 10, 6708 PB Wageningen, The Netherlands; bDepart-ment of Plant Pathology, University of California, One Shields Avenue, Davis, CA 95616, USA; cInstitute of Ecological Science, VU University Amsterdam, De Boelelaan 1085, 1081 HV Amsterdam, The Netherlands
=Corresponding author: Dr. Johan Leveau, University of California, One Shields Avenue, Department of Plant Pathology, Davis CA 95616, USA. Tel. +1 530 752 5046. Fax +1 530 752 5674. E-mail: [email protected].
Accepted in The ISME Journal
AbstractUsing a phyllosphere model system, we demonstrate that the term “carrying ca-pacity”, as it is commonly used in microbial ecology, needs to be understood as the sum of many “local carrying capacities” in order to better explain and predict the course and outcome of bacterial colonization of an environment. Using a green fluorescent protein-based bioreporter system for the quantification of reproduc-tive success in individual Erwinia herbicola cells, we were able to reconstruct the contribution of individual immigrants to the observed changes in population size. This analysis revealed that to bacteria the leaf represents an environment where individual fate is determined by the local carrying capacity of the site where an immigrant cell lands. With increasing inoculation densities, the reproductive suc-cess of most immigrants declined, suggesting that local carrying capacity under the tested conditions was linked to local nutrient availability. Fitting the observed experimental data to an adapted model of phyllosphere colonization suggested that there might exist three types of sites on bean leaves, which differ in their frequency of occurrence and local carrying capacity. Specifically, our data were consistent with a leaf environment that is characterized by few sites where individual immigrants can produce high numbers of offspring, while the remainder of the leaf offered roughly an equal number of sites with low and medium reproductive success. Our findings contribute to a bottom-up understanding of leaf surface colonization, which includes a quantifiable role of chance in the experience at the individual level and in the outcome at the population level.

The Ecology of Bacterial Individuality34
IntroductionIn ecology, the “carrying capacity” of an environment is the maximum number of individuals that the environment can support (McArthur 2006). In phyllosphere mi-crobiology, i.e. the study of microorganisms that colonize leaf surfaces, this term is invariably referred to as the number of microbial cells that a leaf is able to sus-tain (Wilson and Lindow 1994; Wilson, Savka et al. 1995; Woody, Ives et al. 2007; Nix, Burpee et al. 2009). Carrying capacity on leaf surfaces is typically determined through counts of colony-forming units (CFUs) on agar plates. It is a conditional value that depends on several biotic and abiotic factors (Leveau 2006). For exam-ple, different plant species are known to sustain different microbial population sizes (Kinkel, Wilson et al. 2000; Knief, Ramette et al. 2010). Furthermore, bacterial spe-cies may vary in the densities they can achieve on leaf surfaces depending on their ability to deal with the environmental conditions on the leaf surface (Jacques, Kinkel et al. 1995; Jacobs, Carroll et al. 2005). Water availability on the leaf has frequently been highlighted as yet another driver for microbial abundance in the phyllosphere (Leben 1965; Elad and Kirshner 1993; Wilson and Lindow 1994).One key factor in determining foliar carrying capacity is the availability of nu-trients. Carbon is a limiting resource during phyllosphere colonization (Mercier and Lindow 2000; Leveau and Lindow 2001). The process of leaching (Tukey 1966) deposits photosynthates such as the sugars fructose, sucrose and glucose on the leaf surface where they become readily available for consumption by microbes (Mercier and Lindow 2000; Leveau and Lindow 2001; Van Der Wal and Leveau 2010). Spraying of a carbon source onto plant leaves (Wilson and Lindow 1995) or making an additional carbon source available through genetic modifica-tion of the plant (Wilson, Savka et al. 1995) can also increase the carrying capacity of leaves for bacterial populations. The use of bacterial bioreporters has confirmed that sugars such as fructose are not distributed evenly across the leaf surface (Leveau and Lindow 2001). It has also been reported that unused sugars could still be detected on leaves that are colonized by bacteria at the apparent carrying capacity (Mercier and Lindow 2000). These two observations are in line with the hypothesized existence of discrete sites on the leaf surface which contain disparate amounts of resources (e.g. sugars) and which may or may not be colonized by bacteria (Kinkel, Newton et al. 2002; Lindow and Brandl 2003). At high inoculation densities, all sites on a leaf can be expected to be colonized by bacteria, and in those cases, carrying capacity will be determined by the amount of nutrients available in all sites combined. At low inoculation densi-ties, some sites will remain uncolonized, including some that contain nutrients. In

Quantifying local carrying capacity in the phyllosphere 35
the latter case, the carrying capacity is not reached and instead becomes a function of how many, and which; sites are actually occupied by bacterial colonizers. Part of this model of leaf colonization was verified in experiments with the epiphytic bacte-rium Pseudomonas syringae (Wilson and Lindow 1994), revealing that populations derived from low inoculum concentrations never were able to reach the carrying capacity that was realized at high inoculum densities. However, what is still lacking is an experimental, quantitative demonstration of the variation that exists in nutrient availability, or local carrying capacity, between sites on a leaf surface. How big is this variation, and how does it contribute to the course and outcome of leaf coloniza-tion? Population-based measurements are not suited to address these questions, as they only examine averages across the population as a whole. In order to tackle these issues properly, an individual-based approach seems necessary.Here, we used the bacterial bioreporter CUSPER (reverse of REPSUC, for REPro-ductive SUCcess) (Remus-Emsermann and Leveau 2010) to describe how increas-ing inoculation densities are experienced by individual bacterial colonizers of bean leaf surfaces. From this information, we were able to derive estimates for the varia-tion in local carrying capacity and assess the impact of this variation on achieving final foliar population sizes. The CUSPER bioreporter is based on dilution of green fluorescent proteins (GFP) from dividing cells in such a way that GFP fluorescence of a single cell is inversely proportional to the reproductive success of the original immigrant from which the observed cell was derived. The CUSPER bioreporter was recently used to reveal that in a heterogeneous environment, such as the phyllo-sphere, individual bacterial immigrants contribute unequally to future population sizes (Remus-Emsermann and Leveau 2010). In this study, we utilized CUSPER for an individual-based examination of leaf colonization at different inoculation den-sities in order to gain a quantitative understanding of variation in local carrying capacities in the phyllosphere. Such knowledge is potentially important to general ecological understanding as well as downstream applications such as plant pathogen control.
Materials and MethodsBacterial strain, culture conditions, and plant experimentsCUSPER is a bacterial bioreporter of reproductive success (Remus-Emsermann and Leveau 2010). It is based on Erwinia herbicola 299R::JBA28 (pCPP39) (Leveau and Lindow 2001; Remus-Emsermann and Leveau 2010), which constitutively express-es LacIq from plasmid pCPP39 and carries a chromosomal mini-Tn5-Km insertion that expresses stable GFP from a LacIq-repressible PA1/04/03 promoter fusion to gf-

The Ecology of Bacterial Individuality36
pmut3. The transposon confers resistance to kanamycin and the plasmid to tetracy-cline. The concept of CUSPER lies in the loading of bacterial cells with GFP through de- repression of the PA1/04/03 promoter with isopropyl β-D-1-thiogalactopyranoside (IPTG), followed by release of these GFP-loaded cells into an IPTG-free environ-ment. Without de novo GFP production, GFP is diluted every time a cell divides so that GFP fluorescence in each cell becomes an inverse measure for reproductive success. CUSPER cells were cultured to mid-exponential phase at 300 rpm and 28°C in LB broth supplemented with 50 µg kanamycin and 15 µg tetracycline per mL in addition to 1 mM IPTG. Bacteria were harvested by centrifugation at 3900×g for 10 minutes, and resuspended in 1x PBS to approximate densities of 105, 106, 107, and 108 colony-forming units (CFU) per mL. Two fully expanded cotyledon leaves of 14-day-old Phaseolus vulgaris plants (green snap bean, variety Blue Lake Bush 274; Burpee, Warminster, PA) were inoculated by evenly spraying the adaxial surface of each leaf with approximately 0.5 mL of one of the four bacterial dilutions us-ing an airbrush paint gun (Pilot I Spray gun, Walther Pilot, Wuppertal-Vohwinkel, Germany). Inoculated plants were transferred to closed translucent boxes and incu-bated at high relative humidity and 21°C.
Recovery of bacteria and analysis by microscopyAfter 0, 3, 5, 7, and 24 hours, three leaves were sampled from the plants that had been sprayed with one of the four bacterial suspensions, for a subtotal of 12 leaves per time point and a grand total of 60 leaves. Each leaf was transferred to a 50 ml Falcon tube with 20 ml 1x PBS buffer, vortexed briefly, sonicated for 7 min, and vortexed briefly again. Fifty-µL aliquots from each leaf wash were plated using an Eddy Jet spiral-plater (IuL, Barcelona, Spain) onto duplicate LB agar-plates supple-mented with 50 µg kanamycin per mL in order to determine CFUs. For two of the three leaves per time point and treatment (i.e. 40 leaves total), the remainder of the leaf wash was filtered over a 0.2-µm Isopore filter (Millipore, Amsterdam, The Neth-erlands). CUSPER cells were recovered from the filter by vortexing for 15 sec in 1 ml 1x PBS, fixed as previously described (Leveau and Lindow 2001) and stored in 1x PBS at 4° C for no longer than 3 days. Cells were analyzed with an Axio Imager.M1 epifluorescent microscope (Zeiss, Oberkochen, Germany) using standard phase contrast and Zeiss Filter 38 (BP 470/ 40, FT 495, BP 525/ 50) for the visualiza-tion of GFP. Digital images were captured using an EC Plan-Neofluar 100x/1.30 oil objective (Zeiss) with an AxioCam MRm camera (Zeiss). Single-cell fluores-cence was quantified as the mean-pixel intensity of individual cells (Leveau and Lindow 2001) using the AxioVision 2.8 software package (Zeiss, Jena, Germany).

Quantifying local carrying capacity in the phyllosphere 37
Downstream data analysis was performed in Microsoft Excel 2010 (Microsoft Cor-poration, Redmond, WA, USA). To reconstruct the relative contribution of original leaf immigrants to the final population based upon single-cell green fluorescence measurements, we divided the green fluorescence of every one of the N cells in each sample at t=24 by the average cell’s green fluorescence in the inoculum at time t=0. For each cell, this relative GFP content was divided by the sum of all GFP contents within the same sample (ΣGFP) to give a GFP/ΣGFP value for each cell. For each cell, we also calculated the reproductive success (RS) of its original progenitor as 2log(1/GFP). Cells were then binned into one of the following RS classes: RS<0.5, 0.5≤RS<1.5, 1.5≤RS<2.5, 2.5≤RS<3.5, 3.5≤RS<4.5, 4.5≤RS<5.5, and RS≥5.5. For each bin, the GFP/ΣGFP values of all cells were summed to give Σ(GFP/ΣGFP). Values of Σ(GFP/ΣGFP) were then plotted as a function of RS in a histogram (see Figures 2B, 3, and 5).
Simulation of phyllosphere colonization using a logistic growth modelWe adapted a previously developed logistic-growth model for bacteria in a hetero-geneous environment (Kinkel, Newton et al. 2002). The model simulates a leaf with S=104 sites that vary in their carrying capacity J, i.e. the maximal number of bacteria that a single site can sustain. Bacteria and their offspring were not allowed to move from one site to another. At the beginning of the simulation, bacteria were distributed over the S sites following a Poisson distribution assuming an initial popu-lation of 103, 104, or 105 bacteria per leaf. With each iteration n, the number of bacteria N in a site doubled, up to a maximum value N=J. Heterogeneity in J was introduced by assuming a normal or log-normal distribution that was created using a custom script for NetLogo 4.2.2 (Wilensky 1999). Other distributions were cre-ated with a custom Visual Basic Script for MS Excel (http://azzalini.stat.unipd.it/SN/stephen_gersuk.excel). The trimodal distribution that provided the best fit to the ob-served experimental data assumed that 48.5% of the sites had a value J of 2, another 48.5% had a value J of 48, while the remaining 3% of sites had a value J of 1152.
ResultsDetermining the carrying capacity of bean leavesTo determine the bacterial carrying capacity of bean leaves under laboratory con-ditions, we inoculated four sets of cotyledon leaves with a suspension of Erwinia herbicola strain 299R (Eh299R) CUSPER bacteria to reach four different densities, i.e. 4.5x10³, 6.9x10⁴, 5.7x10⁵ or 1.2x10⁷ CFUs per leaf (Figure 1A). Plants were

The Ecology of Bacterial Individuality38
incubated at conditions of high relative humidity, and we monitored changes in the bacterial population sizes by determining CFU counts per leaf at 3, 5, 7, and 24 hours after inoculation (Figure 1A). With the two lowest inoculation densi-ties, population sizes increased during the first 7 hours of the experiment, albeit at different rates. At the two highest inoculation densities, population sizes either remained constant or decreased during this time period. Carrying capacity was estimated from Figure 1B, which shows a plot of the fold-increase in population size over 24 hours as a function of the bacterial density at the time of inoculation. The trend-line crosses the x-axis at3.4x106 CFUs per leaf, which represents the inoculation density where no net growth is expected to occur, i.e. the total carrying capacity under these conditions.
Estimating reproductive success of CUSPER immigrants from GFP content in off-springPrior to introduction into the bean phyllosphere, the CUSPER cells were loaded with stable GFP. This initial amount of GFP gets diluted as each cell starts to divide (Remus-Emsermann and Leveau, 2010). A hypothetical example is given in Figure 2A to illustrate how GFP content of single CUSPER cells was used to reconstruct the reproductive success (RS) of individual immigrants to the leaf surface. In this example, we consider an initial population of N0=8 cells. Four of these do not divide, which equals an RS of 0 for each of those cells. One cell divides once (RS=1), two divide twice (RS=2) to produce four cells each, and one divides three
0 5 10 15 20 252
3
4
5
6
7
8
hours since inoculation
bact
eria
l pop
ulat
ion
size
(log
CFU
per
leaf
)
3 4 5 6 7 8
-1
0
1
2
3
population size at t=0 (log CFU per leaf)
popu
latio
n in
crea
se in
24
hou
rs (l
og N
24/N
0)
A B
Figure 1. Colonization of bean leaf surfaces by Eh299R CUSPER bacteria at different inoculation densities. (A) Changes in population size were monitored as colony-forming units, normalized per leaf, and plotted as a function of time. Inoculation densities (CFU per leaf) at t=0: (●) 4.5x10³; (■) 6.9x10⁴; (▲) 5.7x10⁵; (▼) 1.2x10⁷. (B) Increase in popu-lation size between t=0 and t=24, i.e. Nt=24/Nt=0, as a function of the population size at time t=0. The trendline crosses the X-axis at 6.535, which backtransforms to 3.4x10⁶ CFU per leaf. The error bars represent standard deviations from the mean.
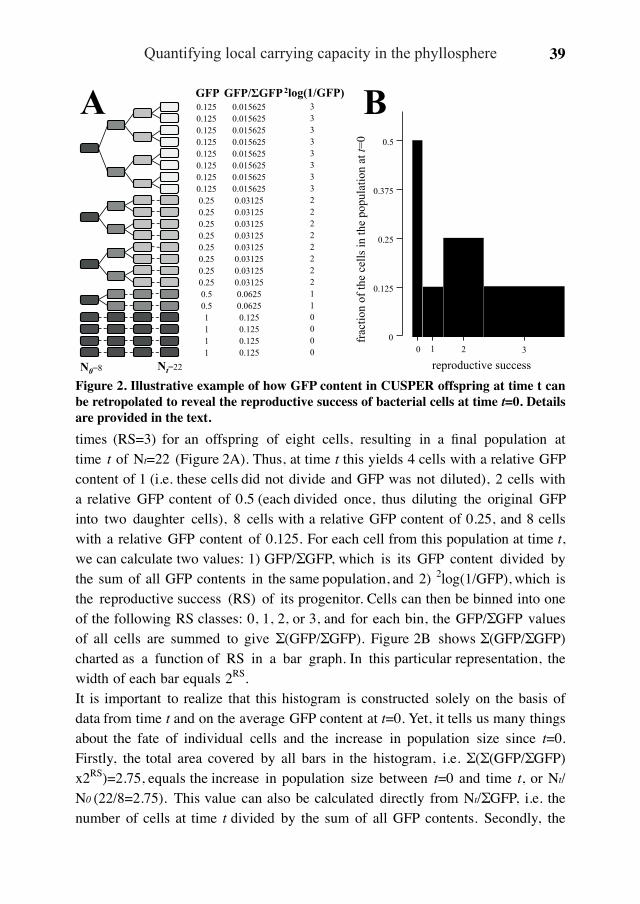
Quantifying local carrying capacity in the phyllosphere 39
GFP GFP/ GFP 0.125 0.125 0.125 0.125 0.125 0.125 0.125 0.125 0.25 0.25 0.25 0.25 0.25 0.25 0.25 0.25 0.5 0.5 1 1
1 1
0.015625 0.015625 0.015625 0.015625 0.015625 0.015625 0.015625 0.015625 0.03125 0.03125 0.03125 0.03125 0.03125 0.03125 0.03125 0.03125 0.0625 0.0625 0.125 0.125
0.125 0.125
N0=8 Nt=22
1 2 3 0 0
0.125
0.25
0.375
0.5
frac
tion
of th
e ce
lls in
the
popu
latio
n at
t=0
reproductive success
2log(1/GFP) 3 3 3 3 3 3 3 3 2 2 2 2 2 2 2 2 1 1 0 0
0 0
A B
Figure 2. Illustrative example of how GFP content in CUSPER offspring at time t can be retropolated to reveal the reproductive success of bacterial cells at time t=0. Details are provided in the text.times (RS=3) for an offspring of eight cells, resulting in a final population at time t of Nt=22 (Figure 2A). Thus, at time t this yields 4 cells with a relative GFP content of 1 (i.e. these cells did not divide and GFP was not diluted), 2 cells with a relative GFP content of 0.5 (each divided once, thus diluting the original GFP into two daughter cells), 8 cells with a relative GFP content of 0.25, and 8 cells with a relative GFP content of 0.125. For each cell from this population at time t, we can calculate two values: 1) GFP/ΣGFP, which is its GFP content divided by the sum of all GFP contents in the same population, and 2) 2log(1/GFP), which is the reproductive success (RS) of its progenitor. Cells can then be binned into one of the following RS classes: 0, 1, 2, or 3, and for each bin, the GFP/ΣGFP values of all cells are summed to give Σ(GFP/ΣGFP). Figure 2B shows Σ(GFP/ΣGFP) charted as a function of RS in a bar graph. In this particular representation, the width of each bar equals 2RS.It is important to realize that this histogram is constructed solely on the basis of data from time t and on the average GFP content at t=0. Yet, it tells us many things about the fate of individual cells and the increase in population size since t=0. Firstly, the total area covered by all bars in the histogram, i.e. Σ(Σ(GFP/ΣGFP)x2RS)=2.75, equals the increase in population size between t=0 and time t, or Nt/N0 (22/8=2.75). This value can also be calculated directly from Nt/ΣGFP, i.e. the number of cells at time t divided by the sum of all GFP contents. Secondly, the

The Ecology of Bacterial Individuality40
3123
25
50
75
25
50
75
25
50
75
25
50
75
012 4 5 >5 0 4 5 >5
reproductive success
fract
ion
of th
e cel
ls in
the p
opul
atio
n at
A B
C D
E F
G H
t 0
Figure 3. Variation in reproductive success of Eh299R CUSPER immigrants to the bean leaf surface, as inferred from GFP content in bacteria that were retrieved from leaves after 24 hours of incubation. Cells were retrieved from the same experimental setup that was used to construct Figure 1. For each of the four inoculation densities, cells from two independent leaf samples were analyzed: panels A and B, 4.5x10³ CFU per leaf; panels C and D, 6.9x10⁴ CFU per leaf; panels E and F, 5.7x10⁵ CFU per leaf; panel G and H, 1.2x10⁷ CFU per leaf. Histograms were fashioned in the same way as was done for the fictional data in Figure 2.

Quantifying local carrying capacity in the phyllosphere 41
graph reveals how successful different fractions of the original population were in producing offspring. For example, it shows that half (i.e. Σ(GFP/ΣGFP)=0.5) of the cells in the population at t=0 did not divide (RS=0) and that a quarter of the cells (Σ(GFP/ΣGFP)=0.25) at t=0 divided 2 times to produce 4 cells at time t (RS=2). Thirdly, the area of any single bar in the graph divided by the total area covered by all bars in the histogram gives the proportional contribution of cells from the corresponding RS bin to the population size at time t. For example, the area of the third bar (RS=2) is Σ(GFP/ΣGFP)x2RS=0.25x22=1, which, divided by 2.75 (=total area, see above), equals 0.36, meaning that 25% of the cells in the origi-nal population divided twice to produce enough offspring to account for 36% of the population at time t.
Single-cell experiences of leaf colonization after inoculation at different densities Using the analysis illustrated in Figure 2, we retropolated GFP content of leaf- re-covered bacteria to the reproductive success of individual bacteria in the t=0 popula-tion. Specifically, we analyzed bacterial cells retrieved at the t=24 time point from eight leaves (4 inoculation densities, 2 leaf washings each) from the experiment for which population data are shown in Figures 1. The results are summarized in Figure 3, which shows eight histograms (A-H), i.e. two leaves from different plants for each density. These graphs indicate great variation in the fate of individual bacteria after they were introduced onto the leaf surface at different starting densi-
log (Nt=24/Nt=0) based on CFU data
log
(Nt=
24/N
t=0)
bas
ed o
n G
FP d
ata
0.5
1
1.5
2
2.5
-1 -0.5 0 0.5 1 1.5 2 2.5
Figure 4. Comparison of estimates for Nt=24/Nt=0, i.e. fold increase in bacteri-al population sizes over 24 hours, based on CFU data and GFP data. For the x-values of each data point, we used the y-axis values shown in Figure 1B. For the y-values of each data point, we used the total area under all bars for each corre-sponding histogram shown in Figure 3. The symbols mark the inoculation den-sity (CFU per leaf) at t=0: (●) 4.5x10³; (■) 6.9x10⁴; (▲) 5.7x10⁵; (▼) 1.2x10⁷, and correspond to the symbols used in Figure 1. If the CFU- and GFP-based estimates for one particular inoculation density were identical, the correspond-ing data point would fall on the line with slope 1. The deviations from this line at low and high inoculation densi-
ties are discussed in the text.

The Ecology of Bacterial Individuality42
ties.On the two leaves that received the lowest inoculation density (Figure 3A and B), 41 and 70 percent, respectively, of the initial colonizers divided once after arrival on the bean leaf surface. We interpret this to mean that a substantial portion of the immigrant population landed in a spot that did not support much growth. On the other hand, 59 and 21 percent, respectively, of the cells at t=0 was very success-ful, with an RS value of 5 or greater, i.e. they produced ≥32 offspring. These very successful immigrants reproduced to become 98 and 80 percent, respectively, of the final population size, compared to only 2 and 13 percent, respectively, for the cells that underwent only one division upon arrival.With increasing inoculation density, the relative fraction of very successful cells (RS≥5) diminished (Figure 3), down to 2.4 and 0.7 percent, respectively, on the two leaves that were sprayed with the highest inoculation density (Figure 3G and H). At this density, 91 and 93 percent, respectively, of the bacterial immigrants each produced 4 offspring at most, with a majority not dividing at all or only once. Despite their low initial abundance of 2.4 and 0.7 percent, the very successful cells contributed a considerable fraction, 31 and 11 percent, respectively, of the final population size.It is evident from Figure 3 that with increasing inoculation density, the sum of the area underneath all of the bars (representing N24/N0, as explained in Figure 2) decreases. This decline in fold-increase in population size is consistent with our findings in Figure 1B, and can be explained by assuming that at higher inocu-lation densities, similar amounts of resources need to be shared by more bacteria, resulting in fewer offspring per cell. The notion that there were still few very suc-cessful immigrants at the highest inoculation density suggests that a small portion of the leaf surface (2.4/0.7% in this case) consists of sites that allow considerably more reproduction than most other sites. Another trend that is apparent in Figure 3 is the increase in resemblance of the two histograms from each inoculation density, as inoculation density increases. This suggests that the course and outcome of leaf colonization become more predictable at higher inoculation densities.For each of the eight histograms shown in Figure 3, we plotted in Figure 4 the sum of the area underneath all of the bars as a function of the N24/N0-fold increase that was obtained from CFU-based data. The fact that data points do not fall on a line with slope 1 through the origin indicates that GFP- and CFU-based results do not fully agree with each other. At the lowest inoculation density, this discrepancy can be explained by the known limitation of CUSPER (Remus-Emsermann and Leveau, 2010) that after 5 cell divisions GFP gets diluted to the point where we
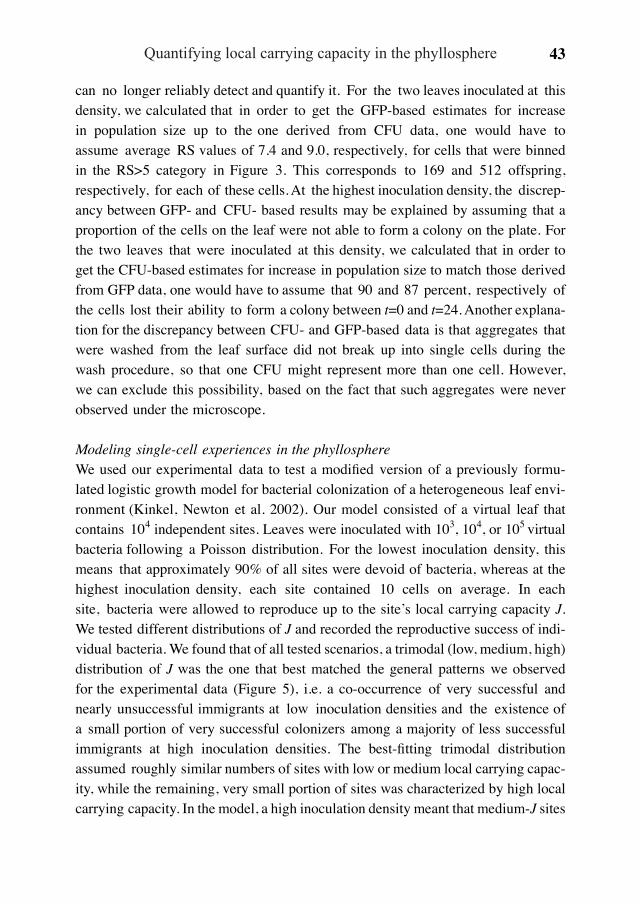
Quantifying local carrying capacity in the phyllosphere 43
can no longer reliably detect and quantify it. For the two leaves inoculated at this density, we calculated that in order to get the GFP-based estimates for increase in population size up to the one derived from CFU data, one would have to assume average RS values of 7.4 and 9.0, respectively, for cells that were binned in the RS>5 category in Figure 3. This corresponds to 169 and 512 offspring, respectively, for each of these cells. At the highest inoculation density, the discrep-ancy between GFP- and CFU- based results may be explained by assuming that a proportion of the cells on the leaf were not able to form a colony on the plate. For the two leaves that were inoculated at this density, we calculated that in order to get the CFU-based estimates for increase in population size to match those derived from GFP data, one would have to assume that 90 and 87 percent, respectively of the cells lost their ability to form a colony between t=0 and t=24. Another explana-tion for the discrepancy between CFU- and GFP-based data is that aggregates that were washed from the leaf surface did not break up into single cells during the wash procedure, so that one CFU might represent more than one cell. However, we can exclude this possibility, based on the fact that such aggregates were never observed under the microscope.
Modeling single-cell experiences in the phyllosphereWe used our experimental data to test a modified version of a previously formu-lated logistic growth model for bacterial colonization of a heterogeneous leaf envi-ronment (Kinkel, Newton et al. 2002). Our model consisted of a virtual leaf that contains 104 independent sites. Leaves were inoculated with 103, 104, or 105 virtual bacteria following a Poisson distribution. For the lowest inoculation density, this means that approximately 90% of all sites were devoid of bacteria, whereas at the highest inoculation density, each site contained 10 cells on average. In each site, bacteria were allowed to reproduce up to the site’s local carrying capacity J. We tested different distributions of J and recorded the reproductive success of indi-vidual bacteria. We found that of all tested scenarios, a trimodal (low, medium, high) distribution of J was the one that best matched the general patterns we observed for the experimental data (Figure 5), i.e. a co-occurrence of very successful and nearly unsuccessful immigrants at low inoculation densities and the existence of a small portion of very successful colonizers among a majority of less successful immigrants at high inoculation densities. The best-fitting trimodal distribution assumed roughly similar numbers of sites with low or medium local carrying capac-ity, while the remaining, very small portion of sites was characterized by high local carrying capacity. In the model, a high inoculation density meant that medium-J sites

The Ecology of Bacterial Individuality44
received immigrants in numbers that for the most part approximated or exceeded J, such that these cells did not differ much in reproductive success from cells that landed in low-J sites. In contrast, the few high-J sites were occupied by cells in num-bers well below J, allowing for a substantial number of offspring per cell. At low inoculation density, the low frequency of high-J sites prevented most, if not all, cells from landing in one of these sites, but since medium-J sites received cells in numbers well below J, there was still an opportunity for these cells to proliferate much more than cells that landed in low-J sites, where no or few doublings oc-curred.
DiscussionWe have determined the bacterial carrying capacity of bean leaves under controlled conditions in the laboratory. By bioreporter analysis, we were able to demonstrate that under these conditions, realized carrying capacity at different inoculation densi-ties is a function of variation in the local carrying capacity of different sites on the leaf surface. Our findings are consistent with a model of phyllosphere colonization that features different fates for bacterial immigrants, depending on where and with how many others they land on the leaf surface. Our study offers a quantitative estimate for these fates, which is a significant step towards a more predictive un-derstanding of bacterial colonization of leaf surfaces.It is evident from our study that individual- and population-based data sets each offer an incomplete understanding of how bacteria colonize a leaf. CUSPER-
0
0.1
0.2
0.3
0.4
0.5
3120 4 5 >5 3120 4 5 >5 3120 4 5 >5
A B C
reproductive success
frac
tion
of th
e ce
lls in
th
e po
pula
tion
at t=
0
Figure 5. Variation in reproductive success of virtual bacterial immigrants to a simu-lated leaf environment. The model is described in the text. It assumes a leaf with 104 discrete sites that vary in their carrying capacity J. This leaf was inoculated with 103 (A), 104 (B), or 105 (C) bacteria per leaf. For this simulation, we assumed that J=2 for 48.5% of the sites, J=48 for another 48.5% of the sites, and J=1152 for the remaining 3% of the sites.

Quantifying local carrying capacity in the phyllosphere 45
based measurements have the limitation that information is lost beyond a repro-ductive success of 5 (Remus-Emsermann and Leveau, 2010), so that the contribution of some immigrants to the population will be underestimated, while CFU-based measurements provide only the average contribution of cells to the population, while ignoring the variability that clearly exists among immigrants. In combination, however, these measurements can offer significant novel insights. For example, the substantial number of cells that divide at most once upon arrival to the leaf surface at low inoculation density, and the corresponding high increase in popu-lation size as derived from CFU counts, suggests that the reproductive success of cells that actually did divide was underestimated and that some cells can produce offspring in numbers that exceed 500 cells. Bacterial aggregates of this size and much larger have been found on bean leaves under appropriate conditions (Monier and Lindow 2004), although it was not established whether they were derived from single cells. On the other hand, to explain high RS values for individual bacterial immigrants at high inoculation densities in the context of a constant or decreasing CFU count under the same conditions, one needs to assume that a substantial number of cells lose their ability to form a colony on agar plates. In-deed, such nonculturability has been demonstrated experimentally for Pseudomo-nas syringae, another model colonizer of the phyllosphere, even under favorable conditions of relative high humidity (Wilson and Lindow, 1992).In our current model of bacterial colonization of the phyllosphere, each leaf coloni-zation event can be thought of as a bottleneck occurrence, where some percentage of the incoming population is prevented from reproducing, or even surviving, while other immigrants in that same population are numerically enriched because they settle at sites conducive to growth. Based on our derived estimates on the quantity and quality of sites, landing in a high-J site is unlikely for any individual bacte-rium, and at low inoculation densities, chance will determine whether such sites will be filled or not. Thus, the outcome of an inoculation event would be less predictable for low inoculation densities than for high ones.Ecological theory holds that if a nutrient resource is limited and the number of or-ganisms competing for this resource is high, the average success of the population goes down (Le Galliard, Fitze et al. 2005; Rankin and Kokko 2006). This is precisely what we observed in our experiments and simulations: high inoculation densities forced more bacterial individuals to share a site and resulted in overall reduced reproductive success. This seems to support the notion that local carry-ing capacity on leaves is determined by local nutrient availability. Being perfectly isogenic, cells of Eh299R can be considered each other’s ultimate competitors,

The Ecology of Bacterial Individuality46
with a niche overlap index (NOI) of 1 (Wilson and Lindow 1994). Thus, unless a site offered very high levels of nutrients, bacterial immigrants would be relatively unable to reproduce, representing a convincing case of the “tragedy of the com-mons” (Hardin 1968).However, a one-time immigration event of up to 107 bacteria per leaf is not a likely event in nature (Lindemann and Upper 1985). Instead, immigration is a gradual process, with cells arriving to the leaf from the surrounding air at different times and typically at low rates (Upper and Hirano 2002). Another aspect of our experimental setup that can be considered artefactual is that all immigrants were of clonal descent. In reality, the leaf surface is colonized by very diverse bacteria and other microorganisms with different NOIs, which allows for various degrees of co- existence (Knief, Frances et al. 2010). However, it is important to note that the ability to set up such artificial colonization events allowed us to extract data on the quality of the leaf surface as a habitable environment. This high level of experi-mental amenability is quite unique to microbial ecology and is one of the advantages microbial ecologists have over ‘macro’-bial ecologists (Fierer 2007). Future appli-cations of CUSPER will address more realistic scenarios, by assessing variation in reproductive success of CUSPER cells in competition with bacteria other than Eh299R and after immigration onto pre-colonized leaves.Our observation that a small fraction (0.7-2.4%) of the cells was very success-ful in reproducing even at the highest inoculation density suggests the existence of sites on the leaf surface that offer high levels of nutrients, allowing these cells to contribute disproportionally (11-31%) to the final population size. Interestingly, this finding agrees with reports showing that relatively rare features on the leaf surface tend to harbor large numbers of bacteria on colonized leaves. Specifically, it is worth noting that while only 0.6% of the bean leaf surface is covered by hooked and glandular trichomes (Monier and Lindow 2005), yet 44.1% of Eh299R bacteria in aggregates were found to be associated with these structures after incubation under moist conditions for 5 days (Monier and Lindow 2005). In at least one study (Yadav, Karamanoli et al. 2005), the population size of epiphytic bacteria was positively correlated with the densities of glandular and non-glandular trichomes. This link between bacterial fate, population size and leaf topography calls for further investigation into the predictive value of trichome density for bacterial coloniza-tion of leaf surfaces.
AcknowledgementsFunding was provided by the Netherlands Organisation of Scientific Research

Quantifying local carrying capacity in the phyllosphere 47
(NWO) in the form of a personal VIDI grant to JHJL. This is NIOO-KNAW publication number 5156.

The Ecology of Bacterial Individuality48

Single-cell experience of bacterial immigrants to pre-colonized leaf surfaces
49
Single-cell experience of bacterial immigrants to pre-colonized leaf surfacesMitja NP Remus-Emsermanna, George A Kowalchuka,b, and Johan HJ Leveaua,c,=
aDepartment of Microbial Ecology, Netherlands Institute of Ecology (NIOO-KNAW), Droevendaalsesteeg 10, 6708 PB Wageningen, The Netherlands; bInstitute of Ecological Science, VU University Amsterdam, De Boelelaan 1085, 1081 HV Amsterdam, The Netherlands; cDepartment of Plant Pathology, University of Cali-fornia, One Shields Avenue, Davis, CA 95616, USA
=Corresponding author: Dr. Johan Leveau, University of California, One Shields Avenue, Department of Plant Pathology, Davis CA 95616, USA. Tel. +1 530 752 5046. Fax +1 530 752 5674. E-mail: [email protected].
AbstractIn this study, we assessed how preemptive inoculation of plant leaves with bacteria affected the establishment of secondary colonizers. We quantified the latter in two ways: 1) at the population level, i.e. as changes in the number of colony-forming units and 2) at the level of single cells, i.e. as reproductive success of individual bacteria. Both analyses showed that the ability of secondary immigrants to estab-lish on the leaf was negatively correlated with the level of pre-population by pri-mary colonizers. This effect was best described by an inverse dose-response curve with an apparent half-point inhibition efficacy of approximately 106 cells of primary colonizer per gram leaf. Calculated efficacy was the same whether we interpreted population data or average single-cell data. Interestingly, under conditions of heavy pre-population with primary colonizers, we still observed that a small fraction of secondary immigrants still produced offspring despite the fact that the corresponding population measurement showed no net increase in population size. This difference in population-level and single-cell level data on the colonization success of second-ary inoculants has direct relevance for biocontrol strategies that are based on the principle of preemptive exclusion of foliar bacterial pathogens. For example, even at saturating levels of primary inoculum, some individual cells of a pathogen may still be able to divide, providing them with the opportunity to reach a quorum and trigger behaviors that favor survival or contribute to virulence.
Keywords: Phyllosphere, biological control, BCA, Erwinia herbicola, Pantoea ag-glomerans, Phaseolus vulgaris, preemptive colonization, biocontrol

The Ecology of Bacterial Individuality50
IntroductionThe plant leaf surface, or phyllosphere, is an extreme and uninviting microbial en-vironment due to abiotic stress conditions such as drought, rain, heat, cold, and ex-posure to UV-radiation (Beattie and Lindow 1999; Andrews and Harris 2000; Le-veau and Lindow 2001; Lindow and Brandl 2003; Leveau 2006). Nevertheless, a variety of microbes, including archaea, yeasts, filamentous fungi, and bacteria, is well adapted to life in the phyllosphere. Phyllosphere colonizers can have a vari-ety of interactions with their hosts, ranging from mutualism to commensalism and pathogenicity (Leveau 2006). Since outbreaks of aboveground plant pathogens can cause a significant decrease in crop yield (Savary, Willocquet et al. 2000; Anderson, Cunningham et al. 2004), management of such pathogens is crucial in modern, often intense, agricultural systems. Additionally, it has been shown that human pathogenic bacteria are able to survive on fresh produce and cause outbreaks in human popula-tions (Beuchat 1996; Brandl 2008; Whipps, Hand et al. 2008; Frank, Faber et al. 2011), suggesting that such targets should also be taken into consideration in crop management applications.Many strategies have been developed to prevent or meditate the establishment of plant pathogens, including the application of chemicals such as copper hydroxide (Wimalajeewa, Cahill et al. 1991), fungicides such as azoxystrobin (Bertelsen, De Neergaard et al. 2001), antibiotics such as streptomycin and oxytetracycline (Lin-dow and Brandl 2003), as well as biocontrol agents (BCAs) (Andrews 1992). BCAs are nonpathogenic microorganisms that help reduce pathogen load by one or more different mechanisms. One important mechanisms is preemptive exclusion (PE) by which BCAs effectively compete for space and/or resources (Lindow 1987; Wilson and Lindow 1994; Wilson and Lindow 1995; Wilson, Savka et al. 1995; Monier and Lindow 2005; Stockwell, Johnson et al. 2011). An example of such a strategy is the preemptive inoculation of Pantoea vagans (Smits, Rezzonico et al. 2010; Stockwell, Johnson et al. 2010) in high densities on blossoms and leaves to minimize the chance of secondary colonization by the plant pathogens Erwinia amylovora, the causal agent of fireblight (Venisse, Barny et al. 2003).Many studies have dealt with biocontrol by preemptive exclusion (PE), mostly via top-down population-based approaches, i.e. by looking at the effect of pre-inocu-lation of a BCA strain and a plant pathogenic strain on the colony forming units of both strains that can be recovered and/ or on the development of disease symptoms on plants (Wilson and Lindow 1994; Braun-Kiewnick, Jacobsen et al. 2000; Nix, Burpee et al. 2009; Stockwell, Johnson et al. 2010; Xu, Salama et al. 2010). How-ever, BCA applications sometimes fail (Andrews 1992; Kinkel, Newton et al. 2002),

Single-cell experience of bacterial immigrants to pre-colonized leaf surfaces
51
and the reasons for this failure are not always clear. For some cases, it has been sug-gested (Kinkel, Newton et al. 2002) that the applied density of a BCA might not have been sufficient to reach all growth-conducive patches on a leaf or that the time since after BCA application might not have been long enough for the BCA to fill up these patches and to prevent all secondary plant pathogens to find and colonize unfilled or partially filled patches. To address this question from a single-cell, bottom-up per-spective, we utilized a recently established single-cell bioreporter for bacterial repro-ductive success, Eh299RCUSPER (Remus-Emsermann and Leveau 2010); this thesis chapter 3). This bioreporter is based on the model phyllosphere colonizer Erwinia herbicola 299R (also known as Pantoea agglomerans 299R), which can be loaded with green fluorescent protein. Bacterial reproduction can then be followed at the single-cell level by determining the dilution of the fluorescent signal, which occurs at each cell division. Prior to the release of CUSPER cells, the bean plants were pre-inoculated with different densities of the red fluorescent E. herbicola bioreporter strain, Eh299RdsRed. Because Eh299RCUSPER and Eh299RdsRed are nearly isogenic (they only differ in the color of fluorescent protein that they produce), they can be con-sidered each others’ most effective competitors, in that they have a nutrient overlap index of 1, which is considered optimal for biocontrol through preemptive exclusion (Wilson and Lindow 1994).
Materials and Methods:Bacterial strains and culture conditionsEh299RCUSPER is based on Erwinia herbicola 299R::JBA28 (pCPP39) (Leveau and Lindow 2001). Plasmid pCPP39 constitutively expresses the repressor LacIq and confers resistance to tetracycline. The chromosomal mini-Tn5-Km transposon inser-tion JBA28 carries a LaqIq repressable GFPmut3 gene and confers resistance to ka-namycin. Erwinia herbicola 299R (pFRU97) (Eh299RdsRed) carries plasmid pFRU97 (Leveau, unpublished) which contains a constitutively expressed red-fluorescent dsRed gene and confers resistance to kanamycin.Eh299RCUSPER cells were cultured in LB broth supplemented with 50 µg kanamycin per mL, 15 µg tetracycline per mL and 1 mM of the LacIq derepressor IPTG, which activates the expression of GFPmut3, resulting in cells loaded with green fluorescent protein. Eh299RdsRed was cultured in LB broth supplemented with 50 µg kanamycin per mL. After growth to mid-exponential phase at 300 rpm and 28°C, bacteria were harvested by centrifugation at 3900 × g for 10 minutes, and resuspended in 1× PBS (8 g NaCl, 0.2 g KCl, 1.44 g Na2HPO4, and 0.24 g KH2PO4 per liter H2O, adjusted to pH 7.4).

The Ecology of Bacterial Individuality52
Inoculation of bean plants with Eh299RdsRed
Cells of Eh299RdsRed were grown and harvested as described above and resuspended in PBS to concentrations of 106, 107, and 108 CFU per mL, as approximated by opti-cal density. Fully expanded cotyledon leaves of two-week-old Phaseolus vulgaris plants (green snap bean, variety Blue Lake Bush 274) were each airbrushed as de-scribed previously (this thesis chapter 3) with 500 µL of one of the bacterial suspen-sions, or with 500 µL sterile PBS. Plants were then transferred to translucent plastic boxes that were closed to retain high relative humidity and incubated for 24 hours under constant illumination at room temperature. Subsequently, each pre-inoculated leaf was inoculated by airbrushing with 500 µL of a freshly prepared suspension of 106 colony-forming units (CFUs) of Eh299RCUSPER per ml. Three leaves per treatment were sampled 0, 3, 6, 8, and 24 hours after inoculation with Eh299RCUSPER.
Recovery of bacteria from leaves and measurement of CFU counts and single-cell GFP contentSampled leaves were individually transferred to a 50-ml Falcon tube with 20 ml 1× PBS buffer, vortexed briefly, sonicated for 7 min, and vortexed briefly again. Two 50-µL aliquots of each leaf wash were plated onto duplicate LB agar-plates supple-mented with 50 µg kanamycin per mL or 20 µg tetracycline per mL using an Eddy Jet spiral-plater (IuL, Barcelona, Spain) in order to determine the number of CFUs of Eh299RCUSPER (i.e. the number of colonies on the tetracycline plates) and Eh299RdsRed (i.e. the number of colonies on the kanamycin plate minus the number of colonies on the tetracycline plates). The remainder of the leaf wash was filtered through a 0.2-µm Isopore filter (Millipore, Amsterdam, The Netherlands). Cells were recovered from the filter by vortexing for 15 sec in 1 ml 1x PBS, fixed as described before (Leveau and Lindow 2001) and stored in 1x PBS at 4°C for no longer than 3 days. Cells were analyzed using an Axio Imager.M1 epifluorescent microscope (Zeiss, Oberkochen, Germany) using phase contrast and Zeiss Filter 38 (BP 470/ 40, FT 495, BP 525/ 50) for the visualization of GFP and Filter 20 (BP 546/ 12, FT 560, BP 575-640) for the visualization of dsRed. Digital images were captured at 1000-fold magnifica-tion with an AxioCam MRm CCD-camera (Zeiss, Jena, Germany). Single-cell green fluorescence intensity of non-red fluorescent cells was quantified using the AxioVi-sion 2.8.2 software package (Zeiss, Jena, Germany) as the mean-pixel intensity of individual cells (Leveau and Lindow 2001). Single-cell green fluorescence measure-ments were used to reconstruct the relative contribution of original leaf immigrants to the final population as explained elsewhere (this thesis chapter 3). Data analysis

Single-cell experience of bacterial immigrants to pre-colonized leaf surfaces
53
0 5 10 15 20 254.0
4.5
5.0
5.5
6.0
6.5
7.0
time (hours)
log
(Eh2
99R
CUSP
ER C
FUpe
r gra
m le
af)
0 3 4 5 6 7 84.5
5.0
5.5
6.0
6.5
7.0
log (Eh299R dsRed CFUper gram leaf at t0)
log
(Eh2
99R
CUSP
ER C
FU
per g
ram
leaf
afte
r 24h
)
A B
was performed in Microsoft Excel 2011 (Microsoft Corporation, Redmond, WA, USA) and GraphPad Prism 5.0c (Graphpad Software, San Diego CA, USA).
ResultsChanges in population size of Eh299RCUSPER cells on bean leaves pre-colonized with Eh299dsRed
Bean leaves were inoculated with different amounts of Eh299RdsRed (primary colo-nizers) to reach population sizes of 2.09×10⁶, 6.31×10⁶, and 6.76×10⁷ CFU per gram leaf after 24 hours of incubation. Subsequent inoculation of these pre-colonized leaves with approximately 5x10⁵ cells of Eh299RCUSPER revealed that the increase in population size of these secondary colonizers over the next 24 hours was inversely correlated with the level of pre-colonization by Eh299RdsRed (Figure 1A). The data fitted a downward-sloping response-curve (Figure 1B), with an approximate thresh-old of 105 CFUs of Eh299dsRed per gram of leaf tissue, i.e. below this population density the secondary colonizers would do as well as when the leaves were not first sprayed with Eh299dsRed. The effective range of Eh299RdsRed reached up to approxi-mately 108 CFUs per gram of leaf, with an apparent IC50 value of 6.116, or 1.31×10⁶ CFUs of Eh299RdsRed per gram leaf tissue.
Figure 1 A) Changes in population size of Eh299RCUSPER as a function of time following inoculation at time t=0. Leaves were colonized by Eh299RdsRed cells at densities of 0 (l), 2.09x10⁶ (¢), 6.31x10⁶ (p), or 6.76x10⁷ (q) CFU per gram leaf. B) Eh299RCUSPER popu-lation sizes after 24 hours of incubation as a function of different population sizes of Eh299RdsRed at t0. The line shows the best-fitting dose response curve (value = best-fit ± std. error, log top-response = 6.369 ± 0.033, log bottom-response = 4.773 ± 0.033, IC50 = 6.116 ± 0.049, r2 = 0.99, formula: y = bottom-response + (top-response – bottom-response) / (1 + 10(x – LogIC50))). Error-bars represent standard deviations of the mean.

The Ecology of Bacterial Individuality54
Single-cell experience of Eh299RCUSPER after arrival on leaves pre-colonized with different densities of Eh299dsRed
The level of pre-colonization by Eh299RdsRed had a strong impact on the reproductive success of individual secondary immigrants of Eh299RCUSPER (Figure 2). The higher the population of Eh299RdsRed bacteria, the lower the average reproductive success of Eh299RCUSPER cells, resulting in a shift to the left in the corresponding histograms. At the highest levels of pre-colonization, we observed almost no reproduction of Eh299RCUSPER, although a small number of immigrants (about 1%) underwent two cell divisions after 24 hours (Figure 2, bottom row). By reconstructing the increase in population size from single-cell measurements (as was done in chapter 3), we were able to show the increases in secondarily inoculated populations as a function of the CFU of Eh299RdsRed at time t0 (Figure 3). The result-ing graph had a similar shape as the one in Figure 1B, i.e. the data fit a downward-sloping response curve (Figure 3). The IC50 for this curve was calculated to be 6.204, or 1.59x10⁶ CFUs of Eh299RdsRed per gram leaf.
DiscussionIn situations where primary and secondary colonizers use the exact same resources,
0 1 2 3 4 5 >5
0.000.250.500.751.00
0.000.250.500.751.00
0.000.250.500.751.00
0.000.250.500.751.00
0 1 2 3 4 5 >5 0 1 2 3 4 5 >5 0 1 2 3 4 5 >5 0 1 2 3 4 5 >5
Reproductive success (# cell divisions)
t0 3 hours 6 hours 8 hours 24 hours
Rela
tive
prop
ortio
n of
indi
vidu
al
Eh29
9RCU
SPER
imm
igra
nts
in th
e po
pula
tion
at t=
0
2.09x10 6 Eh 299R dsRed
no Eh 299R dsRed
6.31x10 6 Eh 299R dsRed
6.67x10 7 Eh 299R dsRed
Figure 2 Relative proportion of individual Eh299RCUSPER immigrants in the population at t = 0 as determined after 0, 3, 6, 8, and 24 hours after inoculation onto leaves that were precolonized with Eh299RdsRed at different densities. Bars represent the mean of three replicates. Error-bars represent the standard deviation from the mean.

Single-cell experience of bacterial immigrants to pre-colonized leaf surfaces
55
secondary colonizers are expected to be less successful in the colonization of a pre-populated environment (Wilson and Lindow 1994). We found that the ability to in-crease in population size of the secondary colonizer, Eh299RCUSPER, decreased with increasing levels of preemptively inoculated Eh299RdsRed cells. This phenomenon was observed both at the population level and the single-cell level (Figure 1B and 3). These findings are in line with a previous study, where it was found that increased densities of Eh299RCUSPER inoculants decreased the reproductive success of the over-all population (this thesis chapter 3). Interestingly, despite this agreement between the two levels of analysis, there were instances where we found a small proportion of the cells to reproduce and form offspring in the absence of a total increase in popula-tion size. For example, 3% of Eh299RCUSPER cells were able to reproduce three times to create 8 offspring each on leaves that were heavily pre-populated at 6.31x10⁶ CFUs per gram leaf (Figure 2, column 4, row 3). This is a relevant observation if one considers that for foliar pathogens such as Pseudomonas syringae the quorum size, i.e. the number of cells in a local population to trigger a common behavior by signaling molecules, can be as low as 13 cells or even fewer (Dulla and Lindow 2008). Thus, a microcolony of 8 cells might be sufficiently large to trigger quorum
0 3 4 5 6 7 80.0
0.5
1.0
1.5
2.0
log (Eh299R dsRed CFUper gram leaf at t0)
popu
latio
n in
crea
se o
f Eh
299R
CUSP
ER i
n 24
hou
rs (l
og N
24/N
0)
Figure 3. The increase in population size of Eh299RCUSPER as derived from single-cell measurements at t=24 was plotted against the population size of Eh299RdsRed at t0. The curve shows the fitted dose response (value = best-fit ± std. error, log top-response = 1.38 ± 0.022, log bottom-response = 0.1835 ± 0.022, log IC50 = 6.204 ± 0.041, r2 = 0.99, formula: y = bottom-response + (top-response – bottom-response) / (1 + 10(x – LogIC50))). The slope of the fitted curve was fixed to a standard slope, or Hill-slope, of 1. X and Y Error-bars represent standard deviations of the mean.

The Ecology of Bacterial Individuality56
sensing behavior, which has been shown for P. syringae to be important for pathoge-nicity (Quiñones, Dulla et al. 2005). This observation supports the notion that bac-terial reproduction or the expression of pathogenicity factors, on leaf surfaces may not always be predicted accurately from population-based measurements. This per-tains not only to plant pathogens, but possibly also to other unwanted contaminants of leaf surfaces, such as the human pathogen Escherichia coli O157:H7. Several studies have documented the rapid decline of O157:H7 or proxy isolates on leafy greens (Delaquis, Bach et al. 2007; Moyne, Sudarshana et al. 2011), and typically this decline is measured at the population level as CFUs that can be washed off leaf surfaces. Our study suggests that, masked by this population decline, there might be some cells that actually do quite well and are able to survive, or even reproduce into microcolonies that offer advantages for survival (Monier and Lindow 2005). The ability of some bacterial immigrants to be highly successful on leaf surfaces while most others are not can be explained by the existence of “oases” of relative abun-dant nutrients (Lindow and Brandl, 2003). It would appear that the challenge for biocontrol strategies that depend on the principal of preemptive exclusion lies in 1) the occupation of all of nutritional oases and 2) the complete exhaustion of available resources in each of these oases. Secondary colonizers might face different situations after reaching the leaf: they ar-rive either in sites that are un-occupied or already occupied by primary colonizers. In sites that are un-occupied, colonization success will be a function of the local carrying capacity (this thesis chapter 3). In occupied sites on the other hand they will have to compete with the previous colonizer, and colonization success will then be determined by the amount of resources left in the sites. This can include those resources that the primary colonizers is incapable of utilizing, or might depend on the amount of resources that are leaching locally from the leaf to the phyllosphere (Remus-Emsermann, de Oliveira et al. 2011). Interestingly, it has been suggested that if secondary colonizers land in already established aggregates, their survival is higher compared to cells that land in un-occupied sites (Monier and Lindow 2005). Thus, it is not necessarily all precolonized sites that do not allow growth of a second-ary colonizer. These sites could allow growth of secondary colonizers, if they still carry enough resources at the time of colonization or the replenishment of resources is high enough.The presented results show that increasing numbers of precolonizers effectively re-duces the reproductive success of secondary colonizers. These results also suggest that to prevent foliar growth of a secondary strain or pathogen by the principle of PE, even a BCA that shares a high resource overlap with the secondary colonizer and

Single-cell experience of bacterial immigrants to pre-colonized leaf surfaces
57
that is inoculated at high densities might still not be able to prevent the reproduction of certain immigrant pathogens. In a field situation, a preemptive colonizer is likely to perform even less well than under the ideal conditions in the lab, for example due to incomplete or uneven application onto leaves. To avoid the presence of sites that are free for the colonization by secondary colonizers, unoccupied sites would need to be re-occupied by the biocontrol agent by migration processes or have to be reinoculated.Our observation that a small fraction (0.7-2.4%) of the cells was very successful in reproducing even at the highest inoculation density suggests the existence of sites on the leaf surface that offer high levels of nutrients, allowing these cells to contribute disproportionally (11-31%) to the final population size. Interestingly, this finding agrees with reports showing that relatively rare features on the leaf surface tend to harbor large numbers of bacteria on colonized leaves. Specifically, it is worth noting that while only 0.6% of the bean leaf surface is covered by hooked and glandular trichomes (Monier and Lindow 2005), yet 44.1% of Eh299R bacte-ria in aggregates were found to be associated with these structures after incubation under moist conditions for 5 days (Monier and Lindow 2005). In at least one study (Yadav, Karamanoli et al. 2005), the population size of epiphytic bacteria was posi-tively correlated with the densities of glandular and non-glandular trichomes. This link between bacterial fate, population size and leaf topography calls for further investigation into the predictive value of trichome density for bacterial colonization of leaf surfaces.
AcknowledgementsWe thank Robin Tecon and Tanja Scheublin for useful comments on the manuscript. Funding was provided by the Netherlands Organisation of Scientific Research (NWO) in the form of a personal VIDI grant to JHJL.

The Ecology of Bacterial Individuality58

Fructose diffusion across poplar cuticles 59
Quantification of lateral heterogeneity in carbohydrate permeability of isolated plant leaf cuticlesMitja N.P. Remus-Emsermanna, Sheron de Oliveirab, Lukas Schreiberb and Johan H.J. Leveaua,c,=
aDepartment of Microbial Ecology, Netherlands Institute of Ecology (NIOO-KNAW), Wageningen, The Netherlands; bDepartment of Ecophysiology, University of Bonn, Bonn, Germany; cDepartment of Plant Pathology, University of California, Davis, CA, USA
=Corresponding author: Dr. Johan Leveau, University of California, One Shields Av-enue, Department of Plant Pathology, Davis CA 95616, USA. Tel. +1 530 752 5046. Fax +1 530 752 5674. E-mail: [email protected].
Published in Frontiers in Microbiology (2011) 2:197 doi: 10.3389/fmicb.2011.00197
AbstractIn phyllosphere microbiology, the distribution of resources available to bacterial colonizers of leaf surfaces is generally understood to be very heterogeneous. How-ever, there is little quantitative understanding of the mechanisms that underlie this heterogeneity. Here, we tested the hypothesis that different parts of the cuticle vary in the degree to which they allow diffusion of the leaf sugar fructose to the surface. To this end, individual, isolated cuticles of poplar leaves were each analyzed for two properties: 1) the permeability for fructose, which involved measurement of diffused fructose by gas chromatography and flame ionization detection (GC-FID), and 2) the number and size of fructose-permeable sites on the cuticle, which was achieved us-ing a green fluorescent protein (GFP)-based bacterial bioreporter for fructose. Bulk flux measurements revealed an average permeance P of 3.39x10⁻⁹ m s-1, while the bioreporter showed that most of the leaching fructose was clustered to sites around the base of shed trichomes, which accounted for only 0.37 % of the surface of the cuticles under study. Combined, the GC-FID and GFP measurements allowed us to calculate an apparent rate of fructose diffusion at these preferential leaching sites of 9.2x10⁻⁷ m s-1. To the best of our knowledge, this study represents the first successful attempt to quantify cuticle permeability at a resolution that is most relevant to bacte-rial colonizers of plant leaves. The estimates for P at different spatial scales will be useful for future models that aim to explain and predict temporal and spatial patterns of bacterial colonization of plant foliage based on lateral heterogeneity in sugar per-meability of the leaf cuticle.
The Ecology of Bacterial Individuality60
IntroductionFor terrestrial plants, the cuticle represents the direct interface between aerial plant parts and the atmosphere. It predominantly consists of cutin, an esterified aliphatic polymer (Kolattukudy 1980) that is impregnated and overlaid by intra- and epicu-ticular waxes, respectively (Jetter and Schäffer 2001). The thickness of plant cuticles ranges from 30 nm for Arabidopsis thaliana leaves to 30 µm for Malus domestica fruit (Schreiber and Schönherr 2009). From a plant perspective, the cuticular mem-brane plays a pivotal role in preventing the loss of water, minerals, and nutrients, and in protecting the plant against pathogenic attacks (Riederer and Müller 2006). The hydrophobic nature of plant cuticles correlates with a limited permeability for polar substances such as water and ions (Schönherr and Schreiber 2004). By comparison, plant cuticles are less permeable for water than synthetic polymers such as polyeth-ylene or polypropylene of equal thickness (Riederer and Schreiber 2001). Another difference between plant cuticles and synthetic membranes is that the former are characterized by a pronounced lateral heterogeneity. Plant leaves are oftentimes dec-orated with features such as trichomes, gland cells, and stomata, (Schlegel, Schön-herr et al. 2005; Schreiber 2005), and these structures may differ substantially in the thickness and wax composition of the cuticle that covers them, as shown recently for trichomes of a pubescent peach fruit variety (Fernández, Khayet et al. 2011). For example, the leaf cuticle tends to be thicker over anticlinal cell walls between epi-dermal cells than on top of epidermal cells (Jeffree 2007).Despite the design of the leaf cuticle to prevent the loss of water and nutrients, it has long been recognized that plant leaves may lose measurable amounts of carbo-hydrates and other substances to the leaf surface through a process called leaching (Tukey 1966). These “leachates” are used by microorganisms that inhabit the leaf surface, or phyllosphere (Andrews and Harris 2000). For many of these bacteria, yeasts, and fungi, the phyllosphere is considered a carbon-limited environment (Wil-son and Lindow 1995; Wilson, Savka et al. 1995), which means that these microbes rely on a constant flux of photosynthates such as glucose, fructose and sucrose from the leaf interior. A recent study (van der Wal and Leveau 2011) estimated that the diffusion of fructose through the isolated cuticular membrane (CM) of Juglans regia (walnut) leaves is sufficient to sustain microbial populations as they are typically found in the phyllosphere. Others have come to the same conclusion using isolated CMs of Prunus laurocerasus, or cherry laurel (Krimm 2005).So far, the quantification of sugar diffusion across plant leaf cuticles has been re-stricted mainly to bulk measurements integrating sugar flux over entire leaves (Tukey 1966; Mercier and Lindow 2000) or over isolated CM discs (Schönherr
Fructose diffusion across poplar cuticles 61
1976; Krimm 2005; van der Wal and Leveau 2011). Estimations of sugar perme-ance at smaller scales, for example the scale of individual bacteria, are not available, although the use of fluorescent bioreporters has previously revealed the existence of ‘hotspots’ of fructose availability to bacteria on the plant leaf surface (Leveau and Lindow 2001; Krimm 2005). Possibly, such sites represent areas where the cuticle is more permeable than in other locales on the leaf surface. A quantitative understand-ing of this lateral heterogeneity in carbohydrate permeance at the micrometer scale will improve our ability to explain and predict foliar growth of microorganisms, including those that are plant pathogenic.To achieve such understanding, we employed an integrated approach that combined bulk flux measurements of fructose across discs of isolated cuticles with the analysis of single-cell bioreporter information on local fructose availability on one and the same set of cuticles. The bioreporter was based on Erwinia herbicola 299 (Eh299), a natural colonizer of the phyllosphere (Brandl and Lindow 1996) which has been used in many phyllosphere studies (Brandl, Quinones et al. 2001; Leveau and Lin-dow 2001; Krimm 2005; Remus-Emsermann and Leveau 2010; van der Wal and Le-veau 2011). Eh299 is equipped with a construct allowing expression of the green flu-orescent protein (GFP) in response to fructose exposure (Leveau and Lindow 2001). On the plant side, we chose to work with CMs isolated from the adaxial, astomatous, mature leaves of poplar (Populus x canescens). Being a model system for the mo-lecular biology of trees (Bradshaw, Ceulemans et al. 2000), the industrial production of wood, and phytoremediation applications (Stanton, Eaton et al. 2002), poplar also has played an important role in research on the permeability of plant leaf cuticles for ions (Schönherr and Schreiber 2004; Schreiber, Elshatshat et al. 2006). Experi-ments with isolated leaf cuticles of Populus x canescens suggested the existence of aqueous pores in the cuticle, of sufficient hydrophilicity to allow the passage of ions such as Ca2+, Cl-, and Ag+ (Schönherr and Schreiber 2004; Schreiber, Elshatshat et al. 2006). As leaves of Populus x canescens mature, trichomes are shed, and ion pas-sage (more specifically, the formation of microscopically visible AgCl crystals) was most abundantly found to occur at the bases of these shed trichomes. It was ruled out that shedding resulted in the formation of holes; instead, the authors argued for the existence of polar pathways, also referred to as aqueous pores (Schönherr and Schreiber 2004) at these sites. This finding challenged the model of slow diffusion of polar substances through a laterally homogeneous cuticle in favor of a model featuring much more lateral heterogeneity (Franke 1967; Schreiber and Schönherr 2009). For a fundamental understanding of microbial phyllosphere colonization, this lateral heterogeneity is of great importance, because it could be used to explain the

The Ecology of Bacterial Individuality62
nonrandom patterns of leaf colonization by bacteria (Monier and Lindow 2004) In the study presented here, we confirm that shed trichome sites are more permeable for sugars and provide quantitative estimates for the permeance and frequency of sugar-permeable sites on the poplar leaf surface.
Material and Methods
Isolation of cuticular membranesIsolation of CMs was conducted as de-scribed elsewhere (Schreiber and Schön-herr 2009). In short, it involved the digestion of 20-mm diameter discs of Populus x canescens (Aiton) Sm. leaves harvested in Spring 2002 near Sarstedt, Germany, with 2% cellulase and pectin-ase in 0.01 M citric acid buffer adjusted to pH 3-4 with KOH. To prevent growth of microorganisms, NaN3 was added to the solution at a final concentration of 1 mM. After complete digestion, isolated CMs were flattened with compressed air on Teflon discs and stored at room tem-perature and low ambient humidity.
Measuring of fructose bulk flux by gas chromatography and flame ionization detection (GC-FID)To measure the bulk flux of fructose over cuticles, cylindrical stainless steel cham-bers were used as described in Schreiber and Schönherr (2009). The chambers (Figure 1) consisted of a donor-chamber, filled with 1 mL of a 180 g per L solution of fructose, and a receiver-chamber filled with deionized water. Both donor and receiver had an inner diameter of 1.2 cm and were equipped with lockable sampling holes to allow sampling and exchange of so-lutions with a syringe. With their physiological outside facing the receiver-chamber, isolated CMs were mounted on top of the donor chamber ring and sealed with high
Adapter
Isolated cuticle
Donor chamber
Receiver chamber
Sampling port and lock
Sampling port and lock
Figure 1 Setup of the cuticle diffusion chamber. See text section Measuring of fructose bulk flux by gas chromatography and flame ionization detection (GC-FID) for details.

Fructose diffusion across poplar cuticles 63
vacuum silicon grease to the receiver chamber. The chambers were placed on a roll-ing bench at 28 °C and samples were taken from the receiver chamber after 5 and 24 hours. Before analysis of these samples by GC/FID (see below), we tested 100 µl of each for fructose using 20 µl Benedict’s reagent (Benedict 1909) to verify the integ-rity of the CMs and the integrity of the chambers with mounted CMs. Those CMs or chambers that were found to be leaky because they had similar fructose concentra-tions in donor and receiver compartments after 5 hours were discarded and not used for further analysis. Receiver samples harvested from intact CMs and chambers were supplemented with 3 µg xylitol to serve as an internal standard, dried under constant N2-flow at 70 °C, derivatized to trimethylsilyl-ethers by adding 30 µl of the catalyst Pyridine and 30 µl of Bis(trimethylsilyl)-trifluoracetamid and incubated for 40 min at 70 °C. Fructose concentration was determined by GC-FID (5890 Series II Plus, HP, Agilent Technologies, Böblingen, Germany), equipped with a dimethylpolysi-loxane column (DB1 GC column, 30 m x 0.32 mm, 0.1 µm, J&W Scientific, Folsom, USA). One µl of each sample was injected. H2 flow was set to 37 kPa. The initial temperature was 65 °C for 3 minutes, after which the temperature was raised at a rate of 8 °C per min to a temperature of 240 °C, after which the rate was increased by 12 °C per min to a final temperature of 310 °C for 35 minutes. Data analysis was performed with GC ChemStation (Rev. B.03.02 (341), Agilent Technologies, Böblingen, Germany). Permeances were calculated using the following equation (Schreiber, Elshatshat et al. 2006): P=F/(AxΔc). Fructose flow F (g s-1) was obtained from the regression line fitted to the points that were obtained by plotting the amount of fructose (in grams) in the receiver chamber as a function of time, while A (m2) represents the area of exposed cuticle (1.13x10⁻⁴ m2) and Δc (g m-3) the difference in fructose concentration between the receiver and donor compartment (i.e. 180 g per L or 1.8 *105 g per m3).
Inoculation of isolated CMs with bacteriaTo measure localized diffusion of fructose, the receiver chambers were unmount-ed, the donor chambers were emptied, and the outside and inside of the CMs were washed with deionized water. The donor chamber was refilled with one mL of an 18 g L-1 fructose solution. Cells of Eh299R carrying (pPfruB-gfp[AAV]) (Leveau and Lindow 2001) were grown overnight on LB agar plates supplemented with 50 ng ka-namycin per mL at 30 °C, spun down for 10 min at 3000x g, washed twice in sterile water, and subsequently diluted with sterile water to an optical density of 1 at 600 nm, which corresponds to approximately 4x10⁸ bacterial colony forming units per mL. Plasmid (pPfruB-gfp[AAV]) confers resistance to kanamycin and codes for the expression of a short-lived version of the green fluorescent protein GFP[AAV] under

The Ecology of Bacterial Individuality64
the control of the fructose-responsive fruB promoter (Leveau and Lindow 2001). CMs were inoculated by pipetting 400 µl of this bacterial suspension on the physi-ological outer side of the cuticle as described by Knoll and Schreiber (Knoll and Schreiber 2004). Diffusion chambers were incubated with the inoculated side facing up for 6 hours at high relative humidity and 28 °C to facilitate adhesion of bacteria to the CM. Subsequently the bacterial suspension was carefully removed by pipet-ting and drying at room humidity for not more than 5 minutes. Next, the setup was transferred into a high humidity chamber and incubated at 28 °C for 16 hours.
Fluorescence microscopy and image analysisFor analysis of inoculated cuticles by fluorescence microscopy and to reveal the lo-cation of reporter bacteria responding to the local availability of fructose, the donor solution was removed and a 10 µl droplet of 75% glycerol supplemented with DAPI, to counterstain all bacteria (whether they were reporting fructose or not), was ap-plied to the center of the inoculated side of the cuticle and covered by a cover slip. Microscopy was performed using a Zeiss AxioPlan stereomicroscope at 400-fold magnification and two filter sets: BP365/FT395/LP397 (Zeiss filter set 1) for visu-alization of DAPI-stained cells and leaf autofluorescence, and 450-490/FT510/515-565 (Zeiss filter set 10) for visualization of bacteria expressing GFP. Images were taken in grey scale mode with a DMX1200 charged coupled device (Nikon Corpora-tion, Japan) and the Software Act-1 version 2.70 (Nikon Corporation, Japan). Images were analyzed with the software package ImageJ 1.45b (Abramoff, Magelhaes et al.
Figure 2 Diffusion of fructose across isolated Populus x canescens leaf cuticles. A) Ac-cumulation of fructose (in grams) as a function of time at a donor concentration of 0.18 g per mL. Shown is the linear regression (r2 = 0.99) with 95 % confidence intervals (broken lines) of the mean (n=10) diffusion of fructose over Populus x canescens leaf cuticles. Error-bars represent the standard error of measurement. B) Probability plot of the log-transformed fructose permeability (P, in m s-1) of individual Populus x cane-scens CMs. The dataset passed the D’Agostino & Pearson omnibus test for normality (P = 0.28)

Fructose diffusion across poplar cuticles 65
Figure 3 GFP-based bioreporting of fructose availability on isolated Populus x canes-cens cuticles. A-E: Epifluorescent images of Populus x canescens CMs inoculated with Eh299(pPfruB-gfp[AAV]). White scale bars represent 20 µm. Images are pseudo-colored merges of DAPI (blue) and GFP (green) channels; when fluorescence occured in both channels the visible color is yellow. The blue channel mainly shows autofluorescence of the CM and DAPI counterstained, non-fructose reporting bacteria. A) Area with many bacterial bioreporter cells but none that fluoresce to indicate exposure to fructose; the right-hand panel is a magnification of the photograph shown on the left-hand site, to show individual DAPI-stained bacteria. B-D) Typical arrangements of bioreporting bacteria on isolated Populus x canescens CMs. F) Light microscopy image of a Populus x canescens CM. Arrows point to sites with shed-off trichomes.

The Ecology of Bacterial Individuality66
2004) by creating pseudo-RGB images from photographs taken from the same area of the cuticle using the different filter sets. The area covered by green-fluorescent bacteria was determined using imageJ‘s measurement tools.
Results
Estimating fructose diffusion across isolated Populus x canescens cuticlesThe bulk permeance of ten individual CMs from poplar leaves was analyzed using a two-compartment experimental setup (Figure 1) that allowed the measurement of fructose diffusion from a donor compartment with a constant high fructose concen-tration across an isolated cuticle into a receiver compartment. Fructose abundances in the receiver compartment were quantified by gas chromatography and plotted as a function of time (Figure 2 A). From the slope of the best-fit line through these points, bulk permeances of Populus x canescens CMs for fructose were calculated as ranging from 2.54x10⁻¹⁰ to 2.78x10⁻⁸ m s-1. Values were log-normally distributed around an average log P of -8.46±0.67, which back-transformed to an average P of 3.39x10⁻⁹ m s-1 (Figure 2 B).
Frequency and size of fructose permeable sites on Populus x canescens cuticular membranesWe performed fluorescence microscopy analysis on three CMs that immediately af-ter the bulk flux measurements (see above) were exposed to the bacterial bioreporter Eh299R(pPfruB-gfp[AAV]) which responds to the presence of fructose by producing green fluorescence. The inoculation resulted in a homogeneous and random distri-bution of bacteria on the CMs as shown by DAPI counterstaining (Figure 3 A). In contrast, the distribution of DAPI-stained cells that also were green fluorescent was
Figure 4 Probability plot of the log-transformed size of fruc-tose permeable sites (in μm2) found on enzymatically isolat-ed Populus x canescens CMs. Data points were derived and pooled from three individual CMs.

Fructose diffusion across poplar cuticles 67
not random. Many occurred as part of circle- or ring-shaped clusters of different diameters (Figure 3B, C, D). The sizes of these clusters from three CMs were mea-sured and found to be lognormally distributed (Figure 4), with many small clusters and few large clusters. The largest site covered by green fluorescent bacteria was 4.7x104 µm2. Values were distributed around a log average of 3.42±0.74 which back-transformed to an average size of 2.62x103 µm2.The majority (79%) of clusters of green fluorescent bacteria were associated with sites of shed trichomes (e.g. Figures 3B and 3C). Thus, these structures appeared to be the main sites of fructose diffusion. We determined that 1 cm2 of the Populus x canescens leaf cuticles we used contained on average 138±67 shed trichome sites. Assuming a sugar-permeable area of 2.62x103 µm2 for each of these (see above), we can calculate that only 0.37% of the leaf cuticle surface allowed diffusion of fruc-tose high enough to induce GFP expression. Correspondingly, the permeance of the Populus x canescens CM at these sites would be 100/0.37 = 270 times higher than our bulk estimate, i.e. 270 x 3.39x10-9 = 9.15x10⁻⁷ m s-1.
DiscussionThe GC-FID-based detection method used here allowed us to determine that the average bulk permeance of Populus x canescens CMs for fructose was one orders of magnitude higher than that reported for isolated CMs of Juglans regia, i.e. 2.79x10-
10 m s-1 (van der Wal and Leveau 2011), but two orders of magnitude higher than Prunus laurocerasus, i.e.6.64x10-11 m s-1 (Krimm 2005). This is consistent with ear-lier findings (Kirsch, Kaffarnik et al. 1997) that cuticles of evergreens such as P. laurocerasus are less permeable than cuticles of deciduous trees such as Populus x canescens and J. regia.Aqueous pores are thought to be made up of hydrated polar functional groups in the cuticle (Chamel, Pineri et al. 1991). Values reported for aqueous pore sizes of plant leaf cuticles were determined for a series of isolated cuticles and showed av-erage radii of 5 Å estimated from trans-cuticular Ag+- and Cl--diffusion (Schreiber, Elshatshat et al. 2006). The hydrodynamic radius of a fructose molecule has been calculated to be 3.61 Å (Ribeiro, Santos et al. 2006), thus permeance of fructose through these pores should be possible. Interestingly, the estimates derived from our study can be used to get a better appreciation for the density of aqueous pores. The permeance P of an individual pore can be calculated from diffusion coefficient D for fructose in water, i.e. 7.44x10⁻¹⁰ m2 s-1 at 30°C (Ribeiro, Santos et al. 2006) and the length L of the path along which diffusion takes place. If we assume that the latter is approximated by the thickness of the cuticle, 2.8x10⁻⁶ m (Todeschini, Lingua et al. 2011), P can be calculated as D/L or 2.66x10⁻⁴ m s-1. This value is 7.84x10⁴ times

The Ecology of Bacterial Individuality68
higher than the bulk permeance we measured for the poplar cuticle. If diffusion of fructose only takes place through aqueous pores we can now estimate the relative area of the cuticle that is effectively permeable to fructose to be 100% / 7.84x104 = 1.28x10⁻³%. Assuming a pore radius of 5 Å, i.e. a pore area of 2.5x10⁻¹⁹ m2, the total number of pores per m2 can be calculated as 5.1x10¹³, which is close to the value of 3.5x10¹⁴ to 2x10¹⁵ pores per m2 reported for isolated Citrus aurantium cuticles (Sch-reiber and Schönherr 2009). Assuming that pores only occur at permeable sites (i.e. the basis of trichomes), the density of aqueous pores at these sites may be calculated as 270 times higher, i.e. 1.38x10¹⁶ aqueous pores per m2. However, these calculated values have to be used with great caution, and will need to be verified in future stud-ies.Our results with the GFP-based fructose bioreporter indicate that the poplar leaf cuticle features sites that are more permeable to fructose than most other sites on the cuticle. These preferential sites seemed to be clustered around shed trichomes. It has been shown that the base of plant leaf trichomes can be heavily cutinized (Fernández, Khayet et al. 2011), and so our findings and those of others (Schreiber, Elshatshat et al. 2006) can be explained by assuming that the observed increased permeability is specific to shed trichomes, representing sites that are structurally less integer than non-modified cuticular areas, as has been suggested for lenticels on fruit (Glenn and Poovaiah 1985) In the absence of measurement of cutin and waxes, however, this remains speculative and needs to be confirmed in future experiments.The predominant presence of sugar-diffusible sites around trichomes on the Populus x canescens cuticle is in good agreement with general observations that bacterial leaf colonizers often establish large populations around the base of trichomes (Monier and Lindow 2004). Trichomes have also been identified as sites where sugars are commonly and abundantly available to leaf-colonizing bacteria (Leveau and Lindow 2001). Heterogeneity in the availability of nutrients on the leaf surface is consistent with the recent observation that bacterial immigrants to the bean phyllosphere ex-perience very different fates (Remus-Emsermann and Leveau, 2010): while most cells divided a few times upon arrival, a few divided many more times. The latter was explained by assuming that those cells landed in sites of high nutrients access. Plants other than Populus x canescens, for example Vicia vaba and P. vulgaris posses aqueous pores not only around trichomes but also associated with other leaf features, such as guard cells of stomates, anticlinal cell walls and glandular trichomes (Schle-gel, Schönherr et al. 2005; Schreiber and Schönherr 2009). Based on this difference, our prediction would be that patterns of bacterial colonization on leaves from these plants would be different from those observed for poplar.

Fructose diffusion across poplar cuticles 69
In conclusion, the poplar leaf cuticle features sites that are more permeable to fruc-tose than most other sites on the cuticle. These preferential sites seemed to be clus-tered around shed trichomes. The estimated values for diffusion rates at these sites provide the first numerical estimation of micrometer scale carbohydrate availability in the phyllosphere. They will help to explain microbial growth patterns in the phyl-losphere and contribute to modeling of microbial growth in the phyllosphere, which so far has been hampered by experimentally derived estimates of carbohydrate dif-fusion and availability at scales that matter most to potential colonizers of the phyl-losphere.
AcknowledgementsFunding was provided by the Netherlands Organisation of Scientific Research (NWO) in the form of a personal VIDI grant to JHJL and by the German Research Foundation (DFG) to LS. This is NIOO-KNAW publication number 5101.

The Ecology of Bacterial Individuality70

Agent-based Simulation of Phyllosphere ColonizationASiMoPh
71
ASiMoPh – Agent-based Simulation of Microbial Phyllosphere Colonization Mitja N.P. Remus-Emsermanna,f*, Katrin Meyerb, Geerten M. Hengeveldc,d, Johan H.J. Leveaua,e,=
aDepartment of Microbial Ecology, Netherlands Institute of Ecology (NIOO-KNAW), Wageningen, The Netherlands, bFaculty of Forest Sciences and Forest Ecology, Ecosystem Modelling, Göttingen University, Göttingen, Germany, cPro-jectgroup Movement Ecology, department of Animal Ecology, Netherlands Institute of Ecology (NIOO-KNAW), Wageningen, The Netherlands, dTeam Forest Ecology, Alterra, Wageningen University, Wageningen, The Netherlands, eDepartment of Plant Pathology, University of California, Davis, CA, USA, fInstitute of Microbiol-ogy, Eidgenössische Technische Hochschule Zürich, Zürich, Switzerland*Current address
=Correspondence: Dr. Johan Leveau University of California One Shields AvenueDepartment of Plant PathologyDavis, CA, 95616, [email protected]
AbstractASiMoPh is an agent-based model of phyllosphere colonization, which was de-veloped to unravel the underlying causes of heterogeneity that influence bacterial growth in the phyllosphere. ASiMoPh describes the phyllosphere as a two-dimen-sional domain of patches that contain different amounts of energy. Agents, represent-ing bacteria, are released in this environment and reproduce based on the energy in their patch. The number of divisions that agents undergo is recorded and expressed as reproductive success. The total number of agents in the phyllosphere environment and in individual patches is also tracked. ASiMoPh reported a direct dependence of agent inoculation density on single-agent reproductive success in that higher initial densities lowered reproductive success. Furthermore, ASiMoPh reported that pre-emptively inoculated agents had a similar effect on secondary agents, lowering the reproductive success of secondary colonizers dramatically at high inoculation densi-ties. Both results are in good agreement with in vitro experiments performed with a bacterial bioreporter of reproductive success based on the bacterium Erwinia herbi-cola on Phaseolus vulgaris cotyledon-leaves (data obtained from chapter 3 and 4 in this thesis). In future studies ASiMoPh can serve as a foundation for phyllosphere
The Ecology of Bacterial Individuality72
modeling to answer more complex questions and incorporate more agent-agent and agent-environment interactions.
IntroductionMicroorganisms have traditionally been investigated at the level of populations and studies at the level of individual organisms and their interactions are still under-represented in microbiology. However, there are many good reasons for shifting the microbiological perspective to the micrometer scale at which microorganisms expe-rience their habitat, e.g. since microscopical techniques and fluorescent reporter and probe technologies made revolutionary advances in the last decades, the observation of individual bacteria is well possible (Pernthaler, Glöckner et al. 2001; Leveau and Lindow 2002; Musat, Halm et al. 2008; Remus-Emsermann, de Oliveira et al. 2011). Even microorganisms from a clonal population exhibit individuality in a homoge-neous environment (Davidson and Surette 2008; Roostalu, Joers et al. 2008). In a microbiological context, individuality means that microorganisms occupy a unique place in time and space that they do not share with others and have a unique cellular composition (Hughes 1956; Levin, Morton-Firth et al. 1998; Strovas, Sauter et al. 2007) which can create different stable phenotypes even within a clonal (i.e. geno-typically identical) population (Davidson and Surette 2008). Two types of tools are used in the study of single bacterial cells. One is based on ex-perimental techniques and allows us to manipulate and interrogate individual bacte-ria (Brehm-Stecher and Johnson 2004; Müller and Nebe-von-Caron 2010), the other tool involves modelling approaches to derive testable hypotheses, facilitate experi-mental planning, and analyze ecological processes. The number of applications of individual-based models (IBMs) in microbial ecology is rapidly growing (Hellweger and Bucci 2009). IBMs often follow a so-called pattern-oriented modeling (POM) approach (Grimm, Revilla et al. 2005) using patterns observed in real systems to compare them to the output of simplified models to justify the simplifications. IBMs in microbiology have been used to investigate phenomena such as biofilm and col-ony formation (Kreft, Booth et al. 1998; Lardon, Merkey et al. 2011), phytoplank-ton dynamics in aquatic systems (Woods and Onken 1982; Woods 2005; Hellweger 2008), the lag phase of bacterial growth (Dens, Bernaerts et al. 2005), and evolution of microorganisms (Lenski, Ofria et al. 2003; Chow, Wilke et al. 2004). More exam-ples of microbial IBMs were recently summarized in Hellweger and Bucci (2009).A microbial environment for which a spatially explicit IBM approach is still lack-ing is the plant leaf surface, or phyllosphere (Ruinen 1961). The phyllosphere is an extreme environment: e.g. widely fluctuating temperatures (Lindow and Brandl

Agent-based Simulation of Phyllosphere ColonizationASiMoPh
73
2003), highly localized and variable amounts of nutrition, e.g. fructose, glucose, and sucrose (Leveau and Lindow 2001; Remus-Emsermann and Leveau 2010; Remus-Emsermann, de Oliveira et al. 2011), and erratic periods of water stress (Beattie 2011). Leaf surfaces also feature a rich variation in topography full of grooves, veins, trichomes, stomata and glandular cells at the microscopic level. Despite the appear-ance of a seemingly stressful environment, the phyllosphere is a significant habitat for microbes of all kinds. For example, leaves worldwide have been estimated to cumulatively carry up to 1026 bacterial cells (Morris and Kinkel 2002).In a previous experimental phyllosphere study (Remus-Emsermann and Leveau 2010) we created a bioreporter that tracks individual reproductive success of bac-teria based on dilution of green fluorescent protein (GFP) during cell division and growth. Using this bioreporter, we have generated a database of patterns that show individual variation in bacterial reproduction on bean leaves under different condi-tions (this thesis chapter 3 and 4). So far, we have interpreted these patterns using a logistic-growth model that assumed a maximum number of bacteria that the leaf is able to sustain, which we called carrying capacity. However, this logistic model did not take into account death of bacterial individuals or resource replenishment in habitable sites in the phyllosphere. There is ample evidence that both these processes occur: living plant leaves leak sufficient amounts of substances that sustain micro-bial life in the phyllosphere (Tukey and Mecklenburg 1964; Leveau and Lindow 2001; Remus-Emsermann, de Oliveira et al. 2011), and bacteria do die (Monier and Lindow 2005; Monier and Lindow 2005). Here, we expanded the logistic growth model into a model that includes a replenishment component and bacterial death. By also including cell-to-cell heterogeneity and stochasticity of cell division, resource uptake, and movement we essentially translated the logistic model into one that is individual based and made it spatially explicit using the modelling program NetLogo (Wilensky 1999). Named “Agent-based Simulation of Microbial Phyllosphere colo-nization”, or short ASiMoPh, it is intended to facilitate the evaluation and interpre-tation of bacterial growth on the leaf surface to better understand the relationships between population increase, individual reproductive success, and environmental heterogeneity.
MethodsStudy organism and pattern-generating experimentThe bacterium Erwinia herbicola 299R (a.k.a. Pantoea agglomerans) is a model phyllosphere colonizer (Brandl and Lindow 1998; Leveau and Lindow 2001; Re-mus-Emsermann and Leveau 2010; van der Wal and Leveau 2011), originally iso-lated from a pear tree leaf (Brandl and Lindow 1996). Patterns of reproductive suc-
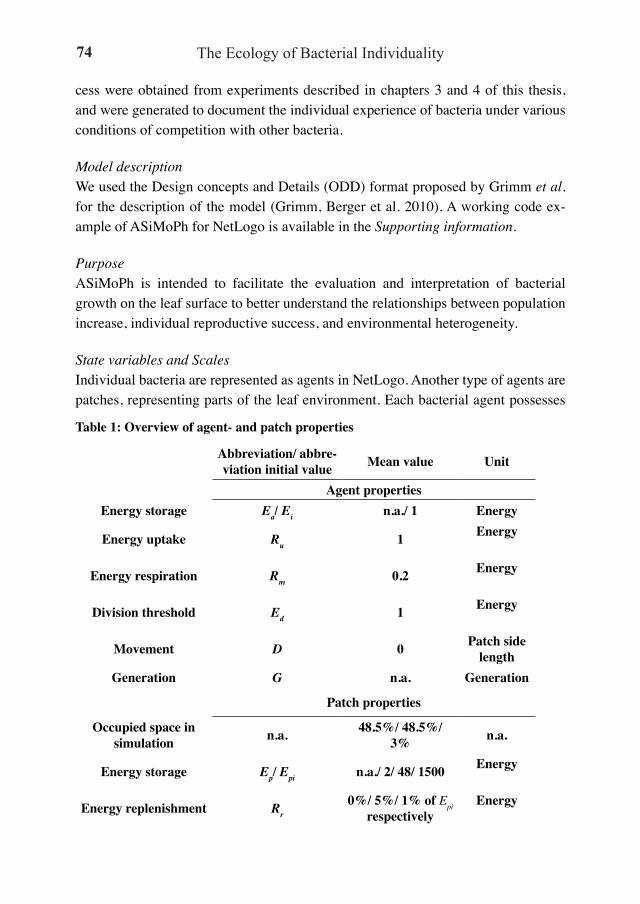
The Ecology of Bacterial Individuality74
cess were obtained from experiments described in chapters 3 and 4 of this thesis, and were generated to document the individual experience of bacteria under various conditions of competition with other bacteria.
Model descriptionWe used the Design concepts and Details (ODD) format proposed by Grimm et al. for the description of the model (Grimm, Berger et al. 2010). A working code ex-ample of ASiMoPh for NetLogo is available in the Supporting information.
PurposeASiMoPh is intended to facilitate the evaluation and interpretation of bacterial growth on the leaf surface to better understand the relationships between population increase, individual reproductive success, and environmental heterogeneity.
State variables and ScalesIndividual bacteria are represented as agents in NetLogo. Another type of agents are patches, representing parts of the leaf environment. Each bacterial agent possesses
Abbreviation/ abbre-viation initial value Mean value Unit
Agent propertiesEnergy storage Ea/ Ei n.a./ 1 Energy
Energy uptake Ru 1 Energy
Energy respiration Rm 0.2 Energy
Division threshold Ed 1 Energy
Movement D 0 Patch side length
Generation G n.a. Generation
Patch properties
Occupied space in simulation n.a. 48.5%/ 48.5%/
3% n.a.
Energy storage Ep/ Epi n.a./ 2/ 48/ 1500 Energy
Energy replenishment Rr0%/ 5%/ 1% of Epi
respectivelyEnergy
Table 1: Overview of agent- and patch properties

Agent-based Simulation of Phyllosphere ColonizationASiMoPh
75
the following attributes: an internal energy pool Ea; an initial pool of energy Ei; an ability to take up energy from its environment with rate Ru per model time step; a threshold of energy Ed, at which reproduction of the agent is triggered, followed by a redistribution of the two newly created agents with a dispersal distance D; bacte-ria metabolize a portion of their energy during every model time step to maintain their metabolism with the respiration-rate Rm; agents record their generation G. It is possible to release two sets of agents side by side or with a time interval into the simulation. Patch agents have the following attributes: initial energy Epi, current energy Ep, and energy replenishment rate Rr. The size of an individual patch corresponds to 2500 µm2, which is about the average size of a fructose-conductive site in the poplar phyl-losphere (Remus-Emsermann, de Oliveira et al. 2011). We used this area estimate since it is the only one available for fructose-conductive sites in the phyllosphere and the only estimate for patch size. All agent properties are summarized in table 1.
Due to computational constraints the simulation did not cover a whole leaf, but was restricted to a representative sample of the leaf environment measuring 1.05 mm x 1.05 mm or 1.1025 mm2, which represents approximately 0.02% of an average bean cotyledon. One model time step corresponds to the shortest average generation time
Algorithm 1:
Model initialization step:Randomized distribution of patches and agents; Ea = Ei; Ep = Epi
Repetitive process list:1) if Ep (current) > 0, bacterial agents take up energy from the patch they are in, so that Ep (new) = Ep (current) – Ru and Ea (new) = Ea (current) + Ru, if Ep (current) < Ru, Ru is reduced so that Ru = Ep (current) 2) bacterial agents divide and daughter cells are relocated with distance D if Ea > Ed; the generation of daughter agents increases by one; G = G + 1
3) bacterial agents metabolize Rm energy for maintenance of metabolism; Ea = Ea – Rm; bacterial agents die if Ea ≤ 0
4) patches that contain less than their initial-energy replenish energy until Ep = Epi; if Ep < Epi; Ep = Ep + Er

The Ecology of Bacterial Individuality76
of the bacterial strain Erwinia herbicola 299R on bean leaves, which is approxi-mately 1 hour 44 min (Leveau and Lindow 2001). Most experimental data derived from experiments that lasted 24 hours, which correspond to 14 time steps.
Process overview and schedulingIn each time step, bacterial agents take up energy, divide, redistribute, consume en-ergy, and survive or die (see algorithm 1). For every process step bacterial agents are randomized in a list that is processed concurrently. Patch agents replenish energy, simulating the natural process of leaching.
Design conceptsEmergence:Bacterial agents form micro-colonies within patches. The frequency distribution of bacterial numbers in patches is recorded and the current generation of all individual agents is recorded.
Prediction: ASiMoPh predicts bacterial population sizes from simulated individual cell repro-duction which is a function of the variation in available energy and number of agents in patches. By separating immigration events of two strains in time, the impact of primary colonizers on the subsequent growth of secondary colonizers can be inves-tigated.
Interaction: Interaction between bacterial agents is indirect and based on competition for energy that is heterogeneously available in patches. Individual patches are not connected, e.g., no lateral diffusion of energy is possible. Due to the redistribution of daughter cells after division, bacterial agents can reach adjacent patches.
Stochasticity: Stochastic processes in ASiMoPh include the following: (I) the initial positions of bacterial agents are randomized within the model grid. (II) Ei and Epi are chosen randomly from a normal distribution with a standard deviation of 25 % of the given average. Ei is on average 1. Epi averages are 2, 48, or 1500 (see initialization) (III) The bacterial agent attributes Ru, Ed, D, are chosen randomly around an average of 1, 2, and 0, respectively, with standard deviations of 0.01, 0.25, 0.015 every time step. (IV) For every process step that queries agents, agents are queried in a randomized

Agent-based Simulation of Phyllosphere ColonizationASiMoPh
77
order. The random number generator used in the simulation was based on Mersenne twister (Matsumoto and Nishimura 1998; Wilensky 1999). For the comparison of simulations the random number seed can be preset.
Collectives: Up to two different breeds of agents can be released into the world representing dif-ferent bacterial strains with different properties in terms of energy uptake, division threshold, energy consumption and movement after division.
Observation: The recorded model output consists of the distribution of reproductive success with-in agent groups, frequency distribution of agent counts per patch, total growth and death of each breed in the simulation, and the distribution of the available energy in patches.
Initialization: Initialization of ASiMoPh is user-controlled. As an exemplary study we setup a leaf-portion that contained three differential types of patches and a total of 441 patches. Patch kind one contained Ep
= 2 and covered 48.5 % of the leaf, patch kind two contained Ep
= 48 and covered 48.5 %, and patch kind three carried Ep = 1500 and
covered 3 % of the leaf. These values were extracted from a logistic model presented in a previous study (Chapter 3). In this study the values represented local carrying
Figure 1: Computational do-main, two-dimensional grid representation of a heteroge-neous surface consisting of 21 x 21 patches, approximately 1.05 mm x 1.05 mm, including 48.5% patches with low Ep, 48.5% of patches with intermediate Ep, and 3%patches with high Ep.

The Ecology of Bacterial Individuality78
capacities without considering replenishment so that one unit of energy sustained one cell. In the here presented study one unit of energy relates to the amount of energy needed for one cell division. Patch kind two and three replenished energy during each time step, patch kind two 5 percent of the initial value and patch kind three 1 percent of the initial value. These choices were made to obtain a total amount of energy in the system sufficient to sustain 3300 agents, but since movement in the model is limited, there will be unreached or unreachable patches if patches are not completely colonized. Related to the average size of a bean leaf the total number of agents would be 1.5x10⁷, which is in good agreement with CFUs often reported in the phyllosphere (Lindow and Brandl 2003). Agents enter the simulation with an average Ei of 1, an average reproductive threshold of Ed 1, an average energy uptake Eu of 1, an energy consumption Em of 20 percent of the energy uptake, and an average dispersal distance of D = 0 with a standard deviation of 0.015.
Simulation experiments:In study 1, one set of agents was released in different densities into the simulation, the average densities ranged from 2-2 to 25 per patch or 0.25 to 32 agents per patch. In study 2, two sets of agents were released subsequently with a difference of 14 time steps, or 24 hours, into the simulation, densities of both sets ranged from 2-4 to 25, or 0.0625 to 32 average agents per patch. The reproductive success of the individual agents was recorded and compared to laboratory experiments.
Figure 2: A – D Representative results of ASiMoPh after 24 simulated hours. Simula-tions were initiated with different numbers of agents. Average numbers of agents per patch were 0.25 (A), 2 (B), 4 (C), and 16 (D), respectively. Error bars represent the standard deviation of three replicate simulations. E - H) Data obtained in the lab from CUSPER cells that were inoculated on Phaseolus vulgaris cotyledons that were recov-ered after 24 hours. CUSPER-cells were inoculated in rising CFU densities per mL: 105, 106, 107, 108 (this thesis chapter 3). Error bars represent the standard deviation of two leaf replicates.
0 1 2 3 4 5 >50
20
40
60
80
0 1 2 3 4 5 >50
20
40
60
80
0 1 2 3 4 5 >50
20
40
60
80
0 1 2 3 4 5 >50
20
40
60
80
0 1 2 3 4 5 >50
20
40
60
80
0 1 2 3 4 5 >50
20
40
60
80
1 2 3 4 5 6 70
20
40
60
80
0 1 2 3 4 5 >50
20
40
60
80
Reproductive success
Rela
tive c
ontri
butio
n to
initi
al po
pulat
ion
A B C D
E F G H
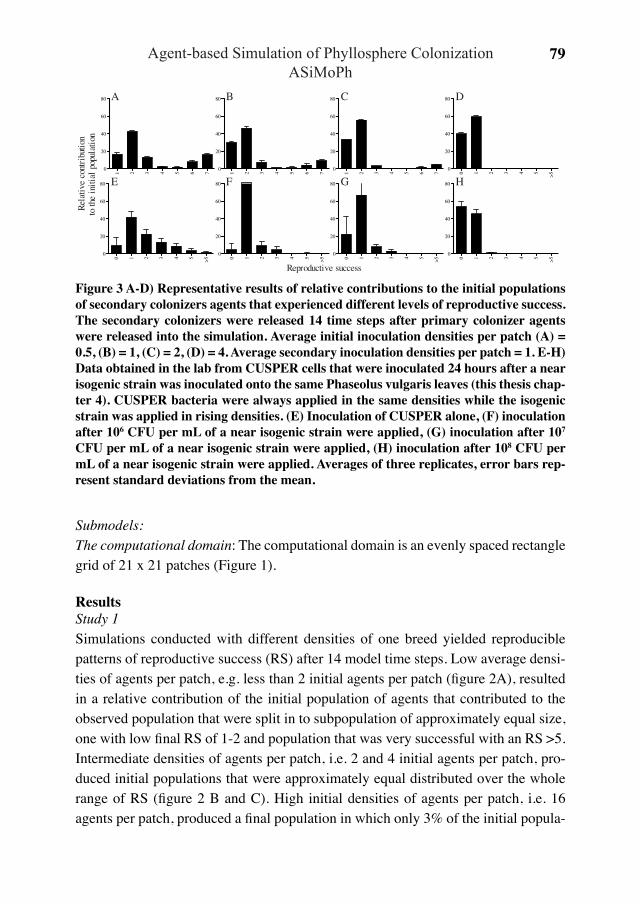
Agent-based Simulation of Phyllosphere ColonizationASiMoPh
79
Submodels:The computational domain: The computational domain is an evenly spaced rectangle grid of 21 x 21 patches (Figure 1).
ResultsStudy 1Simulations conducted with different densities of one breed yielded reproducible patterns of reproductive success (RS) after 14 model time steps. Low average densi-ties of agents per patch, e.g. less than 2 initial agents per patch (figure 2A), resulted in a relative contribution of the initial population of agents that contributed to the observed population that were split in to subpopulation of approximately equal size, one with low final RS of 1-2 and population that was very successful with an RS >5. Intermediate densities of agents per patch, i.e. 2 and 4 initial agents per patch, pro-duced initial populations that were approximately equal distributed over the whole range of RS (figure 2 B and C). High initial densities of agents per patch, i.e. 16 agents per patch, produced a final population in which only 3% of the initial popula-
1 2 3 4 5 6 7
0
20
40
60
80
1 2 3 4 5 6 7
0
20
40
60
80
1 2 3 4 5 6 7
0
20
40
60
80
0 1 2 3 4 5 >5
0
20
40
60
80
0 1 2 3 4 5 >5
0
20
40
60
80
0 1 2 3 4 5 >5
0
20
40
60
80
0 1 2 3 4 5 >5
0
20
40
60
80
0 1 2 3 4 5 >5
0
20
40
60
80
A B C D
E F G H
Rela
tive
cont
ribu
tion
to th
e in
itial
pop
ulat
ion
Reproductive success
Figure 3 A-D) Representative results of relative contributions to the initial populations of secondary colonizers agents that experienced different levels of reproductive success. The secondary colonizers were released 14 time steps after primary colonizer agents were released into the simulation. Average initial inoculation densities per patch (A) = 0.5, (B) = 1, (C) = 2, (D) = 4. Average secondary inoculation densities per patch = 1. E-H) Data obtained in the lab from CUSPER cells that were inoculated 24 hours after a near isogenic strain was inoculated onto the same Phaseolus vulgaris leaves (this thesis chap-ter 4). CUSPER bacteria were always applied in the same densities while the isogenic strain was applied in rising densities. (E) Inoculation of CUSPER alone, (F) inoculation after 106 CFU per mL of a near isogenic strain were applied, (G) inoculation after 107 CFU per mL of a near isogenic strain were applied, (H) inoculation after 108 CFU per mL of a near isogenic strain were applied. Averages of three replicates, error bars rep-resent standard deviations from the mean.

The Ecology of Bacterial Individuality80
tion were very successful with a RS of >5. The rest of the initial population created a pattern resembling a right-tailed or lognormal distribution (figure 2D). The first peak was at a RS of 1 while the second peak was at a RS of >5. More than 50 % of all initial agents experienced less than 3 doublings while the second peak encompassed only 2 – 4 % of all initial agents doubled more than 5 times.
Study 2The second experiment was conducted by releasing a set of agents 14 time steps prior to a second set of agents. The RS of the secondarily released set of agents was recorded and analyzed after an additional 14 time steps. Releasing low amounts of primary colonizing agents, i.e. ≤ 0.5 agents on average per patch, did not have large impacts on pattern observed at the single agent level (figure 3 A). The initial popula-tion was separated into two subpopulations, depending on the site of immigration. One successful population that achieved RS of 5 and more and one less successful population that encompassed about 70% of the total initial population and divided once on average. With rising numbers of preinoculated agents, secondary coloniz-ers became less successful. Especially colonizers that were exceptionally successful decrease until they vanish (figure 3 B, C and D). With the highest amount of prein-oculated agents only about 0.7% of the initial agents were able to divide twice (figure 3 D).
Discussion:We successfully translated a logistic growth model for bacterial phyllosphere colo-nization into a spatial-explicit, agent-based model.In study one the impact of inoculation density on the RS of the colonizers in silico was investigated. Using parameters extracted from a previously established model, the results that were obtained in silico are in good agreement with patterns found in vitro (figure 2 E-H). The spatially explicit approach used in this study here could recreate results that were obtained with a logistic growth model approach (this thesis chapter 3). This emphasizes the importance of space in this system and supports the notion that the Phaseolus vulgaris phyllosphere offers generally at least three differ-ent qualities of habitats, in different quantities, to bacterial colonizers. One habitat that does not permit many doublings of the colonizers even if they reach a resource source on their own and do not have to share resources, one habitat that permits more than one doubling for individual colonizers but not if several colonizers have to share the resources, and finally one or more kinds of habitats that allow growth even if large numbers of colonizers have to share resources. In vitro studies suggested that patch kinds one and two represent approximately equal and large portions of the

Agent-based Simulation of Phyllosphere ColonizationASiMoPh
81
phyllosphere while patch kind three covers only small portions (this thesis chapter 3). Due to limitations of the in vitro dataset to an observation of 5 doublings it is uncertain if these latter patches have to be distinguished into even more patches that offer differential amounts of resources to colonizers on average. The logistic model did not take individual agents into account instead reproductive success of all “bacteria” per site was averaged. ASiMoPh showed that it is possible to achieve the same results with stochastic differences between individual agents. ASiMoPh additionally provides an excellent framework for other various factors that are potentially of importance during phyllosphere colonization, e.g. movement with-in a leaf, changing environmental surroundings, like desiccation and environmental engineering of bacterial agents, antibiosis and many more. Although ASiMoPh is not restricted to leaf colonization, it can be used as a basis for simulations of many given heterogeneous environments, like soil, if simplified to a 2-dimensional domain.
AcknowledgementsFunding was provided by the Netherlands Organisation of Scientific Research (NWO) in the form of a personal VIDI grant to JHJL.

The Ecology of Bacterial Individuality82

Draft sequence of Erwinia herbicola 299R 83
Draft sequence and partial genome annotation of the phyllosphere model bacterium Erwinia herbicola strain 299RMitja NP Remus-Emsermanna and Johan HJ Leveaua,b,c aDepartment of Terrestrial Microbial Ecology, Netherlands Institute of Ecology (NIOO-KNAW), Wageningen, The Netherlands and bDepartment of Plant Pathol-ogy, University of California, Davis, CA, USA
IntroductionErwinia herbicola 299R (Eh229R; syn. Pantoea agglomerans, Enterobacter agglo-merans) is a spontaneous rifampicin-resistant derivative (Brandl and Lindow 1996) of Erwinia herbicola 299, a plant epiphytic bacterium that was isolated from pear leaves (‘Bartlett’ Pyrus communis) in April 1985 (Lindow, Desurmont et al. 1998). Since, it has been employed as a model strain for the study of commensal, bacterial colonizers of the phyllosphere. For example, Eh299R was used to assess how bacte-rial production of indole-3-acetic acid (IAA), contributes to phyllosphere fitness and to the formation of russets on fruit (Brandl, Clark et al. 1996; Brandl and Lindow 1996; Brandl and Lindow 1997; Brandl and Lindow 1998; Lindow, Desurmont et al. 1998; Manulis, Haviv-Chesner et al. 1998; Brandl, Quinones et al. 2001). Eh299R has also been used extensively in conjunction with fluorescent-protein based biore-porter technology to unravel and quantify the bacterial colonization and experience of plant surfaces, which revealed among other things, the uneven distribution of bacterial aggregates and nutrient resources such as sugars on leaves (Jaeger, Lindow et al. 1999; Leveau and Lindow 2001; Miller, Brandl et al. 2001; Monier and Lin-dow 2005; Monier and Lindow 2005; Remus-Emsermann and Leveau 2010; Remus-Emsermann, de Oliveira et al. 2011).
RationaleThe availability of the full genome sequence of Eh299R will allow deeper under-standing of its ability to successfully colonize leaf surfaces as well as omic-type in-vestigations such as transcriptional profiling during leaf colonization and compara-tive genomics with other plant-associated relatives for which genome sequences are available, i.e. Erwinia amylovora, Erwinia pyrifoliae, Pantoea ananatis, and Pan-toea vagans (De Maayer, Chan et al. 2010; Smits, Jaenicke et al. 2010; Smits, Rez-zonico et al. 2010; Smits, Rezzonico et al. 2010). Some of these are plant pathogens, others are not, or are in fact beneficial as biocontrol agents. The inclusion of a com-mensal in this group is likely to shed light on what genes or gene clusters define the pathogen or beneficial phenotype. Furthermore, given that the classification of the

The Ecology of Bacterial Individuality84
species Erwinia herbicola is still ambiguous (Rezzonico, Smits et al. 2009), a full genome sequence may further enlighten this issue and help distinguish and reclassify bacterial strains that are currently grouped under the name Erwinia herbicola.
ResultsEh299R genomic DNA of an overnight culture, isolated using the Qiagen midi kit genomic DNA isolation (Venlo, The Netherlands), was sequenced using the Illumina platform technology by BaseClear (Leiden, The Netherlands) resulting in ~12.9 mil-lion paired-end reads with an average length of 48 bp and an average insert size of 336 bp. Quality filtered reads were assembled de novo with different tools: Velvet 1.1.02 (Zerbino and Birney 2008; Zerbino, McEwen et al. 2009) using the full se-quence set, and SeqMan NGen 3.04 build 10 (DNASTAR, Madison WI, USA) using a subset of 5 million reads. A comparison of both assembly results is given in Table 1. Annotation was performed on all contigs greater than 100 bp using the RAST prokaryotic genome annotation server (Aziz, Bartels et al. 2008). Depending on the assembly tool that was used, the genome was predicted to posses between 4303 and 4436 coding sequences of which 77 – 81 % were predicted to be non-hypothetical. RAST predicted 68 to 80 RNA coding sequences to be present in the genome. The
Velvet 1.1.02 Lasergene SeqMan NGen 3.06 build 10
Contigs > 100 (bp) 314 159N50 (kb) 35 59Scaffolds 189 92
Scaffold > 100 (bp) 55 92Scaffold average length
(kb) 24 29
Scaffold max length (kb) 619 265Total sequence length
(Mb) 4.64 4.77
Coding sequences pre-dicted by RAST 4239 4504
Non hypothetical genes predicted by RAST 3275 3456
RNA CDS predicted by RAST 64 68
Table 1: Comparison of draft assembly using Velvet and SeqMan NGen

Draft sequence of Erwinia herbicola 299R 85
genome has a GC content of 54.3 %.The software r2cat, which allows comparison of genomes that are somewhat related (Husemann and Stoye 2010) was used as a tool to orient Eh299R contigs, by using the recently published genome of the related bacterial strain Pantoea vagans C9-1 as a reference (Smits, Rezzonico et al. 2010). r2cat was able to align 61 out of 112 scaffolds assembled by Velvet (Figure 1 A). The other 51 contigs which accounted for 44 Kb of genetic information could not be aligned to the C9-1 genome. r2cat was able to align 145 out of 159 contigs assembled by SeqMan NGen (Figure 1 B). 14 contigs which account for 157 kb genetic information could not be aligned to the C9-1 sequence. Sequences that r2cat was not able to align against Pantoea vagans C9-1 may represent genetic information that is unique to Eh299R. Future work on the Eh299R genome will include the filling-in of sequence gaps with either traditional Sanger sequencing or next generation sequencing using larger in-sert sizes to allow better resolution of scaffolds and more in-depth annotation.
A B
Reference genome Panteoa vagans C9-1
Que
ried
con
tigs
and
scaf
fold
s
Figure 1 r2cat dot-plot of two Eh299R genome assemblies (Velvet, panel A; SeqMan NGen, panel B) versus the reference genome of Pantoea vagans C9-1. Queried contigs and scaffolds were ordered against the reference using the automatic order function of r2cat. Grey lines represent scaffold and contig termini.
AcknowledgementsFunding was provided by the Netherlands Organisation of Scientific Research (NWO) in the form of a personal VIDI grant to JHJL.

The Ecology of Bacterial Individuality86
General discussion and synthesis 87
General discussion and synthesisThe notion of bacterial individuality, although around for several decades (Hughes 1956; Spudich and Koshland Jr 1976), was only recently revived in the scientific literature (Avery 2006; Davidson and Surette 2008; Zengler 2009; Müller and Nebe-von-Caron 2010). In studying bacterial individuality, one works under the premise that bacteria are individuals, and should be treated as such, as opposed to only as populations, as is usually the case in classical microbiology. This thesis has focused on the development of a framework that allows bacterial individuality to be consid-ered as a more quantifiable concept in ecology. To date, most studies examining bac-terial individuality do so from the perspective of cellular processes e.g. differences in gene regulation, mRNA, or protein stochasticity (Shapiro 2000; Avery 2006; Smits, Kuipers et al. 2006; Musat, Halm et al. 2008). In contrast to these studies, my aim in this thesis has been to focus on bacterial individuality by regarding bacteria as spatial individuals: individuals that occupy a specific place in time and space and make use of, and influence, their local environment. By using the experimentally amendable system of the leaf surface, or phyllosphere, I seek to offer a case study in a natural, yet relatively low-complexity (compared to other habitats, e.g. soil) environment. I used colonization experiments in the phyllosphere to develop a proof of concept for bacterial individuality in ecology. The phyllosphere is not only interesting as an ecological case study, but many ques-tions concerning the colonization of microbes in the phyllosphere are still unan-swered. This thesis has addressed the following specific issues (1) the development and characterization of a bacterial bioreporter for reproductive success (RS) called CUSPER, (2) a (re)-definition of the term carrying capacity in the phyllosphere to a sum of local carrying capacities, (3) the impact of pre-emptive competition on sec-ondary colonizers at the single-cell level, (4) the analysis of spatially variable local flux of fructose across leaf cuticles, (5) the creation of an individual-based model that aims to explain differences in individual reproductive success as a function of environmental heterogeneity and local competition, (6) and the draft assembly and preliminary genome annotation of the phyllosphere model strain Erwinia herbicola 299R.
Reproductive success as a measurement of colonization and environmental het-erogeneity The main tool that was established for this thesis is a bacterial bioreporter that is able to report on the RS of single-cells. Called CUSPER, this bioreporter is based on the dilution of stable green fluorescent protein (GFP) from growing cells of Erwinia

The Ecology of Bacterial Individuality88
herbicola 299R that no longer produce GFP de novo. To achieve this functionality, cells were filled with GFP by induction with Isopropyl β-D-1-thiogalactopyranoside (IPTG) prior to the experiment and introduced into an IPTG-free environment. CUSPER thereby enabled me to determine the reproduction of single cells in arti-ficial environments such as a shaken liquid culture (see chapter 2) or agar plates (data not shown) by analyzing GFP content of individual bacterial cells and follow their growth for up to six doublings, at which point the GFP signal was too low to be differentiated from background fluorescence. CUSPER also showed differences in individual growth success of Erwinia herbicola 299R cells (Eh299R) on Phaseolus vulgaris leaves. The results in chapter 2 show that cells arriving in the phyllosphere experienced various degrees of local ‘habitability’. The results yielded a picture of a population where inoculated bacterial cells contributed unequally to the observed final population, e.g. we found that after 9 hours 29 % of the initial cells contributed to only 5 % of the observed population, whereas another 23 % of the initial popula-tion contributed to 51 % in the final population. We could show that growth curves based on colony forming unit (CFU) measurements and CUSPER single-cell data yielded similar results.
Describing the ecological paradigm of carrying capacity at scales that matter for bacteria While many ecological theories have been well developed for higher organisms, proper translations of these theories to microbiological contexts are often lacking. For example, the term carrying capacity, as typically used in microbial ecology lit-erature, refers to environmental scales that can hardly be perceived by bacterial indi-viduals, e.g. the total surface of a plant leaf (Wilson and Lindow 1995; Nix, Burpee et al. 2009). For bacteria residing on a leaf it is most likely that their activity and fate is based on perception of and response to their immediate local environment (Leveau 2006). My goal has been to record variation in this environment, which encompasses many factors such as nutrient availability and exposure to stress and competitors, not through a description of the dimensions and quality of that environment, but by quantifying the bacterial response to this environment. In chapter 2, I described that the phyllosphere exhibits a heterogeneity of patches with different levels of habitability, while in chapter 3, I showed that saturating the leaf with different densities of bacteria yielded information about the relative occur-rence and quality of these habitable sites. More specifically, low inoculation densi-ties revealed that 45-50% of evenly spread bacteria arriving on a leaf experienced an environment that did not allow them to divide more than once within 24 hours.
General discussion and synthesis 89
The remaining population experienced more than 5 doublings. Higher inoculation densities, on the other hand, revealed that 45-50 % of the tested bean phyllosphere consists of sites of intermediate lognormal distributed carrying capacity, i.e. the sum of resources available that allow growth and stress factors that inhibit growth. Inter-estingly, even at very high inoculation densities, 2-3 % of the population experienced more than 5 doublings within 24 hours, providing evidence for the existence of dis-tinct sites in the phyllosphere that are highly conducive to growth. The more bacteria inoculated, the more predictable the resulting growth pattern, which is in line with the assumption that we saturated a heterogeneous environment to different degrees. These results were used to formulate a logistic growth model that we adapted from Kinkel et. al. (Kinkel, Newton et al. 2002), and that was able to reproduce the experi-mental results. Thus, phyllosphere carrying capacity that can be observed by CFU measurements is a sum of local carrying capacities. These findings greatly improve our current picture of the ecology of the phyllosphere by adding quantitative knowl-edge of the distribution of site qualities and an estimation of the probability for suc-cessful colonization of the phyllosphere by bacteria.
Impact of secondary colonization in the phyllosphere on reproductive successChapter 4 sought to investigate the mechanism of preemptive exclusion by com-bining a preemptively inoculated red fluorescent strain, Erwinia herbicola 299R (pFRU97), with near-isogenic cells of CUSPER, i.e. Erwinia herbicola 299R::JBA28 (pCPP39). One strategy that is available and sometimes used to prevent the onset of disease in agriculture is to preemptively inoculate crops with biocontrol agents (BCAs) prior to outbreaks of plant pathogenic organisms such as Erwinia amylovora (Stockwell, Johnson et al. 2010). The mechanisms by which BCAs control pathogens have typi-cally been observed via top-down population-based measurements (Wilson and Lin-dow 1994; Braun-Kiewnick, Jacobsen et al. 2000; Nix, Burpee et al. 2009; Stock-well, Johnson et al. 2010; Xu, Salama et al. 2010). By making use of CUSPER, it was possible to evaluate the impact of preemptively inoculated bacteria on second-ary colonizers using a bottom-up approach.Colony forming unit data and single-cell data both showed that the success of sec-ondary colonizers depended on the density of primary colonizers. By applying the previously formulated model for phyllosphere colonization (chapter 3), I showed how different timing and densities of preinoculated colonizers inhibited the growth of secondary colonizers to different degrees. These results provide insights into how biocontrol agents (BCAs) might impede pathogen establishment, thereby providing

The Ecology of Bacterial Individuality90
crop protection. In cases of preemptive exclusion, biocontrol functionality is facili-tated by an even distribution, in high numbers, and with a sufficient time advantage.
Determining the local permeability of carbohydrates through a plant cuticleOn plant leaf surfaces, carbohydrates more specifically photoassimilates such as fructose, glucose and sucrose, are the major source of energy and carbon for most phyllosphere colonizers (Mercier and Lindow 2000; Leveau and Lindow 2001). Be-ing produced on the inside of the leaf during photosynthesis, they reach the leaf surface in a process called leaching (Tukey 1966).One of the major gaps in our understanding of the phyllosphere environment, and modeling of this environment, involves the rate by which carbohydrates are locally released into the phyllosphere. Quantitative measurements of local sugar permeation are difficult (Leveau and Lindow 2001; Miller, Brandl et al. 2001) and permeation studies for carbohydrates have typically been restricted to bulk measurements of larger leaf areas (Tukey and Mecklenburg 1964; Mercier and Lindow 2000; van der Wal and Leveau 2011). By combining local semi-quantitative observations with area-dependent bulk measurements, I was able overcome this limitation and address in quantitative terms the lateral heterogeneity of carbohydrate diffusion across leaf cuticles. For this, isolated, trichome- and stomata-free, leaf cuticles from poplar, Populus x canescens, were used. By combining gas chromatography, coupled with a flame ionization detector (GC-FID) and a GFP-based bacterial bioreporter, I was able to pinpoint the lateral differences in permeance of fructose and to estimate the perme-ability of these sites. GC-FID results revealed an average bulk permeance for fruc-tose of 3.39 x 10⁻⁹ m s-1. Following this analysis, bioreporter cells were introduced on the same isolated cuticles. The analysis via epifluorescence microscopy revealed a patchy, non-random pattern of fructose-sensing bioreporters, corresponding to sites with higher fructose permeance. These sites were predominantly co-occurring with shed trichome sites. By relating the total area that these sites cover on the cuticle, the permeance of these sites for fructose appeared 270 times higher than the bulk perme-ance of the isolated cuticle.Together with the studies described in chapters 2-4 that dealt with the heterogene-ity of colonization success, the heterogeneity of available nutrients demonstrates, at least in part, that the differences in growth conduciveness between sites can be linked to differences in nutrient availability.
General discussion and synthesis 91
Modeling bacterial colonization in the phyllosphereThe data collected for chapter 2-5 were used as a foundation to create an agent-based model, called agent-based simulation of microbial phyllosphere colonization or simply “ASiMoPh”. The aim of ASiMoPh is to aid our understanding of the un-derlying mechanism of heterogeneity and how such habitat heterogeneity determines variability in the success of bacterial colonizers of the leaf environment. Another reason was that, even though the logistic growth model formulated in chapter 3 and 4 was able to recreate the patterns that were observed experimentally, it completely dismissed the possibility of death within the bacterial population on the leaf. It also did not take into account the possibility of resource replenishment. Both factors are crucial to capture the essence of carrying capacity, an equilibrium around which a population oscillates. Another reason to shift to a model that is rule-based and uses agents was to explicitly follow the concept of bacterial individuality in modeling. Furthermore, ASiMoPh is spatially explicit Other models for growth and BCA plant pathogen interaction are available, but they too function under the premise that the leaf environment is not spatially explicit (Kinkel, Newton et al. 2002; Xu, Salama et al. 2010). The model was created in NetLogo (Wilensky 1999) and features agents represent-ing bacteria and patches on which bacterial agents can feed. The model parameters include the uptake of nutrients, a threshold of energy that agents need to reach before they divide, a metabolism uptake that agents have to pay every time step and death of individual agents if they have consumed all energy. Patches possess energy and can replenish it during the simulation while agents are feeding on it. By adding both processes, it is possible for agents to reach an equilibrium between growth and death rate, or carrying capacity. Based on the observations of the average size of fructose permeable sites in a cuticle, the patch size in the model was determined to represent 2500 µm2 (chapter 5). To keep computational demands feasible, 441 patches per simulation were assumed, which corresponds to about 0.02% of an average bean leaf. Thus far, ASiMoPh was able to recreate population patterns as were observed in chapter 3 and 4 and explain the results in an individual-based modeling setup.
Sequencing of the phyllosphere model bacterium Erwinia herbicola strain 299RI successfully performed the first steps to sequence the genome of the phyl-losphere model bacterium Erwinia herbicola strain 299R. A draft genome sequence was obtained and annotated. The availability of the full genome sequence will enable further research of mechanisms used by this strain to survive the harsh conditions in the phyllosphere. The species Erwinia herbi-

The Ecology of Bacterial Individuality92
cola is rather heterogeneous and contains strains that are opportunistic patho-gens as well as plant commensals that are used as certified BCAs (Rezzonico, Smits et al. 2009; Smits, Rezzonico et al. 2010). With the availability of a genome that derives from a non-human pathogenic-, plant commensal strain, and together with other recently published sequences of related Pantoea and Erwinia strains (De Maayer, Chan et al. 2010; Smits, Jaenicke et al. 2010; Smits, Rezzonico et al. 2010), I hope to shed light into this issue and maybe help to reclassify strains collected under the current name.
Perspectives for future lines of researchOne of the major limitations of the CUSPER bioreporter used during the larger part of this PhD project lies in the fact that the limit of detection is reached after 6 dou-bling even under the best possible experimental circumstances. By using the same principle of dilution but other means of detection and reporter molecules, it might be possible to lower this limit of detection significantly. One might consider using isotope-labeled molecules to incorporated them into cells and apply Nano secondary ion mass spectrometry (NanoSIMS) to detect the amount of label left after incuba-tion (Li, Wu et al. 2008). This would greatly increase the time that a reporter work-ing with a dilution principle is able to track population development and eliminates the necessity to modify the bacteria used for experimentation with plasmids and/or transposons.To enhance the possibilities of multi-strain experiments, it will be useful to create differentially colored variants of the CUSPER bioreporter and to equip additional bacterial strains with CUSPER. Experiments with CUSPER-equipped pathogenic bacteria as secondary and co-colonizers together with biocontrol strains will yield interesting results that could be combined with enhanced versions of ASiMoPh (see below). Due to analytical problems, i.e. uneven background due to autofluorescence of the leaf, the analysis of CUSPER directly on the leaf surface has been difficult but promising advances have recently been made and will hopefully soon provide insightful results (Tecon, unpublished).Bottom-up approaches using CUSPER bioreporter-equipped bacteria is expected to be of use in describing the experience of bacterial colonizers in other environments, too, especially in complex heterogeneous environments like soil or other, non-water saturated habitats.The determination of the size of carbohydrate permeable sites in the phyllosphere was crucial for phyllosphere modeling. Since we now have the first estimates of the magnitude of permeance, future models, including future versions of ASiMoPh, can

General discussion and synthesis 93
employ these estimates to increase our knowledge of growth patterns in the phyl-losphere. Up until now, ASiMoPh has been able to predict the growth of bacteria in a hetero-geneous environment that is only based on resource competition. In future versions, ASiMoPh could be enhanced with features that include interactions based on agent counts on patches to trigger behavior like production of antibiotic production and leaf bioengineering. This will help to predict the interaction with antibiotic-produc-ing BCAs and leaf-bioengineering pathogens. In the future, bacterial individuality will prove to be an important framework for microbial ecology. It will be possible to address fundamental ecological and evo-lutionary questions in bacterial systems, which will allow, in comparison to macro-ecological systems, rapid validation of hypotheses with virtually unlimited number of individuals in replicate experiments. The development of new techniques that al-low or facilitate the analysis of bacterial individuals has made tremendous advances in the areas of fluorescence in situ hybridization (FISH), multicolored fluorescence bioreporters, as well as of flow cytometry and microscopical techniques. As these techniques further ease the analysis and interpretation of single-cells, they will be-come extremely useful for testing of general ecological and economical theories and models pertaining to individuality.

The Ecology of Bacterial Individuality94

References 95
Abd-El-Haleem, D., S. Zaki, et al. (2006). “Acinetobacter bioreporter assessing heavy metals toxicity.” Journal of Basic Microbiology 46(5): 339-347.
Abramoff, M., P. Magelhaes, et al. (2004). “Image processing with ImageJ.” Biophotonics international 11(7): 36-42.
Amann, R., B. M. Fuchs, et al. (2001). “The identification of microorganisms by fluorescence in situ hybridisation.” Current Opinion in Biotechnology 12(3): 231-236.
Andersen, J. B., C. Sternberg, et al. (1998). “New unstable variants of green fluorescent protein for studies of transient gene expression in bacteria.” Applied and Environmental Microbiology 64(6): 2240-2246.
Anderson, P. K., A. A. Cunningham, et al. (2004). “Emerging infectious diseases of plants: pathogen pollution, climate change and agrotechnology drivers.” Trends in Ecology & Evolution 19(10): 535-544.
Andrews, J. H. (1992). “Biological control in the phyllosphere.” Annual Review of Phytopathology 30(1): 603-635.
Andrews, J. H. and R. F. Harris (2000). “The ecology and biogeography of microorganisms of plant surfaces.” Annual Review of Phytopathology 38: 145-180.
Avery, S. V. (2006). “Microbial Cell Individuality and the Underlying Sources of Heterogeneity.” Nature Reviews Microbiology 4(8): 577-587.
Axtell, C. A. and G. A. Beattie (2002). “Construction and characterization of a proU-gfp transcriptional fusion that measures water availability in a microbial habitat.” Applied and Environmental Microbiology 68(9): 4604-4612.
Aziz, R., D. Bartels, et al. (2008). “The RAST Server: Rapid Annotations using Subsystems Technology.” BMC Genomics 9(1): 75.
Barthlott, W. and C. Neinhuis (1997). “Purity of the sacred lotus, or escape from contamination in biological surfaces.” Planta 202(1): 1-8.
Beattie, G. A. (2011). “Water relations in the interaction of foliar bacterial pathogens with plants.” Annual Review of Phytopathology 49(1): 533-555.
Beattie, G. A. and S. E. Lindow (1999). “Bacterial colonization of leaves: A spectrum of strategies.” Phytopathology 89(5): 353-359.
Begon, M., J. L. Harper, et al. (1996). Ecology: Individuals, populations, and community, Blackwell Publishing.
Benedict, S. R. (1909). “A reagent for the detection of reducing sugars.” Journal of Biological Chemistry 5(5): 485.
Bertelsen, J. R., E. De Neergaard, et al. (2001). “Fungicidal effects of azoxystrobin and epoxiconazole on phyllosphere fungi, senescence and yield of winter wheat.” Plant Pathology 50(2): 190-205.
Beuchat, L. R. (1996). “Pathogenic microorganisms associated with fresh produce.” Journal of Food Protection 59(2): 204-216.
Bradshaw, H. D., R. Ceulemans, et al. (2000). “Emerging model systems in plant biology: Poplar (Populus) as a model forest tree.” Journal of Plant Growth Regulation 19(3): 306-313.
Brandl, M., E. M. Clark, et al. (1996). “Characterization of the indole-3 acetic acid (IAA) biosynthetic pathway in an epiphytic strain of Erwinia herbicola and IAA production in vitro.” Canadian Journal of Microbiology 42(6): 586-592.

The Ecology of Bacterial Individuality96
Brandl, M. T. (2008). “Plant lesions promote the rapid multiplication of Escherichia coli O157:H7 on postharvest lettuce.” Applied and Environmental Microbiology 74(17): 5285-5289.
Brandl, M. T. and S. E. Lindow (1996). “Cloning and characterization of a locus encoding an indolepyruvate decarboxylase involved in indole-3-acetic acid synthesis in Erwinia herbicola.” Applied and Environmental Microbiology 62(11): 4121-4128.
Brandl, M. T. and S. E. Lindow (1997). “Environmental signals modulate the expression of an indole-3-acetic acid biosynthetic gene in Erwinia herbicola.” Molecular Plant-Microbe Interactions 10(4): 499-505.
Brandl, M. T. and S. E. Lindow (1998). “Contribution of indole-3-acetic acid production to the epiphytic fitness of Erwinia herbicola.” Applied and Environmental Microbiology 64(9): 3256-3263.
Brandl, M. T., B. Quinones, et al. (2001). “Heterogeneous transcription of an indoleacetic acid biosynthetic gene in Erwinia herbicola on plant surfaces.” Proceedings of the National Academy of Sciences of the United States of America 98(6): 3454-3459.
Braun-Kiewnick, A., B. J. Jacobsen, et al. (2000). “Biological control of Pseudomonas syringae pv. syringae, the causal agent of basal kernel blight of barley, by antagonistic Pantoea agglomerans.” Phytopathology 90(4): 368-375.
Brehm-Stecher, B. F. and E. A. Johnson (2004). “Single-cell microbiology: Tools, technologies, and applications.” Microbiology and Molecular Biology Reviews 68(3): 538-+.
Brune, A. (1998). “Termite guts: the world’s smallest bioreactors.” Trends in Biotechnology 16(1): 16-21.
Chalfie, M., Y. Tu, et al. (1994). “Green fluorescent protein as a marker for gene-expression.” Science 263(5148): 802-805.
Chamel, A., M. Pineri, et al. (1991). “Quantitative determination of water sorption by plant cuticles.” Plant, Cell & Environment 14(1): 87-95.
Chow, S. S., C. O. Wilke, et al. (2004). “Adaptive radiation from resource competition in digital organisms.” Science 305(5680): 84-86.
Chung, J. D., S. Conner, et al. (1995). “Flow cytometric study of differentiating cultures of Bacillus subtilis.” Cytometry 20(4): 324-333.
Claesson, M. J., Q. Wang, et al. (2010). “Comparison of two next-generation sequencing technologies for resolving highly complex microbiota composition using tandem variable 16S rRNA gene regions.” Nucleic acids research 38(22): e200.
Cormack, B. P., R. H. Valdivia, et al. (1996). “FACS-optimized mutants of the green fluorescent protein (GFP).” Gene 173(1): 33-38.
Davey, H. M. and D. B. Kell (1996). “Flow cytometry and cell sorting of heterogeneous microbial populations: The importance of single-cell analyses.” Microbiological Reviews 60(4): 641-&.
Davey, H. M. and M. K. Winson (2003). “Using flow cytometry to quantify microbial heterogeneity.” Current issues in molecular biology 5(1): 9-15.
Davidson, C. J. and M. G. Surette (2008). “Individuality in bacteria.” Annual Review of Genetics 42: 253-268.

References 97
De Maayer, P., W. Y. Chan, et al. (2010). “Genome sequence of Pantoea ananatis LMG20103, the causative agent of eucalyptus blight and dieback.” J. Bacteriol. 192(11): 2936-2937.
Delaquis, P., S. Bach, et al. (2007). “Behavior of Escherichia coli O157:H7 in leafy vegetables.” Journal of Food Protection 70(8): 1966-1974.
Delmotte, N. l., C. Knief, et al. (2009). “Community proteogenomics reveals insights into the physiology of phyllosphere bacteria.” Proceedings of the National Academy of Sciences of the United States of America 106(38): 16428-16433.
Denoncourt, P., S. Caillet, et al. (2007). “Bacteriological and chemical changes occurring in Bunker-stored silage covered with biodegradable coating.” Journal of Applied Microbiology 103(2): 261-270.
Dens, E. J., K. Bernaerts, et al. (2005). “Cell division theory and individual-based modeling of microbial lag: Part I. The theory of cell division.” International Journal of Food Microbiology 101(3): 303-318.
Dobell, C. (1933). “Antony Van Leeuwenhoek and his “little animals.”.” The American Journal of the Medical Sciences 186(2): 287.
Duineveld, B. M. and J. A. Van Veen (1999). “The number of bacteria in the rhizosphere during plant development: relating colony-forming units to different reference units.” Biology and Fertility of Soils 28(3): 285-291.
Dulla, G. and S. E. Lindow (2008). “Quorum size of Pseudomonas syringae is small and dictated by water availability on the leaf surface.” Proceedings of the National Academy of Sciences of the United States of America 105(8): 3082.
Eberl, L., R. Schulze, et al. (1997). “Use of green fluorescent protein as a marker for ecological studies of activated sludge communities.” Fems Microbiology Letters 149(1): 77-83.
Elad, Y. and B. Kirshner (1993). “Survival in the phylloplane of an introduced biocontrol agent Trichoderma harzianum and populations of the plant pathogen Botrytis cinerea; as modified by abiotic conditions.” Phytoparasitica 21(4): 303-313.
Emonet, T., C. M. Macal, et al. (2005). “AgentCell: a digital single-cell assay for bacterial chemotaxis.” Bioinformatics 21(11): 2714-2721.
Fernández, V., M. Khayet, et al. (2011). “New insights into the properties of pubescent surfaces: the peach fruit (Prunus persica Batsch) as a model.” Plant Physiology.
Fierer, N. (2007). “Finding a place for microorganisms in the field of ecology.” Ecology 88(5): 1336-1337.
Fierer, N., M. Hamady, et al. (2008). “The influence of sex, handedness, and washing on the diversity of hand surface bacteria.” Proceedings of the National Academy of Sciences of the United States of America 105(46): 17994-17999.
Frank, C., M. S. Faber, et al. (2011). “Large and ongoing outbreak of haemolytic uraemic syndrome, Germany, May 2011.” Eurosurveillance 16(21): 2-4.
Goszczynska, T., W. J. Botha, et al. (2007). “Isolation and identification of the causal agent of brown stalk rot, a new disease of maize in South Africa.” Plant Disease 91(6): 711-718.

The Ecology of Bacterial Individuality98
Green, J. and B. J. Bohannan (2006). “Spatial scaling of microbial biodiversity.” Trends in ecology & evolution 21(9): 501-507.
Gregory, R., J. R. Saunders, et al. (2006). “The Paton individual-based model legacy.” Biosystems 85(1): 46-54.
Grijspeerdt, K., J. U. Kreft, et al. (2005). “Individual-based modelling of growth and migration of Salmonella enteritidis in hens’ eggs.” International Journal of Food Microbiology 100(1-3): 323-333.
Grimm, V., U. Berger, et al. (2010). “The ODD protocol: A review and first update.” Ecological Modelling.
Grimm, V. and S. F. Railsback (2005). Individual-based modeling and ecology. Princeton, NJ, Princeton University Press.
Grimm, V., E. Revilla, et al. (2005). “Pattern-Oriented modeling of agent-based complex systems: Lessons from ecology.” Science 310(5750): 987-991.
Gugliandolo, C. and T. L. Maugeri (1993). “Chemolithotrophic, sulfur-oxidizing bacteria from a marine, shallow hydrothermal vent of vulcano (Italy).” Geomicrobiology Journal 11(2): 109-120.
Gunasekera, T. S. and G. W. Sundin (2006). “Role of nucleotide excision repair and photoreactivation in the solar UVB radiation survival of Pseudomonas syringae pv. syringae B728a.” Journal of Applied Microbiology 100(5): 1073-1083.
Handelsman, J. (2004). “Metagenomics: Application of genomics to uncultured microorganisms.” Microbiololgy and Molecular Biology Reviews 68(4): 669-685.
Handelsman, J., M. R. Rondon, et al. (1998). “Molecular biological access to the chemistry of unknown soil microbes: A new frontier for natural products.” Chemistry & Biology 5(10): R245-R249.
Hansen, L. H. and S. J. Sorensen (2001). “The use of whole-cell biosensors to detect and quantify compounds or conditions affecting biological systems.” Microbial Ecology 42(4): 483-494.
Hardin, G. (1968). “The tragedy of the commons.” Science 162(3859): 1243-1248.Harms, H., M. C. Wells, et al. (2006). “Whole-cell living biosensors - are they ready
for environmental application?” Applied Microbiology and Biotechnology 70(3): 273-280.
Hellweger, F. L. (2008). “Spatially explicit individual-based modeling using a fixed super-individual density.” Computers & Geosciences 34(2): 144-152.
Hellweger, F. L. and V. Bucci (2009). “A bunch of tiny individuals--Individual-based modeling for microbes.” Ecological Modelling 220(1): 8-22.
Hermann, T. (2003). “Industrial production of amino acids by coryneform bacteria.” Journal of Biotechnology 104(1-3): 155-172.
Hodson, R. E., W. A. Dustman, et al. (1995). “In-Situ PCR for visualization of microscale distribution of specific genes and gene-Products in prokaryotic communities.” Applied and Environmental Microbiology 61(11): 4074-4082.
Holland, M. A. (1997). “Occam’s razor applied to hormonology - Are cytokinins produced by plants?” Plant Physiology 115(3): 865-868.
Holm, E. and V. Jensen (1972). “Aerobic chemoorganotropic bacteria of a danish

References 99
beech forest - Microbiology of a danish beech forest .1.” Oikos 23(2): 248-&.
Huang, W. E., M. J. Bailey, et al. (2007). “Single-cell Raman spectral profiles of Pseudomonas fluorescens SBW25 reflects in vitro and in planta metabolic history.” Microbial Ecology 53(3): 414-425.
Huang, W. E., R. I. Griffiths, et al. (2004). “Raman microscopic analysis of single microbial cells.” Analytical Chemistry 76(15): 4452-4458.
Hughes, W. H. (1956). “Bacterial variation to sensitivity - Example of individuality in micro-organisms.” Nature 177(4520): 1132-1133.
Husemann, P. and J. Stoye (2010). “r2cat: synteny plots and comparative assembly.” Bioinformatics 26(4): 570-571.
Jackson, E. F., H. L. Echlin, et al. (2006). “Changes in the phyllosphere community of the resurrection fern, Polypodium polypodioides, associated with rainfall and wetting.” Fems Microbiology Ecology 58(2): 236-246.
Jacobs, J. L., T. L. Carroll, et al. (2005). “The role of pigmentation, ultraviolet radiation tolerance, and leaf colonization strategies in the epiphytic survival of phyllosphere bacteria.” Microbial Ecology 49(1): 104-113.
Jacques, M. A., L. L. Kinkel, et al. (1995). “Population sizes, immigration, and growth of epiphytic bacteria on leaves of different ages and positions of field-grown endive (Cichorium endivia var. latifolia).” Applied and Environmental Microbiology 61(3): 899-906.
Jaeger, C. H., S. E. Lindow, et al. (1999). “Mapping of sugar and amino acid availability in soil around roots with bacterial sensors of sucrose and Tryptophan.” Applied and Environmental Microbiology 65(6): 2685-2690.
Jaspers, M. C. M., C. Meier, et al. (2001). “Measuring mass transfer processes of octane with the help of an alkS-alkB :: gfp-tagged Escherichia coli.” Environmental Microbiology 3(8): 512-524.
Jeffree, C. E. (2007). The fine structure of the plant cuticle. Annual Plant Reviews Volume 23: Biology of the Plant Cuticle. M. Riederer and C. Müller, Blackwell Publishing Ltd: 11-125.
Jetter, R. and S. Schäffer (2001). “Chemical composition of the Prunus laurocerasus leaf surface. Dynamic changes of the epicuticular wax film during leaf development.” Plant Physiology 126(4): 1725-1737.
Joyner, D. C. and S. E. Lindow (2000). “Heterogeneity of iron bioavailability on plants assessed with a whole-cell GFP-based bacterial biosensor.” Microbiology-Uk 146: 2435-2445.
Kapley, A., T. De Baere, et al. (2007). “Eubacterial diversity of activated biomass from a common effluent treatment plant.” Research in Microbiology 158(6): 494-500.
Kelly, C. D. and O. Rahn (1932). “The growth rate of individual bacterial cells.” Journal of Bacteriology 23(2): 147-153.
Kinkel, L., M. Newton, et al. (2002). Resource aggregation in the phyllosphere: Implications for microbial dynamics across spatial scales. Phyllosphere Microbiology. S. Lindow, E. Hecht-Poinar and V. Elliott. Saint Paul, MN, USA, APS Press: 317-340.
Kinkel, L. L., J. H. Andrews, et al. (1987). “Leaves as islands for microbes.”
The Ecology of Bacterial Individuality100
Oecologia 71(3): 405-408.Kinkel, L. L., M. Wilson, et al. (1995). “Effect of sampling scale on the assessment
of epiphytic bacterial-populations.” Microbial Ecology 29(3): 283-297.Kinkel, L. L., M. Wilson, et al. (2000). “Plant species and plant incubation conditions
influence variability in epiphytic bacterial population size.” Microbial Ecology 39(1): 1-11.
Kirsch, T., F. Kaffarnik, et al. (1997). “Cuticular permeability of the three tree species Prunus laurocerasus L, Ginkgo biloba L and Juglans regia L: Comparative investigation of the transport properties of intact leaves, isolated cuticles and reconstituted cuticular waxes.” Journal of Experimental Botany 48(310): 1035-1045.
Knief, C., L. Frances, et al. (2010). “Competitiveness of diverse Methylobacterium Strains in the phyllosphere of Arabidopsis thaliana and identification of representative models, including M. extorquens PA1.” Microbial Ecology 60(2): 440-452.
Knief, C., A. Ramette, et al. (2010). “Site and plant species are important determinants of the Methylobacterium community composition in the plant phyllosphere.” The ISME Journal 4(6): 719-728.
Knoll, D. and L. Schreiber (2004). Methods for analysing the interactions between epiphyllic microorganisms and leaf cuticles. Plant Surface Microbiology. Berlin, Springer-Verlag Berlin: 471-487.
Kohler, R., A. Bubert, et al. (2000). “Expression and use of the green fluorescent protein as a reporter system in Legionella pneumophila.” Molecular and General Genetics 262(6): 1060-1069.
Kolattukudy, P. E. (1980). “Bio-Polyester membranes of plants - cutin and suberin.” Science 208(4447): 990-1000.
Kolattukudy, P. E. (1985). “Enzymatic penetration of the plant cuticle by fungal pathogens.” Annual Review of Phytopathology 23(1): 223-250.
Kowalchuk, G., A. Speksnijder, et al. (2007). “Finding the needles in the metagenome haystack.” Microbial Ecology 53(3): 475-485.
Kreft, J. U., G. Booth, et al. (1998). “BacSim, a simulator for individual-based modelling of bacterial colony growth.” Microbiology-Uk 144: 3275-3287.
Kreft, J. U., C. Picioreanu, et al. (2001). “Individual-based modelling of biofilms.” Microbiology 147: 2897-2912.
Krimm, U. (2005). Untersuchungen zur Interaktion epiphyller Bakterien mit Blattoberflächen und Veränderungen in der Phyllosphäre während der Vegetationsperiode. Dr. rer. nat., Rheinischen Friedrich-Wilhelms-Universität Bonn.
Lardon, L. A., B. V. Merkey, et al. (2011). “iDynoMiCS: next-generation individual-based modelling of biofilms.” Environmental Microbiology 13(9): 2416-2434.
Le Galliard, J. F., P. S. Fitze, et al. (2005). “Sex ratio bias, male aggression, and population collapse in lizards.” Proceedings of the National Academy of Sciences of the United States of America 102(50): 18231.
Leben, C. (1965). “Influence of humidity on migration of bacteria on cucumber seedlings.” Canadian Journal of Microbiology 11(4): 671-&.

References 101
Lee, J. P., S. W. Lee, et al. (2006). “Evaluation of formulations of Bacillus licheniformis for the biological control of tomato gray mold caused by Botrytis cinerea.” Biological Control 37(3): 329-337.
Lenski, R. E., C. Ofria, et al. (2003). “The evolutionary origin of complex features.” Nature 423: 139-144.
Leveau, J. H. J. (2006). Microbial communities in the phyllosphere. Biology of the Plant Cuticle. R. M. and M. C., Blackwell Publishing Ltd.: 334-367.
Leveau, J. H. J. and S. E. Lindow (2001). “Appetite of an epiphyte: Quantitative monitoring of bacterial sugar consumption in the phyllosphere.” Proceedings of the National Academy of Sciences of the United States of America 98(6): 3446-3453.
Leveau, J. H. J. and S. E. Lindow (2001). “Predictive and interpretive simulation of green fluorescent protein expression in reporter bacteria.” Journal of Bacteriology 183(23): 6752-6762.
Leveau, J. H. J. and S. E. Lindow (2002). “Bioreporters in microbial ecology.” Current Opinion in Microbiology 5(3): 259-265.
Levin, M. D., C. J. Morton-Firth, et al. (1998). “Origins of individual swimming behavior in bacteria.” Biophysical Journal 74(1): 175-181.
Li, T., T.-D. Wu, et al. (2008). “Simultaneous analysis of microbial identity and function using NanoSIMS.” Environmental Microbiology 10(3): 580-588.
Liljeroth, E. and E. Baath (1988). “Bacteria and fungi on roots of different barley varieties (Hordeum vulgare L.).” Biology and Fertility of Soils 7(1): 53-57.
Lindemann, J. and C. D. Upper (1985). “Aerial dispersal of epiphytic bacteria over bean plants.” Applied and Environmental Microbiology 50(5): 1229-1232.
Lindow, S. E. (1987). “Competitive exclusion of epiphytic bacteria by Ice- Pseudomonas syringae mutants.” Applied and Environmental Microbiology 53(10): 2520.
Lindow, S. E. and M. T. Brandl (2003). “Microbiology of the phyllosphere.” Applied and Environmental Microbiology 69(4): 1875-1883.
Lindow, S. E., C. Desurmont, et al. (1998). “Occurrence of indole-3-acetic acid-producing bacteria on pear trees and their association with fruit russet.” Phytopathology 88(11): 1149-1157.
Linskens, H. F. (1950). “*Quantitative Bestimmung Der Benetzbarkeit Von Blattoberflachen.” Planta 38(5): 591-600.
Mailloux, B. J. and M. E. Fuller (2003). “Determination of in situ bacterial growth rates in aquifers and aquifer sediments.” Applied and environmental microbiology 69(7): 3798-3808.
Maksimow, M., K. Hakkila, et al. (2002). “Simultaneous detection of bacteria expressing GFP and DsRed genes with a flow cytometer.” Cytometry 47(4): 243-247.
Manafi, M., W. Kneifel, et al. (1991). “Fluorogenic and chromogenic substrates used in bacterial diagnostics.” Microbiological Reviews 55(3): 335-348.
Manulis, S., A. Haviv-Chesner, et al. (1998). “Differential involvement of indole-3-acetic acid biosynthetic pathways in pathogenicity and epiphytic fitness of Erwinia herbicola pv, gypsophilae.” Molecular Plant-Microbe Interactions 11(7): 634-642.
The Ecology of Bacterial Individuality102
March, J. C. and W. E. Bentley (2004). “Quorum sensing and bacterial cross-talk in biotechnology.” Current Opinion in Biotechnology 15(5): 495-502.
Marsh, T. L. (1999). “Terminal restriction fragment length polymorphism (T-RFLP): An emerging method for characterizing diversity among homologous populations of amplification products.” Current Opinion in Microbiology 2(3): 323-327.
Matsumoto, M. and T. Nishimura (1998). “Mersenne twister: a 623-dimensionally equidistributed uniform pseudo-random number generator.” ACM Transactions on Modeling and Computer Simulation 8(1): 3-30.
Matz, M. V., A. F. Fradkov, et al. (1999). “Fluorescent proteins from nonbioluminescent Anthozoa species.” Nature Biotechnology 17(10): 969-973.
Melbourne, B. A., H. V. Cornell, et al. (2007). “Invasion in a heterogeneous world: resistance, coexistence or hostile takeover?” Ecology Letters 10(1): 77-94.
Mercier, J. and S. E. Lindow (2000). “Role of leaf surface sugars in colonization of plants by bacterial epiphytes.” Applied and Environmental Microbiology 66(1): 369-374.
Miller, D. M., N. S. Desai, et al. (1999). “Two-color GFP expression system for C-elegans.” Biotechniques 26(5): 914-+.
Miller, W. G., M. T. Brandl, et al. (2001). “Biological sensor for sucrose availability: Relative sensitivities of various reporter genes.” Applied and Environmental Microbiology 67(3): 1308-1317.
Monier, J. M. and S. E. Lindow (2003). “Pseudomonas syringae responds to the environment on leaves by cell size reduction.” Phytopathology 93(10): 1209-1216.
Monier, J. M. and S. E. Lindow (2004). “Frequency, size, and localization of bacterial aggregates on bean leaf surfaces.” Applied and Environmental Microbiology 70(1): 346-355.
Monier, J. M. and S. E. Lindow (2005). “Aggregates of resident bacteria facilitate survival of immigrant bacteria on leaf surfaces.” Microbial Ecology 49(3): 343-352.
Monier, J. M. and S. E. Lindow (2005). “Spatial organization of dual-species bacterial aggregates on leaf surfaces.” Applied and Environmental Microbiology 71(9): 5484-5493.
Morris, C., J. Monier, et al. (1997). “Methods for observing microbial biofilms directly on leaf surfaces and recovering them for isolation of culturable microorganisms.” Applied and Environmental Microbiology 63(4): 1570-1576.
Morris, C. E. and L. L. Kinkel (2002). Fifty years of phyllosphere microbiology: Significant contributions to research in related fields. Phyllosphere Microbiology. S. E. Lindow, E. I. Hecht Poinar and V. J. Elliott: 365-375.
Morris, C. E., J.-M. Monier, et al. (1998). “A technique to quantify the population size and composition of the biofilm component in communities of bacteria in the phyllosphere.” Applied and Environmental Microbiology 64(12): 4789-4795.
Moyne, A., M. R. Sudarshana, et al. (2011). “Fate of Escherichia coli O157: H7 in field-inoculated lettuce.” Food Microbiology 28(8): 1417-1425.

References 103
Müller, S. and G. Nebe-von-Caron (2010). “Functional single-cell analyses: flow cytometry and cell sorting of microbial populations and communities.” Fems Microbiology Reviews 34(4): 554-587.
Musat, N., H. Halm, et al. (2008). “A single-cell view on the ecophysiology of anaerobic phototrophic bacteria.” Proceedings of the National Academy of Sciences of the United States of America 105(46): 17861-17866.
Muyzer, G. and K. Smalla (1998). “Application of denaturing gradient gel electrophoresis (DGGE) and temperature gradient gel electrophoresis (TGGE) in microbial ecology.” Antonie Van Leeuwenhoek International Journal of General and Molecular Microbiology 73(1): 127-141.
Nivens, D. E., T. E. McKnight, et al. (2004). “Bioluminescent bioreporter integrated circuits: potentially small, rugged and inexpensive whole-cell biosensors for remote environmental monitoring.” Journal of Applied Microbiology 96(1): 33-46.
Nix, S., L. L. Burpee, et al. (2009). “Responses of 2 epiphytic yeasts to foliar infection by Rhizoctonia solani or mechanical wounding on the phylloplane of tall fescue.” Canadian Journal of Microbiology 55(10): 1160-1165.
Pernezny, K., R. N. Raid, et al. (1995). “An outbreak of bacterial spot of lettuce in florida caused by Xanthomonas-Campestris Pv. vitians.” Plant Disease 79(4): 359-360.
Pernthaler, A., J. Pernthaler, et al. (2002). “Fluorescence in situ hybridization and catalyzed reporter deposition for the identification of marine bacteria.” Applied and Environmental Microbiology 68(6): 3094-3101.
Pernthaler, J., F.-O. Glöckner, et al. (2001). Fluorescence in situ hybridization (FISH) with rRNA-targeted oligonucleotide probes. Methods in Microbiology. H. P. John, Academic Press. Volume 30: 207-226.
Prosser, J. I., B. J. Bohannan, et al. (2007). “The role of ecological theory in microbial ecology.” Nature reviews. Microbiology 5(5): 384-392.
Quiñones, B., G. Dulla, et al. (2005). “Quorum sensing regulates exopolysaccharide production, motility, and virulence in Pseudomonas syringae.” Molecular Plant-Microbe Interactions 18(7): 682-693.
Rankin, D. J. and H. Kokko (2006). “Sex, death and tragedy.” Trends in Ecology & Evolution 21(5): 225-226.
Redford, A. J., R. M. Bowers, et al. (2010). “The ecology of the phyllosphere: geographic and phylogenetic variability in the distribution of bacteria on tree leaves.” Environmental Microbiology 12(11): 2885-2893.
Remus-Emsermann, M. N., S. de Oliveira, et al. (2011). “Quantification of lateral heterogeneity in carbohydrate permeability of isolated plant leaf cuticles.” Frontiers in Microbiology 2.
Remus-Emsermann, M. N. P. and J. H. J. Leveau (2010). “Linking environmental heterogeneity and reproductive success at single-cell resolution.” Isme Journal 4(2): 215-222.
Rezzonico, F., T. Smits, et al. (2009). “Genotypic comparison of Pantoea agglomerans plant and clinical strains.” Bmc Microbiology 9(1): 204.
Ribeiro, A. C. F., C. I. A. V. Santos, et al. (2006). Diffusion coefficients of aqueous solutions of carbohydrates as seen by Taylor dispersion technique at

The Ecology of Bacterial Individuality104
physiological temperature (37 degrees C). Diffusion in Solids and Liquids - MASS DIFFUSION. A. Ochsner and J. Gracio, Trans Tech Publications. 258-260: 305-309.
Riederer, M. and C. Müller, Eds. (2006). Biology of the plant cuticle. Annual Plant Reviews. Oxford, UK, Blackwell Publishing.
Riederer, M. and L. Schreiber (2001). “Protecting against water loss: analysis of the barrier properties of plant cuticles.” Journal of Experimental Botany 52(363): 2023-2032.
Roberts, P. D., R. D. Berger, et al. (1997). “Disease progress, yield loss, and control of Xanthomonas fragariae on strawberry plants.” Plant Disease 81(8): 917-921.
Roostalu, J., A. Joers, et al. (2008). “Cell division in Escherichia coli cultures monitored at single cell resolution.” Bmc Microbiology 8: -.
Rosch, P., M. Harz, et al. (2005). “Chemotaxonomic identification of single bacteria by micro-Raman spectroscopy: Application to clean-room-relevant biological contaminations.” Applied and Environmental Microbiology 71(3): 1626-1637.
Rosenfeld, N., T. J. Perkins, et al. (2006). “A fluctuation method to quantify in vivo fluorescence data.” Biophysical Journal 91(2): 759-766.
Ruimy, R., V. Breittmayer, et al. (1994). “Assessment of the state of activity of individual bacterial-cells by hybridization with a ribosomal-RNA-targeted fluorescently labeled oligonucleotidic probe.” Fems Microbiology Ecology 15(1-2): 207-213.
Ruinen, J. (1961). “The phyllosphere.” Plant and Soil 15(2): 81-109.Sandhu, A., L. J. Halverson, et al. (2007). “Bacterial degradation of airborne phenol
in the phyllosphere.” Environmental Microbiology 9(2): 383-392.Savary, S., L. Willocquet, et al. (2000). “Rice pest constraints in tropical Asia:
Quantification of yield losses due to rice pests in a range of production situations.” Plant Disease 84(3): 357-369.
Scheiner, S. and M. Willig (2008). “A general theory of ecology.” Theoretical Ecology 1(1): 21-28.
Schlegel, T. K., J. Schönherr, et al. (2005). “Size selectivity of aqueous pores in stomatous cuticles of Vicia faba leaves.” Planta 221(5): 648-655.
Schönherr, J. (1976). “Water permeability of isolated cuticular membranes: The effect of pH and cations on diffusion, hydrodynamic permeability and size of polar pores in the cutin matrix.” Planta 128(2): 113-126.
Schönherr, J. and L. Schreiber (2004). “Size selectivity of aqueous pores in astomatous cuticular membranes isolated from Populus canescens (Aiton) Sm. leaves.” Planta 219(3): 405-411.
Schreiber, L. (2001). “Effect of temperature on cuticular transpiration of isolated cuticular membranes and leaf discs.” Journal of Experimental Botany 52(362): 1893-1900.
Schreiber, L. (2005). “Polar paths of diffusion across plant cuticles: New evidence for an old hypothesis.” Annals of Botany 95(7): 1069-1073.
Schreiber, L., S. Elshatshat, et al. (2006). “AgCl precipitates in isolated cuticular membranes reduce rates of cuticular transpiration.” Planta 223(2): 283-290.

References 105
Schreiber, L., U. Krimm, et al. (2005). “Plant-microbe interactions: identification of epiphytic bacteria and their ability to alter leaf surface permeability.” New Phytologist 166(2): 589-594.
Schreiber, L. and J. Schönherr (2009). Water and solute permeability of plant cuticles. Heidelberg, Springer.
Schuster, K. C., E. Urlaub, et al. (2000). “Single-cell analysis of bacteria by Raman microscopy: spectral information on the chemical composition of cells and on the heterogeneity in a culture.” Journal of Microbiological Methods 42(1): 29-38.
Shaner, N. C., R. E. Campbell, et al. (2004). “Improved monomeric red, orange and yellow fluorescent proteins derived from Discosoma sp red fluorescent protein.” Nature Biotechnology 22(12): 1567-1572.
Shapiro, H. H. (2000). “Microbial analysis at the single-cell level: tasks and techniques.” Journal of Microbiological Methods 42(1): 3-16.
Shimshon, B. (2003). “Microbial whole-cell sensing systems of environmental pollutants.” Current Opinion in Microbiology 6(3): 206-212.
Singh, B. K., P. Millard, et al. (2004). “Unravelling rhizosphere-microbial interactions: opportunities and limitations.” Trends in Microbiology 12(8): 386-393.
Smits, T., S. Jaenicke, et al. (2010). “Complete genome sequence of the fire blight pathogen Erwinia pyrifoliae DSM 12163T and comparative genomic insights into plant pathogenicity.” BMC Genomics 11(1): 2.
Smits, T. H., F. Rezzonico, et al. (2010). “Genome sequence of the biocontrol agent Pantoea vagans strain C9-1.” Journal of Bacteriology 192(24): 6486-6487.
Smits, T. H. M., F. Rezzonico, et al. (2010). “Complete genome sequence of the fire blight pathogen Erwinia amylovora CFBP 1430 and comparison to other Erwinia spp.” Molecular Plant-Microbe Interactions 23(4): 384-393.
Smits, T. H. M., F. Rezzonico, et al. (2010). “Genome Sequence of the Biocontrol Agent Pantoea vagans Strain C9-1.” Journal of Bacteriology 192(24): 6486-6487.
Smits, W. K., O. P. Kuipers, et al. (2006). “Phenotypic variation in bacteria: the role of feedback regulation.” Nature Reviews Microbiology 4(4): 259-271.
Spudich, J. L. and D. Koshland Jr (1976). “Non-Genetic Individuality: Chance in the Single Cell.” Nature 262(5568): 467-471.
Stanton, B., J. Eaton, et al. (2002). “Hybrid poplar in the Pacific Northwest: the effects of market-driven management.” Journal of Forestry 100(4): 28-33.
Stockwell, V. O., K. B. Johnson, et al. (2010). “Control of fire blight by Pseudomonas fluorescens A506 and Pantoea vagans C9-1 applied as single strains and mixed inocula.” Phytopathology 100(12): 1330-1339.
Stockwell, V. O., K. B. Johnson, et al. (2011). “Mechanistically compatible mixtures of bacterial antagonists improve biological control of fire blight of pear.” Phytopathology 101(1): 113-123.
Strovas, T. J., L. M. Sauter, et al. (2007). “Cell-to-cell heterogeneity in growth rate and gene expression in Methylobacterium extorquens AM1.” Journal of Bacteriology 189(19): 7127-7133.
Sueki, M., N. Kobayashi, et al. (1991). “Continuous acetic-acid production by the

The Ecology of Bacterial Individuality106
bioreactor system loading a new ceramic carrier for microbial attachment.” Biotechnology Letters 13(3): 185-190.
Tecon, R. and J. R. van der Meer (2006). “Information from single-cell bacterial biosensors: what is it good for?” Current Opinion in Biotechnology 17(1): 4-10.
Templeton, A. R. and E. D. Rothman (1978). “Evolution in fine-grained environments I. Environmental runs and the evolution of homeostasis.” Theoretical Population Biology 13(3): 340-355.
Todeschini, V., G. Lingua, et al. (2011). “Effects of high zinc concentration on poplar leaves: A morphological and biochemical study.” Environmental and Experimental Botany 71(1): 50-56.
Torsvik, V., R. Sorheim, et al. (1996). “Total bacterial diversity in soil and sediment communities - A review.” Journal of Industrial Microbiology 17(3-4): 170-178.
Tukey, H. B., Jr. (1966). “Leaching of metabolites from above-ground plant parts and its implications.” Bulletin of the Torrey Botanical Club 93(6): 385-401.
Tukey, H. B., Jr. and R. A. Mecklenburg (1964). “Leaching of metabolites from foliage and subsequent reabsorption and redistribution of the leachate in plants.” American Journal of Botany 51(7): 737-742.
Upper, C. and S. Hirano (2002). Revisiting the roles of immigration and growth in the development of populations of Pseudomonas syringae in the phyllosphere. Phyllosphere Microbiology. S. Lindow, E. Hecht-Poinar and V. Elliott. Saint Paul, MN, USA, APS Press: 69-79.
van der Wal, A. and J. H. J. Leveau (2011). “Modelling sugar diffusion across plant leaf cuticles: the effect of free water on substrate availability to phyllosphere bacteria.” Environmental Microbiology 13(3): 792-797.
Veening, J. W., W. K. Smits, et al. (2008). “Bistability, epigenetics, and bet-hedging in bacteria.” Annual review of microbiology 62: 193-210.
Venisse, J. S., M. A. Barny, et al. (2003). “Involvement of three pathogenicity factors of Erwinia amylovora in the oxidative stress associated with compatible interaction in pear.” FEBS letters 537(1-3): 198-202.
Whipps, J. M., P. Hand, et al. (2008). Human pathogens and the phyllosphere. Advances in applied microbiology. S. S. Allen I. Laskin and M. G. Geoffrey, Academic Press. Volume 64: 183-221.
Whitehead, N., J. Byers, et al. (2002). “The regulation of virulence in phytopathogenic Erwinia species: quorum sensing, antibiotics and ecological considerations.” Antonie van Leeuwenhoek 81(1): 223-231.
Whitman, W. B., D. C. Coleman, et al. (1998). “Prokaryotes: The unseen majority.” Proceedings of the National Academy of Sciences of the United States of America 95(12): 6578-6583.
Wilensky, U. (1999). NetLogo. Evanston, IL, Center for Connected Learning and Computer-Based Modeling, Northwestern University.
Wilson, M. and S. Lindow (1995). “Enhanced epiphytic coexistence of near-isogenic salicylate-catabolizing and non-salicylate-catabolizing Pseudomonas putida strains after exogenous salicylate application.” Applied and Environmental Microbiology 61(3): 1073-1076.
References 107
Wilson, M. and S. E. Lindow (1992). “Relationship of total viable and culturable cells in epiphytic populations of Pseudomonas syringae.” Applied and Environmental Microbiology 58(12): 3908-3913.
Wilson, M. and S. E. Lindow (1994). “Ecological similarity and coexistence of epiphytic ice-nucleating (Ice+) Pseudomonas syringae strains and a non-ice-nucleating (Ice-) biological control agent.” Applied and Environmental Microbiology 60(9): 3128.
Wilson, M. and S. E. Lindow (1994). “Inoculum density-dependent mortality and colonization of the phyllosphere by Pseudomonas syringae.” Applied and Environmental Microbiology 60(7): 2232-2237.
Wilson, M., M. A. Savka, et al. (1995). “Altered epiphytic colonization of mannityl opine-producing transgenic tobacco plants by a mannityl opine-catabolizing strain of Pseudomonas syringae.” Applied and Environmental Microbiology 61(6): 2151-2158.
Wimalajeewa, D., R. Cahill, et al. (1991). “Chemical control of bacterial canker Pseudomonas syringae pv. syringae of apricot and cherry in Victoria.” Australian Journal of Experimental Agriculture 31(5): 705-708.
Wong, M. L. and J. F. Medrano (2005). “Real-time PCR for mRNA quantitation.” Biotechniques 39(1): 75.
Woods, J. D. (2005). “The Lagrangian Ensemble metamodel for simulating plankton ecosystems.” Progress In Oceanography 67(1-2): 84-159.
Woods, J. D. and R. Onken (1982). “Diurnal variation and primary production in the ocean preliminary results of a Lagrangian ensemble model.” Journal of Plankton Research 4(3): 735-756.
Woody, S. T., A. R. Ives, et al. (2007). “Dispersal, density dependence, and population dynamics of a fungal microbe on leaf surfaces.” Ecology 88(6): 1513-1524.
Xu, X.-M., N. Salama, et al. (2010). “Numerical studies of biocontrol efficacies of foliar plant pathogens in relation to the characteristics of a biocontrol agent.” Phytopathology 100(8): 814-821.
Yadav, R., K. Karamanoli, et al. (2005). “Bacterial colonization of the phyllosphere of mediterranean perennial species as influenced by leaf structural and chemical features.” Microbial Ecology 50(2): 185-196.
Yang, C. H., D. E. Crowley, et al. (2001). “Microbial phyllosphere populations are more complex than previously realized.” Proceedings of the National Academy of Sciences of the United States of America 98(7): 3889-3894.
Zengler, K. (2009). “Central Role of the Cell in Microbial Ecology.” Microbiol. Mol. Biol. Rev. 73(4): 712-729.
Zerbino, D. R. and E. Birney (2008). “Velvet: Algorithms for de novo short read assembly using de Bruijn graphs.” Genome Research 18(5): 821-829.
Zerbino, D. R., G. K. McEwen, et al. (2009). “Pebble and Rock Band: heuristic resolution of repeats and scaffolding in the velvet short-read de novo assembler.” PLoS ONE 4(12): e8407.
Zhang, Y., E. Callaway, et al. (2009). “Visualisation of hrp gene expression in Xanthomonas euvesicatoria in the tomato phyllosphere.” European Journal of Plant Pathology 124(3): 379-390.
Zoetendal, E. G., C. T. Collier, et al. (2004). “Molecular ecological analysis of the

The Ecology of Bacterial Individuality108
gastrointestinal microbiota: a review.” The Journal of nutrition 134(2): 465.Zwielehner, J., M. Handschur, et al. (2008). “DGGE and real-time PCR analysis of
lactic acid bacteria in bacterial communities of the phyllosphere of lettuce.” Molecular Nutrition & Food Research 52(5): 614-623.
Zwirglmaier, K., W. Ludwig, et al. (2004). “Improved method for polynucleotide probe-based cell sorting, using DNA-coated microplates.” Applied and Environmental Microbiology 70(1): 494-497.

Appendix 109
NetLogo code:breed [agents_set1]breed [deadset1]breed [agents_set2]breed [deadset2]
agents_set1-own [agents_set1_generation agents_set1_internal_energy_storage]agents_set2-own [agents_set2_generation agents_set2_internal_energy_storage]patches-own [patch-current-energy patch-energy-T0] deadset1-own [agents_set1_generationdead agents_set1_internal_energy_storagedead] deadset2-own [agents_set2-generationdead agents_set1_internal_energy_storagedead2]
to setup random-seed random-seed-number setup-world distribute-agents plots reset-ticksend
to release2 release-agents-set2end
to setup-world ca
let desert count patches ask n-of desert patches [set pcolor yellow] ; Add green oasis let n_oasis_green (G_oasis_green_cover / ( patchsize_in-crease_green + 1)) * count patches / 100 ask n-of n_oasis_green patches [set pcolor green] ask-concurrent patches [if pcolor = green [ask-concurrent n-of patchsize_in-crease_green neighbors4 [set pcolor green]]] ; Add blue oasis let n_oasis_blue (G_oasis_blue_cover / ( patchsize_in-crease_blue + 1)) * count patches / 100 ask n-of n_oasis_blue patches [set pcolor blue] ask-concurrent patches

The Ecology of Bacterial Individuality110
[if pcolor = blue [ask-concurrent n-of patchsize_in-crease_blue neighbors4 [set pcolor blue]]] ask patches [if pcolor = yellow [ let standarddeviation2 ln (1 + (desert_stdev_energy * desert_stdev_energy) / (desert_mean_energy * desert_mean_en-ergy)) let desert-standarddeviation sqrt standarddeviation2 let desert-mean (ln desert_mean_energy) - (standard-deviation2 / 2) set patch-energy-T0 exp random-normal desert-mean desert-standarddeviation] if pcolor = green [ let standarddeviation2 ln (1 + (oasis_green_energy_stdev * oasis_green_energy_stdev) / (oasis_green_mean_energy * oasis_green_mean_energy)) let green-standarddeviation sqrt standarddeviation2 let green-mean (ln oasis_green_mean_energy) - (stan-darddeviation2 / 2) set patch-energy-T0 exp random-normal green-mean green-standarddeviation] if pcolor = blue [ set patch-energy-T0 random-normal oasis_blue_mean_en-ergy oasis_blue_energy_stdev] set patch-current-energy patch-energy-T0]end
to distribute-agents let n_agents_set1 441 * 2 ^ (#-agentset1) create-agents_set1 n_agents_set1 [set size 0.35 set shape “circle” setxy random-xcor random-ycor set agents_set1_generation 0 set agents_set1_internal_energy_storage random-normal breed1-start-energy ((breed1-start-energy / 100) * 25) set color black] end
to release-agents-set2 let n_agents_set2 10 ^ (#-agentset2) create-agents_set2 n_agents_set2 [set size 0.35 set shape “circle” setxy random-xcor random-ycor set agents_set2_generation 0 set agents_set2_internal_energy_storage random-normal breed2-start-energy ((breed2-start-energy / 100) * 25)

Appendix 111
set color blue] end
to go repeat total-cycles [ agents-eat agents-divide agents-energy-consumption replenish-patch-energy plots tick]end
to agents-eat ask turtles-on patches with [patch-current-energy > 0] [ let energy_uptake 0 ifelse breed = agents_set1 [ set energy_uptake random-normal agents_set1_energy_uptake ((agents_set1_energy_uptake / 100)) if (patch-current-energy - energy_uptake) < 0 [set en-ergy_uptake patch-current-energy] set agents_set1_internal_energy_storage agents_set1_in-ternal_energy_storage + energy_uptake set patch-current-energy patch-current-energy - energy_uptake] [ if breed = agents_set2 [set energy_uptake random-normal agents_set2_energy_up-take ((agents_set2_energy_uptake / 100)) if (patch-current-energy - energy_uptake) < 0 [set en-ergy_uptake patch-current-energy] set agents_set2_internal_energy_storage agents_set2_in-ternal_energy_storage + energy_uptake set patch-current-energy patch-current-energy - energy_uptake]]]end
to agents-divide ask-concurrent agents_set1 with [agents_set1_internal_en-ergy_storage >= random-normal breed1-reproduction-threshold ((breed1-reproduction-threshold / 100) * 25)] [hatch 2 [;set color color - 1 setxy xcor + random-normal 0 breed1-dispersal ycor + random-normal 0 breed1-dispersal set agents_set1_internal_energy_storage agents_set1_in-ternal_energy_storage / 2 set agents_set1_generation agents_set1_generation + 1] die] ask-concurrent agents_set2 with [agents_set2_internal_en-ergy_storage >= random-normal breed2-reproduction-threshold

The Ecology of Bacterial Individuality112
((breed2-reproduction-threshold / 100) * 25)] [hatch 2 [ setxy xcor + random-normal 0 breed2-dispersal ycor + random-normal 0 breed2-dispersal set agents_set2_internal_energy_storage agents_set2_in-ternal_energy_storage / 2 set agents_set2_generation agents_set2_generation + 1] die]end
to agents-energy-consumption let protection_from_antibiotics 0 let energy-consumption1 (( agents_set1_energy_uptake / 100) * agents_set1_energy_consumption ) let energy-consumption2 (( agents_set1_energy_uptake / 100) * agents_set1_energy_consumption ) ask agents_set1 [set protection_from_antibiotics (count agents_set1-here + count deadset1-here) / 10 * protection_factor let antibiotic_factor ( count agents_set2-here ) * Anti-biotic_strenght - protection_from_antibiotics if-else antibiotic_factor > 0 [set agents_set1_internal_energy_storage agents_set1_in-ternal_energy_storage - energy-consumption1 + ( agents_set1_energy_uptake / 100 * ( agents_set1_energy_consumption + anti-biotic_factor ))] [set agents_set1_internal_energy_storage agents_set1_in-ternal_energy_storage - energy-consumption1] ] ask agents_set1 with [agents_set1_internal_energy_storage < 0] [let current_agents_set1_generation agents_set1_generation hatch-deadset1 1 [ set color red set size 0.35 set shape “circle” set agents_set1_generationdead current_agents_set1_gen-eration ht ] die] ask agents_set2 [set agents_set2_internal_energy_storage (agents_set2_in-ternal_energy_storage - energy-consumption2 )] ask agents_set2 with [agents_set2_internal_energy_storage <

Appendix 113
0] [let current_agents_set2_generation agents_set2_generation hatch-deadset2 1 [ set color red set size 0.35 set shape “circle” set agents_set2-generationdead current_agents_set2_gen-eration ht ] die]end
to replenish-patch-energy let rep-energy 0 let engineer1 0 let engineer2 0 ask-concurrent patches with [count turtles > 0] [ if count agents_set1-here >= Bioengineer1-threshold [set engineer1 Bioengineer1-ability] if count agents_set2-here >= Bioengineer2-threshold [set engineer2 Bioengineer2-ability] if pcolor = green [set rep-energy ((patch-energy-T0 / 100) * replenishing_rate_oasis_green) + ((patch-energy-T0 / 100) * engineer1) + ((patch-energy-T0 / 100) * engineer2)] if pcolor = blue [set rep-energy ((patch-energy-T0 / 100) * replenishing_rate_oasis_blue ) + ((patch-energy-T0 / 100) * engineer1) + ((patch-energy-T0 / 100) * engineer2)] if pcolor = yellow [set rep-energy 0] if patch-current-energy < patch-energy-T0 [ ifelse patch-current-energy + rep-energy > patch-en-ergy-T0 [set patch-current-energy patch-energy-T0] [set patch-current-energy patch-current-energy + rep-energy] ] ] end
to plots set-current-plot “population1-histogram-current-tick” ; plot current ticks histogram breed 1 set-current-plot-pen “alive” let listalive [agents_set1_generation] of agents_set1 set-plot-pen-mode 0

The Ecology of Bacterial Individuality114
histogram listalive set-current-plot-pen “dead” let listdead [agents_set1_generationdead] of deadset1 set-plot-pen-mode 0 histogram listdead set-current-plot-pen “all” let listall sentence listalive listdead set-plot-pen-mode 0 histogram listall set-current-plot “population2-histogram-current-tick” set-current-plot-pen “alive” let listalive2 [agents_set2_generation] of agents_set2 set-plot-pen-mode 0 histogram listalive2 set-current-plot-pen “dead” let listdead2 [agents_set2-generationdead] of deadset2 set-plot-pen-mode 0 histogram listdead2 set-current-plot-pen “all” let listall2 sentence listalive2 listdead2 set-plot-pen-mode 0 histogram listall2
set-current-plot “population-breed1” let cpp_name word “tick “ (ticks + 1) create-temporary-plot-pen cpp_name set-plot-pen-mode 0 set-plot-pen-color ticks + 5 set listall sort listall let n_b count agents_set1 + count deadset1 let counter-current-population-breed1 0 let step-current-population-breed1 100 / (n_b) foreach listall [ plotxy counter-current-population-breed1 ? set counter-current-population-breed1 counter-current-population-breed1 + step-current-population-breed1] set-current-plot “population-breed2” let cpp_name2 word “tick “ (ticks + 1) create-temporary-plot-pen cpp_name2 set-plot-pen-mode 0 set-plot-pen-color ticks + 5 set listall2 sort listall2
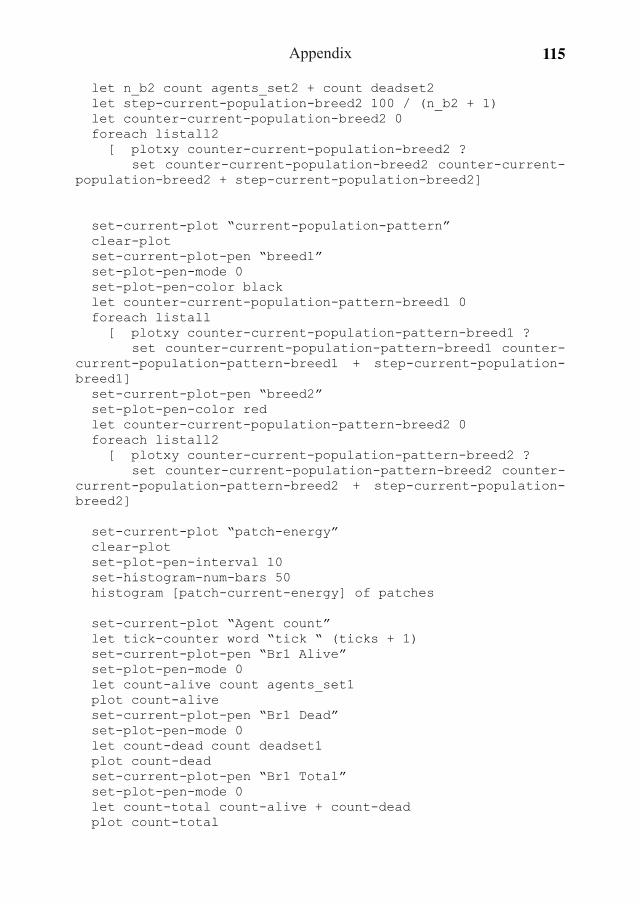
Appendix 115
let n_b2 count agents_set2 + count deadset2 let step-current-population-breed2 100 / (n_b2 + 1) let counter-current-population-breed2 0 foreach listall2 [ plotxy counter-current-population-breed2 ? set counter-current-population-breed2 counter-current-population-breed2 + step-current-population-breed2] set-current-plot “current-population-pattern” clear-plot set-current-plot-pen “breed1” set-plot-pen-mode 0 set-plot-pen-color black let counter-current-population-pattern-breed1 0 foreach listall [ plotxy counter-current-population-pattern-breed1 ? set counter-current-population-pattern-breed1 counter-current-population-pattern-breed1 + step-current-population-breed1] set-current-plot-pen “breed2” set-plot-pen-color red let counter-current-population-pattern-breed2 0 foreach listall2 [ plotxy counter-current-population-pattern-breed2 ? set counter-current-population-pattern-breed2 counter-current-population-pattern-breed2 + step-current-population-breed2] set-current-plot “patch-energy” clear-plot set-plot-pen-interval 10 set-histogram-num-bars 50 histogram [patch-current-energy] of patches set-current-plot “Agent count” let tick-counter word “tick “ (ticks + 1) set-current-plot-pen “Br1 Alive” set-plot-pen-mode 0 let count-alive count agents_set1 plot count-alive set-current-plot-pen “Br1 Dead” set-plot-pen-mode 0 let count-dead count deadset1 plot count-dead set-current-plot-pen “Br1 Total” set-plot-pen-mode 0 let count-total count-alive + count-dead plot count-total

The Ecology of Bacterial Individuality116
;breed 2 plots set-current-plot-pen “Br2 Alive” set-plot-pen-mode 0 let count-alive2 count agents_set2 plot count-alive2 set-current-plot-pen “Br2 Dead” set-plot-pen-mode 0 let count-dead2 count deadset2 plot count-dead2 set-current-plot-pen “Br2 Total” set-plot-pen-mode 0 let count-total2 count-alive2 + count-dead2 plot count-total2 ;agents on patches set-current-plot “agent-counts on patches” clear-plot set-current-plot-pen “agentset1” let agents-on-patches [count agents_set1-here + count dead-set1-here] of patches with [count agents_set1 + count deadset1 > 0] histogram agents-on-patches set-current-plot-pen “agentset2” let agents-on-patches2 [count agents_set2-here + count dead-set2-here] of patches with [count agents_set2 + count deadset2 > 1] histogram agents-on-patches2end

Appendix 117
ASiMoPh example interface

The Ecology of Bacterial Individuality118

About the author 119
Mitja Nandi Paul Remus-Emsermann was born on the 7th of December 1980 in Siegburg, Germany. After his high school degree in 2000 he spend one year of civil service working in the IT-support department of the Johanniter hospital in Bonn, Ger-many. In 2001 he started the study of biology at the Rheinische-Friedrich-Wilhelms University in Bonn. Early 2005 he started to work as a student assistant in the depart-ment of ecophysiology of plants under supervision of Prof. Lukas Schreiber and Dr. habil. Rochus Franke mainly working with Arabidopsis thaliana surface polymers such as Suberin and Cutin. From January 2006 till March 2006 Mitja took the op-portunity to conduct an internship at Syngenta, Stein, Switzerland with the topic “movement of insecticides in soil” under the supervision of Dr. Anke Buchholz. In March 2007 he earned his diploma degree in biology (major subject ecophysiology of plants, minor subjects chemistry and microbiology) and successfully finished his thesis “Characterization of the Beta-Acyl-CoA-Synthase Gene At5g43760 in Arabi-dopsis thaliana” under supervision of Prof. Lukas Schreiber and Dr. habil. Rochus Franke. Also during 2007, Mitja started his PhD-project “The Ecology of Bacterial Indi-viduality” in the department microbial ecology at the Netherlands institute of ecol-ogy, NIOO-KNAW, in Wageningen, the Netherlands, initiated and supervised by Prof. Johan Leveau and co-supervision by Prof. George Kowalchuk. Since then he performed projects as guest researcher in the department of plant pathology at the university of California, Davis CA, USA and in the department of ecophysiology of plants at the Rheinische-Friedrich-Wilhelms University, Bonn, Germany. Mitja pre-sented his research at many seminars and several national and international meetings and conferences. The results of his PhD-project are the presented in this booklet. In November 2011, he joined the group of Julia Vorholt at the ETH Zurich to focus further on plant-microbe and microbe-microbe interactions at the single-cell level.

The Ecology of Bacterial Individuality120

Acknowledgements 121
First of all, I want to thank my supervisor and promoter Johan. Johan, you gave me the opportunity to start this project and gave me a great head start during the first year of the project. We certainly managed this project well enough even though we had a long distance relationship with nine hours of time difference for the last three years. You taught me many things, and formed me to the scientist I am today.
I want to thank you George for taking the obligation to act as my promoter. Of course I also want to thank you for all the effort you put into my project during its final stage and the integration into your “small-scale” group. You always had an open ear for me.
Hans, I want to thank for your open door policy and the constructive discussions that we had. I really appreciated to work under you as a department head, and the way you solved the problems that I ended up in. I will miss rubbing my head against yours in discussions, and the occasional pad on the shoulder when you thought that I did a good job. I hope you’ll stay part of the NIOO for a long time still - it would not be the same without you.
Tanja and Robin, it was a pleasure to work on the same topic as you did, thank you for all the discussions about plants, heterogeneity and single-cells, for the support you gave in the lab when necessary and all the good laughs. I liked our discussions and the views that both of you had, which were always at least a bit- different than mine. That certainly opened my horizon. Annemieke, thanks for our discussions. Kathrin thanks for introducing me to the world of a modeler, being on the same proj-ect with you was a pleasure.
Paolina, thanks for all the kind words that you always had for me, and thanks a lot for the opportunity to supervise Olaf’s microscopy work, I really appreciated the experience.
Thanks to my climbing buddies, and I hope I don’t forget anyone here: Remy, Tanja, Joop, Gera, Max, Roeland, Anne, Dirk, Veronica, Vincent, Patrick, Francesca, and so many students that we dragged with us that I had so much fun with. I miss you all already and the many ‘a biertjes’ and nights of discussions that we had. Nalonja, thanks for hosting us every other night.
Sotos, me man! It was a pleasure to meet you - we’ll stay in touch.

The Ecology of Bacterial Individuality122
My dearest Taia, little chicken, office-mate, thoughtful friend, NIOO wouldn’t have been the same for me without you! I loved our open-ended discussions about moral and ethics. I really hope we will keep in touch in the future.
Remy, brother in arms, mister “know-it-all”. All that trash we’ve talked. I will miss it dearly! I will count on you to visit me in Switzerland to show me how to climb in real mountains.
Marjolein, it was so much fun to have you as a office-mate I will always laugh when remembering the days when you and Jeff trying to get the upper hand in discussions by speaking louder.
Barbara and Roxina, you sweetened my initial life at NIOO and showed me how things worked, thanks a lot for all the confidence you gave me back then.
Saskia, Tanja, Agaat, and Marlies, thanks so much to always have an open ear for my problems and to show me where to find stuff.
Gerda, Elly, and Gerry, the good souls of the institute. What would the NIOO be without you girls (probably lost and in turmoil)? Thanks for everything.
All the others, and there is so many of you since the recent merge of our institutes more than I can remember, with most of you I had beautiful and entertaining lunch and coffee breaks. It was rare that I didn’t enjoy my days at the NIOO thanks to all you guys.
Olaf and Isaac, thanks each of you so much for staying in the lab with me for a la-borious long-term experiment. I guess I would have spent another couple of hours in the lab if not for you two guys.
Jan, Jeness, Isaac, Gurdeep, Nilesh, Robin, Ben and Jeremy, I had a blast with you guys in Davis, thanks for taking care of me and entertaining me during the two month that I spent there.
Lukas and Rochus (Benny) thanks for letting me use your lab for one part of this

Acknowledgements 123
thesis and of course for giving me the confidence to start a PhD-project in the first place. Also thanks to Sheron with whom I had important discussions and who gave me more than valuable advises during the time.
Paul, Tina, Reinhard und Gerda, danke euch Eltern fürs da sein, fürs helfen wenn Not am Mann war und alles andere.
Daniela, Frau, beste Freundin, Kleinkind, Kritikerin in einem. Ohne dich hätte ich nicht durchgehalten

The Ecology of Bacterial Individuality124

Summary 125
SummaryClassical microbial ecology generally describes and quantifies bacteria at a popula-tion or community level, be it for example in a liquid culture, as a colony on an agar plate, or as found in environmental samples. Such an approach necessarily yields re-sults that reflect population or community averages, e.g. an average enzyme activity,, an average doubling rate, or an average experience of the environment. The latter is at odds with the growing realization that considerable environmental heterogene-ity exists in physicochemical and biological properties at the micrometer-scale. By averaging the bacterial experience of such heterogeneous environments, potentially valuable information is lost about the behavior of the organisms under study and about the variation in that behavior. Recent technical advances have introduced new possibilities to interrogate individual bacteria for their perception of and response to their local environment.In this thesis, we used the phyllosphere, or leaf surface, as a model bacterial environ-ment to address the question if and how individual cells that colonize this habitat are impacted by micro-scale environmental heterogeneity and how these impacts help to shape bacterial populations. To this end, a novel bioreporter was introduced that enabled analysis of single-cell reproductive success of individual bacteria. This new bioreporter was termed CUSPER (reproductive success = repsuc read backward) and is based on the dilution of green fluorescent protein (GFP) from growing cells of the natural leaf-colonizing bacterial strain Erwinia herbicola 299R. By applying CUSPER cells to bean leaf surfaces, it was revealed that individual im-migrants differed in their ability to produce offspring and contributed differently to the final observed populations. This was interpreted as an imposed effect of the en-vironmental heterogeneity on the immigrating population, suggesting that the phyl-losphere represents a patchy environment that offers various degrees of habitability to members of an immigrant population.Subsequently, CUSPER was used to quantify the impact of different leaf inocula-tion densities on the reproductive success of cells within a population of bacterial immigrants. Some of the chosen densities were deliberately in excess of the carrying capacity of the bean leaves under study. This approach made it possible to show that even under circumstances in which immigrants arrive at numbers higher than the leaf can sustain, some cells were still able to reproduce. This finding suggested that carrying capacity has to be understood as the sum of many local carrying capacities. A complementary modeling approach revealed that experimental observations can be explained by the existence of three types of microenvironments. Two of these environments represented approximately equal parts of the bean leaf surfaces under
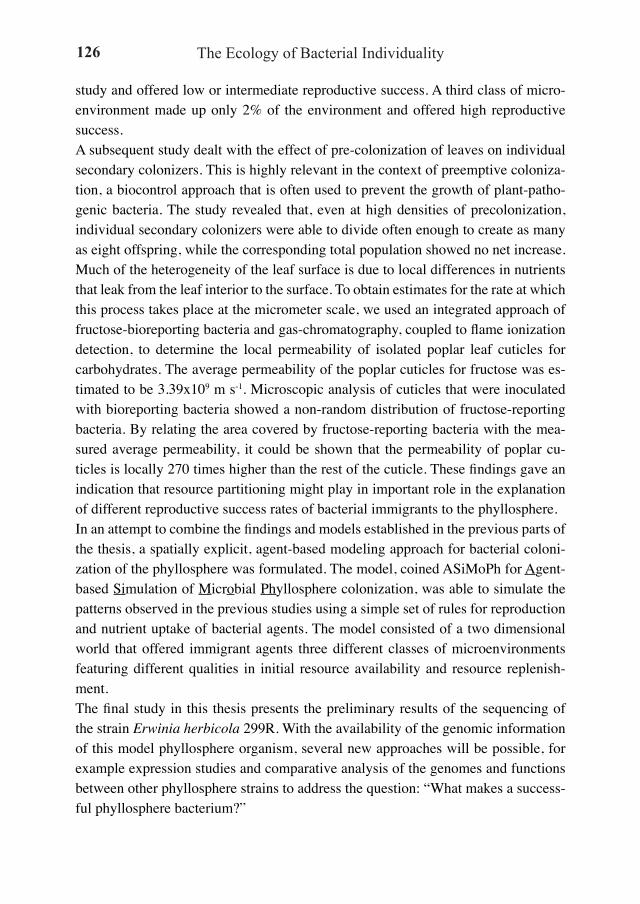
The Ecology of Bacterial Individuality126
study and offered low or intermediate reproductive success. A third class of micro-environment made up only 2% of the environment and offered high reproductive success.A subsequent study dealt with the effect of pre-colonization of leaves on individual secondary colonizers. This is highly relevant in the context of preemptive coloniza-tion, a biocontrol approach that is often used to prevent the growth of plant-patho-genic bacteria. The study revealed that, even at high densities of precolonization, individual secondary colonizers were able to divide often enough to create as many as eight offspring, while the corresponding total population showed no net increase. Much of the heterogeneity of the leaf surface is due to local differences in nutrients that leak from the leaf interior to the surface. To obtain estimates for the rate at which this process takes place at the micrometer scale, we used an integrated approach of fructose-bioreporting bacteria and gas-chromatography, coupled to flame ionization detection, to determine the local permeability of isolated poplar leaf cuticles for carbohydrates. The average permeability of the poplar cuticles for fructose was es-timated to be 3.39x10⁹ m s-1. Microscopic analysis of cuticles that were inoculated with bioreporting bacteria showed a non-random distribution of fructose-reporting bacteria. By relating the area covered by fructose-reporting bacteria with the mea-sured average permeability, it could be shown that the permeability of poplar cu-ticles is locally 270 times higher than the rest of the cuticle. These findings gave an indication that resource partitioning might play in important role in the explanation of different reproductive success rates of bacterial immigrants to the phyllosphere.In an attempt to combine the findings and models established in the previous parts of the thesis, a spatially explicit, agent-based modeling approach for bacterial coloni-zation of the phyllosphere was formulated. The model, coined ASiMoPh for Agent-based Simulation of Microbial Phyllosphere colonization, was able to simulate the patterns observed in the previous studies using a simple set of rules for reproduction and nutrient uptake of bacterial agents. The model consisted of a two dimensional world that offered immigrant agents three different classes of microenvironments featuring different qualities in initial resource availability and resource replenish-ment.The final study in this thesis presents the preliminary results of the sequencing of the strain Erwinia herbicola 299R. With the availability of the genomic information of this model phyllosphere organism, several new approaches will be possible, for example expression studies and comparative analysis of the genomes and functions between other phyllosphere strains to address the question: “What makes a success-ful phyllosphere bacterium?”

Summary 127
Taken together, the studies presented in this thesis demonstrated that single-cell ob-servations yielded important information of the heterogeneity that shapes bacterial populations in the phyllosphere that were thus far overlooked. The CUSPER biore-porter offers an excellent tool for future studies investigating bacterial individuality not only in the phyllosphere, but also for many other environments.Important first steps were taken in this thesis to build a conceptual framework for bacterial individuality in natural environments that may serve as a foundation for future research in individual-based microbial ecology.

The Ecology of Bacterial Individuality128

Samenvatting 129
SamenvattingIn de microbiologie en microbiële ecologie wordt er over het algemeen aan bacteriën gemeten als populaties of gemeenschappen, bijvoorbeeld in een vloeibare cultuur, als een kolonie op een agarplaat of in hun natuurlijke leefomgeving. Dit heeft er toe geleid dat onze kennis van bacteriën in deze populaties en gemeenschappen veelal gebaseerd is op gemiddelden, bijvoorbeeld een gemiddelde enzymactiviteit of een gemiddelde groeisnelheid. Een groot nadeel van deze benadering is dat informatie verloren gaat over de eventuele variatie in het gedrag van individuele bacteriën bin-nen een populatie of gemeenschap. Er is een groeiend besef dat deze informatie belangrijk is voor een integraal inzicht in hoe bacteriële populaties en gemeenschap-pen tot stand komen en functioneren. Recente technische ontwikkelingen hebben het mogelijk gemaakt om onderzoek te doen aan hoe individuele bacteriën de fysisch-chemische en biologische kenmerken waarnemen van hun lokale leefomgeving. Het wordt steeds duidelijker dat op micrometerschaal variaties in deze kenmerken eerder regel dan uitzondering zijn en een belangrijke rol spelen in hoe individuele bacteriën reageren, overleven en vorm geven aan een populatie of gemeenschap.In dit proefschrift werd gebruikt gemaakt van de fyllosfeer, oftewel het planten-bladoppervlak, als een natuurlijke, microscopisch heterogene modelleefomgeving. Binnen deze fyllosfeer werd onderzocht of en hoe het lot van individuele bacteriën verschilt van dat van de gemiddelde bacterie. Daartoe werd een nieuwe zogenaamde bacteriële bioreporter ontwikkeld die het mogelijk maakt het reproductieve succes van individuele bacteriën te kwantificeren. Deze bioreporter werd CUSPER geno-emd en is gebaseerd op het uitverdunnen van groen fluorescerend eiwit (GFP) in reproducerende cellen van de bacterie Erwinia herbicola 299R, een natuurlijke kolo-nist van het bladoppervlak.Toepassing van CUSPER op het oppervlak van een bonenblad liet duidelijke ver-schillen zien in hoeveel nageslacht individuele bacteriën produceerden en dus welke bijdrage zij leverden aan de totale bacteriële populatie op het blad. We leidden hie-ruit af dat de fyllosfeer een fragmentarische omgeving is die bacteriën verschillende mates van bewoonbaarheid en realisatie van nageslacht biedt. Met CUSPER werd ook getest hoe oplopende bacteriële inoculatiedichtheden inv-loed hebben op het reproductieve succes van individuele cellen binnen een popu-latie van immigranten op het bladoppervlak. Deze aanpak gaf duidelijk aan dat zelfs wanneer het aantal bacteriële immigranten groter was dan wat het blad aankon (het zogenaamde bacteriële draagvermogen van het blad), sommige cellen nog steeds in staat waren nageslacht te produceren. Dit resultaat duidt er op dat het bacte-riële draagvermogen van een blad moet worden gezien als de som van vele lokale

The Ecology of Bacterial Individuality130
draagvermogens. De experimentele waarnemingen konden worden nagebootst met de hulp van een mathematisch model, maar alleen indien aangenomen werd dat er drie soorten lokale leefomgeving op het blad voorkwamen, dat wil zeggen plekken met een relatief lage, medium of hoge waarschijnlijkheid dat bacteriën succesvol zijn in het produceren van nageslacht. Een bijkomende aanname was dat er veel meer plekken met lage en middelbare waarschijnlijkheid op het blad voorkwamen dan plekken met hoge waarschijnlijkheid.Ook werd onderzocht wat het effect was van pre-kolonisatie van bladeren op het invasiesucces van secundaire immigranten. Dit is relevant in het kader van de zoge-naamde biocontrole, waarbij de groei van plant-pathogene bacteriën, dat wil zeggen bacteriële ziekteverwekkers op planten, wordt voorkomen door het bladoppervlak te verzadigen met voor de plant onschuldige bacteriën waardoor het bladoppervlak minder mogelijkheden biedt voor het produceren van nageslacht door een pathogene bacterie. De studie toonde echter aan dat zelfs bij hoge dichtheden van pre-kolonisa-tie door zulke onschuldige bacteriën, een aantal individuele secundaire immigranten wel degelijk in staat was te reproduceren.Een deel van de waargenomen verschillen in het reproductieve succes van bacte-riën op het bladoppervlak is waarschijnlijk te wijten aan lokale verschillen in voed-ingsstoffen, zoals plantensuikers die vanuit het blad naar het oppervlak lekken. Om inzicht te krijgen in de variatie tussen verschillende delen van het bladoppervlak werd gekozen voor een geïntegreerde aanpak, een combinatie van bacteriële bio-reporterdetectie voor de plantsuiker fructose, en gaschromatografie gekoppeld aan vlamionisatiedetectie. Zo kon de lokale doorlaatbaarheid van cuticula van populier-bladeren worden bepaald, op 3.39x10⁹ m s-1 voor fructose. Microscopische analyse van deze cuticula liet echter een nonrandom distributie zien van bacteriën die aan fructose blootgesteld waren. Door de twee bevindingen te combineren kon worden aangetoond dat de doorlaatbaarheid van de populierbladcuticula op sommige plek-ken wel 270 keer zo hoog als de gemiddelde doorlaatbaarheid. Deze resultaten geven aan dat de verdeling van suikerlekkage op het bladoppervlak niet uniform is, wat een verklaring kan zijn voor de waargenomen verschillen in het reproductieve succes van bacteriële immigranten in de fyllosfeer.In een poging om de verschillende onderzoeksresultaten te combineren werd een ruimtelijk expliciet, ‘agent-based’ model voor bacteriële kolonisatie van de fylosfeer geformuleerd. Met dit model, genaamd ASiMoPh voor ‘Agent-based Simulation of Microbial Phyllosphere colonisation’, werd het mogelijk te simuleren hoe bacteriën het bladoppervlak koloniseren aan de hand van eenvoudige regels voor de voort-planting van bacteriële cellen en hun opname van voedingsstoffen.

Samenvatting 131
Het laatste hoofdstuk in dit proefschrift geeft een samenvatting van de stappen die tot dusver genomen zijn om de genoomsequentie van Erwinia herbicola 299R te bepalen. Met dit genoom in handen zullen genexpressiestudies en vergelijkende ge-noomanalyses mogelijk worden en antwoord geven op de vraag wat voor genen en genfuncties nodig zijn om als bacterie te overleven in de fylosfeer.De experimenten en analyses in dit proefschrift bieden nieuw inzicht in de manier waarop individuele cellen van elkaar kunnen verschillen in hun lot tijdens de koloni-satie van een nieuwe leefomgeving als gevolg van heterogeniteit in de micrometer-schaalbeleving van die leefomgeving. De CUSPER bioreporter belooft een geschikt hulpmiddel te zijn voor toekomstige studies in het kader van bacteriële individu-aliteit, niet alleen in de fylosfeer, maar ook in andere bacteriële habitats. Met dit proefschrift zijn een aantal belangrijke stappen gezet in de richting van een betere waardering voor de rol van bacteriële individualiteit in de microbiële ecologie.