VOW-rurr~YruW~Df~~tUU~r r7irE~~ -- · PDF fileoverall excavation rate and required less work...
54
VOW-rurr~YruW~Df~~tUU~r s.m rr . .. r7irE~~ ee.4 --porI vo11 %Cmq~ A . 4 ,bAA.~~ - - M4, & ~.& i~ 1 A~kli ¾r4 a r r4 j'4 4x tc -I t frikt .art .- f MR"A "N' -l 04, - t n '~ t~ OR~fo 1~ ~ ~ ~~~1 w,,-'M. t'k4.*-
Transcript of VOW-rurr~YruW~Df~~tUU~r r7irE~~ -- · PDF fileoverall excavation rate and required less work...

VOW-rurr~YruW~Df~~tUU~r s.m rr . .. r7irE~~
ee.4 --porIvo11
%Cmq~ A
. 4 ,bAA.~~ - - M4,
& ~.& i~1 A~kli ¾r4 a
r r4
j'4 4x tc
-I t frikt .art .-
f
MR"A "N'
-l 04, -
t n '~ t~
OR~fo 1~ ~ ~ ~~~1 w,,-'M. t'k4.*-
-mlo -y :41 WeOU
"~~'t Am 'AWf*A.'llsarn
aA t vsL-I--d iO1 2WWA"_
J'i- VThy r
t.m m'T bk.. WafXpiS1rsf!'uadio"_ _
L2 MANtj4iS tX~ rc . m n*~b~' . tt~e4Ik 4eA ttn ressv,,'a~tn
41ý, 441
UA
%s~~~~~~~1 ionr~~J.~' f. >~.
.44J~~~~~~~~~~ AV';..,.7; ~.~~4 ~ ~ -. ___U
.Am NI~ P. -.At 'S' ~ i 4l1 U -.41"'

U NCLASS IFIED ________
SECURITY CLASSIFICATION OF THIS PAGE (When Date initered)
DERWATER JETTING AND A JET/DREDGE TOOL FOR TehLa - Imu
Y5'. Johneittlema
Navl oata Syt~msCeterARA WRK UN.ITIIOR UUMUERS
I. CERONRMLING ORGFICEIO NAME AND ADD)RESS 10 RGA LMET RJCTS
/1 Augt r978
1T. ONITORING AGENCY NAME & ADR tdl tfa Controli~ng Office) IS. SECU41TY CLASS. (of this report)
.~; 5~JUNCLASSIFIED15a DECLASSI FICATION/ DOWN GRADING
SCHCCULE
16. DISTRIBUTION STArEMENT (of this Raporgj
Approved for Public Release; Distribution Unlimited.
17. DISTRIBUTION STATEMENT (of the abstract entered In, Block 20, It different from Report)
IS. SUPPLEMENTARY NOTES
19. KEY WORDS (C- ntinue on reverse aide JI necessary and Identify by block mnubor)Diver, equipment Identifiers:Seafloor construction equipment Underwater jettingDredging Diver toolsUnderwater Working diver
______jetting
PACT (Continue on reverse side It necessary and identify by biock numbe~r)
~Underwater jetting and dredging components were tested to determine theirhydrodynamnic characteristics. The components were combined to form a three-way combination system of a single jet, a single dredge, and a combinationjet-dredge system. The operational characteristics of these three configura-tions were t~hen determined by testing their ability to excavate the sandy sediments in the waters off Panama City, Florida. The single jet system rapidlyfluidized the sand, but did not transport it elffeclively; the sin.ld
D JAN 73 1473 111DITION OF' I NOV6 SOSLT%/ N 0102~ F 1.60 SECURITY CLASSIFICATION OF THIS PAGIE (Whmen Data Entered)
SECURITY CLASSIFICATION UO THIS PAGE (Whnm Dome I•nteete
20.
Osystem transported the sand effectively but required constant attention toprevent clogging the suction. The combination jet-dredge system gave the bestoverall excavation rate and required less work from the diver than eithersingle component system. The combination is also a force-balanced system re-quiring little diver effort to handle the device.
CorrelatioL between soil properties and stagnation pressure were success-ful in establishing preliminary guidelines for choosing a nozzle, if the char-acteristics of the bottom material are known.
0ii
S/N 0102- LF-014. 6601UNCLASSIFIED
...... 4•--l_ E,,ATION OF THIS PACE('Wlm D Pe, Bnteed)

NCSC TM-229-78
SUMMARY
The Civil Engineering Laboratory (CEL), Port Hueneme, Californiatasked Naval Coastal Systems Center with testing and evaluating under-water jetting aad dredging components with a final goal of fabricatinga prototype diver operated combination jet/dredge. Tests were carriedout on a pump and various sizes of nozzles in order to establish designprocedures for selection of the most efficient nozzle for use in agiven bottom material.
Upon completion of the nozzle tests a prototype jetidredge cowbina-tion tool was assembled using a Stanley SM-22 sump pump which suppliedpower to the nozzle and a 3-inch "Gold Dredge." This size dredge waschosen because of it's power input requirements and immediate availabili-ty. Tests were then completed on the combination jet/dredge and it'sperformance in different bottom materials recorded.
. . . ............. i...
4• .. . .. . I
(Reverse Page ii Blank)
__Q
NCSC TM-229-78
TABLE OF CONTENTS
Page No.
I NTRODUCTION. .. ...................... ....................... 1
EXPERIMENTAL OBJECTIVES AND APPROACHES. .. ..................... 1
Hydrodynamic Descriptions .. .... ......................... 3
Hydraulic Sump Pump .. .. .. ....................... 3
Test Rig Piping. .. ................................. 3
Jetting Nozzles .. .. .. .. .. .. .. .. .... 4
TEST PLAN .. ............ . . .. .. .. .. .. .. .. .... 4
Excavation Rates. .. ............ .. .. .. .. ..... 4
Reaction Forces .. .... ................................... 5
Jet anid Dredge Te sts.. .. .. .. .... ............ 5
EXPERIMENTAL RESULTS. .. ............ .. .. ..... . . . . 7
Hydraulic Sump Pump. .. ........ ......................... 7
Test Rig Piping . . . .. .. . .. .. .. .. .. .. ... 12
Jetting Nozzles . . .. .. .. .. .. ... . . . . . . . 12
A Excavation . . . . . . .. .. .. .. .. .. .. . .. 12
4Discus sion. ... .. .. ................ . . . . 12
Excavation Rates .. . .. .. . ... . ... . .. .. 15
Reaction Forces . . . . . . . . f . . . . . . . . . 15
iiAA
NCSC TM-229-78
TABLE OF CONTENTS (CONT'D)
Pqage No.
Jet-Dredge Tests . . . . . . . . . . . . . . . . . . . .. 19
Quantitative Results ........... . ......... 19
DESIGN PROCEDURES ...... ................... ... 24
CONCLUSIONS ............ .. ... . . . . . . . . . 33
RECOMMENDATIONS ........... . . . . . . . ... . 34
APPENDIX A- REACTION FORCE ANALYSIS ................. . A-1
APPENDIX B - STAGNATION PRESSURE ANALYSIS . . . . . . . . . . . B-1
iv
iv
-- . . . . . .. . .. . .. .. - -- n . -'1 ,- - . -" " -
NCSC TH-229-78
LIST OF ILLUSTRATIONS
Figure No. Page No.
1 Flow and Pressure Test Setup 2
2 Reaction Force Measurement Setup 6
3 Sump Pump Characteristic Curves 8
4 Water Flow Versus Pump Pressure 9
5 Hydraulic Fluid Pressure VariationsDue to to Temperature 10
6 Reduced Characteristic Curves 11
7 Characteristic Curves of Jetting Nozzles 13
8 Histogram of Calculated Stagnation Pressure 17
9 Nozzle Reaction Forces 18
10 Dredge Side of Jet-Dredge Tool 20
11 Jet Side of Jet-Dredge Tool 21
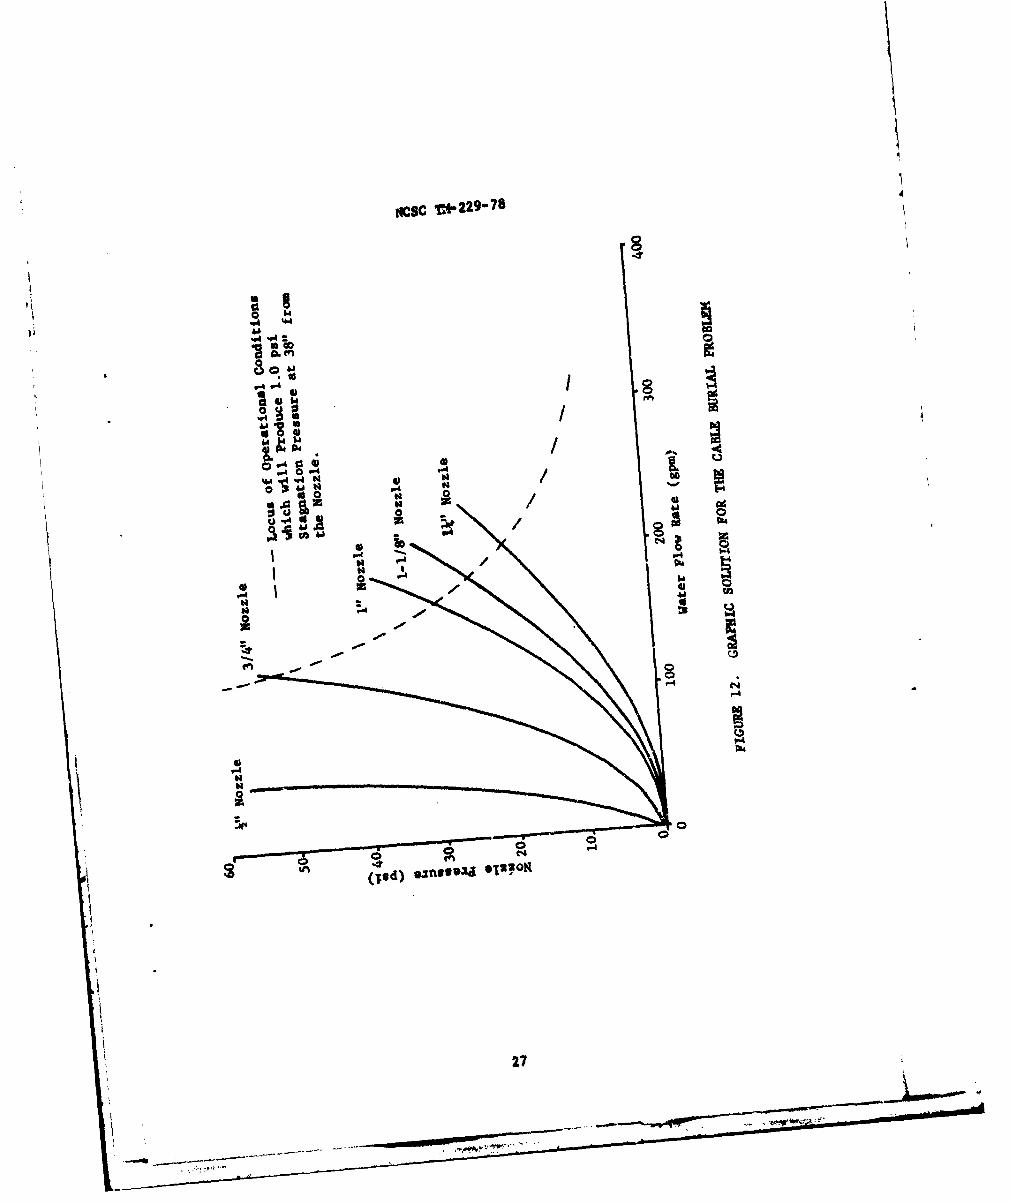
12 Graphic Soluti n for the Cable Burial Problem 27
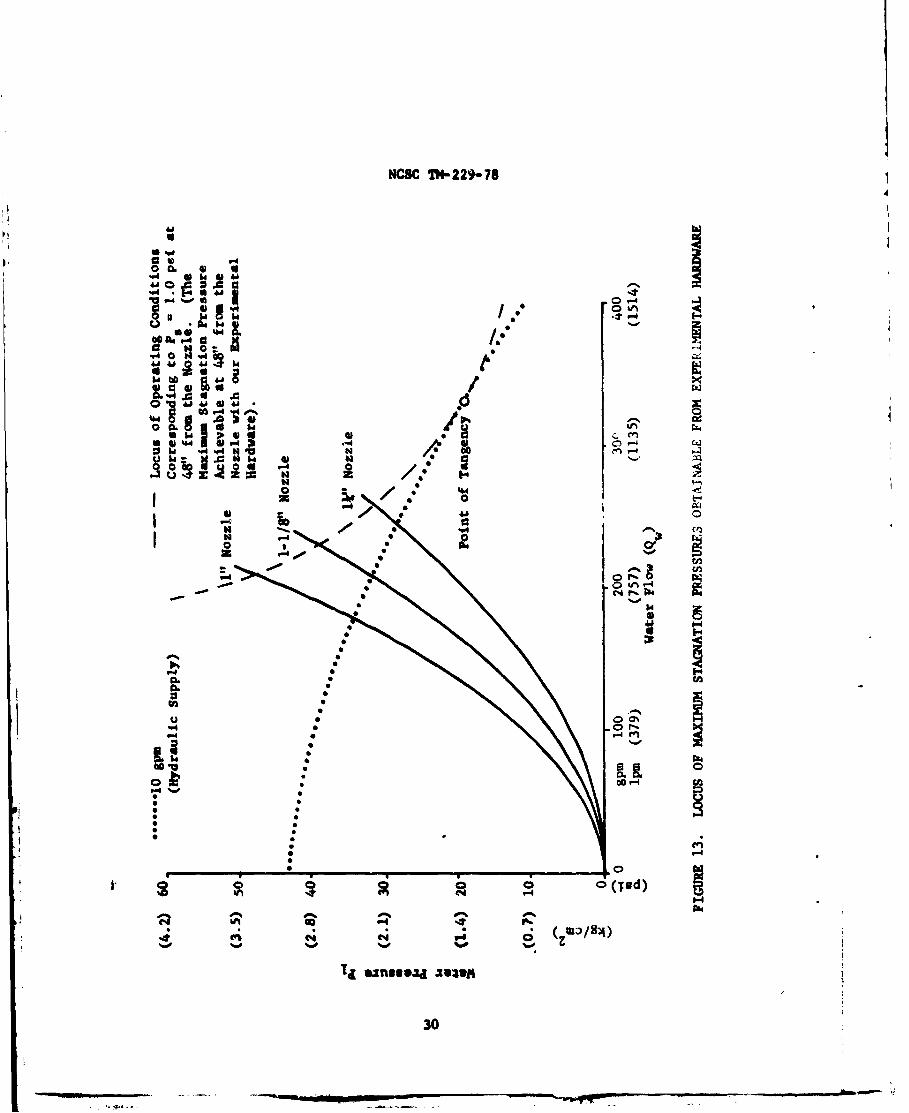
13 Locus of Maximum Stagnation Pressures Obtainablefrom Experimental Hardware 30
14 Nozzle Constant Related to Nozzle Diameter 32
v
NCSC Th-229-78
LIST OF TABLES
Table No. Page No.
1 Excavation Data 16
2 Test Site Data 19
3 Fluidization/Removal Data 22
4 Calculated and Measured Reaction Forcesfor Tapered Nozzles 23
5 Nozzle Constants 33
V1
Si ...... n............ -

NCSC TM-229-784
INTRODUCTION
The construction, mai.ntenance, and repair of fixed ocean facilitiesis a mission of the Naval Facilities Engineering Command supported bythe Civil Engineering Laboratory (CEL) and the underwater constructionteams. Many construction tasks require removal c! sediments. Jettingand dredging are the most commonly used techniques. Pipeline, cable
emplacement, and placement of mooring systems for ships and buoys, aretasks where some type of water jet may be used to accomplish the Job.Small salvage operations may require the use of a jet and/or dredge. The
inspection and repair of pipeline or cable systemp ,aay also require a jetor dredge.
Present methods for Jetting require the diver to contend with largeheavy hoses, unbalanced forces, and in some cases poor visibility. Wheredredging is used, the task of handling awkward sump pumps often resultsin excessive diver fatigue. Also, since sump pumps have a limitation onthe size of solids they can safely pump in a slurry, the diver must re-move shells, small stones, and other debris to prevent clogging. CEL
tasked NCSC to establish a basis for improvement in Jetting and dredginghardware.
The prellminary phase of the project involved gathering basic hydro-
dynamic data of various sized nozzles. This was done because of thelack of desiga information available in the area. An example of a nozzlewhich does not take full advantage of the power available from the pumpis the ½-inch balanced nozzle which is included in the tool kit assembled
at NCSC. This nozzle size may serve its purpose if ised in clay type
sediments where a cutting action is required, but if osed in soft sand
that can easily be fluidized, this nozzle would not be the most efficient.
In order to gather data on these components a lightweighat test frame was
constructed on which a pump, flowmeter, and nozzles were mounted(Figure 1).
EXPERIMENTAL OBJECTIVES AND APPROACHES
A series of experiments were performed to gather basic hydrcly-namlc
data describing the performance of various Jetting system components.
These experiments are divided into the following groups:
(Text Continued on Page 3)
"'.. ....-....

NCSC TM-229-78
SI-
Aluminum Angle Water Flow RateFrame at
ii
BH
-- A
P - Pump DischargePressure at A c
Pressure TapPA Ambient Pressure Gate Valve
P2 = Discharge FlowPressure at C
FIGURE 1. FLOW AND PRESSURE TEST SETUP
2
' .**4*--' .. . ... .. - -,- ~m**s.l*'.* -..., .
NCSC TM-229-78
1. HYDRODYNAMIC DESCRIPTIONS
*hydraulic sump pump
*test rig piping
*jetting nozzles
2. OPERATIONAL DESCRIPTION
*excavation rates
*reaction -&orces
*jet/dredge experiences
The majority of tests were run with the components mounted in the
test frame constructed of lightweight aluminum angle stock (Figure 1).
HYDRODYNAMIC DESCRIPTIONS
Hydraulic Sump Pump
The objective of the first set of tests was to characterize thehydraulic sump pump (Stanley Model 51422) with a series of flow versuspressure curves for various hydraulic supply conditions. For these ex-periments the nozzle and pressure tap (location C) shown in Figure 1were replaced by a gate valve so that a range of back pressures could beimposed on the pump. Then, for hydraulic flow rates between 5 and 10gallons per minute (18.9-37.9 1pm) the water flow rate (Q), pump dis-charge pressure (Pl), and ambient pressure (P.) were measured. Pump dlo-charge pressure was sensed at location A, water flow rate at location Band downstream pressure (P2) at location C. Further, the pressure gaugeat location A was left in the system throug~iout all nozzle tests so thatadditional pump data could be collected using the nozzles rather than thegate valve, as a flow restriction.
Test Rix Piping
The second set of tests characterized the piping between the pumpand the nozzle under test. Actually, these data were collected duringthe pump and nozzle tests by noting the pressure drop between pressuregauge at location A and the end of the test rig pipe section. Duringpump tests the end of the pipe section was open to ambient pressure, andduring the nozzle tests the end of the test rig piping was at location C(the downstream pressure gauge).
3

NCSC TM-229-78
Jetting Nozzles
The third set of experiments characterized the flow and pressurerelationship for nozzles. The nozzles tested were:
* 1/2" straight pipe
* 3/4" straight pipe with bell reducer (1½ x 1¼ and
* 1" straight pipe appropriate reducing bushings
e 1¼" straight pipe
e 1/2" orifice tapered nozzle (Halperin part # NT202)
e 3/4" orifice tapered nozzle (Halperin part # NT202)
* 1" orifice tapered nozzle (Halperin part # NT202)
e 1 1/8" orifice tapered nozzle (Halperin part # NT202)
e 1 1/4" orifice tapered nozzle (Halperin part # NT202)
The data which characterize these nozzles are the water flow rate,(Q), and the pressure .drop across the nozzle (this is computed as thedifference between the gauge pressure, (P 2), and ambient pressure (P a).
TEST PLAN
EXCAVATION RATES
The first set of tests in the operational category were intended tocompare the excavation rate of each nozzle under various supply condi-tions. The test st' id was modified by the addition of flotation whichpermitted it to bc mioved in the watei quite easily. For each test, thetest stand was positioned over an undisturbed section of the sand bottomoff NCSC's east pier, with the nozzle pointing straight down. The bottomwas jetted for 1 minute. Measurements of the diameter and depth of thejetted hole were then recorded. Because the sand in this area fluidizedeasily and recompacted slowly, the data gathered by these experimentsshould be interpreted as volume fluidized rather than excavated. Sub-sequent excavation rate tests were performed, allowing sufficient timefor the fluidized material to settl-.
4

NCSC TM-229-78
REACTION FORCES
'I The second set of tests was an evaluation of reaction forces re-suiting from use of various nozzles. Early in the project it wasthought that if the test stand and piping were physically constrainedthen the nozzle reaction would be seen as a compressive force in thepipe just upstream of the nozzle. An annular load cell was built andinstalled in the pipe to measure this force. When this apparatus wastried, it indicated that the pipe was in tension rather than compres-sion. Thinking through this problem again led to the realization thatthe static pressure in the pipe (essent-a~lly what is read on pressuregauge at location C) creates a tensile condition greater than the com-pressive force attributable to the change of momentum term. Further,since the net contribution of static pressure terms must be zero forthe entire system (refer to Appendix A), the reaction force relatesonly to the change in momentum term
d(mv) =vdm 2 ~vAdt dt A
where
dt-differentiation with respect to time
m = mass
v - velocity
A - orifice area
Q = flow rate
and p - density
To perform the reaction force studies (after abandoning the loadcell), the test rig was suspended with the nozzle pointing straight downand forces were measured with a Chatillion Scale (Figure 2).
JET AND DREDGE TESTS
The intent of these tests was to gather information relating tothe advantage (or disadvantages) of combining the pump, jet, and dredgeinto a single tool which would be the deliverable hardware of thisproject.
(Text Continued on Page 7)
5

NCSC TH-229-78
* - ChatillionScale
Pivot
FIGURE 2. REACTION FORCE MEASUREMENT SETUP
6
SII . "" I-- -- I i .. . " II "low-p,'

NCSC TM-229-78
EXPERIMENTAL RESULTS
'~1
HYDRAULIC SUMP PUMP
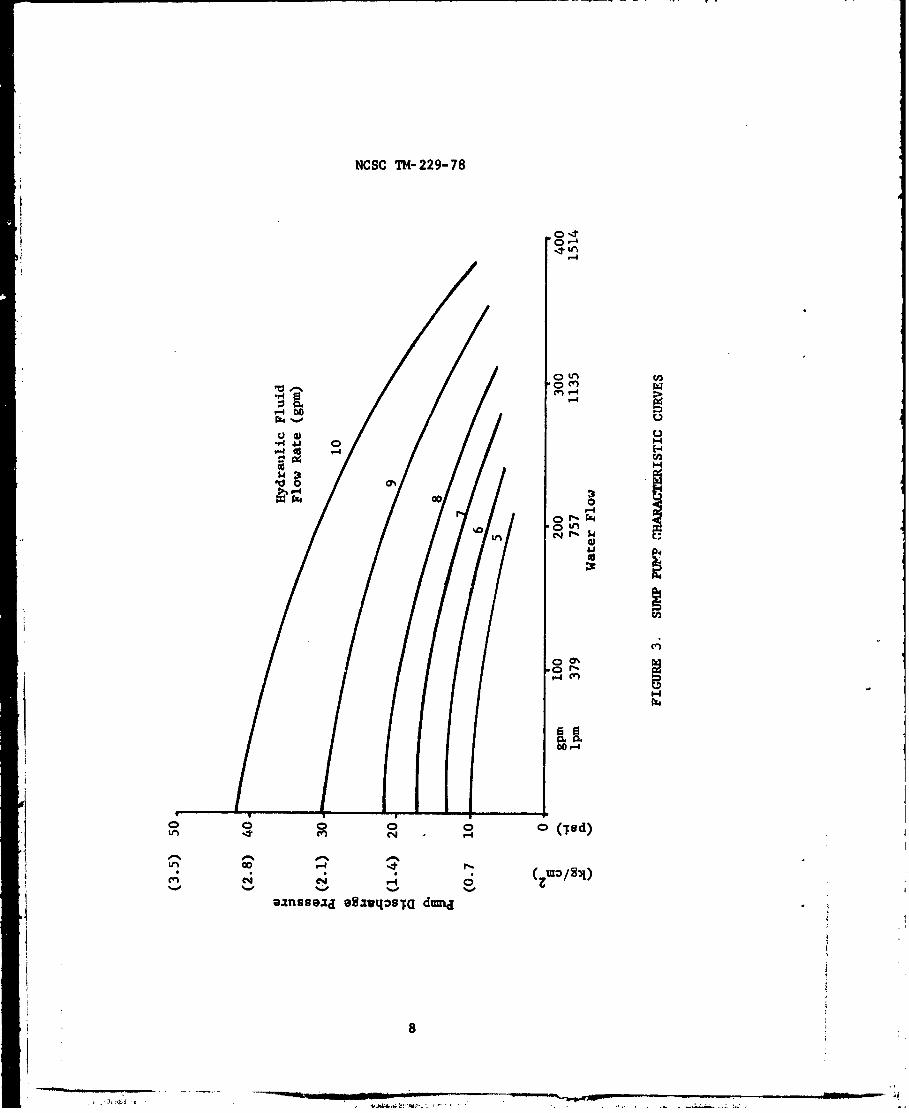
Dita obtained from pump tests comprise a set of characteristiccurves (flow versus pressure) for hydraulic fluid supply flow rates be-tween 5 and 10 gpm (3.9 and 18.9 Ipm) (Figure 3). Several cautionarynotes are in order.
1. Repeatability. Setting a desired hydraulic fluid flow rate onthe power source does not guarantee that the sump pump will operate alongthe corresponding curve shown in Figure 3. To show the magnitude of thisproblem Figure 4 presents all pump characteristic data points corres-ponding to a nominal hydraulic flow rate of 10 gpm '18.9 1pm). Effortswere made to keep the hydraulic fluid at a constant temperature by in-stalling 100 feet of hose from the power source to the pump, and byputting a large portion of this hose in the water to cool the hydraulicfluid; but supply conditions still varied as shown in Figure 4. Exami-nation of Figure 5 shows the range of flow and pressure in hydraulicfluid encountered during the tests and demonstrates that these parametersseemingly do not systematically depend upon hydraulic fluid temperature.
2. Similarity. The affinity laws for centrifugal pumps predictthat all characteristic curves for a particular pump are related throughthe reduced flow and pressure variables.
Q and P-n 2r)
where
n- impeller speed.
Under the assumption that the sump pump's motor speed is directly pro-
portional to hydraulic fluid flow rate, the affinity laws' applicabilitywas tested by redrawing the curves of Figure 3 on reduced axes of
Qwater and
Qhydraulic 2Qh2~hydraulic
These reduced characteristic curves are presented in Figure 6. Thecurves do not follow the affinity laws' as well as one might hope.
(Text Continued on Page 12)
7
NCSC TM-229-78
0 LM
nV-4
0cfn
-400
.0.
00
09'C14
eanssaa agvqos~ d-4
8,rz

NCSC TM-229-78
0 c
00
00
0 0 LnIý4 W N
0 0~00
0 :0 4) 4 1
0C -4-4 :0
0 0 044-
"0 -t4 4'4-I P-1
0 0044 44,
00u.A *r4
"0 L0
o 0o (led)
enNI N r-4 0
sanes~ea as vqpujc dtuma
9

NCSC TM-229-78
2000.(140.4)
A 105
O,x 115-120
13 100-110
4 1500 0 110-1201051053) Hydraulic gluid Temperature-
(F)
"4-
3ý
® 1000.• (70.2)
500,
(35.1)
00 (sp") • 1•
(lpm) (18.9) -(37.9)
-'Hydraulic Flow
FIGURE 5. HYDRAULIC FLUID PRB.ESSURE•J VARL4ATIONS DUE TO TEMPERATURE
50

NCSC TM- 229- 78
-4D0
OD%
r4444
-00
C',
00
In.
eanoojd olv4 penp0
NCSC T*-229-78
TEST RIG PIPING
During nozzle test3 the pump discharge pressure at A (Figure 1)(P I) was measured to provide additional pump data and the dischargeflow pressure (P2) at the nozzle (C in Figure 1) was measured to deter-mine certain nozzle characteristics. The difference between these twopressures is the pressure drop in the test rig piping. A total of 69data points were used to determine that for the test rig piping thedifference in pressure was
-4 2 psiAP - (1.75 x10 A 2
(gpm)
Although this information is applicable only to the test rig, it doespoint out that for systems design, the piping between the pump and thenozzle must be considered, either by adding it to the nozzle characteris-tic or by subtracting it ftin the pump characteristic.
JETTING NOZZLES
The straight and tapered nozzles listed in the subsection on JettingNozzles were tested to establish their pressure versus flow relationshipcharacteristics. For flow through an orifice the pressure could be ex-pected to be proportional to the square of the flow rate; this hypothesiswas tested and found to be quite reasonable. Figure 7 shows the pressure-f low curves for each nozzle tested.
EXCAVATION RATES
Discussion
The process of excavating sand may be thought of in terms of twodistinct mechanisms; i.e., fluidizing and transporting, which act to-gether. In the early excavation rate tests, the experimental setup ofFigure 1 was used, and after Jetting for 1 minute, the dimensions of theresulting hole in the sand were measurnd. At the time the measurementswere taken the sand was fluidized, but not necessarily removed from theI hole. Therefore, the early results only report the volume of sandfluidized. The fluidized material remained in this state approximatelyone-half hour after~ the hole was produced. Later tests both with andwithout the dredge operating took this into account by allowing suffici-ent time for recompaction of the fluidized sand.
(Text Continued on Page 14)
12

ICSC TrH-229-78
(3.5) 50 Nozzle 3/4" Nozzle
I" Noz laI" N 1a LL/8" Nozzle
(2,8) 40 1-V" )ozzle
( 2.1) 30
S(1.4) 20
(0.7) 10
" gpm) 100 200 300(ipa) 379 757 1135
Water Flow (Qw)
FIGURE 7. CHARACTERISTIC CURVES OF JETTING NOZZLES
13

NCSC TM-229-78
Fluidization
Assuming that fluidization occurs when the jet's stagnation pressurereaches or exceeds some value related to the sediment's shear strengththe early jetting results can be analyzed in terms of the theory of tur-bulent jets; this theory allows calculation of the stagnation pressure atvarious distances from the nozzle •nd should, therefore, allow predic-tions of the maximum distance from the nozzle where sand will befluidized.
The theory predicts that the variation of flow velocity on a jetaxis is related to the distance from the "pole" of the jet by an equa-tion of the form
mx
and stagnation pressure by an equation of the form
k
x
In the latter equation, k may be determinea experimentally, as may be theadditive constant relating the pole position to the nozzle position.Theoretical values are also available.
In Appendix B the theoretical values taken from Reference 1 and theexperimental values taken from Reference 2 are shown to be in reasonablygood agreement and produce the following equation:
47
D• 2.1)2
where x is measured from the nozzle's orifice.
The hypothesis that fluidization will occur if the stagnation pres-sure (P ) exceeds a value related to the sediment's shear strength maynow be tested by calculating the stasnation pressures found at the maxi-mum observed depth of a Jetted hole.
(I) Abramovich, G. N., The Theory of Turbulent Jets, M.I.T. Press,Cambridge, MA., 1963.
(2)Cheung, J. B., et al, Study on Water Jet Trenching, Flow Technology,Presentation #2, Flow Research, Inc., Kent, Washington, 3 December1976.
14
• • "-• -4• --• , ---

NCSC TM-229-78
Table 1 presents data collected during excavation rate studies,with estimates of the initial nozzle pressure obtained by overlayingFigure 3 (swmp pump characteristics) on Figure 7 (nozzle flow and pres-sure). The last column of Table 1 shows values of stagnation pressurecalculated at the bottom of the jetted hole. A histogram of these lastdata is plotted in Figure 8 to show that they are normally distributedabout a mean stagnation pressure of 0.49 psi (with a standard deviationof 0.15 psi). Also shown on Figure & is a smoothed sample distribution(a Hanning window was used in smoothing) and a normal distributioncurve having the appropriate mean and standard deviation.
Since the shear strength of the sandy soil which was flu' -dized wasapproximately 0.17 psi (0.01 kg/rn2), it appears that these sedimentsfluidize when the stagnation pressure is on the order of three times theshear strength. It should be recognized that part of the variabilityin the data is attributable to experimental uncertainties (particularlythe estimations for the initial nozzle pressure), and to variations inthe soil properties. Although no attempt was made to sort out these fac-tors, it seems clear that: the techniques of analysis used here could oereversed to provide reasonably good estimates of the depth of f!,.vidi-zation that a given nozzle will achieve. This is discussed further inthe section dealing with design procedures.
EXCAVATION RATES
While fluidization appears to be predictable on the basis of theory,it is not so clear that excavation is easily predictable. Once the sandparticles are dislodged by a jet, the mechanics of sediment transportcome into play to determine whether or not these particles will make itout of the hole or not. Data relative to the jetting-dredging tests areshown in Table 2. Table 3 lists the excavation effectiveness of jettingalone and for the jet-dredge combination. Comparing the fluidized volumewith the volume after settling, each test with the jet alone shows thatonly 25 percent of the fluidized volume was perman~ently removed from thehole. Though it may be c.oincidence that this percen~tag~e is so constantover a wide range of no~zzle sizes it could be that it is dependent onsediment properties. Not enough quantitative data were gathered toJustify further conclusions on excavation rates by jetting alone.
REACTION FORCES
Examination of Table 4 and Figure 9 (nozzle reaction forces, F)shows that through the use of the change in momentum equation,X
d(mv) - 2dt A'
(Text Continued on Page 18)

NCSC Ti-22P-78
TABLE 1
EXCAVATION DATA
Hydraulic Observed Inferred CalculatedNozzle Plow Rate Depth of Hole Source Pressure Stagnation Pressure
Size & Type (too) (i nches) (1) (98st)
1 1/4" 10 58, 60, 58 27 0.54, 0.51, 0.54Tapered 9 56, 54, 53 21 0.45, 0.48, 0.50
8 54, 48, 46 16 0.37, 0.46, 0.507 43, 40, 39 13 0.46, 0.53, 0.556 39, 39, 37 11 0.47, 0.47, 0.515 36 8 0.39
1 1/8" 10 55, 54, 54 30 0.54, 0.56, 0.56Tapered 9 45, 49, 50 23 0.61, 0.52, 0.50
8 44, 45, 45 17.5 0.58, 0.46, 0.467 39, 40, 38 15 0.48, 0.50, 0.556 38, 37, 29 12 0.44, 0.46, 0.735 34 9 0.40
1" 10 65, 54, 53, 54 32 0.33, 0.48, 0.50, 0.48Tapered 9 60, 44, 42, 50 24.5 0.30, 0.54, 0.59, 0.42
8 52, 41, 38, 49 18 0.29, 0.46, 0.53, 0.327 48, 38, 35, 41 16 0.30, 0.47, 0.55, 0.406 33, 3Y, 34, 40 12 0.46, 0.43, 0.43, 0.325 35, 33 9 0.31, 0.34
3/4" 10 60, 35, 30 34 0.24, 0.67, 0.90Tapered 9 53, 28, 28 27.5 0.24, 0.8-', 0.83
8 50, 30, 21 22 0.22, 0.58, 1.147 37, 24, 24 17 0.30, 0.69, 0.696 27, 20, 18 14 0.45, 0.80, 0.975 26 10 0.35
1/2" 10 36. 30, 28 40 0.34, 0.49, 0.56Tapered 9 28, 24, 23 31 0.43, 0.58, 0.63
8 26, 26, 25 23 0.37, 0.37, 0.407 22, 20, 20 19 0.42, 0.50, 0.506 16, 18, 18 15 0.61, 0.49, 0.495 - 12 -
1 1/4" 10 69 35 0.50Pipe 9 56 21 0.45
8 50 16 0.427 46 13 0.406 36 11 0.545 36 8 0.39
it 10 48 32 0.60Pipe 9 46 24.5 0.50
8 43 18 0.427 39 * 16 0.456 32 12 0.495 30 9 0.41
3/4" 10 40 34 0.52Pipe 9 40 27.5 0.42
8 33 22 0.497 33 17 0.386 24 14 0.575 19 10 0.62
X4

NCSC TM-229-78
-.4
*IW-4
A .0
ra ~is 0
to4 4J E-4-F 0"
41 0z o
04
.0..a 1-4o m ? 4
~ý4soueanzo joSousboa
17S Ci

NCSC TM-229-78
0)0
N
0 9- 4 cn~
0N "0 0 o
0 0 0
*1- 1-4
0 u
$Z4
0
0
0 U0 N c0
18*

NCSC TH-229-78
TABLE 2
TEST SITE DATA
_________ Sand Clay
Location East Pier Jetties(N.W. of Buoy #9)
Water 15 35Depth
Sea Floor Silty SiltyMaterial Sand ClayClassification
Sea FloorMaterialProperties __________
a. Density 1.75 g/2c 1.878 g/cT3b. Shear 12 g/cm 5.76 g/cm
Strength(vane shear)
predictions of the reaction forces produced by various sizes of nozzlescan be obtained with reasonable accuracy. These reaction force measure-ments were obtained using the configuration in Figure 2.
JET-DREDGE TESTS
Quantitative Results
Figures 10 and 11 are photographs of the combination jet-dredgetool that was built.
* Table 3 shows volumes of sand fluidized and completely removed by
the jet-dredge combination and the jet alone. The percentage of material
fluidized by the jet-dredge and removed was nearly constant regardless of
¶ nozzle size. The percentages of removal for the jet alone were also
nearly constant. However, with the jet-dredge almost all of the fluid-
ized material was removed while the jet alone only removed about one-quarter of the material.
(Text Continued on Page 24)

NCSC TM-229-78
FIGURE 10. DREDGE SIDE OF JET-DREDGE TOOL
20

14CSC TM297 8 If
PI29U78
21

owl NCSC TM-228-78
0 0)-H 4
-HI
0 I c
v~u-4 H44 . '.
0) 0 9:)ot .-. 4 ')u~
4 - >
v *0
SI i-I LW C4
0 % Li, %- , %- Vcn 4.C- ~ .00 %Z 00
*N 04) N ' 0 -Hr .
> P4 '4 0 C14 m' -*
0 .
E-4 > 00 a)cdv4H iin UM %0 ca 0 0).
inJ% . c'd C'J c'Ji aX 44 14 41
N4 Cu 0U
04 A ~.0 to
>0 41
'4-4 C1 rý en 0 'otk
r4 -H .0aJ~o 0
'a-..~~ 4 4 C0We' *t C *ý W N~p
a) en. 44 4)*
NH9- 041l4V.4. rf 14
2 2d
V-4 Ai a co22
NCSC TM-229-78
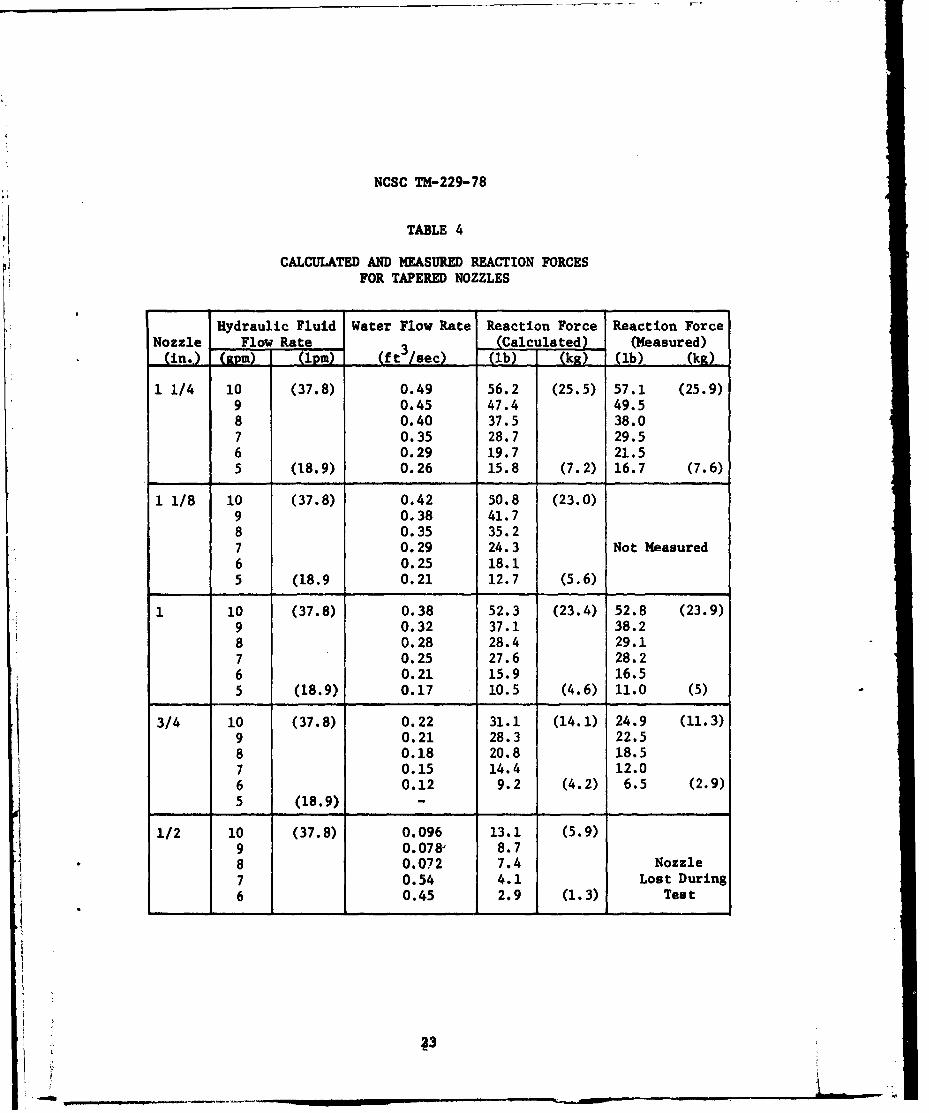
TABLE 4
CALCULATED AND MEASURED REACTION FORCESFOR TAPERED NOZZLES
Hydraulic Fluid Water Flow Rate Reaction Force Reaction ForceNozzle Flow Rate (Calculated) (Measured)
(in..) (m) (lpm) (ft 3 /sec) (lb) ((kg)
1 1/4 10 (37.8) 0.49 56.2 (25.5) 57.1 (25.9)9 0.45 47.4 49.58 0.40 37.5 38.07 0.35 28.7 29.56 0.29 19.7 21.55 (18.9) 0.26 15.8 (7.2) 16.7 (7.6)
1 1/8 10 (37.8) 0.42 50.8 (23.0)9 0.38 41.78 0.35 35.27 0.29 24.3 Not Measured6 0.25 18.15 (18.9 0.21 12.7 (5.6)
1 10 (37.8) 0.38 52.3 (23.4) 52.8 (23.9)9 0.32 37.1 38.28 0.28 28.4 29.17 0.25 27.6 28.26 0.21 15.9 16.55 (18.9) 0.17 10.5 (4.6) 11.0 (5)
3/4 10 (37.8) 0.22 31.1 (14.1) 24.9 (11.3)9 0.21 28.3 22.58 0.18 20.8 18.57 0.15 14.4 12.06 0.12 9.2 (4.2) 6.5 (2.9)5 (18.9) -
1/2 10 (37.8) 0.096 13.1 (5.9)9 0.078, 8.78 0.072 7.4 Nozzle7 0.54 4.1 Lost During6 0.45 2.9 (1.3) Test
S•?3
b4
NCSC TM-229-78
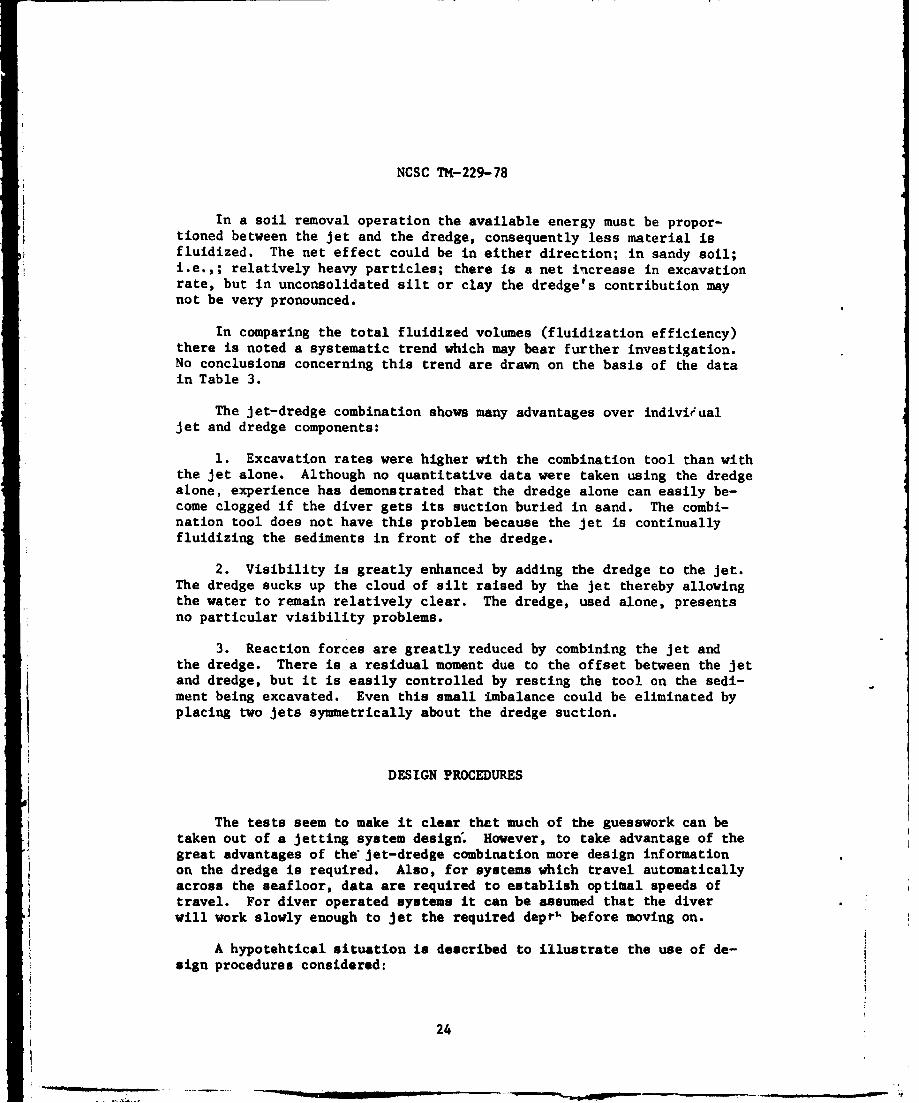
In a soil removal operation the available energy must be propor-tioned between the jet and the dredge, consequently less material isfluidized. The net effect could be in either direction; in sandy soil;i.e.,; relatively heavy particles; there is a net increase in excavationrate, but in unconsolidated silt or clay the dredge's contribution maynot be very pronounced.
In comparing the total fluidized volumes (fluidization efficiency)there is noted a systematic trend which may bear further investigation.No conclusions concerning this trend are drawn on the basis of the datain Table 3.
The jet-dredge combination shows many advantages over indivieualjet and dredge components:
1. Excavation rates were higher with the combination tool than withthe jet alone. Although no quantitative data were taken using the dredgealone, experience has demonstrated that the dredge alone can easily be-come clogged if the diver gets its suction buried in sand. The combi-nation tool does not have this problem because the jet is continuallyfluidizing the sediments in front of the dredge.
2. Visibility is greatly enhanced by adding the dredge to the Jet.The dredge sucks up the cloud of silt raised by the jet thereby allowingthe water to remain relatively clear. The dredge, used alone, presentsno particular visibility problems.
3. Reaction forces are greatly reduced by combining the jet andthe dredge. There is a residual moment due to the offset between the jetand dredge, but it is easily controlled by resting the tool on the sedi-ment being excavated. Even this small imbalance could be eliminated byplacing two jets symmetrically about the dredge suction.
DESIGN PROCEDURES
The tests seem to make it clear that much of the guesswork can betaken out of a jetting system desigtn. However, to take advantage of thegreat advantages of the jet-dredge combination more design informationon the dredge is required. Also, for systems which travel automaticallyacross the seafloor, data are required to establish optimal speeds oftravel. For diver operated systems it can be assumed that the diverwill work slowly enough to jet the required deprth before moving on.
A hypotehtical situation is described to illustrate the use of de-sign procedures considered:
24

NCSC TH-229-78
A heavy cable is to be buried to a depth of at least 38 inches(26.52 cm) in a sandy bottom having a shear strength of 0.2 psi (0.01 kg/m ). It is assumed that the cable can be laid across the sand first, andburied later, and that, because of the instability of the soil, the diverwill not push the jet into the soil, but rather will hold it at the sur-face. Finally, the cable is assumed to be heavy enough to sink throughfluidized sand.
The first step is to determine what stagnation pressure is requiredat the bottom of the hole. While we found that the average stagnationpressure at the bottom of the hole was about three times the soil shearstrength it would be wise to give the diver a little more pressure thanrequired. For design purposes let us choose five times the shearstrength or 1.0 psi (0.07 kg/mi).
The second step is to decide how to get this pressure. Since
P 47oP a (x + 2.1)2
can be rearranged to give
P (x + 2.1D)2 2 P 20
and since x > 2.10, the approximateion
P x 2 j47 PD2a 0
can be made. Substitution of numerical values then give
2 x2
30.7 lbs mP D2 - __o 47
showing that an inverse relationship between the initial nozzle pressureand the nozzle area satisfies the constraint on stagnation pressure.
A further transformation is made possibJe by noting that flow rate
and pressure are also related by the nozzle area. Each nozzle is char-acterized by a curve of the form
P kQ
where k - constant characteristic to the nozzle's flow-pressure curve
25
.* -t~

NCSC TM-229-78
which is more normally written
2 P 2 /TQCQC 0 - • c - .$).- 4 4 1
From this last equation
D C 2P
Now substitution into the equationP2P 8x2Rs PoD 2
47 0
gives
P x 24-8 Po(v47 oC 2
Rearrangement gives P substitution of the, P 47 (4 Q) p
approximate values
C - 1.0 Discharge Coefficient
2-2lb-sec
ft4
1 gallon - 231 in 3 (3785.4 cc)
yield a final numerical form which can be graphed:
Po M {8.1 x 10⁵ /Q2 } {(gpm)ý psil
From Figure 12, which shows this curve and several nozzle characteristiccurves, it is obvious that several different nozzles are feasible.
In order to illustrate the futility of trying to minimize reactionforces on the diver without adversely affecting stagnation pressure atthe bottom of the hole, the following controlling equation is presented
(Text Continued on Page 28)
26
Awl**
444
'a 0
0.4ca-
0 04
00
N ON
o -A

NCSC Ut-229-78
F *2 P2A 2
wD
Substitution of the equation
D2 -q -
D CQ2 2°
givesF 2p~ CQ.,Th. Q
Solving for P0 givea,
PF 2 psi 6MM) 2
Po Q 22C Q2 .1F2 lb 2
Q
Unfortunately, if F in this equation is fixed, the dependence of P-on Q is precisely the same as it was for the equation which definesacceptable operating conditions:
.2 22
2
In this e It the association of 910 F with 8.1 x 10 in the twoequations for P 0leads inevitably to the conclusion that F w 30 lb,
(13.6 kg). 0
If this is unacceptable, perhaps a balanced nozzle should be con-sidered. With such a configuration about twice the water flow rate isrequired to achieve the proper initial nozzle pressure; a larger powersource may be required. Another alternative would be to weight thenozzle with about 30 lb of lead. This my be the least expensivesolution.
Elimination of reaction forces in this type situation is not pos-sible, however a solution which would yield a uinimm horsepower avail-able in the form
p .1714 HP0 Q
28

NCSC TH-229-78
does not show the *m functional form as
Po a {8.1 x 10
Ii QMinimizing horsepower, given by an equation of the form
HP - k1 PO Q
subject to the constraint that
0 kQ2
is the same as minimizing horsepower expressed in the formk 3
HP Q ;
there is no local extremun of horsepower. Therefore, to minimizehorsepower within the constraint of hardware availability it is advan-tageous to use the nozzle that gives the highest flow rate. This isthe largest nozzle whose characteristic curve intersects the locus ofacceptable operating conditions within the capabilities of the pump.
The minimum horsepower solution is, however, of academic interestonly because, for existing power supply and water pump hardware, theproper nozzle choice would be the one which gives the most margin againstunanticipated patches of hard sediments. This mounts to choosing thenozzle which could, if used with the power source wide open, producethe greatest stagnation pressure at the desired burial depth. Recallingthat
2 2 2
o 4 Q 2)
it is apparent that optimal Js ting per ormance (in terms of fluidiza-tion) will be achieved when P is such that the curve described by theabove equation is just tangent to the highest pump characteristic curve;the optimal nozzle is chosen on this basis. Figure 13 shows the 10 gpm(37.9 lpm) hydraulic fluid supply curve for the sump pump used duringour experiments, several nozzle characteristic curves, and the opera-tional curve (Po = k/Q2 )-vhich is just tangent to the pump curve. Inthis case, a nozzle izse greater than 1 1/4 in. in indicated. If the1 1/4 in. nozzle is the largest one available, then it should be chosen.Coincidently, in this example, the choice of the largest nozzle also mini-mizes horsepower.
* The final design calculation to be covered is the relationship be-tween nozzle size and the coefficient of the nozzles characteristicequation
wD C 2P
29 (Text Continued on Page 311
NCSC TH-229-78
0 0. 1 is
"0 a 64U
Ul 00
101
1 0L C. raw64 0-4
14 4 4
a0
-4
U00% r c
0 4'
* 30
NCSC TM-229-78
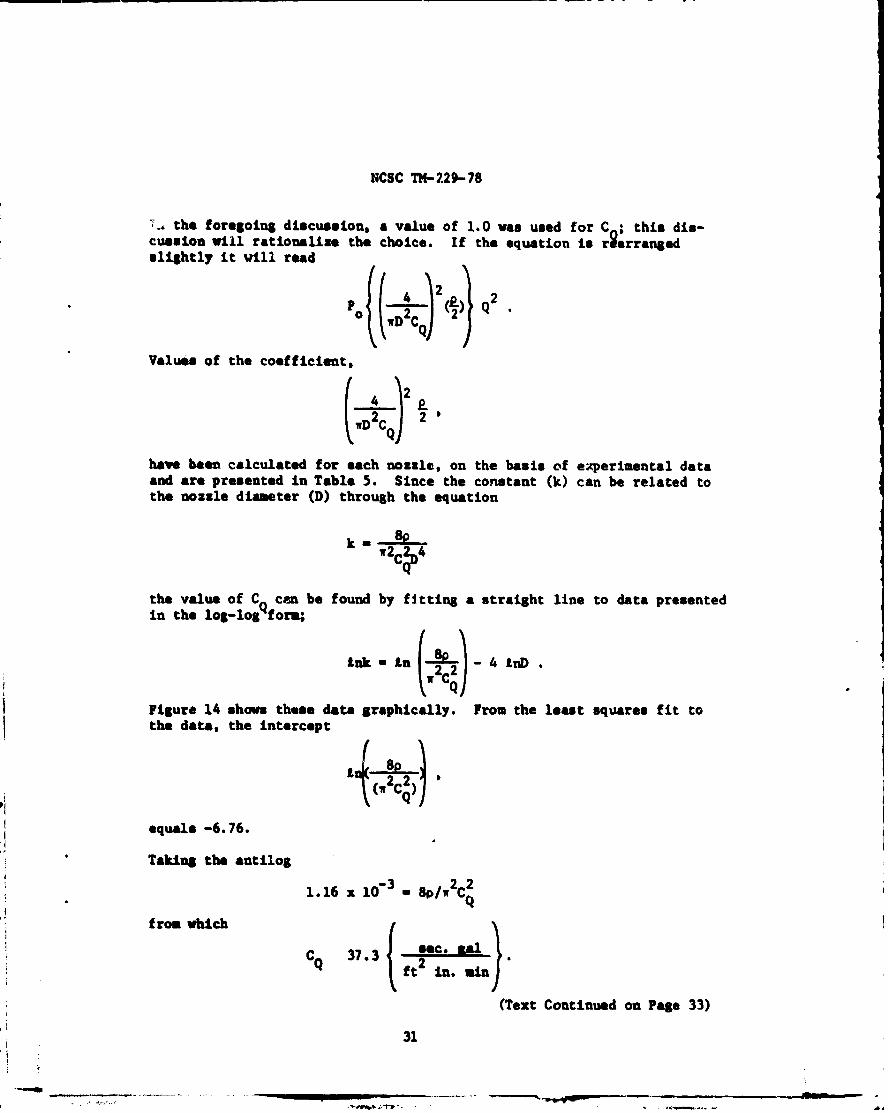
T., the foregoing discussion, a value of 1.0 was used for C ; this dis-cussion will rationalize the choice. If the equation is r 2 ;rrangedslightly it will read
f(4 2 £*- Q2
Values of the coefficient,
wD 2 CQ) 2'
have been calculated for each nozzle, on the basis of experimental dataand are presented in Table 5. Since the constant (k) can be related tothe nozzle diameter (D) through the equation
k- 8PW2C2D4
Q
the value of C can be found by fitting a straight line to data presentedin the log-1ogforam;
Ink - n -4 LnD.
Figure 14 shown these data graphically. From the least squares fit tothe data, the intercept
equals -6.76.
Taking the antilog1.16 x 10 3 8/w2C
from which
Jsec. RalC 37.3 ft n.m
ft2 in. sin
(Text Continued on Page 33)
31

NCSC TM-229-78
NozzleConstant
Nozzle
Diameter-0.8 -0.6 -0.4 -0.2 0 0.2 0.4 0.6 UL D.I I I I , I I
Least SquaresFit to Data: -3An k - -6.76-4.2 An D
• "4
0.
-L-8 0
FIGURE 14. NOZZLE CONSTANT RELATED TO NOZZLE DIAMETER
32

NCSC TM-229-78
TABLE 5
NOZZLE CONSTANTS
Nozzle Size (in.) Constant (k) (psi/gpm2)
1/2 2.38 x 10⁻²
3/4 3.40 x 10-
1 1.11 x 10⁻³
1 1/8 7.44 x 10⁻⁴
1 1/4 4.77 x 10⁻⁴
Applying the appropriate conversion factors to cancel the units ufCQ gives
CQ %i.O0
The foregoing discussion covers the design of a single jet systemintended for burial by fluidization. It applies virtually all of thequantitative results of t1iis effort, but does not address the dredge atall. For app]ications requiring the actual removal of sediments, ratherthan just fluidized, the dredge is 73elieved to be h13hly effective. How-ever, not enou•gh quantified information is presently available to presenta systematic design procedure at this time.
CONCLUSIONS
Through the use of the jet/dredge, a diver was able to accomplishtasks involving trenching with greatly improved efficiency and ease.This device also a:ýlowed a diver to elearly monitor the progress of atask. Also, the diver, while performing his task, experienced minimalreaction forces fzom the device thus making it possible for a diver tocontinue working u particular task over an extended period of time with-out experiencing fatigue. This device is also compatible with theModel 2 power source.
After testing had been completed on the nozzles and pump, it was con-cluded that the optimum nozzle could be chosen which would produce the
33

NCSC T*-229-78
maximum soil penetration, provided the soil shear strength was known.Also reaction forces could be calculated making it possible to predictforces which the user may experisnce.
RECOMMENDATIONS
Further studies in various types of soils should be carried out inorder to relate nozzle size to soil characteristics. Also, the pipingmaterial should be constructed of lightweight aluminum pipe or tubingto decrease the weight of the device. Buoyancy should be attacheddirectly to the device thus eliminating the tethered buoyancy package.
34

NCSC TM-229-78
APPENDIX A
REACTION FORCE ANALYSIS
This appendix presents the mathematics which support the reactionforce calculations in the body of the text. The important point isthat only the change of momentum (not pressure) contributes to the re-action force. For example, consider a nozzle whose orifice is madesmaller atd smaller until finally it is closed. Then no matter how muchpressuire there is inside the nozzle, there will be no reaction force.Then a miniscule orifice certainly can't lead to large reaction forces,despite internal pressure; in fact, internal pressure has nothing to dowith reaction forces, except by way of the nozzle's characteristiccurve which relates flow rate to pressure drop.
Figure Al shows a system for ' .c• reaction forces can easily becalculated on the basis of the very fundamental force balance
F= maRegion of
Integration
I 4 - BoundaryI'| Surface
PipeNozzleI I
PumpI
S~I
FIGURE Al. MATHEMATICAL MODEL OF TEST RIG
Applying this formula to small volume elements WdT) within the region in-dicated in Figure Al gives Euler's equationi
1 A(V)
A-1

NCSC TM-229-78
which is developed in all elementary fluid mechanics texts*. Inte-grating this force balance over the region of intereot gives
Fte l =f p D dT
R
The objective of further calculations is to reduce this very generalformula to something that can be readily calculated. This will be ac-complished by transforming the volume integral to a surface integral.
Recalling the equation of continuity
+ div(po) - 0at
provides the key to this transformation. Multiplying the continuityequation by ý gives
'V a+ 'V div(pý) 0.at
The projection of this equation on the ith axis gives
vi-P- + v div pý - 0i at i. p~n
Now noting that
v div pu - dlv vi pý -p " grad vi
allows this equation
"v 2 + (v Pý) - pi v, " 0i atii
to be combined with the. ith component of the force balance,
.D4*the notation is the particular derivative equal to
at+-
A-2
NCSC TM-229-784
ati dFij•-+•(v" )v v- d
to give
IV, -_•t V (ývi) dF i(P-+vi + v)v + (P(V" v- d-
at i at, ~ 1P
Finally, noting that
P(' " - )vi PV " (ýv )
leads to the ith equation
SdFi
Integrating this over the region shown in Figure Al gives
Sf 1- ,z )d +Xa (i) d f+ (v i o•) dT - external)t
R R
and, applying the divergence formula
R S
gives the ith equation in a more useful form:
Jl- ~ i(v d fviv ~d ~~external) iR S
Recombination of the components gives the final equation
f-n (pv)dT + f )d -( nexternal
which is the integral form of Euler's equation.
In the case of a submerged jet operating under steady condition thefollowing assumption can be made:
at is identically zero
A-3

NCSC TH-229-78
v is zero every where except across thejet's initial section, and here, it isequal to Q/A and is normal to the surfaceof integration.
The formula then reduces to
pV2 A - IlFexternal I I
in the direction of the jet velocity vector. Since this is the forcerequired to keep the region stationary, the jet's reaction force is inthe opposite direction and has the same magnitude, pV 2A.
A-4
A-4
NCSC TM-229-78
APPENDIX B
STAGNATION PRESSURE ANALYSIS
This appendix supports the equation
47 P0
(x/D + 2.1)
which describes the dependence of the jet's stagnation pressure on thedistance (x) from the nozzle orifice. Figure Bl shows the nozzle andjet, and the coordinate system used for analysis. Early analyses ofthe spread of turbulence in submerged jets established, with ample sup-port from experimental efforts, that velocity profiles in the main regionof the jet are "self similar;" each profile is the same when plotted oncoordinates of
u-- and - _-
um x - sDm
where u is the velocity along the centerline, y is the distance fromthe cenlerline at which u is measured, and x-sD is the distance from thepole to the jet section at which u is measured. The constant -s is thepole 1 Ltion relative to the nozzle orifice.
Experimental evidence also shows that static pressure within thejet is virtually the same as the surrounding ambient pressure. ForIrrotational flow with invariant static pressure the integral form ofthe Navier Stokes equation (Bernouilli's equation) is used to show thatthe total momentum flux of the jet through any jet cross section isconstant:
r
Lr2nyd u] u - constant (independent of x)
where r is the radius of the jet section in question.
Making use I the self similarity of jet profiles, the variable
n - y/x - sD
is introduced, along with the equation
U.-f (y/x- sD)Um
I
B-1
Spa

NCSC TM-229-78
Imaginary "Pol•t"
4--• X (Measured from orifice)
F Orifice Jet BoundaryZ Hasured
o Centerline) _"- .,. . ..- -
•_• Core Boundarj
Nozzl M iDiameter - D eion
Transition Zone
FIGURE B1. CROSS SECTION OF A SUBMERGED JET
to give
x/x-sD edge 2ir(u f(n))2 (x - 9D) 2 dn - constant.
Since x and u are explicitly independent of n, the equation can berewritten as
edge
u (x - sD) 2 J2W.2 () ndn - constant.0
Differentiation with respect to x gives
2(u (x-*yj~ d edge
2(u( (x -80) 4 (u D) S 2wf 2 (n) ndn 0
B-2
NCSC TM-229-78
from which it is clear that
d (U(X - sD)) 0.
Hence,
u = constant/x- sD.* m
The last equation describes the decay of centerline velocity along thejet axis. Since static pressure is invariant, the stagnation pressureis directly proportional to u2
m
constant
(x - sD)
Reference Bl continues to develop the momentum equation, and by evalu-ating terms at the nozzle orifice and at the start of the transitionzone, arrives at values of the numerical constants which lead to theequation used in the body of this report
47.02 P
D(xD - 2.07)2
Experimental data from Reference B2 have been tested against these valuesby plotting
against x
While the data tended to follow a straight line relationship, the numeri-cal values extracted from linear regressions showed considerable spreadaround the predicted values in the equation.
S(- - 2.07)
Values corresponding to the figure, 47.02 typically came out between 42and 68, while values corresponding to the figure -2.07 came out between-0.37 and +2.1. In applying the stagnation pressure equation in prac-tice, the pole position is not very important since it is typicallysmall by comparison to depths of fluidization.
48"1 Abramovich, G. N., The Theory of Turbulent Jets, M.I.T. Press,Cambridge, MA., 1963.
"')Cheung, J. B., et al, Study on Water Jet Trenching, Flow Technology,Presentation #2, Flow Research, Inc., Kent, Washington, 3 December1976.
B-3

NCSC TM-229-78
INITIAL DISTRIBUTION LIST
106 Commanding Officer, Harbor Clearance Unit ONE (Copy 1)(Attn: OIC SDS-450) (Copy 2)(ATTN: ENS G. T. Solether) (Copy 3)(ATTN: M4CM R. Villasenor) (Qopy 4)
107 Commanding Officer, Harbor Clearance Unit TWO (Copy 5)(ATTN: W033 Leon Ryder) (Copy 6)
- Commanding Officer, Naval Construction Battalion Center,Davisville, RI 02854
(Code 10) (Copy 7)--- Coeanding Officer, U. S. Naval Ship Repair Facility,
Subic Bay, FPO San Francisco 96651(ATTN: Diving Officer) (Copy 8)
-- Commanding Officer, U. S. Naval Ship Repair Facility,FPO Seattle 98762
(ATTN: Diving Officer) (Copy 9)236 Commanding Officer, David Taylor Naval Ship R&D Center
(Code 1933, Mr. Jim Lee) (Copy 10)102 Commanding Officer, Naval Submarine Training Center, Pacific
(Code 60, Dir. of Di;ing and Escape) (Copy 11)580 ý.oimander, Naval Construction Battalions, Atlantic (Copy 12)-- Comander, Cruiser Destroyer Force, Seventh Fleet, FPO
San Francisco 96601(ATMh: Diving Officer) (Copy 13)
-- Comander, Naval Construction Battalions, Pacific Fleet,0 San Francisco 96610 (Copy 14)
427 Commander, Naval Sea Systems Command(ATTN: SFA 0004 (Copies 15-20)
-- Commander, Service Force, U. S. Atlantic Fleet, NorfolkVA 23511
(ATTN! LCDR K. A. Gustafson) (Copy 21)383 Commander, Service Squadron 8, Norfolk (Copy 22)--- Ccommander, Submarine Squadron YOUR, FPO New York 09501
(ATTN: Material Officer) (Copy 23)Commander, Undersrater Construction Team ONE, U. S. NavalAmphibious Base, Little Creek, Norfolk, VA 23512 (Copy 24)
0 --- Comender, Underwater Construction Team TWO, U. S. NavalConstruction Battalion Center, Port Nuenme, CA 93043 (Copy 25)
S-- USS PIGEON (ASR-21), FPO San Francisco 96601 (Copy 26)T. L. Apjohn II, Ccmmanding Officer, HCU-1001, Portsmouth, NH(Copy 27)
197 Naval Explosive Ordnance Disposal Facility, Indian Head(ATTN: E. Faccini, Code 5044) (Copy 28)
--- USS COUCAL (ASR-8), FPO San Francisco 96601 (Copy 29)--- National Oceanic and Atmospheric Administration,
Rockville, MD 20852(ATTN: Office of Coastal Environment, Code 1n-6) (Copy 30)
204 Naval Medical Research Institute, Natl. Naval Medical Center (Copy 31)186 Civil Engineering Laboratory, Naval Construction Battalion
Center (Copies 32-43)
INITIAL DISTRIBUTION LIST (Cont'd.)NCSC TM-229-78
National Marine Research Center, Box 1600, Galveston,TX 77550 (Ccpy 44)
124 Long Beach Naval Shipyard, Long Beach, CA(ATTN: Code 400, Public Works Dept.. Diving Supervisor) (Copy 45)
--- Naval Facilities Engineering Command, 200 Stovall St.,Alexandria, VA 22332
(ATTN: Code PC-2, Ocean Facilities Program,CDR K. K. Donovan, CEC, Director) (Copy &6)
288 Operational Test and Evaluation Force, Pacific (Copy 47)478 Commander, Naval Surface Force, Pacific (Copy 48)--- CAPT E. B. Mitchell, USN(Ret), 5403 Albemarle,
Westmoreland Hills, HD (Copy 49)--- Naval Undersea Center, P. 0. Box 997, Kailua, Hawaii 96734 (Copy 50)--- Bill Nix, P. 0. Box 4117, Paaadena. TX 77502 (Copy 51)--- Ramsey Parks, Santa Barbara City College, 312 Nopal St.,
Santa Barbara, CA 93103 (Copy 52)--- LCDR Lloyd L. Reynolds, USNR(R), 926 Sprinsmill Rd.,
Villanova, PA 19085 (Copy 53)--- George Sampson, DIVEX, 2245 Breaux Ave,, P. 0. Box 504.
Harvey, LA 70058 (Copy 54)--- George Scholley, Alcoa Marine Corporation, 1200 Ring Bldg.,
Washington, DC 20036 (Copy 55)--- Vernon E. Shelton, Deep Ocean Work Systems, 645 E. 219th St.,
Unit 647, Carson, CA 90745 (Copy 56)-- Robert J. Shourot, President, Undersea Systems, Inc..
112 W. Main St., Bay Shore, NY 11796 (Copy 57)309 Submarine Development Group One (copy 58)265 Conmander, Naval Oceans System Center, San Diego
(ATTN: Code 63, H. R. Talkington) (Copy 59)528 Mr. J. F. Freund, Naval Sea Systems Comnd (Code C353) (Copy 60)298 Portsmouth Naval Shipyard, Portsmouth, NH
(ATTN: LCDR L. C. Gies) (Copy 61)--- D. Michael Hughes, Oceaneering International,Inc,
9219 Katy Freeway, Houston, TX 77024 (Copy 62)--- Jim Joiner, Director, Ccmmercial Diving Center,
272 S. Fries Ave., Wilmington, CA 90744 (Copy 63)226 Naval School, Explosive Ordnance Disposal, Naval Ordnance
Station, Indian Read (Copy 64)-- LCDR J. V. Khellman, USIN(R), Rt. #1, Henniker, ME 03242 (Copy 65)
Bob Kutzleb, Seaward, Inc., 6269 Leaburg Pike, FallsChurch, VA 22044 (Copy 66)
Dick Long, Diving Unlimited, 1148 Delevan Drive,San Diego, CA 92102 (Copy 67)
299 Puget Sound Naval Shipyard, Bremerton(ATTh: Code 2125, Engineering Library) (Copy 66)
-.... CAPT Joseph Nadeo, Murphy Pacific Salvage Corp., MarittDivision, 1 World Trade Center, Fleet 8633, New York 10048 (Copy 69)
--- Raymond F. McAllister, Prof. of Ocean Engineering, FloridaAtlantic University, soca Raton, FL 33432 (Copy 70)
229 Fleet & Nine Warfare Training Center, Charleston(ATTN: LCDI HcConnochie) (Copy 71)
- Jim )IcD4le, Taylor Diving & Salvage Co,, 795 EngineeringRd., Belle Chasse, LA 70037 (CE"py 72)

INITIAL DISTRIBUTION LIST (Coot'd.)NCSC TM-229-78
W. Tessin, Chairman, Florida Atlantic University, Dept.of Ocean Engineering, Boca Baton, FL 33432 (Copy 73)
E. A. Wardwell, Seaward. Inc., 6269 Leeaburg Pike, FallsChurch, VA 22044 (Copy 74)
289 Comander, Operational Test & Evaluation Force, Atlantic (Copy 75)Joanne Wills, Managing Editor FACEPLATE, Potomac ResearchInstitute, 7655 Old Springhouse Rd., Westgate ResearchPark, McLean, VA 22104 (Copy 76)
35 Battelle Hemarial Institute, Columbus Laboratories(ATTN: Don Hackiman) (Copy 77)
555 Naval Facilities Engineering Comand, Chesapeake Div. (Copy 78)479 Norfolk Naval Shipyard, Portsmouth (Copy 79)340 Woods Sold Oceanographic Institution
(ATTN: LO-206, Document Library) (Copy 80)23 Army Engineers Waterways Experiment Station, Vicksburg
(ATTN: Library) (Copy 81)457 Oceanographer of the Navy
(ATTh: Nanagement Information Division) (Copy 82)257 Naval Submarine Be**, New London
(ATTN: Diving Supervisor) (Copy 83)45 Charleston Naval Shipyard
(ATM: Diving Supervisor) (Copy 84)125 Ware Island Naval Shipyard, Vallejo, CA
(ATMIl: Diving Supervisor) (Copy 85)216 Naval Ordnance Station, Indian Read
(ATTN: Diving Supervisor) (Copy 86)297 Philadelphia Naval Shipyard, Philadelphia
(ATTN: Diving Supervisor) (Copy 87)298 Portsmouth Naval Shipyard
(ATTN: DivtIg Supervisor) (Copy 88)222 Naval Postgraduate School, Nonterey
(ATTN: Code 2124, Library) (Copy 89)-- Supervisor of Salvage, Vast Coast Representative, Bldg 7,
an 82, Naval Station, Treasure Island, San Francisco 94130 (Copy 90)485 Naval Ship Engineering Center, Hyattsville
(ATTN: Technical Library) (Copy 91)491 Coiaader, Naval Oceans Systems Center
(ATTN: Library) (Copy 92)- Technical Processes Branch, D-823, NOAA Libraries Division,
Sm 806, Silver Spring, M6) 20910- (Copy 93)208 Naval Oceanographic Office
(ATTN: Code 600, Library) (Copy 94)- Cmanding Officer, USS AJAX (AR-6), Sasebo, FPO SF 96601
(ATIK: Diving Officer) (Copy 95)-- Cmamnding Officer, USS RYCE CANYON (AD-36), Peatl.,
FPO SF 96601(ATTN: Divi - Officer) (Copy 96)
Cn0img Officer. USS CANOPUS (AS-34), Holy Loch,FON 09501
(ATTN: Diving Officer) (Copy 97)Cam dI0g Off icer, USS DXZ3 (MAD-14), San Diego, FP0 SF 96601
(ATTN: Diving Officer) (Copy 98)
I
INITIAL DISTRIBUTION LIST (Cont'd.)NCSC T*-229-78
Commanding Officer, USS RECTOR (AR-7), San FranciscoFPO S? 96601
(ATTN: Diving Officer) (Copy 99)Commanding Officer, USS HOLLAND (AS-32), Charleston
FPO NY 09501(ATTN: Diving Officer) (Copy 100)
Commanding Officer, USS HUNLEY (AS-31), CharlestonFPO NY 09501
(ATTN: Diving Officer) (Copy 101)--- Comandiug Officer, USS ORIOR (AS-18), Charleston
FPO NY 09501(ATTN: Diving Officer) (Copy 102)
--- Commanding Officer, USS PIEDIMONT (AD-17), NaplesFP0 NY 09501
(ATTN: Diving Officer) (Copy 103)-- Comanding Officer, USS PRAIRIE (AD-15), San Diego
FPO SF 96601(ATTN: Diving Officer) (Copy 104)
--- Comanding Officer, USS SAMUEL CMPERS (AD-37), San DiegoFPO Sy 96601
(ATTN: Divin% Officer) (Copy 105)--- Cinanding Officer, USS SIERRA (AD-18), Charleston
PPO NY 09501(ATTN: Diving Officer) (Copy 106)
-- Comanding Officer, USS SPERRY (AS-12), San DiegoFSPO San Diego 92132
(ATTN: Diving Officer) (Copy 1Q7)-- Comanding Officer, USS VULCAN (AR-5), NORVA, FPO NY 09501
(ATTNi Diving Officer) (Copy 108)--- Naval Ocean Syotems Center, Diving Division, Long Beach,
CA 90822(ATTN: LT. 0. Dunn) (Copy 109)
75 Director, Defense Documentation Center (Copies 110-121)
ti


![Ekkuo tuu - WordPress.com · 2016-06-03 · 47 ekuo tuu gksrs gSa] (fp=k 3-1 c)A o`"k.k dh 'kqØtud ufydk,¡ o`"k.k ufydkvksa osQ ekè;e ls 'kqØokfgdkvksa esa [kqyrh gSaA ;g 'kqØokfgdk](https://static.fdocuments.in/doc/165x107/5eccc89dd37c2d1e737d8e44/ekkuo-tuu-2016-06-03-47-ekuo-tuu-gksrs-gsa-fpk-3-1-ca-okk-dh-kqtud.jpg)