Voting Machine Allocation in Franklin County, Ohio, …wmebane/franklin2.pdfVoting Machine...
32
Voting Machine Allocation in Franklin County, Ohio, 2004: Response to U.S. Department of Justice Letter of June 29, 2005 Walter R. Mebane, Jr. July 7, 2005 (original draft) February 11, 2006 (this draft) This note reports analysis of the effects voting machine allocation had on voter turnout in precincts of Franklin County, Ohio, in the election conducted on November 2, 2004. The results here extend the analysis of voter turnout in Mebane (2005) to take into account facts presented in a report by the U.S. Department of Justice (DOJ), Voting Section, Civil Rights Division, released in a letter dated June 29, 2005 (Tanner 2005). I also respond to some of the facts and interpretations stated in the DOJ report. Most of the data used in this analysis come from a spreadsheet file obtained directly from Franklin County. The file contains information about a number of variables for each voting precinct in the county. It was given to me with the name FINAL JUSTICE DEPARTMENT ANALYSIS.xls (received by me on January 29, 2006). The data in this file are the same as in a file supplied to the Democratic National Committee’s team that was investigating the Ohio 2004 election. That file was originally supplied to Eric Greenwald, who gave it to me with the name franklinMchWrkProPollClose.xls (received by me on April 13, 2005). Among the variables in the file is one that counts the number of voting machines in each precinct (“2004 VOTING MACHINES”). Also available are variables that count the number of registered voters in each precinct as of April 1, 2004, and November 4, 2004 (“4/1/04 VOTER REGISTRATION” and “11/4/04 VOTER REGISTRATION”) and the number of active voters as of April 27, 2004, and November 4, 2004 (“4/27/04 ACTIVE VOTERS” and “11/4/04 ACTIVE VOTERS”). The file also contains a variable reporting the official count of the number of ballots cast (“2004 OFFICIAL PUBLIC COUNT”). The racial composition of each precinct is measured using proprietary data, derived from the 2000 Census, prepared under contract for the DNC. For discussion of the statistical methods used in this memo see Mebane and Herron (2005) and Mebane and Sekhon (2004a; 2004b). Voting Machine Allocation and Voter Turnout The analysis of Ohio precincts in the Democratic National Committee’s report on Ohio 2004 (Mebane and Herron 2005) finds that in precincts across the state, as the ratio of voting machines per registered voter in each precinct increases, voter turnout increases. The mechanism conjectured in that report is that more machines per registered voter meant there were shorter lines, and that shorter lines meant that more people could take the time to vote. The report in this way connects official decisions to place different numbers of voting machines in different precincts with disparities in different voters’ access to the polls. Mebane (2005) reports evidence that tends to confirm that mechanism among precincts in Franklin County. The analysis in the current report refines the analysis by taking into account the racial composition of each precinct. Mebane (2005) estimates that the effect of inadequate provision of voting machines in Franklin County reduced voter turnout much more than was implied by the estimates presented in Mebane and Herron (2005). The DOJ report finds that voter 1
Transcript of Voting Machine Allocation in Franklin County, Ohio, …wmebane/franklin2.pdfVoting Machine...

Voting Machine Allocation in Franklin County, Ohio, 2004: Response to U.S. Department ofJustice Letter of June 29, 2005
Walter R. Mebane, Jr.July 7, 2005 (original draft)
February 11, 2006 (this draft)
This note reports analysis of the effects voting machine allocation had on voter turnout inprecincts of Franklin County, Ohio, in the election conducted on November 2, 2004. The resultshere extend the analysis of voter turnout in Mebane (2005) to take into account facts presented ina report by the U.S. Department of Justice (DOJ), Voting Section, Civil Rights Division, releasedin a letter dated June 29, 2005 (Tanner 2005). I also respond to some of the facts andinterpretations stated in the DOJ report.
Most of the data used in this analysis come from a spreadsheet file obtained directly fromFranklin County. The file contains information about a number of variables for each votingprecinct in the county. It was given to me with the name FINAL JUSTICE DEPARTMENTANALYSIS.xls (received by me on January 29, 2006). The data in this file are the same as in afile supplied to the Democratic National Committee’s team that was investigating the Ohio 2004election. That file was originally supplied to Eric Greenwald, who gave it to me with the namefranklinMchWrkProPollClose.xls (received by me on April 13, 2005). Among thevariables in the file is one that counts the number of voting machines in each precinct (“2004VOTING MACHINES”). Also available are variables that count the number of registered votersin each precinct as of April 1, 2004, and November 4, 2004 (“4/1/04 VOTER REGISTRATION”and “11/4/04 VOTER REGISTRATION”) and the number of active voters as of April 27, 2004,and November 4, 2004 (“4/27/04 ACTIVE VOTERS” and “11/4/04 ACTIVE VOTERS”). Thefile also contains a variable reporting the official count of the number of ballots cast (“2004OFFICIAL PUBLIC COUNT”).
The racial composition of each precinct is measured using proprietary data, derived from the2000 Census, prepared under contract for the DNC.
For discussion of the statistical methods used in this memo see Mebane and Herron (2005)and Mebane and Sekhon (2004a; 2004b).
Voting Machine Allocation and Voter TurnoutThe analysis of Ohio precincts in the Democratic National Committee’s report on Ohio 2004(Mebane and Herron 2005) finds that in precincts across the state, as the ratio of voting machinesper registered voter in each precinct increases, voter turnout increases. The mechanismconjectured in that report is that more machines per registered voter meant there were shorterlines, and that shorter lines meant that more people could take the time to vote. The report in thisway connects official decisions to place different numbers of voting machines in differentprecincts with disparities in different voters’ access to the polls.
Mebane (2005) reports evidence that tends to confirm that mechanism among precincts inFranklin County. The analysis in the current report refines the analysis by taking into account theracial composition of each precinct. Mebane (2005) estimates that the effect of inadequateprovision of voting machines in Franklin County reduced voter turnout much more than wasimplied by the estimates presented in Mebane and Herron (2005). The DOJ report finds that voter
1

registration data from Franklin County are unreliable, due to failure to purge lapsed voters(Tanner 2005, 2). The current analysis shows that replacing voter registration with a measure ofthe number of voters active in each precinct produces estimates of the effect of inadequatemachine provision on voter turnout that agree with the estimates Mebane and Herron (2005)present as typical throughout the state.
Figure 1 illustrates how providing an inadequate number of voting machines in precincts inFranklin County, Ohio, in 2004 produced long lines and caused voter turnout to decrease. Voterturnout in these figures is measured as the ratio of the official count of ballots cast to the numberregistered in November. The figure shows three scatterplots. The first plot shows the relationshipbetween the voting machines per registered voter ratio and voter turnout across precincts. Thelines in this and in the second plot are the ordinary least squares regression line where the naturallogarithm of the machines per registered voter ratio is the regressor (using the natural logarithmfits the data better than using the ratio directly). Turnout is higher where the number of votingmachines per registered voter is higher. The second plot shows the relationship between thevoting machines per registered voter ratio and the elapsed time each precinct’s polls were open. Alonger elapsed time implies that there were more voters still waiting to vote at the end of electionday. Many voters waited in long lines during the day, so this duration measure is not a perfectindicator for the long lines phenomenon. The durations are shorter (meaning lines at the end ofthe day were shorter) where the number of voting machines per registered voter is higher. Thethird plot shows the relationship between the elapsed time each precinct’s polls were open andvoter turnout. The line in this plot is the regression line using the polls open elapsed time as theregressor. Turnout is lower where the durations are greater (meaning lines were longer).
The DOJ report includes several statements that together may suggest that the observedrelationships between voting machine allocations, polls open elapsed times and voter turnoutsimply reflect the fact that both low ratios of voting machines per registered voter and long pollsopen elapsed times occurred in precincts with many African American voters, voters who arealready predisposed for other reasons to turnout to vote at lower rates.
The DOJ report observes that “voter turnout in Franklin County, as in much of the UnitedStates, varies significantly by race” (Tanner 2005, 2). A typical finding is that voter turnout islower among African Americans. The DOJ report further states that “there were fewer votingmachines in black precincts than in white precincts based on registration” (Tanner 2005, 3). Ipresent evidence regarding this claim (which is correct) below.
The DOJ report also claims that there is a “tendency in Franklin County for white voters tocast ballots in the morning (i.e., before work), and for black voters to cast ballots in the afternoon(i.e., after work)” (Tanner 2005, 3). Data from a survey of 1,201 Ohio voters conducted January30 through February 2, 2005, supports only the first part of this assertion (for a description of thesurvey methodology, see Feldman and Belcher 2005). As Table 1 shows, a higher proportion ofvoters who identified themselves as white rather than African American arrived at the polls tovote early in the morning: 49 percent of white voters arrived before 11 a.m. but only 41 percent ofAfrican American voters did so. And a higher proportion of African American voters than whitevoters arrived at the polls to vote during the middle of the day: 31 percent of African Americanvoters but only 23 percent of white voters arrived between 11 a.m. and 3 p.m. But during the lateafternoon and early evening period there is no disparity in the proportion of each group arriving atthe polls: 27 percent of white voters and 28 percent of African American voters arrived at thepolls to vote after 3 p.m. Across Ohio, at least, there is no support for the DOJ’s claim that black
2

voters more than white voters tended to show up to cast ballots “after work.”The DOJ report also states that “the predominantly black polling places stayed open later than
the predominantly white precincts in order to serve those voters who were in line at the normal7:30 p.m. poll closing time” (Tanner 2005, 3). Figure 2 shows the relationship across precinctsbetween the proportion African American and the polls open elapsed time. In addition to ascatterplot of the two variables, the figure also shows the ordinary least squares regression line.While there is slight tendency for the polls to be open longer as the proportion African Americanincreases, the longest elapsed times in fact occur in precincts where the proportion AfricanAmerican is low.
Direct evidence against the suggestion that the relationship between voting machineallocations and voter turnout primarily reflects a general tendency for voter turnout to be lowamong African American voters may be seen by examining the relationshps shown in Figures 3,4, 5, and 6. These figures show the same scatterplots as in Figure 1, except the precincts areseparated based on the proportion of the voting age population in each that is African American.The precincts are grouped into quartiles. Figure 3 shows the scatterplots among the 25 percent ofprecincts that have the lowest proportion African American. These are precincts where less than1.7 percent of the voting age population is African American. Figure 4 shows the middle half ofprecincts. These are precincts where more than 1.7 percent but less than 15.65 percent of thevoting age population is African American. Figure 5 shows the scatterplots among the 25 percentof precincts that have the highest proportion African American. These are precincts where morethan 15.65 percent of the voting age population is African American. Figure 6 shows theprecincts in which more than half of the voting age population is African American.
In every one of the four subsets of Franklin County precincts, turnout is higher where thenumber of voting machines per registered voter is higher. In each of the subsets, as well, the pollsopen elapsed times are shorter (meaning lines at the end of the day were shorter) where thenumber of voting machines per registered voter is higher. The bivariate relationship between pollsopen elapsed times and voter turnout varies across the four subsets. Among the precincts with lowand intermediate proportions African American, turnout is lower where the elapsed times aregreater. But among the precincts with the highest proportions African American, the mean levelof voter turnout is not correlated with the elapsed times.
Because the machines per registered voter ratio, the polls open elapsed time, the proportionAfrican American and voter turnout are all correlated with one another, the simple pairwiserelationships between them are difficult to interpret. To try to disentangle the relationships, let usfirst consider the conditional distribution of the polls open elapsed times given the machine perregistered voter ratios and the proportions African American. Then we will look at the conditionaldistribution of voter turnout given the other variables.
Table 2 reports estimates of a Poisson regression model (allowing for underdispersion) thatshows that the polls open elapsed time does tend to be significantly shorter in precincts where thevoting machines per registered voter ratio is higher, and longer where the proportion AfricanAmerican is greater. Shortages of voting machines are a primary reason for poll closing times tobe later.
Table 3 reports robust estimates of an overdispersed binomial regression model that has voterturnout in each precinct depending on the number of voting machines per registered voter, thepolls open elapsed time and the proportion African American. The regression model uses dummyvariables to allow the estimated base level of turnout and the estimated effects of the machine
3

allocations and the polls open elapsed times to vary across the three subsets of precincts.Specifically, using Ai to denote the proportion African American in precinct i, I define twodummy variables using the following rules:
LOWi =
{
1, if Ai < 0.017
0, otherwise
MEDi =
{
1, if 0.017 ≤ Ai ≤ 0.1565
0, otherwise
LOWi = 1 only if precinct i is in the set of precincts that have the lowest proportion AfricanAmerican, and MEDi = 1 only if precinct i is in the set of precincts that have an intermediateproportion African American. Using MRi to denote the natural logarithm of the voting machinesper registered voter ratio and Pi to denote the polls open elapsed time, the linear predictor in themodel may be written as follows.
Zi = b0 + b1Pi + b2MRi + LOWi(b3 + b4Pi + b5MRi) + MEDi(b6 + b7Pi + b8MRi) + b9Ai .
With this formulation, the estimated effects for each set of precincts may be recovered as follows:
Zi =
b0 + b3 + (b1 + b4)Pi + (b2 + b5)MRi + b9Ai, low proportion African Americanb0 + b6 + (b1 + b7)Pi + (b2 + b8)MRi + b9Ai, medium proportion African Americanb0 + b1Pi + b2MRi + b9Ai, high proportion African American .
Clearly we expect that having more voting machines per registered voter should increase voterturnout, because having more machines should reduce each voter’s expected waiting time (i.e.,shorter lines). Hence we expect b2 + b5 > 0, b2 + b8 > 0 and b2 > 0. If shortages of machines arethe primary cause of delays in voting and consequently of reductions in voter turnout, then giventhe number of voting machines we expect that having a polling place be open longer shouldincrease voter turnout (the counterfactual is obvious: imagine closing the polls while people arestill standing in line waiting to vote). Therefore we expect b1 + b4 > 0, b1 + b7 > 0 and b1 > 0. Inthis case the negative relationships between the polls open elapsed time and voter turnout thatappears in Figures 3 and 4 would be explained as a reflection of the fact that shortages of votingmachines caused long lines that forced the polls to be open longer. Finally, if African Americansare less likely than others are to vote, given the same number of voting machines per registeredvoter and the same polls open elapsed time, then we should observe b9 < 0.
The estimates in Table 3 confirm all of these expectations except one.Other things equal, having more voting machines per registered voter is associated with higher
voter turnout, but the effects are larger among the precincts that have intermediate or highproportions African American. In the set of precincts with high proportions African American,the number of voting machines per registered voter is very strongly related to voter turnout. Thepoint estimate for the coefficient is b2 = 1.36. The estimated effect of voting machines on turnoutamong the precincts with intermediate proportions African American is not significantlydifferent: b2 + b8 = 1.51. The estimated effect of voting machines on turnout among the precinctswith low proportions African American is positive but substantially smaller: b2 + b5 = 0.67. Thedisplay at the bottom of Table 3 translates these coefficient estimates into estimates of the
4
differences in voter turnout expected across the ranges of values for the ratio of voting machinesper registered voter observed among each of the three sets of precincts. The results confirm thateffects of voting machine allocations on voter turnout were less severe among precincts that hadlow proportions African American. Each expected turnout value is computed using the coefficientparameter estimates and the quartiles of the machines per registered voter ratio, the median pollsopen elapsed time and the median proportion African American among precincts in the referentsubset. Moving from the first to the third quartile of the voting machines per registered voter ratiois associated with an increase of about nine percent in voter turnout in the precincts having highand intermediate proportions African American. But among the precincts having low proportionsAfrican American, moving from the first to the third quartile of the voting machines per registeredvoter ratio is associated with an increase of about three percent in voter turnout.
Also, as expected, voter turnout falls as the proportion African American increases, otherthings equal (b9 = −0.34).
The estimated effects of polls open elapsed times on turnout are as expected for the precinctsthat have intermediate or high proportions African American, but not for the precincts that havelow proportions African American. For the precincts with the highest proportion AfricanAmerican, keeping the polls open longer is associated with higher turnout, other things equal(b1 = 0.081). The estimated effect among the precincts with intermediate proportions AfricanAmerican is not significantly different (b1 + b7 = 0.072). But for the precincts that have lowproportions African American, keeping the polls open longer is associated with lower turnout,other things equal (b1 + b4 = −0.104). The display at the bottom of Table 3 translates thecoefficient estimates into estimates of the differences in voter turnout expected across the rangesof values for the polls open elapsed times observed among each of the three sets of precincts.Each expected turnout value is computed using the coefficient parameter estimates and thequartiles of the median polls open elapsed times, the machines per registered voter ratio and themedian proportion African American among precincts in the referent subset. Moving from thefirst to the third quartile of the polls open elapsed times is associated with an increase of about 3.4percent in voter turnout in the precincts having high proportions African American, and with anincrease of about two percent in the precincts with intermediate proportions African American.But among the precincts having low proportions African American, moving from the first to thethird quartile of the voting machines per registered voter ratio is associated with a decrease ofabout 0.7 percent in voter turnout. In the precincts that have low proportions African American,delays that deterred voters from voting occurred for reasons that do not trace back to insufficientprovision of voting machines in the same way as in the other precincts. Other unmeasured aspectsof conditions in those precincts may have made a difference. Or it may be that the people in thoseprecincts tended to respond differently when faced with similar conditions in the polling place.
The model reported in Table 3 describes the pattern of voter turnout among most of theprecincts in the analysis. Among the 787 precincts, there are only four precincts that have voterturnout so different from the pattern observed among the other precincts that they are classified asoutliers. Table 3 lists those precincts. In all of them the observed turnout is substantially smallerthan expected according to the model that describes turnout throughout the rest of the county.
The DOJ report states that the rolls of registered voters in Franklin County are so unreliablethat in making decisions about how to allocate voting machines to precincts, Franklin Countyelection officials augmented them with information about turnout in previous elections. The DOJreport states, “the Board used the inflated voter rolls in the Fall of 2004 as one factor in its
5

allocation of voting machines, and it also used past voter turnout as another factor” (Tanner 2005,2). In the data provided by Franklin County, the variable that most closely approximates thecombination of these two kinds of information is the count of the active voters in each precinct.One may wonder whether the effects of voting machine allocation on voter turnout appear to besmaller if in the analysis the number of registered voters is replaced by the number of activevoters.
As may be seen in Figures 7, 8, 9, 10, and 11, using active voters instead of registered votersdoes not greatly change the bivariate relationships among the machine allocations, the polls openelapsed times and voter turnout. Voter turnout in these figures is measured as the ratio of theofficial count of ballots cast to the number of active voters in November, and we now consider theratio of voting machines per active voter in each precinct. Over all precincts in Franklin County,the relationships using active voters are nearly the same as they are using registered voters(compare Figure 7 with Figure 1). Likewise the relationships are more similar than not in each ofthe previously considered subsets of precincts grouped by the proportion of the voting agepopulation in each that is African American (compare Figure 8 with Figure 3, Figure 9 withFigure 4, Figure 10 with Figure 5 and Figure 11 with Figure 6).
Table 4 reports estimates of a Poisson regression model (allowing for underdispersion) thatshows that the polls open elapsed time does tend to be significantly shorter in precincts where thevoting machines per active voter ratio is higher, and longer where the proportion AfricanAmerican is greater. The effect the ratio of voting machines per active voter has on the polls openelapsed time is about the same as the effect estimated for the ratio of voting machines perregistered voter. If anything the effect estimated with respect to active voters is slightly larger thanthe one estimated with respect to registered voters.
Estimating an overdispersed binomial regression model that has voter turnout among activevoters in each precinct depending on the number of voting machines per active voter, the pollsopen elapsed time and the proportion African American produces one noteworthy change fromthe model estimated using registered voters that was presented in Table 3. The estimatespresented in Table 5 refer to a model having the same form as the one for turnout amongregistered voters. Using MAi to denote the natural logarithm of the voting machines per activevoter ratio, the linear predictor in the model may be written
Zi = c0 + c1Pi + c2MAi + LOWi(c3 + c4Pi + c5MAi) + MEDi(c6 + c7Pi + c8MAi) + c9Ai ,
and the estimated effects for each set of precincts may be recovered as follows:
Zi =
c0 + c3 + (c1 + c4)Pi + (c2 + c5)MAi + c9Ai, low proportion African Americanc0 + c6 + (c1 + c7)Pi + (c2 + c8)MAi + c9Ai, medium proportion African Americanc0 + c1Pi + c2MAi + c9Ai, high proportion African American .
If having more voting machines per active voter increases voter turnout among active votersless than having higher numbers of voting machines per registered voter increases registered voterturnout, then the coefficients that measure these effects should be of smaller magnitude in thecurrent model. That is, we should observe b2 + b5 > c2 + c5, b2 + b8 > c2 + c8 and b2 > c2. Ifshortages of machines are the primary cause of delays in voting and consequently of reductions invoter active voter turnout, then we continue to expect that, given the number of voting machines,
6

having a polling place be open longer should increase voter turnout among those voters.Therefore we expect c1 + c4 > 0, c1 + c7 > 0 and c1 > 0. Of course the model estimates forregistered voters have already indicated that among the precincts with a low proportion AfricanAmerican, delays apparently had effects on turnout that were qualitatively different from theeffects among the other precincts (recall that b1 + b4 < 0). And, finally, if African Americans areless likely to vote than other active voters are, given the same number of voting machines peractive voter and the same polls open elapsed time, then we should observe c9 < 0.
The estimates presented in Table 5 show that, other things equal, having more votingmachines per active voter is associated with higher voter active voter turnout, even though theeffects of the machine allocation on turnout are of smaller magnitude among active voters thanthey are among registered voters. Once again the effects are larger in the precincts that have highproportions African American than among the precincts that have low proportions AfricanAmerican. The effects on turnout among the precincts with intermediate proportions AfricanAmerican are smaller than among the high proportion precincts and greater than among the lowproportion precincts. In the set of precincts with highest proportions African American, thecoefficient that measures the effect on active voter turnout of the number of voting machines peractive voter is estimated to be smaller than the corresponding coefficient estimate for registeredvoters: c2 = 1.21, while b2 = 1.36. The estimated effect of voting machines on active voterturnout among the precincts with intermediate proportions African American is slightly smallerthan the estimate among the precincts with high proportions African American: c2 + c8 = 1.04.The estimated effect among the precincts that have low proportions African American issignificantly smaller: c2 + c5 = .41.
The estimated differences in expected active voter turnout across the ratios of voting machinesper active voter observed in each of the three sets of precincts are reported at the bottom of Table5. The results confirm that the effects of voting machine allocations on active voter turnout aresmaller than the effects on registered voter turnout (compare Table 3). The results also show thatthe effects are greatest among the precincts that have high proportions African American and leastamong precincts that have low proportions African American. Moving from the first to the thirdquartile of the voting machines per active voter ratio is associated with an increase of about 5.7percent in active voter turnout in the precincts having high proportions African American and ofabout 3.5 percent in active voter turnout in the precincts with intermediate proportions AfricanAmerican. But among the precincts having low proportions African American, moving from thefirst to the third quartile of the voting machines per active voter ratio is associated with anincrease of about 1.1 percent in voter turnout.
Voter turnout among active voters falls as the proportion African American increases, otherthings equal (c9 = −0.54).
Having polls be open longer is associated with increases in active voter turnout, other thingsequal, only for the precincts that have high proportions African American (c1 = 0.042). Theestimated effect among the precincts with intermediate proportions African American is slightlynegative (c1 + c7 = −0.031), and the estimated effect for the precincts that have low proportionsAfrican American is significantly negative (c1 + c4 = −0.123). The display at the bottom of Table5 translates these coefficient estimates into estimates of the differences in voter turnout expectedacross the ranges of values for the polls open elapsed times observed among each of the three setsof precincts. Moving from the first to the third quartile of the polls open elapsed times isassociated with an increase of about 1.6 percent in voter turnout in the precincts having high
7

proportions African American, with a decrease of about 0.7 percent in the precincts withintermediate proportions African American, and with a decrease of about 0.4 percent in voterturnout in the precincts having low proportions African American. These results again suggestthat the delays that deterred active voters from voting in the precincts having lower proportionsAfrican American occurred for reasons that do not trace back to insufficient provision of votingmachines in the same way as in the precincts that have high proportions African American.
The model reported in Table 5 describes the pattern of active voter turnout in most of theprecincts. Among the 787 precincts, there are only four precinct outliers. Table 5 lists thoseprecincts. In all of them the observed turnout is substantially smaller than exected according tothe model that describes turnout throughout the rest of the county. One of the outlier precincts inthe model for active voter turnout is also an outlier in the model for registered voter turnout. Thatprecinct appears to be extremely anomalous whether one considers active voters or registeredvoters.
To summarize, while it is clear that shortages of voting machines in Franklin County causeddelays in people waiting to vote that in turn reduced voter turnout, it is not clear why therelationship between voting machine allocation and turnout seems to take different formsdepending on the racial composition of the precincts in question. Using the separation ofprecincts into quartiles based on the proportion of a precinct’s voting age population that isAfrican American, we find that in all the sets of precincts, having more voting machines per voter(either registered voter or active voter) is associated with higher voter turnout, given the pollsopen elapsed time and the proportion African American. But the estimate of the partialassociation between machines per voter and turnout is much smaller in the set of precincts withlow proportions African American than it is in the other sets. And when we consider only activevoters, the estimated partial association is larger in the set of precincts that have high proportionsAfrican American than it is in the set of precincts that have intermediate proportions. In addition,the partial association between polls open elapsed time and turnout is negative in the set ofprecincts with low proportions African American, and when only active voters are considered thepartial association is negative as well in the set of precincts that have intermediate proportionsAfrican American. Because greater shortages of voting machines are a primary cause of longerpolls open elapsed times, these negative partial associations are probably best seen as additionalmanifestations of the basic problem that there were not enough machines, but it is not clear whythe effects take such different forms in the different sets of precincts.
Regardless of the differing appearances the relationship between voting machine allocationsand voter turnout has in the statistical models, the estimates of the typical differences in turnoutassociated with the allocations suggests that the impact was much larger in areas that had higherproportions of African American voters. Even considering only the estimated effects on turnoutamong active voters, which are smaller than the estimated registered voter effects, the expectedvoter turnout estimates at the bottom of Table 5 show that the typical reduction in voterturnout—when comparing a precinct that has a machines per active voter ratio near the thirdquartile to a precinct having a ratio near the first quartile—is more than five times larger in the setof precincts with high proportions African American than it is in the set of precincts with lowproportions. In the former set of precincts the reduction in turnout associated with such adifference in the provision of voting machines is about 5.7 percent while in the latter set thereduction is about 1.1 percent.
If we take into account the indirect consequences of the machine allocations that are
8

associated with the polls open elapsed times, the picture of more severe effects in precincts thathave more African American voters does not change in any substantively important way. Becauselonger polls open times are in the regression model sense associated with higher voter turnoutamong precincts with high proportions African American but with lower voter turnout amongprecincts with low proportions, a crudely estimated combined effect of the two variables showsslightly less disparate impacts than the estimated effect of differences in the voting machine ratiosalone. If, just to get a heuristic sense, we add together both sets of expected voter turnout effectsfrom the bottom of Table 5—comparing the third to the first quartile for the machine ratio and thefirst to the third quartile for the polls open time—the crude result is a typical reduction of 4.1percent in voter turnout in the precincts having high proportions African American and a typicalreduction of 1.4 percent in the precincts having low proportions. By this crude measure theallocation of voting machines still is associated with reductions in turnout that are typically threetimes larger in the set of precincts with high proportions African American than they are in the setof precincts with low proportions. There is no merit to the DOJ report’s suggestion that keepingthe polls open longer fully mitigated the consequences of the initial disparity in the distribution ofvoting machines (recall the DOJ statement, “the predominantly black polling places stayed openlater than the predominantly white precincts in order to serve those voters who were in line at thenormal 7:30 p.m. poll closing time” Tanner 2005, 3).
Racial Biases in Voting Machine AllocationSo far we have seen that the allocation of voting machines among Franklin County’s precinctsaffected different voters differently, and that the most severe effects in terms of reduced voterturnout were incident on voters in precincts that had high proportions of African Americans. Werethe machine allocation decisions that produced such disparate impacts themselves racially biased?
The description of the methods used to allocate voting machines in the DOJ report isunspecific:
“In any event, the Board used the inflated voter rolls in the Fall of 2004 as one factorin its allocation of voting machines, and it also used past voter turnout as anotherfactor. Of course, any allocation—no matter how bipartisan—was inevitably going tobe inelegant and imprecise given that the Board had to make allocation decisions wellbefore the election and was constrained by the number of voting machines available(2,904), the number of precincts (788), and the Ohio practice of having at least twomachines in each precinct so that voting can continue if one machine breaks down. AsElections Director Damschroder acknowledged, the process involved ‘some math andsome art.’ ” (Tanner 2005, 2)
The lack of specificity in the DOJ report’s description is apparent, but its accuracy is alsoquestionable. The spreadsheet file provided by Franklin County shows 2,800 voting machinesassigned to precincts, not 2,904.
The DOJ report states plainly that “there were fewer voting machines in black precincts thanin white precincts based on registration” (Tanner 2005, 3), but the report attempts to justify that asan appropriate response to the history of voter turnout in the different precincts: “the Board [ofElections] tended to allocate fewer machines to the 54 predominantly black precincts perregistered voter because of the long history of lower black turnout” (Tanner 2005, 3). The DOJ
9

report goes on to state that when one looks at the voting machine allocation in relation to theballots cast, the problematic disparity disappears:
“But while there were fewer voting machines in black precincts than in white precinctsbased on registration, the disparity was reversed when compared to actual voter turnoutin the 2004 election. In fact, voting machines in the white precincts were busier thanthe machines in the black precincts, and black persons who went to the polls were notat a disadvantage due to the number of machines.” (Tanner 2005, 3)
In view of the disparities we have documented with respect to the effects the allocation ofvoting machines had on voter turnout, it should be obvious that it is not appropriate to take therelationship between the number of voting machines and the number of ballots cast as a measureof the fairness and adequacy of the machine allocations. Doing so, as the DOJ report does,ignores the people who went to the polls with the intention to vote but could not do so because ofthe great delays caused by the scarcity of machines.
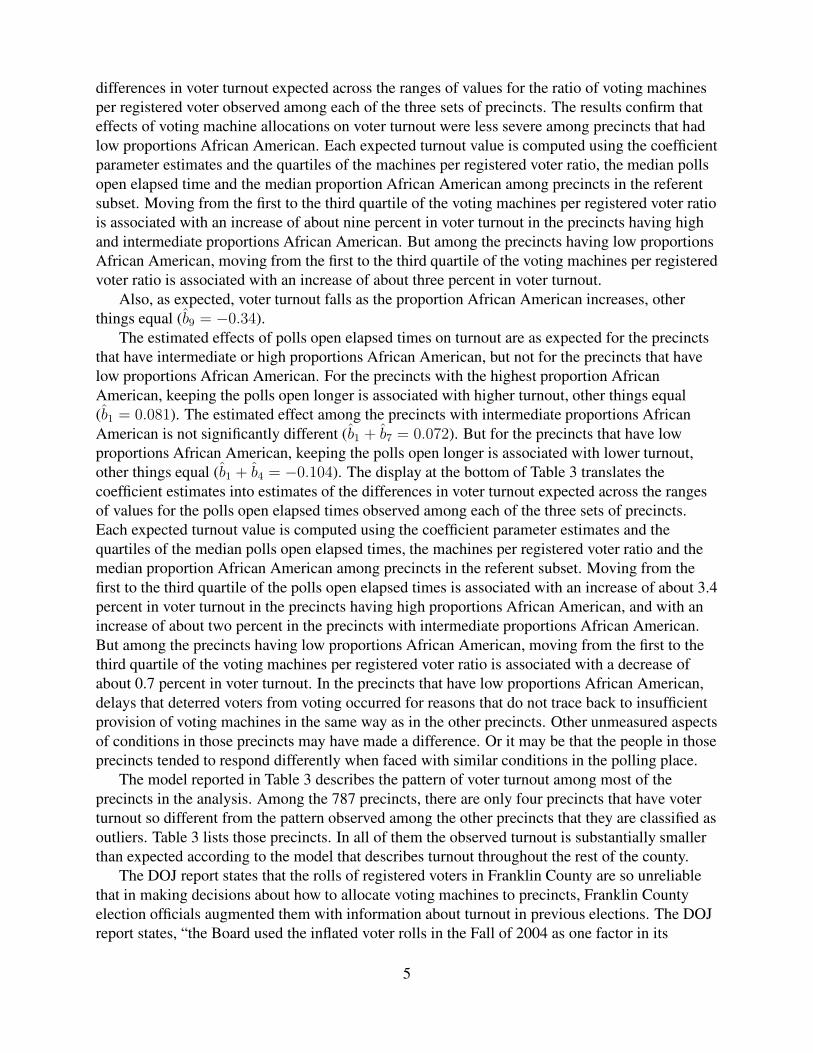
It is true that the ratio of ballots cast per voting machine does not show the same pattern ofdisparities associated with the racial composition of precincts that are evident in the ratio ofregistered voters per voting machine. Using the previous discussion’s separation of precincts intoquartiles based on the proportion of a precinct’s voting age population that is African American,the first column of Table 6 shows that in the set of precincts that have low proportions AfricanAmerican there were typically 262 registered voters per voting machine while in the set ofprecincts with high proportions African American there were typically 324 registered voters pervoting machine. The second column shows that the balance changes when the number of ballotscast is considered. In the set of precincts with low proportions African American there weretypically 170 ballots cast per voting machine while in the set of precincts with high proportionsAfrican American there were typically 164 ballots cast per voting machine.
Far from being a measure of the fairness of the voting machine allocation, however, therelationship between the number of voting machines and the number of ballots cast is primarilyan indication of the length of time it took for each voter who did manage to vote to complete theballot. Of the 792 precincts for which there are data in the file from Franklin County, 776 have apolls open elapsed time greater than 13 hours, which indicates that they were open past thescheduled poll closing time of 7:30 p.m.. Presumably each precinct remained open until the lastvoter in line as of 7:30 p.m. had voted, and no longer, and the universally acknowledged longlines in most places in the county throughout the day means that every voting machine was fullyoccupied throughout the day. So all we learn from the fact that typically there were 170 ballotscast per voting machine in the precincts with low proportions African American and 164 ballotscast per voting machine in the precincts with high proportions is that in the latter precincts eachvoter typically took slightly longer to vote than each voter did in the former set of precincts. Thatthe time it took each person to vote is the main fact underlying the ballots per machine statistics isshown most clearly by the third column of Table 6, which shows the median value for each set ofprecincts of the number of ballots cast divided by the polls open elapsed time and the number ofvoting machines. In the set of precincts with low proportions African American typically 13ballots were cast per voting machine per hour that the polls were open while in the set of precinctswith high proportions African American typically 11 ballots were cast per voting machine perhour. Perhaps this is where the DOJ report’s speculation about the effects of the length of theballot come into play: “It is clear that there were long lines at polling places across Franklin
10

County, and it was not uncommon for voters to have to wait three or more hours to cast theirballots. This was especially true within the City of Columbus, where the ballot was exceptionallylong” (Tanner 2005, 1).
The most relevant measure of whether there were racial biases in the allocation of votingmachines is the relationship between the number of voting machines in each precinct and themeasure of the number of voters Franklin County officials expected in each precinct for theNovember election as of the time the voting machine allocation decisions were made. We askedthe Franklin County Board of Elections to supply the exact count of voters in each precinct thatthey used to make the machine allocations. In response to that query, on January 23, 2005, theysent three files via email (Brown 2006): the file named FINAL JUSTICE DEPARTMENTANALYSIS.xls, a file named SECOND LIST FOR DOJ 06.09.05.xls and a file named06.20.05 Purged Voters for DOJ.xls. We then asked which of several alternativeformulas matched the measure used to make the allocation decisions. Referring to columns in thethree spreadsheet files, the question was “Which numbers were used to make themachine allocation? (a) "4/27/04 ACTIVE VOTERS"; (b) "4/27/04ACTIVE VOTERS" + "TOTAL NEWLY REGISTERED VOTERS 2004";(c) "4/1/04VOTER REGISTRATION";(d) "4/1/04 VOTER REGISTRATION" + "TOTALNEWLY REGISTERED VOTERS 2004";(e) any of the preceding - "PURGEDVOTERS"; (f) other.” The Director of Franklin County’s Board of Elections, MattDamschroder, responded as follows:
“I have been quoted as saying the 11/04 allocation decision was calculated using ‘alittle bit of math and a little bit of art.’ Because 90% of the allocation decision using theold machines had to be made well in advance of the election, there was not sufficienttime to take into full account the significant change in registration. Therefore, mid-summer, post primary active voter numbers were used as an objective baseline andthen changed based upon subjective evaluations such as past turnout, new construction(which would indicate more provisional ballot demand), and local contests or issuesthat may drive turnout beyond what was expected for the balance of the county (i.e.,school tax levy).” (Damschroder 2006)
Evidently the allocation decisions were not a simple function of any particular measure of thenumber of voters.
Nonetheless we can use the information sent in response to our query to assess whether themachine allocations appear to be racially biased when compared to the count of voters in eachprecinct near the time the bulk of the allocation decisions were made. Damschroder’s statementsuggests that most but not all of the allocations were made in “mid-summer.” His mention of“post primary” voters refers to the primary election of March, 2004. Two columns in the FINALspreadsheet file may bear on the concept of “post primary active voters”: “4/1/04 VOTERREGISTRATION” and “4/27/04 ACTIVE VOTERS.” The fact that the “4/1/04 VOTERREGISTRATION” count for each precinct is always larger than the “4/27/04 ACTIVE VOTERS”count implies that the latter reflects some voters having been purged from the former. TheSECOND file contains a column entitled “TOTAL NEWLY REGISTERED VOTERS 2004” andthe Purged file contains a column entitled “PURGED VOTERS,” but these numbers do notappear to be useful for recovering the status of each precinct as of “mid-summer.” We asked theFranklin County officials to clarify the temporal scope of the “NEWLY REGISTERED” numbers.
11

Our question was, “In SECOND LIST FOR DOJ 06.09.05.xls there arecolumns "TOTAL NEWLY REGISTERED VOTERS 2004" and "NEWLYREGISTERED VOTERS CASTING BALLOTS IN 2004." What is the time spanfor "newly" here? Newly registered since when? Does that meanbetween 4/27/2004 (or 4/1/2004) and 6/9/2004 (I assume 06.09.05is June 9, 2005)? That would suggest I should add the "newly"counts to the "4/27/04 ACTIVE VOTERS" counts to get the totalnumber of voters used to allocate the machines. Is thiscorrect?” Damschroder responded as follows:
“For the spreadsheet you reference, ‘TOTAL NEWLY REGISTERED VOTERS 2004’means any qualified elector registering to vote in Franklin County for the first timeduring the time period between the March primary election and the November generalelection. Newly registered voters, by NVRA definition, are considered active votersand would be included in the final total active voters numbers.” (Damschroder 2006)
Regarding the “PURGED VOTERS” values, Damschroder gave a response that included thefollowing:
“In 1999, the Board of Elections changed voter registration systems (database softwareapplication) and in the transition lost all of its electronic data ”proving” that the Boardhad followed the law and issued the confirmation notices. Therefore the Board choseto reset all inactive voters to active status and began the NVRA process over. It is hardto determine precisely how many inactive voters in 2004 should have been purgedfrom the rolls in 2001 and 2003, but the bottom line is that the 2004 rolls were bloateddue to the abnormally high number of inactive voters. Note here that not all inactivevoters were then purged in 2005 (because not all had reached the fullness of theirNVRA timetable). Once a voter is purged (cancelled) the voter no longer appears onthe rolls of the election jurisdiction as a registered voter. The future purge status ofan inactive voter was not considered in the 2004 voting machine allocation decisionmaking process.” (Damschroder 2006)
An exact reconciliation in the spirit of Damschroder’s statements between all the numberscontained in the files supplied by Franklin County is not possible, but it is clear that the “TOTALNEWLY REGISTERED VOTERS 2004” and “PURGED VOTERS” information cannot be usedto approximate “mid-summer” voter counts. Precinct by precinct, the sum of “4/1/04 VOTERREGISTRATION” and “TOTAL NEWLY REGISTERED VOTERS 2004” is moderately close tothe value of “11/4/04 VOTER REGISTRATION” from the FINAL file. The median percentagedifference between them is 0.16 percent and the largest difference is 26.9 percent. The sum isgreater than “11/4/04 VOTER REGISTRATION” in 367 precincts and less in 406 precincts. If the“PURGED VOTERS” values are subtracted from the sum then the result is less than “11/4/04VOTER REGISTRATION” in all but two precincts. The sum of “4/27/04 ACTIVE VOTERS”and “TOTAL NEWLY REGISTERED VOTERS 2004” is always less than “11/4/04 VOTERREGISTRATION.”
The information provided by Franklin County does not allow us to recover the information orthe decision rules Franklin County officials used to allocate voting machines to precincts for the
12

2004 general election. The closest we can come to measuring the number of voters as of“mid-summer” 2004 is to use the number of active voters in each precinct as of April 27, 2004.
The active voter counts used in the analysis reported in the preceding section are datedNovember 4, 2004, two days after the election. The November active voter count is the bestmeasure to use for comparing the allocation of voting machines to the electorate as it existed onelection day. Allocation decisions made using “mid-summer” information would of course haveignored the surge in voter registration that took place between July and October. According to thefile provided by Franklin County, there was a net increase of 15 percent in voter registration in thecounty between April 1, 2004, and November 4, 2004. Between April 27, 2004, and November 4,2004 the number of active voters in the county increased by 27.4 percent.
The fifth and sixth columns of Table 6 show that, in terms of racial disparities, the Novembercount of active voters and the April-June count of active-newly-purged voters present divergentpictures of the voting machine allocation. Using the November active voter counts, there are onaverage more active voters per voting machine in the precincts that have high proportions AfricanAmerican (242 voters per machine) than in the precincts with low proportions (213 voters permachine). In percentage terms, this disparity is smaller than the one observed using the counts ofregistered voters. Using the registered voter counts there are on average 23.7 percent more votersper machine in the precincts with high proportions African American than in the precincts withlow proportions, but using the November active voter counts there are 13.6 percent more. Thedisparity is nonetheless still large. Using the April active voter counts, however, there are moreactive voters per voting machine in the precincts that have low proportions African American(189 voters per machine) than in the precincts with high proportions (177 voters per machine), adifference of 6.8 percent.
The allocation of voting machines in Franklin County was clearly biased against voters inprecincts with high proportions of African Americans when measured using the standard of theNovember, 2004, electorate. Measured against the active electorate in April, the machineallocations on average favored voters in precincts with high proportions African American. If wehad reason to believe that the “mid-summer” information about the voters in each precinct wassimilar to the active voter counts in late April, then it might be plausible to argue that FranklinCounty election officials should be exculpated for the November disparities because the largeincrease in the active electorate from April to November simply caught them by surprise.
Beyond the fact that we have no reason to believe that the number of active voters in eachprecinct in “mid-summer” was close to the number on April 27 (new registrants are consideredactive voters), at least two considerations argue against deciding that the officials should beconsidered blameless. First, the total number of voting machines was inadequate even whencompared to the size of the estimated active electorate in June. To reach an average of 100 votersper machine in the April electorate, the county needed 5,023 working voting machines, not 2,800.The DOJ report states that the county plans to increase the number of voting machines to 5,000(Tanner 2005, 4). If the size of the active electorate in November, 2004, is used, the number ofworking machines needed to reach 100 voters per machine is 6,404. It appears that FranklinCounty election officials are making plans that will again produce shortages of voting machines infuture elections.
Second, to say that it was appropriate for Franklin County officials to rely on an assessment ofthe size of the active electorate made in “mid-summer” would be to say it was appropriate forthem to ignore the clear signs during the late summer and fall that the November electorate would
13

be substantially larger. If nothing else, the surge of applications from new registrants should havebeen a clear indicator that plans made based on the earlier information would not be sufficient.
ConclusionThe allocation of voting machines in Franklin County was clearly biased against voters inprecincts with high proportions of African Americans when measured using the standard of theNovember, 2004, electorate. In precincts with high proportions of African American voters therewere 13.6 percent more active voters per voting machine than in precincts having low proportionsof African American voters. While shortages of voting machines caused long delays in votingthroughout the county, the allocation of voting machines among the county’s precincts affecteddifferent voters differently. The most severe effects in terms of reduced voter turnout wereincident on voters in precincts that had high proportions of African Americans. The mostconservative estimate—based on the reported size of the active electorate in November—is thattypically the shortages of machines reduced voter turnout by slightly more than four percent inprecincts in which high proportions of the voters were African American, while shortages inprecincts where very few voters were African American reduced voter turnout by slightly lessthan 1.5 percent.
If the allocation of voting machines is compared to information about the size of the activeelectorate that was available to Franklin County election officials at the end of April, 2004, thenthe allocation of machines is not biased against voters who were active at that time in precinctshaving high proportions of African Americans. But if we use the April information to evaluate theallocation plans, then we must note that the plans involved using a total number of machines thatwas nearly 45 percent too small. Using the April measure of the size of the active electorate,5,023 working voting machines were needed, not 2,800 machines as data supplied by the countyindicate were actually deployed on election day.
Using plans made in “mid-summer” meant that Franklin county officials ignored informationduring the late summer and fall that should have showed them that the November electoratewould be substantially larger. Between April and November, the active voter population in thecounty increased by more than 15 percent. If nothing else, the surge of new registrants shouldhave indicated that their plans made in mid-summer would prove woefully insufficient.
14

0.002 0.004 0.006 0.008 0.010 0.012
0.2
0.5
0.8
2004 machines per registered voter
2004
vot
er tu
rnou
t
0.002 0.004 0.006 0.008 0.010 0.012
1315
17
2004 machines per registered voter
2004
pol
ls o
pen
elap
sed
time
13 14 15 16 17 18
0.2
0.5
0.8
2004 polls open elapsed time
2004
vot
er tu
rnou
t
Figure 1: Number of Voting Machines, Turnout and Poll Closing Times in Franklin County
15

Table 1: Voter Ethnicity and Time of Day Arrived at Polls
EthnicityTime White Afr. Am.
Before 8 a.m. 21 188 a.m.–11 a.m. 28 2311 a.m.–3 p.m. 23 313 p.m.–5 p.m. 13 15After 5 p.m. 14 13
Notes: Each column shows the percentage of voters self-identifying as having the referentethnicity (question wording: “Could you please tell me your race?”) who arrived at the polls tovote during the indicated time interval (question wording: “What time of day did you get to thepolls to vote?”).
Source: Voter Experience Survey. The sample is a random telephone sample of 1,201 peopleinterviewed throughout Ohio during January 30 through February 2, 2005, “who voted (or went tothe polls with the intention of voting) in the 2004 general election” on November 2, 2004(Feldman and Belcher 2005, 1).
16

0.0 0.2 0.4 0.6 0.8
1314
1516
1718
proportion African American
2004
pol
ls o
pen
elap
sed
time
Figure 2: Polls Open Elapsed Time by Proportion African American
17

0.003 0.004 0.005 0.006 0.007 0.008
0.4
0.6
0.8
2004 machines per registered voter
2004
vot
er tu
rnou
t
0.003 0.004 0.005 0.006 0.007 0.008
13.0
14.5
2004 machines per registered voter
2004
pol
ls o
pen
elap
sed
time
13.0 13.5 14.0 14.5 15.0 15.5
0.4
0.6
0.8
2004 polls open elapsed time
2004
vot
er tu
rnou
t
Figure 3: Number of Voting Machines, Turnout and Poll Closing Times in Franklin County: 25Percent of Precincts with Lowest Proportions African American
18

0.002 0.004 0.006 0.008 0.010 0.012
0.3
0.5
0.7
2004 machines per registered voter
2004
vot
er tu
rnou
t
0.002 0.004 0.006 0.008 0.010 0.012
1315
17
2004 machines per registered voter
2004
pol
ls o
pen
elap
sed
time
13 14 15 16 17 18
0.3
0.5
0.7
2004 polls open elapsed time
2004
vot
er tu
rnou
t
Figure 4: Number of Voting Machines, Turnout and Poll Closing Times in Franklin County: 50Percent of Precincts with Middle Proportions African American
19

0.002 0.003 0.004 0.005 0.006
0.2
0.4
0.6
2004 machines per registered voter
2004
vot
er tu
rnou
t
0.002 0.003 0.004 0.005 0.006
1315
17
2004 machines per registered voter
2004
pol
ls o
pen
elap
sed
time
13 14 15 16 17
0.2
0.4
0.6
2004 polls open elapsed time
2004
vot
er tu
rnou
t
Figure 5: Number of Voting Machines, Turnout and Poll Closing Times in Franklin County: 25Percent of Precincts with Highest Proportions African American
20

0.0025 0.0030 0.0035 0.0040 0.0045 0.0050
0.4
0.6
2004 machines per registered voter
2004
vot
er tu
rnou
t
0.0025 0.0030 0.0035 0.0040 0.0045 0.0050
1315
17
2004 machines per registered voter
2004
pol
ls o
pen
elap
sed
time
13 14 15 16 17
0.4
0.6
2004 polls open elapsed time
2004
vot
er tu
rnou
t
Figure 6: Number of Voting Machines, Turnout and Poll Closing Times in Franklin County:Precincts with More than 50 Percent African American
21

Table 2: Polls Open Elapsed Time Given Machines per Registered Voter and Proportion AfricanAmerican Regressors
Variable Coef. SE t-ratio
(Intercept) 1.818847 0.053773 33.83Log(Machines per Registered Voter) −0.141308 0.009480 −14.90Proportion African American 0.099189 0.008725 11.37
Notes: Underdispersed Poisson regression model estimates (dispersion estimate is 0.043). Pollsopen elapsed time is the dependent variable. n = 787.
22

Table 3: Voter Turnout: Polls Open Elapsed Time, Machines per Registered Voter and ProportionAfrican American Regressors
Variable Coef. SE t-ratio
(Intercept) 6.8400 0.4780 14.300Polls Open Elapsed Time 0.0817 0.0148 5.510Log(Machines per Registered Voter) 1.3600 0.0851 16.000Low Proportion African American Dummy −1.1200 0.8870 −1.260Low AA Dummy × Polls Open Elapsed Time −0.1860 0.0485 −3.830Low AA Dummy × Log(Machines per Registered Voter) −0.6930 0.1450 −4.800Medium Proportion African American Dummy 1.0800 0.6040 1.790Medium AA Dummy × Polls Open Elapsed Time −0.0101 0.0207 −0.489Medium AA Dummy × Log(Machines per Registered Voter) 0.1460 0.1140 1.280Proportion African American −0.3410 0.0632 −5.390
Notes: Robust (tanh) overdispersed binomial regression estimates. For each precinct, thedependent variable counts the number of registered voters voting versus the number of registeredvoters not voting. LQD σ = 3.73; tanh σ = 3.40; n = 787; 2 outliers.
OutliersCode Precinct Precinct Name SRes
01059E COLS 59-E Columbus City Fifty-Ninth Ward Precinct E −4.6906000E FRANKLIN-E Franklin Township Franklin E −3.96
Expected Voter Turnout at Quartiles of the
Machine Ratio Polls Open TimeProportion African American 25% 50% 75% 25% 50% 75%
Low 0.635 0.650 0.666 0.653 0.650 0.646Medium 0.516 0.565 0.608 0.560 0.565 0.581High 0.460 0.506 0.546 0.490 0.506 0.524
Notes: Each expected turnout value for the machine ratio quartiles is computed using thecoefficient parameter estimates reported in the top part of this table and, for each subset ofprecincts, the quartiles of the machines per registered voter ratio, the median polls open elapsedtime and the median proportion African American in the referent subset. The values for the pollsopen time quartiles are computed using the quartiles of the polls open elapsed time, the medianmachines per registered voter ratio and the median proportion African American in the referentsubset.
23

0.004 0.006 0.008 0.010 0.012 0.014 0.016
0.4
0.6
0.8
2004 machines per active voter
2004
vot
er tu
rnou
t
0.004 0.006 0.008 0.010 0.012 0.014 0.016
1315
17
2004 machines per active voter
2004
pol
ls o
pen
elap
sed
time
13 14 15 16 17 18
0.4
0.6
0.8
2004 polls open elapsed time
2004
vot
er tu
rnou
t
Figure 7: Number of Voting Machines, Turnout among Active Voters and Poll Closing Times inFranklin County
24

0.004 0.006 0.008 0.010 0.012 0.014
0.6
0.8
2004 machines per active voter
2004
vot
er tu
rnou
t
0.004 0.006 0.008 0.010 0.012 0.014
13.0
14.5
2004 machines per active voter
2004
pol
ls o
pen
elap
sed
time
13.0 13.5 14.0 14.5 15.0 15.5
0.6
0.8
2004 polls open elapsed time
2004
vot
er tu
rnou
t
Figure 8: Number of Voting Machines, Turnout among Active Voters and Poll Closing Times inFranklin County: 25 Percent of Precincts with Lowest Proportions African American
25

0.004 0.006 0.008 0.010 0.012 0.014 0.016
0.4
0.6
0.8
2004 machines per active voter
2004
vot
er tu
rnou
t
0.004 0.006 0.008 0.010 0.012 0.014 0.016
1315
17
2004 machines per active voter
2004
pol
ls o
pen
elap
sed
time
13 14 15 16 17 18
0.4
0.6
0.8
2004 polls open elapsed time
2004
vot
er tu
rnou
t
Figure 9: Number of Voting Machines, Turnout among Active Voters and Poll Closing Times inFranklin County: 50 Percent of Precincts with Middle Proportions African American
26

0.003 0.004 0.005 0.006 0.007 0.008 0.009
0.5
0.7
2004 machines per active voter
2004
vot
er tu
rnou
t
0.003 0.004 0.005 0.006 0.007 0.008 0.009
1315
17
2004 machines per active voter
2004
pol
ls o
pen
elap
sed
time
13 14 15 16 17
0.5
0.7
2004 polls open elapsed time
2004
vot
er tu
rnou
t
Figure 10: Number of Voting Machines, Turnout among Active Voters and Poll Closing Times inFranklin County: 25 Percent of Precincts with Highest Proportions African American
27

0.003 0.004 0.005 0.006 0.007
0.45
0.65
2004 machines per active voter
2004
vot
er tu
rnou
t
0.003 0.004 0.005 0.006 0.007
1315
17
2004 machines per active voter
2004
pol
ls o
pen
elap
sed
time
13 14 15 16 17
0.45
0.65
2004 polls open elapsed time
2004
vot
er tu
rnou
t
Figure 11: Number of Voting Machines, Turnout among Active Voters and Poll Closing Times inFranklin County: Precincts with More than 50 Percent African American
28

Table 4: Polls Open Elapsed Time Given Machines per Active Voter and Proportion African Amer-ican Regressors
Variable Coef. SE t-ratio
(Intercept) 1.670601 0.057828 28.89Log(Machines per Active Voter) −0.176063 0.010720 −16.42Proportion African American 0.096276 0.008495 11.33
Notes: Underdispersed Poisson regression model estimates (dispersion estimate is 0.041). Pollsopen elapsed time is the dependent variable. n = 787.
29

Table 5: Voter Turnout among Active Voters: Polls Open Elapsed Time, Machines per Active Voterand Proportion African American Regressors
Variable Coef. SE t-ratio
(Intercept) 7.0000 0.7360 9.510Polls Open Elapsed Time 0.0424 0.0215 1.970Log(Machines per Active Voter) 1.2100 0.1500 8.070Low Proportion African American Dummy −1.7400 1.1100 −1.570Low AA Dummy × Polls Open Elapsed Time −0.1650 0.0563 −2.930Low AA Dummy × Log(Machines per Active Voter) −0.7970 0.2000 −3.980Medium Proportion African American Dummy 0.2570 0.9530 0.270Medium AA Dummy × Polls Open Elapsed Time −0.0736 0.0282 −2.610Medium AA Dummy × Log(Machines per Active Voter) −0.1750 0.2030 −0.863Proportion African American −0.5390 0.0764 −7.050
Notes: Robust (tanh) overdispersed binomial regression estimates. For each precinct, thedependent variable counts the number of active voters voting versus the number of active votersnot voting. LQD σ = 3.61; tanh σ = 3.44; n = 787; 4 outliers.
OutliersCode Precinct Precinct Name SRes
01009A COLS 09-A Columbus City Ninth Ward Precinct A −4.7701009B COLS 09-B Columbus City Ninth Ward Precinct B −4.2201010B COLS 10-B Columbus City Tenth Ward Precinct B −5.0201059E COLS 59-E Columbus City Fifty-Ninth Ward Precinct E −4.73
Expected Voter Turnout at Quartiles of the
Machine Ratio Polls Open TimeProportion African American 25% 50% 75% 25% 50% 75%
Low 0.798 0.804 0.809 0.806 0.804 0.802Medium 0.750 0.768 0.785 0.770 0.768 0.763High 0.652 0.682 0.709 0.674 0.682 0.690
Notes: Each expected turnout value for the machine ratio quartiles is computed using thecoefficient parameter estimates reported in the top part of this table and, for each subset ofprecincts, the quartiles of the machines per active voter ratio, the median polls open elapsed timeand the median proportion African American in the referent subset. The values for the polls opentime quartiles are computed using the quartiles of the polls open elapsed time, the medianmachines per active voter ratio and the median proportion African American in the referentsubset.
30
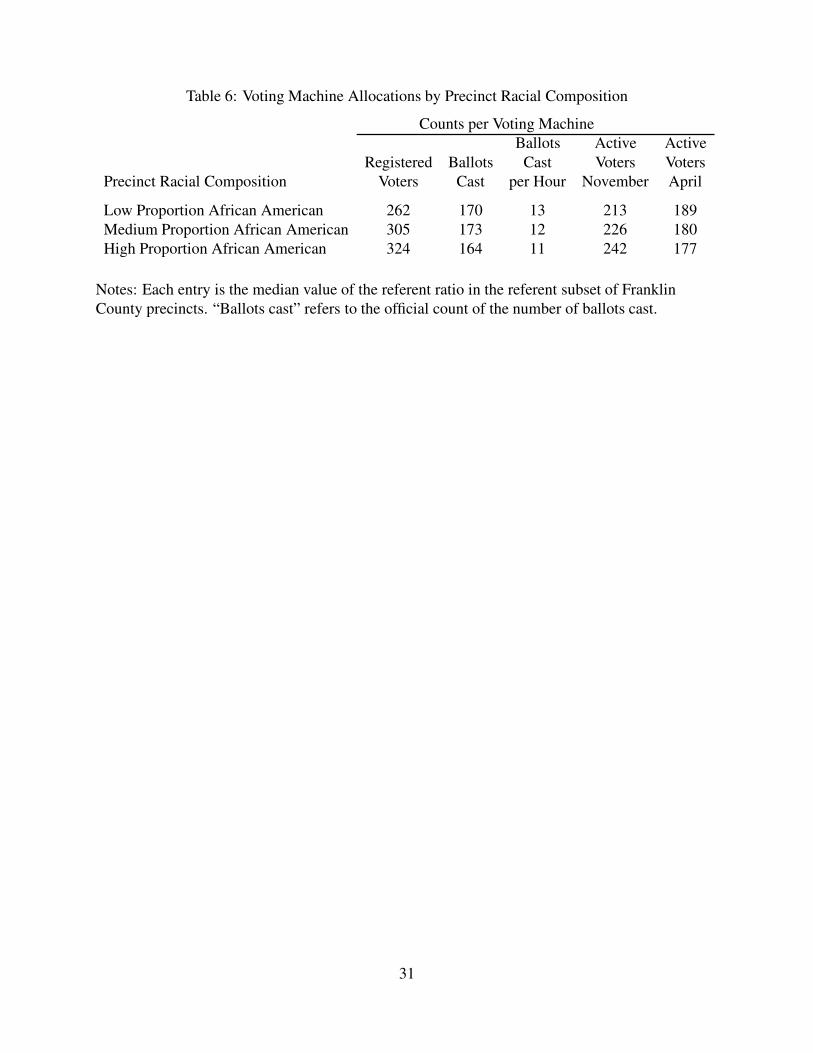
Table 6: Voting Machine Allocations by Precinct Racial Composition
Counts per Voting MachineBallots Active Active
Registered Ballots Cast Voters VotersPrecinct Racial Composition Voters Cast per Hour November April
Low Proportion African American 262 170 13 213 189Medium Proportion African American 305 173 12 226 180High Proportion African American 324 164 11 242 177
Notes: Each entry is the median value of the referent ratio in the referent subset of FranklinCounty precincts. “Ballots cast” refers to the official count of the number of ballots cast.
31

References
Brown, Suzanne M. 2006. Email message from Suzanne M. Brown<[email protected]> to Matthew Rado, Monday, January 23,2006 9:54 am.
Damschroder, Matt. 2006. Email message from Matt Damschroder<[email protected]> to Matthew Rado, Wednesday, February8, 2006 4:19 pm.
Feldman, Diane, and Cornell Belcher. 2005. “Voting Experience Survey.” March 3, 2005.Included in the Democratic National Committee report, Democracy at Risk: The 2004Election in Ohio.
Mebane, Walter R., Jr. 2005. “Ohio 2004 Election: New Registrants, Provisional Ballots, VotingMachines, Turnout and Polls Open Elapsed Times in Franklin County Precincts.” June 18,2005. Included in the Democratic National Committee report, Democracy at Risk: The2004 Election in Ohio.
Mebane, Walter R., Jr., and Michael C. Herron. 2005. “Ohio 2004 Election: Turnout, ResidualVotes and Votes in Precincts and Wards.” June 9, 2005. Included in the DemocraticNational Committee report, Democracy at Risk: The 2004 Election in Ohio.
Mebane, Walter R., Jr., and Jasjeet S. Sekhon. 2004a. “Robust Estimation and Outlier Detectionfor Overdispersed Multinomial Models of Count Data.”. American Journal of PoliticalScience 48 (April): 392–411.
Mebane, Walter R., Jr., and Jasjeet Sekhon. 2004b. “Multinomial Robust Regression(MultinomRob).” Package for R. Source code along with LINUX and Windows binaries areavailable from the Comprehensive R Archive Network (CRAN, http://cran.r-project.org/).
Tanner, John. 2005. Letter to Nick A. Soulas, Jr., Assistant Prosecuting Attorney, FranklinCounty, Ohio. June 29, 2005.http://www.usdoj.gov/crt/voting/misc/franklin oh.pdf (accessedJuly 2, 2005).
32